Embed Size (px)
Citation preview

2016 Performance Accountability Report Maryland Public Colleges and
Universities
Volume 1
February 2017 MSAR #709
Lawrence J. Hogan, Jr. Boyd K. Rutherford Governor Lt. Governor
MARYLAND HIGHER EDUCATION COMMISSION 6 North Liberty Street Tenth Floor Baltimore, MD 21201

Maryland Higher Education Commission
Anwer Hasan, Chairman
Sandra L. Jimenez, Vice-Chair
Vivian S. Boyd
Joseph DeMattos, Jr.
John Holaday
Russell V. Kelley
Peri J. Kelsey, Student Commissioner
Ian MacFarlane
Donna M. Mitchell
Joel Packer
Rizwan A. Siddiqi
John W. Yaeger
James D. Fielder, Jr., Ph.D. Secretary

Table of Contents
Executive Summary ........................................................................................................................ 1
Overview of the Accountability Report .......................................................................................... 3
History and Overview of the Accountability Process ..................................................................... 4
Assessment and Recommendation .................................................................................................. 8
Targeted Indicators and Campus Responses - Community Colleges……………………………21
Targeted Indicators and Campus Responses - Public Four-Year Colleges and Universities..…..43

EXECUTIVE SUMMARY AND OVERVIEW

1
EXECUTIVE SUMMARY This report summarizes many of the key measures Maryland’s public higher education institutions are using to hold themselves accountable to the State and its citizens. Institutions’ accountability measures correspond to their strategic priorities, institutional goals, and missions and are aligned with the Maryland State Plan for Postsecondary Education Maryland Ready. This assessment reflects the six broad goals and objectives outlined in the State Plan. The six goals are:
Goal 1: Quality and effectiveness Goal 2: Access, affordability, and completion Goal 3: Diversity Goal 4: Innovation Goal 5: Economic growth and vitality Goal 6: Data use and distribution
The goals illuminated in the plan encompass a broad, sweeping agenda for postsecondary education. What arises from a review of the institutions’ PAR submissions is the institutions’ ongoing commitment to addressing some of the most complex issues facing higher education. These include keeping college affordable, ensuring students successfully progress toward completion, and addressing issues tied to gaps in outcomes for some of the state’s most vulnerable students (e.g., low-income students, ethnic and racial minority students). As institutions continue their progress toward institutional and state goals, the Commission identified some areas that should continue to receive focus and attention. These include institutional efforts to use creative and collaborative strategies for enrollment growth and to build partnerships that help target potential enrollees among high school students, working adults, and the unemployed. In an effort to address the continued inequities in educational outcomes among racial and ethnic minority students, institutions should assess and analyze the outcomes of initiatives aimed at reducing these achievement gaps. These include assessing the effectiveness of institutions’ policies, targeted programs, and curriculum changes in an effort to understand whether they are having the intended effects and to inform the allocation of resources. A third area of focus for institutions should include ensuring assessment procedures and process are in place as alternative forms of educational delivery (e.g., distance education, online degree programs) continue to be ramped up. Evaluation should focus on the effectiveness and potential for success of these programs and courses. In the coming year, the Commission will work with the institutional data that are available and in collaboration with institutions to continue to answer questions and provide research that can help achieve the goals set forth in the 2013 State Plan.

2
OVERVIEW AND HISTORY OF THE
ACCOUNTABILITY PROCESS

3
OVERVIEW OF THE ACCOUNTABILITY REPORT The purpose of the Performance Accountability Report (PAR) is to provide an annual opportunity for the State, the Maryland Higher Education Commission (MHEC), colleges and universities, and individual governing boards to review and evaluate institutions’ efforts to fulfill their missions and advance the goals of the State. The commitment of Maryland’s public colleges and universities to this process is demonstrated by their ongoing efforts to provide detailed and high-quality reports to the Commission each year. This is the 21st accountability report submitted to the Commission since the adoption of the current system with benchmarked indicators and objectives. Volume 1 includes the following:
• an overview of the accountability process; • observations about institutional performance on key statistical indicators; and • institutional responses to the Commission’s questions about indicators submitted in the
2015 PAR.
Volume 2 of the report contains appendices that include the full accountability reports for all of the public two- and four-year institutions in Maryland. These reports are unedited by Commission staff except to ensure a consistent appearance. The reports from the community colleges include:
• an update regarding their performance on the indicators in each “mission/mandate” area; • their progress toward meeting the goals applicable to community colleges in Maryland
Ready, the Maryland State Plan for Postsecondary Education; • a discussion of how well the campuses are serving their communities; • four years of trend data; and • benchmarks for each indicator.
The reports from the public four-year institutions include:
• a listing of their goals; • an update regarding their progress toward meeting their goals; • objectives and performance measures as submitted to the State for Measuring for Results
(MFR); • five years of trend data for each measure; and • the State Plan goals applicable to four-year colleges and universities.
Volume 2 also includes a summary of the operational definitions, sources of performance measures, guidelines for benchmarking the indicators, and the formats for the institutional performance accountability reports.
4
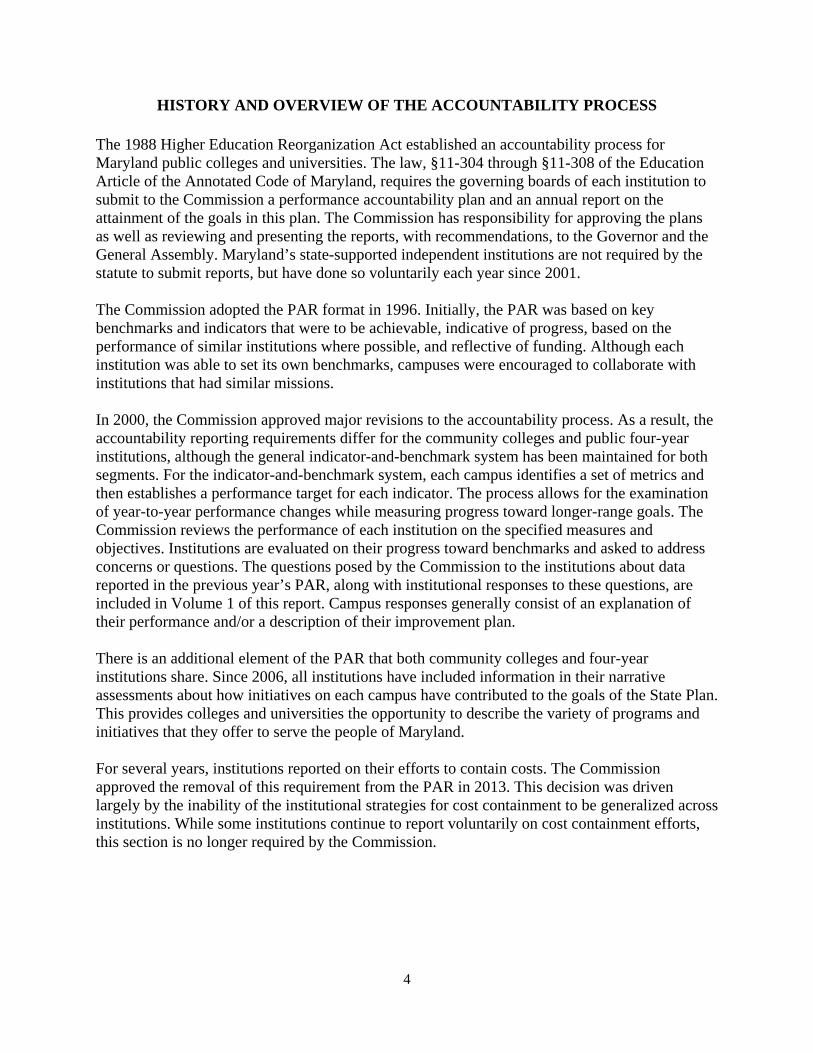
HISTORY AND OVERVIEW OF THE ACCOUNTABILITY PROCESS
The 1988 Higher Education Reorganization Act established an accountability process for Maryland public colleges and universities. The law, §11-304 through §11-308 of the Education Article of the Annotated Code of Maryland, requires the governing boards of each institution to submit to the Commission a performance accountability plan and an annual report on the attainment of the goals in this plan. The Commission has responsibility for approving the plans as well as reviewing and presenting the reports, with recommendations, to the Governor and the General Assembly. Maryland’s state-supported independent institutions are not required by the statute to submit reports, but have done so voluntarily each year since 2001. The Commission adopted the PAR format in 1996. Initially, the PAR was based on key benchmarks and indicators that were to be achievable, indicative of progress, based on the performance of similar institutions where possible, and reflective of funding. Although each institution was able to set its own benchmarks, campuses were encouraged to collaborate with institutions that had similar missions. In 2000, the Commission approved major revisions to the accountability process. As a result, the accountability reporting requirements differ for the community colleges and public four-year institutions, although the general indicator-and-benchmark system has been maintained for both segments. For the indicator-and-benchmark system, each campus identifies a set of metrics and then establishes a performance target for each indicator. The process allows for the examination of year-to-year performance changes while measuring progress toward longer-range goals. The Commission reviews the performance of each institution on the specified measures and objectives. Institutions are evaluated on their progress toward benchmarks and asked to address concerns or questions. The questions posed by the Commission to the institutions about data reported in the previous year’s PAR, along with institutional responses to these questions, are included in Volume 1 of this report. Campus responses generally consist of an explanation of their performance and/or a description of their improvement plan. There is an additional element of the PAR that both community colleges and four-year institutions share. Since 2006, all institutions have included information in their narrative assessments about how initiatives on each campus have contributed to the goals of the State Plan. This provides colleges and universities the opportunity to describe the variety of programs and initiatives that they offer to serve the people of Maryland. For several years, institutions reported on their efforts to contain costs. The Commission approved the removal of this requirement from the PAR in 2013. This decision was driven largely by the inability of the institutional strategies for cost containment to be generalized across institutions. While some institutions continue to report voluntarily on cost containment efforts, this section is no longer required by the Commission.
5
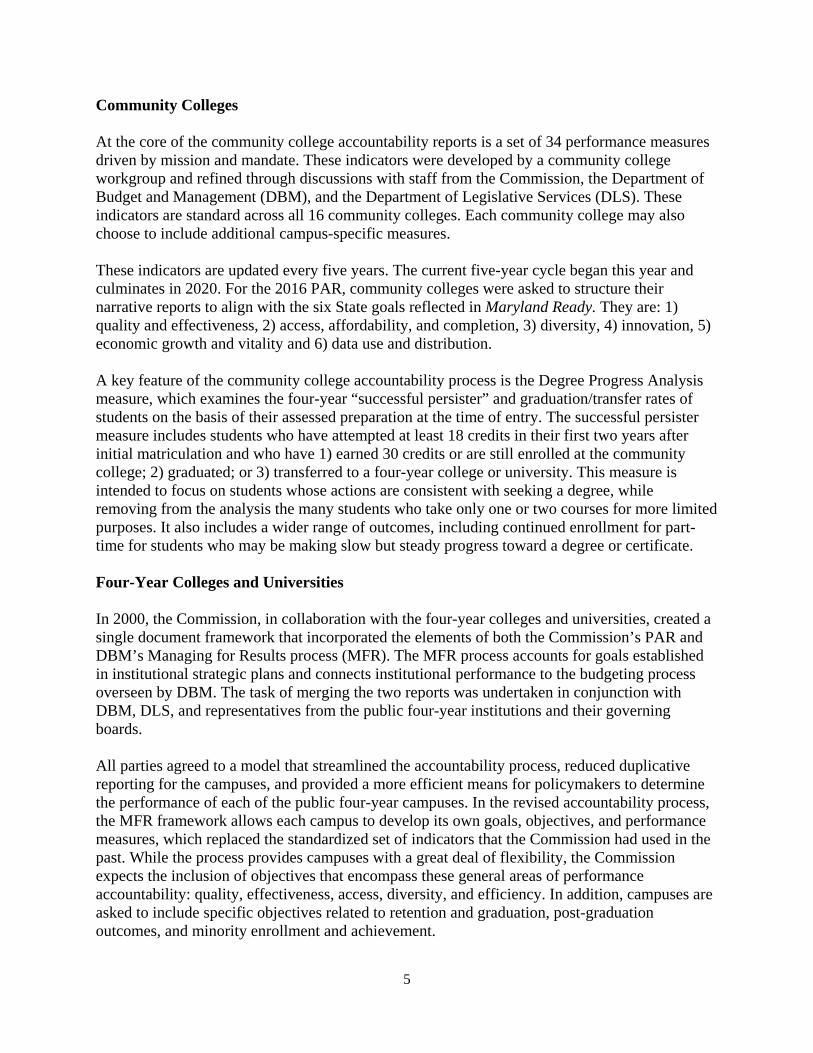
Community Colleges At the core of the community college accountability reports is a set of 34 performance measures driven by mission and mandate. These indicators were developed by a community college workgroup and refined through discussions with staff from the Commission, the Department of Budget and Management (DBM), and the Department of Legislative Services (DLS). These indicators are standard across all 16 community colleges. Each community college may also choose to include additional campus-specific measures. These indicators are updated every five years. The current five-year cycle began this year and culminates in 2020. For the 2016 PAR, community colleges were asked to structure their narrative reports to align with the six State goals reflected in Maryland Ready. They are: 1) quality and effectiveness, 2) access, affordability, and completion, 3) diversity, 4) innovation, 5) economic growth and vitality and 6) data use and distribution. A key feature of the community college accountability process is the Degree Progress Analysis measure, which examines the four-year “successful persister” and graduation/transfer rates of students on the basis of their assessed preparation at the time of entry. The successful persister measure includes students who have attempted at least 18 credits in their first two years after initial matriculation and who have 1) earned 30 credits or are still enrolled at the community college; 2) graduated; or 3) transferred to a four-year college or university. This measure is intended to focus on students whose actions are consistent with seeking a degree, while removing from the analysis the many students who take only one or two courses for more limited purposes. It also includes a wider range of outcomes, including continued enrollment for part-time for students who may be making slow but steady progress toward a degree or certificate. Four-Year Colleges and Universities In 2000, the Commission, in collaboration with the four-year colleges and universities, created a single document framework that incorporated the elements of both the Commission’s PAR and DBM’s Managing for Results process (MFR). The MFR process accounts for goals established in institutional strategic plans and connects institutional performance to the budgeting process overseen by DBM. The task of merging the two reports was undertaken in conjunction with DBM, DLS, and representatives from the public four-year institutions and their governing boards. All parties agreed to a model that streamlined the accountability process, reduced duplicative reporting for the campuses, and provided a more efficient means for policymakers to determine the performance of each of the public four-year campuses. In the revised accountability process, the MFR framework allows each campus to develop its own goals, objectives, and performance measures, which replaced the standardized set of indicators that the Commission had used in the past. While the process provides campuses with a great deal of flexibility, the Commission expects the inclusion of objectives that encompass these general areas of performance accountability: quality, effectiveness, access, diversity, and efficiency. In addition, campuses are asked to include specific objectives related to retention and graduation, post-graduation outcomes, and minority enrollment and achievement.

6
The public four-year institutions’ submissions contain a brief narrative and the goals, objectives, and performance measures they submit to DBM for the MFR. All institutional benchmarks run through 2019.

7
ASSESSMENT AND RECOMMENDATIONS

8
ASSESSMENT BY THE MARYLAND HIGHER EDUCATION COMMISSION
This report summarizes many of the key measures Maryland’s public higher education institutions are using to hold themselves accountable to the State and its citizens. Institutions’ accountability measures correspond to their strategic priorities, institutional goals, and missions and are aligned with the Maryland State Plan for Postsecondary Education Maryland Ready. This assessment reflects the six broad goals and objectives outlined in the State Plan. The six goals of the State Plan are:
Goal 1: Quality and effectiveness Goal 2: Access, affordability, and completion Goal 3: Diversity Goal 4: Innovation Goal 5: Economic growth and vitality Goal 6: Data use and distribution
In reviewing institutional progress toward the six State Plan goals, there is substantial evidence that institutions are meeting the objectives put forth in the Plan for Goals 1 through 5. Each section of this report highlights some of the successes and challenges for institutions as they endeavor to meet the State’s goals for higher education. The report concludes with recommendations institutions can take in the coming year to continue progress toward achieving the goals of the State Plan. The remainder of Volume I consists of the targeted metrics and campus responses for both the community colleges and public four-year institutions. Volume II contains institutional narratives as submitted to MHEC, presented unedited by Commission staff. Quality and Effectiveness: Maryland will enhance its array of post-secondary education institutions and programs, which are recognized nationally and internationally for academic excellence, and more effectively fulfill the evolving educational needs of its students, the State, and the nation. The measures that institutions use to evaluate their progress toward Goal 1 of the State Plan include post-graduate outcomes, student retention, progress of students with developmental education needs, and licensure and certification examination pass rates. Post-graduate outcomes and student satisfaction Institutions regularly administer surveys to their alumni and to current and non-returning students in an effort to obtain valuable feedback on the student experience and the perceived value of the education and training received. Both the community colleges and public four-year institutions report that the vast majority of survey respondents are satisfied with their education and have been successful in achieving their post-graduation goals. These goals can include enrolling in graduate school, transferring to another institution, or finding employment relevant to their field of study.

9
Polling non-returning students helps community colleges assess student satisfaction with educational goal achievement and determine the factors that contributed to their departure from school. Many colleges report that students do not re-enroll for a range of complex reasons including transfer to another institution and family and work obligations. In general, community colleges find that the majority of non-returning students partially or fully achieved their educational goals while enrolled, and many of the students polled indicate their intention to return when they are able. Institutions report that response rates to these surveys are low, which calls into question the validity and representativeness of the data. As a solution, institutions couple these data with other indicators of quality and effectiveness in an effort to obtain a clearer assessment of their institutional strengths and areas of improvement. Examples of this include pairing survey data with such indicators as licensure and certification examination pass rates, as well as retention and graduation rates, for use in assessing quality and effectiveness. Retention The second-year retention rate for first-time, full-time undergraduates at public four-year institutions in Maryland was 83.8% for the 2014 cohort. This represented a decrease from the previous cohort, which saw a historically high retention rate of 85.1%. Nevertheless, the retention rate of the 2014 cohort is the second highest ever, and continues a long-term growth trend established in 2006. Of the first-time full-time community college students in the 2013 cohort, 37.3% were still enrolled in 2015; this retention rate is on par with the persistence rate of the past four years, which ranged from 37.5% to 38.8%. An additional 3.0% graduated within two years and a remaining 14.2% had transferred to a four-year institution. What these rates can mask is the complexity of the community college student’s path through college. One challenge to persistence, according to institutions’ reports, is that students may not re-enroll for a number of reasons, including employment and family demands and limited financial resources. Second, traditional measures of persistence usually only include first-time, full-time students, which accounts for a smaller percentage of overall enrolled students. In response, institutions use the Degree Progress Analysis report as an analytic tool that captures a broader swath of community college students. The Degree Progress Analysis examines part- and full-time students who complete at least 18 credit hours within their first two years of enrollment, and identifies students as successful if they have graduated, transferred to a four-year institution, or are still enrolled with a cumulative grade point average of 2.0 or better. Progress of students with developmental education needs Seven in 10 community college students were assessed to need remediation in 2013 (the most recent year for data collection). With such high demand for remedial education, the community colleges report myriad ways they are trying to ensure that remedial students complete the assigned sequence of courses successfully. Institutions continue to refine their remedial courses through such efforts as dedicating tutors and additional instructors to the courses and creating accelerated courses. These accelerated courses replace the traditional two-, three-, or four-semester remedial sequence with instructional delivery that allows a student to move more
10
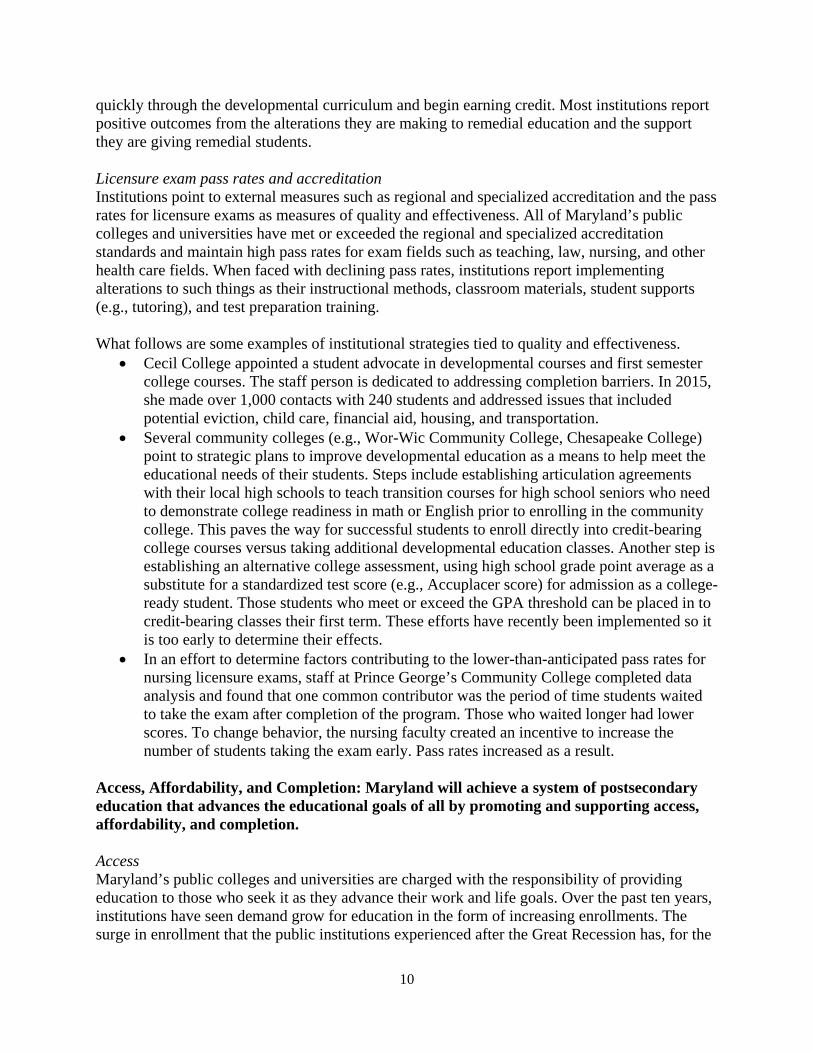
quickly through the developmental curriculum and begin earning credit. Most institutions report positive outcomes from the alterations they are making to remedial education and the support they are giving remedial students. Licensure exam pass rates and accreditation Institutions point to external measures such as regional and specialized accreditation and the pass rates for licensure exams as measures of quality and effectiveness. All of Maryland’s public colleges and universities have met or exceeded the regional and specialized accreditation standards and maintain high pass rates for exam fields such as teaching, law, nursing, and other health care fields. When faced with declining pass rates, institutions report implementing alterations to such things as their instructional methods, classroom materials, student supports (e.g., tutoring), and test preparation training. What follows are some examples of institutional strategies tied to quality and effectiveness.
• Cecil College appointed a student advocate in developmental courses and first semester college courses. The staff person is dedicated to addressing completion barriers. In 2015, she made over 1,000 contacts with 240 students and addressed issues that included potential eviction, child care, financial aid, housing, and transportation.
• Several community colleges (e.g., Wor-Wic Community College, Chesapeake College) point to strategic plans to improve developmental education as a means to help meet the educational needs of their students. Steps include establishing articulation agreements with their local high schools to teach transition courses for high school seniors who need to demonstrate college readiness in math or English prior to enrolling in the community college. This paves the way for successful students to enroll directly into credit-bearing college courses versus taking additional developmental education classes. Another step is establishing an alternative college assessment, using high school grade point average as a substitute for a standardized test score (e.g., Accuplacer score) for admission as a college-ready student. Those students who meet or exceed the GPA threshold can be placed in to credit-bearing classes their first term. These efforts have recently been implemented so it is too early to determine their effects.
• In an effort to determine factors contributing to the lower-than-anticipated pass rates for nursing licensure exams, staff at Prince George’s Community College completed data analysis and found that one common contributor was the period of time students waited to take the exam after completion of the program. Those who waited longer had lower scores. To change behavior, the nursing faculty created an incentive to increase the number of students taking the exam early. Pass rates increased as a result.
Access, Affordability, and Completion: Maryland will achieve a system of postsecondary education that advances the educational goals of all by promoting and supporting access, affordability, and completion. Access Maryland’s public colleges and universities are charged with the responsibility of providing education to those who seek it as they advance their work and life goals. Over the past ten years, institutions have seen demand grow for education in the form of increasing enrollments. The surge in enrollment that the public institutions experienced after the Great Recession has, for the
11
most part, diminished. In its wake is a return to enrollment trends that are much more on par with what institutions saw before this surge. Institutions cite the short-term decrease in the number of high school graduates and a more robust employment environment as two key reasons for slowing enrollment growth. In particular, enrollment issues loom large for the community colleges. Overall total annual unduplicated headcount of credit and continuing education students for 2015 was down 2.8% from 2014 and 9.1% from 2012. These average rates mask stark differences among institutions; some community colleges have seen a 20 to 28% drop in enrollment since 2012, and others have seen modest 2 to 3% decreases. Many community colleges in rural areas report they are feeling the double effects of decreases in the number of students graduating high school and decreases in the overall county population. Regardless, the drop in enrollment has positioned community colleges to become more creative and assertive in seeking new enrollments by recruiting out of the county and increasing outreach to non-traditional students. One bright spot in enrollment for the community colleges is the tremendous growth in high school student enrollment, which grew 15.6% from fall 2014 to fall 2015 and has increased 41.3% since fall 2011. This surge is due to increased participation in dual enrollment. The vast majority (86.0% or 4,935 of 5,742 students) of dually enrolled high school students in Maryland are enrolled in the community colleges. 1 Undergraduate enrollment at the public four-year institutions grew 1.9% from fall 2014 to 2015, going from 128,368 students to 130,862. Overall the public four-year institutions cite more aggressive admissions practices as a contributor to this trend. In addition, institutions such as Coppin State University, Frostburg University, and the University of Baltimore point to their efforts with students identified as “near completers” (students who stopped out of college close to completion) as providing a small bump in enrollment. These students have completed at least 75% of their credits needed to graduate and are considered in good academic standing by the institution. By re-enrolling these students and providing them financial and academic support, institutions increase enrollments and the number of students earning awards. Affordability In fiscal year 2016, Maryland’s public two-year institutions ranked 30th lowest nationally in in-district tuition and fees, and Maryland’s public four-year institutions ranked 26th lowest nationally for in-state tuition and fees. 2 For community colleges, this meant average tuition and fees of $4,094, a 5.0% increase from fiscal year 2015. The public four-year institutions charged in-state undergraduates, on average, $8,849 for tuition and fees in fiscal year 2016, a 4.0% increase from the prior year. 3
1 Henneberger, Angela K., Terry V. Shaw, Mathew C. Uretsky, and Michael E. Woolley. "Dual Enrollment in Maryland: A Report to the General Assembly and Governor Lawrence J. Hogan." (2015). 2 Ma, J., S. Baum, M. Pender, and D. Bell. "Trends in College Pricing 2015."New York, NY: The College Board (2015). http://trends.collegeboard.org/sites/default/files/2015-trends-college-pricing-final-508.pdf 3 “2016 Data Book,” Maryland Association of Community Colleges, http://mdacc.org/wp-content/uploads/MACC_Databook_FY2016.pdf and FY 2015 Governors Budget Book.

12
Institutions acknowledge that revenue from tuition and fees has taken on an increasingly important role as other sources of operating revenue have stayed flat or diminished. The tables below show that as revenue from state appropriations and operating grants on a per full-time equivalent (FTE) basis has stagnated, the two- and four-year institutions have turned to tuition and fees as the primary source of operating revenue. Table 1: Trends in Operating Revenue per FTE at Maryland Public Four-Year Institutions, FY 03 and FY 14 FY 03 FY 14 Sources of Operating Revenue
$ % of Total Operating Revenue
per FTE
$ % of Total Operating
Revenue per FTE Tuition and Fees Revenue plus Discounts and Allowances per FTE
$8,011 33% $11,059 41%
Operating Grants per FTE $8,309 34% $7,589 28% State Appropriations per FTE $8,028 33% $8,455 31% Source: U.S. Department of Education. Institute of Education Sciences, National Center for Education Statistics.
Table 2: Trends in Operating Revenue per FTE at Maryland Community Colleges, FY 03 and FY 14 FY 03 FY 14 Sources of Operating Revenue
$ % of Total Operating
Revenue per FTE
$ % of Total Operating
Revenue per FTE Tuition and Fees Revenue plus Discounts and Allowances per FTE
$3,849 34% $5,220 40%
Operating Grants per FTE $1,202 11% $687 5% State Appropriations per FTE $3,060 27% $3,224 25%
Note: Community colleges receive local appropriations, which constitute the remaining percentage of operating revenue. Source: U.S. Department of Education. Institute of Education Sciences, National Center for Education Statistics.
Many institutions acknowledge that continuing to increase tuition and fees is not sustainable in the long term and report steps they intend to take or are currently taking to try to pare down costs and obtain new streams of revenue. Some colleges report such cost saving measures as eliminating vacant faculty and staff positions, redesigning benefits plans, renegotiating contracts, and automatizing functions (e.g.. billing) through technology. New revenue streams have been found through partnerships with community organizations, renting out campus facilities to outside groups, and seeking new grants from corporations and foundations.

13
Recognizing that increasing tuition and fees requires students and their families to bear more of the burden for paying for college, many institutions report the efforts they have made to increase the number and size of financial aid awards (principally in the form of scholarships or grants), especially to those students most vulnerable to shifts in price. From 2012 to 2014, institutional aid awarded per FTE increased 12.4% at the public four-year institutions and 3.0% at the community colleges. Concurrently, the average grant per FTE awarded to undergraduates at the public four-year institutions increased 15.6% (from $2,420 to $2,797). Over this same period, community colleges’ average grant increased 2.0% from $2,316 to $2,361.4 Institutions report myriad ways that they try to target financial aid in effective and efficient ways to ensure students with need are not hindered in their progress toward completion. These include providing financial aid to students who, after all aid and family contribution has been applied to the cost of attendance, still have unmet need. Another strategy some public four-year institutions employ is to provide financial aid in the form of scholarships and grants to newly enrolled transfer students, who can face financial challenges in paying the higher cost of attendance associated with a four-year college or university. Completion Completion can be captured through graduation rates for the public four-year institutions and through success rates at the community colleges. The success rate captures the number of students who graduate from a two-year institution after obtaining an award or certificate, transfer to a four-year institution, or continue enrollment at a Maryland community college after four years. Community colleges also measure success through the Degree Progress Analysis model, which examines students who complete at least 18 credit hours within their first two years of enrollment, and identifies students as successful if they have graduated, transferred to a four-year institution, or are still enrolled with a cumulative grade point average of 2.0 or better. The six-year graduation rate for first-time, full-time students at the public four-year institutions was 66.17% for the 2009 cohort. This is the highest statewide graduation rate on record. The four-year success rate for community college students in the 2011 cohort was 44.8% for 2015, meaning that almost half of the first-time, full-time students who enrolled in community college in 2011 had either graduated, transferred, or were still enrolled. This rate continues a multiyear trend where the success rate has hovered between 44.7% and 48.7%. The successful persister rate for community college students shows that 69.2% of the 2010 cohort had earned a degree or certificate, transferred to another institution, or were still enrolled at their original community college with a 2.0 or higher GPA in FY 2016. This rate includes the successful persister rates of those who enter community college as “college ready” (with no need for developmental education courses) and those who complete their developmental courses and persist (known as developmental completers), which are 83.4% and 81.8% respectively. Students who are identified as needing developmental education courses but do not complete the
4 Maryland Higher Education Commission Financial Aid Information System and U.S. Department of Education. Institute of Education Sciences, National Center for Education Statistics.

14
developmental sequence have much lower success rates (40.6% for those entering in the 2010 cohort).5 Another measure of completion is the number of degrees awarded to students. In 2014-2015, 15,133 associate degrees were awarded by the community colleges, and the public four-year institution awarded 39,054 degrees to undergraduate and graduate students. In total, this is a 3.7% increase from the 2013-2014 and part of a longer trend of increases in the number of awards and degrees among the public institutions statewide. This also positions the institutions well in their effort to achieve the 55% completion goal by 2025. Institutions’ efforts to increase access, affordability, and completion are diverse and multidimensional. Below are some notable and unique efforts currently underway.
• Cecil College’s innovative scholarship initiatives include a Completion Scholarship program, which directs funds to students who enroll in 11 or more credits. This effort is to encourage students who are in good academic standing to shorten their time to degree. Cecil also offers an “unmet need” scholarship to fill the gap between the student’s financial aid and the cost of attendance. Lastly the institution offers a “late start” scholarship for students who don’t enroll or register until mid-July or after, a point in time in which it is typically too late to receive other forms of aid for the upcoming academic year.
• University of Maryland University College partners with the State’s 16 community colleges to facilitate transfer pathways and provide outcomes data on students who transfer from the community college to UMUC. Through the Transfer Student Report, UMUC provides each college an overall student profile, which includes the top five receiving majors, the GPA, the number of credits transferred, and the number of transfer students that earned bachelors’ degrees in the reporting year. In addition, each year, after the community colleges release their course catalogs, UMUC staff update the UMUC Degree Map to reflect changes to community college and UMUC program requirements. These reports are then distributed to the community colleges to review and correct, if needed, with advisors at both institutions using the final reports to inform the transfer process with up-to-date content.
• University of Maryland, College Park Pre-Transfer Advising program is unique in the state and nation. Pre-transfer advisors work with students and advisors at the community colleges to assist prospective transfer students prior to application. Once admitted, transfer students receive services through the Transfer2Terp program, including support in integrating academically and socially into the university community. Lastly, specific transfer scholarships are offered to transfer students to cover the costs of two years of undergraduate study.
• The president of the University of Maryland, Eastern Shore requires that all divisions and operational units make student retention and graduation one of their top strategic priorities, and all operational plans must include at least one retention objective. The anticipated result of this action is that the issues of student retention and success stay central to the daily, monthly, and annual operations of the institution.
5 Retention, Graduation, and Transfer Rates at Maryland Community Colleges September 2016. http://mhec.maryland.gov/publications/Documents/Research/AnnualReports/2016RetGradTransCCs.pdf

15
Diversity: Maryland will ensure equitable opportunity for academic success and cultural competency for Maryland’s population.
The State’s diversity goal is comprehensive, defining diversity by race, ethnicity, age, ability, family educational history, veteran status, and socioeconomic status. This goal complements existing efforts to ensure Maryland’s colleges and universities are creating culturally competent students who value differing perspectives and are supporting a diverse campus through the composition of its students, faculty, and staff. Although institutional PAR submissions reflect the myriad ways institutions are encouraging diversity on campus, it should be noted that the data analysis provided in this report is unable to capture many aspects of diversity as described in Maryland Ready. The racial and ethnic diversity of students attending Maryland’s public four year institutions has increased 1.4% from 2014 to 2015. The largest growing groups of students include Hispanic/Latino students, Native Hawaiian or Pacific Islanders, and students who identify as two or more races. Institutions indicate there are additional shifts in their institutional makeup with reports in increases in veterans, students with disabilities, and low-income students. Services are tailored to meet these students’ needs and help them as they navigate the college environment. For the Performance Accountability Report, institutions report on several key measures tied to diversity. These include progress toward closing racial and ethnic academic achievement gaps (retention and graduation) and outcomes for first-generation and low-income students. Some institutions also report on their efforts to support other student populations, such as veterans, students with learning disabilities, and adult students. In 2016, the retention and graduation rates for African American and Hispanic students at the public four-year institutions were lower than the rates for white students. The second-year retention rate for white students was 86.5% and the six-year graduation rates was 77.9%. African American students’ second-year retention and six-year graduation rates were 78.3% and 44.7% respectively. Hispanic students also had lower retention rates (83.4%) and six-year graduation rates (69.9%). While these outcome measures have stayed relatively constant for African American students, Hispanic student retention and graduation rates continue to increase. These differences by race and ethnicity exist at the community colleges as well with white students graduating or transferring at a higher rate (41.3%) than African American students (22.0%) and Hispanic students (27.4%). This is a slight increase from 2015 for African American students and a decrease for Hispanic students. Institutions acknowledge the importance of addressing these persistent gaps in retention and graduation and continue to create programming, mentoring, advising, and other services targeting student populations most at risk of leaving college before earning a credential or degree. What follows are some notable examples of the ways that community colleges and the public four-year institutions are addressing issues of diversity, equity, and achievement gaps.
16
• After Chesapeake College completed an analysis of the contributing factors tied to the achievement gap between its white and African American students, it found that the students’ achievement gaps were associated with differences in college preparedness. The college subsequently focused both on the entry pathways to college (by partnering with the local high schools) and their means of identifying developmental education students. Through their efforts, they increased their pool of college-ready students, including a dramatic increase in African American students who enrolled directly into credit-bearing courses.
• Wor-Wic Community College’s veterans’ coordinator assists current and prospective students who are veterans or active military personnel; he serves as an academic advisor to and advocate for veteran students and helped establish a scholarship specifically for veteran students.
• When making staff or faculty hires, Frostburg University requires that one member of each search committee to be responsible for ensuring that minority outreach is a priority. Frostburg’s Director for ADA/EEO Compliance receives documentation on the efforts of this initiative as a means of quality control and compliance.
• Towson University’s TOPS (Towson Opportunities in STEM) Program targets students from underserved Baltimore City schools who have an interest in completing a STEM degree at Towson. The program supports the students through mentoring, financial assistance, academic tutoring, and provides access to professional development through guest speakers, research experiences, and meetings.
Greater details regarding the institutions’ efforts to meet the State’s diversity goals can be found in the annual Report on Institutional Programs of Cultural Diversity published by the Commission. This report includes institutional progress reports on their efforts to meet campus-wide goals tied to cultural diversity. Innovation: Maryland will seek to be a national leader in the exploration, development, and implementation of creative and diverse education and training opportunities that will align with State goals, increase student engagement, and improve learning outcomes and completion rates.
The majority of colleges and universities in Maryland report on the sustenance and growth of online education as a part of a larger strategic plan and a direct way they can contribute to this State goal. Reports reflect that institutions are focusing resources and time on developing quality course design, providing professional development for their faculty to develop courses, and growing programs slowly, with an eye for long-term success. Institutions cite the myriad benefits to the students, the State and the institutions as online enrollment grows; these include increasing student success and college graduates, growing enrollments, and delivering relevant and responsive curriculum meant to meet the demand for an educated workforce. Another notable trend in applying transformative approaches to increasing student engagement and improve student outcomes is through technology and data platforms. Almost all institutions mention using technology to provide tools to faculty, advisors, and administrators in helping students with retention and completion. Platforms are used for such activities as “nudging”

17
students regarding upcoming deadlines and informing academic advisors of students are at risk for failing a course or dropping out. What follows are some examples of the ways in which institutions are using innovative methods to increase student success.
• Carroll Community College reports success in the use of a vendor platform that provides all students access to a planning module. This module allows each student to create an educational plan with the help of an academic advisor. By mapping a multi-semester and multi-year plan, students can identify course sequences and other efficiencies in an effort to complete their education more quickly.
• The University of Maryland University College is working to transform the student transcript from a static document to an interactive record illustrating what a student learned in each course listed. The current prototype includes program-level outcomes presented as progress bars, showing how a student has mastered academic objectives. This evidence-based transcript documents student progress, changes over time as the student advances academically, and has the potential to show students (and employers) what the student has learned and how he or she can use what was learned in the workplace.
• University of Maryland. College Park’s Academy for Innovation and Entrepreneurship encourages innovation among students by providing innovation and entrepreneurship courses, holding creative competitions and hackathons, and conducting workshops. Students pursuing innovative, entrepreneurial projects can receive award money and scholarship funding.
• In 2016, Bowie State University established the Education Innovation Initiative (EI2). EI2
is a PreK-20 science, technology, engineering, arts and mathematics (STEAM) academic enrichment program that integrates hands-on, real world problem solving and entrepreneurial approaches to STEAM curriculum, develops students' identities as scientists/researchers, builds a critical mass of faculty who regularly use evidence-based instructional practices and develops partnerships and pilot programs to sustain the PreK-20 STEM pipeline.
Economic Growth: Maryland will stimulate economic growth, innovation, and vitality by supporting a knowledge-based economy, especially through increasing education and training and promoting the advancement and commercialization of research.
Public colleges and universities play a central role in contributing to the economic growth and vitality of the Maryland. Institutions report their progress toward helping the State meet its goals regarding workforce development, especially in critically needed professions in such areas as healthcare, education, and STEM fields. While most institutions report stable or growing enrollments and graduates in STEM and healthcare fields, most institutions that have teacher education programs face challenges regarding teacher education enrollments and candidates. Although the teacher candidates that are graduating are highly prepared and poised to enter the job market (based on institutions’ reported PRAXIS pass rates), there are fewer students enrolled in and graduating from these programs. This trend puts the state at risk of a teacher shortage. Institutions report efforts to encourage student enrollment, which includes targeted recruitment of students and incentives (such as scholarships and mentoring).

18
Community colleges closely monitor existing qualified workforce shortages, identify areas of emerging, high-demand professions and industries, and establish programs to help supply the qualified workers. This process can have the added benefit of increasing college enrollments, as students are attracted to the programs that can help ensure they obtain jobs with higher wages within their local communities. Institutions contribute the economic vitality in the state in myriad ways. Some examples include:
• Baltimore City Community College’s established a Director of Business Affairs and Economic Development to build business and industry relationships and focus on industries identified by Baltimore City’s workforce investment board and office of economic development as targeted growth industries based on current need, projected wage and employment growth, and other factors.
• Bowie State University’s Teaching, Learning, and Professional Development department reaches out to area community colleges and local public high schools to recruit students to enroll in early childhood and elementary education programs.
• Chesapeake College partnered with local social services agencies and corrections facilities for employment training in forklift operations and construction flagger skills. The programs helped inmates develop new job skills they could use upon release from prison and assisted non-custodial parents to help them find gainful employment so they could help support their families.
• The University of Maryland, College Park, University of Maryland, Baltimore, and the National Institute of Standards and Technology have established a joint research venture, The Institute for Bioscience and Biotechnology Research. This collaboration aims to translate University of Maryland intellectual property into commercial opportunities in the areas of biology, medicine, and engineering.
Data Use and Distribution: Maryland will create and support an open and collaborative environment of quality data use and distribution that promotes constructive communication, effective policy analysis, informed decision-making, and achievement of State goals. Few institutions report specifically on their efforts to meet this State goal but it’s clear that institutions are using data to inform decision making and direct policy. One common example of this reality is the effort at many institutions to use early alert systems and other student data warehouses to help identify students at risk of dropping or stopping out, so that the institution may intervene to support them. Data analytics is another area of focus for institutions. For example, all of the University of Maryland System institutions participate in the Performance Analytic Reporting Framework initiative. This national collaborative gathers data in an effort to help institutions use predictive analytics to trace the progress of their students. Institutions within the program exchange information about the tools they use and the practices they have in place that measurably improve student outcomes.

19
Conclusions and Recommendations This report provides a summary of progress toward performance accountability measures used by the State’s public higher education institutions and an analysis of institutional activities. Maryland’s institutions of higher education are guided by the goals and objectives set forth in the Maryland State Plan, Maryland Ready. The six goals illuminated in the plan encompass a broad, sweeping agenda for postsecondary education. What arises from a review of the institutions’ PAR submissions is the institutions’ ongoing commitment to addressing some of the most complex issues facing higher education. These include keeping college affordable, ensuring students successfully progress toward completion, and addressing issues tied to gaps in outcomes for some of the state’s most vulnerable students (e.g., low-income students, ethnic minority students). As institutions continue their progress toward institutional and state goals, the Commission identified some areas that should continue to receive focus and attention. The following are some recommendations from the Commission to Maryland’s public colleges and universities.
• Maryland’s public colleges and universities should continue to approach their strategies in enrollment growth in a creative and collaborative manner. Partnerships with local and state institutions can create pathways to education for potential students. Partner entities can include high schools, nearby community colleges, and employers and businesses in the area, and target audiences should include high school and community college students, and working and unemployed adults.
• Public two-year and four-year institutions alike should strengthen and expand their efforts to seek funding from philanthropic support. Grants from foundations and corporations and giving from alumni and friends of the institution can help to diversify funding to streams, improve philanthropic connections, and provide support to important initiatives.
• Institutions should continue to analyze outcomes for students who are dually enrolled to ensure that the intended benefits for these students are being achieved. Possible benefits of dual enrollment include: shortening the time to degree, increasing exposure to higher education in an effort to increase enrollment, and increasing higher education participation among racial and ethnic minority and low-income students, who are currently underrepresented in dual enrollment in the state.
• In an effort to address the continued inequities in educational outcomes among racial and ethnic minority students, institutions should assess and analyze the outcomes of initiatives aimed at reducing these achievement gaps. These include assessing the effectiveness of institutions’ policies, targeted programs, and curriculum changes in an effort to understand whether they are having the intended effects and to inform the allocation of resources.
• Institutional strategies to develop and strengthen alternative forms of curriculum delivery (e.g., distance education, flipped classrooms, online degree programs) should contain assessment procedures that evaluate their effectiveness and potential for success.
In reviewing institutional progress toward the six State goals, there is substantial evidence that institutions are meeting the objectives put forth in the Plan for Goals 1 through 5. In the coming year, the Commission will work with new data that are available and in collaboration with

20
institutions to continue to answer questions and provide research that can help achieve the goals set forth in the 2013 State Plan. RECOMMENDATION: It is recommended that the Maryland Higher Education Commission approve the 2016 Performance Accountability Report and ask the Secretary to forward it to the Governor and the General Assembly as required by law.

21
TARGETED
INDICATORS AND CAMPUS RESPONSES
COMMUNITY
COLLEGES

22
ALLEGANY COLLEGE OF MARYLAND Enrollment in continuing education workforce development courses (Indicators 30a and 30b). Enrollment in Continuing Professional Education leading to government or industry-required certification or licensure (Indicators 31a and 31b). Commission Assessment: Despite significant decreases in headcounts and enrollments in workforce development and professional continuing education courses between FY 2011 and FY 2014, the College has established benchmarks calling for significant increases for FY 2015. Please discuss specific strategies the College will employ to reach this benchmark. Response: The college set 2015 benchmarks that were not met for two continuing education indicators: Enrollment in continuing education workforce development courses and enrollment in continuing professional education leading to government or industry-required certification or licensure. The Dean of Continuing Education employed the following strategies to attempt to meet the FY2015 benchmark. Continuing Education Program Directors will continue to communicate with their partners through the County Chamber of Commerce and the Office of Economic Development, to connect with new businesses opening and relocating in the region. Likewise they will maximize their affiliations with professional groups and consortiums to ensure that offerings provide the appropriate content for participants to obtain and maintain their licenses and certifications. Statewide Maryland Community College Advisory Groups will be consulted to help determine trends and licensure and certification cycles among various professions. To meet the FY2020 benchmark, over the last few years, ACM CE has increased partnerships and invested resources for new licensure and certification programming. In the health field, affiliations have been expanded including those with the Dental Association and the Western Maryland Health System. A new training partnership with the Western Maryland Area Health Education Center allows for new professional licensure and certification opportunities. The Manual & CNC Machining Program has been created and provided a new market for those seeking certification, and started an employment pipeline for area employers. This new initiative has also been incorporated into college involvement in the Regional Manufacturers Roundtable. The awarding of an EARN grant through DLLR, has created an IT Center for Excellence, that networks local IT employers, and identifies the credentials needed by companies in the region, including future hiring requirements.
23
ANNE ARUNDEL COMMUNITY COLLEGE
No response required.
24
BALTIMORE CITY COMMUNITY COLLEGE
Associate degrees and credit certificates awarded (Indicator 25b). Commission Assessment: There have been fluctuations in the College’s transfer degree awards for the past several years, with a 39.7% drop in the number of awards from 2013 to 2014 (from 234 to 141). Please describe the strategies that the College intends to utilize to achieve the projected benchmark of 70.2 percent growth in transfer degrees awarded in 2015. Response: The number of transfer degrees increased in FY 2015 to 168 from 141. The numbers of certificates and career degrees awarded fell to 237 and 104, respectively (Indicator 16). The benchmarks for FY 2015 were 320 (career degrees), 240 (transfer degrees), 75 (certificates), and 635 (total awards). The benchmark for certificates was surpassed, but the numbers of degrees have fluctuated. Based on BCCC’s FY 2016 degree information system, the number of career degrees awarded fell to 193 while certificates increased to 113 and transfer degrees increased to 232 (a 64.5% increase from FY 2014). The total number of awards increased to 538. Based on recent initiatives, BCCC has established a benchmark of 647 total awards for FY 2020. In FY 2015, BCCC completed the reduction in credits for awards in accordance with CCRCCA. All educational plans were revised accordingly and shared. A more interactive degree/certificate auditing process was implemented in FY 2016 to better advise students on the achievement of short-term certificates. Degree Audit Specialist contact all students who have earned at least 45 credits towards an Associate degree or 15 credits towards a certificate for assistance with a completion plan. The YearUp program will be doubling its capacity (from 40 to 80) leading to more students completing IT Basic Skills certificates. BCCC currently offers 13 programs with stackable certificates and new programs will be developed with stackable credentials included.

25
CARROLL COMMUNITY COLLEGE Associate degrees and credit certificates awarded (Indicator 25b). Commission Assessment: The College has demonstrated substantial growth on this indicator over the past several years, seeing a marked increase in career, transfer, and associate degrees awarded and exceeding the benchmark goals. Please discuss the factors underlying these trends in degrees and certificates awarded and whether the College expects these trends to continue in the future. Response: Two factors were primarily responsible for this increase in degrees awarded over this period. The college has placed great emphasis on supporting student degree completion, through individualized student planning, targeted advising, free tutoring, student coaching, reforms in transitional education, summer bridge programs, placement test preparation, promotion of summer and winter session attendance, increasing the number of courses offered online, and introduction of accelerated seven-week classes. In its marketing communications, the college has emphasized the advantages of completing the first two years of college at the community college through its “Higher Ed. Lower Cost” campaign promoting Carroll as “the cost-effective college strategy.” These efforts have had the desired result. The percentage of degree-seeking students who complete the associate degree within four years has steadily increased from 28.2 percent for the 2005 entering cohort to 41.1 percent for the 2011 cohort. The increased volume of degrees awarded over the study period also reflected strong enrollment growth prompted by the economic recession of 2007-08 and subsequent slow economic recovery. As was true with community colleges nationwide, high unemployment and recession encouraged more students to enroll at the community college. This “economic effect” peaked in fall 2009, when credit headcount at Carroll was nearly 500 students above what would normally have been anticipated based on underlying county demographics and historical enrollment rates. Increased enrollments due to the recession impacted Carroll from 2007 through 2012. In fall 2013, enrollments fell to more normal levels, and have come in at forecasted levels ever since. The combination of increased enrollment rates and the higher enrollment due to the recession produced the great increase in degrees awarded. With enrollment now steadily declining due to the changing age composition of Carroll County’s stagnant population, it is likely the number of awards will decline—despite improved graduation rates. Enrollment in continuing education workforce development courses (Indicators 30a and 30b). Enrollment in Continuing Professional Education leading to government or industry-required certification or licensure (Indicators 31a and 31b). Commission Assessment: Despite significant decreases in headcounts and enrollments in workforce development and professional continuing education courses between FY 2011 and FY 2014, the College has established benchmarks calling for significant increases for FY 2015. Please discuss the College’s strategies it will use to achieve these increases.

26
Response: Declines overall in continuing education can be attributed to lower county unemployment rates, stagnant population growth and the related decline in high school population and graduates. Competition from online training providers in the information technology and childcare training areas are also suspected to be a factor. The decline in IT enrollments since FY2013 is also attributed to the end of a large cybersecurity grant that had provided free tuition for the certification courses resulting in increased enrollments for a three-year period. Additionally, as the economy continued to improve between 2011 and 2014 and unemployment fell, there were fewer contracts with the local WIA office for cohort occupational training resulting in lower enrollments. Several strategies to increase enrollments and headcount are being implemented. Continuing Education and Training will develop additional online and hybrid course offerings and expand partnerships with training providers to deliver more online options to our students. The Medical Assistant program has seen declines in enrollment over the past year which we are attributing to the high cost of the program and limited financial assistance available. In response, we have restructured our tuition assistance program to help more students overcome the financial barriers to entry. Additionally, we are applying for Pell Grant funding approval for the program. In 2014, we dedicated a position to provide student support services; this position has expanded to provide student career advising and support services for those entering career training programs, manage the Veterans approved programs, work directly with students utilizing our tuition assistance, and work with retention issues to facilitate program completion. These activities help to facilitate successful completion of career training programs, many of which prepare individuals for licensure or certification, such as Medical Assistant, Certified Nursing Assistant, Phlebotomy Technician, Pharmacy Technician and Dental Assistant. Continuing Education and Training is working side-by-side with our academic colleagues to develop new programs with stackable skills and credentials that will prepare the workforce and enhance the economic vitality of Carroll County. This joint planning has enabled us to create opportunities for credit for prior credentials, degree attainment, and ongoing continuing professional education. We are currently working with marketing and web services to (1) enhance our website end-user experience to make it easier to locate information and register for continuing education courses and workforce training certificates, and (2) expand use of social media. We are evaluating enrollment trends and will replace programs with low enrollment numbers and/or high cancellation rates with new programs designed to meet future workforce demands. The Business Training and Services area is currently undergoing a rebranding effort which will clearly define and communicate information about our employee training services to the business community. Through this effort we hope to assist more Carroll County businesses and organizations to prepare their workforce for future demands and expand our impact on the County’s economic development. We continue to work closely with our local WIOA staff, local Economic Development, the Maryland Department of Commerce, the Carroll Technology Council, Chambers of Commerce and other stakeholders in workforce development to meet regional workforce needs.
27
CECIL COLLEGE Successful persister rate after four years (Indicator 5). Commission Assessment: The College had seen increases in performance in its successful persister rate for its college-ready and developmental non-completer students in the Fall 2007, Fall 2008, and Fall 2009 cohorts and declines in successful persister rates for developmental completers within those same cohorts. However, the College experienced a substantial decline in these rates for all students in the Fall 2010 student cohort. In the 2015 Performance Accountability Report, the College briefly summarizes several contributing factors tied to this sharp decrease and discusses institutional initiatives aimed at addressing this trend. Please provide any available information on the efficacy of these initiatives and describe the measures used by the College to assess the effectiveness of them. Response: The College transitioned the developmental math courses from Pearson’s MyMathLab to the Assessment and Learning in Knowledge Spaces (ALEKS). For fall 2015, this action enabled more students to successfully complete classes and allowed students to complete multiple courses in the same semester. There was significant increases in the pass rate from fall 2014 to fall 2015: 51.02% MyMathLab; 71.29% ALEXS. This resulted in a 20.27% change from fall 2014 to fall 2015. Next, a new developmental education sequence was designed for Math. This new sequence reduces the maximum credit hours of Developmental Math from 11 (MAT 091 – 4, MAT 092 – 4, and MAT 093 – 3) to eight (8) credit hours. Our developmental math sequence includes three courses. MAT 096 Math Fundamentals is a two credit course consisting of basic math skills beginning with arithmetic. MAT 097 Introductory and Intermediate Algebra is a four credit course that is the prerequisite for college math courses in Statistics, Finite Math, and Applied Calculus. MAT 098 Advanced Intermediate Algebra is a two credit course for STEM majors that is the prerequisite for Precalculus and science courses. For many students the pathway to a college level math course is shortened to one four (4) credit course. This result is a significant savings in both time and tuition expense. In addition, this new sequencing will continue to use the ALEXS programs and continue to have an instructor and tutor. A summary of the implementation follows: Project Overview Status of implementation: • Pilot Summer 2016 • Full implementation Fall 2016 Number of Sections: • Summer: 5 • Each Fall: 24 • Each Spring: 20 How many students: • Summer: 105 • Each Fall: 534
28
• Each Spring: 398 Programs of study that align with the new pathway: - Art - Biology - Business - Economics - Procurement - Music - Nursing - Visual Communications We will continue to monitor the progress of improvements and provide statistics reflecting the success of this program.

29
CHESAPEAKE COLLEGE Commission Assessment (not tied to any specific indicator): In the 2015 Performance Accountability Report, the College described its efforts to analyze differences in Degree Progress Indicator outcomes for minority students and all students. Its findings show that degree progress is a function of students’ college readiness, with fewer minority students enrolling at the College “college-ready” than their non-minority peers. Please discuss what strategies the College intends to employ as a result of this analysis in an effort to address the identified achievement gap. Response: The Commission noted that in the 2015 Performance Accountability Report, the College described its efforts to analyze differences in Degree Progress Indicator outcomes for minority students and all students. Its findings show that degree progress is a function of students’ college readiness, with fewer minority students enrolling at the College “college-ready” than their non-minority peers. As a result of this analysis, strategies to address the identified achievement gap were requested. African-American students have statistically lower degree progress rates than White students. However, the true achievement gap is more related to the fact that White college readiness rates are 4-5 times that of African-Americans. Additionally, African-Americans’ rate of testing into both developmental English and Math is twice as high as Whites. Not surprising, Whites complete developmental coursework at nearly twice the rate of African-Americans. Chesapeake College's approach to this situation focuses on two dimensions – helping more new students enter college-ready or with fewer developmental requirements and helping more students with developmental needs complete those hurdles. The College collaboratively developed with its five support counties an articulation agreement to employ its Intermediate Algebra course as a transition course for high school seniors who need to demonstrate college readiness in math. Chesapeake is providing the school systems with the course curriculum and comparable testing materials and has agreed to use the course as a pre-requisite for and direct placement into its various credit-level math courses. The College and the five counties also offered the Alternate College Readiness Assessment (ACRA) initiative to allow qualified recent public school graduates to substitute high school grade-point average for the applicable Accuplacer test score for placement into college-level English and/or mathematics courses. Students who did not meet the Accuplacer cut score for entrance into credit-level English but had both a 3.0 cumulative high school grade-point average and a 3.0 cumulative grade-point average in high school English courses were permitted to register for credit English. Similarly, students who did not test into college-level math courses but had both a 3.0 cumulative high school grade-point average and 3.0 cumulative grade-point average in all high school math were allowed to skip developmental math. Sixty-seven students used the ACRA waiver in fall 2015, 17.2% of all recent local public high school graduates, leading to a jump in the number and share of college-ready students. Despite continued enrollment declines overall, the number of recent African-American high school graduates in attendance increased and their college readiness rate rose to a record level, while the percentage requiring both English and math remediation fell substantially. More details about their successful outcomes is included in a later passage.

30
Starting in 2012, all developmental math classes were taught in math labs with students working independently through myMathLab, a product that includes video instruction, practice tests and activities, and testing. Instructors and tutors were available in the room to assist. Though the program followed guidelines based on the emporium model used at other colleges, course success rates were poor. Adjustments and changes yielded no improvement, so in 2015 the decision was made to radically change the model using a more traditional classroom format, supplemented with an open textbook licensed under an open copyright license (OER), and made available online to be freely used by students and the online math lab. All sections of the lowest level math (MAT023) were converted to this format for fall 2015. With initial favorable results and student reaction, those students who completed MAT023 in the fall were allowed to register in specially designated sections of MAT031 (the next highest level) in the spring 2016 semester. New enrollments in MAT031 and MAT032 (the highest developmental level) continued to register in the PASS for the spring, and if necessary, complete in summer 2016. Special one-credit hour sections were offered in the summer for students needing only limited additional time to complete the course under the old model. In fall 2016, all three math classes will be taught in the redesigned OER classrooms. Developmental English made radical changes with a new curriculum and course numbering system in place for AY 14-15. Faculty members continue to refine and improve the course materials and instructional sequence. During AY 2015-16, all faculty members were advised to use more intrusive contact with the students. Instructors got student mobile phone numbers during the first week of class, and texted any student who missed two classes. Following up with students rather than simply letting them fall behind and slip away is particularly important with this population, that, in addition to academic needs, may also be dealing with non-cognitive challenges that keep them away from the class. While the impacts of these changes will take more time to manifest in the formal outcome metrics, positive signs have already emanated. Fall 2015 students taking credit-level English and math with an ACRA exemption had success rates that were almost 20 percentage points higher than achieved by their non-ACRA counterparts. Also, in MAT023 that was first fully redeveloped, the course success rate of African-American students rose from 15.8% in FY2014 to 35.8% in FY2016, while the partially redeveloped MAT031 increased from 7.3% to 21.6% over the same period.

31
COLLEGE OF SOUTHERN MARYLAND Associate degrees and credit certificates awarded (Indicator 25b). Commission Assessment: The College is to be commended for a 62.1% increase in transfer degrees awarded from 2011 to 2014 (from 575 to 932). Please discuss in greater detail the factors underlying this increase and whether the College expects these trends to continue in the future. Response: The College of Southern Maryland is committed to student success. CSM promotes completion through its Strategic Plan and Success and Goal Completion Plan. The Plans integrate institutional policies, practices, and programs intentionally designed to maximize students’ efforts at each point along their College experiences, beginning at their first point of contact and continuing until students have earned a certificate or degree. Some best practices and strategies include:
(1) Early pathway educational assessment: CSM provides opportunities for students to measure their college readiness for college-level English, mathematics, and reading, in their junior year of high school. Students who score poorly can take courses to improve skills during their senior year. The goal is to have high school graduates completely prepared to begin college-level work.
(2) Academic Advising: CSM standardized academic advising to both accelerate the pace of credit accumulation and improve college persistence. The standardization provides continuity of access and services across all campuses for students and includes an intrusive advising model, which is action-oriented to involve and motivate students to seek help when needed.
(3) Pathways to a Degree/Degree Plan: CSM provides an academic degree plan for entering freshmen to help students anticipate the academic workload, courses needed to earn a degree, and when courses will be offered in order to appropriately schedule prerequisites.
(4) Reverse Transfer: Students who have earned 15 or more credits and have transferred to a four-year institution without an associate’s degree may “reverse transfer” their earned credits from the four-year institution to complete an associate’s degree. This process makes it possible for students to earn an associate’s degree as they continue to work toward completing their bachelor’s degree. CSM has reverse transfer agreements with Salisbury and Towson Universities.
(5) Auto-Awarding: CSM automated the awarding of certificates to increase the number of students completing a certificate. Students who earn associate degrees are notified of the certificates they have earned. Graduation candidates no longer pay a graduation fee.
(6) ACCESS CSM: Designed for high school students to earn college credit via distance education. College courses are broadcast by satellite to the high school, students interact with faculty and college students. Taking a college course helps prepare students for the expectations of higher education and will add value to their college applications and resumes.
(7) Fifteen to Complete Grant Assistance: Provides financial assistance to students who are near completion
(8) Dual Enrollment: Allows students to take college courses while still enrolled in high school.
32
(9) Early Academic Alert: CSM identifies students who are “at risk” and establishes proactive intervention methods through the ‘early alert’ program. At risk includes students who have academic related concerns within the classroom once other methods have been unsuccessful. Areas of concern including missing assignments, poor class performance and attendance, and difficulty comprehending course materials.
The College anticipates growth in the number of degrees and certificates, but at a slower pace than the last few years.

33
COMMUNITY COLLEGE OF BALTIMORE COUNTY Successful persister rate after four years of college-ready students, developmental completers, and developmental non-completers (Indicators 5a, 5b, and 5c). Commission Assessment: The College is to be commended for increases in performance in the successful persister rate of college-ready students over the past four student cohorts (Fall 2007 to Fall 2010). However, among these same cohorts the successful persister rates decreased for both developmental completers and developmental non-completers (by 4.7 percentage points and 6.5 percentage points respectively). Please discuss in greater detail the factors underlying these decreases and describe any steps the College has taken or intends to take to restore rates. Response: For the most recent cohort reported, Fall 2011, the persistence rate for developmental completers has increased from 80.8% to 84.3%, an improvement of 3.5 percentage points. Unfortunately, the developmental non-completer rate has not improved. In Fall 2011, the persister rate was 36.2%, a small decline from the Fall 2010 rate of 36.9%. However, CCBC has been successful in decreasing the number of developmental non-completers. In Fall 2011, the percentage of students in the cohort classified as developmental non-completers was 40.6%, down from 45.4% in Fall 2010. The percentage of developmental completers increased from 39.2% to 42.6%. Reducing the number of non-completers is one factor in the improvement of CCBC’s overall persister rate from 60.2% to 63.3%. Additionally, the college is utilizing a number of strategies to increase both the number of students successfully persisting and the percentage of successful students in these cohort groups (college ready, developmental completer, and developmental non-completer). CCBC implemented guided pathways in Fall 2015, which now provide students with a clear road map of the courses they need to take to complete a credential. The pathway structure includes more opportunities for student and faculty engagement, an enhanced orientation for new students, expanded role for academic advising, and more supports to ensure students stay on course. For students with developmental needs, the college has instituted and scaled accelerated courses in English (writing), reading and math. CCBC is a national leader in developmental education acceleration. Our accelerated course delivery models for developmental education have been shown to increase the rate at which students successfully complete developmental and college level courses. Through intensive advising and more clear course tracks, developmental education accelerated courses are now taken by the majority of our developmental students.
34
FREDERICK COMMUNITY COLLEGE Fall-to-fall retention of Pell grant recipients (Indicator 26a). Commission Assessment: Fall-to-fall retention of Pell grant recipients has increased four percentage points (from 57.1% to 61.2%) for the past three cohorts of students (Fall 2010, Fall 2011, Fall 2012, and Fall 2013 cohorts). Please discuss the factors underlying this increase and whether the College expects these trends to continue in the future. Response: Factors underlying the increase in fall-to-fall retention of Pell grant recipients include:
• The Partnership to Achieving Student Success (PASS) program, created in 2011, which provides support for recent high school graduates who test into one or more developmental course(s) at FCC.
• The creation of FAFSA workshops held on campus during both day and evening hours. • Targeted and personal emails to students from financial aid counselors regarding needed
documentation and verification materials. • Personal telephone calls to students from admissions counselors encouraging previously
enrolled Pell grant recipients who had not completed a degree to re-enroll and register for classes, as well as connecting them to needed resources.
Although the College plans to continue these initiatives, it does not expect the trend to continue beyond the Fall 2014 cohort. Federal regulations regarding the monitoring of student progress toward degree program completion (Satisfactory Academic Progress) have resulted in an increased number of student suspensions of eligibility for federal financial aid, which prevents students from enrolling, and will impact the overall number of Pell grant recipients. Future initiatives include the expansion of a First Year Experience program to address academic preparation and success, a student success alert to offset the increasing number of student suspensions, and the availability of student success grants to keep students in class and prevent withdraws.
Enrollment in continuing education workforce development (Indicator 30a). Enrollment in Continuing Professional Education leading to government or industry-required certification or licensure (Indicator 31a). Commission Assessment: The College has seen a substantial decrease in unduplicated headcount in continuing education workforce development (a 55.5% decrease in headcount) and government or industry-required professional education (a 26.8% decrease in headcount) between 2011 and 2014. Please discuss the factors underlying these trends and describe any steps the College has taken or intends to take to increase enrollment. Response: From FY 2011 to FY 2014, Continuing Education and Workforce Development (CEWD) enrollment dropped for several reasons. FCC closed the Drivers Education Program because costs exceeded revenue (also reported in Licensure), there was a decrease in business contract training that reflected a lag in local recovery from the recession, and the College lost a significant contract in health care training for ACLS/CPR with the local health care system (also
35
reported in Licensure). The Business Management program also saw a decrease in demand, and a change in a real estate licensure partnership caused a significant drop in Professional Licensure for the same period. In addition, the College made changes to the Applied Music registrations, whereby CE companion courses are shifting to credit course enrollment. Also, CEWD has seen a decrease in the senior population in the Institute for Learning in Retirement program. The following strategies are underway to increase enrollment:
• Marketing plans have been overhauled by leveraging new technologies and using the market research and analysis conducted by the Marketing Department.
• Student prospect tracking and communications and implementation of online portal for enhancing web registrations was initiated.
• New programs have been developed in Sterile Processing, Web Development, Frontline Leadership, Entrepreneurship, Hotel, Culinary Arts, and Tourism. Future programs in development are a manufacturing boot camp, a MakerSpace curriculum, and more CE programming in pathways for hospitality programming.
• Course offerings in the Institute for Learning in Retirement are being expanded. • Audience profiles for recruitment have been widened. • The Contract Training model is being overhauled by moving toward a Business Solutions
model and the College hired a newly designed position to focus on better outreach strategies and sales.
• Growth in serving students as a result of the new WIAO legislation is anticipated. • Growth with respect to the American Heart Association Training Sites is anticipated.
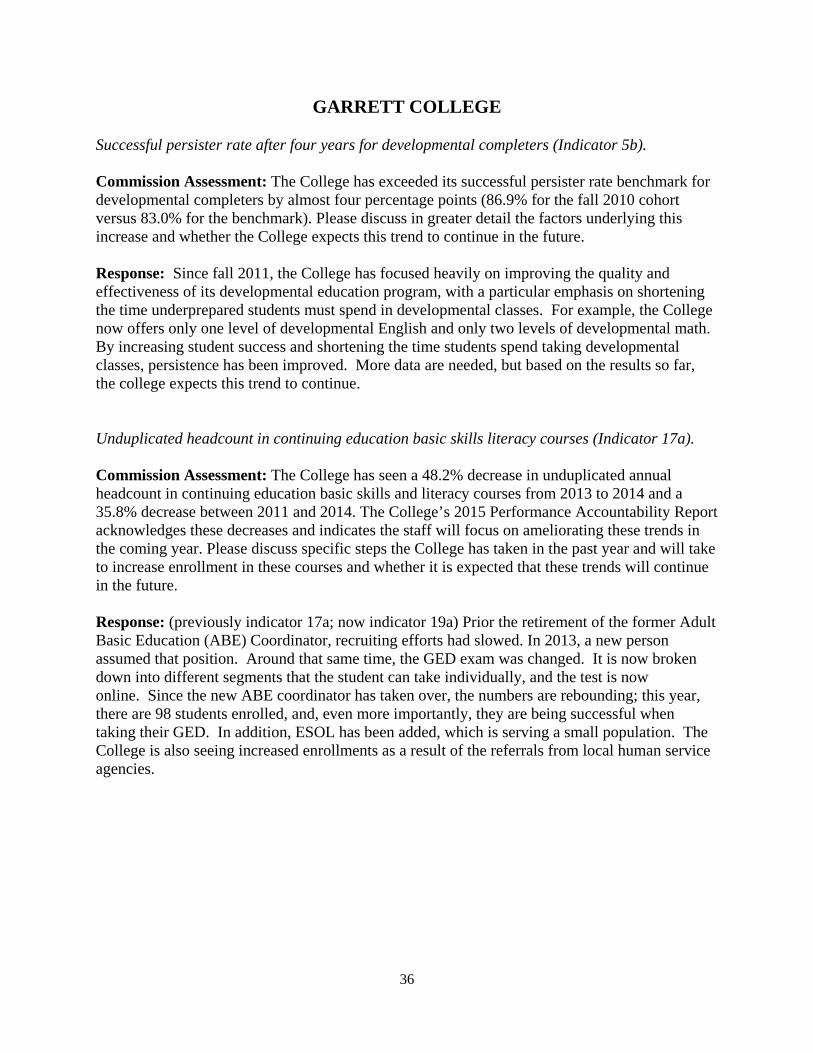
36
GARRETT COLLEGE Successful persister rate after four years for developmental completers (Indicator 5b). Commission Assessment: The College has exceeded its successful persister rate benchmark for developmental completers by almost four percentage points (86.9% for the fall 2010 cohort versus 83.0% for the benchmark). Please discuss in greater detail the factors underlying this increase and whether the College expects this trend to continue in the future. Response: Since fall 2011, the College has focused heavily on improving the quality and effectiveness of its developmental education program, with a particular emphasis on shortening the time underprepared students must spend in developmental classes. For example, the College now offers only one level of developmental English and only two levels of developmental math. By increasing student success and shortening the time students spend taking developmental classes, persistence has been improved. More data are needed, but based on the results so far, the college expects this trend to continue. Unduplicated headcount in continuing education basic skills literacy courses (Indicator 17a). Commission Assessment: The College has seen a 48.2% decrease in unduplicated annual headcount in continuing education basic skills and literacy courses from 2013 to 2014 and a 35.8% decrease between 2011 and 2014. The College’s 2015 Performance Accountability Report acknowledges these decreases and indicates the staff will focus on ameliorating these trends in the coming year. Please discuss specific steps the College has taken in the past year and will take to increase enrollment in these courses and whether it is expected that these trends will continue in the future. Response: (previously indicator 17a; now indicator 19a) Prior the retirement of the former Adult Basic Education (ABE) Coordinator, recruiting efforts had slowed. In 2013, a new person assumed that position. Around that same time, the GED exam was changed. It is now broken down into different segments that the student can take individually, and the test is now online. Since the new ABE coordinator has taken over, the numbers are rebounding; this year, there are 98 students enrolled, and, even more importantly, they are being successful when taking their GED. In addition, ESOL has been added, which is serving a small population. The College is also seeing increased enrollments as a result of the referrals from local human service agencies.

37
HAGERSTOWN COMMUNITY COLLEGE
Enrollment and headcount in contract training courses (Indicators 33a and 33b). Commission Assessment: The College has exceeded its benchmarks for enrollment in contract training courses, seeing a 168.8% growth in unduplicated headcount from 2011 to 2014 (570 to 1532) and a 196.2% growth in annual enrollments (817 to 2420). Please discuss the factors underlying these dramatic increases and whether the College expects these trends to continue in the future. Response: Hagerstown Community College is committed to expanding community and business services to those we serve. This commitment is incorporated into its 2018 Strategic Plan as Strategic Goal 4.3; “Expand strategic partnerships and alliances in fulfilling the College’s mission and serve as a supporting catalyst for regional economic development.” From a curricular standpoint, HCC responded to employer needs by developing the high skill/high wage programs discussed above in State Plan Goal 5 – Economic Growth and Vitality. Establishing such programs comes with a multitude of experienced professionals in the designated areas in the form of faculty, and specialized equipment to be used as training tools for students. With this vast array of skilled professionals and industry equipment in areas of known need with the community, HCC was able to capitalize on the supply-and-demand opportunities presented by expanding them beyond credit-program enrollment.
Furthermore, our Continuing Education office has gone to great lengths to secure partnerships with local organizations and businesses on their educational trainings to provide on-site coordination. In July 2014 and again in June 2015, Hagerstown Community College hosted large training events on campus as a direct result from these partnerships. While the benefit from these events is reflective in the data, the nature of the training events discourages sustainable annual training. As such, while the college remains committed to continuing to secure partnerships and host contract trainings, it does not expect to sustain the high trends of data reported in FY 14 and FY 15.
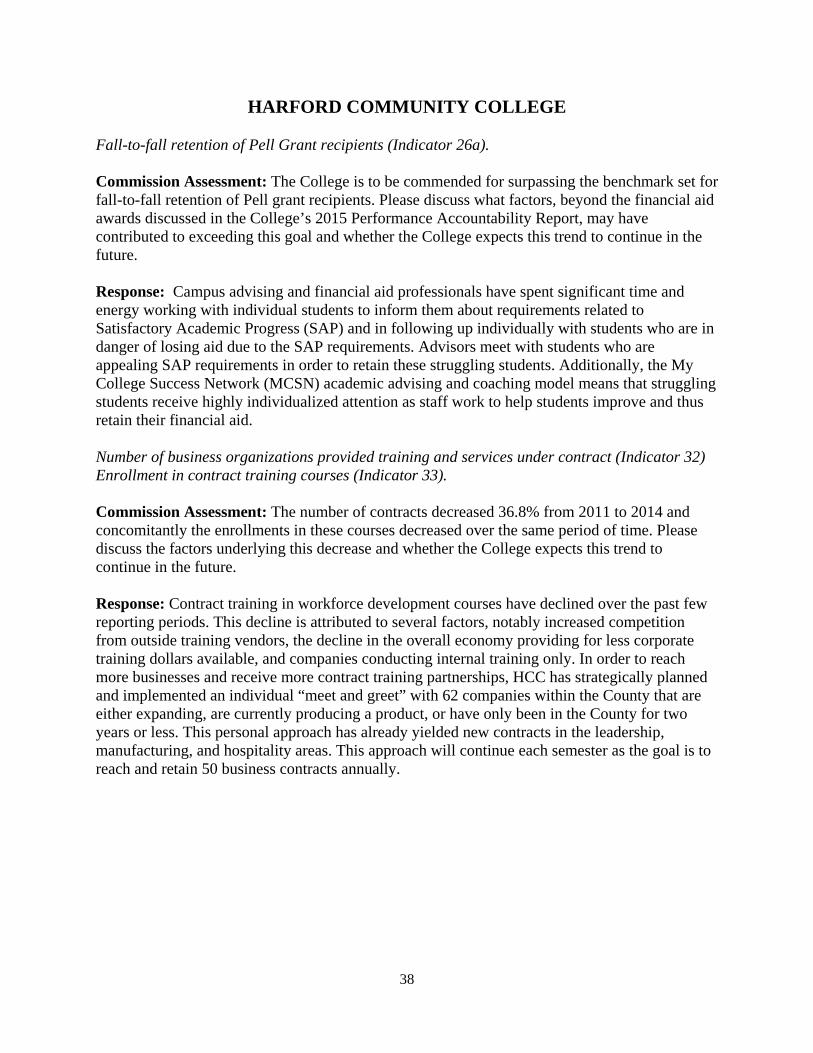
38
HARFORD COMMUNITY COLLEGE Fall-to-fall retention of Pell Grant recipients (Indicator 26a). Commission Assessment: The College is to be commended for surpassing the benchmark set for fall-to-fall retention of Pell grant recipients. Please discuss what factors, beyond the financial aid awards discussed in the College’s 2015 Performance Accountability Report, may have contributed to exceeding this goal and whether the College expects this trend to continue in the future. Response: Campus advising and financial aid professionals have spent significant time and energy working with individual students to inform them about requirements related to Satisfactory Academic Progress (SAP) and in following up individually with students who are in danger of losing aid due to the SAP requirements. Advisors meet with students who are appealing SAP requirements in order to retain these struggling students. Additionally, the My College Success Network (MCSN) academic advising and coaching model means that struggling students receive highly individualized attention as staff work to help students improve and thus retain their financial aid. Number of business organizations provided training and services under contract (Indicator 32) Enrollment in contract training courses (Indicator 33). Commission Assessment: The number of contracts decreased 36.8% from 2011 to 2014 and concomitantly the enrollments in these courses decreased over the same period of time. Please discuss the factors underlying this decrease and whether the College expects this trend to continue in the future. Response: Contract training in workforce development courses have declined over the past few reporting periods. This decline is attributed to several factors, notably increased competition from outside training vendors, the decline in the overall economy providing for less corporate training dollars available, and companies conducting internal training only. In order to reach more businesses and receive more contract training partnerships, HCC has strategically planned and implemented an individual “meet and greet” with 62 companies within the County that are either expanding, are currently producing a product, or have only been in the County for two years or less. This personal approach has already yielded new contracts in the leadership, manufacturing, and hospitality areas. This approach will continue each semester as the goal is to reach and retain 50 business contracts annually.

39
HOWARD COMMUNITY COLLEGE
Market share of recent, college-bound high school graduates (Indicator 12). Commission Assessment: The College has seen fluctuations in the market share of recent, college-bound high school graduates, and in 2015 has exceeded its benchmark goal by four percentage points. Please explain what may have contributed to these fluctuations and most recent increase and whether the College expects this trend to continue in the future. Response: Factors that may have contributed to the most recent increase in market share of recent, college bound high school graduates include new programs designed for underrepresented students and a software application that supports robust communication plans for prospective students. The college hopes to exceed its benchmark but also realizes that the metric may continue to fluctuate. Fall-to-fall retention of Pell grant recipients (Indicator 26a). Commission Assessment: The College is to be commended for its year-over-year increases in fall-to-fall retention of both Pell grant recipients and non-recipients. Please discuss the factors that have contributed to the College’s success in the retention of Pell grant recipients and whether it anticipates this trend to continue. Response: Factors that may have contributed to the increases in fall-to-fall retention (Fall 2012-Fall 2013) of Pell Grant recipients include high levels of case management to help students pay for college and avoid being dropped for non-payment, high levels of communication to Pell Grant recipients regarding registration and focused support services for low-income students. The college expects to continue the trend of year-over-year increases but realizes that the metric may also fluctuate.

40
MONTGOMERY COLLEGE Commission Assessment: The College’s performance on this indicator has declined in the last several cohort years, with persistence rates decreasing 5.6 percentage points between the Fall 2007 cohort and the Fall 2010 cohort. The College briefly discusses this decline in its 2015 Performance Accountability Report, indicating that a task force assessed the issue and provided recommendations. Please elaborate on the task force’s findings and discuss any steps the College has taken or intends to take to improve performance on this indicator. Response: Although the persistence rate decreased 5.6 percentage points between the fall 2007 and fall 2010 cohorts, and persistence of the intervening cohorts fluctuate, the successful persistence rate for African American students reached 91% of the benchmark. The persistence rate for the most recent cohort, fall 2011, increased to 71.6 percent, bringing the success of this indicator closer to its target. The academic success of students, which includes persistence in the academic pipeline, is the primary goal of Montgomery College. Following the recommendations of the Closing the Achievement Gap Taskforce, the College developed several student-centered initiatives. The list below is not exhaustive, but provides a sampling of current initiatives. • Established Achieving the Promise Academy (ATPA), which is a multi-faceted endeavor, to
more deeply invest in the success of African-American and Latino students. The ATPA is focused on aggressively coaching individual students to succeed academically at Montgomery College. Grounded in empirical research on student success, the ATPA creates and oversees small cohorts for student participants. Students benefit from academic coaching, mentoring, targeted academic support, and participation in Learning Success Cohort Communities (LSCC).
• Developed a Student Success Policy and joined the National Achieving the Dream Project to gain access to best practices and resources to help students succeed.
• Identified courses from the top 20 programs perceived as roadblocks (courses with high DFW rates) for a large number of students, particularly African American and Latino students; implemented the DFW Reduction Initiative which entails working with vice president/provosts, deans, chairs and faculty to develop strategies to reduce the DFW rates. The intent is to employ effective intervention strategies on targeted students prior to midterm, increase contact between affected students and faculty, and require the use of academic support resources. Thus far, results from these efforts have shown slight to modest increases in fall to spring retention, fall to fall retention and course pass rates.
• Implemented mentoring programs specifically aimed at the retention of African American students, both male (Boys to Men) and female (Sister 2 Sister) and Achieving the Promise Academy, which is includes a peer mentoring component. These mentoring programs provide academic and personal mentoring and monitor academic progress.
• The College supports and provides leadership development and professional development opportunities for targeted minority groups in partnership with other institutions, like the Black, Brown and College Bound Summit which provide the latest research and methods higher education institutions can employ to increase access, persistence, retention and graduation rates.

41
PRINCE GEORGE’S COMMUNITY COLLEGE Fall-to-fall retention of college-ready students (Indicator 3a). Commission Assessment: The College saw fluctuations in its fall-to-fall retention of college-ready students between Fall 2010 and Fall 2012, with a sharp decrease for the Fall 2013 cohort (from 63.0% in Fall 2012 to 46.8% in Fall 2013). Please explain what may have contributed to the decrease and any steps the College has taken or intends to take to restore the rate. Response: In order to respond to this issue, data on the fall-to-fall retention metric was reviewed for the last decade. The resulting analysis showed this metric commonly fluctuates from one year to the next by ten percent or more around a mean of approximately 55%. Indeed, this year’s value returns the metric very close to this mean. The likely reason for such large percentage fluctuations is due to the small number of students these percentages represent. The change from 63.0% for the fall 2012 cohort to 46.8% for the fall 2013 cohort represents only 160 students, or 1% of the College’s total student population. It is common for PGCC’s college-ready students to complete one or two semesters at the College and then transfer to a four-year institution, prior to completing a credential at the College. By fall of 2014, there were 160 additional students from the fall 2013 cohort that had left the College compared to the prior year, with the majority of them leaving to attend another institution. While fluctuations in fall-to-fall retention rate are common, the College is keenly aware that encouraging college-ready students to persist and complete at PGCC is an important metric to improving overall performance. To address this, the Pathways Project includes work to establish tighter and clearer alignments with transfer institutions and stronger articulation agreements for specific programs, especially the larger transfer programs. The goal is to ensure students have a smooth and successful transition to a four-year institution after completing their degree at PGCC. In addition to these changes, the College has also established some incentives to retain and graduate more college-ready students. One incentive is a tuition assistance grant for students who are returning to the College after being absent for at least two consecutive semesters and have an original one-term outstanding balance of $500 or less. Another incentive has been developed to encourage dual-enrollees to continue their academic career at PGCC. The “Dual to Completion” incentive is available to students who started at the College as dually enrolled students continue after high school graduation to complete their degree at PGCC. All of these specific actions and incentives are expected to increase the total number of college-ready students who begin at PGCC, remain enrolled, and complete their degree before transferring.

42
WOR-WIC COMMUNITY COLLEGE Number of business organizations provided training and services under contract (Indicator 32) Enrollment in contract training courses (Indicator 33). Commission Assessment: The number of businesses receiving training and services under contract has increased 341.9% in four years (from 31 in 2011 to 137 in 2014), and concomitantly enrollments have increased over that time. In the 2015 Performance Accountability Report, the College explains that this increase is due to efforts by staff to re-establish ties with businesses in the area. Please explain in greater detail the efforts the continuing education staff members employed to re-establish ties with businesses and whether the College thinks this trend is sustainable. Response: The greatest increase in both the number of businesses and organizations, and enrollments, occurred from FY 2012 to FY 2013. The reason for the increase from 33 businesses and organizations in FY 2012 to 121 in FY 2013 (and concomitant enrollment increases) was a college business process change, whereby formal contracts were created for training provided by Wor-Wic’s criminal justice academy. The college believes that this trend is sustainable since this process and the continuing education division’s ongoing efforts to explore training opportunities with area businesses and organizations are expected to continue.
43
TARGETED INDICATORS AND CAMPUS RESPONSES
PUBLIC FOUR-YEAR
COLLEGES AND UNIVERSITIES

44
BOWIE STATE UNIVERSITY Objective 2.3: Increase the number of online and hybrid courses annually from 99 in 2012 to 240 in 2019 and offer at least two predominantly or fully online programs by 2019. Commission Assessment: Currently, the University has no programs where most or all of the courses are taught online. In the 2015 Performance Accountability Report, the University established a goal of creating at least two predominantly or fully online programs by 2019. Please discuss the University’s current and future strategies as it onramps these new online programs. Response: The Middle States Commission on Higher Education (MSCHE) 2011 decennial visiting team made several recommendations related to online education at Bowie State. Specifically, the team recommended establishing clearly defined lines of authority for the direction of distance education programming, assuring that the development and approval of distance education courses and programs follow the same processes as traditional face-to-face courses and that new online programs should be developed along the lines defined in the Middle States guidelines Distance Education Programs: Interregional Guidelines for the Evaluation of Distance Education (Online Learning). Bowie State’s 2016 Periodic Review report summarized the progress in meeting these recommendations. Since 2012, the university’s Academic Computing unit has been responsible for collaborating with academic units to develop and support both fully online courses as well as hybrid courses in which 50% or more of the instruction and learning activities are carried out online. In addition to instructional design, Academic Computing assumes responsibility for the management and technical support for the university’s learning management system, faculty development, course redesign projects, and online learner support services. Academic Computing reports directly to the Provost and Vice President for Academic Affairs. The 2013-2018 Strategic Plan Initiative, 3.3 Identify and implement selected online academic programs and courses to provide alternative modes of instructional delivery, provides the framework for expansion of distance education. Academic departments, Academic Computing and the Office of Planning, Analysis and Accountability (OPAA) identify possible courses and programs for development. Once identified and discussed with the academic departments, faculty and Academic Computing collaborate to develop online courses that are comparable to face-to-face instruction. Since fall 2012, the university has doubled the number of courses online and enrollment in these courses grew 77 percent. While enrollment is growing in online courses, the number of students enrolled exclusively online is very small – approximately 65 students. Targeted course development is occurring in the graduate Nursing and Management Information System programs so that the university can submit a Middle States substantive change request to offer distance education programs. All new courses, regardless of instructional format are reviewed and approved by Bowie State’s Curriculum Committee. The University’s Online Policy further outlines the organization and policies related to new and previously approved courses offered through both face-to-face and distance education modalities. The Online Policy ensures that Bowie State’s online courses are

45
developed using the best practices in online course design, development, and delivery. Since 2013, all online and hybrid courses were evaluated internally using an abridged Quality Matters rubric. During the review process, 208 courses were evaluated and all, except 10, now meet more than 75 percent of the QM standards. Bowie State has aligned its distance education strategy and policies with the Nine Hallmarks of Quality defined by MSCHE. The Office of Academic Computing assessed the status of Bowie's progress in meeting the Hallmarks of Quality. The Strategic Plan provides the context for the vision of online education within the university’s overall mission and goals. The university is still in the process of laying the foundation necessary within the institution’s administrative areas to ensure that budgetary, technology, and resource planning is in place to sustain an online program. The online curriculum is developed based on its traditional course curriculum and undergoes the same internal and external evaluation and approval processes required for traditional courses and programs. The assessment of the effectiveness of the online courses and student learning outcomes are conducted through student course evaluations and through annual programmatic assessment reporting. Bowie State’s faculty members delivering online instruction are well supported through the training program for online education provided by Academic Computing. Both students and faculty are provided with helpdesk support, online help, and training resources. They are reminded of the requirement to uphold academic integrity in this new course delivery medium. Faculty and students have resources available through the Academic Computing and Online Course Support website including a student readiness self-assessment, video tutorials, how-to guides, and helpdesk information and training schedule. Bowie is now poised for offering targeted online courses to meet student demand.

46
COPPIN STATE UNIVERSITY Commission Assessment (not tied to a specific indicator): In the 2015 Performance Accountability Report, the University discussed institutional efforts in place to support students who transfer from other institutions, noting that students who transfer to the University “perform significantly better than the new freshmen,” with higher four-year graduation rates than their native peers. Please provide an analysis as to why this population performs significantly better than those students entering as freshmen. Response: National statistics, and data at the campus level, show that transfer students often complete all, if not most of the General Education requirements prior to entering the institution. A major impetus for transfer students’ success is the University System of Maryland’s articulation agreement among the community colleges and the four-year public institutions. As can be expected, transfers also enter into the institution having more college-level experience and are more aware of navigating college careers than incoming freshmen classes at Coppin, especially since on average, 61% of CSU’s freshmen indicate that they are first-generation college students. Transfers consist of more mature college going students. The designation of first-generation has profound effects on retention and completion rates at the institution as targeted services are usually needed to support students in time-to-degree completion. For FY 2016, Coppin State had 273 transfer students, continuing the trend of a strong transfer student population. Intervention and Support for Transfers: The campus has designated a set of services through Enrollment Management and Student Affairs. The office provides transfer and transition services to incoming and prospective transfer students. Furthermore, the University grants admissions priority will be granted to Maryland Community College students who have earned at least 56 transferable credits or have earned an Associate of Arts degree. Maryland resident transfer students who have attended two or more institutions may be considered for transfer admission if transfer applicants have a combined GPA of 2.0 or greater and are in good academic standing at the last institution attended. Students are tracked throughout their academic career and also receive specialized advisement within the Office of Records and Registration. Students are also provided guidance and support in the use of the University System of Maryland’s ARTSYS system, which is a system-wide information system to assist students in course selection and understanding necessary requirements for baccalaureate degree completion at the four-year institutions.

47
FROSTBURG STATE UNIVERSITY Objective 2.6: Attain and preserve a six-year graduation rate of African-American students at 54% through 2019. The University’s graduation rate for African American students has hovered between 47.4% and 53.0% for the past several years, with a 50.3% six-year graduation rate for African American students in the 2014-2015 academic year. Describe the factors the University has identified that affect students’ progress, provide evidence related to these factors, and identify strategies for addressing these obstacles. Response: There are four general factors that affect African-American students’ progress at Frostburg: academic readiness, social capital, financial concerns, and community climate. Academic Readiness High school grade point averages and SAT scores show that African-American students arrive at Frostburg with less academic preparation than other students. Strategies in place to assist with academic readiness include placement testing, developmental courses, tutoring and student support services, and early alert systems. At FSU, the reading, writing, and mathematics skills of all incoming students are assessed, and those falling below requirements are enrolled in appropriate Freshman Composition and/or Developmental Mathematics sections. One of the developmental mathematics courses was redesigned in 2011 to address low pass rates, particularly among African-American students. Since the redesign, pass rates have improved significantly. In 2015, the English Department created a one-credit course to complement Freshman Composition in an effort to better serve students who test at the lowest level on the English placement test. Individual and peer tutoring services are available for 100- and 200-level courses in the areas of mathematics, natural and computer sciences, and business courses. For assistance with other courses, as well as time/workload management, and test preparation, students can participate in the Peer Assisted Learning program or visit the writing center. The federally-funded TRiO Student Support Services program also provides a broad array of services to eligible first-generation, low-income students, including professional tutoring. Frostburg has two early alert systems that help to identify students who may require additional support. Firstly, the Freshman Progress Survey, which is administered each fall and spring term, asks faculty to complete a brief survey for each freshman regarding any obstacles to student progress. These surveys are returned to students’ advisors for follow up. Secondly, the Beacon early alert system connects all faculty, advisors, athletic coaches, and academic support staff with their students and provides an opportunity to communicate concerns regarding students’ academic behavior. Social Capital
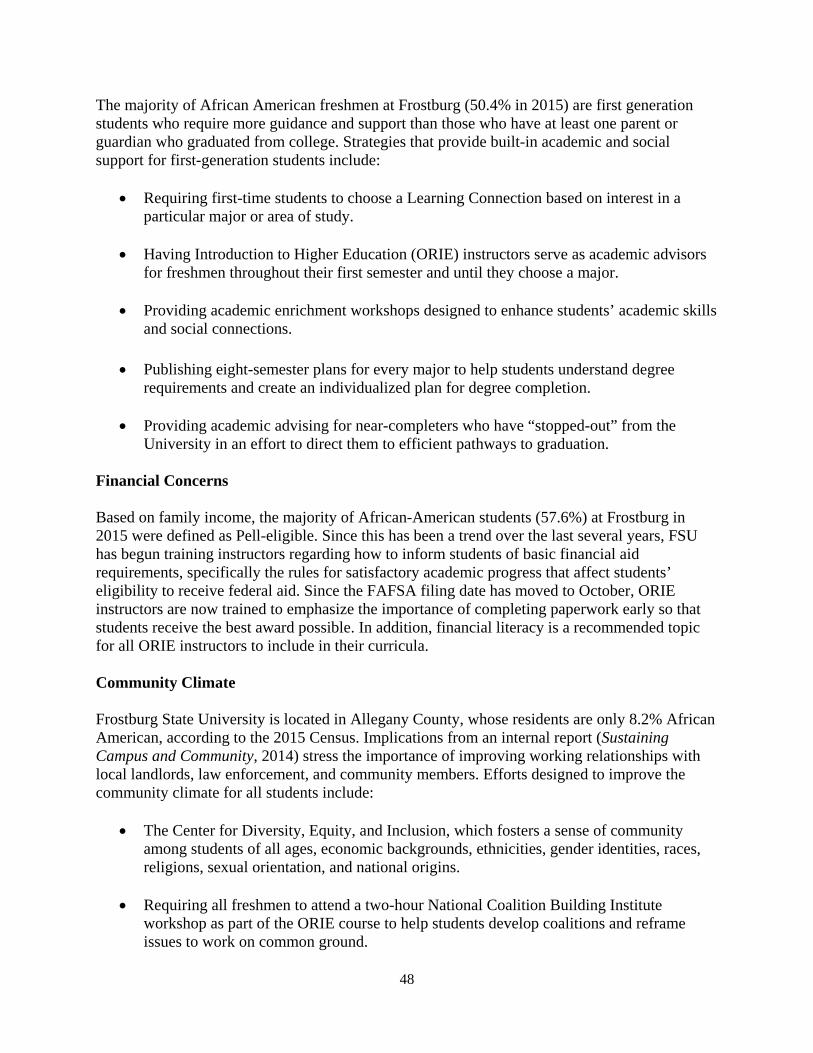
48
The majority of African American freshmen at Frostburg (50.4% in 2015) are first generation students who require more guidance and support than those who have at least one parent or guardian who graduated from college. Strategies that provide built-in academic and social support for first-generation students include:
• Requiring first-time students to choose a Learning Connection based on interest in a particular major or area of study.
• Having Introduction to Higher Education (ORIE) instructors serve as academic advisors
for freshmen throughout their first semester and until they choose a major.
• Providing academic enrichment workshops designed to enhance students’ academic skills and social connections.
• Publishing eight-semester plans for every major to help students understand degree requirements and create an individualized plan for degree completion.
• Providing academic advising for near-completers who have “stopped-out” from the
University in an effort to direct them to efficient pathways to graduation. Financial Concerns Based on family income, the majority of African-American students (57.6%) at Frostburg in 2015 were defined as Pell-eligible. Since this has been a trend over the last several years, FSU has begun training instructors regarding how to inform students of basic financial aid requirements, specifically the rules for satisfactory academic progress that affect students’ eligibility to receive federal aid. Since the FAFSA filing date has moved to October, ORIE instructors are now trained to emphasize the importance of completing paperwork early so that students receive the best award possible. In addition, financial literacy is a recommended topic for all ORIE instructors to include in their curricula. Community Climate Frostburg State University is located in Allegany County, whose residents are only 8.2% African American, according to the 2015 Census. Implications from an internal report (Sustaining Campus and Community, 2014) stress the importance of improving working relationships with local landlords, law enforcement, and community members. Efforts designed to improve the community climate for all students include:
• The Center for Diversity, Equity, and Inclusion, which fosters a sense of community among students of all ages, economic backgrounds, ethnicities, gender identities, races, religions, sexual orientation, and national origins.
• Requiring all freshmen to attend a two-hour National Coalition Building Institute
workshop as part of the ORIE course to help students develop coalitions and reframe issues to work on common ground.

49
• A series of dialogs sponsored by the Maryland Judiciary’s Mediation and Conflict
Resolution Office (MACRO), Frostburg State University, and Mountainside Community Mediation Center (MCMC) conducted with students, staff, and, townspeople to discuss concerns about cultural tensions.
• Student organizations that address the needs of African American students, such as the
Black Student Alliance, the African-American Studies Society, and the NAACP College Chapter, which enhance the cultural enrichment of the campus community.
• An annual, off-campus full-weekend diversity retreat, which open to all FSU students and
provides an opportunity for students, staff, and faculty to openly discuss similarities and differences and learn to appreciate both.

50
SALISBURY STATE UNIVERSITY
No response required.

51
TOWSON UNIVERSITY Objective 3.5 Increase/maintain the ethnic minority undergraduate six-year graduation rate to 72% or above through fiscal year 2019. Objective 3.6 Increase/maintain the African-American undergraduate six-year graduation rate to 72% or above by fiscal year 2019. Commission Assessment: In the 2015 Performance Accountability Report, the Commission requested that the University share available information on the efficacy of its retention programs and initiatives specifically targeting underrepresented students and describe the measures used to determine the effectiveness of these efforts. The Commission appreciates the list of initiatives aimed at facilitating retention and graduation of all students but seeks additional information as to the efficacy of these initiatives and possible measures used to assess the effects on the target population(s). Specifically, please provide any evaluation data collected (e.g. tracking outcomes of participants over time [with or without use of a comparison group], pre-and post-program survey) or other quantitative or qualitative data used to assess these programs. Response: Strategies for Student Success (S3) Course The Strategies for Student Success (S3) Course (also called Orientation 50) is TU’s primary intervention with low-income students, and first-generation students. Students are assigned to the S3 course based on a risk assessment. Community Enrichment and Enhancement Partnership (CEEP) Award TU’s Community Enrichment and Enhancement Partnership (CEEP) Award is a scholarship for retaining diverse and traditionally under-represented undergraduates, including African-American, Hispanic, and low-income students. CEEP Award recipients must maintain a cumulative grade point average of at least 2.50. CEEP Award recipients: (a) receive academic support resources, (b) explore career development as well as graduate and professional school options, (c) participate in community service and leadership development activities, (d) develop relationships with faculty, and (e) participate in field placements and internships. Retention and graduate rate data for students participating in this initiative are as follows: Students Achieve Goals through Education (SAGE) Program TU’s SAGE Program focuses on increasing retention and graduation rates of first-year undergraduates from diverse backgrounds, including African-American, Hispanic, and low-income students. The SAGE Program pairs students with peer mentors who promote academic achievement, personal development, and campus-wide involvement. Peer mentors maintain weekly contact with students, encourage focus on academic goals, assist in resolving academic issues, as well as help students identify organizations and activities of personal and professional interests.

52
SAGE Program participants attend weekly, hour-long meetings / workshops throughout the academic year addressing topics such as academic success strategies, personal and professional development issues, diversity issues, and opportunities to network with peers, faculty, and staff. Retention and graduate rate data for students participating in this initiative are as follows: Towson Opportunities in STEM (TOPS) Program TU’s TOPS Program is a unique opportunity available to incoming freshmen majoring in Science, Technology, Engineering, and Mathematics (STEM) at TU. The TOPS program currently targets students from underserved high schools in the Baltimore Metropolitan area with an interest in completing a TU STEM degree. TOPS was funded by the National Science Foundation from 2007 through 2013, but is now TU funded. The program provides students with the critical support that they need to succeed, including financial, social, mentoring, academic, life-skill development, etc. TOPS also provides students with opportunities to explore various career options through professional meetings, research experiences, guest speakers, etc. The TU TOPS students begin their academic program with an intensive one-week summer experience that boosts their readiness for their first year. This is followed by intrusive advising, cohort registration, peer tutoring and continuous community support throughout their time at Towson University. Retention and graduate rate data for students participating in this initiative are as follows:
S3 Course Fall 2007
Fall 2008
Fall 2009
Fall 2010
Fall 2011
Fall 2012
Fall 2013
Fall 2014
Fall 2015
cohort size (n=) 111 131 76 46 104 29 70 43 60 fall to fall retention rate 77% 88% 76% 91% 86% 86% 91% 86% 87% 6-year graduation rate 48% 72% 45% 59% n/a n/a n/a n/a n/a
CEEP Award Fall 2005
Fall 2006
Fall 2007
Fall 2008
Fall 2009
Fall 2010
Fall 2011
Fall 2012
Fall 2013
Fall 2014
Fall 2015
cohort size (n=) 62 26 35 32 19 18 24 6 25 29 42
fall to fall retention rate 85% 96% 86% 91% 84% 89% 88% 100% 100% 97% 93%
6-year graduation rate 50% 65% 71% 63% 63% 89% n/a n/a n/a n/a n/a SAGE Program Fall 2010 Fall 2011 Fall 2012 Fall 2013 Fall 2014 Fall 2015 cohort size (n=) 154 201 237 230 236 255 fall to fall retention rate 89% 89% 90% 92% 91% 90% 6-year graduation rate 69% n/a n/a n/a n/a n/a
TOPS Program Fall 2008
Fall 2009
Fall 2010
Fall 2011
Fall 2012
Fall 2013
Fall 2014
Fall 2015
cohort size (n=) 16 22 20 21 18 21 20 8 fall to fall retention rate 100% 86% 100% 100% 94% 95% 100% 100% 6-year graduation rate 63% 64% 75% n/a n/a n/a n/a n/a
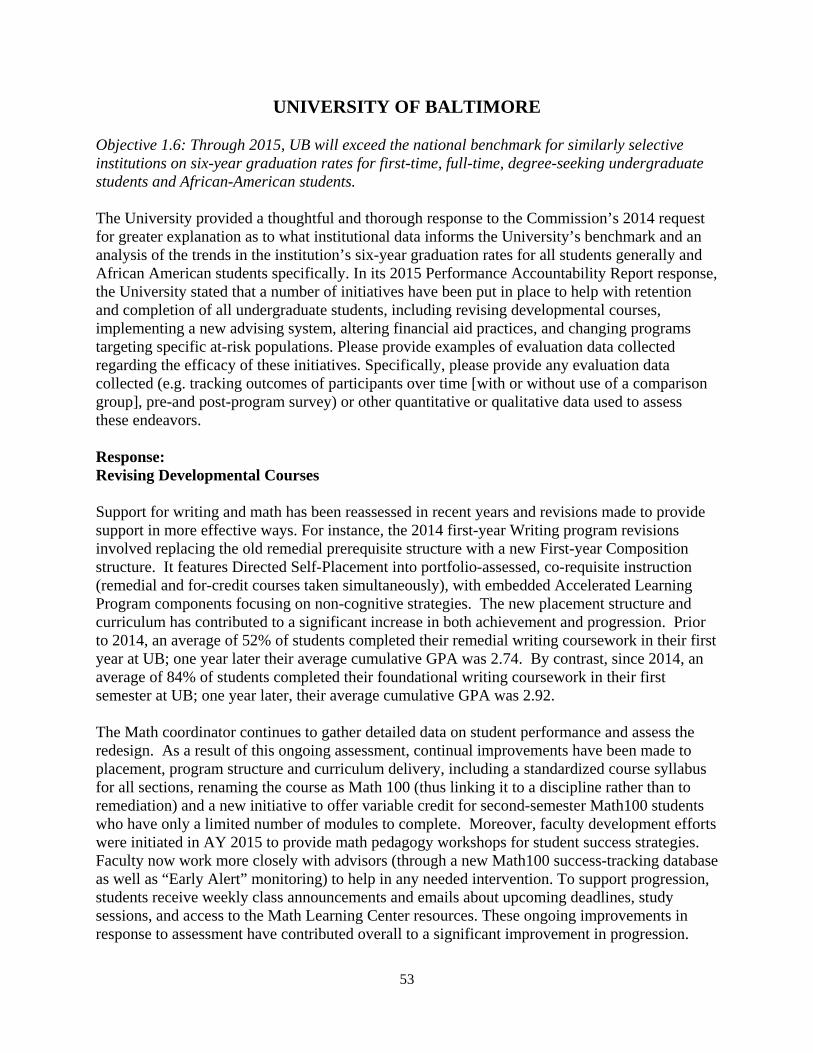
53
UNIVERSITY OF BALTIMORE Objective 1.6: Through 2015, UB will exceed the national benchmark for similarly selective institutions on six-year graduation rates for first-time, full-time, degree-seeking undergraduate students and African-American students. The University provided a thoughtful and thorough response to the Commission’s 2014 request for greater explanation as to what institutional data informs the University’s benchmark and an analysis of the trends in the institution’s six-year graduation rates for all students generally and African American students specifically. In its 2015 Performance Accountability Report response, the University stated that a number of initiatives have been put in place to help with retention and completion of all undergraduate students, including revising developmental courses, implementing a new advising system, altering financial aid practices, and changing programs targeting specific at-risk populations. Please provide examples of evaluation data collected regarding the efficacy of these initiatives. Specifically, please provide any evaluation data collected (e.g. tracking outcomes of participants over time [with or without use of a comparison group], pre-and post-program survey) or other quantitative or qualitative data used to assess these endeavors. Response: Revising Developmental Courses Support for writing and math has been reassessed in recent years and revisions made to provide support in more effective ways. For instance, the 2014 first-year Writing program revisions involved replacing the old remedial prerequisite structure with a new First-year Composition structure. It features Directed Self-Placement into portfolio-assessed, co-requisite instruction (remedial and for-credit courses taken simultaneously), with embedded Accelerated Learning Program components focusing on non-cognitive strategies. The new placement structure and curriculum has contributed to a significant increase in both achievement and progression. Prior to 2014, an average of 52% of students completed their remedial writing coursework in their first year at UB; one year later their average cumulative GPA was 2.74. By contrast, since 2014, an average of 84% of students completed their foundational writing coursework in their first semester at UB; one year later, their average cumulative GPA was 2.92. The Math coordinator continues to gather detailed data on student performance and assess the redesign. As a result of this ongoing assessment, continual improvements have been made to placement, program structure and curriculum delivery, including a standardized course syllabus for all sections, renaming the course as Math 100 (thus linking it to a discipline rather than to remediation) and a new initiative to offer variable credit for second-semester Math100 students who have only a limited number of modules to complete. Moreover, faculty development efforts were initiated in AY 2015 to provide math pedagogy workshops for student success strategies. Faculty now work more closely with advisors (through a new Math100 success-tracking database as well as “Early Alert” monitoring) to help in any needed intervention. To support progression, students receive weekly class announcements and emails about upcoming deadlines, study sessions, and access to the Math Learning Center resources. These ongoing improvements in response to assessment have contributed overall to a significant improvement in progression.

54
Before 2014, only 43% of students needing remedial math completed it during their first year at UB. Since fall 2014, 60% of students needing foundational mathematics completed it during their first year at UB. Implementing a new advising system
In 2013, the University contracted with Educational Advisory Board (EAB) Student Success Collaborative (SSC) to enhance our understanding of risk factors impacting student success. This online tool allows more targeted and proactive advising. It was adopted to provide additional support for academic advisors and help make their work more efficient and effective, particularly given their high caseloads. The SSC combines technology, research, process improvement and predictive analytics to help institutions find at-risk students, conduct targeted outreach campaigns aimed at various groups of students, and develop success plans for these students. In Spring 2015, UB piloted the SSC. This pilot found that the tool was effective for streamlining the work of advisors and allowing them to make more targeted interventions with students. Thus, in Fall 2015, all undergraduate advisors and program directors were brought on board. The SSC identifies students at risk based on predictive analytics using UB’s own student data. The advisors can then reach out to these students in an effort to help them get back on track towards success. The EAB steering committee continues to meet monthly to discuss the utilization and advisor experiences with the software. In addition, UB has an advisor user group that meets as needed to discuss experiences and share best practices. Altering financial aid practices
The Office of Financial Aid made one major change. The change was to package continuing students for aid at the same time new students are being packaged. In the past, continuing students were packaged the summer before the start of the term. Earlier packaging has helped students plan their finances better. This program has not yet been fully assessed, and there are limited data on the specific correlation between financial aid and student success at UB; however, the Assistant Vice President for Enrollment Services reports that as of spring 2016 a higher rate of continuing students were accepting their financial aid packages early. In addition, UB received a Near Completer Grant from USM to support students who had financial holds and had completed at least 110 credits. Assessment results indicate that 88% of students receiving this grant (up to $1,500) either graduated or were still enrolled. In fall 2016, additional monies for near completer grants were secured. The grant was provided to student with at least a 3.00 GPA and who had sufficient credit that completion of a degree program was likely within one to two semesters. Changing programs targeting specific at-risk populations
The Brotherhood, Mentorship, Achievement, Leadership and Enterprise Academy (B.M.A.L.E. Academy) was created in 2014 to inspire high academic achievement among UB's male students of color. The program supports, embraces and engages men of color in an effort to close the achievement, retention and graduation gaps. Program participants are assigned mentors from among UB faculty, staff and students. The combination of high touch professional and peer mentoring is a program hallmark. In collaboration with other campus offices, students are provided with supplemental academic advising, tutoring support, social and community

55
engagement, cultural immersion, professional and academic programs and opportunities to provide community service. This program directly serves the university’s mission to “serve the needs of a diverse population in an urban setting.” The program grew by 200% from 15 participants in 2014 to 45 participants in 2015. The average semester GPA of program participants improved from 2.52 in spring 2015 to 2.72 in Spring 2016. BMALE participants are also active on campus and at the national and local level. Two well-attended campus and community town halls have been presented, Policing the Community: Know Your Rights and Destroying the School to Prison Pipeline. Several students attended the 2015 White House Youth Policy Hackathon where student leaders from across the country participated in policy discussions around the “It’s On Us” sexual assault prevention campaign, dismantling the school to prison pipeline, and increasing the presence of underrepresented populations in STEM fields.
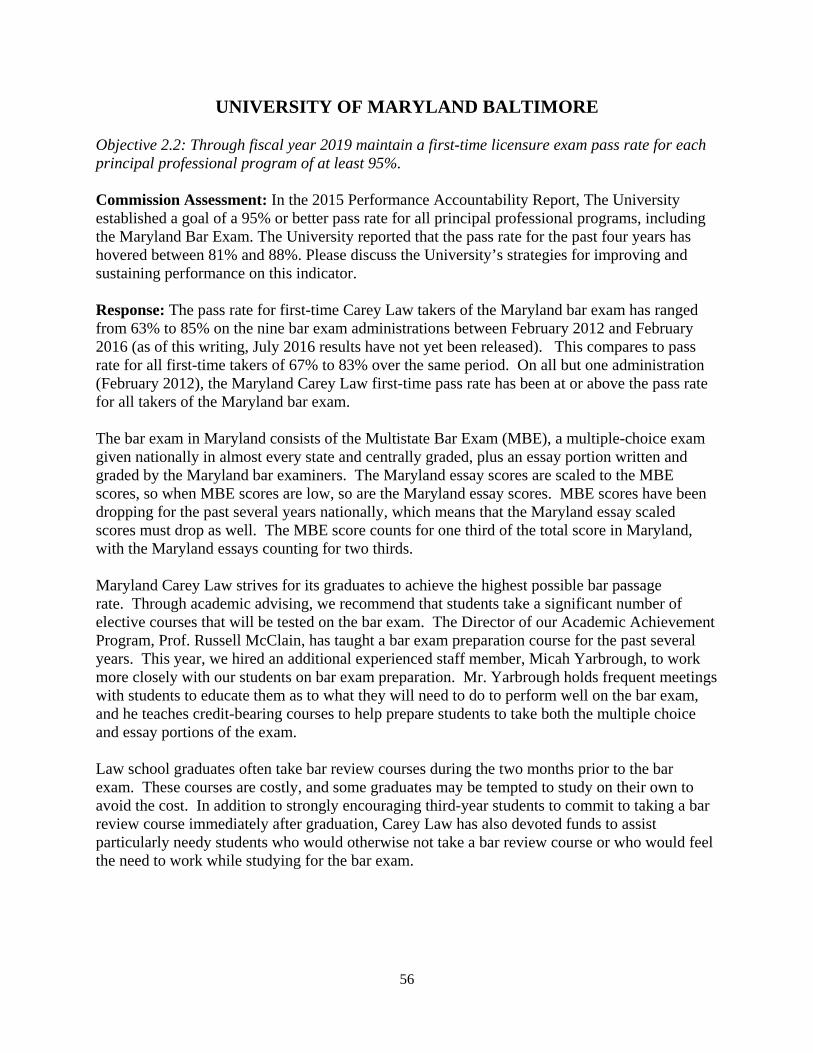
56
UNIVERSITY OF MARYLAND BALTIMORE Objective 2.2: Through fiscal year 2019 maintain a first-time licensure exam pass rate for each principal professional program of at least 95%. Commission Assessment: In the 2015 Performance Accountability Report, The University established a goal of a 95% or better pass rate for all principal professional programs, including the Maryland Bar Exam. The University reported that the pass rate for the past four years has hovered between 81% and 88%. Please discuss the University’s strategies for improving and sustaining performance on this indicator. Response: The pass rate for first-time Carey Law takers of the Maryland bar exam has ranged from 63% to 85% on the nine bar exam administrations between February 2012 and February 2016 (as of this writing, July 2016 results have not yet been released). This compares to pass rate for all first-time takers of 67% to 83% over the same period. On all but one administration (February 2012), the Maryland Carey Law first-time pass rate has been at or above the pass rate for all takers of the Maryland bar exam. The bar exam in Maryland consists of the Multistate Bar Exam (MBE), a multiple-choice exam given nationally in almost every state and centrally graded, plus an essay portion written and graded by the Maryland bar examiners. The Maryland essay scores are scaled to the MBE scores, so when MBE scores are low, so are the Maryland essay scores. MBE scores have been dropping for the past several years nationally, which means that the Maryland essay scaled scores must drop as well. The MBE score counts for one third of the total score in Maryland, with the Maryland essays counting for two thirds. Maryland Carey Law strives for its graduates to achieve the highest possible bar passage rate. Through academic advising, we recommend that students take a significant number of elective courses that will be tested on the bar exam. The Director of our Academic Achievement Program, Prof. Russell McClain, has taught a bar exam preparation course for the past several years. This year, we hired an additional experienced staff member, Micah Yarbrough, to work more closely with our students on bar exam preparation. Mr. Yarbrough holds frequent meetings with students to educate them as to what they will need to do to perform well on the bar exam, and he teaches credit-bearing courses to help prepare students to take both the multiple choice and essay portions of the exam. Law school graduates often take bar review courses during the two months prior to the bar exam. These courses are costly, and some graduates may be tempted to study on their own to avoid the cost. In addition to strongly encouraging third-year students to commit to taking a bar review course immediately after graduation, Carey Law has also devoted funds to assist particularly needy students who would otherwise not take a bar review course or who would feel the need to work while studying for the bar exam.

57
UNIVERSITY OF MARYLAND BALTIMORE COUNTY Objective 5.1: Maintain a retention rate of UMBC undergraduates at 90% or greater through FY 2019. Objective 5.2: Increase the graduation rate of UMBC undergraduates from 68.8% in FY 2014 to 70% in FY 2019. Commission Assessment: The University is to be commended for making steady progress in meeting its benchmarks tied to second-year retention and graduation of its undergraduate students. In the 2015 Performance Accountability Report, the University described a number of strategies and initiatives aimed at improving retention and graduation for all students. These included living-learning communities, summer bridge programs, and first-year seminars. Please update the Commission on the outcomes of these interventions, noting any evidence of the effects they may have had on the target student populations. Response: Living Learning Communities (LLCs) connect students with a shared interest in culture, academics, or community service. Undergraduate students live together in a residential community and participate in academic and extracurricular programming designed for them and sponsored by academic departments and programs. Compared to students not involved in LLCs, LLC students self-reported that they were more satisfied with their overall academic experience on campus, more engaged and involved on campus, interacted with more university faculty and staff, and had a greater understanding of diversity and multiculturalism. Internal retention and graduation rates reveal that, on average, for the fall 2002 to fall 2009 cohorts of full-time new freshmen unaffiliated with a scholars or athletic program, 71.9 percent of students participating in an LLC in the matriculation term graduated within six years, compared to 56.3 percent of students not participating (IRADS, fall 2016). The Office of Undergraduate Education (OUE) offers a First-Year Experience (FYE) menu to students with programs that engage a cohort of new students in a semester-long, small-group, academic experience that includes skills development, community building, and transition support. These programs, open to all students, target those who do not have an affiliation with our scholars programs, LLCs, Athletics, or Shriver service learning experience in the matriculation term. Offerings include First Year Seminars (FYS), capped at 20 students and designed to create an active-learning environment enriched by field work, original research, group projects or performance as well as more traditional reading, writing, and lecture formats (in AY 2015-2016 we offered 40 sessions of 26 seminars taught by 24 faculty and staff from departments across the university); Introduction to an Honors University (IHU) student success seminars as one-credit additions to popular freshman courses in the disciplines (offerings increased from three in 2002-2003 to 51 in 2015-2016); and, Collegiate Success Institute Summer Bridge Program in partnership with the Office of Summer, Winter, and Special Programs (summer 2015 saw revisions to Summer Bridge including a focus on math and writing preparedness for incoming students, with a record 40 student members). Analysis of participation in an FYE for new freshmen in the first semester shows that for the fall 2006 to spring 2015 cohorts, new unaffiliated freshmen who enrolled in an IHU or FYS were

58
retained at higher rates than non-IHU/FYS unaffiliated freshmen. Unaffiliated students enrolled in FYE were about 17-19% more likely to be retained than students who did not enroll in FYE. Prior analyses have identified certain populations of unaffiliated students as being at higher risk, including males and commuter students. Data from the fall 2006 – spring 2015 FYE cohorts show that new unaffiliated freshman male commuters who enrolled in an IHU or FYS in their matriculation semester were retained and graduated at higher rates than non-IHU/FYS unaffiliated freshmen male commuters (The First-Year Experience (FYE) at UMBC, OUE white paper, spring 2016). The Collegiate Success Institute (CSI) summer bridge was instituted in 2008. During the period of 2008 – 2015, 176 new freshmen participated in the program. The program is too new to have meaningful graduation rate trend data. The average one-year retention rate for CSI participants is 87 percent, somewhat higher than unaffiliated new freshmen, but rates do vary year to year in part based on the pre-college preparation of program participants.
* Peer institutions changed in Summer 2015. Ten current peers now include: University of California-Riverside, University of California-Santa Cruz, University of Massachusetts-Lowell, University of Massachusetts Amherst, North Carolina State University at Raleigh, New Jersey Institute of Technology, SUNY at Albany, SUNY at Binghamton, Miami University-Oxford, and George Mason University

59
UNIVERSITY OF MARYLAND COLLEGE PARK Objective 1.12: Increase the percentage of transfer students who graduate from UMD from 60% in 2014 to 75% by 2019. Commission Assessment: The University has set a goal of increasing the four-year graduation rate of transfer students from 60% in 2014 to 75% in 2019. Please describe in greater detail the transfer population the University enrolls (e.g., demographics, average number of credits transferred in, type of transfer [from community college and from other four-year institutions]) and discuss what resources the University has or will put in place to aid in meeting this goal. Response: UMCP enrolled 2,346 new transfer and new other undergraduates in Fall 2015. Of those, the largest race/ethnicity groups were White (45%), Black or African American (14%), Asian American (13%), Foreign (12%), and Hispanic (11%). Approximately 50% were female; 81% were in-state; 88% enrolled full-time; and, 61% came from a two-year institution, 33% came from a 4-year institution, and 7% came from a foreign or other institution. UMCP’s Pre-Transfer Advising, which is not replicated in other schools or states, provides pre-matriculation planning to potential transfer students by assessing students’ readiness to transfer and providing estimates to four-year degree completion. Pre-Transfer advisors work closely with local community college students and advisors, and offer assistance to any prospective transfer student prior to their application to the university. To provide advising services to more potential transfer students, UMCP is hiring four additional Pre-Transfer advisors. Each will be housed at one of the university’s “feeder” community colleges. The Transfer2Terp Program provides both social and academic communities for transfer students with the primary objective of helping students identify their greatest talents and strengths and learn how to apply these strengths both in and outside of the classroom. The Transfer Academic Excellence Scholarship is available to outstanding students transferring from Maryland community colleges who have a cumulative grade point average of 3.5 or higher and have either completed 56+ credits or have an Associates of Arts degree. The award covers in-state tuition for two years of undergraduate study and the university has recently received enhancement funding for additional transfer scholarships.

60
UNIVERSITY OF MARYLAND EASTERN SHORE Commission Assessment (not tied to a specific indicator): In its 2015 Performance Accountability Report, the University stated that one of its institutional goals is to “develop, strengthen, and implement academic programs that are responsive to the UMES mission and are systematically reviewed for sustained quality, relevance, and excellence to meet the challenges of a highly competitive and global workforce.” In addition, the University reported that it is consistently reviewing its program offerings to ensure that they effectively meet the needs of the students and other stakeholders. Please describe in greater detail the process by which the University reviews its programs and how it measures for quality, relevance, and excellence. Response: The University of Maryland Eastern Shore conducts periodic academic program reviews and uses the results of this important evaluative process to enhance its academic programs and meet the needs of its critical stakeholders. As a constituent institution of the University System of Maryland, UMES is required to conduct periodic academic program reviews on a seven-year cycle. The program reviews are designed to determine the robustness and viability of the academic program as indicated by measures such as program enrollment and number of degrees awarded. For this important evaluative process, degree-granting and certificate awarding programs are required to undergo an internal (self-study) and external review. The internal self-study phase of the program review focuses on a departmental questionnaire that seeks to document pertinent information about the academic program and the department in which the program is housed. Specifically, the internal review requires the academic department to conduct a comprehensive and critical evaluation of its overarching goals and objectives, identify critical student learning outcomes, the quality of its faculty, the core curriculum and supporting courses, assessment program and how results of assessment are used to improve curriculum and to enhance student performance. The external review component of the academic program review requires that the academic department solicit the assistance of experts in the discipline to review the data provided from the self-study and identify program strengths and weaknesses. The academic programs use the recommendations and findings from the external review to implement programmatic improvements, thus providing critical stakeholders such as students and university partners with quality academic programming that prepares students for careers and graduate programs and supports state, regional, national, and global workforce demands. The following are examples of ways in which academic programs have implemented programmatic improvements resulting from program review recommendations:
1. Engineering and Aviation Sciences (2010) developed peer and annual review policies for faculty evaluation, developed entrance and exit examinations for Aviation students, added two new courses to its curriculum and developed new Air Traffic control courses.
2. Rehabilitation Services (2010) updated degree program information and promotional materials in the university catalog and website, implemented curriculum modifications such as course title changes, and updated course syllabi with more appropriate language for disability statements and developed a program evaluation plan.
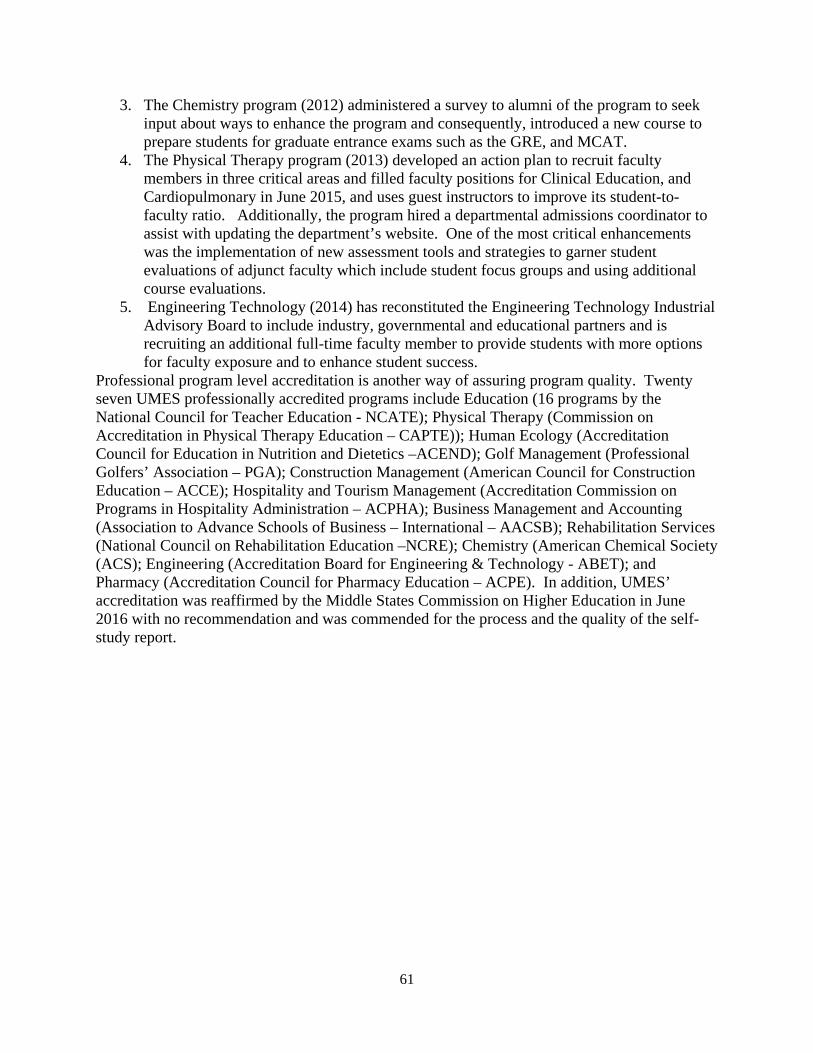
61
3. The Chemistry program (2012) administered a survey to alumni of the program to seek input about ways to enhance the program and consequently, introduced a new course to prepare students for graduate entrance exams such as the GRE, and MCAT.
4. The Physical Therapy program (2013) developed an action plan to recruit faculty members in three critical areas and filled faculty positions for Clinical Education, and Cardiopulmonary in June 2015, and uses guest instructors to improve its student-to-faculty ratio. Additionally, the program hired a departmental admissions coordinator to assist with updating the department’s website. One of the most critical enhancements was the implementation of new assessment tools and strategies to garner student evaluations of adjunct faculty which include student focus groups and using additional course evaluations.
5. Engineering Technology (2014) has reconstituted the Engineering Technology Industrial Advisory Board to include industry, governmental and educational partners and is recruiting an additional full-time faculty member to provide students with more options for faculty exposure and to enhance student success.
Professional program level accreditation is another way of assuring program quality. Twenty seven UMES professionally accredited programs include Education (16 programs by the National Council for Teacher Education - NCATE); Physical Therapy (Commission on Accreditation in Physical Therapy Education – CAPTE)); Human Ecology (Accreditation Council for Education in Nutrition and Dietetics –ACEND); Golf Management (Professional Golfers’ Association – PGA); Construction Management (American Council for Construction Education – ACCE); Hospitality and Tourism Management (Accreditation Commission on Programs in Hospitality Administration – ACPHA); Business Management and Accounting (Association to Advance Schools of Business – International – AACSB); Rehabilitation Services (National Council on Rehabilitation Education –NCRE); Chemistry (American Chemical Society (ACS); Engineering (Accreditation Board for Engineering & Technology - ABET); and Pharmacy (Accreditation Council for Pharmacy Education – ACPE). In addition, UMES’ accreditation was reaffirmed by the Middle States Commission on Higher Education in June 2016 with no recommendation and was commended for the process and the quality of the self-study report.

62
UNIVERSITY OF MARYLAND UNIVERSITY COLLEGE
Commission Assessment (not tied to a specific indicator): In the 2015 Performance Accountability Report, the University discussed the collaborative work it has done with Maryland’s community colleges to examine factors that may contribute to the academic success of students who transfer from community college to the University. Please share with the Commission the results of these collaborations and any resulting practice and/or policy implications. Response: UMUC’s 2015 Performance Accountability Report described a pilot project, the UMUC Success Calculator, intended to leverage student data from Montgomery College (MC), Prince George’s Community College, and UMUC to help community college advisors counsel students about their likelihood of success at UMUC based on their academic behavior at the community college. Success was defined as receiving a 2.0 or higher grade point average in a student’s first semester at UMUC. As a first wave, the UMUC Success Calculator was presented to staff at Montgomery College in March 2015, and nine MC administrators and staff were provided access to the tool. To date none of these authorized users has accessed or utilized the Success Calculator since its launch. Thus, there is no practice or policy change to report at this time as a result of this pilot effort. UMUC’s Accountability, Compliance and Reporting team is currently preparing to survey the MC staff who have been provided access to this tool with the intention of identifying potential and real barriers to its use. This will provide critical insight to inform whether further investments should be made to update the data on which it draws and efforts made to socialize the tool to increase usage, particularly since the original grant funding for this initiative has since ended. UMUC continues to partner closely with the community colleges, as described above, to support pathways to degree completion for transfer students.
63
MORGAN STATE UNIVERSITY Commission Assessment (not tied to a specific indicator): In the 2015 Performance Accountability Report, the University established a goal of increasing undergraduate and graduate enrollment to 12,000 by 2021, which would be a 55.9% increase from its fall 2014 enrollment of 7,698 students. In the Report narrative, the University briefly discusses the admissions efforts underway to help achieve this aggressive goal. Please describe in greater detail the plans the University has to achieve this goal, addressing the changes (e.g., program development or removal, financial aid strategies, faculty hiring, new construction) that will take place to support this enrollment increase. Response: While the University’s long-term goal remains to achieve enrollment of 12,000 undergraduate and graduate students, the realities of the current higher education landscape have necessitated an adjustment of the timeline to achieve that goal. We now anticipate an enrollment of 9,500 by FY 2021. The bulk of this planned enrollment growth will come through the efforts of the Division of Academic Outreach and Engagement, which coordinates the University’s online, off-campus, and continuing education programs. Three new online degrees and one new certificate program are expected to be launched during the fall 2016 semester with additional degree and/or certificate programs being launched at regular intervals in subsequent semesters. This brings the total number of online degree and certificate programs at Morgan to nine. For the four new online programs, Eduventures, a consulting firm, assisted the University in conducting a program feasibility review, identifying go-to-market considerations to drive student enrollments, and conducting financial modeling for revenue and marketing expenses expected. Projected enrollment in these online programs by 2021 is reflected in the table below. The table also indicates projected enrollment in two off-campus locations where the University anticipates beginning to offer courses and programs over the next year or two.
64
ST. MARY’S COLLEGE OF MARYLAND
Objective 2.1: Recruit a qualified and diverse entering class with the following attributes: • Median verbal and math combined score of at least 1250 • Average high school grade point average of at least 3.40 (4 point scale) • Minority enrollment of at least 25 percent • Out-of-state student enrollment of at least 20 percent • Students from first-generation households enrollment of at least 20 percent • Pell grant disbursed during their first year student enrollment of at least 20 percent
Commission Assessment: The College is to be commended for meeting or exceeding many of the performance measures established for recruiting its freshman class in 2014. The College has set a goal of having at least 20% of the incoming class of freshmen come from families that live outside the state, yet this performance measure has fluctuated between 15% (fall 2012 incoming class) and 6% (fall 2014 incoming class). Please discuss the College’s strategies for improving and sustaining performance on this indicator. Response: As noted above (Objective 2.1), the College continues to face challenges in recruiting and enrolling students from outside of Maryland. Based on analysis of enrollment trends over the past several years, we have reset this goal to be 10% of the incoming first-year class. (This revision can be seen in the attached Managing For Results Excel template.) To reach this goal for the fall 2017 class, several strategies are in place, as described below.
• The admissions office has enhanced its recruitment of out-of-state students by reorganizing all counselor territories to include out-of-state responsibilities, resulting in an increase from two to seven counselors working with out-of-state students.
• Two new open house events have been added to the fall schedule this cycle In addition to our two traditional fall open houses, we have added Discover St. Mary’s Days on Columbus and Veterans Day. This will provide greater opportunities for all prospective students including out-of-state to visit and learn about SMCM.
• SMCM has signed a MOU with the country of Aruba to facilitate the enrollment of up to 20 new international students in the spring and fall of 2017. We will be attending their national college fair on November 3rd and 4th to build presence. Our first student from Aruba arrived this fall.
• College fair visits have been increased 37% from 70 in 2015 to 96 in 2016, a move designed to reach more potential SMCM prospective students for fall 2017. The additional fairs are in out-of-state locations that are considered prime targets. These areas include VA, DC, NC, Southeastern and Central PA, and NJ.
• The college has expanded its financial aid programs to provide additional scholarship opportunities for high achieving students from out-of-state. This includes Merit Scholarships and Visit Scholarships for applicants from out-of-state.