Embed Size (px)
Citation preview
2016 Media Survey Results
This report is based on a survey of more than 600 members of the media from more than 40 countries - our largest study yet. There is an emphasis on North America and the UK, where the majority of our polling is done.
Different from previous years, we also take a look at the trends that surface amongst particular media groups. This granular methodology yielded data that enabled us to create Business Wire’s Media Blueprint: a more targeted approach to reaching and working with the media. Within the Blueprint, you will find helpful best practices to segment messaging for consumer or B2B audiences, as well as the benefits of targeted media relations.
We analyzed differences that arose due to media experience: from media veterans (15+ years), to experienced media (5-15 years) and media newcomers (less than 5 years). We looked at variations between generations: Baby Boomers, Gen X, Millennial and Gen Z. Our survey bucketed media into broad beat
Welcome to Business Wire’s annual report that examines the current media landscape, best practices for working with journalists and effective ways for organizations to meet the media’s needs in an evolving digital news marketplace.
categories: B2B/trade news, business/finance news, local/national news, lifestyle/entertainment news and consumer products/services news. Finally we studied the distinctions between media outlet types: web, newspaper, magazine, newswire, television (TV), radio and blogs.
These various subsets allowed us to highlight interesting and useful trends, which will help you communicate your news message more efficiently and effectively.
Our products and services are integral to this more strategic media approach. Every Business Wire news release is backed by our patented distribution network allowing targeting by geography, industry and demographic. While the news release is the first and most important step to amplifying your message and reaching the right audience, we’ve leveraged our strong media relationships to assemble this report as a blueprint to following up that outreach in an effective way.
If we view pitching and news releases as outbound media relations, online newsrooms and investor sites would serve as the inbound. The answers from journalists on how they utilize newsrooms will be helpful in determining if your organization’s website is properly organized to ensure that the media and analysts who need to conduct research can do so quickly and effectively.
Today’s journalists are short on time and a proper online newsroom, with access to key features, can mean the difference between your inclusion in a story (with up-to-date and accurate information) or your exclusion with the added injury of the insertion of a competitor. Our findings relay the Blueprint for constructing a newsroom that the media wants and expects.
Our continued goal is to serve as an informed partner to our clients by staying abreast of the quickly-changing needs of the media; and to assist our partners in doing their best work to compliment the services they utilize with us.
This year our evidence reveals when, where and how to reach today’s journalists. In addition to taking the pulse of modern media, we found that, once again, many view the future of journalism as The New York Times (50%) and BuzzFeed (45%). The outlets swapped places this year, with journalists placing a higher value on deeper, long-form news, versus quicker, bite-sized news packaging.
Other key findings include:• Tuesday (34%) morning (61%) is
the best time to pitch media; and Thursday (7%) evening (9%) is the worst time to pitch
• Most journalists that use a newswire do so daily (53%) or several times a day (23%)
• The top three social platforms have held steady the past three years: Twitter, Facebook and LinkedIn; Twitter is No. 1, but for the first time in three years Facebook and LinkedIn tied for the No. 2 place
• Use of YouTube had the largest year-over increase at 25%
• Interviews (51%) are the No. 1 video type most desired by journalists
• 45% of journalists care about the social reach of a source or company
• 75% of journalists refer to an online newsroom when researching an organization
4
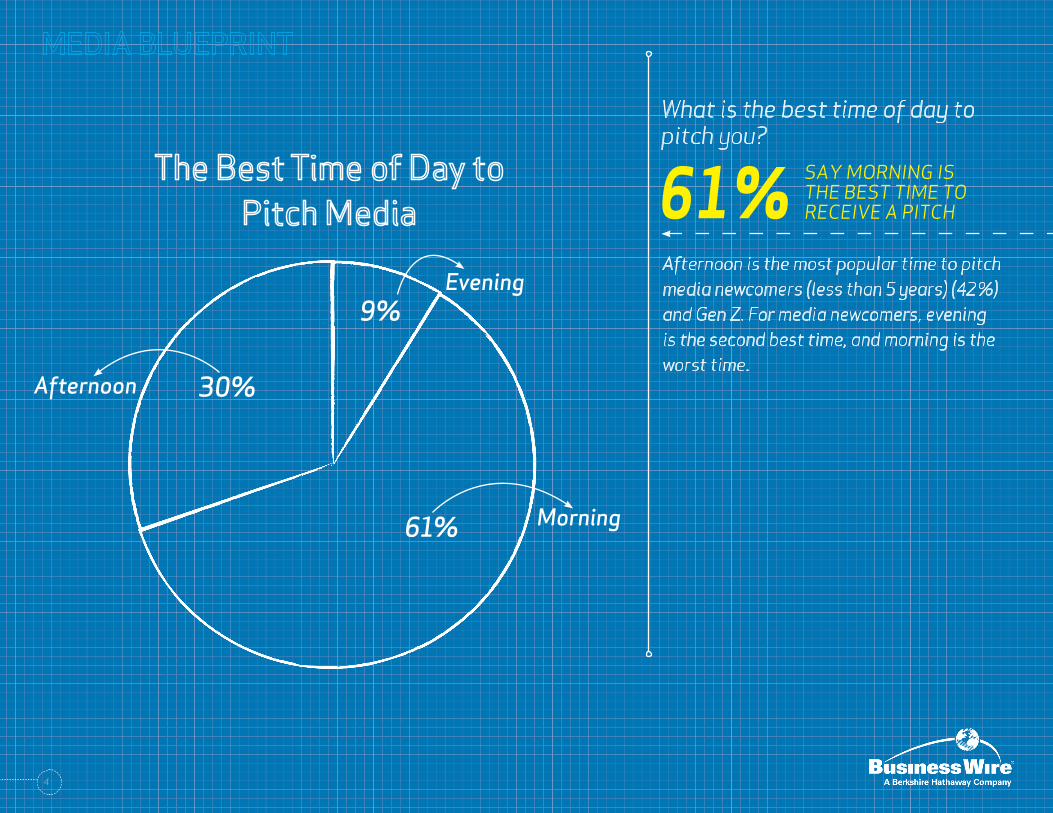
What is the best time of day to pitch you?
SAY MORNING IS THE BEST TIME TO RECEIVE A PITCH
Morning61%
30%
9%
Afternoon
EveningAfternoon is the most popular time to pitch media newcomers (less than 5 years) (42%) and Gen Z. For media newcomers, evening is the second best time, and morning is the worst time.
61%
5
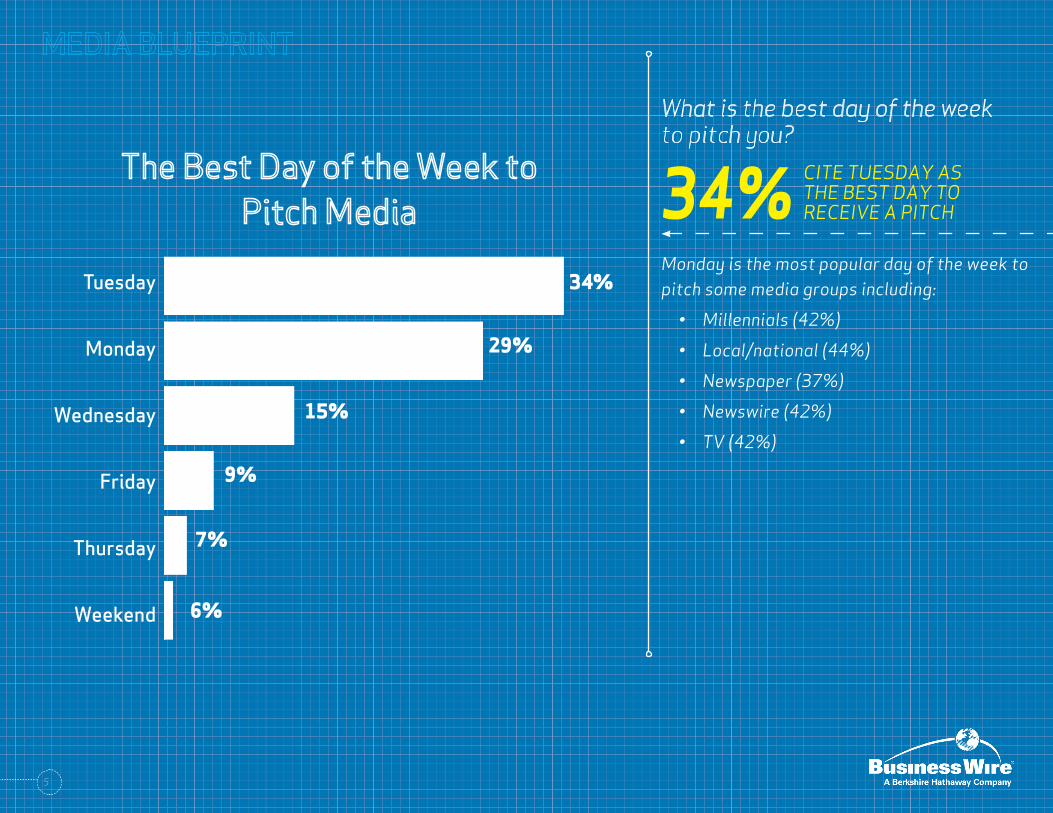
34%
29%
15%
9%
7%
6%
Tuesday
Monday
Wednesday
Friday
Thursday
Weekend
What is the best day of the week to pitch you?
CITE TUESDAY AS THE BEST DAY TO RECEIVE A PITCH34%
Monday is the most popular day of the week to pitch some media groups including:
• Millennials (42%)
• Local/national (44%)
• Newspaper (37%)
• Newswire (42%)
• TV (42%)
6
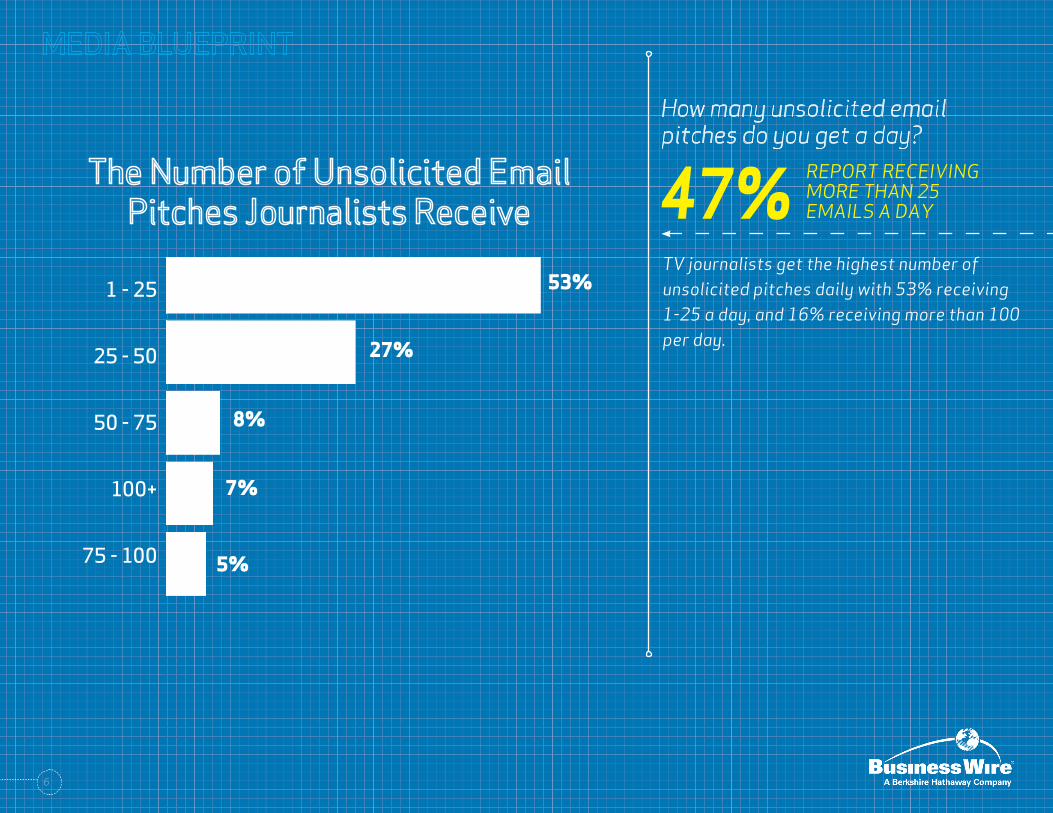
53%
27%
8%
7%
5%
1 - 25
25 - 50
50 - 75
100+
75 - 100
TV journalists get the highest number of unsolicited pitches daily with 53% receiving 1-25 a day, and 16% receiving more than 100 per day.
How many unsolicited email pitches do you get a day?
REPORT RECEIVING MORE THAN 25 EMAILS A DAY47%
7
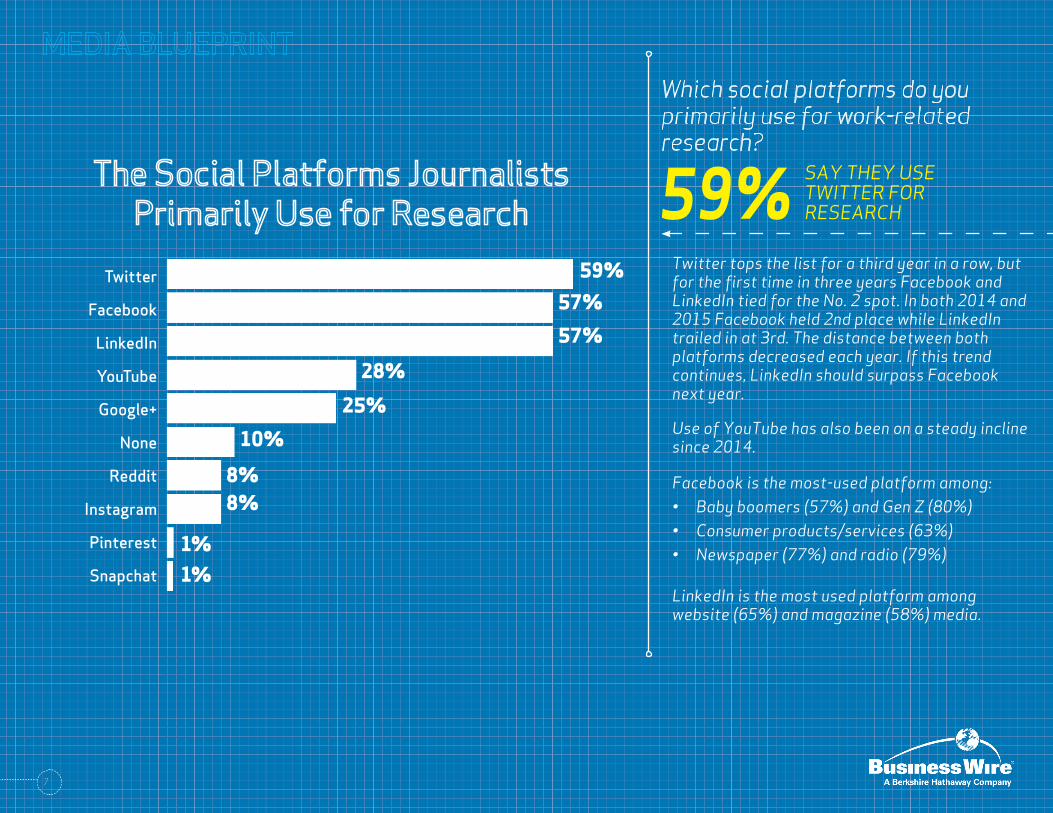
59%57%
57%
28%
25%
10%
YouTube
Google+
None
Snapchat
8%8%
1%1%
Twitter tops the list for a third year in a row, but for the first time in three years Facebook and LinkedIn tied for the No. 2 spot. In both 2014 and 2015 Facebook held 2nd place while LinkedIn trailed in at 3rd. The distance between both platforms decreased each year. If this trend continues, LinkedIn should surpass Facebook next year.
Use of YouTube has also been on a steady incline since 2014.
Facebook is the most-used platform among:• Baby boomers (57%) and Gen Z (80%)• Consumer products/services (63%) • Newspaper (77%) and radio (79%)
LinkedIn is the most used platform among website (65%) and magazine (58%) media.
Which social platforms do you primarily use for work-related research?
SAY THEY USE TWITTER FOR RESEARCH59%
8
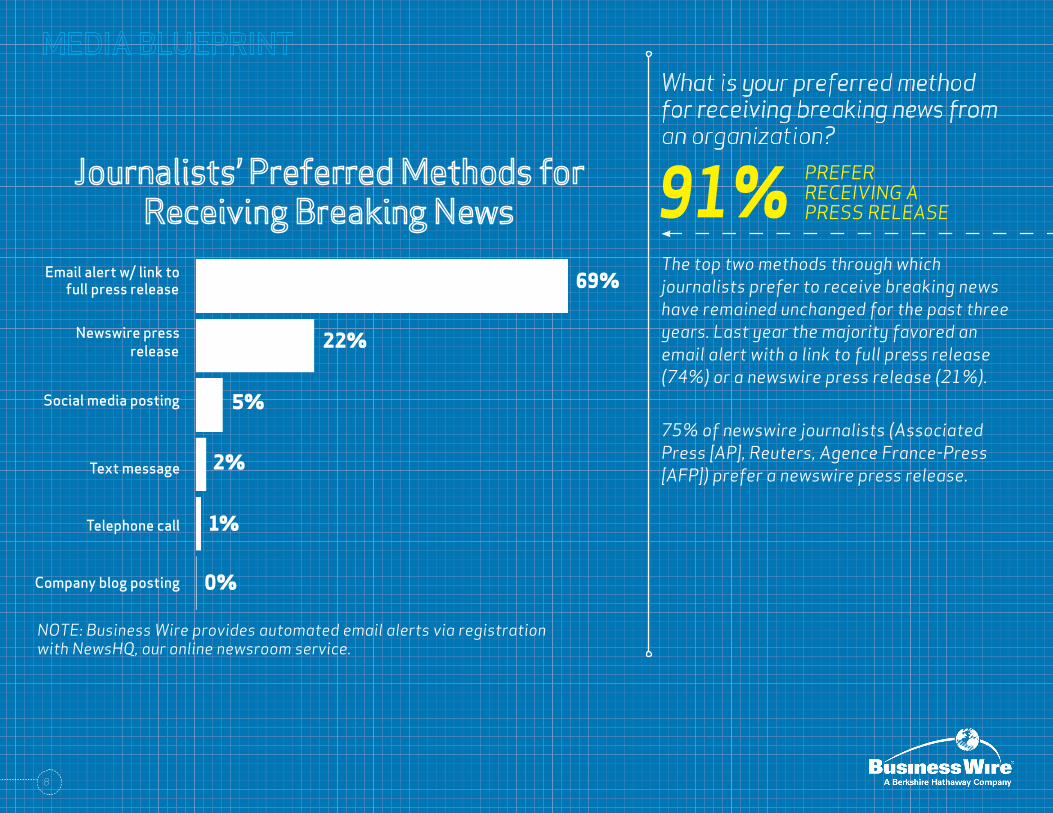
69%
22%
5%
2%
1%
0%
Email alert w/ link to full press release
Newswire press release
Social media posting
Text message
Telephone call
Company blog posting
The top two methods through which journalists prefer to receive breaking news have remained unchanged for the past three years. Last year the majority favored an email alert with a link to full press release (74%) or a newswire press release (21%).
75% of newswire journalists (Associated Press [AP], Reuters, Agence France-Press [AFP]) prefer a newswire press release.
What is your preferred method for receiving breaking news from an organization?
PREFER RECEIVING A PRESS RELEASE91%
NOTE: Business Wire provides automated email alerts via registration with NewsHQ, our online newsroom service.
9
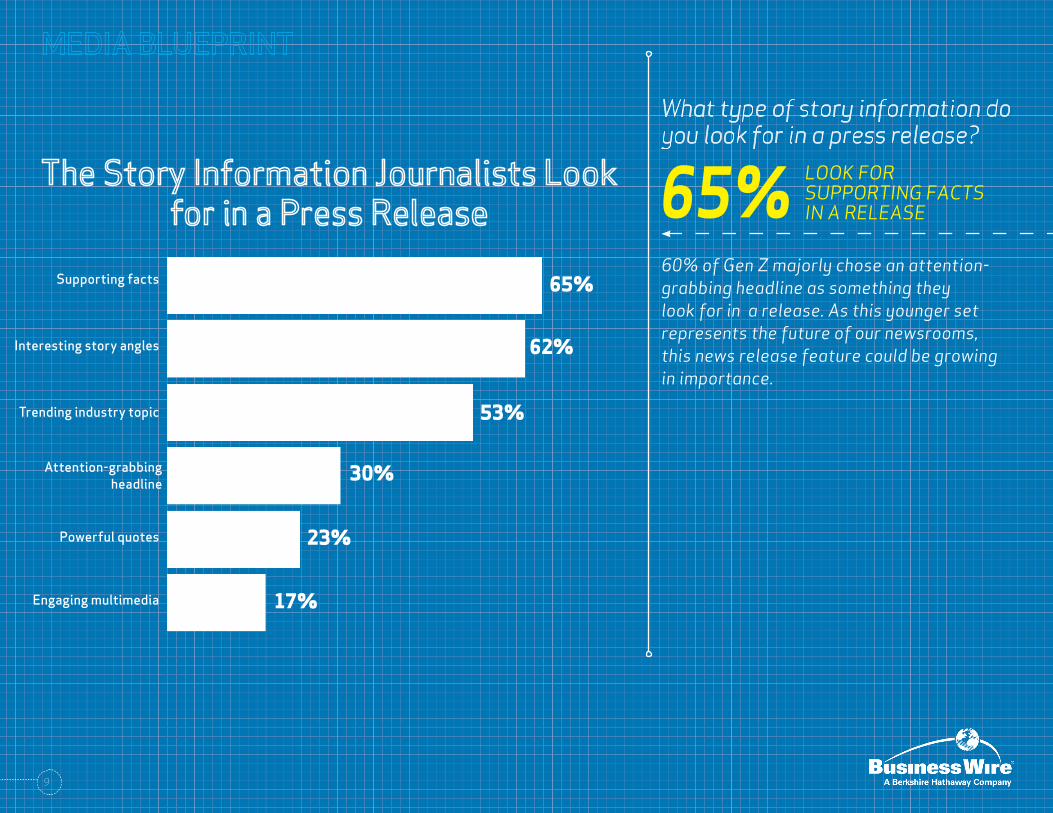
65%
62%
53%
30%
23%
17%
Supporting facts
Interesting story angles
Trending industry topic
Powerful quotes
Attention-grabbingheadline
Engaging multimedia
60% of Gen Z majorly chose an attention-grabbing headline as something they look for in a release. As this younger set represents the future of our newsrooms, this news release feature could be growing in importance.
What type of story information do you look for in a press release?
LOOK FOR SUPPORTING FACTS IN A RELEASE65%
10
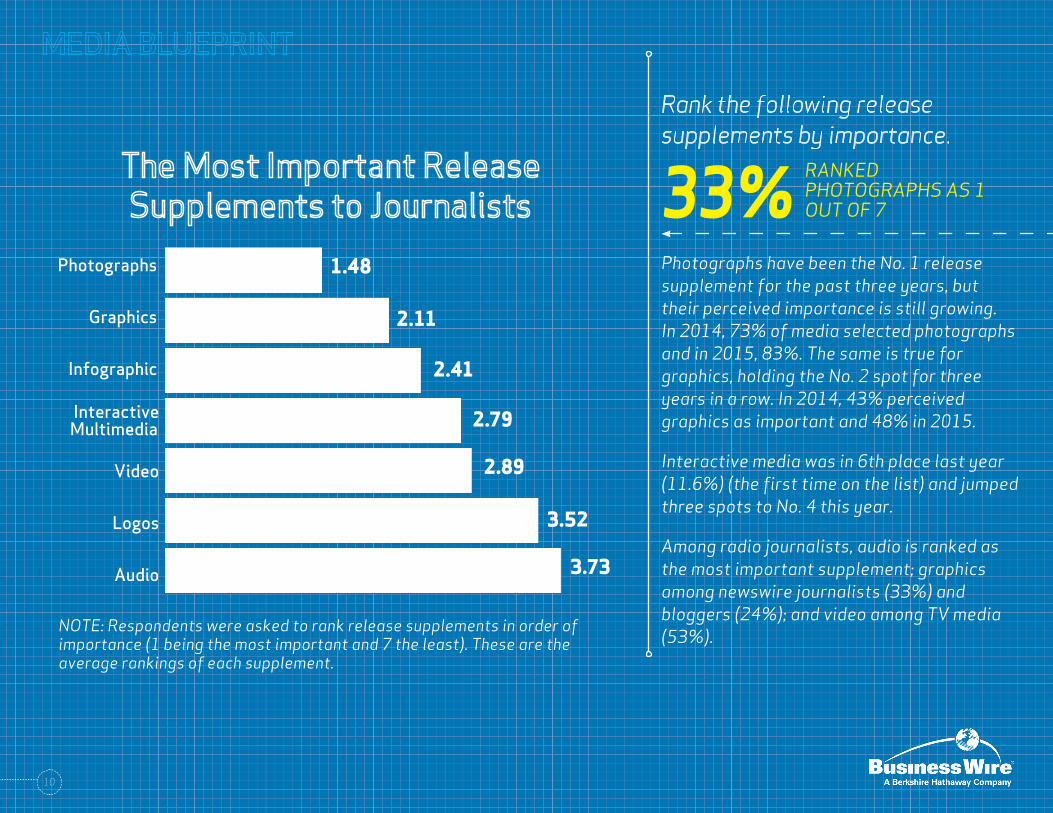
3.73
3.52
2.89
2.79
2.41
2.11
Photographs
Graphics
Infographic
1.48
Interactive Multimedia
Video
Logos
Audio
Photographs have been the No. 1 release supplement for the past three years, but their perceived importance is still growing. In 2014, 73% of media selected photographs and in 2015, 83%. The same is true for graphics, holding the No. 2 spot for three years in a row. In 2014, 43% perceived graphics as important and 48% in 2015.
Interactive media was in 6th place last year (11.6%) (the first time on the list) and jumped three spots to No. 4 this year.
Among radio journalists, audio is ranked as the most important supplement; graphics among newswire journalists (33%) and bloggers (24%); and video among TV media (53%).
Rank the following release supplements by importance.
RANKED PHOTOGRAPHS AS 1 OUT OF 733%
NOTE: Respondents were asked to rank release supplements in order of importance (1 being the most important and 7 the least). These are the average rankings of each supplement.
11
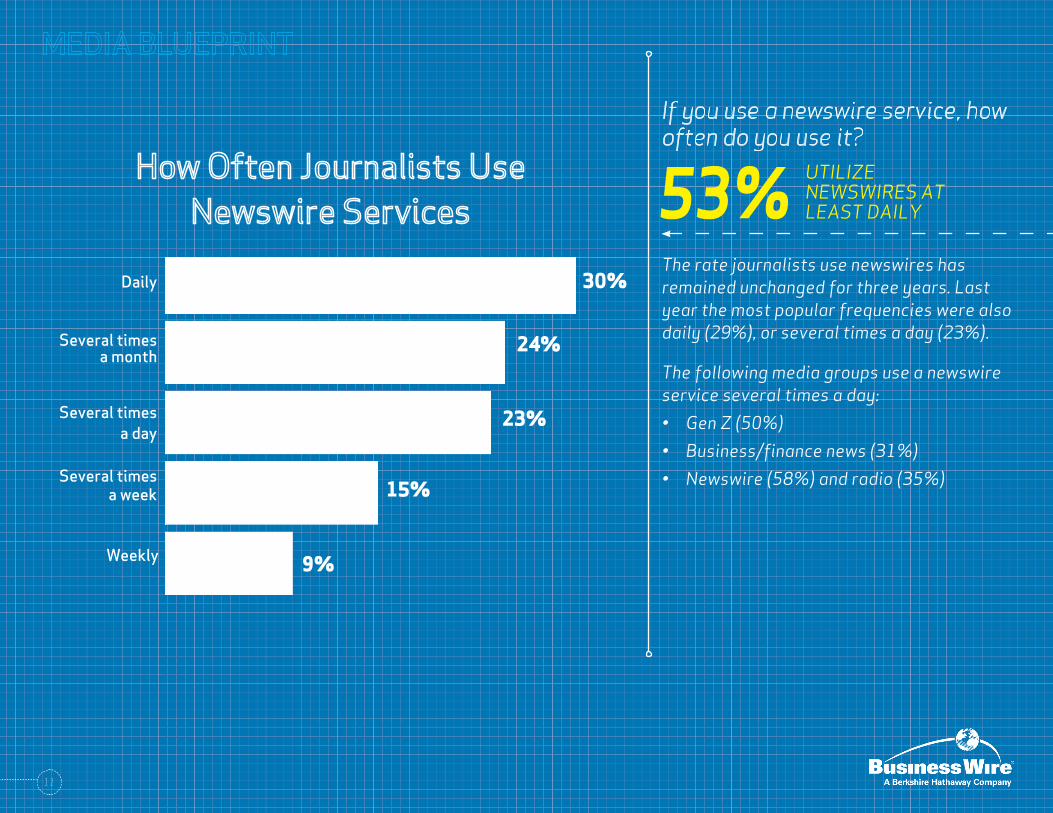
30%
24%
23%
15%
9%
Daily
Several timesa month
Several times a day
Several times a week
Weekly
The rate journalists use newswires has remained unchanged for three years. Last year the most popular frequencies were also daily (29%), or several times a day (23%).
The following media groups use a newswire service several times a day:
• Gen Z (50%)
• Business/finance news (31%)
• Newswire (58%) and radio (35%)
If you use a newswire service, how often do you use it?
UTILIZE NEWSWIRES AT LEAST DAILY53%
12
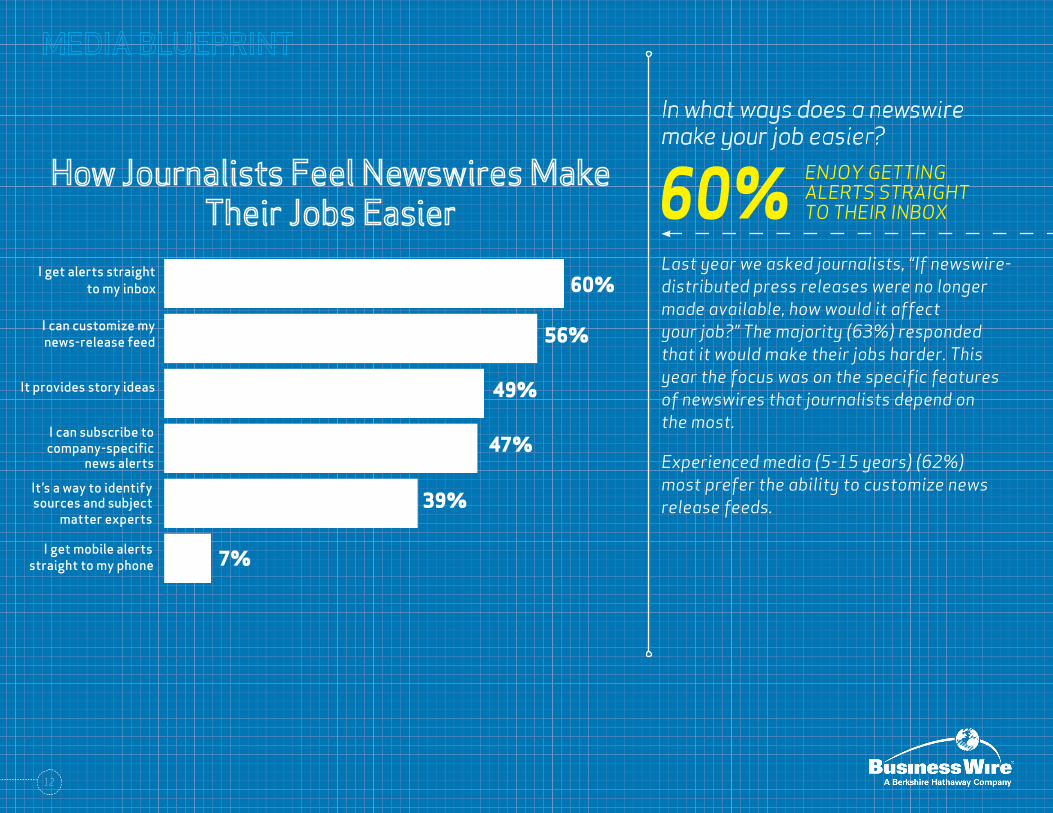
60%
56%
49%
47%
39%
7%
I get alerts straight to my inbox
I can customize my news-release feed
It provides story ideas
I can subscribe to company-specific
news alertsIt’s a way to identify sources and subject
matter experts
I get mobile alerts straight to my phone
Last year we asked journalists, “If newswire-distributed press releases were no longer made available, how would it affect your job?” The majority (63%) responded that it would make their jobs harder. This year the focus was on the specific features of newswires that journalists depend on the most.
Experienced media (5-15 years) (62%) most prefer the ability to customize news release feeds.
In what ways does a newswire make your job easier?
ENJOY GETTING ALERTS STRAIGHT TO THEIR INBOX60%
13
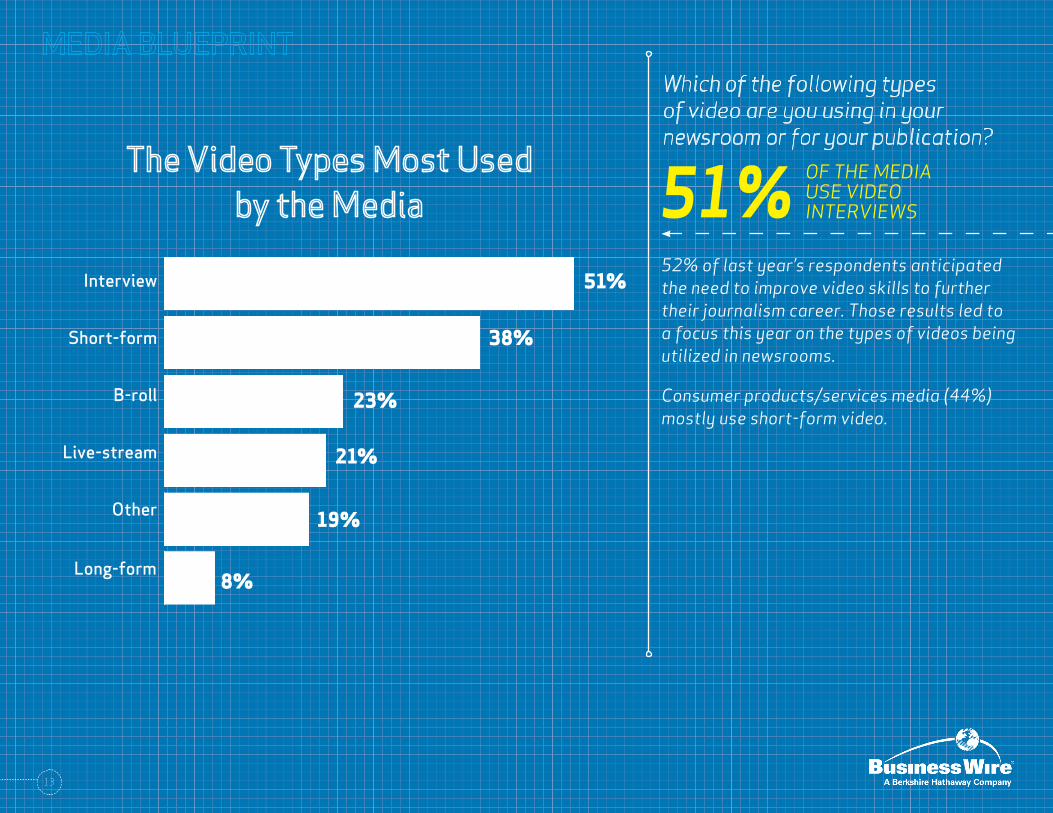
51%
38%
23%
21%
19%
8%
Interview
Short-form
B-roll
Live-stream
Other
Long-form
52% of last year’s respondents anticipated the need to improve video skills to further their journalism career. Those results led to a focus this year on the types of videos being utilized in newsrooms.
Consumer products/services media (44%) mostly use short-form video.
Which of the following types of video are you using in your newsroom or for your publication?
OF THE MEDIA USE VIDEO INTERVIEWS51%
14
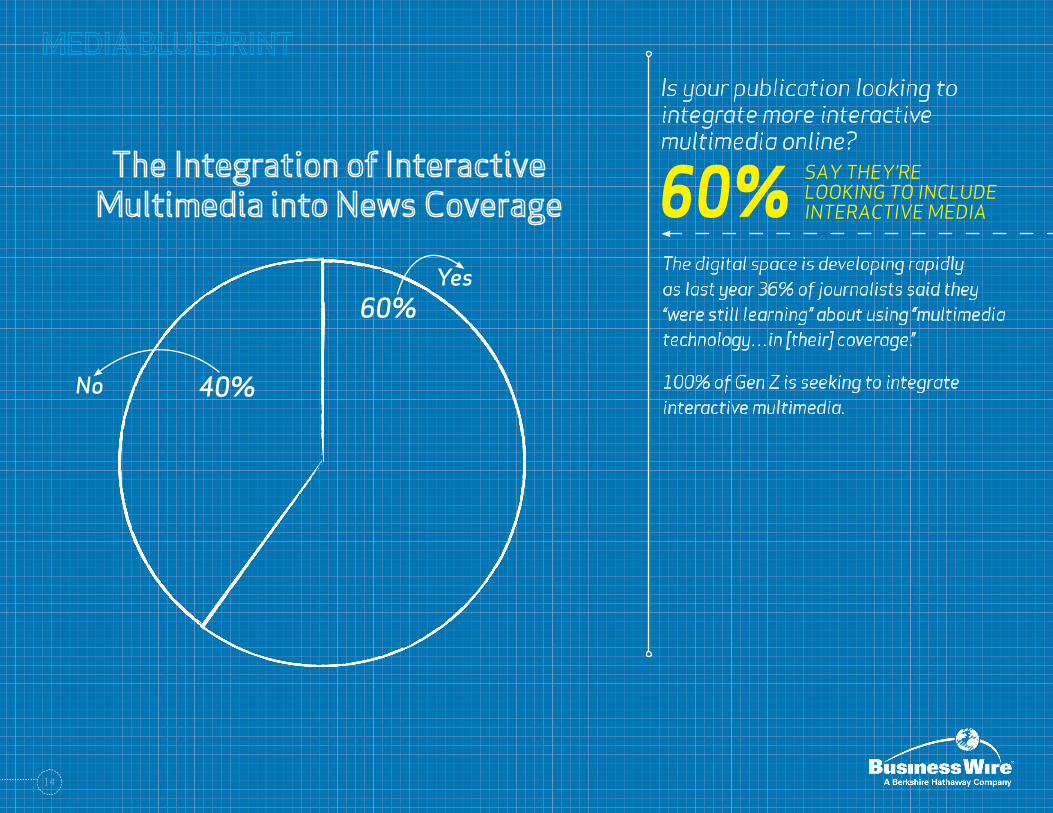
Is your publication looking to integrate more interactive multimedia online?
SAY THEY’RE LOOKING TO INCLUDE INTERACTIVE MEDIA
Yes
40%
60%
No
The digital space is developing rapidly as last year 36% of journalists said they “were still learning” about using “multimedia technology…in [their] coverage.”
100% of Gen Z is seeking to integrate interactive multimedia.
60%
15
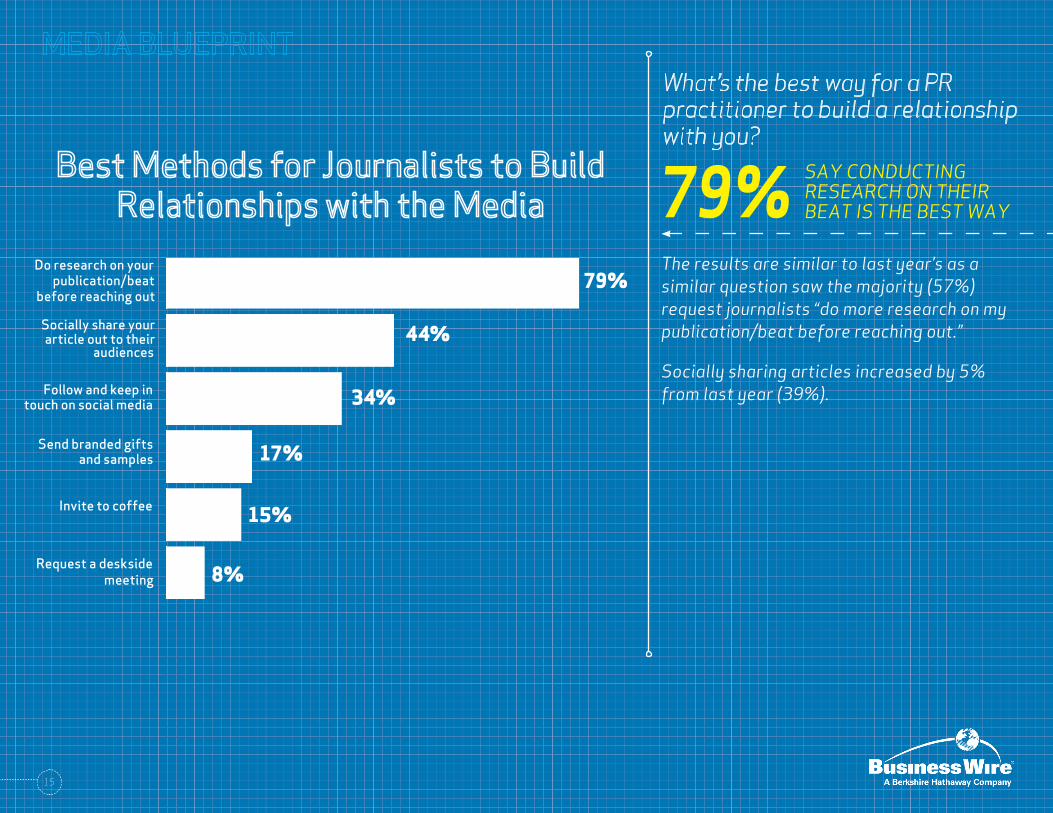
79%
44%
34%
17%
15%
8%
Do research on your publication/beat
before reaching out
Socially share your article out to their
audiences
Follow and keep in touch on social media
Send branded gifts and samples
Invite to coffee
Request a deskside meeting
The results are similar to last year’s as a similar question saw the majority (57%) request journalists “do more research on my publication/beat before reaching out.”
Socially sharing articles increased by 5% from last year (39%).
What’s the best way for a PR practitioner to build a relationship with you?
79% SAY CONDUCTING RESEARCH ON THEIR BEAT IS THE BEST WAY
16
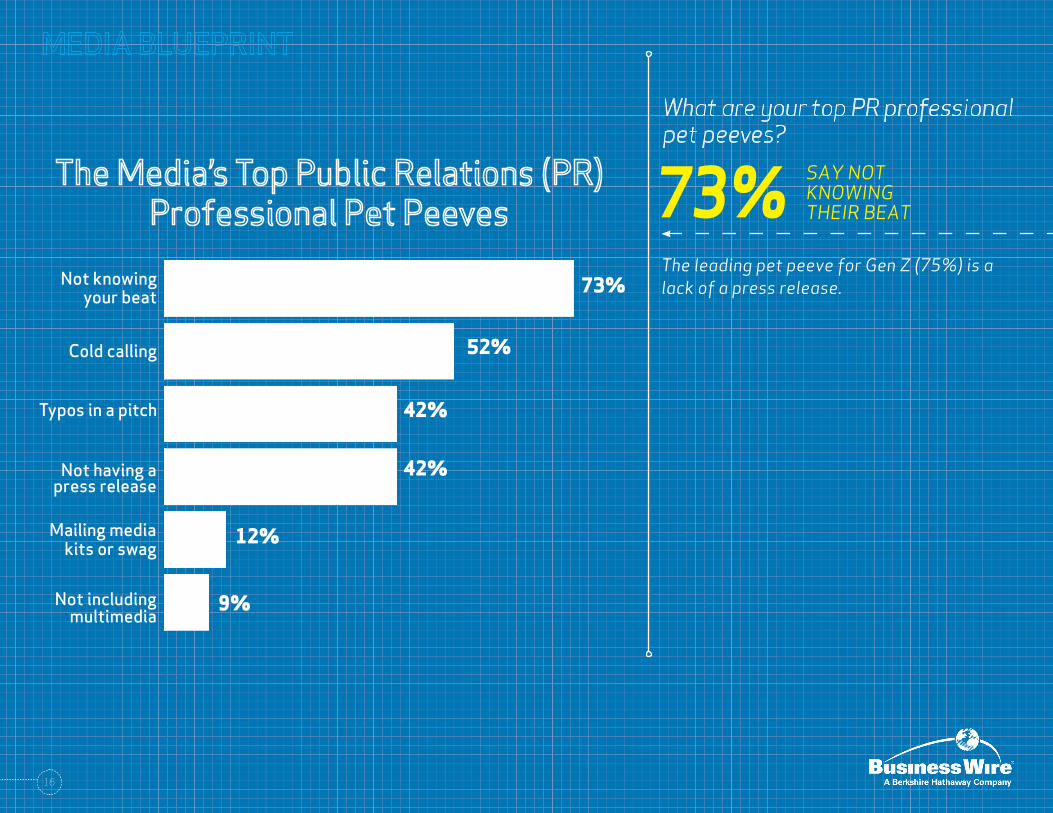
73%
52%
42%
42%
12%
9%
Not knowing
Not having a press release
your beat
Cold calling
Typos in a pitch
Mailing media kits or swag
Not including multimedia
The leading pet peeve for Gen Z (75%) is a lack of a press release.
What are your top PR professional pet peeves?
SAY NOT KNOWING THEIR BEAT73%

17
42%
24%
19%
9%
6%
1-5
6-10
21+
11-15
16-20
Many media groups report producing more than 21+ stories a week including:
• Local/national news (30%)
• Newswire (34%) and TV (39%)
On average how many news pieces do you produce a week?
SAY THEY PRODUCE 6+ ARTICLES A WEEK58%
18
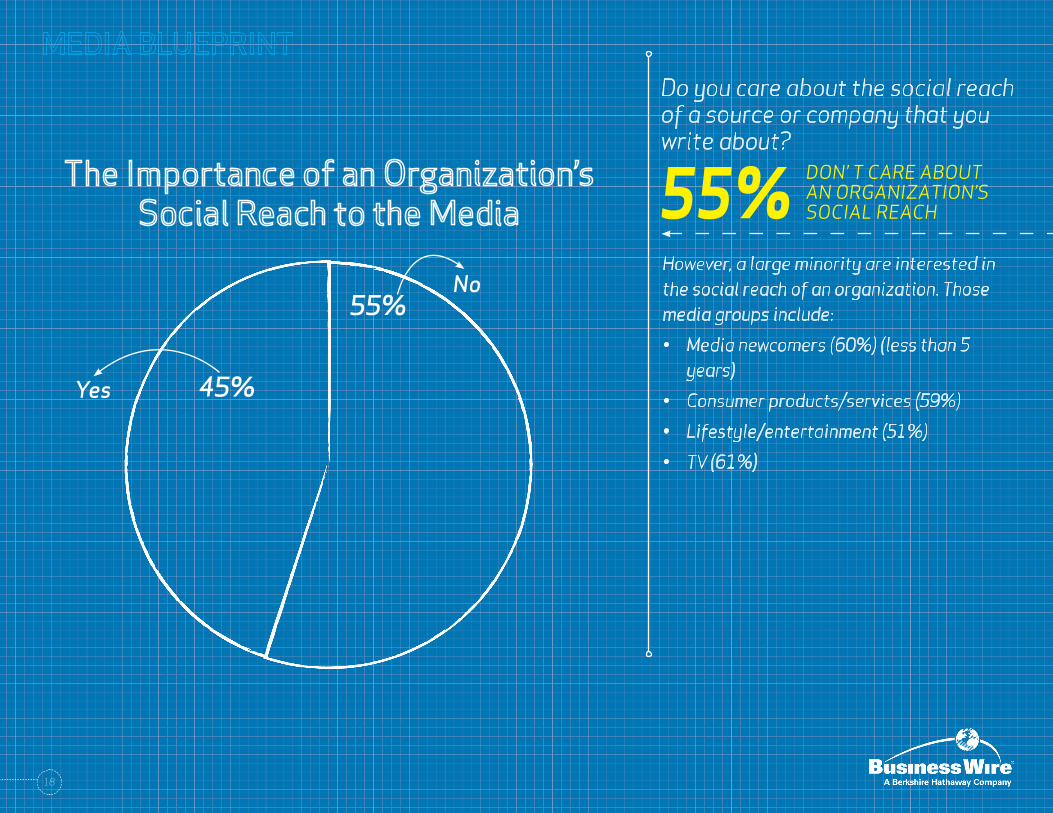
Do you care about the social reach of a source or company that you write about?
DON’ T CARE ABOUT AN ORGANIZATION’S SOCIAL REACH
Yes 45%
55%No
However, a large minority are interested in the social reach of an organization. Those media groups include:
• Media newcomers (60%) (less than 5 years)
• Consumer products/services (59%)
• Lifestyle/entertainment (51%)
• TV (61%)
55%
19
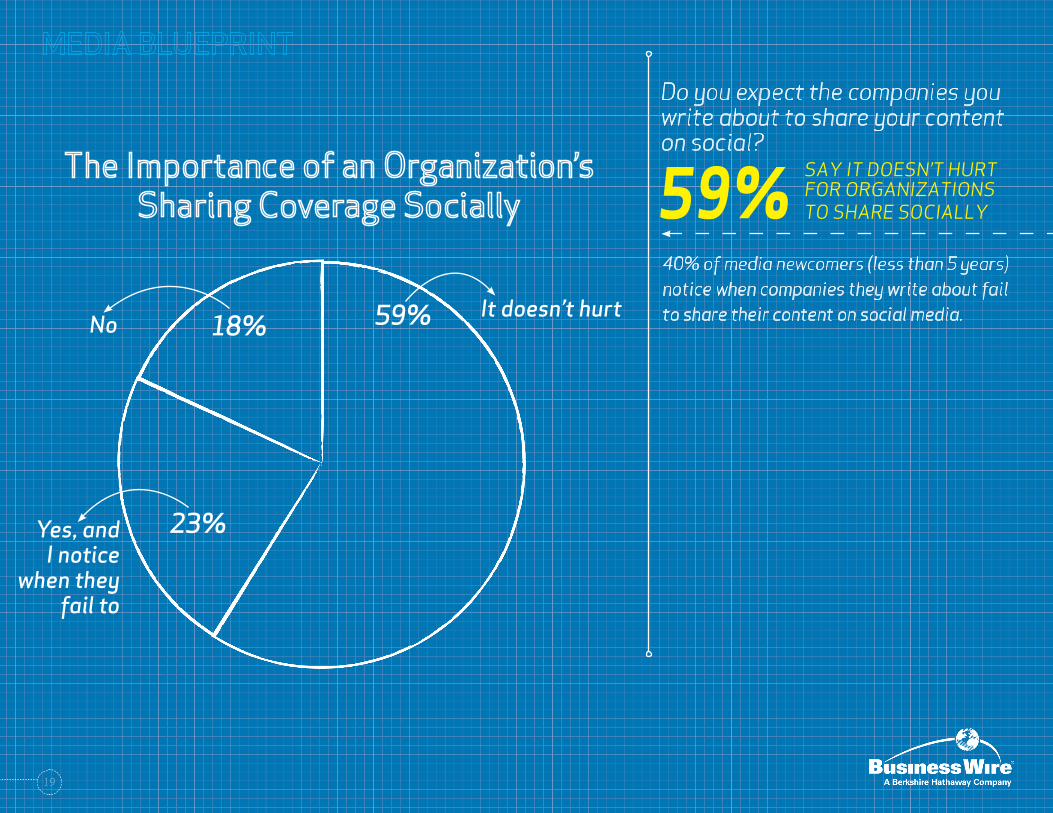
Do you expect the companies you write about to share your content on social?
SAY IT DOESN’T HURT FOR ORGANIZATIONS TO SHARE SOCIALLY
It doesn’t hurt18%
23%
59%No
Yes, and I notice
when they fail to
40% of media newcomers (less than 5 years) notice when companies they write about fail to share their content on social media.
59%
20
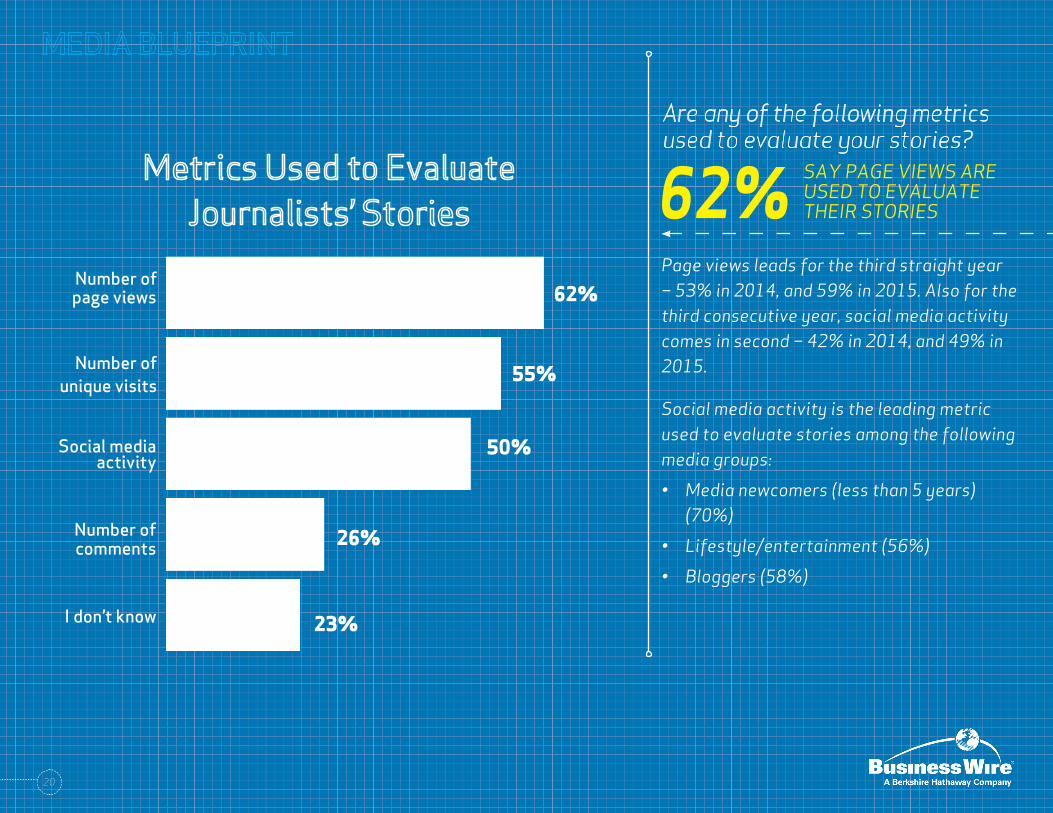
62%
55%
50%
26%
23%
Number of
Social media activity
page views
Number of unique visits
Number of comments
I don’t know
Page views leads for the third straight year – 53% in 2014, and 59% in 2015. Also for the third consecutive year, social media activity comes in second – 42% in 2014, and 49% in 2015.
Social media activity is the leading metric used to evaluate stories among the following media groups:
• Media newcomers (less than 5 years) (70%)
• Lifestyle/entertainment (56%)
• Bloggers (58%)
Are any of the following metrics used to evaluate your stories?
SAY PAGE VIEWS ARE USED TO EVALUATE THEIR STORIES62%
21
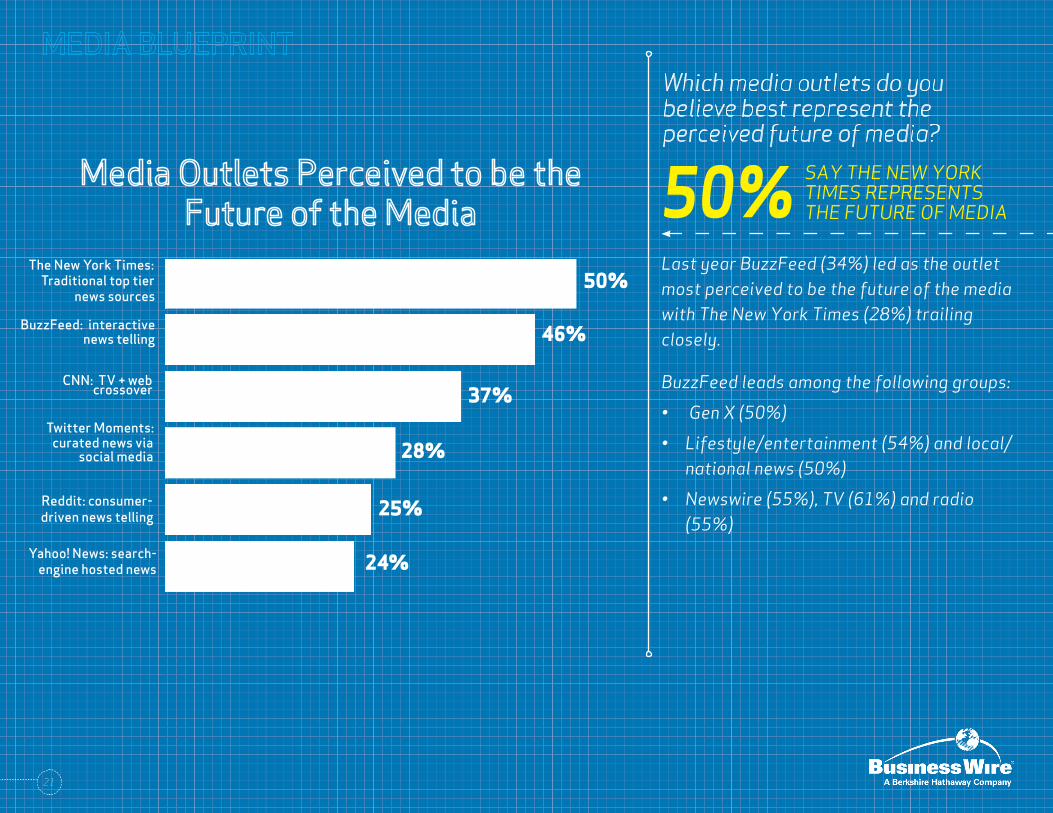
50%
46%
37%
28%
25%
24%
The New York Times: Traditional top tier
news sources
BuzzFeed: interactive news telling
CNN: TV + web crossover
Twitter Moments: curated news via
social media
Reddit: consumer-driven news telling
Yahoo! News: search-engine hosted news
Last year BuzzFeed (34%) led as the outlet most perceived to be the future of the media with The New York Times (28%) trailing closely.
BuzzFeed leads among the following groups:
• Gen X (50%)
• Lifestyle/entertainment (54%) and local/national news (50%)
• Newswire (55%), TV (61%) and radio (55%)
Which media outlets do you believe best represent the perceived future of media?
SAY THE NEW YORK TIMES REPRESENTS THE FUTURE OF MEDIA50%
23
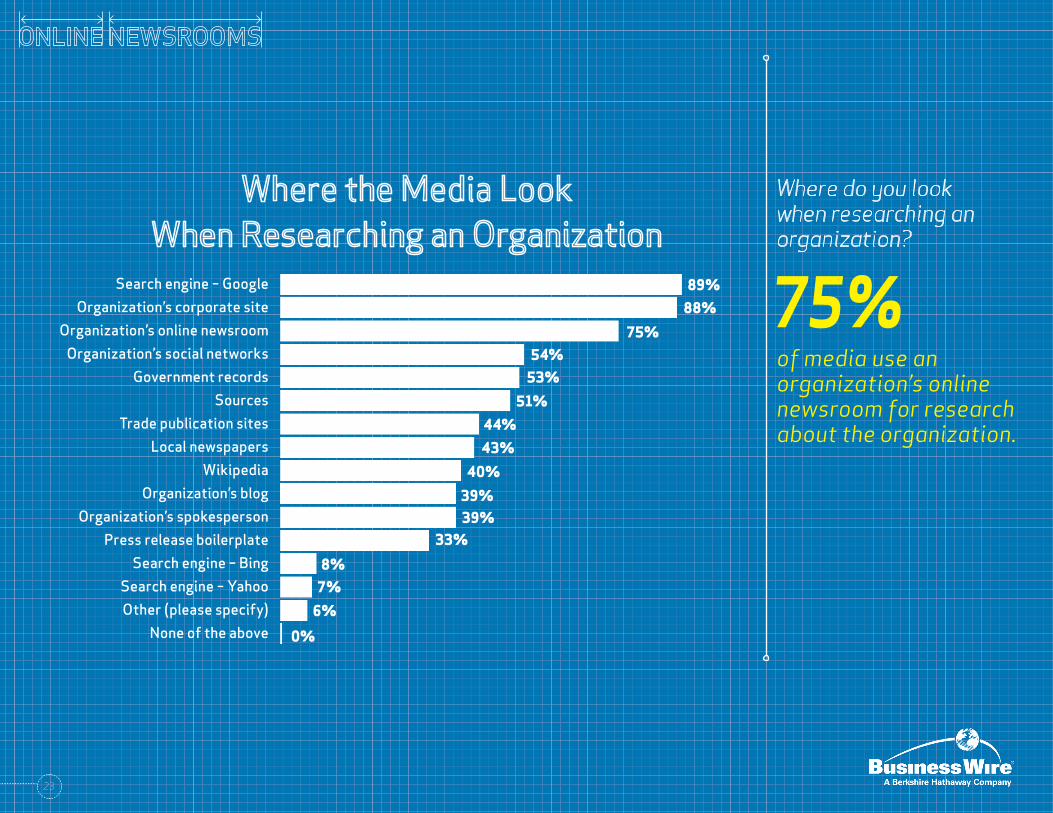
Where do you look when researching an organization?
Search engine – GoogleOrganization’s corporate site
Organization’s online newsroomOrganization’s social networks
Government records Sources
Trade publication sitesLocal newspapers
WikipediaOrganization’s blog
Organization’s spokespersonPress release boilerplate
Search engine – BingSearch engine – YahooOther (please specify)
None of the above
89%88%
75%54%53%
51%44%43%
40%
39%39%
33%
8%7%
6%
0%
of media use an organization’s online newsroom for research about the organization.
75%
24
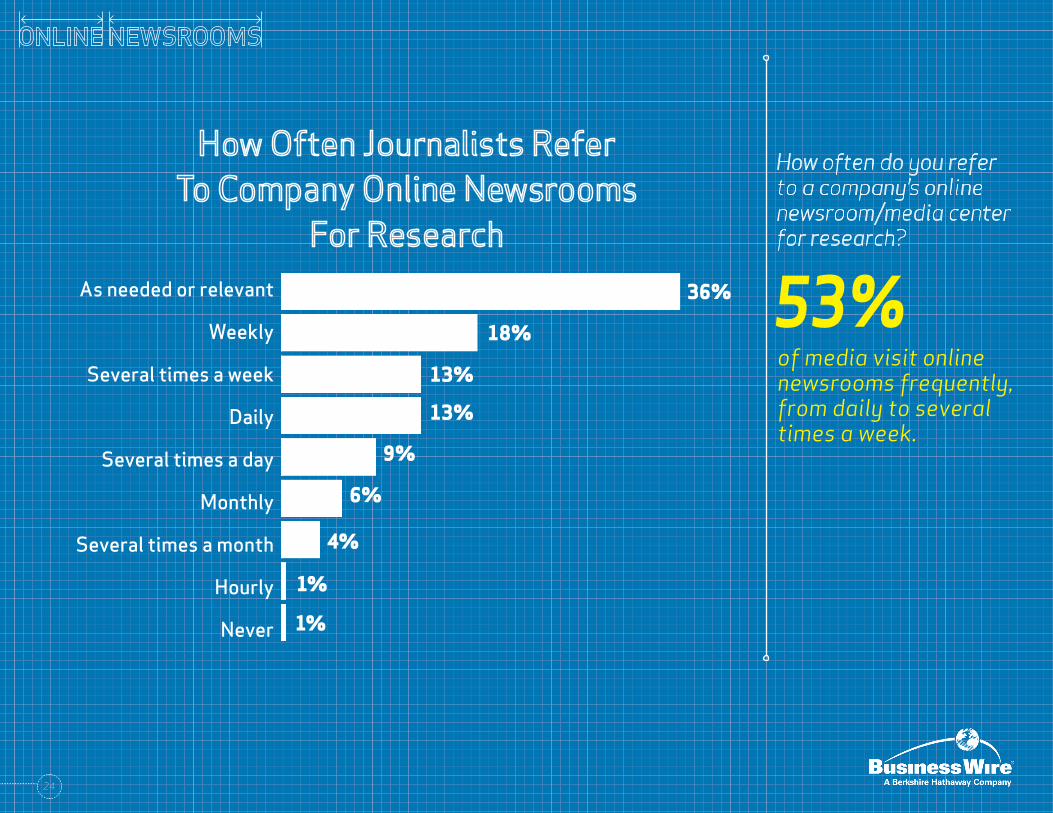
As needed or relevant
Weekly
Several times a week
Daily
Several times a day
Monthly
Several times a month
Hourly
Never
How often do you refer to a company’s online newsroom/media center for research?
of media visit online newsrooms frequently, from daily to several times a week.
36%
18%
13%
13%
9%
6%
4%
1%
1%
53%
25
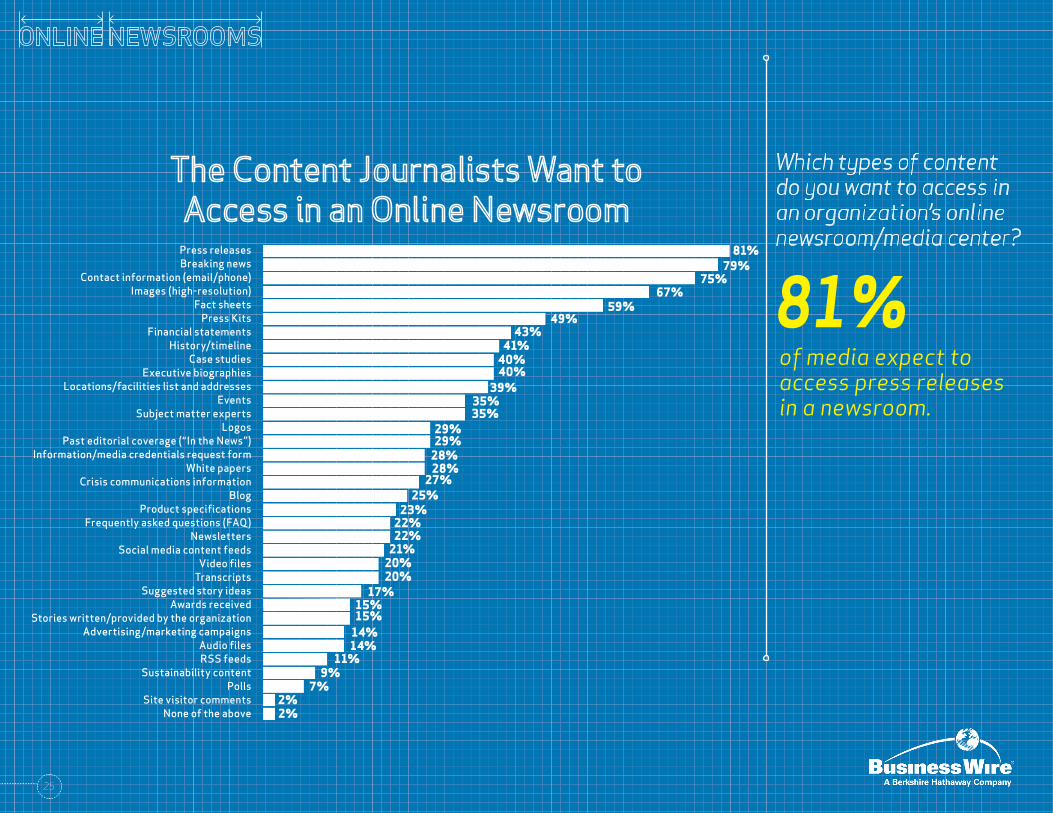
of media expect to access press releases in a newsroom.
Which types of content do you want to access in an organization’s online newsroom/media center?
Press releasesBreaking news
Contact information (email/phone)Images (high-resolution)
Fact sheetsPress Kits
Financial statementsHistory/timeline
Case studiesExecutive biographies
Locations/facilities list and addressesEvents
Subject matter expertsLogos
Past editorial coverage (“In the News”)Information/media credentials request form
White papersCrisis communications information
BlogProduct specifications
Frequently asked questions (FAQ)Newsletters
Social media content feeds Video files
TranscriptsSuggested story ideas
Awards receivedStories written/provided by the organization
Advertising/marketing campaignsAudio filesRSS feeds
Sustainability contentPolls
Site visitor commentsNone of the above
81%79%
75%67%
59%49%
43%41%40%40%39%
35%35%
29%29%28%28%27%
25%23%22%22%21%20%20%
17%15%15%14%14%
11%9%
7%2%2%
81%
26
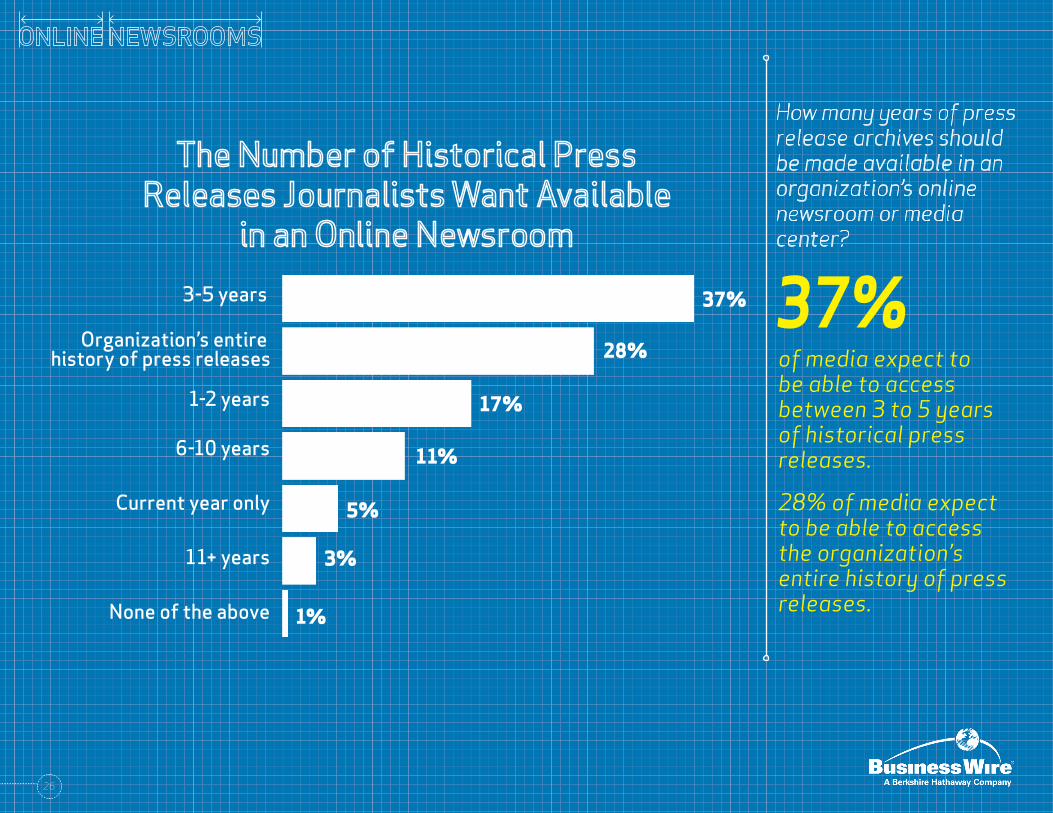
37%
How many years of press release archives should be made available in an organization’s online newsroom or media center?
of media expect to be able to access between 3 to 5 years of historical press releases.
28% of media expect to be able to access the organization’s entire history of press releases.
3-5 years
Organization’s entire
37%
28%
17%
11%
5%
3%
history of press releases
1-2 years
6-10 years
Current year only
11+ years
None of the above 1%
27
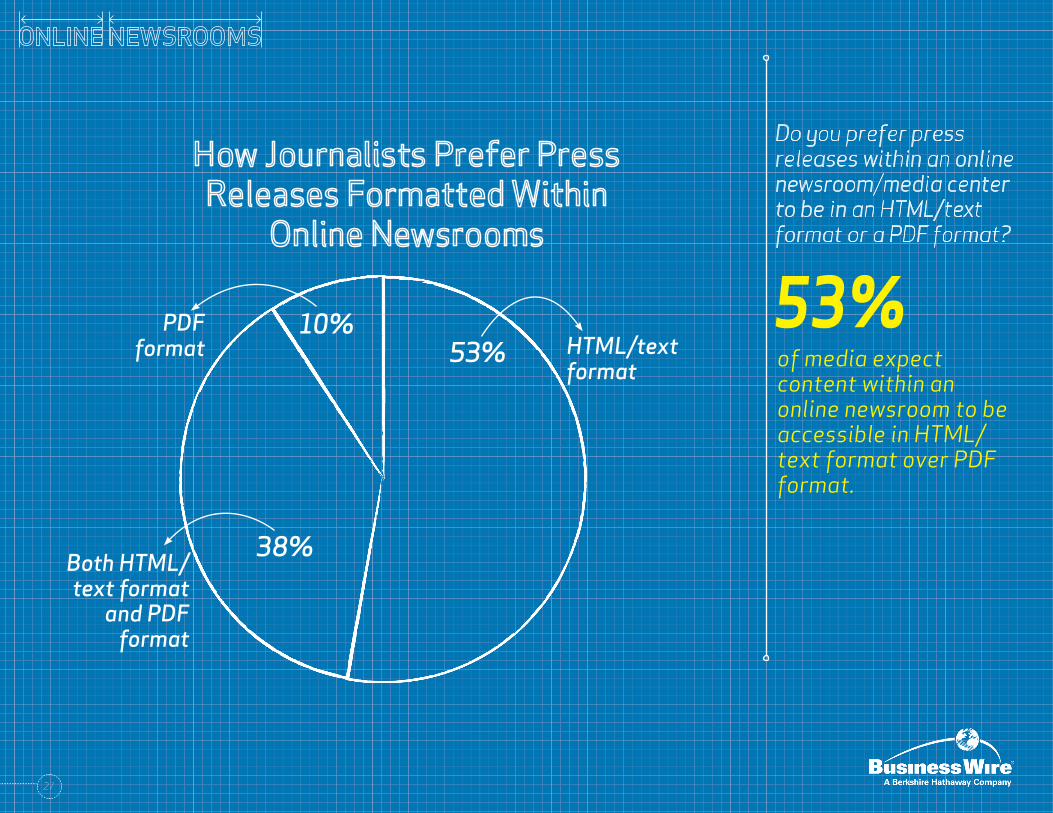
53%
Do you prefer press releases within an online newsroom/media center to be in an HTML/text format or a PDF format?
of media expect content within an online newsroom to be accessible in HTML/text format over PDF format.
HTML/text format
10%
38%
53%PDF
format
Both HTML/text format
and PDF format
28
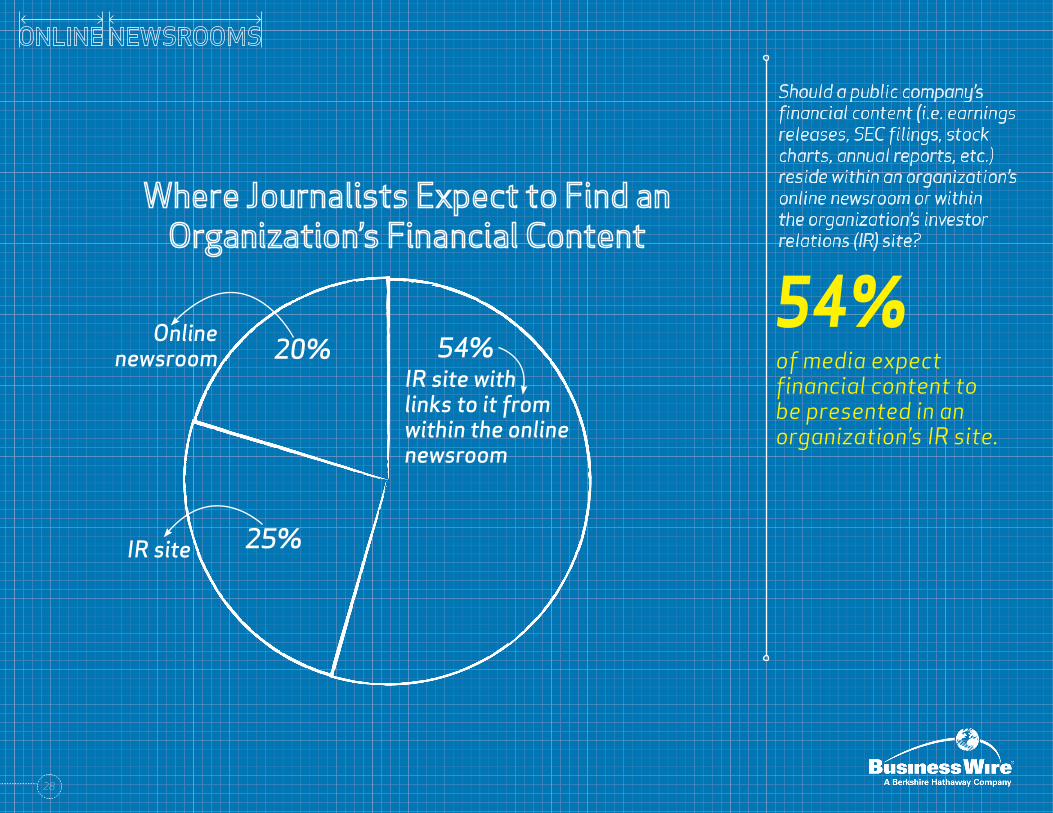
Should a public company’s financial content (i.e. earnings releases, SEC filings, stock charts, annual reports, etc.) reside within an organization’s online newsroom or within the organization’s investor relations (IR) site?
of media expect financial content to be presented in an organization’s IR site.
54% IR site with links to it from within the online newsroom
20%
25%
54%Online newsroom
IR site
29
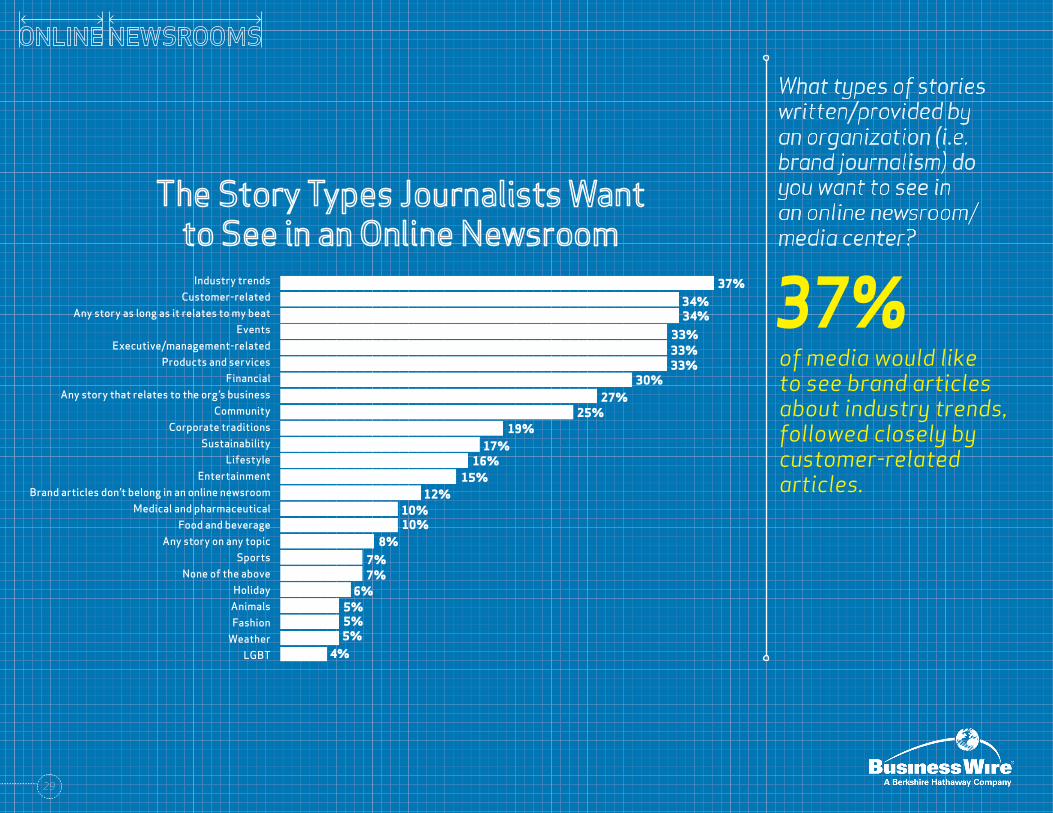
of media would like to see brand articles about industry trends, followed closely by customer-related articles.
Industry trendsCustomer-related
Any story as long as it relates to my beatEvents
Executive/management-relatedProducts and services
FinancialAny story that relates to the org’s business
CommunityCorporate traditions
SustainabilityLifestyle
EntertainmentBrand articles don’t belong in an online newsroom
Medical and pharmaceuticalFood and beverage
Any story on any topicSports
None of the aboveHoliday
AnimalsFashion
WeatherLGBT
37%34%34%
33%33%33%
30%27%
25%19%
17%16%
15%12%
10%
What types of stories written/provided by an organization (i.e. brand journalism) do you want to see in an online newsroom/ media center?
10%8%
7%7%
6%5%5%5%
4%
37%
30
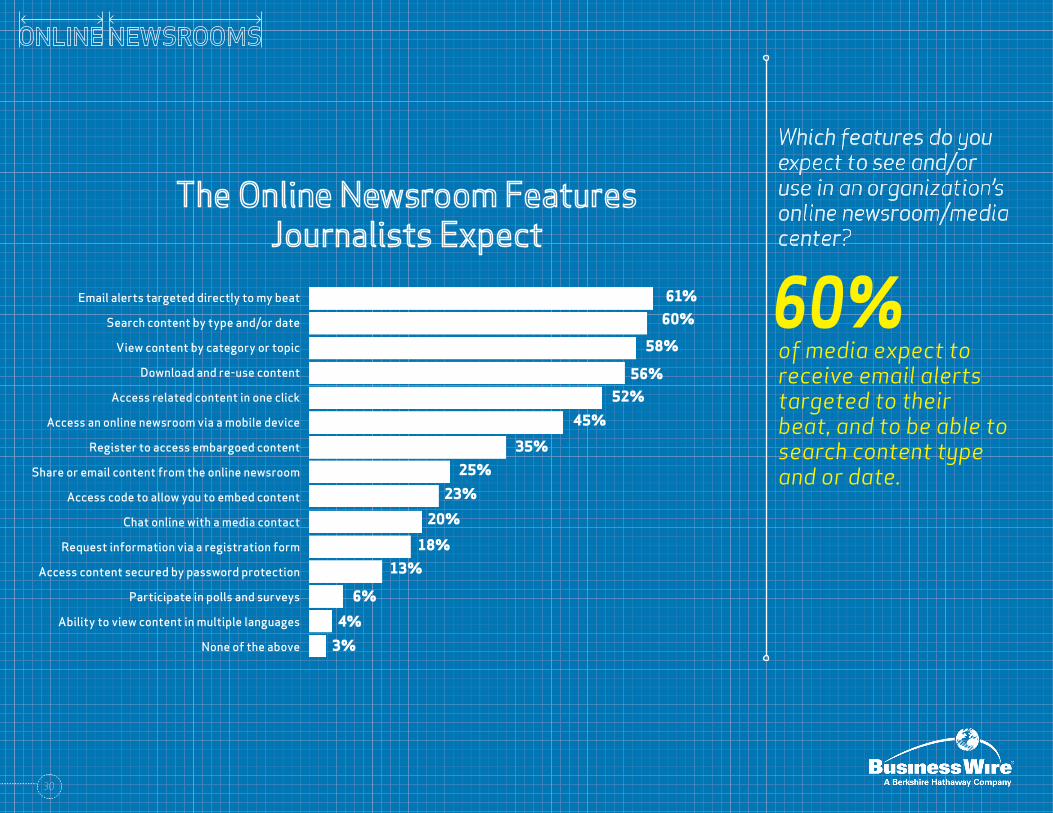
Which features do you expect to see and/or use in an organization’s online newsroom/media center?
of media expect to receive email alerts targeted to their beat, and to be able to search content type and or date.
Email alerts targeted directly to my beat
Search content by type and/or date
View content by category or topic
Download and re-use content
Access related content in one click
Access an online newsroom via a mobile device
Register to access embargoed content
Share or email content from the online newsroom
Access code to allow you to embed content
Chat online with a media contact
Request information via a registration form
Access content secured by password protection
Participate in polls and surveys
Ability to view content in multiple languages
None of the above
61%60%
58%
56%52%
45%
35%25%
23%
20%
18%13%
6%
4%
3%
60%
31
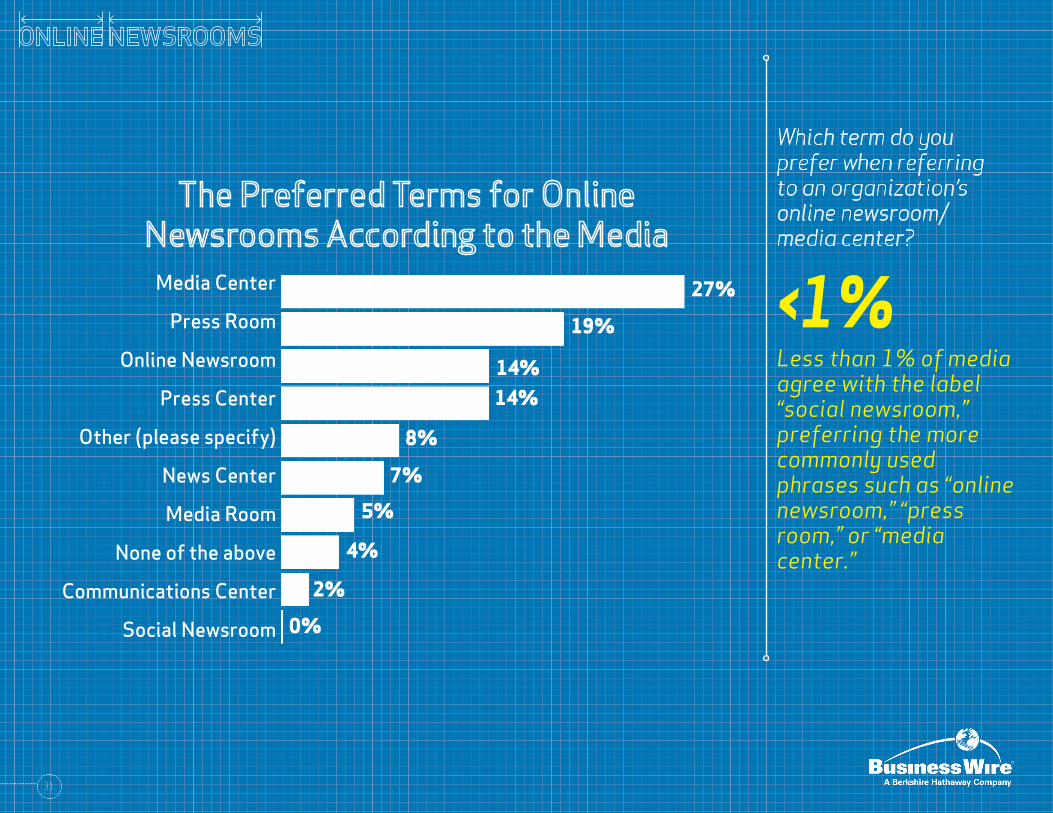
Media Center
Press Room
Online Newsroom
Press Center
Other (please specify)
News Center
Media Room
None of the above
Communications Center
Social Newsroom
Which term do you prefer when referring to an organization’s online newsroom/ media center?
Less than 1% of media agree with the label “social newsroom,” preferring the more commonly used phrases such as “online newsroom,” “press room,” or “media center.”
27%
19%
14%14%
8%
7%
5%
4%
2%
0%
<1%
» 2015 North American Media Survey
» Why Clean Communication is a “Must” in Press Releases
» The Multi-Channel Approach Every Marketer Needs to Know
» How to Make a Video for Your Next Release
» 8 Questions to Determine if a Newswire is Your Perfect Match
» Editorial Coverage Drives Trust…It’s Time to Increase Your PR Budgets
©Business Wire40 East 52nd Street14th FloorNew York, NY 10022@businesswire