Embed Size (px)
Citation preview
1
ANNUAL REPORT
2016

Mashreq Annual Report 20162

Mashreq Annual Report 2016 1

His Highness Sheikh Khalifa Bin Zayed Al NahyanPresident of the United Arab Emirates and Emir of Abu Dhabi

3
His Highness Sheikh Mohammed Bin Rashid Al MaktoumVice President & Prime Minister of the United Arab Emirates and Emir of Dubai

Mashreq Annual Report 20164

Mashreq Annual Report 2016 5
Contents
Board of Directors 7
Chairman’s Report 8
Worldwide Presence 13
Corporate Governance Report 16
Basel II Pillar 3 23
Financial Highlights 47
Independent Auditor’s Report 56
Group Financial Statements 63
Consolidated Statement of Financial Position 64
Consolidated Income Statement 65
Consolidated Statement of Comprehensive Income 66
Consolidated Statement of Changes in Equity 67
Consolidated Statement of Cash Flows 68
Notes to the Consolidated Financial Statements 70

Mashreq Annual Report 20166

Mashreq Annual Report 2016 7
Board of Directors
ChairmanAbdulla Bin Ahmad Al Ghurair
Vice-ChairmanAli Rashed Ahmad Lootah
Director & Chief Executive OfficerH.E. Abdul Aziz Abdulla Al Ghurair
DirectorsRashed Saif Saeed Al Jarwan
Sultan Abdulla Ahmed Al Ghurair
Rashed Saif Ahmed Al Ghurair

Mashreq Annual Report 20168
Chairman’s Report2016 was a difficult year for the banking sector as it had to contend with the threefold impact of reduced
confidence on the back of lower oil prices; strong US dollar impacting non-oil private sector firms; and fiscal
consolidation. The tough macroeconomic environment led to reduced appetite for both business credit and
personal loans and the economic slowdown also led to higher credit losses in SME and personal lending sectors.
In this environment, we maintained robust capital and liquidity levels and placed a strong emphasis on cost
management. We also strengthened our risk management and underwriting criteria and it is a testament to
our diversification strategy that we were able to grow our balance sheet by 6.6% and revenues by 3.2% in the
year. Our international franchises continue to record strong growth rates and improved their contribution to
bank’s bottom line.
Mashreq’s Total Assets increased by 6.6% to reach AED 122.8 billion in 2016, compared to AED 115.2 billion at
the end of 2015. On a year-on-year basis, Loans and Advances grew by 1.4% to end at AED 61.0 billion driven
by 14.4% growth in Islamic finance. Customer Deposits at AED 77.0 billion, increased by 4.6% as compared
to December 2015, driven by 7.2% growth in conventional deposits. The bank continued to exhibit a healthy
liquidity position with Liquid Assets to Total Assets standing at 30.4% as of December 2016. Both Loan-to-
Total Assets Ratio at 49.7% and Loan-to-Deposit ratio at 79.2% also continued to remain more conservative
vis-à-vis the market.
Total operating income crossed the AED 6 billion mark and stood at AED 6.2 billion, a year-on-year increase of
3.2%. A slight decline in net interest margin from 3.60% as of December 2015 to 3.52% as of December 2016
was offset by a 1.4% year-on-year increase in loan volume and led to AED 3.6 billion in Net Interest Income
& Net Income from Islamic Products - up by 4.2% compared to 2015. We maintained our consistently high
proportion of net fee and commission income and Mashreq’s best-in-class Net Fee, Commission, Investment
and Other Income to operating income ratio remained high at 42.2%. Strong and disciplined cost management
resulted in Operating expenses decreasing by 2.7% year-on-year to reach AED 2.4 billion and Efficiency ratio
(Expenses to Income ratio) improved significantly to 39% from 41.4% last year.
In spite of deteriorating market conditions, we were able to restrict the net growth in our Non-Performing Loans
to AED 0.3 billion leading to a Non-Performing Loans to Gross Loans ratio of 3.1% at the end of December
2016. Net Allowances for impairment for 2016 were AED 1.7 billion and total Provisions for Loans and advances
reached AED 3.3 billion, constituting 151.1% coverage for Non-Performing Loans as on December 2016 (145%
in December 2015).
In a tough year, Mashreq delivered a net profit of AED 1.9 billion with resulting Earnings per share of AED 10.85.
The bank continued to maintain healthy Tier-1 and Total Capital Adequacy ratio of 16.0% and 16.9% respectively.
Your Board, in keeping with its established practice of funding the growth through internal capitalization, is
recommending a cash dividend of 40% of paid up capital. This cash dividend will constitute 37% of the profit
for 2016, thereby retaining remaining profit so as to maintain necessary capital adequacy ratios for upcoming
Basel III capital requirements.
8
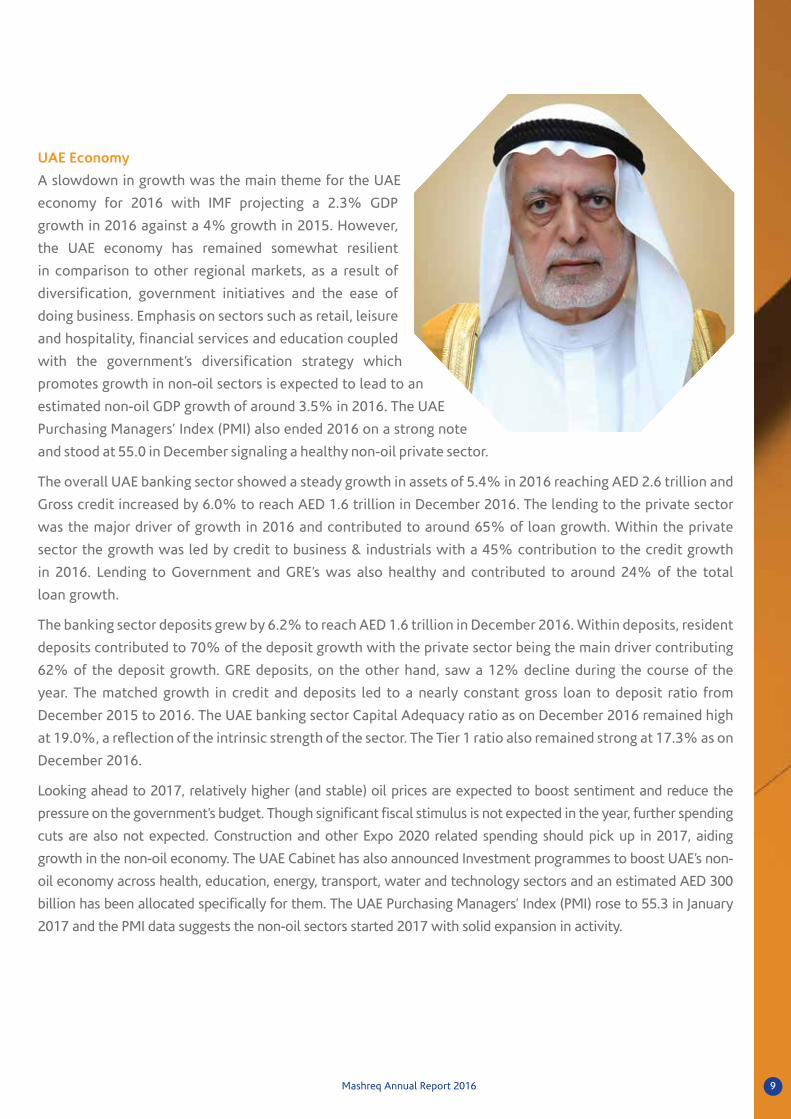
UAE Economy
A slowdown in growth was the main theme for the UAE
economy for 2016 with IMF projecting a 2.3% GDP
growth in 2016 against a 4% growth in 2015. However,
the UAE economy has remained somewhat resilient
in comparison to other regional markets, as a result of
diversification, government initiatives and the ease of
doing business. Emphasis on sectors such as retail, leisure
and hospitality, financial services and education coupled
with the government’s diversification strategy which
promotes growth in non-oil sectors is expected to lead to an
estimated non-oil GDP growth of around 3.5% in 2016. The UAE
Purchasing Managers’ Index (PMI) also ended 2016 on a strong note
and stood at 55.0 in December signaling a healthy non-oil private sector.
The overall UAE banking sector showed a steady growth in assets of 5.4% in 2016 reaching AED 2.6 trillion and
Gross credit increased by 6.0% to reach AED 1.6 trillion in December 2016. The lending to the private sector
was the major driver of growth in 2016 and contributed to around 65% of loan growth. Within the private
sector the growth was led by credit to business & industrials with a 45% contribution to the credit growth
in 2016. Lending to Government and GRE’s was also healthy and contributed to around 24% of the total
loan growth.
The banking sector deposits grew by 6.2% to reach AED 1.6 trillion in December 2016. Within deposits, resident
deposits contributed to 70% of the deposit growth with the private sector being the main driver contributing
62% of the deposit growth. GRE deposits, on the other hand, saw a 12% decline during the course of the
year. The matched growth in credit and deposits led to a nearly constant gross loan to deposit ratio from
December 2015 to 2016. The UAE banking sector Capital Adequacy ratio as on December 2016 remained high
at 19.0%, a reflection of the intrinsic strength of the sector. The Tier 1 ratio also remained strong at 17.3% as on
December 2016.
Looking ahead to 2017, relatively higher (and stable) oil prices are expected to boost sentiment and reduce the
pressure on the government’s budget. Though significant fiscal stimulus is not expected in the year, further spending
cuts are also not expected. Construction and other Expo 2020 related spending should pick up in 2017, aiding
growth in the non-oil economy. The UAE Cabinet has also announced Investment programmes to boost UAE’s non-
oil economy across health, education, energy, transport, water and technology sectors and an estimated AED 300
billion has been allocated specifically for them. The UAE Purchasing Managers’ Index (PMI) rose to 55.3 in January
2017 and the PMI data suggests the non-oil sectors started 2017 with solid expansion in activity.
Mashreq Annual Report 2016 9

Mashreq Annual Report 201610
IMF expects Abu Dhabi’s GDP to grow at 1.7% while Dubai is projected to grow at 3.6% - the UAE, as a whole,
is projected to report a GDP growth of 2.5% in 2017. After extreme price volatility in the oil market in 2016,
the production cut agreement signed by OPEC members towards the end of the year has helped the market to
achieve a relative degree of stability. This recent bounce in crude prices coupled with the fructification of all
the reforms introduced in 2016 is expected to improve investor confidence and consumer sentiment and help
the economy grow at a faster pace in 2017.
Outlook for 2017
2017 has a special significance for Mashreq as on 1st May 2017 we will be completing 50 years of uninterrupted
profitable operations. We have put in place the foundations and have assembled a strong senior leadership
and management team that we believe can drive the bank forward. The bank is well positioned to leverage
its strong brand name and prudently tap into available growth opportunities in its preferred segments and
markets. Digital will be at the forefront of our initiatives as we continue to invest in innovations that result in
positive experiences for our customers; Mashreq’s strategy on innovation and focus on customer experience
has served us well in the past and will remain the mainstay of our future strategy. Our plans for 2017 have been
drawn and are expected to deliver a healthy growth in balance sheet footing and net profit.
For a third year in succession, Mashreq was awarded the Gallup Great Workplace Award in 2016. In any given
year, this award is only given to an exclusive group of companies that meet a rigorously evaluated work culture
standard (typically less than 40 globally), and the list of multiple repeat winners is even more exclusive. While
this external vindication is important for the recognition and what it says about Mashreq’s work culture, it is
even more important in terms of laying the foundation from which to maximize the impact of our new Values,
Vision, Mission and strategy.
On behalf of the Board of Directors, I take this opportunity to thank the CEO and the staff of Mashreq for their
perseverance and dedication and for delivering a stable performance in these challenging times. I also want
to express my thanks to our customers, shareholders, the Central Bank and the Government of UAE for their
continued support and trust.
Thank you.
Abdulla Bin Ahmad Al Ghurair Chairman

Mashreq Annual Report 2016 11
IMPORTANT INDICATORS 2012 2013 2014 2015 2016
ADVANCES TO CUSTOMER DEPOSITS 87.3% 86.1% 84.8% 81.7% 79.2%
EQUITY TO TOTAL ASSETS 18.1% 16.9% 16.0% 16.1% 15.9%
RETURN ON AVERAGE EQUITY (AFTER-TAX) 10.3% 13.0% 15.7% 14.2% 10.5%
RETURN ON AVERAGE ASSETS (AFTER-TAX) 1.7% 2.2% 2.5% 2.2% 1.6%
EFFICIENCY RATIOS 45.4% 42.2% 37.8% 41.4% 39.0%
CAPITAL ADEQUACY RATIO (As per CB) 19.3% 18.2% 16.6% 16.9% 16.9%
CLASSIFICATION OF ASSETS/LIABILITIES - DECEMBER 31
ASSETS 2012 2013 2014 2015 2016
OTHER ASSETS 9.0% 8.3% 7.2% 7.5% 9.2%
CASH AND BANK BALANCES 27.4% 26.5% 27.7% 29.9% 30.4%
ADVANCES 54.2% 56.3% 54.9% 52.3% 49.6%
INVESTMENTS 9.4% 8.9% 10.2% 10.3% 10.8%
LIABILITIES & EQUITY 2012 2013 2014 2015 2016
LONG TERM AND OTHER LIABILITIES 10.4% 10.9% 10.9% 11.3% 13.6%
CUSTOMER DEPOSITS 62.1% 65.4% 64.7% 63.9% 62.7%
BANK DEPOSITS 9.4% 6.8% 8.4% 8.7% 7.8%
EQUITY (Including NCI) 18.1% 16.9% 16.0% 16.1% 15.9%
13.6%
62.7%
15.9%
7.8%
9.2%
30.4%
49.6%
10.8%

Mashreq Annual Report 201612 Mashreq Annual Report 2016

Mashreq Annual Report 2016 13
Worldwide Presence
Mashreq Annual Report 2016
Mashreq Annual Report 201614
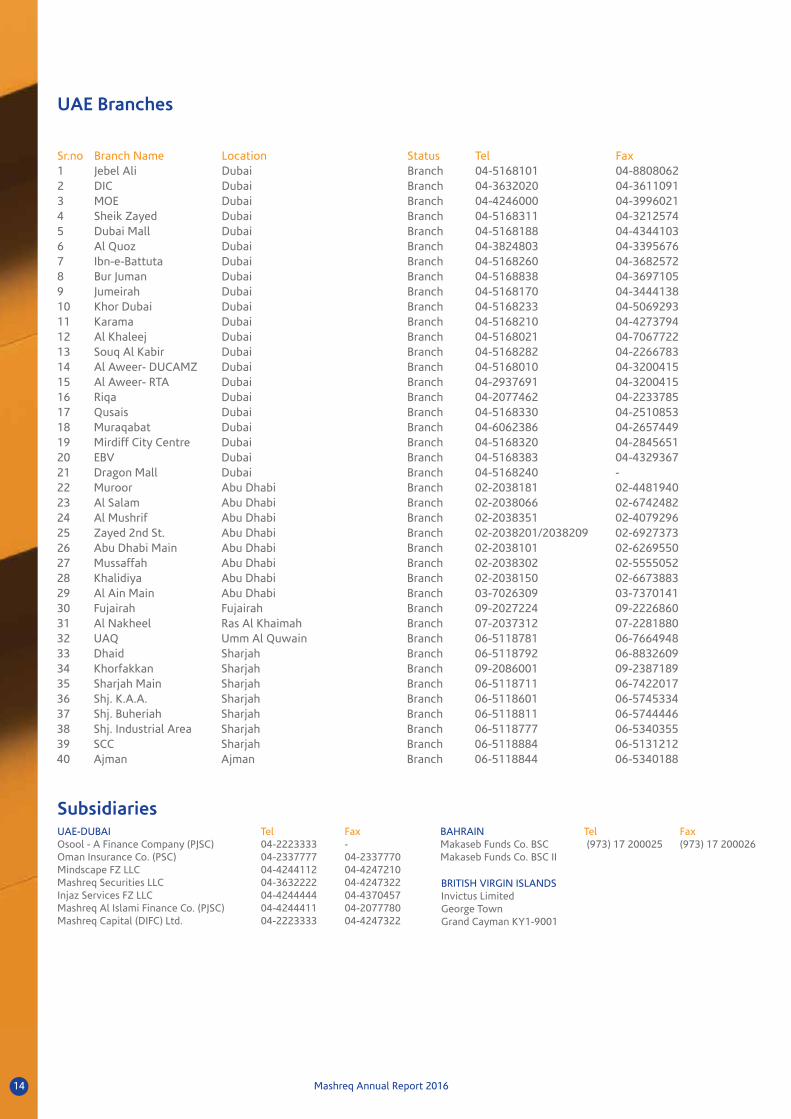
Sr.no Branch Name Location Status Tel Fax1 Jebel Ali Dubai Branch 04-5168101 04-88080622 DIC Dubai Branch 04-3632020 04-36110913 MOE Dubai Branch 04-4246000 04-39960214 Sheik Zayed Dubai Branch 04-5168311 04-32125745 Dubai Mall Dubai Branch 04-5168188 04-43441036 Al Quoz Dubai Branch 04-3824803 04-33956767 Ibn-e-Battuta Dubai Branch 04-5168260 04-36825728 Bur Juman Dubai Branch 04-5168838 04-36971059 Jumeirah Dubai Branch 04-5168170 04-344413810 Khor Dubai Dubai Branch 04-5168233 04-506929311 Karama Dubai Branch 04-5168210 04-427379412 Al Khaleej Dubai Branch 04-5168021 04-706772213 Souq Al Kabir Dubai Branch 04-5168282 04-226678314 Al Aweer- DUCAMZ Dubai Branch 04-5168010 04-320041515 Al Aweer- RTA Dubai Branch 04-2937691 04-320041516 Riqa Dubai Branch 04-2077462 04-223378517 Qusais Dubai Branch 04-5168330 04-251085318 Muraqabat Dubai Branch 04-6062386 04-265744919 Mirdiff City Centre Dubai Branch 04-5168320 04-284565120 EBV Dubai Branch 04-5168383 04-432936721 Dragon Mall Dubai Branch 04-5168240 -22 Muroor Abu Dhabi Branch 02-2038181 02-448194023 Al Salam Abu Dhabi Branch 02-2038066 02-674248224 Al Mushrif Abu Dhabi Branch 02-2038351 02-407929625 Zayed 2nd St. Abu Dhabi Branch 02-2038201/2038209 02-692737326 Abu Dhabi Main Abu Dhabi Branch 02-2038101 02-626955027 Mussaffah Abu Dhabi Branch 02-2038302 02-555505228 Khalidiya Abu Dhabi Branch 02-2038150 02-667388329 Al Ain Main Abu Dhabi Branch 03-7026309 03-737014130 Fujairah Fujairah Branch 09-2027224 09-222686031 Al Nakheel Ras Al Khaimah Branch 07-2037312 07-228188032 UAQ Umm Al Quwain Branch 06-5118781 06-766494833 Dhaid Sharjah Branch 06-5118792 06-883260934 Khorfakkan Sharjah Branch 09-2086001 09-238718935 Sharjah Main Sharjah Branch 06-5118711 06-742201736 Shj. K.A.A. Sharjah Branch 06-5118601 06-574533437 Shj. Buheriah Sharjah Branch 06-5118811 06-574444638 Shj. Industrial Area Sharjah Branch 06-5118777 06-534035539 SCC Sharjah Branch 06-5118884 06-513121240 Ajman Ajman Branch 06-5118844 06-5340188
UAE Branches
Subsidiaries UAE-DUBAI Tel Fax BAHRAIN Tel FaxOsool - A Finance Company (PJSC) 04-2223333 - Makaseb Funds Co. BSC (973) 17 200025 (973) 17 200026Oman Insurance Co. (PSC) 04-2337777 04-2337770 Makaseb Funds Co. BSC IIMindscape FZ LLC 04-4244112 04-4247210Mashreq Securities LLC 04-3632222 04-4247322 Injaz Services FZ LLC 04-4244444 04-4370457 Mashreq Al Islami Finance Co. (PJSC) 04-4244411 04-2077780 Mashreq Capital (DIFC) Ltd. 04-2223333 04-4247322
BRITISH VIRGIN ISLANDSInvictus LimitedGeorge TownGrand Cayman KY1-9001

Mashreq Annual Report 2016 15Mashreq Annual Report | Report and consolidated financial statements for the year ended 31 December 2015 7
OverseasBranches
AFRICAEgyptAlexandria74 (A) Albert Al Awal St.SemouhaTel: (203) 419 6901Fax: (203) 429 6058
Dokki15 El Messaha St.El Messaha Sq.Tel: (202) 3332 7525Fax: (202) 3336 3096
Down Town21 Dareeh Saad St.off Kasr El Eini St.Tel: (202) 2791 8555Fax: (202) 2792 7498
Heliopolis72 (B) El Mahad Elishtraky St.Tel: (202) 2456 1473Fax: (202) 2256 9850
KatameyaBusiness Mall, Plot 219-101,5th District El TagamoaTel: (201) 0222 02451Fax: (201) 2929 8695
Maadi3 El Laselky St.Tel: (202) 2755 6155Fax: (202) 2516 0900
Mohandseen32 Al Riad St., off Shebab St.Tel: (202) 3308 3701Fax: (202) 3305 3655
Nasr City37 Abbas El Akkad St.Tel: (202) 2400 8910Fax: (202) 2403 2347
Zamalek35 Abu Al Feda St.Tel: (202) 3728 3203Fax: (202) 2735 8272
6th OctoberPlot 33 Gezira TowerBeside Arken TowerSheikh Zayed, 6th OctoberTel: (202) 3854 6003Fax: (202) 3851 0079
MIDDLE EASTBahrainManamaTel: (973) 1750 4444Fax: (973) 1721 5990Corporate OfficeTel: (973) 1756 1353Fax: (973) 1758 2989
QatarDohaC Ring Road – MainAl Emadi BuildingOpposite Gulf TimesTel: (974) 4408 3171Fax: (974) 4479 5601SWIFT: MSHQ QA QA
RamadaCommercial CentreShop # 1, Salwa Road, nearRadisson Blu Hotel Tel: (974) 4408 3277Fax: (974) 4432 9288
TV RoundaboutBin Towar Center, Opposite AlJazeera TV StationTel: (974) 4408 3253Fax: (974) 4486 7207
West BayPalm Tower B, Ground Floor, West BayTel: (974) 4408 3220Fax: (974) 4412 3781
Grand HamadAl Bodiya Building, GrandHamad Street (Bank Street)Tel: (974) 4408 3225Fax: (974) 4418 5846
KuwaitAl QiblaAhmad Al-Jabber StreetAl Zomoroda BuildingTel: (965) 2495 4810/01Fax: (965) 2495 4861/2
EUROPELondonTel: (44) 207 3824000Fax: (44) 207 2569717Swift: MSHQ GB 2L
AMERICANew YorkTel: (1) 212 545 8200 (1) 212 824 2800Fax: (1) 212 545 0919Swift: MSHQ US 33
ASIAHong KongTel: (852) 2905 5847 (852) 2905 5811Fax: (852) 2521 4289Swift: MSHQ HK HH
IndiaMumbaiTel: (91) 22 6632 7200Fax: (91) 22 6630 1554Swift: MSHQ IN BB
REPRESENTATIVES OFFICESBangladeshDhakaTel: (88) 02 711 5750 (88) 02 955 0761Fax: (88) 02 471 17715
PakistanKarachiTel: (92) 21 3565 6830/2Fax: (92) 21 3565 6872/3
NepalKathmanduNew BaneshwarLakhe Chaur Marg, Ward No. 10Tel: (977) 1 448 0810/448 0811Fax: (977) 1 448 0809
Mashreq Annual Report 201616
Corporate Governance Report
Mashreq Annual Report 2016
Mashreq Annual Report 2016 17
Corporate Governance Report 2016Corporate Governance is globally recognized as an effective mechanism to control and direct an organization.
With the transparency it brings, it strengthens the bonds with the stakeholders and also improves the decision
making process. Mashreq seeks to balance its operational performance and financial success with the controls,
transparency and accountability a good Corporate Governance structure brings.
Mashreq Bank is regulated by the Central Bank of the UAE and maintains the industry best practices in terms
of compliance with the UAE Companies Law, the UAE Central Bank regulations & the laws of the United Arab
Emirates. For our international locations we are compliant with the regulation of the local Central Bank and
the law of the country of operation.
Corporate Governance: Structure and Roles
Mashreq has adopted a strong corporate governance infrastructure with clear roles and responsibilities
articulated at different levels. Mashreq is operated and controlled through the structure and mechanism
adopted in the corporate governance system. The shareholders’ role in governance is to appoint the directors
and the auditors and to assure themselves that an appropriate governance structure is in place. The Board of
Directors is responsible for the governance of the Bank and its responsibilities include setting the company’s
strategic aims, providing the leadership to put them into effect, supervising the management of the business
and reporting to shareholders on their stewardship. The board is also responsible for protecting the rights and
interests of the minority shareholders of the Bank. The board’s actions are subject to laws, regulations and the
decisions of the shareholders made in general meetings.
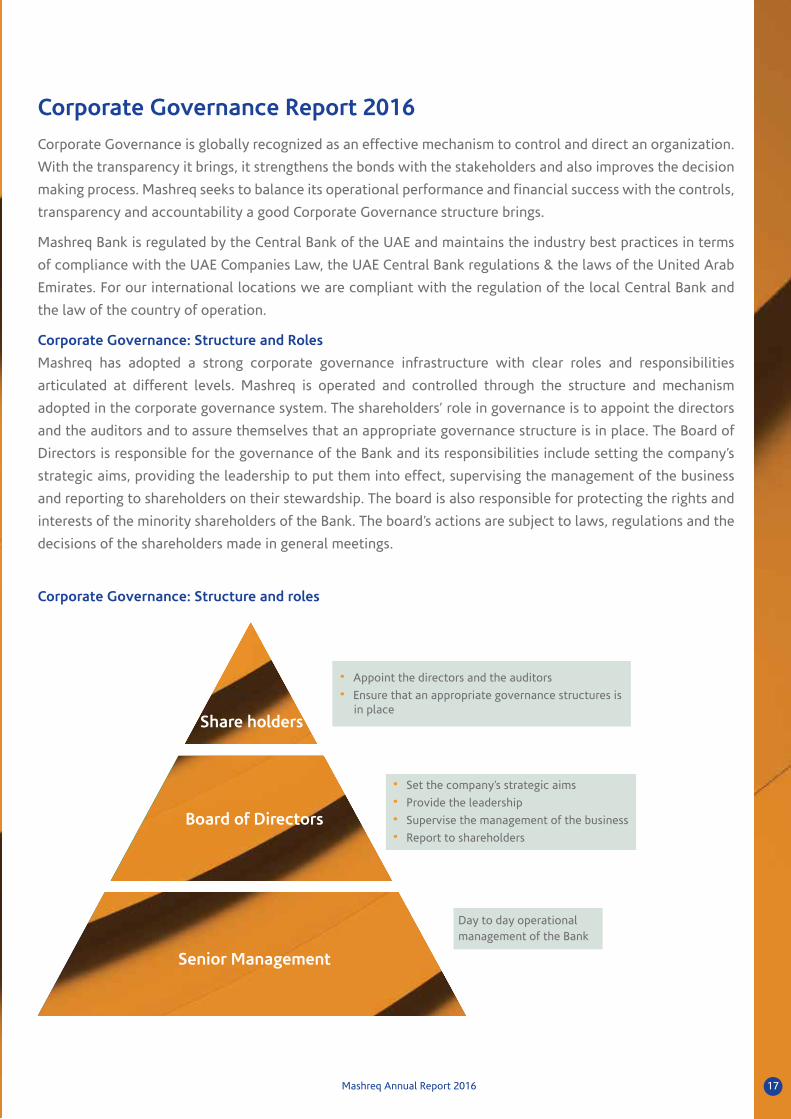
Corporate Governance: Structure and roles
• Appoint the directors and the auditors
• Ensure that an appropriate governance structures is in place
• Set the company’s strategic aims
• Provide the leadership
• Supervise the management of the business
• Report to shareholders
Day to day operationalmanagement of the Bank
Board of Directors
Senior Management
Share holders

Mashreq Annual Report 201618
The Bank’s senior management acts based on clear delegation of authority on administrative, financial and
operational matters based on appropriate policies and manuals. The delegation of authority is judiciously
provided based on experience, performance, track record and the position of individuals. Any misuse of
authority or acts of negligence is highlighted through regular audits and reviews which are escalated up to
board level depending upon the seriousness of the issue.
Corporate Governance Framework
Mashreq Bank’s corporate governance framework is based on well-established policies and procedures that are
documented in applicable charters encompassing stakeholders at different levels. It is supported by detailed
Standard Operating and desktop procedures. The Bank has also adopted a written Code of Conduct & Ethics
document that is signed by all employees and the adherence to the code is monitored closely.
A detailed qualitative disclosure on risk management policy and controls is provided through a separate
note on Pillar-three disclosure which is attached to the annual financial statements. Note 3 and 4 of the
banks consolidated financial statements contain the accounting policies, critical accounting judgements and
key sources of estimation uncertainty. A comprehensive quantitative and qualitative note (Note 43) on risk
management policy is also published along with the annual consolidated financial statements that may be
referred for further information on risk management issues. All of the mentioned disclosures are available
in the bank’s detailed financial statements that are prepared in accordance with the International Financial
Reporting Standards (IFRS) and are posted on the company website on a timely basis.
Board of Directors composition
Currently the bank’s Board consists of six Directors. The Chairman and four Directors are Non-Executive
Directors whereas the CEO is the only Executive Director. Two Directors out of six are independent Directors
and are not related to the major shareholders or the Chairman or the CEO of the Bank. The Executive Director
and CEO is the son of the Chairman of the bank. Another son of the Chairman and one of his nephews are also
members of the Board.
All Directors are elected by the shareholders of the company and have a three year term. The Directors are
well-qualified and experienced professionals who add tremendous value to the overall management capability.
These Directors are successful businessmen in their own right and they also hold very responsible positions in
public life.
All the directors have declared their interest and directorships at the time of joining the Board and their dealings
in the shares of the bank are on full disclosure and arm’s length basis.
The names of the Directors and positions held by them are given below:
Chairman: Abdulla Bin Ahmad Al Ghurair
Vice Chairman: Ali Rashed Ahmad Lootah (Independent)
Director & Chief Executive Officer: H.E. Abdul Aziz Abdulla Al Ghurair
Directors: Sultan Abdulla Ahmed Al Ghurair
Rashed Saif Saeed Al Jarwan (Independent)
Rashed Saif Ahmed Al Ghurair

Mashreq Annual Report 2016 19
The Board of Directors meets at least once every quarter. They have delegated certain powers to the CEO
for effective day-to-day management. All the important management issues are raised by the bank’s senior
management to the Board on a timely basis.
Remuneration of the Board
The Directors are paid an annual fee which is a fixed amount for the year. For 2016, the fee payable is AED 3.25
Million which is 0.17% of the Net Profit.
The Executive Director/CEO is paid a monthly salary and an annual performance bonus.
Board Meetings: The Board of Directors meet minimum once every Quarter. During 2016 Mashreq Board had
five meetings.
Board Committees
The Board has established two Board Committees to assist the Board in carrying out its functions. The roles and
delegated authorities of these Committees are set out in their respective terms of reference documents. The
terms of reference are reviewed and updated regularly.
Audit Committee of the Board: The Audit Committee of the Board consists of the following three Non-
Executive Directors:
1. Sultan Abdulla Ahmed Al Ghurair
2. Rashed Saif Ahmed Al Ghurair
3. Rashed Saif Saeed Al Jarwan
The Audit Committee is responsible for reviewing the financial reporting process as well as conducting an
oversight on the activities and effectiveness of the banks internal and external auditors. The Audit Committee,
during the year, meets the external auditor and the auditors provide them the details of audit process and
findings. They also discuss the auditor’s management letter and the management’s response, as well as,
corrective actions taken. They review the quarterly financials and Annual financial reports of the bank. The
Audit Committee also meet’s the bank’s Head of Audit and Compliance Group to review their charter, scope
of work, and organization structure. The inspection reports from regulators are also presented to the Audit
Committee for their review and action.
Remuneration and Compensation Committee of the Board: The Committee is composed of the following two
Non-Executive Directors:
1. Ali Rashed Ahmad Lootah
2. Rashed Saif Saeed Al Jarwan
This Committee meets as and when required but at least once a year. The main task of the Committee is to
review the reward strategy of the bank and to approve the annual increments and bonus recommended by the
management.

Mashreq Annual Report 201620
Management Committees
The Corporate Governance structure of the bank ensures that there is a clear division of responsibilities
between the board and the executive management. The executive management is responsible for running the
operations of the bank and there are various management committees which have been established by the
Board and have delegated authority to manage the bank’s affairs on day-to-day basis.
The Bank’s Executive Management Committee consists of the CEO and his Direct Reports. This Committee
meets on a monthly basis and addresses the key issues concerning the Bank.
The Executive Management Committee comprises of:
1. CEO
2. Head of Corporate Affairs
3. Head of Corporate Banking
4. Head of International Banking
5. Head of Retail Banking
6. Head of Treasury & Capital Markets
7. Head of Risk Management
8. Head of Operations & Technology
9. Head of Audit & Compliance
The Executive Management Committee has seven sub committees. These sub-committees are specific to a
function and all the concerned functional heads are members of these Committees.
Management sub Committees
(i) The Audit and Compliance Committee - ACC: The ACC considers issues of internal control, internal
audit, and risk identification and meets on a monthly basis. Response gaps to internal audit findings,
if any, are also reviewed by the ACC.
(ii) Asset and Liability Committee – ALCO: The ALCO is responsible for monitoring and managing the
bank’s assets and liabilities with the primary objective of managing liquidity whilst ensuring regulatory
compliance and mitigating interest rate risks. The ALCO meets on a monthly basis.
(iii) Information Security Committee - ISC: The ISC reviews and administers the information security
infrastructure of the bank and meets on a quarterly basis.
(iv) Risk Committee: The Risk Committee is responsible for setting the Bank’s risk policies and programs
and ensuring their adherence. The Committee meets as and when required.
(v) Investment Committee: The primary focus of the Committee is to approve the bank’s investments in
securities. It also reviews the performance of the bank’s investments based on established benchmarks.
The Investment Committee meets on a quarterly basis.

Mashreq Annual Report 2016 21
(vi) Human Resource Committee: The Human Resource Committee is focused on ensuring that the bank
adopts the best practices in the area of people management. It works in coordination with the Human
Resource Division to improve attraction, retention and development of the talent and meets as and
when required
(vii) Technology Steering Committee: The Committee focuses on aligning technology with business strategy
and supports the banks operations in providing transparency and efficiency to the existing systems.
The committee meets on a quarterly basis.
Shari’ah Governance
Mashreq has an Islamic finance company, Mashreq Al Islami (MAI), and a fully embedded Islamic Banking
window within the bank, which offers its clients a complete suite of Shari’ah compliant products and solutions
across the entire banking spectrum. While all our offerings are client centric and follow best market practices,
we ensure that we achieve high standards of Shari’ah compliance. To accomplish this we have engaged top
scholars from the world of Islamic Finance who supervise every step of Islamic product development and its
related contracts. Under the guidance of these esteemed scholars, coupled with robust governance measures
in-house, we endeavor to deliver on our commitment to our clients to provide them with banking solutions in
line with guiding principles of Islamic Finance.
SHARI’AH BOARD MEMBERS
SHEIKH ABDULLAH BIN SULAIMAN AL-MANEA
CHAIRMAN
y Member of the Saudi Forum of Senior Shari’ah Scholars, which advises the government of the Kingdom
of Saudi Arabia and Saudi public on all Islamic issues
y Deputy Chairman, Shari’ah board for Accounting and Auditing Organization for Islamic Financial
Institutions which is the most acclaimed body globally for issuing Shari’ah & Accounting standards
y Served as the President of the courts of the Makkah Al Mukarramah and a Member of Supreme
Judiciary Council of Saudi Arabia
y Member of the Islamic Fiqh Council - Organization of the Islamic Countries and the Islamic Fiqh
Academy, Jeddah
y Serves as an Advisor to several Islamic Financial Institutions including:
› Bahrain Shamil Bank
› National Commercial Bank
› Riyadh Bank
› Bank AlBilad
› The Saudi British Bank
› SABB Takaful Company
› Saudi Investment Bank

Mashreq Annual Report 201622
SHEIKH NIZAM MOHAMMED SALEH YAQUBY
MEMBER
y One of the most influential figures in Islamic finance industry
y Ph.D in Islamic Law and a BA in Economics and Comparative Religion from the McGill University in
Canada
y Member of the Shari’ah board for Accounting and Auditing Organization for Islamic Financial
Institutions
y Board member of 50+ financial institutions as a Shari’ah expert including:
› Abu Dhabi Islamic Bank
› Barclays
› BNP Paribas
› Credit Agricole CIB
› Dow Jones Islamic Index
› HSBC Amanah
› Lloyds TSB
› Citi
› Standard Chartered
› Hilal Bank
DR. MOHAMMED AL-GARI
MEMBER
y PhD in Economics from the University of California
y Professor of Islamic Economics and the former Director of the Centre for Research in Islamic Economics
at King Abdul Aziz University in Saudi Arabia
y Active member of the International Fiqh Academy
y Member of the Shari’ah board for Accounting and Auditing Organization for Islamic Financial
Institutions
y Member of a number of Shari’ah Boards in the GCC, Europe and the United States, including:
› Dow Jones
› International Islamic Fund Market
› Citi Islamic Investment Bank
› Merrill Lynch
› Saudi American Bank.
› HSBC
› Standard Chartered
External Auditors: Deloitte (a member of the Deloitte Touche and Tohmatsu) were appointed external auditors
for Mashreq Group consolidation and parent company audit for the year ended 31st December 2016 by the
shareholders in their meeting held on 28 February 2016.
General: During the year, Mashreq share trading was rather thin and 2,191,526 shares representing 1.2% of
total shares were sold / purchased.
Mashreq Annual Report 2016 23
Basel II Pillar 3
Mashreq Annual Report 2016
Mashreq Annual Report 201624
Contents - Basel II Pillar 3
1. Overview of Basel II Requirements 25
2. Mashreq’s Approach to Pillar 1 26
3. Future Developments 26
4. Scope of Application 27
5. Risk Management Objectives and Policies 28
6. Capital Adequacy and Capital Management 39
7. Credit Risk Exposure by Asset Classes & Risk Weights — Standardised Approach 40
8. Gross Credit Risk Exposure by Asset Classes — Standardised Approach 41
9. Credit Risk Mitigation as per Standardised Approach 42
10. Past Dues, Impaired Loans & Provisions 42
11. Impaired Loans & Investments by Geography 45
12. Market Risk 46
13. Equity Position in Banking Books 46

Mashreq Annual Report 2016 25
1. Overview of Basel II requirements
Basel II Framework
The bank complies with Basel II UAE CB guidelines issued in November 2009. These guidelines are structured
around three pillars specified in Basel II framework of international convergence of capital measurement and
capital standards which are outlined below:
y The first pillar – Minimum Capital Requirements – Defines the way banking institutions calculate
their regulatory capital requirements in order to cover credit risk, market risk and operational risk.
Other risks are not considered fully quantifiable at this stage.
y The second pillar – Supervisory Review Process – Provides national regulators with a framework
to help them assess the adequacy of banks’ internal capital to be used to cover not only credit risk,
market risk and operational risk but also other risks not identified in the first pillar such as systemic
risk, concentration risk, strategic risk, reputational risk, liquidity risk and legal risk, which the accord
combines under the title of residual risk. This risk and capital assessment is commonly referred to as
the Internal Capital Adequacy Assessment Process (ICAAP).
y The third Pillar – Market Discipline – encourages market discipline by developing a set of qualitative
and quantitative disclosure requirements which will allow market participants to make a better
assessment of capital, risk exposure, risk assessment processes, and hence the capital adequacy of
the institution. The requirements of Pillar 3 are fulfilled by this section.
Basel II also provides for different approaches to calculating capital requirements.
Standardised approach — Under this approach, the assets (including off-balance-sheet post-CCF) are classified
into asset types to enable better risk sensitivity. The risk weights used to assess capital requirements against
credit exposures are consistent across the industry.
Internal-ratings-based approach (IRB) — Under this approach, the risk weights are derived from the Bank’s
internal models. The IRB approach is further sub-divided into two alternative applications, Foundation and
Advanced:
Foundation IRB (FIRB) — Under this approach, the banks are allowed to develop their own models to estimate
the PD (probability of default) for individual clients or groups of clients and use supervisory values for LGD
(loss given default) and EAD (exposure at default) estimates. Banks can use this approach only subject to
approval from their local regulators.
Advanced IRB (AIRB) — Under this approach, the banks are allowed to develop their own model to quantify
required capital for credit risk. PD, LGD and EAD can be determined using the Bank’s internal models. Banks
can use this approach only subject to approval from their local regulators.

Mashreq Annual Report 201626
2. Mashreq’s approach to Pillar 1Pillar 1 – Approaches Adopted by Mashreq Bank
Risk Type Current Approach Adopted
Credit Standardised Approach
Market Standardised Approach
Operational Standardised Approach
Pillar 1 Scope
Credit Risk – Standardized Approach
Mashreq Bank is currently using the Standardized Approach for Credit Risk, covering all portfolios including
Financial Institutions, Treasury & Capital Market counterparty risk as well credit risk in the Trading Book. This
approach allows the use of external ratings from designated credit-rating agencies, wherever available, in
determining the appropriate risk weights. The risk weights are determined by the asset class and the external
rating of the counterparty. The net exposure incorporates off-balance-sheet exposures after applying the credit
conversion (CCF) and credit risk mitigation (CRM) factors.
Market Risk – Standardized Approach
Mashreq Bank calculates its market risk capital requirements on the basis of the Standardized Approach for
general and specific interest rate risk, foreign exchange risk, and general and specific equity risk.
Operational Risk – Standardized Approach
For operational risk, Mashreq Bank applies the Standardized Approach. The Operational Risk Framework (ORM)
has been put in place, including a sophisticated IT system to capture and report the large amount of data
required. The Risk and Control Self-Assessment (RCSA) process and related processes are embedded within the
business units across the bank.
3. Future developmentsThe regulation and supervision of financial institutions continues to undergo significant change in response
to the global financial crisis. In December 2010, the Basel Committee issued final rules in two documents: A
global regulatory framework for more resilient banks and banking systems and an international framework for
liquidity risk measurement, standards and monitoring, which together are commonly referred to as ‘Basel III’.
Capital Adequacy as a percentage of RWA
Capital elementExisting As per Basel- II –
Central BankSuggested Ratio as per
Central Bank – Basel III*Ratio as per BASEL III
Common Equity Tier 1 (CET1) NA 7.50% 4.50%
Tier 1 Capital 8% 9% 6%
Capital Adequacy Requirement (CAR)
12% 11% 8%
Capital Conservation Buffer (CCB); using common equity
NA 2.50% 2.50%
Countercyclical buffer (CCyB) NA Upto 2.50% Upto 2.50%
After Capital Conservation Buffer
CET1 - 10.00% 7%
Tier 1 Capital 8% 11.50% 8.50%
CAR 12% 13.50%** 10.50%

Mashreq Annual Report 2016 27
* These ratio were a part of the Consultative paper shared by Central Bank with Local Banks.
** In addition to the requirement for a 13.5% Capital Adequacy Ratio, a countercyclical buffer varying from
0.0% to 2.5% may apply.
In addition, Basel III introduces a minimum 3% leverage ratio and two required liquidity ratios. The Liquidity
Coverage Ratio requires a bank to hold sufficient high quality liquid assets to cover its total net cash flows over
30 days; the Net Stable Funding Ratio requires the available amount of stable funding to exceed the required
amount of stable funding over a one-year period of extended stress.
In May 2015, the Central Bank of the UAE published “Regulations relating to Liquidity at Banks”. Starting on
1 January 2015, minimum liquidity coverage was 60%. This coverage increases by 10% each year to reach
100% by 1 January 2019. The NSFR requirement to be introduced in January 2018 is 100%. The methodology
for estimating the LCR and NSFR is based on an interpretation of the Basel standards and includes a number of
assumptions that are subject to change. Mashreq monitors its position against the anticipated LCR and NSFR
requirements to ensure the Bank’s ability to comply with the standards.
Impact on Mashreq
At the end of 2016, the capital ratio and the Tier 1 ratio of the Bank were 16.86% and 15.95%, respectively.
Additionally, the composition of the Bank’s capital is of high-quality equity based with lesser reliance on Tier 2
capital supply (i.e. hybrid instruments).
4. Scope of ApplicationName of the Credit Institution to which the Requirements apply
The Pillar III disclosure requirements under the new Basel II capital framework are applicable to the group level
of consolidation, namely Mashreq Bank PSC, also known as Mashreq Bank Group, consolidated global banking
operations.
Differences between Accounting and Pillar III Reporting
The scope of consolidation of Pillar III differs from the scope of consolidation of the financial statements which
include the fully consolidated results and balance sheet of Oman Insurance Co, as disclosed in the Mashreq
Bank PSC Annual Report.
Since the information disclosed under Pillar III primarily relates to banking book loans and advances and similar
information, the difference in consolidation and reporting does not materially impact Pillar III disclosure.
Restrictions on the Transfer of Funds & Regulatory Capital
No restrictions, or other major impediments, on the transfer of funds or regulatory capital within the Group
exist.
Securitization Exposure
The bank does not have material securitization exposure(s). Activities are limited to investments in sukuk
issues, most of which are held to maturity, the remainder being immaterial.
Mashreq Annual Report 201628
5. Risk Management Objectives and PoliciesI. Risk Management Overview
Objectives
The main goals of Mashreq Bank’s Risk Management are to oversee the bank’s enterprise-wide risk policies
and guidelines under the guidance of the Board of Directors and the Risk Committee, to establish credit limits
and delegation authorities, to set and manage the risk surveillance function and decision processes and to
implement Group-wide risk assessment methods for each of the bank’s units and operating entities.
Mashreq Bank has implemented an integrated Risk Management platform enabling Risk to manage the bank
as a single portfolio. Sophisticated risk metrics such as probability of default and risk charge are calculated
at transaction and portfolio level, enabling the bank to manage its business based upon long-term risk-return.
Banks investments affected by market fluctuations in Forex, Interest Rates and Equity Prices are managed by
Value at Risk at transaction and portfolio level to assess and manage its risk.
All material risks are assessed in a proactive way within the Enterprise Risk framework. The Risk Appetite
Assessment will integrate Basel II compliant stress scenarios, while comprehensive risk capital management
will ensure an appropriate risk capital allocation at portfolio and transaction level.
Risk Governance
Mashreq Bank’s Risk Governance model defines three types of Committees and one Forum:
y The Risk Committee
y The Assets & Liabilities Committee (ALCO)
y The Investment Committee
y Credit Risk Forum (CRF)
Risk Committee
The Risk Committee concentrates on developing Group-wide policy frameworks for all risk types as well
as managing and monitoring material credit, market and operational risks for the different activities
within Mashreq Bank. They also set the risk appetite for the bank and guide risk management on portfolio
actions and strategy.
ALCO Committee
The ALCO Committee is in charge of monitoring the bank’s liquidity, asset liability mismatch, interest rate
risk and related functions.
Investment Committee
The Investment Committee monitors the credit and investment quality of the bank’s various investment
portfolios and recommends portfolio adjustments as required.
Credit Risk Forum
A Credit Risk Forum, comprising of Risk Management Head, Head of Wholesale Risk, Credit Managers,
Special Assets Managers and Head of Legal, review and discuss credits over a certain threshold and other
credit related issues. Representatives from other Business / product Groups are invited for discussions on
specialized or complex transactions.
Mashreq Annual Report 2016 29
Organization - Risk Management
The Group has set up a strong risk management infrastructure supported by adoption of best practices in the
field of risk management to manage and monitor material risks arising out of its day to day operations.
All risk types can be grouped under the following major headings:
y Credit Risk
y Market Risk
y Operational Risk
y Liquidity Risk
y Other Risks
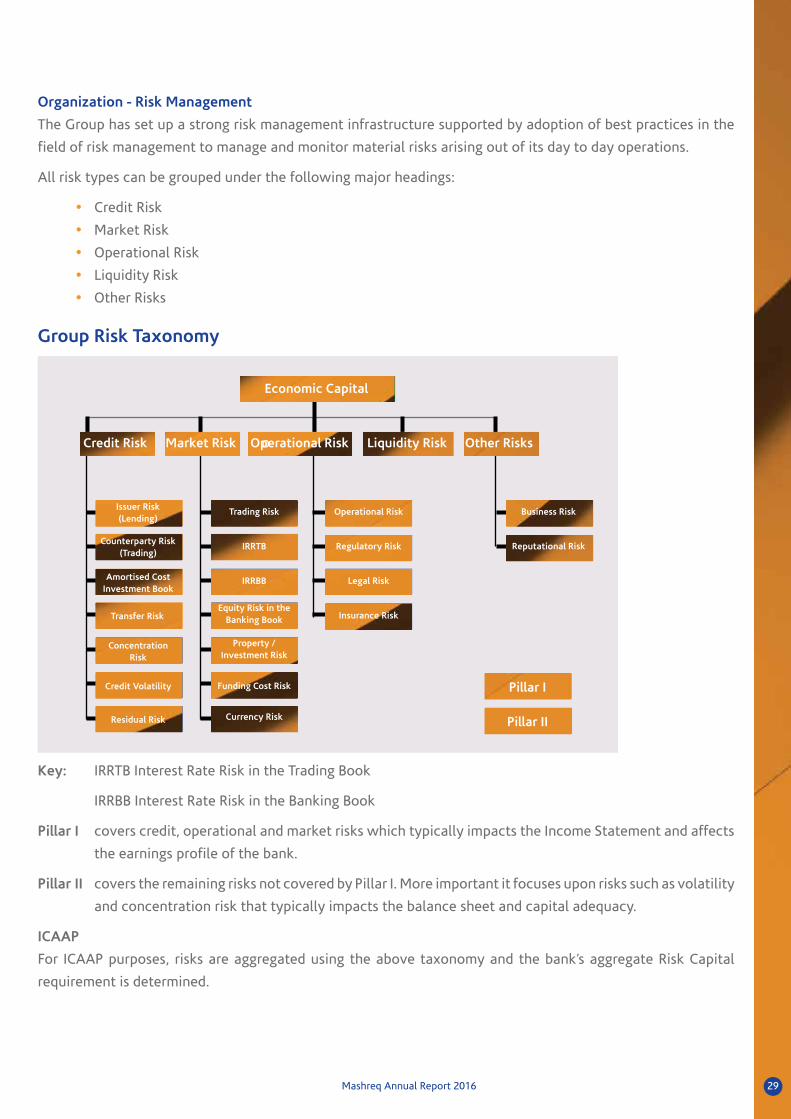
Group Risk Taxonomy
Transfer Risk
Amortised CostInvestment Book
Credit Volatility
Residual Risk
ConcentrationRisk
Counterparty Risk(Trading)
Issuer Risk(Lending)
Trading Risk
IRRTB
IRRBB
Equity Risk in theBanking Book
Property /Investment Risk
Funding Cost Risk
Currency Risk
Operational Risk
Regulatory Risk
Legal Risk
Insurance Risk
Business Risk
Reputational Risk
Credit Risk Market Risk Liquidity Risk Other RisksOperational Risk
Economic Capital
Pillar II
Pillar I
Key: IRRTB Interest Rate Risk in the Trading Book
IRRBB Interest Rate Risk in the Banking Book
Pillar I covers credit, operational and market risks which typically impacts the Income Statement and affects
the earnings profile of the bank.
Pillar II covers the remaining risks not covered by Pillar I. More important it focuses upon risks such as volatility
and concentration risk that typically impacts the balance sheet and capital adequacy.
ICAAP
For ICAAP purposes, risks are aggregated using the above taxonomy and the bank’s aggregate Risk Capital
requirement is determined.

Mashreq Annual Report 201630
Mashreq has the following ICAAP quantitative models:
y Credit Risk (including the concentration risk)
y Market Risk
› Trading and equity risk
› Funding cost risk
› Interest Rate Risk in the Banking Book
y Operational Risk
y Business Risk
Risk Management Framework
The Board of Directors (the “BOD”) has overall responsibility for the establishment and oversight of the Group’s
risk management framework and they are assisted by various committees including the Risk Committee, Assets
and Liabilities Committee (ALCO) and Investment Committee etc., who work under the mandate of the BOD.
These committees approve risk management policies of the Bank developed by the Risk Management Group.
The Risk Committee has overall responsibility for the oversight of the risk management framework and the risk
appetite of the Group. The Risk Committee is responsible for the approval of credit policies and procedures
of the Group and to ensure adherence to the approved policies and close monitoring of different risks within
the Group. The Risk Committee also monitors and establishes various concentration limits, approves policy
exceptions and monitors periodic portfolio reviews to ascertain asset quality.
The Risk Management Group function is independent of the business groups and is led by a qualified Risk
Management Head, with enterprise-wide responsibility for the function. The Risk Management Group is
responsible for formulating policies to manage credit, market and operational risk. Experienced and trained Risk
Managers have delegated authority within the risk management framework to approve credit risk transactions
and monitor market and operational risks.
The Audit, Fraud and Compliance Group (AFCG) is independent of Risk Management. Audit provides independent
assurance to stakeholders and senior management on compliance with all credit policies and procedures in
the Bank and the effectiveness of credit management processes. This is undertaken by a periodic review of all
risk-taking units, in addition to Risk Management. AFCG reports directly to the CEO.
Risk Analytics and Modelling
Mashreq has robust metrics in place for determining Probability of Default (“PD”), Loss Given Default (“LGD”),
and Exposure at Default (“EAD”) variables. The Basel Risk Analytics and Modelling Unit within Risk Management
Group is responsible as per Basel II guidelines for periodically validating various risk rating models including
recalibration of PD, LGD and EAD parameters.
The Internal Capital Adequacy Assessment Process (ICAAP) and the Stress Testing team within Risk Management
Group is responsible for calculating the Group’s economic capital requirement and managing the Group’s
ICAAP. This entails monitoring the Group’s capital adequacy under a variety of stressed scenarios to assess and
report the impact upon the Group’s capital buffer (measured as available capital less risk capital demand) and
recommending appropriate actions, as required.

Mashreq Annual Report 2016 31
As part of its analysis of portfolio pressure points, the Group carries out periodic stress testing to its entire
portfolio and takes appropriate action to (i) mitigate risks arising out of specific obligors or industries and/or
due to global risk events and their implications on the Group’s client base, and (ii) determine portfolio direction
and resource allocation accordingly.
Different credit underwriting procedures are followed for commercial and institutional lending, and retail
lending, as described below.
II. Credit Risk Management
Credit risk is the risk that a customer or counterparty to a financial asset fails to meet its contractual obligations
and cause the Group to incur a financial loss. It arises principally from the Group’s loans and advances, dues
from banks and financial institutions and non-trading investment activities.
Credit risk is actively managed and monitored in accordance with defined credit policies and procedures. The
creditworthiness of each counter party is evaluated and appropriate credit limits are established through
adoption of prudent credit structures relevant to the credit risk. To reduce individual counterparty credit risk,
the Group ensures that, whenever necessary, loans are secured by acceptable form of collateral. The Group
uses an internal risk rating system to assess the credit quality of corporate borrowers and counterparties. Each
corporate performing borrower is assigned an internal rating between MRS 1 to MRS 25 and non-performing
borrowers are assigned ratings of non-accrual under restructuring (NAUR), substandard, doubtful and loss.
The Group also calculates the Risk Adjusted Return on Capital (RAROC) for credit applications that are priced
on a risk-adjusted basis. RAROC calculations are also built into the Credit Appraisal System.
All credit policies are reviewed and approved by the Group’s Risk Committee. The policies are reviewed regularly
to reflect changes in market conditions or regulatory requirements.
Whenever possible, loans are secured by acceptable forms of collateral in order to mitigate credit risk. Credit
risk is also mitigated through adoption of prudent credit structures relevant to the credit risk. The Group
further limits risk through diversification of its assets by geography and industry sectors.
Wholesale Credit Risk Management
All credit applications for commercial and institutional lending are subject to the Group’s credit policies,
underwriting standards and industry caps (if any) and to regulatory requirements, as applicable from time to
time. The Group does not lend to companies operating in industries that are considered by the Group inherently
risky or speculative.
Limit setting is based on a combination of factors, including a detailed evaluation of each customer’s
creditworthiness based on proven performance, industry, management and financial analysis (both historical
and projected), risk rating, and analysis of facilities (tenor & types of facilities, pricing, collateral and support).
The Wholesale Credit Risk Management team centrally approves all credit facilities and limits for all corporate,
treasury and capital markets, financial institutions and SME clients of the Group. All credit lines or facilities
extended by the Group are granted subject to prior approval pursuant to a set of delegated credit authority
limits as recommended by the Risk Management Head in line with the Wholesale Credit Policy, and approved
by the Group’s Chief Executive Officer (the “CEO”). A Credit Risk Forum, comprising of Risk Management Head,
Head of Wholesale Risk, Credit Managers, Special Assets Managers and Head of Legal, review and discuss
credits over a certain threshold and other credit related issues. Representatives from other Business / product
Groups are invited for discussions on specialized or complex transactions.
Mashreq Annual Report 201632
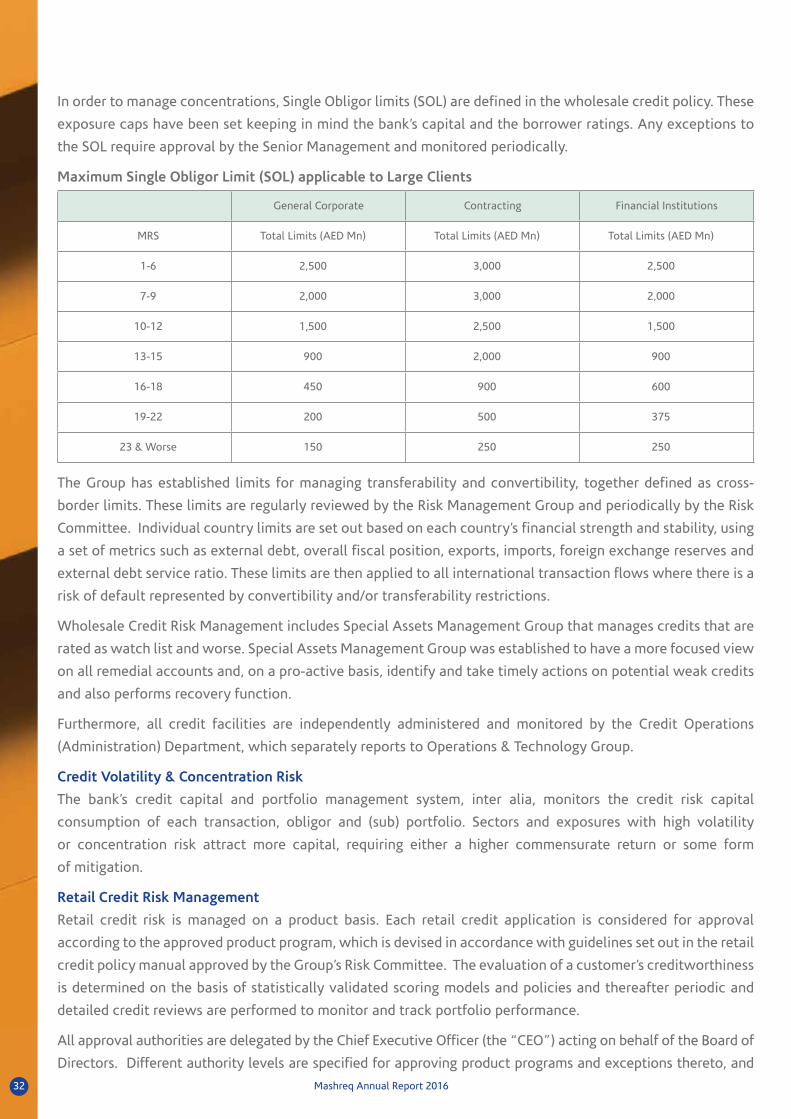
In order to manage concentrations, Single Obligor limits (SOL) are defined in the wholesale credit policy. These
exposure caps have been set keeping in mind the bank’s capital and the borrower ratings. Any exceptions to
the SOL require approval by the Senior Management and monitored periodically.
Maximum Single Obligor Limit (SOL) applicable to Large Clients
General Corporate Contracting Financial Institutions
MRS Total Limits (AED Mn) Total Limits (AED Mn) Total Limits (AED Mn)
1-6 2,500 3,000 2,500
7-9 2,000 3,000 2,000
10-12 1,500 2,500 1,500
13-15 900 2,000 900
16-18 450 900 600
19-22 200 500 375
23 & Worse 150 250 250
The Group has established limits for managing transferability and convertibility, together defined as cross-
border limits. These limits are regularly reviewed by the Risk Management Group and periodically by the Risk
Committee. Individual country limits are set out based on each country’s financial strength and stability, using
a set of metrics such as external debt, overall fiscal position, exports, imports, foreign exchange reserves and
external debt service ratio. These limits are then applied to all international transaction flows where there is a
risk of default represented by convertibility and/or transferability restrictions.
Wholesale Credit Risk Management includes Special Assets Management Group that manages credits that are
rated as watch list and worse. Special Assets Management Group was established to have a more focused view
on all remedial accounts and, on a pro-active basis, identify and take timely actions on potential weak credits
and also performs recovery function.
Furthermore, all credit facilities are independently administered and monitored by the Credit Operations
(Administration) Department, which separately reports to Operations & Technology Group.
Credit Volatility & Concentration Risk
The bank’s credit capital and portfolio management system, inter alia, monitors the credit risk capital
consumption of each transaction, obligor and (sub) portfolio. Sectors and exposures with high volatility
or concentration risk attract more capital, requiring either a higher commensurate return or some form
of mitigation.
Retail Credit Risk Management
Retail credit risk is managed on a product basis. Each retail credit application is considered for approval
according to the approved product program, which is devised in accordance with guidelines set out in the retail
credit policy manual approved by the Group’s Risk Committee. The evaluation of a customer’s creditworthiness
is determined on the basis of statistically validated scoring models and policies and thereafter periodic and
detailed credit reviews are performed to monitor and track portfolio performance.
All approval authorities are delegated by the Chief Executive Officer (the “CEO”) acting on behalf of the Board of
Directors. Different authority levels are specified for approving product programs and exceptions thereto, and
Mashreq Annual Report 2016 33
individual loans and credits under product programs. Each product program contains detailed credit criteria (such
as customer demographics and income eligibility) and regulatory, compliance and documentation requirements,
as well as other operating requirements. Credit authority levels are also captured in the Product Program.
Residual Credit Risk Management
Residual risk primarily arises as a result of insufficient collateral recovery or mitigation in the event of default.
The bank has developed internal risk models, which include a residual recovery rate that is reviewed at
least once annually, (more frequently in the case of downturns), the results of which are incorporated in the
risk charge.
Consequently the bank is compensated for residual risk through the risk charge applied to the business and
ultimately the client.
Basel II Implementation
During the period 2005 onwards, major emphasis was placed upon developing Pillar I compliant risk rating
models (PD, LGD and EL) and the development of a portfolio management system centered upon Pillar I risk
metrics. In due course it is the bank’s intention to migrate from the Standardized Approach to the IRB approach
for credit risk.
A Pillar II economic capital platform has been developed that provides effective bottom – up capital assessment
and portfolio management. Risk adjusted capital allocation and pricing has been introduced enabling the bank
to determine risk adjusted customer level profitability.
y Wholesale
All Basel related metrics are generated by a stand-alone IT system independently controlled by the Model
Development & Capital Management Unit.
Wholesale has been involved in a project to integrate its Risk Management IT requirements to provide a seamless
data solution from transaction origination through to web-based portfolio reporting and to consolidate all data
onto a single platform.
y Retail
Data is generated from the core banking system and SAS is used for Basel II analytical purposes. The bank has
invested in a new core banking system (I-Flex) that will provide the foundation for effective data management
in future years.
Scorecards are validated on an annual basis to ensure that calculation of risk metrics, based upon up-to-date
scorecards and data was completed recently.
Data Management
y Wholesale
A team of data input specialists has been employed since the inception of model building and validation in
2005. Their specific function is to check credit applications, rating sheets and related documentation, monitor
data accuracy, and reconcile and clean data as required.
y Retail
All data is reconciled with the general ledger at a portfolio aggregate level to ensure accuracy and completeness.
Historical data has been archived since Jan 2007 for all scored products and is housed in a SQL Data mart.
Mashreq Annual Report 201634
III. Management of Market & Related Risks
Market Risk Management
Market Risk is the risk that fair value or cash flows of financial instruments held by Mashreq Group, or its
income may be adversely affected by movement in market factors such as interest rates, credit spreads, foreign
exchange rates, equity and commodity prices.
Market Risk at Mashreq Bank is governed by a comprehensive control framework as defined by the approved
Market Risk Policy. This function is completely independent of the business. The Market Risk Function reports
to the Head of Risk Management.
Market risk arises from the Group’s trading and non-trading activities. The Market Risk Management function
primarily addresses risks arising from trading activities. Interest risk exposure arising from non-trading activities
is managed by the Assets & Liabilities Committee (ALCO). Trading risks are concentrated in Treasury and Capital
Markets (TCM) and are managed by a solid framework of market risk limits that reflect the Group’s market
risk appetite. Limits are placed on position sizes, stop loss levels, as well as on market factor sensitivities.
A comprehensive risk reporting framework is in place where by, the positions are monitored daily against
the established limits and monitoring reports are circulated to the Market Risk Management team and the
respective Business Heads. In case of a limit exception, corrective action is taken in line with the Market Risk
Policy and the concerned trading desk’s limits package.
Each trading desk has a Permitted Product List comprising of products and structures which have been
determined to be appropriate for the TCM desk to trade. Any addition to this list is made after approval from
the TCM Product Policy Committee which assesses the risks associated with the product and verifies that they
can be controlled effectively prior to approving the product. The bank uses Value at Risk (VaR) methodology as
its core analytical tool to assess risks across proprietary trading desks. VaR is an estimate of the potential losses
arising in a portfolio over a specified time horizon due to adverse changes in underlying market factors. The
Bank calculates its one-day VaR at a 99% confidence interval using Monte Carlo Simulations approach across
its trading portfolio. Value at Risk framework is supplemented by other limits and sensitivity triggers.
Stress testing is conducted by generating extreme, but plausible scenarios, such as significant movements in
interest rates, credit spreads, etc. and analyzing their effect on the Group’s trading positions.
Liquidity Risk Management
Liquidity Risk is the risk that the Group’s entities in various locations and in various currencies will be unable to
meet a financial commitment to a customer, creditor, or investor when due.
Management of Liquidity Risk
Senior management’s focus on liquidity management is to:
y Better understand the various sources of liquidity risk, particularly under stressed conditions.
y Develop effective contingency plans.
y Develop a comprehensive approach to management of liquidity risk to ensure that it is line with the
Group’s overall risk appetite.
y Improve resilience to a sharp decline in market liquidity and to demonstrate that the bank can survive
the closure of one or more funding markets by ensuring that finance can be readily raised from a
variety of sources.
Mashreq Annual Report 2016 35
The Assets and Liabilities Committee (“ALCO”) has a broad range of authority delegated by the Board of Directors
to manage the Group’s asset and liability structure and funding strategy. ALCO meets on a monthly basis or
more often as circumstances dictate to review liquidity ratios, asset and liability structure, interest rate and
foreign exchange exposures, internal and statutory ratio requirements, funding gaps and general domestic and
international economic and financial market conditions. ALCO formulates liquidity risk management guidelines
for the Group’s operation on the basis of such review.
To measure and monitor its liquidity, the Group uses various indicators including the regulatory ratio of
Utilization of Funds to Stable Resources. Other indicators include Advances to Deposits, liquid assets to total
assets ratios, deposit concentration risk indicators, plus liquid assets ratio / liquidity coverage ratio as per UAE
Central Bank.
The funding centre is responsible for managing liquidity and it follows strict guidelines for deployment of liquid
assets within each liquidity bucket. Periodic stress tests are performed to ensure the availability of funds during
stressed situations. Inter-bank borrowing lines and repo facilities with global banks are part of the contingency
funding options maintained by the Treasury.
Liquidity Concentration Risk
All the banks in the UAE are subject to high depositor concentration. Over the years, the Group has successfully
introduced various cash managed products and retail savings’ schemes which have enabled it to mobilize low
cost, broad base deposits, as well as increasing the tenor of deposits.
Asset Liability Mismatch (ALM) Risk Management
The Asset Liability Mismatch (“ALM”) risk arises through the structural mismatch between liquid assets and
liabilities on the banking book.
A Liquidity Contingency Funding Plan has been formulated within the ICAAP framework. The Contingency
Funding Plan is based upon the actual measures that the bank took during the 2008/9 crisis to improve its
liquidity position. These measures included:
(1) Reducing the Advances-to-Deposit ratio to very conservative norms, well below the 100%
threshold generally used as a benchmark
(2) Doubling the bank’s Liquid Asset: Total Asset ratio to very conservative levels to ensure that
short term net outflows could be more than matched by the prompt monetization of liquid
assets. The large majority of the bank’s liquid assets are high quality, consisting of cash and Central
Bank CDs
(3) Reducing undrawn committed exposures
(4) Monitoring and reducing other sources of contingent outflows
(5) Reducing tenors where applicable
(6) Re-pricing transactions for market disruption
(7) Winding down off balance sheet exposures with the potential to become on balance sheet

Mashreq Annual Report 201636
Liquidity Measurement and Management within the Internal Capital Adequacy Assessment Process (ICAAP)
Major emphasis has been placed on addressing the liquidity requirements formulated within the Basel III
framework - the Liquidity Coverage Ratio (LCR) and the Net Stable Funding Ratio (NSFR).
As part of the ICAAP a Liquidity Risk Tolerance Statement has been developed, which, together with the bank’s
Risk Appetite & Risk Capacity Statement, provide a sound foundation for Strategic Planning & Management
Reporting.
During the annual planning process, the business plan is used to determine future liquidity and capital
requirements, which are then compared with the bank’s funding capacity to ensure an acceptable liquidity gap
profile is targeted.
Interest Rate Risk Management
Pillar I covers interest rate risk in the trading book and treats it as a market risk confined primarily to Treasury
and Capital Market (TCM) trading book.
Pillar II covers the broader issue of interest rate risk in the banking book, which is an enterprise risk.
y Interest Rate Risk in the Trading Book (IRRTB)
IRRTB is primarily derived from the debt securities portfolio, interest rate swaps, and a very small bond futures
portfolio.
For Pillar I measurement purposes the bank has adopted the maturity method and is using the methodology
and table specified in paragraph 718(iv) of the International Convergence of Capital Measurement and Capital
Standards framework (The Basel II Accord).
y Interest Rate Risk in the Banking Book (IRRBB)
The core of Mashreq Bank’s business is usually based on accepting customer deposits and/or borrowing from
the market for a range of maturities and lending at a higher interest rate for varying maturities in order to earn
a margin (the so called net interest margin). Abrupt or large changes in the interest rate curve can affect the
profitability of a bank significantly as it directly affects this margin.
Equity Risk in the Banking Book
Equity Risk in the Banking Book arises from the possibility that changes in equity & indices market prices can
adversely affect the value of stocks and securities held by the Bank.
Property & Investment Risk Management
This risk applies to properties owned by the bank and long-term investments in subsidiaries, associates and
other investments. The risk attached to volatility in all other investments is captured under Market Risk.
The bank is not exposed to material property or investment risk since its material properties and investments
are either not intended for disposal or held to maturity.
For economic capital purposes the capital requirement for investment will be based on general market risk factors.
Currency Risk Management
Currency risk represents the risk of change in the value of financial instruments due to changes in foreign
exchange rates. The exchange rate of the AED against the US Dollar has been pegged since November 1980
and the Group’s exposure to currency risk is limited to that extent. The majority of the bank’s spot positions are
USD Dollar denominated; any other material spot positions are denominated in GCC currencies which are also
pegged to the US Dollar.
Mashreq Annual Report 2016 37
The bank performs short term partial hedges on its USD positions and carries some USD position risk as it has
a fixed parity.
IV. Management of Operational & Related Risks
Operational risk:
Operational risk is risk of loss resulting from inadequate or failed internal processes, systems, people or
from external events. Mashreq’s Operational risk policy outlines the approach and governance structure for
monitoring and managing of operational risk.
Governance:
Whilst the Bank cannot eliminate all operational risks, it has developed a comprehensive framework of
identifying, assessing, controlling, mitigating, monitoring and reporting Operational risk.
Operational risk management follows three lines of defence model;
y Business units form the first line of defence. They own the risk and have direct responsibility managing
operational risk in their respective areas.
y Group Operational risk team is the second line of defence which provides policy, tools and infrastructure
to assist business units in managing their risks.
y Internal Audit is the third line of defence who provides independent assurance on the effectiveness
of the risk management process.
The Board has oversight responsibilities for operational risk management. These responsibilities are exercised
through the Risk management committee, which is the senior Management forum responsible for the oversight
of Operational Risk.
Regulatory capital requirement for operational risk capital is calculated annually. Mashreq has adopted the
Standardized approach in determining its operational risk capital requirements. The capital charge for the year
ended 31 December 2016 was AED 1,244,151 thousand (2015: AED 1,122,964 thousand).
Risk identification, monitoring and reporting
Mashreq’s Operational risk framework consist of tools that assist in managing and measuring operational risk
including;
Risk and control self-assessment (RCSA)
RCSA is the process of identifying, recording and assessing potential risks and related controls.
It provides a framework and tools for management to:
(a) Assess and manage key risks
(b) Testing the effectiveness of controls
(c) Developing action plans
(d) Identify and prioritize their business objectives
Incident management
The reporting of Operational risk incidents is a critical component of Mashreq’s Operational risk management
framework. This ensures greater risk transparency across the organisation and helps to identify gaps and
facilitate timely remedial action for potential risk exposures.

Mashreq Annual Report 201638
V. Other risks
Regulatory Risk
Regulatory risk primarily emanates from changes in Banking laws and regulations which impact the banking
business in specific market, or on other hand where bank ends up offering products or applying internal
procedures / processes which are not in line with the respective regulatory requirements, thus resulting in
significant regulatory action against the bank, which may include withdrawal of license or restriction to
conduct certain business.
Due to global nature of banking business, apart from banking laws and regulations at home country, there is
bearing to certain degree of overseas regulations due to their extra-territoriality, which may expose the bank
to regulatory risk as well as reputational risk. This can be managed by having a strong compliance culture in
the bank along with practicing best practices in corporate governance.
Legal Risk
Legal risk is managed through strict corporate governance, reporting, legal and compliance guidelines, as well
as operational risk identification and control. The bank has in recent years completed an extensive review
of loan and security documentation to mitigate legal risk and ensure standardization of documentation in
accordance with best practice and legal policy guidelines.
Reputation Risk
Reputation risk is the risk of loss due to the deterioration of Mashreq Bank’s reputation. This risk is managed
through strong corporate governance and compliance rules and stringent internal controls within the Group.
Business Risk Management
Business Risk is the risk caused by uncertainty in profits due to changes in the competitive environment that
damage the franchise or operational economics of a business. Business Risk comprises two distinct elements –
new business and in-force business.
y New business acquisition (expected volumes, margins and costs from business yet to be written).
y Existing business (expected volumes, margins and costs from business that has already been written).
Business Risk for new business acquisition is defined as the risk of loss (to the relevant confidence level and
over the framework time horizon) caused by the potential for new business volumes and margins to fail to
cover the expense base.
Business Risk for the existing book is defined as the risk of loss caused by a decline in business volumes due to
competitive, recessionary or other conditions.
For new business, the worst case scenario is that no new business is generated, but fixed and set up costs are
incurred. In the current environment, the bank is not contemplating any substantial new ventures; consequently
the risk is not material.
For existing business, a detailed ongoing review of all business units is conducted to assess whether marginally
performing units should be rationalized or closed.
During the downturn in recent years, the bank has taken significant steps to improve its efficiency ratios,
primarily through a reduction in overhead costs.
Quantifying Business Risk
For economic capital purposes, Business Risk is quantified by assessing the volatility of gross income and
expenses at a 99.9% confidence level.
Mashreq Annual Report 2016 39
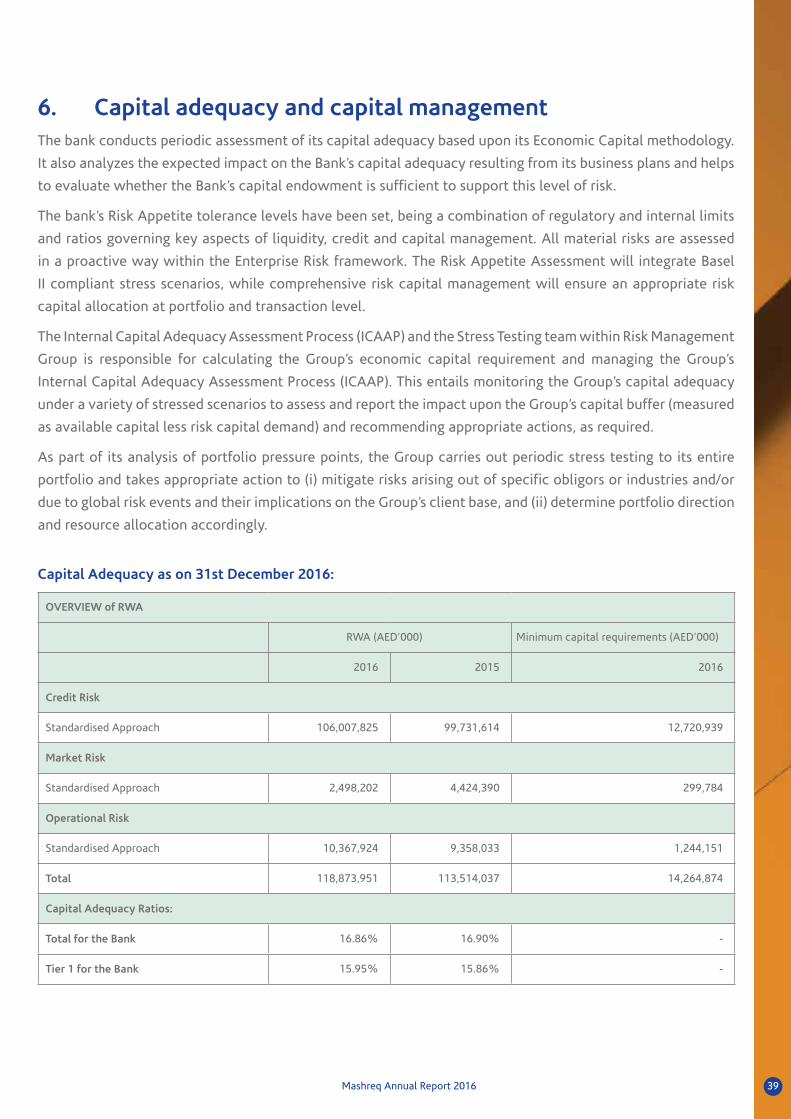
6. Capital adequacy and capital managementThe bank conducts periodic assessment of its capital adequacy based upon its Economic Capital methodology.
It also analyzes the expected impact on the Bank’s capital adequacy resulting from its business plans and helps
to evaluate whether the Bank’s capital endowment is sufficient to support this level of risk.
The bank’s Risk Appetite tolerance levels have been set, being a combination of regulatory and internal limits
and ratios governing key aspects of liquidity, credit and capital management. All material risks are assessed
in a proactive way within the Enterprise Risk framework. The Risk Appetite Assessment will integrate Basel
II compliant stress scenarios, while comprehensive risk capital management will ensure an appropriate risk
capital allocation at portfolio and transaction level.
The Internal Capital Adequacy Assessment Process (ICAAP) and the Stress Testing team within Risk Management
Group is responsible for calculating the Group’s economic capital requirement and managing the Group’s
Internal Capital Adequacy Assessment Process (ICAAP). This entails monitoring the Group’s capital adequacy
under a variety of stressed scenarios to assess and report the impact upon the Group’s capital buffer (measured
as available capital less risk capital demand) and recommending appropriate actions, as required.
As part of its analysis of portfolio pressure points, the Group carries out periodic stress testing to its entire
portfolio and takes appropriate action to (i) mitigate risks arising out of specific obligors or industries and/or
due to global risk events and their implications on the Group’s client base, and (ii) determine portfolio direction
and resource allocation accordingly.
Capital Adequacy as on 31st December 2016:
OVERVIEW of RWA
RWA (AED’000) Minimum capital requirements (AED’000)
2016 2015 2016
Credit Risk
Standardised Approach 106,007,825 99,731,614 12,720,939
Market Risk
Standardised Approach 2,498,202 4,424,390 299,784
Operational Risk
Standardised Approach 10,367,924 9,358,033 1,244,151
Total 118,873,951 113,514,037 14,264,874
Capital Adequacy Ratios:
Total for the Bank 16.86% 16.90% -
Tier 1 for the Bank 15.95% 15.86% -

Mashreq Annual Report 201640
7. Credit Risk Exposure by Asset Classes & Risk Weights - Standardised Approach as at 31 December 2016
CREDIT RISK EXPOSURE BY ASSET CLASSES & RISK WEIGHTS — STANDARDISED APPROACH
(AED’000)
0% 20% 35% 50% 75% 100% 150%
Net credit exposures amount
(post CCF and post-CRM)
Sovereigns 19,527,022 557,036 - 97,228 - 2,498,554 - 22,679,840
Non-commercial public sector enterprises (PSEs) 212,037 - - - - - - 212,037
Multilateral development banks (MDBs) - - - - - - - -
Banks 605,600 5,908,171 - 13,568,005 - 6,460,610 617,080 27,159,466
Securities firms - - - - - - - -
Government-related entities (GREs) & other Corporates 2,939,969 582,679 - 2,813,291 - 54,759,480 103,466 61,198,885
Regulatory retail portfolios - - - - 9,526,021 2,098,129 - 11,624,150
Secured by residential property - - 4,525,888 - - 1,485,344 - 6,011,232
Secured by commercial real estate 1,213 - - - - 12,995,839 - 12,997,052
Past-due loans 9,304 - - - - 590,762 512,073 1,112,139
Higher-risk categories - - - - - - 290,713 290,713
Other assets 2,341,265 - - - - 3,830,447 - 6,171,712
Securitised assets - - - - - - - -
Credit derivatives (banks selling protection) 1,175,360 - - 40,403 - 606,045 - 1,821,808
Total 26,811,770 7,047,886 4,525,888 16,518,927 9,526,021 85,235,210 1,523,332 151,279,034
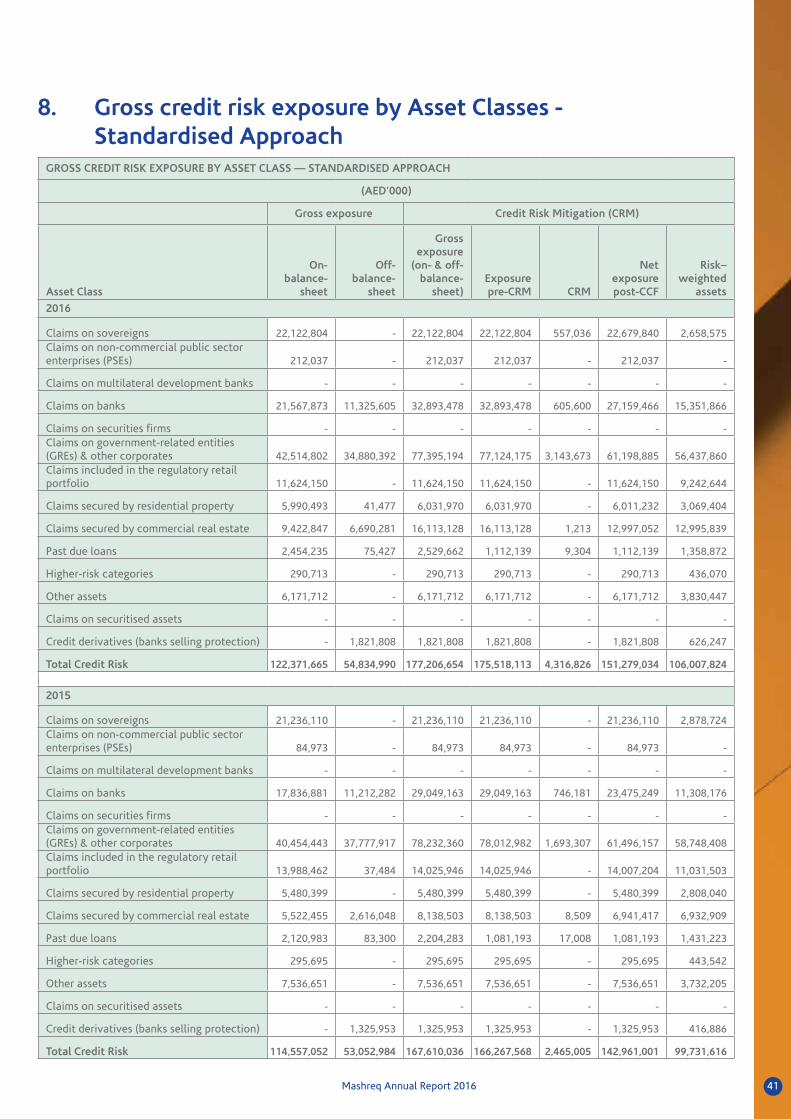
Mashreq Annual Report 2016 41
8. Gross credit risk exposure by Asset Classes - Standardised Approach
GROSS CREDIT RISK EXPOSURE BY ASSET CLASS — STANDARDISED APPROACH
(AED’000)
Gross exposure Credit Risk Mitigation (CRM)
Asset Class
On-balance-
sheet
Off-balance-
sheet
Gross exposure
(on- & off- balance-
sheet)Exposure pre-CRM CRM
Net exposure post-CCF
Risk–weighted
assets
2016
Claims on sovereigns 22,122,804 - 22,122,804 22,122,804 557,036 22,679,840 2,658,575 Claims on non-commercial public sector enterprises (PSEs) 212,037 - 212,037 212,037 - 212,037 -
Claims on multilateral development banks - - - - - - -
Claims on banks 21,567,873 11,325,605 32,893,478 32,893,478 605,600 27,159,466 15,351,866
Claims on securities firms - - - - - - - Claims on government-related entities (GREs) & other corporates 42,514,802 34,880,392 77,395,194 77,124,175 3,143,673 61,198,885 56,437,860 Claims included in the regulatory retail portfolio 11,624,150 - 11,624,150 11,624,150 - 11,624,150 9,242,644
Claims secured by residential property 5,990,493 41,477 6,031,970 6,031,970 - 6,011,232 3,069,404
Claims secured by commercial real estate 9,422,847 6,690,281 16,113,128 16,113,128 1,213 12,997,052 12,995,839
Past due loans 2,454,235 75,427 2,529,662 1,112,139 9,304 1,112,139 1,358,872
Higher-risk categories 290,713 - 290,713 290,713 - 290,713 436,070
Other assets 6,171,712 - 6,171,712 6,171,712 - 6,171,712 3,830,447
Claims on securitised assets - - - - - - -
Credit derivatives (banks selling protection) - 1,821,808 1,821,808 1,821,808 - 1,821,808 626,247
Total Credit Risk 122,371,665 54,834,990 177,206,654 175,518,113 4,316,826 151,279,034 106,007,824
2015
Claims on sovereigns 21,236,110 - 21,236,110 21,236,110 - 21,236,110 2,878,724 Claims on non-commercial public sector enterprises (PSEs) 84,973 - 84,973 84,973 - 84,973 -
Claims on multilateral development banks - - - - - - -
Claims on banks 17,836,881 11,212,282 29,049,163 29,049,163 746,181 23,475,249 11,308,176
Claims on securities firms - - - - - - - Claims on government-related entities (GREs) & other corporates 40,454,443 37,777,917 78,232,360 78,012,982 1,693,307 61,496,157 58,748,408 Claims included in the regulatory retail portfolio 13,988,462 37,484 14,025,946 14,025,946 - 14,007,204 11,031,503
Claims secured by residential property 5,480,399 - 5,480,399 5,480,399 - 5,480,399 2,808,040
Claims secured by commercial real estate 5,522,455 2,616,048 8,138,503 8,138,503 8,509 6,941,417 6,932,909
Past due loans 2,120,983 83,300 2,204,283 1,081,193 17,008 1,081,193 1,431,223
Higher-risk categories 295,695 - 295,695 295,695 - 295,695 443,542
Other assets 7,536,651 - 7,536,651 7,536,651 - 7,536,651 3,732,205
Claims on securitised assets - - - - - - -
Credit derivatives (banks selling protection) - 1,325,953 1,325,953 1,325,953 - 1,325,953 416,886
Total Credit Risk 114,557,052 53,052,984 167,610,036 166,267,568 2,465,005 142,961,001 99,731,616

Mashreq Annual Report 201642
9. Credit Risk Mitigation as per Standardized ApproachCREDIT RISK MITIGATION AS PER STANDARDIZED APPROACH
(AED’000)
31-Dec-16 31-Dec-15
Exposure before Credit Risk Mitigation 155,595,859 145,426,004
Exposure covered by on-balance sheet netting - -
Exposure covered by eligible financial collateral 3,759,789 2,465,004
Exposure covered by guarantees 557,036 -
Exposure covered by credit derivatives - -
Net exposure after Credit Risk Mitigation 151,279,034 142,961,000
10. Past Due and Impaired Loans & ProvisionsDefinitions of Past Due and Impaired Loans / Provisions
Past Due Loans and Securities
For recognition of past due loans and securities as non-performing, the bank uses the same methodology
employed by Basel II:
y The loan, in full or in part, is past due by 90 days or more. Past due includes failure to service the
interest.
y The bank deems that there is reasonable doubt that the loan will be recovered in full, or in part,
or that the client will be able to service the debt, without recourse to collateral.
The unsecured portion of any loan (other than a qualifying residential mortgage loan) that is past due for more
than 90 days, net of specific provisions (including partial charge-offs), is risk weighted as follows:
y 150% risk weight when specific provisions are less than 20% of the outstanding amount of the loan;
y 100% risk weight when specific provisions are 20% and above of the outstanding amount
of the loan.
Past Due, but not Impaired, Loans and Securities
Past due but not impaired loans and other financial assets are those loans and other financial assets where
contractual interest or principal payments are past due. Very often these overdues are only for a few days and
do not reflect fundamental weaknesses. On these classes of assets the Group believes that specific impairment
is not appropriate at the current condition on the basis of the level of security or collateral available and/or the
stage of collection of amounts owed to the Group.
Impairment / Provisions
The Group establishes an allowance for impairment losses that represents its estimate of incurred losses in its
loan portfolio. The main components of this allowance are a specific loss component that relates to individually
significant exposures, and a collective impairment allowance established for the statistical possibility that
some of these loan may get impaired in future.
The Group also complies with International Accounting Standards 39 (IAS 39) in accordance with which it
assesses the need for any impairment losses on its loans portfolio by calculating the net present value using
the original effective interest rate of the expected future cash flows for each loan or its recoverability based
on either collateral value or the market value of the asset where such price is available.

Mashreq Annual Report 2016 43
Specific Provisioning
Impairment of financial assets
Financial assets, other than those at Fair Value through Profit & Loss (FVTPL), are assessed for indicators of
impairment at each balance sheet date. Financial assets are impaired where there is objective evidence that,
as a result of one or more events that occurred after the initial recognition of the financial asset, the estimated
future cash flows of the investment have been impacted. For financial assets carried at amortised cost, the
amount of the impairment is the difference between the asset’s carrying amount and the present value of
estimated future cash flows, discounted at the original effective interest rate.
For shares classified as Fair Value through Other Comprehensive Income (FVTOCI), a significant or prolonged
decline in the fair value of the security below its cost is considered to be objective evidence of impairment.
For all other financial assets, including redeemable notes classified as finance lease receivables, objective
evidence of impairment could include:
y Significant financial difficulty of the issuer or counterparty; or
y Default or delinquency in interest or principal payments; or
y It becoming probable that the borrower will enter bankruptcy or financial re-organisation.
The carrying amount of the financial asset is reduced by the impairment loss directly for all financial assets
with the exception of loans and advances where the carrying amount is reduced through the use of an
allowance account. When advance receivable is uncollectible, it is charged off against the allowance account.
Subsequent recoveries of amounts previously charged off are credited against the allowance account. Changes
in the carrying amount of the allowance account are recognized in profit or loss. If in a subsequent period, the
amount of the impairment loss decreases and the decrease can be related objectively to an event occurring
after the impairment was recognized, the previously recognized impairment loss is reversed through profit or
loss to the extent that the carrying amount of the investment at the date the impairment is reversed does not
exceed what the amortised cost would have been had the impairment not been recognized.
In respect of Fair Value through Other Comprehensive Income (FVTOCI) equity securities, any increase in fair
value subsequent to an impairment loss is recognized directly in equity.
Impairment of loans and advances
Impairment of loans and advances are assessed as follows:
(i) Individually assessed loans
These represent mainly corporate loans which are assessed individually by the Bank’s Credit Risk Unit in order
to determine whether there exists any objective evidence that a loan is impaired.
Impaired loans are measured based on the present value of expected future cash flows discounted at the loan’s
effective interest rate or at the loan’s observable market price, if available, or at the fair value of the collateral
if the recovery is entirely collateral dependent.
The impairment loss is calculated as the difference between the loan’s carrying value and its present value
calculated as above.

Mashreq Annual Report 201644
For wholesale loans provisions are made as per the following thresholds:
Sub-standard 25%
Doubtful 50%
Loss 100%
(ii) Collectively assessed loans
Impairment losses of collectively assessed loans include the allowances on:
a) Performing commercial and other loans
b) Retail loans with common features which are rated on a portfolio basis and here individual loan
amounts are not significant.
(a) Performing commercial and other loans
Where individually assessed loans are evaluated and no evidence of loss is present or has been identified, there
may be losses based upon risk rating and expected migrations, product or industry characteristics.
Impairment covers losses which may arise from individual performing loans that are impaired at the balance
sheet date but were not specifically identified as such until sometime in the future.
The estimated impairment is calculated by the Group’s management for each identified portfolio as per the
requirements of the Central Bank of the UAE and based on historical experience, credit rating and expected
migrations in addition to the assessed inherent losses which are reflected by the economic and credit conditions.
(b) Retail loans with common features which are rated on a portfolio basis and where individual loan
amounts are not significant
Retail loans are provided for as follows:
90 Days Past Due: 25%
120 Days Past Due: 50%
180 Days Past Due: 100%
Write -off Policy
Wholesale
The Group writes off a loan or other financial asset (and any related allowances for impairment losses) when
the Group Credit determines that the loans or other financial assets are uncollectible in whole or in part. This
determination is reached after considering information such as the occurrence of significant changes in the
borrower or issuer’s financial position such that the borrower or issuer can no longer pay its obligation in full,
or that proceeds from collateral will not be sufficient to pay back the entire exposure. For smaller balance
standardized loans, charge off decisions generally are based on a product specific past due status. Assets are
written-off against provisions up to the extent of amount considered un-collectible. However, the Group may
continue with its recovery effort including litigation, on written off accounts.

Mashreq Annual Report 2016 45
Retail
For all retail (including retail SME loans), write-offs are generally allowed only after three years from the date
of which the asset has been classified as “Loss” or has been charged off.
All retail loans are charged off when installments are past due over 181 days (credit cards at 180 days past due
(dpd)). For Mortgage loans, provisions are reported as below:
y Loans where the under construction property is defined as abandoned, the principal outstanding is
fully provided.
y Loans where the under construction property is defined as High Risk, the principal outstanding is
fully provided at 180 dpd. Further for such loans that are < 180 dpd & if the property is at under
construction stage for > 5 years from date of booking, the property value is further stressed by 10%
(in addition to 30% as required by Central bank) & provisions are reported on the negative equity.
y For all completed properties that have completed 180 dpd and the title deed is not available, provisions
are reported on the full principal outstanding.
y All other mortgage loans are provisioned as per central bank regulations based on the negative equity
component.
11. Impaired loans & Investments by geographyPORTFOLIO MONITORING AND IDENTIFYING CREDIT RISK AND IMPAIRMENT Impaired loans & Investments by geography
(AED’000)
Impairment allowance/ provision as at 31 December
NPL Individual CollectiveInterest in suspense
Other Income in suspense
Total NPL (net of individual impairment,
interest & other income in suspense)
2016Domestic (UAE) 1,365,760 850,622 1,567,760 156,558 3,885 354,695
Other Middle East countries 1,020,760 532,128 118,501 143,545 12,998 332,089
O.E.C.D. 167 146 - 57 - (36)
Other countries - - 1,489 (5) - 5
Total 2,386,687 1,382,896 1,687,750 300,155 16,883 686,753
2015
Domestic (UAE) 955,061 648,390 1,443,903 72,352 4,898 229,421
Other Middle East countries 1,170,905 457,400 137,113 147,075 12,122 554,308
O.E.C.D. 200 176 - 61 - (37)
Other countries - 0 3,435 (5) - 5
Total 2,126,166 1,105,966 1,584,451 219,483 17,020 783,697

Mashreq Annual Report 201646
12. Market risk
Capital Calculation
Capital is allocated in respect of market risk under the general guide-lines and framework set out under Basel
II Section VI, Market Risk, which defines this risk as the risk of losses in on- and off-balance-sheet positions
arising from movements in market prices.
The market risks subject to a capital charge are as follows:
y interest rate risk;
y foreign exchange risk;
y equity exposure risk;
y commodity risk; and
y options risk.
CAPITAL REQUIREMENT FOR MARKET RISK UNDER STANDARDISED APPROACH
(AED’000)
2016 2015
Risk-weighted assets
Capital requirements
Risk-weighted assets
Capital requirements
Interest rate risk — trading book 1,180,149 141,618 2,958,406 355,009
Specific risk 973,555 116,827 2,638,658 316,639
General risk — maturity-based 206,594 24,791 319,748 38,370
Foreign exchange risk 832,999 99,960 823,751 98,850
Equity exposure risk- trading book 484,432 58,132 635,694 76,284
General risk 242,216 29,066 317,847 38,142
Specific risk 242,216 29,066 317,847 38,142
Commodity risk- trading book - - - -
Options risk 622 74 6,539 785
Intermediate Approach 622 74 6,539 785
Total market risk capital charge 2,498,202 299,784 4,424,390 530,928
13. Equity position in Banking booksEQUITY POSITION IN BANKING BOOKS
(AED’000)
2016 2015
Publicly traded/quoted
Privately held/unquoted
Publicly traded/quoted
Privately held/unquoted
Equities 70,140 82,196 69,702 83,120
Any other investments - - - -
Total equity position 70,140 82,196 69,702 83,120

Mashreq Annual Report 2016 47
Financial Highlights

Mashreq Annual Report 201648 Mashreq Annual Report 2016
CUSTOMER DEPOSITS [AED billion]
0
10
20
30
40
50
60
70
80
47.5
58.6
68.573.6
77.0
2012 2013 2014 2015 2016
LOANS AND ADVANCES [AED billion]
0
10
20
30
40
50
60
70
80
41.4
50.4
58.0 60.2 61.0
2012 2013 2014 2015 2016

Mashreq Annual Report 2016 49
OPERATING INCOME [AED million]
2012 2013 2014 2015 20160
1000
2000
3000
4000
5000
6000
7000
8000
4,084
4,837
5,845 5,977 6,169
NET PROFIT [AED million]
2012 2013 2014 2015 20160
500
1000
1500
2000
2500
1,312
1,806
2,401 2,402
1,926

Mashreq Annual Report 201650
EARNINGS PER SHARE [AED]
2012 2013 2014 2015 20160
3
6
9
12
15
7.76
10.68
13.53 13.53
10.85
COST EFFICIENCY [%]
2012 2013 2014 2015 20160
10
20
30
40
5045.4
42.239.0
41.437.8

Mashreq Annual Report 2016 51
RETURN ON ASSETS [%]
2012 2013 2014 2015 20160.0
0.5
1.0
1.5
2.0
2.5
1.69
2.17 2.17
1.62
2.46
RETURN ON EQUITY [%]
2012 2013 2014 2015 20160
5
10
15
20
10.29
13.05
15.6914.16
10.55

Mashreq Annual Report 201652
COMPOSITION
LIABILITIES & EQUITY [AED 123bn]
SEGMENTS
DEPOSITS [AED 77bn]
2016 ASSET MIX [AED 123bn]
50%Advances
63%Deposits
63%CASA
Diversified Portfolio
2016 LIABILITIES & EQUITY MIX
Other Assets
Cash And Bank Balances
Advances
Investments
Corporate
Retail
Treasury & capital markets
International
Islamic
Insurance
Others
Medium / LTL Borrowings
Customer Deposits
Bank Deposits
Other Liabilties
Equity (Including NCI)
Current Accounts
Savings Accounts
Term Deposits
50%
9%11%
30%
25%
11%
14%27%
12%
4%
7%
63%
16%
9%
8%
4%
37%
58%
5%

Mashreq Annual Report 2016 53
Corporate
Retail
Treasury & capital markets
International
Islamic
Insurance
Others
SEGMENTS
MOODY’S S&P FITCH CI
COMPOSITION
24%International
45% Non-Interest Income
9%
7%
22%22%
31%
4%5%
2016 OPERATING INCOME [AED 6,169mn]
CREDIT RATINGS
Baa2/P-2/Positive
BBB+/A-2/Stable
A- / A1 /Stable
A / F1 /Stable
Corporate
Retail
Treasury & capital markets
International
Islamic
Insurance
Others
Net Interest/ Profit Income
Net Fee & commission
Investment
Others
24%27%
22%
9%
7%6%
5%
27%
55%
14%
4%

Mashreq Annual Report 201654
TIER 1 RATIO [%]
CAPITAL ADEQUACY RATIO [%]
TOTAL STAKEHOLDERS’ EQUITY [AED billion]
Minimum regulatoryrequirement of 8%
Minimum regulatoryrequirement of 12%
2012 2013 2014 2015 20160
5
10
15
20
17.216.4
15.3 15.9 16.0
2012 2013 2014 2015 20160
5
10
15
20 19.318.2
16.6 16.9 16.9
2012 2013 2014 2015 20160
5
10
15
20
13.815.1
16.918.5
19.5

Mashreq Annual Report 2016 55
NPL TO GROSS LOANS [%]
NPL COVERAGE [%]
LIQUID ASSETS TO TOTAL ASSETS [%]
2012 2013 2014 2015 20160
2
4
6
8
10
8.8
5.1
3.7
2.8 3.1
2012 2013 2014 2015 20160
50
100
150
200
53
96
120
145 151
2012 2013 2014 2015 20160
5
10
15
20
25
30
35
27.4 26.527.7
29.9 30.4

Mashreq Annual Report 201656
Independent Auditor’s ReportMashreqBank PSC GroupReport and consolidated financial statements for the year ended 31 December 2016
Mashreq Annual Report 2016

Mashreq Annual Report 2016 57
Independent auditor’s report
The Shareholders
Mashreqbank psc
Dubai
United Arab Emirates
Report on the Audit of the Consolidated Financial Statements
Opinion
We have audited the consolidated financial statements of Mashreqbank psc (the “Bank”) and its subsidiaries
(together the “Group”), Dubai, United Arab Emirates which comprise the consolidated statement of financial
position as at 31 December 2016, and the consolidated income statement, consolidated statement of
comprehensive income, consolidated statement of changes in equity and consolidated statement of cash flows
for the year then ended, and a summary of significant accounting policies and other explanatory information.
In our opinion, the accompanying consolidated financial statements present fairly, in all material respects, the
consolidated financial position of the Mashreqbank psc and its subsidiaries, as at 31 December 2016, and its
consolidated financial performance and their consolidated cash flows for the year then ended in accordance
with International Financial Reporting Standards (“IFRSs”).
Basis for Opinion
We conducted our audit in accordance with International Standards on Auditing (ISAs). Our responsibilities under
those standards are further described in the Auditor’s Responsibilities for the Audit of the Consolidated Financial
Statements section of our report. We are independent of the Group in accordance with the International Ethics
Standards Board for Accountants’ Code of Ethics for Professional Accountants (IESBA Code) together with the
other ethical requirements that are relevant to our audit of the Group’s consolidated financial statements in
the United Arab Emirates and we have fulfilled our other ethical responsibilities. We believe that the audit
evidence we have obtained is sufficient and appropriate to provide a basis for our opinion.
Key Audit Matters
Key audit matters are those matters that, in our professional judgment, were of most significance in our audit
of the consolidated financial statements of the current period. These matters were addressed in the context of
our audit of the consolidated financial statements as a whole, and in forming our opinion thereon, and we do
not provide a separate opinion on these matters.

Mashreq Annual Report 201658
Key Audit Matters (continued)
KEY AUDIT MATTER HOW OUR AUDIT ADDRESSED THE KEY AUDIT MATTERS
Impairment of loans and advances and Islamic financing
The management exercises significant judgment when determining both when and how much to record as loan impairment provisions. Because of the significance of these judgements and the size of loans and advances and Islamic financing, the audit of allowance for related impairment provisions is a key area of focus. At 31 December 2016, the total of gross loans and advances and Islamic finance was AED 64 billion (2015: AED 63 billion) against which allowance for impairment provisions of AED 3.3 billion were recorded (2015: AED 2.8 billion). Judgement is applied to determine appropriate parameters and assumptions used to calculate impairment.
The accounting policies and critical judgments relative to the calculations of the impairment provisions on loans and advances and Islamic financing are summarised in Note 3.14 and Note 4.1 to the consolidated financial statements respectively.
The Group uses two methods in its calculations of impairment provisions on loans and advances and Islamic financing:
Our audit procedures included the assessment of controls over the approval, recording and monitoring of loans and advances, and evaluating the methodologies, inputs and assumptions used by the Group in calculating collectively assessed impairments, and assessing the adequacy of impairment allowances for individually assessed loans and advances.
We tested the design, implementation and operating effectiveness of the key controls to determine which loans and advances are impaired and provisions against those assets. These included testing:
• System-based and manual controls over the timely recognition of impaired loans and advances;
• Controls over the impairment calculation models including data inputs;
• Controls over collateral valuation estimates
• Controls over governance and approval process related to impairment provisions, including continuous reassessment by the management.
We also assessed whether the financial statement disclosures appropriately reflect the Group’s exposure to credit risk.
Individually assessed facilites
These represent mainly corporate facilties which are assessed individually by the Group’s Credit Risk Unit in order to determine whether there exists any objective evidence that a loan is impaired.
Impaired facilities are measured based on the present value of expected future cash flows discounted at the original effective interest rate or at the observable market price, if available, or at the fair value of the collateral if the recovery is entirely collateral dependent.
Impairment loss is calculated as the difference between the facilties carrying value and its present value or recoverable amount calculated as above.
Collectively assessed facilties
The management of the Group assesses, based on historical experience and the prevailing economical and credit conditions, the magnitude of performing retail and wholesale facilties which may be impaired but not identified as of the reporting date.
Allowances against performing loans and advances are reassessed on a periodical basis using modelled basis for different portfolios with common features and allowances are adjusted accordingly based on the judgment of management and guidance received from the Central Bank of the UAE.
Individually assessed facilties
We tested a sample of individual facilities (including loans that had not been identified by management as potentially impaired) to form our own assessment as to whether impairment events had occurred and to assess whether adequate impairments provisions had been recorded in a timely manner.
Where impairment had been identified, we tested the estimation of the future expected cash flows prepared by management to support the calculation of impairment, challenging the assumptions, including realisation of collateral held. This work involved assessing the work performed by external experts used by the Group to value the collateral.
We examined a sample of facilties which had not been identified by management as potentially impaired and formed our own judgment as to whether that was appropriate to support management’s conclusion.
Collectively assessed facilites
For the collective impairment models used by the Group, we tested a sample of the data used in the models as well as evaluating the model methodology and re-performing the calculations. For the key assumptions used in the model, we challenged management to provide objective evidence that they were appropriate and included all relevant risks. Further, we considered our industry experience and knowledge to consider the appropriateness of the provision.
We recalculated the collective impairment provision as per the Bank’s policies and IFRS and compared it with the calculations as per UAE Central Bank to ensure adequacy of the provision.
We performed certain test procedures to ensure past due payments are reflected in the right bucket. We have also involved our IT auditors to provide us assurance on the accuracy of the ageing reports generated by the system and its related configuration.
INDEPENDENT AUDITOR’S REPORT (continued)

Mashreq Annual Report 2016 59
Key Audit Matters (continued)
KEY AUDIT MATTER HOW OUR AUDIT ADDRESSED THE KEY AUDIT MATTER
Valuation of financial instruments including derivatives
The fair value of financial instruments is determined through the application of valuation techniques which often involve the exercise of judgement by management and the use of assumptions and estimates. Due to the significance of financial instruments (financial instruments measured at fair value represent 3% of total assets) and the related estimation uncertainty, this is considered a key audit risk. Fair values are generally obtained by reference to quoted market prices, third party quotes, discounted cash flow models and recognised pricing models as appropriate.
Our audit procedures included the assessment of controls over the identification, measurement and management of valuation risk, and evaluating the methodologies, inputs and assumptions used by the Group in determining fair values. For the Group’s fair value models, we assessed the appropriateness of the models and inputs. We compared observable inputs against independent sources and externally available market data.
For a sample of instruments with the assistance of our own valuation specialists, we critically assessed the assumptions and models used, by reference to what we considered to be available alternative methods and sensitivities to key factors.
We have also assessed the adequacy of the Bank’s disclosures including the accuracy of the categorisation into the fair value measurement hierarchy and adequacy of the disclosure of the valuation techniques, significant unobservable inputs, changes in estimate occurring during the period and the sensitivity to the key assumptions.
Valuation of Insurance contract liabilities
As at 31 December 2016, net insurance contract liabilities amounted to AED 1.5 billion, as detailed in note 18 to these consolidated financial statements.
As set out in note 3.18 and note 4.6, valuation of these liabilities requires professional judgment and also involve number of assumptions made by management.
This is particularly the case for those liabilities that are based on the best-estimate of technical reserves that includes ultimate cost of all claims incurred but not settled at a given date, whether reported or not, together with the related claims handling costs and related technical reserves. A range of methods are used by management and the internal actuary/independent external actuary to determine these provisions. Underlying these methods are a number of explicit or implicit assumptions relating to the expected settlement amount and settlement patterns of claims.
Furthermore, valuation of life insurance contract liabilities involves complex and subjective judgement made by management and the internal actuary/independent external actuary about variety of uncertain future outcomes, including the estimation of economic assumptions, such as investment return, discount rates, and operating assumptions, such as expense, mortality and persistency. Changes in these assumptions can result in material impacts to the valuation of these liabilities.
The valuation of these liabilities also depends on accurate data about the volume, amount and pattern of current and historical claims since they are often used to form expectations about future claims. As a result of all of the above factors, insurance contract liabilities represent a significant risk for the Group.
Our audit procedures included:
• Testing the underlying Group data to source documentation.
• Evaluating and testing of key controls around the claims handling and case reserve setting processes of the Group.
• Evaluating and testing of key controls designed to ensure the integrity of the data used in the actuarial reserving process.
• Checking samples of claims case reserves through comparing the estimated amount of the case reserve to appropriate documentation, such as reports from loss adjusters.
• Re-performing reconciliations between the claims data recorded in the Group’s systems and the data used in the actuarial reserving calculations.
In addition, with the assistance of our actuarial specialists, we:
• performed necessary reviews to ascertain whether the results are appropriate for financial disclosure.
• reviewed the actuarial report compiled by the independent external actuaries of the Group and calculations underlying these provisions, particularly the following areas;
› appropriateness of the calculation methods and approach (actuarial best practice)
› review of assumptions
› sensitivities to key assumptions
› risk profiles
› consistency between valuation periods
› general application of financial and mathematical rules
INDEPENDENT AUDITOR’S REPORT (continued)

Mashreq Annual Report 201660
Key Audit Matters (continued)
KEY AUDIT MATTER HOW OUR AUDIT ADDRESSED THE KEY AUDIT MATTER
IT systems and controls over financial reporting
We identified IT systems and controls over financial reporting as an area of focus because the Bank’s financial accounting and reporting systems are vitally dependent on complex technology due to the extensive volume and variety of transactions which are processed daily and there is a risk that automated accounting procedures and related internal controls are not accurately designed and operating effectively. A particular area of focus related to logical access management and segregation of duties. The incorporated key controls are essential to limit the potential for fraud and error as a result of change to an application or underlying data. Our audit approach relies on automated controls and therefore procedures are designed to test access and control over IT systems.
We assessed and tested the design and operating effectiveness of the controls over the continued integrity of the IT systems that are relevant to financial reporting. We examined the framework of governance over the Group’s IT organisation and the controls over program development and changes, access to programs and data and IT operations, including compensating controls where required. We also tested the accuracy and completeness of key computer generated reports heavily used in our testing such as aging report of overdue loans and advances.
In events deficiencies are noted during our testing affecting applications and databases, we performed a combination of controls testing and substantive testing in order to determine whether we could place reliance on the completeness and accuracy of system generated information. In addition and where appropriate, we extended the scope of our substantive audit procedures.
Other information
Board of Directors is responsible for the other information. The other information comprises the annual
report of the Group. We obtained the Board of Directors’ report of the annual report prior to the date of this
auditor’s report, and the remaining information of the annual report is expected to be made available to us
after that date. The other information does not include the consolidated financial statements and our auditor’s
report thereon.
Our opinion on the consolidated financial statements does not cover the other information and we do not
express any form of assurance or conclusion thereon.
In connection with our audit of the consolidated financial statements, our responsibility is to read the
other information and, in doing so, consider whether the other information is materially inconsistent with
the consolidated financial statements or our knowledge obtained in the audit, or otherwise appears to be
materially misstated.
If, based on the work we have performed on the other information that we obtained prior to the date of this
auditor’s report, we conclude that there is a material misstatement of this other information, we are required
to report that fact. We have nothing to report in this regard.
When we read the remaining information of the annual report of the Group, if we conclude that there is a
material misstatement therein, we are required to communicate the matter to those charged with governance.
Responsibilities of Management for the Consolidated Financial Statements
Management is responsible for the preparation and fair presentation of the consolidated financial statements
in accordance with IFRS and their preparation in compliance with applicable provisions of UAE Federal Law No.
(2) of 2015, and for such internal control as management determines is necessary to enable the preparation of
consolidated financial statements that are free from material misstatement, whether due to fraud or error.
In preparing the consolidated financial statements, management is responsible for assessing the Group’s ability
to continue as a going concern, disclosing, as applicable, matters related to going concern and using the going
concern basis of accounting unless management either intends to liquidate the Group or to cease operations,
or has no realistic alternative but to do so.
The Board of Directors and the Audit Committee are responsible for overseeing the Group’s financial
reporting process.
INDEPENDENT AUDITOR’S REPORT (continued)

Mashreq Annual Report 2016 61
Auditor’s Responsibilities for the Audit of the Consolidated Financial Statements
Our objectives are to obtain reasonable assurance about whether the consolidated financial statements as
a whole are free from material misstatement, whether due to fraud or error, and to issue an auditor’s report that
includes our opinion. Reasonable assurance is a high level of assurance, but is not a guarantee that an audit
conducted in accordance with ISAs will always detect a material misstatement when it exists. Misstatements
can arise from fraud or error and are considered material if, individually or in the aggregate, they could
reasonably be expected to influence the economic decisions of users taken on the basis of these consolidated
financial statements.
As part of an audit in accordance with ISAs, we exercise professional judgment and maintain professional
skepticism throughout the audit. We also:
• Identify and assess the risks of material misstatement of the consolidated financial statements, whether
due to fraud or error, design and perform audit procedures responsive to those risks, and obtain audit
evidence that is sufficient and appropriate to provide a basis for our opinion. The risk of not detecting a
material misstatement resulting from fraud is higher than the one resulting from error, as fraud may involve
collusion, forgery, intentional omission, misrepresentations, or the override of internal controls.
• Obtain an understanding of internal controls relevant to the audit in order to design audit procedures that
are appropriate in the circumstances, but not for the purpose of expressing an opinion on the effectiveness
of the internal controls.
• Evaluate the appropriateness of accounting policies used and the reasonableness of accounting estimates
and related disclosures made by management.
• Conclude on the appropriateness of management’s use of the going concern basis of accounting and based
on the audit evidence obtained, whether a material uncertainty exists related to events or conditions
that may cast significant doubt on the Group’s ability to continue as a going concern. If we conclude
that a material uncertainty exists, we are required to draw attention in our auditor’s report to the related
disclosures in the consolidated financial statements or, if such disclosure are inadequate, to modify our
opinion. Our conclusions are based on the audit evidence obtained up to the date of our auditor’s report.
However, future events or conditions may cause the Group to cease to continue as a going concern.
• Evaluate the overall presentation, structure and content of the consolidated financial statements, including
the disclosures, and whether the consolidated financial statements represent the underlying transactions
and events in a manner that achieves fair presentation.
• Obtain sufficient appropriate audit evidence regarding the financial information of the entities or business
activities within the Group to express an opinion on the consolidated financial statements. We are
responsible for the direction, supervision and performance of the group audit. We remain solely responsible
for our audit opinion.
We communicate with those charged with governance regarding, among other matters, the planned scope and
timing of the audit and significant audit findings, including any significant deficiencies in internal control that
we identify during our audit.
We also provide those charged with governance with a statement that we have complied with relevant ethical
requirements regarding independence, and to communicate with them all relationships and other matters that
may reasonably be thought to bear on our independence, and where applicable, related safeguards.
INDEPENDENT AUDITOR’S REPORT (continued)
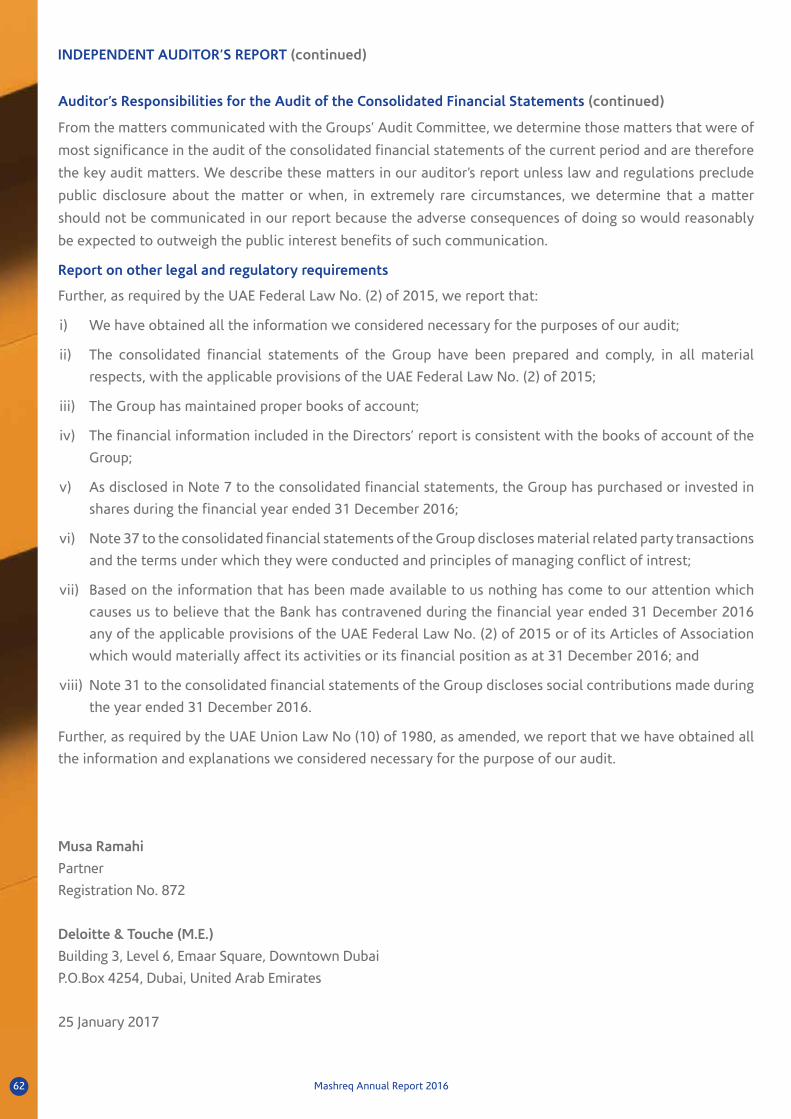
Mashreq Annual Report 201662
Auditor’s Responsibilities for the Audit of the Consolidated Financial Statements (continued)
From the matters communicated with the Groups’ Audit Committee, we determine those matters that were of
most significance in the audit of the consolidated financial statements of the current period and are therefore
the key audit matters. We describe these matters in our auditor’s report unless law and regulations preclude
public disclosure about the matter or when, in extremely rare circumstances, we determine that a matter
should not be communicated in our report because the adverse consequences of doing so would reasonably
be expected to outweigh the public interest benefits of such communication.
Report on other legal and regulatory requirements
Further, as required by the UAE Federal Law No. (2) of 2015, we report that:
i) We have obtained all the information we considered necessary for the purposes of our audit;
ii) The consolidated financial statements of the Group have been prepared and comply, in all material
respects, with the applicable provisions of the UAE Federal Law No. (2) of 2015;
iii) The Group has maintained proper books of account;
iv) The financial information included in the Directors’ report is consistent with the books of account of the
Group;
v) As disclosed in Note 7 to the consolidated financial statements, the Group has purchased or invested in
shares during the financial year ended 31 December 2016;
vi) Note 37 to the consolidated financial statements of the Group discloses material related party transactions
and the terms under which they were conducted and principles of managing conflict of intrest;
vii) Based on the information that has been made available to us nothing has come to our attention which
causes us to believe that the Bank has contravened during the financial year ended 31 December 2016
any of the applicable provisions of the UAE Federal Law No. (2) of 2015 or of its Articles of Association
which would materially affect its activities or its financial position as at 31 December 2016; and
viii) Note 31 to the consolidated financial statements of the Group discloses social contributions made during
the year ended 31 December 2016.
Further, as required by the UAE Union Law No (10) of 1980, as amended, we report that we have obtained all
the information and explanations we considered necessary for the purpose of our audit.
Musa Ramahi
Partner
Registration No. 872
Deloitte & Touche (M.E.)
Building 3, Level 6, Emaar Square, Downtown Dubai
P.O.Box 4254, Dubai, United Arab Emirates
25 January 2017
INDEPENDENT AUDITOR’S REPORT (continued)
Mashreq Annual Report 2016 63Mashreq Annual Report 2016
Group Financial Statements
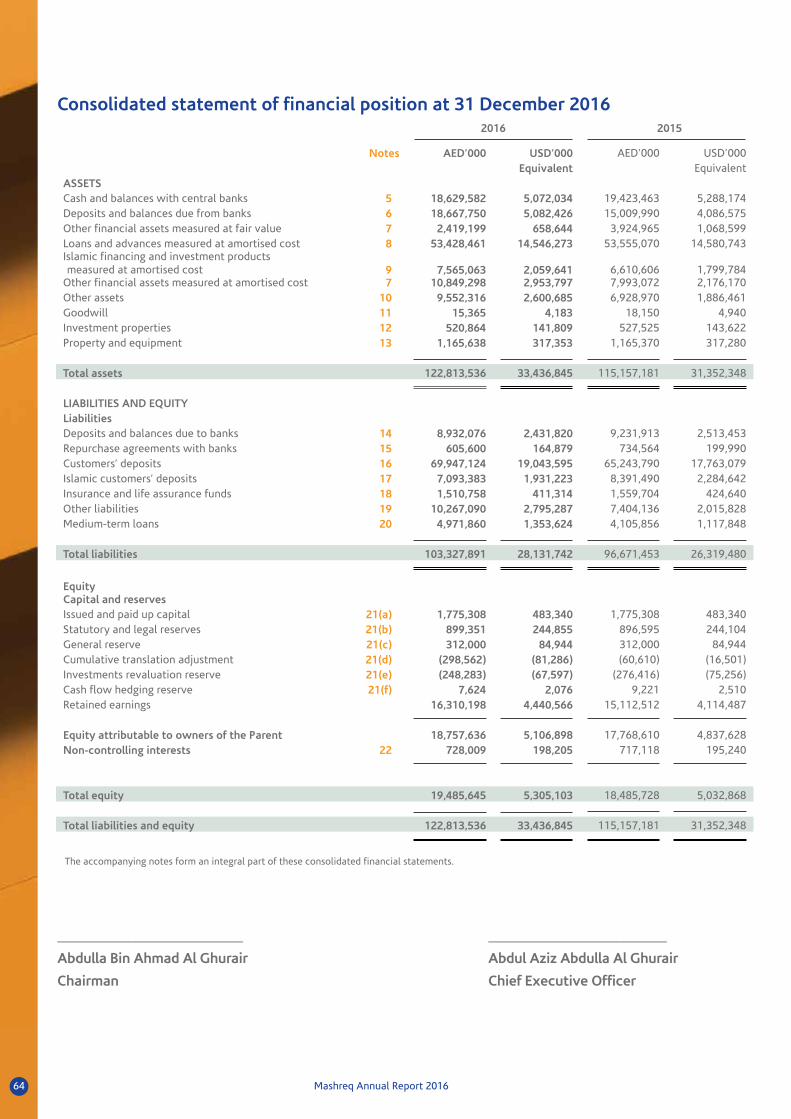
Mashreq Annual Report 201664
Consolidated statement of financial position at 31 December 20162016 2015
Notes AED’000 USD’000 AED’000 USD’000Equivalent Equivalent
ASSETSCash and balances with central banks 5 18,629,582 5,072,034 19,423,463 5,288,174Deposits and balances due from banks 6 18,667,750 5,082,426 15,009,990 4,086,575Other financial assets measured at fair value 7 2,419,199 658,644 3,924,965 1,068,599Loans and advances measured at amortised cost 8 53,428,461 14,546,273 53,555,070 14,580,743Islamic financing and investment products measured at amortised cost 9 7,565,063 2,059,641 6,610,606 1,799,784
Other financial assets measured at amortised cost 7 10,849,298 2,953,797 7,993,072 2,176,170Other assets 10 9,552,316 2,600,685 6,928,970 1,886,461Goodwill 11 15,365 4,183 18,150 4,940Investment properties 12 520,864 141,809 527,525 143,622Property and equipment 13 1,165,638 317,353 1,165,370 317,280
Total assets 122,813,536 33,436,845 115,157,181 31,352,348
LIABILITIES AND EQUITYLiabilitiesDeposits and balances due to banks 14 8,932,076 2,431,820 9,231,913 2,513,453Repurchase agreements with banks 15 605,600 164,879 734,564 199,990Customers’ deposits 16 69,947,124 19,043,595 65,243,790 17,763,079Islamic customers’ deposits 17 7,093,383 1,931,223 8,391,490 2,284,642Insurance and life assurance funds 18 1,510,758 411,314 1,559,704 424,640Other liabilities 19 10,267,090 2,795,287 7,404,136 2,015,828Medium-term loans 20 4,971,860 1,353,624 4,105,856 1,117,848
Total liabilities 103,327,891 28,131,742 96,671,453 26,319,480
EquityCapital and reservesIssued and paid up capital 21(a) 1,775,308 483,340 1,775,308 483,340 Statutory and legal reserves 21(b) 899,351 244,855 896,595 244,104General reserve 21(c) 312,000 84,944 312,000 84,944Cumulative translation adjustment 21(d) (298,562) (81,286) (60,610) (16,501)Investments revaluation reserve 21(e) (248,283) (67,597) (276,416) (75,256)Cash flow hedging reserve 21(f) 7,624 2,076 9,221 2,510Retained earnings 16,310,198 4,440,566 15,112,512 4,114,487
Equity attributable to owners of the Parent 18,757,636 5,106,898 17,768,610 4,837,628Non-controlling interests 22 728,009 198,205 717,118 195,240
Total equity 19,485,645 5,305,103 18,485,728 5,032,868
Total liabilities and equity 122,813,536 33,436,845 115,157,181 31,352,348
The accompanying notes form an integral part of these consolidated financial statements.
__________________________ _________________________
Abdulla Bin Ahmad Al Ghurair Abdul Aziz Abdulla Al Ghurair
Chairman Chief Executive Officer

Mashreq Annual Report 2016 65
The accompanying notes form an integral part of these consolidated financial statements.
Consolidated income statement for the year ended 31 December 2016
2016 2015
Notes AED’000 USD’000 AED’000 USD’000Equivalent Equivalent
Interest income 24 4,466,079 1,215,921 4,101,946 1,116,784Income from Islamic financing and investment products 25 347,555 94,624 258,293 70,322
Total interest income and income fromIslamic financing and investment products 4,813,634 1,310,545 4,360,239 1,187,106
Interest expense 26 (1,345,530) (366,330) (1,033,192) (281,294)Distribution to depositors – Islamic products 27 (105,737) (28,788) (65,258) (17,767)
Net interest income and income fromIslamic products net of distribution to depositors 3,362,367 915,427 3,261,789 888,045
Fee and commission income 28 3,049,142 830,150 3,024,587 823,465Fee and commission expenses 28 (1,364,469) (371,486) (1,300,179) (353,983)
Net fee and commission income 1,684,673 458,664 1,724,408 469,482
Net investment income 29 262,517 71,472 169,106 46,040Other income, net 30 859,068 233,887 822,202 223,850
Operating income 6,168,625 1,679,450 5,977,505 1,627,417
General and administrative expenses 31 (2,406,701) (655,241) (2,472,527) (673,163)Allowances for impairment, net 32 (1,733,659) (472,001) (999,805) (272,204)
Profit before taxes 2,028,265 552,208 2,505,173 682,050Overseas income tax expense (74,354) (20,243) (70,528) (19,202)
Profit for the year 1,953,911 531,965 2,434,645 662,848
Attributed to:Owners of the Parent 1,926,412 524,479 2,402,107 653,990Non-controlling interests 27,499 7,486 32,538 8,858
1,953,911 531,965 2,434,645 662,848
Earnings per share 33 AED 10.85 USD 2.95 AED 13.53 USD 3.68
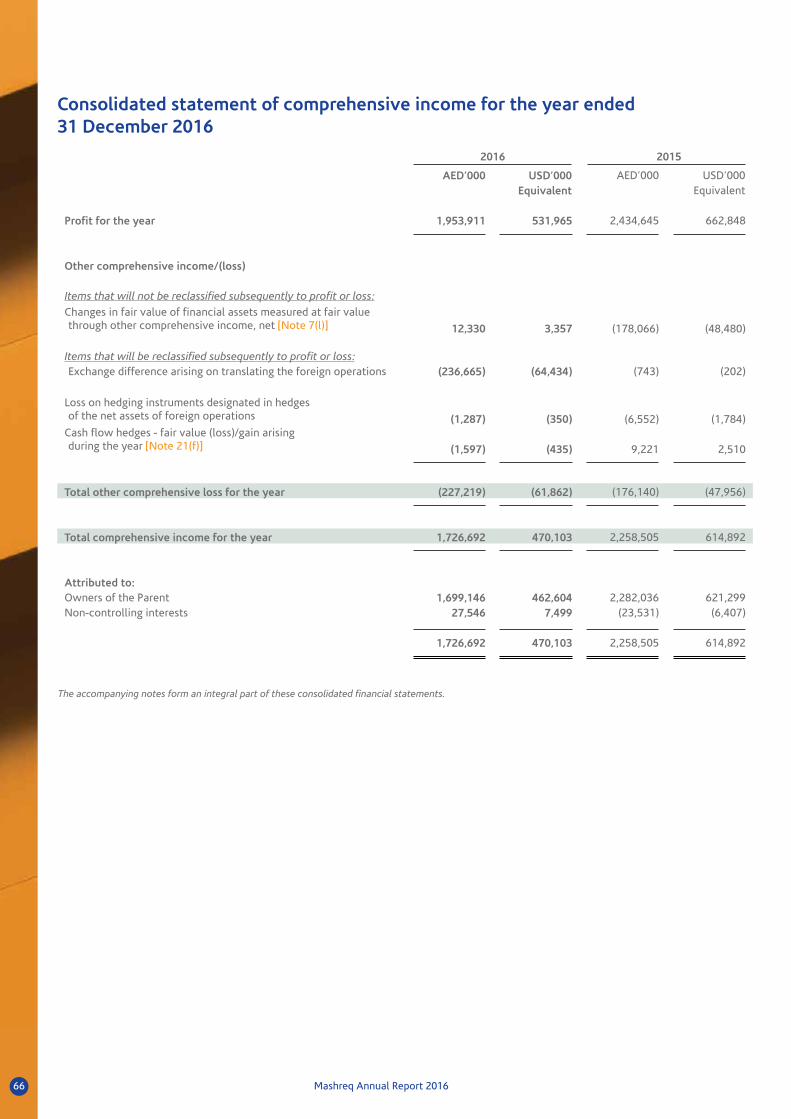
Mashreq Annual Report 201666
Consolidated statement of comprehensive income for the year ended31 December 2016
The accompanying notes form an integral part of these consolidated financial statements.
2016 2015
AED’000 USD’000 AED’000 USD’000Equivalent Equivalent
Profit for the year 1,953,911 531,965 2,434,645 662,848
Other comprehensive income/(loss)
Items that will not be reclassified subsequently to profit or loss:
Changes in fair value of financial assets measured at fair valuethrough other comprehensive income, net [Note 7(l)] 12,330 3,357 (178,066) (48,480)
Items that will be reclassified subsequently to profit or loss:Exchange difference arising on translating the foreign operations (236,665) (64,434) (743) (202)
Loss on hedging instruments designated in hedges of the net assets of foreign operations (1,287) (350) (6,552) (1,784)
Cash flow hedges - fair value (loss)/gain arising during the year [Note 21(f)] (1,597) (435) 9,221 2,510
Total other comprehensive loss for the year (227,219) (61,862) (176,140) (47,956)
Total comprehensive income for the year 1,726,692 470,103 2,258,505 614,892
Attributed to:Owners of the Parent 1,699,146 462,604 2,282,036 621,299Non-controlling interests 27,546 7,499 (23,531) (6,407)
1,726,692 470,103 2,258,505 614,892

Mashreq Annual Report 2016 67
Consolidated statement of changes in equity for the year ended31 December 2016
The accompanying notes form an integral part of these consolidated financial statements.
Issued and paid up capital
Statutory and legal reserves
General reserve
Cumulative translation adjustment
Investments revaluation
reserve
Cash flowhedgingreserve
Retained earnings
Equity attributable
to owners of the Parent
Non-controlling
interests Total
AED’000 AED’000 AED’000 AED’000 AED’000 AED’000 AED’000 AED’000 AED’000 AED’000
Balance at 1 January 2015 1,690,770 852,582 312,000 (53,315) (152,150) - 13,512,995 16,162,882 755,668 16,918,550
Profit for the year - - - - - - 2,402,107 2,402,107 32,538 2,434,645
Other comprehensiveincome/(loss) for the year - - - (7,295) (121,997) 9,221 - (120,071) (56,069) (176,140)
Total comprehensiveincome/(loss) for the year - - - (7,295) (121,997) 9,221 2,402,107 2,282,036 (23,531) 2,258,505
Issue of bonus shares[Note 21(a)] 84,538 - - - - - (84,538) - - -
Transfer from investmentrevaluation reserve toretained earnings - - - - (2,269) - 2,269 - - -
Transfer to statutory andlegal reserves - 44,013 - - - - (44,013) - - -
Payment of dividends[Note 21(g)] - - - - - - (676,308) (676,308) (18,129) (694,437)
Additional contributionattributable to the newnon-controlling interestshareholders (Note 22) - - - - - - - - 3,110 3,110
Balance at 31 December2015 1,775,308 896,595 312,000 (60,610) (276,416) 9,221 15,112,512 17,768,610 717,118 18,485,728
Profit for the year - - - - - - 1,926,412 1,926,412 27,499 1,953,911
Other comprehensiveincome/(loss)for the year - - - (237,952) 12,283 (1,597) - (227,266) 47 (227,219)
Total comprehensiveincome/(loss)for the year - - - (237,952) 12,283 (1,597) 1,926,412 1,699,146 27,546 1,726,692
Transfer frominvestment revaluationreserve to retainedearnings - - - - 15,850 - (15,850) - - -
Transfer to statutoryand legal reserves - 2,756 - - - - (2,756) - - -
Payment of dividends[Note 21(g)] - - - - - - (710,120) (710,120) (16,655) (726,775)
Balance at 31 December2016 1,775,308 899,351 312,000 (298,562) (248,283) 7,624 16,310,198 18,757,636 728,009 19,485,645

Mashreq Annual Report 201668
Consolidated statement of cash flows for the year ended 31 December 2016
The accompanying notes form an integral part of these consolidated financial statements.
2016 2015
Notes AED’000 USD’000 AED’000 USD’000Equivalent Equivalent
Cash flows from operating activitiesProfit before taxation for the year 2,028,265 552,208 2,505,173 682,051Adjustments for:Depreciation of property and equipment 13 155,611 42,366 148,637 40,467Allowances for impairment, net 32 1,733,659 472,001 999,805 272,204
(Gain)/loss on disposal of property andequipment 30 (53,837) (14,658) 4,959 1,350
Reversal of impairment on property and equipment 13 (35,171) (9,576) - -Loss from disposal of investment properties 30 250 69 - -
Fair value adjustments of other financial assetsmeasured at FVTPL 29 (6,310) (1,718) 41,291 11,242
Fair value adjustments of investmentproperties 30 2,161 588 (34,196) (9,310)
Net realised gain from sale of otherfinancial assets measured at FVTPL 29 (24,029) (6,542) (33,305) (9,068)
Dividend income from financial assetsmeasured at FVTOCI 29 (26,878) (7,318) (26,088) (7,103)
Net realised loss from sale of other financialassets measured at amortised cost 29 490 133 10,345 2,816
Fair value adjustment – derivatives 30 (6,954) (1,893) (7,070) (1,925)
Operating cash flows before changes inoperating assets and liabilities 3,767,257 1,025,660 3,609,551 982,724
Increase in deposits with central banks (430,654) (117,249) (1,674,668) (455,940)
Increase in deposits and balancesdue from banks maturing after three months (1,997,519) (543,839) (3,333) (907)
Increase in loans and advances measured atamortised cost (1,512,319) (411,739) (2,282,576) (621,447)
Increase in Islamic financing and investmentproducts measured at amortised cost (1,011,571) (275,407) (832,666) (226,699)
Increase in other assets (2,651,224) (721,814) (939,587) (255,809)
Increase/(decrease) in other financial assetscarried at FVTPL 210,633 57,347 (856,247) (233,119)
(Decrease)/increase in repurchase agreementswith banks (128,964) (35,111) 111,528 30,364
Increase in customers’ deposits 4,703,334 1,280,516 1,938,413 527,747(Decrease)/increase in Islamic customers’ deposits (1,298,107) (353,419) 3,208,724 873,598
Increase in medium-term loans (not qualifiedas Tier 2 capital) 866,004 235,776 97,613 26,576
Increase in deposits and balances due to banks (299,837) (81,633) 1,007,380 274,266
Decrease in insurance and lifeassurance funds (48,946) (13,326) (95,435) (25,983)
Increase in other liabilities 2,862,954 779,459 1,481,502 403,349Overseas tax paid (74,354) (20,243) (70,528) (19,202)
Net cash generated from operating activities 2,956,687 804,978 4,699,671 1,279,518

Mashreq Annual Report 2016 69
Consolidated statement of cash flows for the year ended 31 December 2016 (Continued)
The accompanying notes form an integral part of these consolidated financial statements.
2016 2015
Notes AED’000 USD’000 AED’000 USD’000Equivalent Equivalent
Cash flows from investing activitiesPurchase of property and equipment 13 (136,063) (37,043) (231,119) (62,924)Proceeds from sale of property and equipment 69,192 18,838 18,273 4,975Proceeds from sale of investment properties 4,250 1,157 (3,012) (820)
Net increase in other financial assets measuredat amortised cost (1,419,720) (386,529) (389,865) (106,143)
Net increase in other financial assets measured at FVTOCI (99,194) (27,006) (45,436) (12,370)
Dividend income from other financial assetsmeasured at FVTOCI 29 26,878 7,318 26,088 7,103
Net cash used in investing activities (1,554,657) (423,265) (625,071) (170,179)
Cash flows from financing activitiesDividend paid (726,775) (197,870) (694,437) (189,064)Additional contribution by non-controlling interest 22 - - 3,110 847
Net cash used in financing activities (726,775) (197,870) (691,327) (188,217)
Net increase in cash and cash equivalents 675,255 183,843 3,383,273 921,121Net foreign exchange difference (239,549) (65,219) 1,926 524Cash and cash equivalents at 1 January 19,877,731 5,411,852 16,492,532 4,490,207
Cash and cash equivalents at 31 December 35 20,313,437 5,530,476 19,877,731 5,411,852

Mashreq Annual Report 201670
Notes to the consolidated financial statements for the year ended31 December 2016
1 General information
Mashreqbank psc (the “Bank”) was incorporated in the Emirate of Dubai in 1967 under a decree issued by The
Ruler of Dubai. The Bank carries on retail banking, commercial banking, investment banking, Islamic banking,
brokerage and asset management activities through its branches in the United Arab Emirates, Bahrain, Kuwait,
Egypt, Hong Kong, India, Qatar, the United Kingdom and the United States of America.
The accompanying consolidated financial statements combine the activities of the Bank and its subsidiaries
(collectively the “Group”), as listed in Note 36.
The address of the Bank’s registered office is P.O. Box 1250, Dubai, United Arab Emirates.
2. Application of new and revised International Financial Reporting Standards
(“IFRS”)
2.1 New and revised IFRS applied with no material effect on the consolidated financial statements
The following new and revised IFRS, which became effective for annual periods beginning on or after 1 January
2016, have been adopted in these consolidated financial statements. The application of these new and revised
IFRS has not had any material impact on the amounts reported for the current and prior periods but may affect
the accounting for future transactions or arrangements.
y IFRS 14 Regulatory Deferral Accounts.
y Amendments to IAS 1 Presentation of Financial Statements relating to Disclosure initiative.
y Amendments to IFRS 11 Joint arrangements relating to accounting for acquisitions of interests in joint
operations.
y Amendments to IAS 16 Property, Plant and Equipment and IAS 38 Intangible Assets relating to
clarification of acceptable methods of depreciation and amortisation.
y Amendments to IAS 16 Property, Plant and Equipment and IAS 41 Agriculture relating to bearer plants.
y Amendments to IAS 27 Separate Financial Statements relating to accounting investments in
subsidiaries, joint ventures and associates to be optionally accounted for using the equity method in
separate financial statements.
y Amendments to IFRS 10 Consolidated Financial Statements, IFRS 12 Disclosure of Interests in Other
Entities and IAS 28 Investment in Associates and Joint Ventures relating to applying the consolidation
exception for investment entities.
y Annual Improvements to IFRS 2012-2014 Cycle covering amendments to IFRS 5 Non-current Assets
Held for Sale and Discontinued Operations, IFRS 7 Financial Instruments: Disclosures and IAS 19
Employee Benefits.
Mashreq Annual Report 2016 71
Notes to the consolidated financial statements for the year ended 31 December 2016 (continued)
2. Application of new and revised International Financial Reporting Standards
(“IFRS”) (continued)
2.2 New and revised IFRS in issue but not yet effective and not early adopted
The Group has not yet early applied the following new standard, amendments and interpretations that have
been issued but are not yet effective:
New and revised IFRSEffective for annual periods beginning on or after
y Amendments to IAS 12 relating to recognition of Deferred Tax Assets for
Unrealised Losses.
y Amendments to IAS 7 Statement of Cash Flows to provide disclosures that
enable users of financial statements to evaluate changes in liabilities arising
from financing activities.
1 January 2017
1 January 2017
y Finalised version of IFRS 9 [IFRS 9 Financial Instruments (2014)] was issued
in July 2014 incorporating requirements for classification and measurement,
impairment, general hedge accounting and derecognition. This amends
classification and measurement requirement of financial assets and
introduces new expected loss impairment model.
› Impairment: The 2014 version of IFRS 9 introduces an ‘expected credit
loss’ model for the measurement of the impairment of financial assets,
so it is no longer necessary for a credit event to have occurred before
a credit loss is recognized.
› Hedge accounting: Introduces a new hedge accounting model that
is designed to be more closely aligned with how entities undertake
risk management activities when hedging financial and non-financial
risk exposures.
› Derecognition: The requirements for the derecognition of financial
assets and liabilities are carried forward from IAS 39.
A new measurement category of fair value through other comprehensive
income (FVTOCI) will apply for debt instruments held within a business model
whose objective is achieved both by collecting contractual cash flows and
selling financial assets.
A new impairment model based on expected credit losses will apply to debt
instruments measured at amortised costs or FVTOCI, lease receivables, contract
assets and certain written loan commitments and financial guarantee contract.
1 January 2018

Mashreq Annual Report 201672
Notes to the consolidated financial statements for the year ended 31 December 2016 (continued)
2. Application of new and revised International Financial Reporting Standards
(“IFRS”) (continued)
2.2 New and revised IFRS in issue but not yet effective and not early adopted (continued)
New and revised IFRSEffective for annual periods beginning on or after
y IFRIC 22 Foreign Currency Transactions and Advance Consideration
The interpretation addresses foreign currency transactions or parts of
transactions where:
› there is consideration that is denominated or priced in a foreign currency;
› the entity recognises a prepayment asset or a deferred income liability
in respect of that consideration, in advance of the recognition of the
related asset, expense or income; and
› the prepayment asset or deferred income liability is non-monetary.
1 January 2018
y IFRS 15 Revenue from Contracts with Customers: IFRS 15 provides a single,
principles based five-step model to be applied to all contracts with customers.
y Amendments to IAS 40 Investment Property: Amends paragraph 57 to state that
an entity shall transfer a property to, or from, investment property when, and only
when, there is evidence of a change in use. A change of use occurs if property meets,
or ceases to meet, the definition of investment property. A change in
management’s intentions for the use of a property by itself does not constitute
evidence of a change in use. The paragraph has been amended to state that the
list of examples therein is non-exhaustive.
y IFRS 16 Leases provides a single lessee accounting model, requiring lessees to
recognise assets and liabilities for all leases unless the lease term is 12 months
or less or the underlying asset has a low value.
1 January 2018
1 January 2018
1 January 2019
y Amendments to IFRS 10 Consolidated Financial Statements and IAS 28
Investments in Associates and Joint Ventures (2011) relating to the treatment
of the sale or contribution of assets from and investor to its associate or joint
venture
Effective date deferred
indefinitely
Management anticipates that these new standards, interpretations and amendments will be adopted in the
Group’s consolidated financial statements for the period of initial application and adoption of these new
standards, interpretations and amendments, except for IFRS 9, may have no material impact on the consolidated
financial statements of the Group in the period of initial application.
The application of the finalised version of IFRS 9 may have significant impact on amounts reported and
disclosures made in the Group’s consolidated financial statements in respect of Group’s financial assets and
financial liabilities. However, it is not practicable to provide a reasonable estimate of effects of the application
until the Group performs a detailed review.
Mashreq Annual Report 2016 73
Notes to the consolidated financial statements for the year ended 31 December 2016 (continued)
3 Summary of significant accounting policies
3.1 Statement of compliance
The consolidated financial statements of the Group have been prepared in accordance with International
Financial Reporting Standards (IFRS) and Central Bank of the U.A.E. requirements as related to the impairment
of loans and advances measured at amortised cost and calculation of the capital adequacy ratio.
The UAE Federal Law No. 2 of 2015 (“Companies Law”) has come into force on 1 July 2015 (as amended). The
Bank has twenty four months from the effective date of the Companies Law to comply with its provisions (the
“transitional provisions”) and the Bank has availed the transitional provisions.
3.2 Basis of preparation
The consolidated financial statements of the Group have been prepared on the historical cost basis except for
certain financial instruments and investment properties that are measured at fair values at the end of each
reporting period.
Historical cost is generally based on the fair value of the consideration given in exchange for assets.
Fair value is the price that would be received to sell an asset or paid to transfer a liability in an orderly transaction
between market participants at the measurement date, regardless of whether that price is directly observable
or estimated using another valuation technique. In estimating the fair value of an asset or a liability, the Group
takes into account characteristics of the asset or liability if market participants would take those characteristics
into account when pricing the asset or liability at the measurement date. Fair value for measurement and/or
disclosure purposes in these consolidated financial statements is determined on such a basis, except for share-
based payment transactions that are within the scope of IFRS 2 Share-based Payment, leasing transactions
that are within the scope of IAS 17 Leases, and measurements that have some similarities to fair value but are
not fair value, such as net realisable value in IAS 2 Inventories or value in use in IAS 36 Impairment of Assets.
In addition, for financial reporting purposes, fair value measurements are categorised into Level 1, 2 or 3 based
on the degree to which the inputs to the fair value measurements are observable and the significance of the
inputs to the fair value measurement in its entirety, which are described as follows:
y Level 1 inputs are quoted prices (unadjusted) in active markets for identical assets or liabilities that
the entity can access at the measurement date;
y Level 2 inputs are inputs, other than quoted prices included within Level 1, that are observable for
the asset or liability, either directly or indirectly; and
y Level 3 inputs are unobservable inputs for the asset or liability.
The consolidated financial statements are presented in Arab Emirates Dirham (AED) and all values are rounded
to the nearest thousands dirham, except when otherwise indicated.
The principal accounting policies are set out below:

Mashreq Annual Report 201674
Notes to the consolidated financial statements for the year ended 31 December 2016 (continued)
3 Summary of significant accounting policies (continued)
3.3 Basis of consolidation
These consolidated financial statements incorporate the financial statements of the Bank and entities controlled
by the Bank and its subsidiaries. Control is achieved when the Bank:
y has power over an investee,
y is exposed, or has rights, to variable returns from its involvement with the investee, and
y has the ability to use its power over the investee to affect the amount of the investor’s returns.
The Group reassesses whether or not it controls an investee if facts and circumstances indicate that there are
changes to one or more of the three elements of control listed above.
When the Group has less than a majority of the voting rights of an investee, it has power over the investee
when the voting rights are sufficient to give it the practical ability to direct the relevant activities of the
investee unilaterally. The Group considers all relevant facts and circumstances in assessing whether or not the
Group’s voting rights in an investee are sufficient to give it power, including:
y the size of the Group’s holding of voting rights relative to the size and dispersion of holdings of the
other vote holders;
y potential voting rights held by the Group, other vote holders and other parties;
y rights raising from other contractual arrangements; and
y any additional facts and circumstances that indicate that the Group has, or does not have, the
current ability to direct the relevant activities at the time that decisions need to be made, including
voting patterns and previous shareholders’ meetings.
Consolidation of a subsidiary begins when the Bank obtains control over the subsidiary and ceases when the
Bank loses control over the subsidiary. Specifically, income and expenses of a subsidiary acquired or disposed
of during the year are included in the consolidated income statement from the date the Bank gains control until
the date when the Bank ceases to control the subsidiary.
Profit or loss of each component of other comprehensive income is attributable to the owners of the
Group and to the non-controlling interests. Total comprehensive income of subsidiaries is attributed to the
owners of the Bank and to the non-controlling interest even if this results in the non-controlling interests
having a deficit balance.
When necessary, adjustments are made to the financial statements of subsidiaries to bring their accounting
policies into line with the Group’s accounting policies.
All intragroup assets, liabilities, equity, income, expenses and cash flows relating to transactions between
members of the Group are eliminated in full on consolidation.
Changes in the Group’s ownership interest in existing subsidiaries
Changes in the Group’s ownership interests in subsidiaries that do not result in the Group losing control over
the subsidiaries are accounted for as equity transactions. The carrying amounts of the Group’s interests and
the non-controlling interests are adjusted to reflect the changes in their relative interests in the subsidiaries.
Any difference between the amount by which the non-controlling interests are adjusted and the fair value of
the consideration paid or received is recognised directly in equity and attributed to shareholders of the Parent.

Mashreq Annual Report 2016 75
Notes to the consolidated financial statements for the year ended 31 December 2016 (continued)
3 Summary of significant accounting policies (continued)
3.3 Basis of consolidation (continued)
Changes in the Group’s ownership interest in existing subsidiaries (continued)
When the Group loses control of a subsidiary, the profit or loss on disposal is calculated as the difference
between (i) the aggregate of the fair value of the consideration received and the fair value of any retained
interest and (ii) the previous carrying amount of the assets (including goodwill), and liabilities of the subsidiary
and any non-controlling interests. When assets of the subsidiary are carried at revalued amounts or fair values
and the related cumulative gain or loss have been recognised in the consolidated statement of comprehensive
income and accumulated in equity, the amounts previously recognised in the consolidated statement
of comprehensive income and accumulated in equity are accounted for as if the Parent had directly disposed
of the relevant assets (i.e. reclassified to profit or loss or transferred directly to retained earnings as specified
by applicable IFRSs). The fair value of any investment retained in the former subsidiary at the date when
control is lost is regarded as the fair value on initial recognition for subsequent accounting under IFRS 9
Financial Instruments or, when applicable, the cost on initial recognition of an investment in an associate
or a joint venture.
3.4 Business combinations
Acquisitions of businesses are accounted for using the acquisition method. The consideration transferred
in a business combination is measured at fair value, which is calculated as the sum of the acquisition-date fair
values of the assets transferred by the Group, liabilities incurred by the Group to the former owners of the
acquiree and the equity interests issued by the Group in exchange for control of the acquiree. Acquisition-
related costs are generally recognised in profit or loss as incurred.
At the acquisition date, the identifiable assets acquired and the liabilities assumed are recognised at their
fair value.
Goodwill is measured as the excess of the sum of the consideration transferred, the amount of any non-
controlling interests in the acquiree, and the fair value of the acquirer’s previously held equity interest in
the acquiree (if any) over the net of the acquisition-date amounts of the identifiable assets acquired and the
liabilities assumed. If, after reassessment, the net of the acquisition-date amounts of the identifiable assets
acquired and liabilities assumed exceeds the sum of the consideration transferred, the amount of any non-
controlling interests in the acquiree and the fair value of the acquirer’s previously held interest in the acquiree
(if any), the excess is recognised immediately in profit or loss as a bargain purchase gain.
Non-controlling interests that are present ownership interests and entitle their holder to a proportionate
share of the entity’s net assets in the event of liquidation may be initially measured either at fair value or
at the non-controlling interests’ proportionate share of the recognised amounts of the acquiree’s identifiable
net assets. The choice of measurement basis is made on a transaction-by-transaction basis. Other types
of non-controlling interests are measured at fair value or, when applicable, on the basis specified
in another IFRS.
Mashreq Annual Report 201676
Notes to the consolidated financial statements for the year ended 31 December 2016 (continued)
3 Summary of significant accounting policies (continued)
3.4 Business combinations (continued)
When the consideration transferred by the Group in a business combination includes assets or liabilities
resulting from a contingent consideration arrangement, the contingent consideration is measured at its
acquisition-date fair value and included as part of the consideration transferred in a business combination.
Changes in the fair value of the contingent consideration that qualify as measurement period adjustments
are adjusted retrospectively, with corresponding adjustments against goodwill. Measurement period
adjustments are adjustments that arise from additional information obtained during the ‘measurement
period’ (which cannot exceed one year from acquisition date) about facts and circumstances that existed
at the acquisition date.
The subsequent accounting for changes in the fair value of the contingent consideration that do not qualify
as measurement period adjustments depends on how the contingent consideration is classified. Contingent
consideration that is classified as equity is not remeasured at subsequent reporting dates and its subsequent
settlement is accounted for within equity. Contingent consideration that is classified as an asset or a liability is
remeasured at subsequent reporting dates in accordance with IAS 39 Financial Instruments: Recognition and
Measurement and IAS 37 Provisions, Contingent Liabilities and Contingent Assets, as appropriate, with the
corresponding gain or loss being recognised in profit and loss.
When a business combination is achieved in stages, the Group’s previously held equity interest in the acquiree is
remeasured to fair value at the acquisition date (i.e. the date when the Group obtains control) and the resulting
gain or loss, if any, is recognised in profit or loss. Amounts arising from interests in the acquiree prior to the
acquisition date that have previously been recognised in consolidated statement of comprehensive income
are reclassified to profit or loss where such treatment would be appropriate if that interest were disposed of.
If the initial accounting for a business combination is incomplete by the end of the reporting period in which
the combination occurs, the Group reports provisional amounts for the items for which the accounting is
incomplete. Those provisional amounts are adjusted during the measurement period (see above), or additional
assets or liabilities are recognised, to reflect new information obtained about facts and circumstances that
existed at the acquisition date that, if known, would have affected the amounts recognised at that date.
3.5 Goodwill
Goodwill arising on acquisition of a business is carried at cost as established at the date of acquisition of the
business (see Note 3.4 above) less accumulated impairment losses if any.
For the purposes of impairment testing, goodwill is allocated to each of the Group’s cash-generating units (or
groups of cash-generating units) that is expected to benefit from the synergies of the combination.
A cash-generating unit to which goodwill has been allocated is tested for impairment annually, or more
frequently when there is an indication that the unit might be impaired. If the recoverable amount of the cash-
generating unit is less than the carrying amount, the impairment loss is allocated first to reduce the carrying
amount of any goodwill allocated to the unit and then to the other assets of the unit pro rata based on the
carrying amount of each asset in the unit. Any impairment loss for goodwill is recognised directly in profit or
loss. An impairment loss recognised for goodwill is not reversed in the subsequent periods.
On disposal of the relevant cash-generating unit, the atributable amount of goodwill is included in the
determination of the profit or loss on disposal.
Mashreq Annual Report 2016 77
Notes to the consolidated financial statements for the year ended 31 December 2016 (continued)
3 Summary of significant accounting policies (continued)
3.6 Revenue recognition
Interest income and expense
Interest income and expense for all interest-bearing financial instruments, except for other financial assets
measured at fair value through profit and loss (FVTPL), are recognised within ‘interest income’ and ‘interest
expense’ in the consolidated income statement using the effective interest method. Interest income from
other financial assets measured at FVTPL is recognised within ‘net investment income’ in the consolidated
income statement.
The effective interest method is a method of calculating the amortised cost of a financial asset or a financial
liability and of allocating the interest income or interest expense over the relevant period. The effective interest
rate is the rate that exactly discounts estimated future cash payments or receipts through the expected life of
the financial instrument or, when appropriate, a shorter period to the net carrying amount of the financial asset
or financial liability. When calculating the effective interest rate, the Group estimates cash flows considering all
contractual terms of the financial instrument (for example, prepayment options) but does not consider future
credit losses. The calculation includes all fees and points paid or received between parties to the contract that
are an integral part of the effective interest rate, transaction costs and all other premiums or discounts.
Once a financial asset or a group of similar financial assets has been written down as a result of an impairment
loss, interest income is recognised using the rate of interest used to discount the future cash flows for the
purpose of measuring the impairment loss. Recoveries in respect of loans and advances previously provided for
are accounted for on a cash receipt basis.
Income from Islamic financing and investments products
The Group’s policy for recognition of income from Islamic financing and investments products is described in
Note 3.20 (iii).
Fee and commission income and expenses
The Group earns fee and commission income from a diverse range of services it provides to its customers. Fee
income can be divided into the following two categories:
(a) Fee income earned from services that are provided over a certain period of time. Fees earned for the provision
of services over a period of time are accrued over that period. These fees include commission income and asset
management, custody and other management and advisory fees. Loan commitment fees for loans that are
likely to be drawn down and other credit-related fees are deferred (together with any incremental costs) and
recognised as an adjustment to the effective interest rate on the loan. When it is unlikely that a loan will be
drawn down, the loan commitment fees are recognised over the commitment period on a straight-line basis.
(b) Fee income from providing transaction services, Fees arising from negotiating or participating in the
negotiation of a transaction for a third party, such as the arrangement of the acquisition of shares or other
securities or the purchase or sale of businesses, are recognised on completion of the underlying transaction.
Fees or components of fees that are linked to a certain performance are recognised after fulfilling the
corresponding criteria.

Mashreq Annual Report 201678
Notes to the consolidated financial statements for the year ended 31 December 2016 (continued)
3 Summary of significant accounting policies (continued)
3.6 Revenue recognition (continued)
Dividend revenue
Dividend revenue from investments is recognised in the consolidated income statement when the Group’s right
to receive payment has been established (provided that it is probable that the economic benefits will flow to
the Group and the amount of Income can be measured reliably).
Insurance contracts revenue and insurance commission income
Premiums are recognised as revenue (earned premium) on time-proportion basis over the effective period of
policy coverage. The portion of premium received on in-force contracts that relates to unexpired risks at the
end of the reporting period is reported as the unearned premium liability.
Premium on life assurance policies are accounted for on the date of writing of policies and on subsequent due
dates.
Insurance commission income is recognised when the policies are written based on the terms and percentages
agreed with the reinsurers.
Gain or loss from redemption of medium-term loans
Gain or loss from redemption of medium-term loans represents the difference between the amount paid and
the carrying amount of the liability on the date of redemption.
Rental income
The Group’s policy for recognition of revenue from operating leases is described in 3.7 below.
Rendering of services
Consultancy and project services revenue represents the total amount of services rendered and work completed
and invoiced, net of discount.
3.7 Leasing
Leases are classified as finance leases whenever the terms of the lease transfer substantially all the risks and
rewards of ownership to the lessee. All other leases are classified as operating leases.
3.7.1 The Group as lessor
Amounts due from lessees under finance leases are recognised as receivables at the amount of the Group’s net
investment in the leases. Finance lease income is allocated to accounting periods so as to reflect a constant
periodic rate of return on the Group’s net investment outstanding in respect of the leases.
Rental income from operating leases is recognised on a straight-line basis over the term of the relevant lease.
Initial direct costs incurred in negotiating and arranging an operating lease are added to the carrying amount
of the leased asset and recognised on a straight-line basis over the lease term.
3.7.2 The Group as lessee
Assets held under finance leases are initially recognised as assets of the Group at their fair value at the inception
of the lease or, if lower, at the present value of the minimum lease payments. The corresponding liability to the
lessor is included in the consolidated statement of financial position as a finance lease obligation.

Mashreq Annual Report 2016 79
Notes to the consolidated financial statements for the year ended 31 December 2016 (continued)
3 Summary of significant accounting policies (continued)
3.7 Leasing (continued)
3.7.2 The Group as lessee (continued)
Lease payments are apportioned between finance expenses and reduction of the lease obligation so as to
achieve a constant rate of interest on the remaining balance of the liability. Finance expenses are recognised
immediately in profit or loss, unless they are directly attributable to qualifying assets, in which case they are
capitalised in accordance with the Group’s general policy on borrowing costs (see Note 3.9). Contingent rentals
are recognised as expenses in the periods in which they are incurred.
Operating lease payments are recognised as an expense on a straight-line basis over the lease term, except
where another systematic basis is more representative of the time pattern in which economic benefits from
the leased asset are consumed. Contingent rentals arising under operating leases are recognised as an expense
in the period in which they are incurred.
In the event that lease incentives are received to enter into operating leases, such incentives are recognised as
a liability. The aggregate benefit of incentives is recognised as a reduction of rental expense on a straight-line
basis, except where another systematic basis is more representative of the time pattern in which economic
benefits from the leased asset are consumed.
3.8 Foreign currencies
The individual financial statements of each Group entity are presented in the currency of the primary economic
environment in which the entity operates (its functional currency). For the purpose of the consolidated financial
statements, the results and financial position of each entity are expressed in U.A.E. Dirham (AED), which is the
functional currency of the Group, and the presentation currency for the consolidated financial statements.
The presentation currency of the Group is the U.A.E. Dirham (AED); however, for presentation purposes only,
additional columns for US Dollar (USD) equivalent amounts have been presented in the consolidated statement
of financial position, consolidated income statement, consolidated statement of comprehensive income and
consolidated statement of cash flows and certain notes to the consolidated financial statements using a
conversion rate of USD 1.00 = AED 3.673.
In preparing the financial statements of the individual entities, transactions in currencies other than the Group’s
functional currency (foreign currencies) are recorded at the rates of exchange prevailing at the dates of the
transactions. At each reporting date, monetary items denominated in foreign currencies are retranslated at
the rates prevailing at the reporting date. Non-monetary items carried at fair value that are denominated in
foreign currencies are retranslated at the rates prevailing at the date when the fair value was determined. Non-
monetary items that are measured in terms of historical cost in a foreign currency are not retranslated.
Exchange differences are recognised in the consolidated income statement in the period in which they arise
except for:
y exchange differences which relate to assets under construction for future productive use, which are
included in the cost of those assets when they are regarded as an adjustment to interest costs on
foreign currency borrowings;
y exchange differences on transactions entered into in order to hedge certain foreign currency risks;
and

Mashreq Annual Report 201680
3 Summary of significant accounting policies (continued)
3.8 Foreign currencies (continued)
y exchange differences on monetary items receivable from or payable to a foreign operation for which
settlement is neither planned nor likely to occur, which form part of the net investment in a foreign
operation, and which are recognised initially in the foreign currency translation reserve and recognised
in consolidated income statement on disposal of the net investment.
For the purpose of presenting these consolidated financial statements, the assets and liabilities of the Group’s
foreign operations are expressed in AED using exchange rates prevailing at the reporting date. Income and
expense items are translated at the average exchange rates for the period, unless exchange rates fluctuated
significantly during that year, in which case the exchange rates at the dates of the transactions are used.
Exchange differences arising, if any, are classified as equity and recognised in the Group’s cumulative translation
adjustment. Such exchange differences are recognised in the consolidated income statement in the period in
which the foreign operation is disposed.
On the disposal of a foreign operation, all the exchange differences accumulated in equity in respect of that
operation attributable to the owners of the Bank is reclassified to the consolidated income statement.
In addition, in relation to a partial disposal of a subsidiary that does not result in the Bank losing control over the
subsidiary, the proportionate share of accumulated exchange differences are re-attributed to non-controlling
interests and are not recognised in the consolidated income statement. For all other partial disposals (i.e.
partial disposals of associates or jointly controlled entities that do not result in the Bank losing significant
influence or joint control), the proportionate share of the accumulated exchange differences is reclassified to
the consolidated income statement.
Goodwill and fair value adjustments on identifiable assets and liabilities acquired arising on the acquisition of
a foreign operation are treated as assets and liabilities of the foreign operation and translated at the rate of
exchange prevailing at the end of each reporting period. Exchange differences arising are recognised in equity.
3.9 Borrowing costs
Borrowing costs directly attributable to the acquisition, construction or production of qualifying assets, which
are assets that necessarily take a substantial period of time to get ready for their intended use or sale, are
added to the cost of those assets, until such time as the assets are substantially ready for their intended use
or sale.
Investment income earned on the temporary investment of specific borrowings pending their expenditure on
qualifying assets is deducted from the borrowing costs eligible for capitalisation.
All other borrowing costs are recognised in profit or loss in the period in which they are incurred.
3.10 Property and equipment
Property and equipment are stated at cost less accumulated depreciation and any accumulated impairment
losses.
Freehold land and capital work in progress are not depreciated.
Notes to the consolidated financial statements for the year ended 31 December 2016 (continued)

Mashreq Annual Report 2016 81
3 Summary of significant accounting policies (continued)
3.10 Property and equipment (continued)
Depreciation is recognised so as to write off the cost of assets (other than land and capital work in progress),
using the straight-line method, over the estimated useful lives of the respective assets, as follows:
Years
Properties for own use 20 – 25
Furniture, fixtures, equipment and vehicles 4 - 10
Improvements to freehold properties and others 5 - 10
The estimated useful lives, residual values and depreciation method are reviewed at each year end, with the
effect of any changes in estimate accounted for on a prospective basis.
An item of property, plant and equipment is derecognised upon disposal or when no future economic benefits
are expected to arise from the continued use of the asset. Any gain or loss arising on the disposal or retirement
of an item of property, plant and equipment is determined as the difference between the sales proceeds and
the carrying amount of the asset and is recognised in the consolidated income statement.
One year after property and equipment are fully depreciated, they are maintained at a net book value of one
currency unit by setting off accumulated depreciation against cost.
Capital work in progress are carried at cost, less any recognised impairment loss. Cost includes professional
fees and, for qualifying assets, borrowing costs capitalised in accordance with the Group’s accounting policy.
Such properties are classified to the appropriate categories of property and equipment when completed and
ready for intended use. Depreciation of these assets, on the same basis as other property assets, commences
when the assets are ready for their intended use.
3.11 Investment property
Investment properties are properties held to earn rentals and/or for capital appreciation (including property
under construction for such purposes). Investment properties are measured initially at cost, including
transaction costs. Subsequent to initial recognition, investment properties are measured at fair value. Gains
and losses arising from changes in the fair value of investment properties are included in the consolidated
income statement in the period in which they arise.
An investment property is derecognised upon disposal or when the investment property is permanently
withdrawn from use and no future economic benefits are expected from the disposal. Any gain or loss arising
on derecognition of the property (calculated as the difference between the net disposal proceeds and the
carrying amount of the asset) is included in the consolidated income statement in the period in which the
property is derecognised.
3.12 Impairment of tangible assets
At the end of each reporting period, the Group reviews the carrying amounts of its tangible assets to determine
whether there is any indication that those assets have suffered an impairment loss. If any such indication
exists, the recoverable amount of the asset is estimated in order to determine the extent of the impairment loss
(if any). When it is not possible to estimate the recoverable amount of an individual asset, the Group estimates
the recoverable amount of the cash-generating unit to which the asset belongs.
Notes to the consolidated financial statements for the year ended 31 December 2016 (continued)
Mashreq Annual Report 201682
3 Summary of significant accounting policies (continued)
3.12 Impairment of tangible assets (continued)
When a reasonable and consistent basis of allocation can be identified, corporate assets are also allocated to
individual cash-generating units, or otherwise they are allocated to the smallest group of cash-generating units
for which a reasonable and consistent allocation basis can be identified.
Recoverable amount is the higher of fair value less costs to sell and value in use. In assessing value in use, the
estimated future cash flows are discounted to their present value using a pre-tax discount rate that reflects
current market assessments of the time value of money and the risks specific to the asset for which the
estimates of future cash flows have not been adjusted.
If the recoverable amount of an asset (or cash-generating unit) is estimated to be less than its carrying amount,
the carrying amount of the asset (or cash-generating unit) is reduced to its recoverable amount. An impairment
loss is recognised in the consolidated income statement.
When an impairment loss subsequently reverses, the carrying amount of the asset (or cash-generating unit) is
increased to the revised estimate of its recoverable amount, such that the increased carrying amount does not
exceed the carrying amount that would have been determined had no impairment loss been recognised for the
asset (or cash-generating unit) in prior years. A reversal of an impairment loss is recognised in the consolidated
income statement, unless the relevant asset is carried at a revalued amount, in which case the reversal of the
impairment loss is treated as a revaluation increase.
3.13 Provisions
Provisions are recognised when the Group has a present obligation (legal or constructive) as a result of a past
event, it is probable that the Group will be required to settle the obligation, and a reliable estimate can be
made of the amount of the obligation.
The amount recognised as a provision is the best estimate of the consideration required to settle the present
obligation at the reporting date, taking into account the risks and uncertainties surrounding the obligation.
Where a provision is measured using the cash flows estimated to settle the present obligation, its carrying
amount is the present value of those cash flows.
When some or all of the economic benefits required to settle a provision are expected to be recovered from a
third party, the receivable is recognised as an asset if it is virtually certain that reimbursement will be received
and the amount of the receivable can be measured reliably.
3.14 Financial instruments
Financial assets and financial liabilities are recognised when the Group becomes a party to the contractual
provisions of the instrument.
Financial assets and financial liabilities are initially measured at fair value. Transaction costs that are directly
attributable to the acquisition or issue of financial assets and financial liabilities (other than financial assets
and financial liabilities at fair value through profit and loss) are added to or deducted from the fair value
of the financial assets or financial liabilities, as appropriate, on initial recognition. Transaction costs directly
attributable to the acquisition of financial assets or financial liabilities at fair value through profit and loss are
recognised immediately in the consolidated income statement.
Notes to the consolidated financial statements for the year ended 31 December 2016 (continued)

Mashreq Annual Report 2016 83
3 Summary of significant accounting policies (continued)
3.14 Financial instruments (continued)
3.14.1 Financial assets
All regular way purchases or sales of financial assets are recognised and derecognised on a trade date basis.
Regular way purchases or sales are purchases or sales of financial assets that require delivery of assets within
the time frame established by regulation or convention in the marketplace.
Classification of financial assets
For the purposes of classifying financial assets, an instrument is an ‘equity instrument’ if it is a non-derivative
and meets the definition of ‘equity’ for the issuer except for certain non-derivative puttable instruments
presented as equity by the issuer. All other non-derivative financial assets are ‘debt instruments’.
The Bank classifies financial assets as subsequently measured at amortised cost, fair value through other
comprehensive income or fair value through profit or loss on the basis of both:
(a) the entity’s business model for managing the financial assets; and
(b) the contractual cash flow characteristics of the financial asset.
Financial assets at amortised cost
A financial asset measured at amortised cost are categorised under such category if both of the following
conditions are met:
(a) the financial asset is held within a business model whose objective is to hold financial assets in order
to collect contractual cash flows; and
(b) the contractual terms of the financial asset give rise on specified dates to cash flows that are solely
payments of principal and interest on the principal amount outstanding.
Debt instruments, including loans and advances and Islamic financing and investments products, are measured
at amortised cost if both of the following conditions are met:
(a) the asset is held within a business model whose objective is to hold assets in order to collect contractual
cash flows; and
(b) the contractual terms of the instrument give rise on specified dates to cash flows that are solely
payments of principal and interest/profit on the principal amount outstanding.
Financial assets at fair value through other comprehensive income (FVTOCI)
At initial recognition, the Group can make an irrevocable election (on an instrument-by-instrument basis) to
designate investments in equity instruments as at FVTOCI. Designation at FVTOCI is not permitted if the equity
investment is held for trading.
A financial asset is held for trading if:
y it has been acquired principally for the purpose of selling it in the near term;
y on initial recognition it is part of a portfolio of identified financial instruments that the Group
manages together and has evidence of a recent actual pattern of short-term profit-taking; or
y it is a derivative that is not designated and effective as a hedging instrument or a financial guarantee.
Notes to the consolidated financial statements for the year ended 31 December 2016 (continued)

Mashreq Annual Report 201684
3 Summary of significant accounting policies (continued)
3.14 Financial instruments (continued)
3.14.1 Financial assets (continued)
Financial assets at fair value through other comprehensive income (FVTOCI) (continued)
Investments in equity instruments at FVTOCI are initially measured at fair value plus transaction costs.
Subsequently, they are measured at fair value with gains and losses arising from changes in fair value recognised
in consolidated statement of comprehensive income and accumulated in the investments revaluation reserve.
Where the asset is disposed of, the cumulative gain or loss previously accumulated in the investments
revaluation reserve is not transferred to consolidated income statement, but is reclassified to retained earnings.
Dividends on these investments in equity instruments are recognised in the consolidated income statement
when the Group’s right to receive the dividends is established in accordance with IAS 18 Revenue, unless the
dividends clearly represent a recovery of part of the cost of the investment.
Financial assets at fair value through profit or loss (FVTPL)
A financial asset shall be measured at fair value through profit or loss unless it is measured at amortised cost
or at fair value through other comprehensive income. However, the Group may make an irrevocable election
at initial recognition for particular investments in equity instruments that would otherwise be measured at fair
value through profit or loss to present subsequent changes in fair value in other comprehensive income.
Debt instruments that do not meet the amortised cost criteria (as described above) are measured at FVTPL. In
addition, debt instruments that meet the amortised cost criteria but are designated as at FVTPL are measured at
FVTPL. A debt instrument may be designated as at FVTPL upon initial recognition if such designation eliminates
or significantly reduces a measurement or recognition inconsistency that would arise from measuring assets or
liabilities or recognising the gains and losses on them on different bases.
Debt instruments are reclassified from amortised cost to FVTPL when the business model is changed such
that the amortised cost criteria are no longer met. Reclassification of debt instruments that are designated
as at FVTPL on initial recognition is not allowed. Irrecovable designation of financial assets at FVTPL at initial
recognition is made by the Group only if by doing so it eliminates or significantly reduces measurement or
recognition inconsistency that would otherwise arise from measuring assets or liabilities or recognizing the
gains and losses on them on different basis.
Financial assets at FVTPL are measured at fair value at the end of each reporting period, with any gains or
losses arising on remeasurement recognised in the consolidated income statement. The net gain or loss
recognised in the consolidated income statement is included in the ‘net investment income’ line item in the
consolidated income statement. Fair value is determined in the manner described in Note 43 to the consolidated
financial statements.
Interest income on debt instruments as at FVTPL is included in the net gain or loss described above and is
included in the ‘net investment income’ line item.
Dividend income on investments in equity instruments at FVTPL is recognised in the consolidated income
statement when the Group’s right to receive the dividends is established in accordance with IFRS and is included
in the net gain or loss described above.
Notes to the consolidated financial statements for the year ended 31 December 2016 (continued)

Mashreq Annual Report 2016 85
3 Summary of significant accounting policies (continued)
3.14 Financial instruments (continued)
3.14.1 Financial assets (continued)
Reclassification
Reclassification of financial assets
When, and only when, the Bank changes its business model for managing financial assets it reclassifies all
affected financial assets. If such a reclassification is applied prospectively from the reclassification date. It
is not required under IFRS 9 to restate any previously recognised gains, losses (including impairment gains or
losses) or interest.
Reclassification from FVTPL to Amortised Cost
If Bank reclassifies a financial asset out of the fair value through profit or loss measurement category and into
the amortised cost measurement category, its fair value at the reclassification date becomes its new gross
carrying amount.
Effective interest method
The effective interest method is a method of calculating the amortised cost of a debt instrument and of
allocating interest income over the relevant period. The effective interest rate is the rate that exactly discounts
estimated future cash receipts (including all fees and points paid or received that form an integral part of the
effective interest rate, transaction costs and other premiums or discounts) through the expected life of the
debt instrument, or, where appropriate, a shorter period, to the net carrying amount on initial recognition.
Income is recognised on an effective interest basis for debt instruments (other than those financial assets
designated as FVTPL) and are measured subsequently at amortised cost. Interest income is recognised in the
consolidated income statement.
Foreign exchange gains and losses
The fair value of financial assets denominated in a foreign currency is determined in that foreign currency and
translated at the spot rate at the end of each reporting period. The foreign exchange component forms part of
its fair value gain or loss. Therefore,
y for financial assets that are classified as at FVTPL, the foreign exchange component is recognised in
the consolidated income statement; and
y for financial assets that are designated as at FVTOCI, any foreign exchange component is recognised
in consolidated statement of comprehensive income.
For foreign currency denominated debt instruments measured at amortised cost at the end of each reporting
period, the foreign exchange gains and losses are determined based on the amortised cost of the financial
assets and are recognised in the consolidated income statement.
Impairment of financial assets
Financial assets that are measured at amortised cost are assessed for impairment at the end of each reporting
period. Financial assets are considered to be impaired when there is objective evidence that, as a result of one
or more events that occurred after the initial recognition of the financial assets, the estimated future cash
flows of the asset have been affected.
Notes to the consolidated financial statements for the year ended 31 December 2016 (continued)

Mashreq Annual Report 201686
3 Summary of significant accounting policies (continued)
3.14 Financial instruments (continued)
3.14.1 Financial assets (continued)
Impairment of financial assets (continued)
Objective evidence of impairment could include:
y significant financial difficulty of the issuer or counterparty;
y breach of contract, such as a default or delinquency in interest or principal payments;
y it becoming probable that the borrower will enter bankruptcy or financial re-organisation; or
y the disappearance of an active market for that financial asset because of financial difficulties.
The amount of the impairment loss recognised is the difference between the asset’s carrying amount and the
present value of estimated future cash flows reflecting the amount of collateral and guarantee, discounted at
the financial asset’s original effective interest rate.
The carrying amount of the financial asset is reduced by the impairment loss directly for all financial assets with
the exception of loans and advances and due from banks, where the carrying amount is reduced through the
use of an allowance account. When a loan is considered uncollectible, it is written off against the allowance
account. Subsequent recoveries of amounts previously written off are credited against the allowance account.
Changes in the carrying amount of the allowance account are recognised in the consolidated income statement.
If, in a subsequent period, the amount of the impairment loss decreases and the decrease can be related
objectively to an event occurring after the impairment was recognised, the previously recognised impairment
loss is reversed through the consolidated income statement to the extent that the carrying amount of the
financial asset at the date the impairment is reversed does not exceed what the amortised cost would have
been had the impairment not been recognised.
Impairment of loans and advances measured at amortised costs are assessed by the Group as follows:
(i) Individually assessed loans
These represent mainly corporate loans which are assessed individually by the Group’s Credit Risk Unit in order
to determine whether there exists any objective evidence that a loan is impaired.
Impaired loans are measured based on the present value of expected future cash flows discounted at the loan’s
effective interest rate or at the loan’s observable market price, if available, or at the fair value of the collateral
if the recovery is entirely collateral dependent.
Impairment loss is calculated as the difference between the loans carrying value and its present value calculated
as above.
Notes to the consolidated financial statements for the year ended 31 December 2016 (continued)

Mashreq Annual Report 2016 87
3 Summary of significant accounting policies (continued)
3.14 Financial instruments (continued)
3.14.1 Financial assets (continued)
Impairment of financial assets (continued)
(ii) Collectively assessed loans
Impairment losses of collectively assessed loans include the allowances on:
(a) Performing commercial and other loans
Where individually assessed loans are evaluated and no evidence of loss is present or has been
identified, there may be losses based upon risk rating and expected migrations, product or industry
characteristics.
Impairment covers losses which may arise from individual performing loans that are impaired at the
reporting date but were not specifically identified as such until sometime in the future.
The estimated impairment is calculated by the Group’s management for each identified portfolio and
based on historical experience, credit rating and expected migrations in addition to the assessed
inherent losses which are reflected by the economic and credit conditions and taking into account the
requirements of the Central Bank of the U.A.E.
(b) Retail loans with common features which are rated on a portfolio basis and where individual loan
amounts are not significant
Impairment of retail loans is calculated by applying a formulaic approach whereby a provision of
25% of loan balance is made when it is past due by more than 90 days and less than 120 days and a
provision of 50% of loan balance is made when it is past due by more than 120 days and less than 180
days. All loans that are past due by more than 180 days are written off or are fully provided for net of
collateral held.
Derecognition of financial assets
The Group derecognises a financial asset only when the contractual rights to the cash flows from the asset
expire, or when it transfers the financial asset and substantially all the risks and rewards of ownership of the
asset to another entity. If the Group neither transfers nor retains substantially all the risks and rewards of
ownership and continues to control the transferred asset, the Group recognises its retained interest in the
asset and an associated liability for amounts it may have to pay. If the Group retains substantially all the risks
and rewards of ownership of a transferred financial asset, the Group continues to recognise the financial asset
and also recognises a collateralised borrowing for the proceeds received.
On derecognition of a financial asset measured at amortised cost, the difference between the asset’s carrying
amount and the sum of the consideration received and receivable is recognised in the consolidated income
statement.
On derecognition of a financial asset that is classified as FVTOCI, the cumulative gain or loss previously
accumulated in the investments revaluation reserve is not reclassified to the consolidated income statement,
but is reclassified to retained earnings.
Notes to the consolidated financial statements for the year ended 31 December 2016 (continued)

Mashreq Annual Report 201688
3 Summary of significant accounting policies (continued)
3.14 Financial instruments (continued)
3.14.2 Financial liabilities and equity instruments
Classification as debt or equity
Debt and equity instruments issued by the Group are classified as either financial liabilities or as equity in
accordance with the substance of the contractual arrangement and the definitions of a financial liability and
an equity instrument.
Equity instruments
An equity instrument is any contract that evidences a residual interest in the assets of an entity after deducting
all of its liabilities. Equity instruments issued by the Group are recognised at the proceeds received, net of
direct issue costs.
Financial liabilities
All financial liabilities are subsequently measured at amortised cost using the effective interest rate method
or at FVTPL.
However, financial liabilities that arise when a transfer of a financial asset does not qualify for derecognition
or when the continuing involvement approach applies, financial guarantee contracts issued by the Group, and
commitments issued by the Group to provide a loan at below-market interest rate are measured in accordance
with the specific accounting policies set out below.
Financial liabilities subsequently measured at amortised cost
Financial liabilities that are not held-for-trading and are not designated as at FVTPL are measured at amortised
cost at the end of subsequent accounting periods. The carrying amounts of financial liabilities that are
subsequently measured at amortised cost are determined based on the effective interest method. Interest
expense that is not capitalised as part of costs of an asset is included in the consolidated income statement.
The effective interest method is a method of calculating the amortised cost of a financial liability and of
allocating interest expense over the relevant period. The effective interest rate is the rate that exactly discounts
estimated future cash payments (including all fees and points paid or received that form an integral part of
the effective interest rate, transaction costs and other premiums or discounts) through the expected life of the
financial liability, or (where appropriate) a shorter period, to the net carrying amount on initial recognition.
Foreign exchange gains and losses
For financial liabilities that are denominated in a foreign currency and are measured at amortised cost at the
end of each reporting period, the foreign exchange gains and losses are determined based on the amortised
cost of the instruments and are recognised in the consolidated income statement.
The fair value of financial liabilities denominated in a foreign currency is determined in that foreign currency
and translated at the spot rate at the end of the reporting period.
Financial guarantee contracts
A financial guarantee contract is a contract that requires the issuer to make specified payments to reimburse
the holder for a loss it incurs because a specified debtor fails to make payments when due in accordance with
the terms of a debt instrument.
Notes to the consolidated financial statements for the year ended 31 December 2016 (continued)

Mashreq Annual Report 2016 89
3 Summary of significant accounting policies (continued)
3.14 Financial instruments (continued)
3.14.2 Financial liabilities and equity instruments (continued)
Financial guarantee contracts (continued)
Financial guarantee contracts issued by the Group are initially measured at their fair values and, if not designated
as at FVTPL, are subsequently measured at the higher of:
y the amount of the obligation under the contract, as determined in accordance with IAS 37 Provisions,
Contingent Liabilities and Contingent Assets; and
y the amount initially recognised less, where appropriate, cumulative amortisation recognised in
accordance with the revenue recognition policies.
Derecognition of financial liabilities
The Group derecognises financial liabilities when, and only when, the Group’s obligations are discharged,
cancelled or they expire. The difference between the carrying amount of the financial liability derecognised
and the consideration paid and payable, including any non-cash assets transferred or liabilities assumed, is
recognised in consolidated income statement.
Financial liabilities at FVTPL
Financial liabilities are classified as ‘at FVTPL’ when the financial liability is either held for trading or it is
designated as FVTPL.
A financial liability is classified as held for trading if:
y it has been incurred for the purpose of repurchasing in the near term; or
y on initial recognition it is part of the portfolio of identified financial instruments that the Group
manages together and has a recent actual pattern of short-term profit making; or
y it is a derivative that is not designated and effective as a hedging instrument
A financial liability other than a financial liability held for trading may be designated as at FVTPL upon initial
recognition if:
y such a designation eliminates or significantly reduces a measurement or recognition inconsistency
that would otherwise arise; or
y the financial liability forms a part of a group of assets or financial liability or both, which is managed
and its performance is evaluated on a fair value basis, in accordance with the Group’s documented
risk management or investment strategy, and information about the grouping is provided internally
on that basis; or
y it forms part of a contract containing one or more embedded derivatives, and IFRS 9 Financial
Instruments permits the entire contract (asset or liability) to be designated as FVTPL.
Notes to the consolidated financial statements for the year ended 31 December 2016 (continued)

Mashreq Annual Report 201690
3 Summary of significant accounting policies (continued)
3.14 Financial instruments (continued)
3.14.2 Financial liabilities and equity instruments (continued)
Financial liabilities at FVTPL (continued)
Financial liabilities at FVTPL are stated at fair value, with any gains or losses arising on the remeasurement
recognised in profit or loss. The net gain or loss recognised in profit or loss incorporates any interest paid on
the financial liability and is included in the ‘other gains and losses’ line item.
3.15 Offsetting of financial assets and liabilities
Financial assets and liabilities are offset and reported net in the consolidated statement of financial position
only when there is a legally enforceable right to set off the recognised amounts or when the Group intends to
settle on a net basis, or to realise the asset and settle the liability simultaneously.
3.16 Derivative financial instruments
The Group deals with derivatives such as forward foreign exchange contracts, interest rate futures, forward rate
agreements, currency and interest rate swaps, currency and interest rate options (both written and purchased).
Further details of derivatives financial instruments are disclosed in Note 41.
Derivatives are initially recognised at fair value at the date the derivative contracts are entered into and are
subsequently remeasured to their fair value at the end of each reporting period. The resulting gain or loss is
recognised in consolidated income statement immediately unless the derivative is designated and effective as
a hedging instrument, in which event the timing of the recognition in consolidated income statement depends
on the nature of the hedge relationship. All derivatives are carried at their fair values as assets where the fair
values are positive and as liabilities where the fair values are negative.
Fair values are generally obtained by reference to quoted market prices, discounted cash flow models and
recognised pricing models as appropriate.
Embedded derivatives
Derivatives embedded in non-derivative host contracts that are not financial assets within the scope of IFRS
9 Financial Instruments (e.g. financial liabilities) are treated as separate derivatives when their risks and
characteristics are not closely related to those of the host contracts and the host contracts are not measured
at FVTPL.
3.17 Hedge accounting
The Group designates certain hedging instruments, which include derivatives and non-derivatives in respect of
foreign currency risk, as either fair value hedges or hedges of net investments in foreign operations. Hedges of
foreign exchange risk on firm commitments are accounted for as cash flow hedges.
At the inception of the hedge relationship, the Group documents the relationship between the hedging
instrument and the hedged item, along with its risk management objectives and its strategy for undertaking
various hedge transactions. Furthermore, at the inception of the hedge and on an ongoing basis, the Group
documents whether the hedging instrument is highly effective in offsetting changes in fair values or cash flows
of the hedged item attributable to the hedged risk.
Note 41 sets out details of the fair values of the derivative instruments used for hedging purposes.
Notes to the consolidated financial statements for the year ended 31 December 2016 (continued)

Mashreq Annual Report 2016 91
3 Summary of significant accounting policies (continued)
3.17 Hedge accounting (continued)
Fair value hedges
Changes in the fair value of derivatives that are designated and qualify as fair value hedges are recognised
in the consolidated income statement immediately, together with any changes in the fair value of the
hedged asset or liability that are attributable to the hedged risk. The change in the fair value of the hedging
instrument and the change in the hedged item attributable to the hedged risk are recognised in the consolidated
income statement.
Hedge accounting is discontinued when the Group revokes the hedging relationship, when the hedging
instrument expires or is sold, terminated, or exercised, or when it no longer qualifies for hedge accounting. The
fair value adjustment to the carrying amount of the hedged item arising from the hedged risk is amortised to
the consolidate income statement from that date.
Cash flow hedges
The effective portion of changes in the fair value of derivatives that are designated and qualify as cash flow
hedges is recognised in the consolidated statement of other comprehensive income and accumulated under
the heading of cash flow hedging reserve. The gain or loss relating to the ineffective portion is recognised
immediately in consolidated income statement, and is included in the other income line item.
Amounts previously recognised in the consolidated statement of comprehensive income and accumulated in
equity are reclassified to consolidated income statement in the periods when the hedged item affects in the
recognition of a non-financial assets or a non-financial liability, the gains and losses previously recognised in
consolidated statement of comprehensive income and accumulated in equity are transferred from equity and
included in the initial measurement of the cost of the non-financial asset or non-financial liability.
Hedge accounting is discontinued when the Group revokes the hedging relationship, when the hedging
instrument expires or is sold, terminated, or exercised, or when it no longer qualifies for hedge accounting. Any
gain or loss recognised in the consolidated statement of comprehensive income and accumulated in equity at
that time remains in equity and is recognised when the forecase transaction is ultimately recognised in profit
or loss. When a forecast transaction is no longer expected to occur, the gain or loss accumulated in equity is
recognised immediately in the consolidated income statement.
Hedges of net investments in foreign operations
Hedges of net investments in foreign operations are accounted for similarly to cash flow hedges. Any gain or
loss on the hedging instrument relating to the effective portion of the hedge is recognised in the consolidated
statement of comprehensive income and accumulated under the heading of cumulative translation reserve. The
gain or loss relating to the ineffective portion is recognised immediately in the consolidated income statement.
Gains and losses on the hedging instrument relating to the effective portion of the hedge accumulated in the
cumulative translation reserve are reclassified to the consolidated income statement on the disposal of the
foreign operation.
Notes to the consolidated financial statements for the year ended 31 December 2016 (continued)

Mashreq Annual Report 201692
3 Summary of significant accounting policies (continued)
3.18 Insurance contracts
3.18.1 Product classification
Insurance contracts are those contracts when the Group (the insurer) has accepted the significant insurance risk
from another party (policyholder) by agreeing to compensate the policyholder if a specified uncertain future
event (the insured event) adversely affects the policyholder. As a general guideline, the Group determines
whether it has significant insurance risk by comparing benefits paid with benefits payable if the insured event
did not occur. An insurance contract can also transfer financial risk.
Investment contracts are those contracts that transfer significant financial risk. Financial risk is the risk of a
possible future change in one or more of a specified interest rate, financial instrument price, commodity price,
foreign exchange rate, index of price or rates, credit rating or credit index or other variable provided in the case
of a non-financial variable, that the variable is not specific to a party to the contract.
Once a contract has been classified as an insurance contract, it remains an insurance contract for the remainder
of its lifetime even if the insurance risk reduces significantly during this period unless all rights and obligations
are extinguished or expire. An investment contract can however be classified as an insurance contract after its
inception if the insurance risk becomes significant.
Some insurance contracts and investment contracts contain discretionary participating features (DPF) which entitle
the contract holder to receive, as a supplement to the standard guaranteed benefits, additional benefits:
y that are likely to be a significant portion of the total contractual benefits;
y whose amount or timing is contractually at the discretion of the insurer;
y that are contractually based on:
(i) the performance of a specified pool of contracts or a specified type of contract,
(ii) realised/unrealised investment returns on a specified pool of assets held by the issuer or,
(iii) the profit or loss of the Company, fund or other entity that issues that contract.
Under IFRS 4 Insurance Contracts, DPF can be either treated as an element of equity or as a liability, or can be
split between the two elements. The Group policy is to treat all DPF as liabilities within insurance or investment
contract liabilities.
The policyholder bears the financial risks relating to some insurance contracts or investment contracts. Such
products are usually unit-linked contracts.
3.18.2 Recognition and measurement
Insurance contracts are classified into two main categories, depending on the nature of the risk, duration of the
risk and whether or not the terms and conditions are fixed.
These contracts are general insurance contracts and life assurance contracts.
Notes to the consolidated financial statements for the year ended 31 December 2016 (continued)

Mashreq Annual Report 2016 93
3 Summary of significant accounting policies (continued)
3.18 Insurance contracts (continued)
3.18.3 General insurance contracts
Premiums are recognised as revenue (earned premiums) proportionally over the period of coverage. The portion
of premium received on in-force contracts that relates to unexpired risks at the end of the reporting period
is reported as the unearned premium liability. Premiums are shown in the profit and loss before deduction
of commission.
Claims and loss adjustment expenses are charged to the profit or loss as incurred based on the estimated
liability for compensation owed to contract holders or third parties damaged by the contract holders.
3.18.4 Life assurance contracts
In respect of the short term life assurance contracts, premiums are recognised as revenue (earned premiums)
proportionately over the period of coverage. The portion of the premium received in respect of in-force
contracts that relates to unexpired risks at the end of the reporting period is reported as the unearned premium
liability. Premiums are shown before the deduction of the commission.
In respect of long term life assurance contracts, premiums are recognised as revenue (earned premiums) when
they become payable by the contract holder. Premiums are shown before deduction of commission.
Premiums for group credit life policies are recognised when paid by the contract holder.
A liability for contractual benefits that are expected to be incurred in future is recorded when the premiums
are recognised. The liability is based on the assumptions as to mortality, persistency, maintenance expenses
and investment income that are established at the time the contract is issued. A margin for adverse deviation
is included in the assumptions.
Where a life assurance contract has a single premium or limited number of premium payments due over a
significantly shorter period than the period during which the benefits are provided, the excess of the premiums
payable over the valuation premiums is deferred and recognised as income in line with the decrease of unexpired
insurance risk of the contract in-force or for annuities in force, in line with the decrease of the amount of future
benefits expected to be paid.
The liabilities are recalculated at the end of each reporting period using the assumptions established at the
inception of the contract.
Claims and benefits payable to contract holders are recorded as expenses when they are incurred.
3.18.5 Reinsurance contracts
Contracts entered into by the Group with reinsurers under which the Group is compensated for losses on one
or more contracts issued by the Group and that meet the classification requirements for insurance contracts
are recognised as reinsurance contracts. Contracts that do not meet these classification requirements are
classified as financial assets. Insurance contracts entered into by the Group under which the contract holder
is another insurer, are included in insurance contracts. The benefits to which the Group is entitled under its
reinsurance contracts are recognised as reinsurance contract assets.
Notes to the consolidated financial statements for the year ended 31 December 2016 (continued)

Mashreq Annual Report 201694
3 Summary of significant accounting policies (continued)
3.18 Insurance contracts (continued)
3.18.5 Reinsurance contracts (continued)
The Group assesses its reinsurance contract assets for impairment on a regular basis. If there is objective
evidence that the reinsurance contract assets are impaired, the Group reduces the carrying amount of the
reinsurance contract assets to their recoverable amounts and recognises that impairment loss in the profit or
loss. Amounts recoverable from or due to reinsurers are measured consistently with the amounts associated
with the reinsured insurance contracts and in accordance with the terms of each reinsurance contract.
Reinsurance liabilities are primarily premiums payable for reinsurance contracts and are recognised as expenses
when due.
The Group also assumes reinsurance risk in the normal course of business for life insurance and general
insurance contracts where applicable. Premium and claims on assumed reinsurance contracts are recognised as
revenue or expenses in the same manner as they would be if the reinsurance were considered direct business,
taking into account the product classification of the reinsured business. Reinsurance liabilities represent
balances due to reinsurance companies. Amounts payable are estimated in a manner consistent with the
related reinsurance contract.
Reinsurance assets or liabilities are derecognised when the contractual rights are extinguished or expire or
when the contract is transferred to another party.
3.18.6 Insurance contract liabilities
(a) Unearned premium reserve
At the end of the reporting period, proportions of net retained premium of the general insurance and medical
insurance are provided to cover portions of risks which have not expired. The reserves are calculated on a time-
proportion basis whilst maintaining the minimum reserve requirements required by the regulations relating to
insurance companies. Unearned premium for group life and individual life classes of business is estimated by
the Group’s actuary in the calculation of the insurance contracts liabilities for life assurance business.
(b) Additional reserve
The additional reserve comprises of the provisions made for:
y the estimated excess of potential claims over unearned premiums (premium deficiency),
y the claims incurred but not reported at the end of the reporting period (IBNR), and
y the potential shortfall in the estimated amounts of the unpaid reported claims.
The reserve represents management’s best estimates of the potential liabilities at the end of the reporting
period. The liabilities for unpaid reported claims are estimated using the input of assessments for individual
cases reported to the Group and management estimates based on past claims settlement trends for the claims
incurred but not reported. At the end of each reporting period, prior year claims estimates are reassessed for
adequacy by the Group’s actuary and changes are made to the provision.
Notes to the consolidated financial statements for the year ended 31 December 2016 (continued)
Mashreq Annual Report 2016 95
3 Summary of significant accounting policies (continued)
3.18 Insurance contracts (continued)
3.18.6 Insurance contract liabilities (continued)
(c) Life assurance fund
The life assurance fund is determined by independent actuarial valuation of future policy benefits at the end
of each reporting period. Actuarial assumptions include a margin for adverse deviation and generally vary
by type of policy, year of issue and policy duration. Mortality and withdrawal rate assumptions are based on
experience and industry mortality tables. Adjustments to the balance of the fund are effected by charging to
consolidated statement of income.
(d) Unit linked liabilities
For unit linked policies, liability is equal to the policy account values. The account value is the number of units
times the bid price.
(e) Outstanding claims
Insurance contract liabilities towards outstanding claims are recognised for all claims intimated and unpaid
at the end of the reporting period. These liabilities are known as the outstanding claims provision, which are
based on the estimated ultimate cost of all claims incurred but not settled at the end of the reporting period
after reduction for the expected value of salvage and other recoveries. Delays can be experienced in the
notification and settlement of certain types of claims, therefore the ultimate cost of claims cannot be known
with certainty at the end of the reporting period. The liability is not discounted for the time value of money.
No provision for equalisation or catastrophic reserves is recognised. The liability is derecognised when it is
expired, discharged or cancelled.
3.18.7 Policy acquisition costs
Commissions and other acquisition costs that vary with and are related to securing new insurance contracts
and renewing existing insurance contracts are recognised as expenses when incurred.
Acquisition costs incurred in securing long-term investments contracts are deferred and amortised over a
period of four years.
3.18.8 Salvage and subrogation reimbursements
Estimates of salvage and subrogation reimbursements are considered as an allowance in the measurement of
the insurance liability for claims.
3.18.9 Liability adequacy test
At the end of each reporting period, liability adequacy tests are performed to ensure the adequacy of the
insurance contract liabilities. In performing these tests, current best estimates of future contractual cash flows
and claims handling and administration expenses, as well as investment income from the assets backing such
liabilities, are used. Any deficiency is immediately charged to the profit or loss.
Notes to the consolidated financial statements for the year ended 31 December 2016 (continued)
Mashreq Annual Report 201696
3 Summary of significant accounting policies (continued)
3.18 Insurance contracts (continued)
3.18.10 Receivables and payables related to insurance contracts
Receivables and payables are recognised when due. These include amounts due to and from agents, brokers,
insurance contract holders and reinsurance companies.
If there is objective evidence that the insurance receivable is impaired, the Group reduces the carrying
amount of the insurance receivable accordingly and recognises that impairment loss in the consolidated
income statement.
3.19 Taxation
Where applicable, provision is made for current and deferred taxes arising from the operating results
of overseas branches that are operating in taxable jurisdictions.
3.20 Islamic financing and investment products
In addition to conventional banking products, the Group offers its customers certain non-interest based banking
products, which are approved by its Sharia’a Supervisory Board.
All Islamic banking products are accounted for in conformity with the accounting policies described below:
(i) Definitions
The following terms are used in Islamic financing:
Murabaha
An agreement whereby the Group sells to a customer a commodity or an asset, which the Group has purchased
and acquired, based on a promise received from the customer to buy the item purchased according to specific
terms and conditions. The selling price comprises the cost of the commodity and an agreed profit margin.
Ijara
An agreement whereby the Group acting as a lesser, purchases or constructs an asset for lease according to
the customer’s request (lessee), based on his promise to lease the asset for an agreed rent and a specific period
that could end by transferring the ownership of the leased asset to the lessee.
Musharaka
An agreement between the Group and a customer to contribute to a certain investment enterprise or the
ownership of a certain property concluding with the acquisition by the customer of the full ownership. The
profit or loss is shared as per the terms of the agreement.
Mudaraba
An agreement between the Group and a customer whereby the Group provides a certain amount of funds,
which the customer then invests in a specific enterprise or activity against a specific share in the profit. The
customer bears the loss in case of default, negligence or violation of any of the terms and conditions of the
Mudaraba.
Notes to the consolidated financial statements for the year ended 31 December 2016 (continued)

Mashreq Annual Report 2016 97
3 Summary of significant accounting policies (continued)
3.20 Islamic financing and investment products (continued)
(i) Definitions (continued)
Wakala
An agreement whereby the Group provides a certain sum of money to an agent who invests it according to
specific conditions in return for a certain fee (a lump sum of money or a percentage of the amount invested).
The agent is obliged to return the invested amount in case of default, negligence or violation of any of the
terms and conditions of the Wakala.
(ii) Accounting policy
Islamic financing and investment products are measured at amortised cost, using the effective profit method,
less any amounts written off, allowance for doubtful accounts and unearned income.
The effective profit rate is the rate that exactly discounts estimated future cash flow through the expected life
of the financial asset or liability, or, where appropriate, a shorter period.
Allowance for impairment is made against Islamic financing and investment products when their recovery
is in doubt taking into consideration IFRS requirements (as explained in Note 3.14.1). Islamic financing and
investment products are written off only when all possible courses of action to achieve recovery have proved
unsuccessful.
(iii) Revenue recognition policy
Income from Islamic financing and investing assets are recognised in the consolidated income statement using
the effective profit method.
The calculation of the effective profit rate includes all fees paid or received, transaction costs, and discounts
or premiums that are an integral part of the effective profit rate. Transaction costs are incremental costs that
are directly attributable to the acquisition, issue or disposal of a financial asset.
Murabaha
Murabaha income is recognised on effective profit rate basis over the period of the contract based on the
principal amounts outstanding.
Ijara
Ijara income is recognised on effective profit rate basis over the lease term.
Musharaka
Income is accounted for on the basis of the reducing balance on a time proportion basis that reflects the
effective yield on the asset.
Mudaraba
Income or losses on Mudaraba financing are recognised on an accrual basis if they can be reliably estimated.
Otherwise, income is recognised on distribution by the Mudarib, whereas the losses are charged to income on
their declaration by the Mudarib.
Notes to the consolidated financial statements for the year ended 31 December 2016 (continued)

Mashreq Annual Report 201698
3 Summary of significant accounting policies (continued)
3.20 Islamic financing and investment products (continued)
(iii) Revenue recognition policy (continued)
Wakala
Estimated income from Wakala is recognised on an accrual basis over the period, adjusted by actual income
when received. Losses are accounted for on the date of declaration by the agent.
(iv) Islamic customers’ deposits and distributions to depositors
Islamic customers’ deposits are initially measured at fair value which is normally consideration received net of
directly attributable transaction costs incurred, and subsequently measured at their amortised cost using the
effective profit method.
Distributions to depositors (Islamic products) are calculated according to the Group’s standard procedures and
are approved by the Group’s Sharia’a Supervisory Board.
4 Critical accounting judgements and key sources of estimation uncertainty
In the application of the Group’s accounting policies, which are described in Note 3, the management is required
to make judgements, estimates and assumptions about the carrying amounts of assets and liabilities that are
not readily apparent from other sources. The estimates and associated assumptions are based on historical
experience and other factors that are considered to be relevant. Actual results may differ from these estimates.
The estimates and underlying assumptions are reviewed on an ongoing basis. Revisions to accounting estimates
are recognised in the period in which the estimate is revised if the revision affects only that period or in the
period of the revision and future periods if the revision affects both current and future periods.
Significant areas where management has used estimates, assumptions or exercised judgements are as follows:
4.1 Impairment of financial assets measured at amortised cost
The Group’s accounting policy for allowances in relation to impaired financial assets carried at amortised cost
is described in Note 3. Impairment is calculated on the basis of discounted estimated future cash flows or by
applying a certain percentage on the performing unclassified loans and advances book based on market trend
and historical pattern of defaults. For retail loans and advances impairment is calculated based on a formulaic
approach depending on past due instalments and payments.
The allowance for loans and advances losses is established through charges to income in the form of an
allowance. Increases and decreases in the allowance due to changes in the measurement of the impaired loans
and advances are included in the allowance for loans and advances losses and affect the consolidated income
statement accordingly.
Individually assessed loans and advances
Impairment losses for individually assessed loans and advances are determined by an evaluation of exposure
on a case-by-case basis. This procedure is applied to all classified corporate loans and advances which are
individually significant accounts or are not subject to the portfolio-based approach.
Notes to the consolidated financial statements for the year ended 31 December 2016 (continued)

Mashreq Annual Report 2016 99
4 Critical accounting judgements and key sources of estimation uncertainty
(continued)
4.1 Impairment of financial assets measured at amortised cost (continued)
Individually assessed loans and advances (continued)
The following factors are considered when determining impairment losses on individually assessed accounts:
y The customer’s aggregate borrowings.
y The customer’s risk rating, i.e. ability to perform profitable business and generate sufficient cash to
repay the borrowed amount.
y The value of the collateral and the probability of successful repossession.
y The cost involved to recover the debts.
The Group’s policy requires regular review of the level of impairment allowances on individual facilities.
Impaired loans and advances continue to be classified as impaired unless they are brought fully current and the
collection of scheduled interest and principal is considered probable.
Collectively assessed loans and advances
The management of the Group assesses, based on historical experience and the prevailing economical and
credit conditions, the magnitude of loans and advances which may be impaired but not identified as of the
reporting date.
These portfolio allowances are reassessed on a periodical basis and allowances are adjusted accordingly based
on the judgement of management and guidance received from the Central Bank of the UAE.
Collectively assessed allowances are also made in respect of losses incurred in portfolios of retail loans with
common features and where individual loan amounts are not significant.
Impairment of retail loans is calculated by applying a formulaic approach whereby a provision of 25% of loan
balance is made when it is past due by more than 90 days and less than 120 days, and a provision of 50% of
loan balance is made when is past due by more than 120 days and less than 180 days. All loans that are past
due by more than 180 days are written off or are fully provided for net of collateral.
4.2 Property and equipment
The cost of property and equipment is depreciated over the estimated useful life, which is based on expected
usage of the asset, expected physical wear and tear, which depends on operational factors. The management
has not considered any residual value as it is deemed immaterial.
4.3 Fair value of financial instruments
Where the fair values of financial assets and financial liabilities recorded on the consolidated statement of
financial position cannot be derived from active markets, they are determined using a variety of valuation
techniques that include the use of mathematical models. The inputs to these models are derived from
observable market data where possible, but where observable market data are not available, judgment is
required to establish fair values. The judgments include considerations of liquidity and model inputs such as
volatility for longer dated derivatives and discount rates, prepayment rates and default rate assumptions for
asset backed securities. The management believes that the chosen valuation techniques and assumptions used
are appropriate in determining the fair value of financial instruments.
Notes to the consolidated financial statements for the year ended 31 December 2016 (continued)

Mashreq Annual Report 2016100
4 Critical accounting judgements and key sources of estimation uncertainty
(continued)
4.4 Derivative financial instruments
Subsequent to initial recognition, the fair values of derivative financial instruments measured at fair value are
generally obtained by reference to quoted market prices, discounted cash flow models, recognised market
accepted pricing models and from counterparty statements. When prices are not available, fair values are
determined by using valuation techniques which refer to observable market data. These include comparison
with similar instruments where market observable prices exist, discounted cash flow analysis and other
valuation techniques commonly used by market participants. The main factors which management considers
when applying a model are:
(a) The likelihood and expected timing of future cash flows on the instrument. These cash flows are
usually governed by the terms of the instrument, although management judgment may be required
in situations where the ability of the counterparty to service the instrument in accordance with the
contractual terms is in doubt; and
(b) An appropriate discount rate of the instrument. Management determines this rate by observing market
pricing data. When valuing instruments by reference to comparable instruments, management takes
into account the maturity and structure with which the position held is being compared.
4.5 Investment properties
The Group values its investment properties at fair value on the basis of market valuations prepared by
independent property consultants. The valuations are based on assumptions which are mainly based on market
conditions existing at each reporting date. Therefore, any future change in the market conditions could have
an impact on the fair value.
4.6 The ultimate liability arising from claims made under insurance contracts
The estimation of ultimate liability arising from the claims made under insurance contracts is the Group’s most
critical accounting estimate. There are sources of uncertainty that need to be considered in the estimate of
the liability that the Group will eventually pay for such claims. Estimates have to be made at the end of the
reporting period for both the expected ultimate cost of claims reported and for the expected ultimate cost of
claims incurred but not reported (“IBNR”). Liabilities for unpaid reported claims are estimated using the input
of assessments for individual cases reported to the Group and management estimates based on past claims
settlement trends for the claims incurred but not reported. At the end of each reporting period, prior year
claims estimates are reassessed for adequacy and changes are made to the provision.
4.7 Classification and measurement of financial assets
The classification and measurement of the financial assets depend on the management’s business model for
managing its financial assets and on the contractual cash flow characteristics of the financial asset assessed.
Management is satisfied that the Group’s investments in securities are appropriately classified and measured.
4.8 Fair value measurements and valuation processes
Some of the Group’s assets and liabilities are measured at a fair value for financial reporting purposes. In
estimating the fair value of an asset or a liability, the Group uses market-observable data to the extent it is
available. Where Level 1 inputs are not available, the Group engages independent professionally qualified
valuers to perform the valuation. The Bank works closely with the qualified external valuers to establish the
appropriate valuation techniques and inputs to the model.
Notes to the consolidated financial statements for the year ended 31 December 2016 (continued)
Mashreq Annual Report 2016 101
5 Cash and balances with central banks
(a) The analysis of the Group’s cash and balances with central banks as at 31 December is as follows:
2016 2015AED’000 AED’000
Cash on hand 1,049,505 845,591Balances with central banks:
Current accounts and other balances 6,774,795 8,203,244Statutory deposits 6,905,282 6,674,628Certificates of deposit 3,900,000 3,700,000
18,629,582 19,423,463
(b) The geographical analysis of the cash and balances with central banks is as follows:
2016 2015AED’000 AED’000
Balances within the U.A.E. 12,048,216 10,876,322Balances outside the U.A.E. 6,581,366 8,547,141
18,629,582 19,423,463
(c) The Group is required to maintain statutory deposits with various central banks on demand, time
and other deposits as per the statutory requirements. The statutory deposits are not available for
use in the Group’s day-to-day operations. Cash on hand and current accounts and other balances are
non-interest-bearing. Certificate of deposits are at an average interest rate of 0.74% (2015: 0.40%)
per annum.
6 Deposits and balances due from banks
(a) The analysis of the Group’s deposits and balances due from banks is as follows:
2016 2015AED’000 AED’000
Demand 1,418,631 2,011,629Overnight 55,000 192,997Time 17,194,119 12,805,486
18,667,750 15,010,112Less: Allowance for impairment - (122)
18,667,750 15,009,990
Notes to the consolidated financial statements for the year ended 31 December 2016 (continued)

Mashreq Annual Report 2016102
6 Deposits and balances due from banks (continued)
(b) The above represent deposits and balances due from:
2016 2015AED’000 AED’000
Banks within the U.A.E. 3,454,654 1,451,658Banks outside the U.A.E. 15,213,096 13,558,454
18,667,750 15,010,112
Less: Allowance for impairment - (122)
18,667,750 15,009,990
(c) Allowance for impairment movement
2016 2015AED’000 AED’000
At 1 January 122 24,444Charged during the year (Note 32) - 261(Reversal of)/Interest in suspense (122) 1,790Written off during the year - (26,373)
At 31 December - 122
7 Other financial assets
(a) The analysis of the Group’s other financial assets as at 31 December is as follows:
2016 2015AED’000 AED’000
Other financial assets measured at fair value(i) Financial assets measured at fair value through
profit and loss (FVTPL)
Debt securitiesCorporate bonds and treasury bills 1,008,996 2,624,985Sukuk 104,400 36,027
1,113,396 2,661,012Equities Quoted - 16,548Unquoted 215 508
215 17,056Mutual and other funds 536,909 589,742
1,650,520 3,267,810
Notes to the consolidated financial statements for the year ended 31 December 2016 (continued)

Mashreq Annual Report 2016 103
7 Other financial assets (continued)
(ii) Financial assets measured at fair value through other comprehensive income (FVTOCI)
EquitiesQuoted 384,214 402,783Unquoted 348,294 216,650
732,508 619,433Mutual and other funds [Note 7(g)] 36,171 37,722
768,679 657,155
Total other financial assets measured at fair value (A) 2,419,199 3,924,965
(iii) Financial assets measured at amortised cost
Debt securitiesBonds 10,014,326 7,141,930Sukuk 946,970 963,140Less: Allowance for impairment (111,998) (111,998)
Total other financial assets measured at amortised cost (B) 10,849,298 7,993,072
Total other financial assets [(A) +(B)] 13,268,497 11,918,037
(b) The geographic analysis of other financial assets is as follows:
2016 2015AED’000 AED’000
Balances within the U.A.E. 3,494,333 3,338,488
Balances outside the U.A.E. 9,774,164 8,579,549
13,268,497 11,918,037
(c) The analysis of other financial assets by industry sector is as follows:
2016 2015AED’000 AED’000
Government and Public Sector 5,935,271 5,323,051Commercial and Business 1,582,603 750,371Financial Institutions 5,471,961 5,039,235Other 278,662 805,380
13,268,497 11,918,037
(d) The movement of the allowance for impairment of financial assets measured at amortised cost during
the year was as follows:
2016 2015AED’000 AED’000
At 1 January 111,998 145,850
Reversal during the year (Note 32) - (33,852)
At 31 December 111,998 111,998
Notes to the consolidated financial statements for the year ended 31 December 2016 (continued)

Mashreq Annual Report 2016104
7 Other financial assets (continued)
(e) The fair value of other financial assets measured at amortised cost amounted to AED 10.76 billion
as of 31 December 2016 (2015: AED 7.92 billion) (Note 43).
(f) The other financial assets measured at amortised costs include debt securities aggregating to notional
value of AED 623 million (fair value of AED 634 million) [2015: AED 750 million (fair value of AED 766
million)] which were collateralised against repurchase agreements with banks (“Repo”) (Note 15).
(g) Other financial assets measured at FVTOCI include AED 36 million (2015: AED 38 million) investment
in Makaseb Income Fund. The fund is managed by the Group and has no fixed maturity or coupon rate
and the fair value of the fund is based on quoted market prices.
(h) Other financial assets measured at FVTPL include AED 225 million (2015: AED 245 million) which
represents investments in Makaseb Income Fund, Mashreq Al Islami Income Fund and Mashreq Arab
Tigers Fund. These funds are managed by the Group and have no fixed maturity and coupon rate. The
fair value of these investments is based on quoted market prices.
(i) As of 31 December 2016, there are no significant concentrations of credit risk for debt instruments
measured at amortised cost. The carrying amount reflected above represents the Group’s maximum
exposure for credit risk for such assets.
(j) During the year ended 31 December 2016, dividends received from financial assets measured at
FVTOCI amounting to AED 27 million (2015: AED 26 million) were recognised as investment income
in the consolidated income statement (Note 29).
(k) During the year ended 31 December 2016, change in fair value of other financial assets measured at
FVTPL amounted to a profit of AED 6 million (2015: a loss of AED 41 million) and was recognised as
investment income in the consolidated income statement (Note 29).
(l) During the year ended 31 December 2016, change in fair value of financial assets measured at FVTOCI
amounted to a profit of AED 12 million (2015: a loss of AED 178 million) and was recognised in the
consolidated statement of comprehensive income.
(m) During the year ended 31 December 2016, the Group purchased and disposed equity shares amounted
to AED 250 million (2015: 206 million) and AED 174 million (2015: 150 million) respectively.
(n) Other financial assets measured at amortised cost include AED 1.4 billion (2015: Nil) which represent
investments reclassified from investments previously measured at FVTPL. Due to this reclassification,
the net profit for the year ended 31 December 2016 has increased by AED 3.4 million (2015: Nil).
Notes to the consolidated financial statements for the year ended 31 December 2016 (continued)

Mashreq Annual Report 2016 105
8 Loans and advances measured at amortised cost
(a) The analysis of the Group’s loans and advances measured at amortised cost is as follows:
2016 2015AED’000 AED’000
Loans 48,720,940 48,201,075
Overdrafts 4,684,243 4,563,342
Credit cards 2,784,011 3,167,485
Other 459,800 389,337
56,648,994 56,321,239Less: Allowance for impairment (3,220,533) (2,766,169)
53,428,461 53,555,070
(b) The analysis of loans and advances measured at amortised cost by industry sector is as follows:
2016 2015AED’000 AED’000
Manufacturing 3,864,320 3,902,432Construction 5,503,953 3,849,313Trade 9,010,501 11,102,269Transport and communication 3,844,615 4,282,487Services 5,698,416 4,820,698Financial institutions 1,824,699 660,483Personal 16,581,261 16,604,872Government and related enterprises 10,304,888 10,807,900Other 16,341 290,785
56,648,994 56,321,239Less: Allowance for impairment (3,220,533) (2,766,169)
53,428,461 53,555,070
(c) In certain cases, the Group continues to carry certain classified doubtful debts and delinquent
accounts on its books even after making 100% provision for impairment. Interest is accrued on most
of those accounts for litigation purposes only and accordingly not taken to consolidated income
statement. The value of loans and advances on which interest is not taken to consolidated income
statement, including fully provided accounts, amounted to AED 2.20 billion at 31 December 2016
(2015: AED 1.95 billion) (Note 43).
(d) The movement of the allowance for impairment and suspended interest of loans and advances
measured at amortised cost during the year was as follows:
2016 2015AED’000 AED’000
At 1 January 2,766,169 3,136,593Impairment allowance for the year (Note 32) 903,225 789,214Interest suspended 117,174 84,835Exchange and other adjustments (46,986) (4,440)Recoveries during the year (Note 32) (3,900) (5,215)Written off during the year (515,149) (1,234,818)
At 31 December 3,220,533 2,766,169
Notes to the consolidated financial statements for the year ended 31 December 2016 (continued)

Mashreq Annual Report 2016106
8 Loans and advances measured at amortised cost (continued)
(e) In determining the recoverability of loans and advances, the Group considers any change in the
credit quality of the loans and advances measured at amortised cost from the date credit was initially
granted up to the end of the reporting period. The concentration of credit risk is limited due to the
fact that the customer base is large and unrelated.
9 Islamic financing and investment products measured at amortised cost
(a) The analysis of the Group’s Islamic financing and investment products measured at amortised cost is
as follows:
2016 2015AED’000 AED’000
Financing
Murabaha 3,694,743 3,907,356Ijara 3,122,514 1,672,605
6,817,257 5,579,961
Investment
Mudaraba 232,355 182,813Wakala 728,496 1,112,519
960,851 1,295,332
Total 7,778,108 6,875,293
Less: Unearned income (157,800) (216,056) Allowance for impairment (55,245) (48,631)
7,565,063 6,610,606
(b) The analysis of Islamic financing and investment products measured at amortised cost by industry
sector is as follows:
2016 2015AED’000 AED’000
Manufacturing 605,964 692,410Construction 1,988,459 1,263,384Trade 799,626 1,229,460Transport and communication 323,846 778,105Services 1,835,386 840,012Financial institutions 278,256 23,576Personal 1,783,541 1,607,374Government and related enterprises 163,030 440,972
Total 7,778,108 6,875,293Less: Unearned income (157,800) (216,056) Allowance for impairment (55,245) (48,631)
7,565,063 6,610,606
(c) The value of Islamic financing and investment products on which profit is not taken to consolidated
income statement, including fully provided accounts, amounted to AED 71 million as at 31 December
2016 (2015: AED 62 million) (Note 43).
Notes to the consolidated financial statements for the year ended 31 December 2016 (continued)
Mashreq Annual Report 2016 107
9 Islamic financing and investment products measured at amortised cost
(continued)
(d) Allowance for impairment movement:
2016 2015AED’000 AED’000
At 1 January 48,631 48,014Impairment allowance/(reversal of impairment) during the year, net(Note 32) 19,775 (382)
(Reversal of)/profit in suspense (145) 999Written off during the year (13,016) -
At 31 December 55,245 48,631
(e) In determining the recoverability of Islamic financing and investment products, the Group considers
any change in the credit quality of the Islamic financing and investment products measured at
amortised cost from the date credit was initially granted up to the end of the reporting period. The
concentration of credit risk is limited due to the fact that the customer base is large and unrelated.
10 Other assets 2016 2015
AED’000 AED’000
Interest receivable 237,529 184,702Property acquired in settlement of debts* 114,498 218,722Prepayments 93,349 109,906Acceptances** 5,831,534 3,499,817Positive fair value of derivatives (Note 41) 863,918 879,233Insurance related receivables 1,728,520 1,351,272Credit card interchange receivables 94,405 84,718Taxes paid in advance 60,309 74,007Other 528,254 526,593
9,552,316 6,928,970
* As of 31 December 2016, property acquired in settlement of debts includes land with a net carrying
amount of AED 113 million (2015: AED 215 million). The land is registered in the name of the Group’s
Chief Executive Officer on trust and for the benefit of the Group.
** Acceptances are recognised as a financial liability (Note 19) in the consolidated statement of financial
position with a contractual right of reimbursement from the customer as a financial asset.
11 Goodwill
During 2012, Oman Insurance Company P.S.C, a subsidiary of the Bank acquired a 51% interest in Dubai Group
Sigorta A.S̨. a company established and registered in Istanbul, Turkey, which is engaged in the business of issuing
short term and long term insurance contracts relating to general insurance. Dubai Group Sigorta A.S̨. was acquired
by the Group with the objective of improving its overall geographical spread.
The Group’s effective proportion of ownership interest in this subsidiary is 32.61% (2015: 32.61%).
Notes to the consolidated financial statements for the year ended 31 December 2016 (continued)

Mashreq Annual Report 2016108
12 Investment properties 2016 2015
AED’000 AED’000
At fair value
At 1 January 527,525 490,317Purchases during the year - 3,012Change in fair value during the year (Note 30) (2,161) 34,196Disposals during the year (4,500) -
At 31 December 520,864 527,525
All of the Group’s investment properties are held under freehold interest and located in the U.A.E.
The fair value of investment properties as at 31 December 2016 has been arrived at on the basis of a valuation
carried out by independent professionally qualified valuers, who are not related to the Group and have appropriate
qualifications and recent market experience in the valuation of properties in the United Arab Emirates.
There has been no change to the valuation technique during the year.
The fair value of the Group’s investment properties is based on unobservable market inputs, i.e. Level 3.
13 Property and equipment
Properties for own use
Furniture, fixtures,
equipment & vehicles
Improvements to freehold properties and other
Capital work-in-progress Total
AED’000 AED’000 AED’000 AED’000 AED’000CostAt 1 January 2015 1,048,743 480,645 440,084 37,789 2,007,261Additions during the year 30,889 93,804 93,992 12,434 231,119Transfers - 6,782 - (6,782) -Disposals/write-offs (723) (80,684) (49,642) - (131,049)
At 31 December 2015 1,078,909 500,547 484,434 43,441 2,107,331Additions during the year 5,336 39,981 77,415 13,331 136,063Reversal of impairment 35,171 - - - 35,171Transfers - 18,936 - (18,936) -Disposals/write-offs (10,660) (56,691) (54,538) - (121,889)
At 31 December 2016 1,108,756 502,773 507,311 37,836 2,156,676
Accumulated depreciation and impairmentAt 1 January 2015 378,441 322,076 200,624 - 901,141Charge for the year (Note 31) 18,615 62,232 67,790 - 148,637Eliminated on disposals/write-offs (240) (73,261) (34,316) - (107,817)
At 31 December 2015 396,816 311,047 234,098 - 941,961Charge for the year (Note 31) 19,854 63,154 72,603 - 155,611Eliminated on disposals/write-offs (2,645) (54,713) (49,176) - (106,534)
At 31 December 2016 414,025 319,488 257,525 - 991,038
Carrying amountAt 31 December 2016 694,731 183,285 249,786 37,836 1,165,638
At 31 December 2015 682,093 189,500 250,336 43,441 1,165,370
Notes to the consolidated financial statements for the year ended 31 December 2016 (continued)
Mashreq Annual Report 2016 109
14 Deposits and balances due to banks
(a) The analysis of deposits and balances due to banks is as follows:
2016 2015AED’000 AED’000
Time 5,743,217 4,086,745Demand 1,538,551 2,262,741Overnight 1,650,308 2,882,427
8,932,076 9,231,913
(b) The above represent borrowings from:
2016 2015AED’000 AED’000
Banks within the U.A.E. 1,734,671 2,848,821Banks outside the U.A.E. 7,197,405 6,383,092
8,932,076 9,231,913
15 Repurchase agreements with banksRepricing Maturity date Interest rate 2016 2015
AED’000 AED’000
6 months May 2016 0.94% per annum - 734,5641 month January 2017 1.43% per annum 35,028 -3 months March 2017 1.43% per annum 468,400 -3 months March 2017 1.53% per annum 102,172 -
605,600 734,564
Collateral given against these Repo borrowings is disclosed in Note 7(f) to the consolidated financial statements.
16 Customers’ deposits
(a) The analysis of customers’ deposits is as follows:
2016 2015AED’000 AED’000
Current and other accounts 41,053,475 38,839,043Saving accounts 3,406,698 3,555,435Time deposits 25,486,951 22,849,312
69,947,124 65,243,790
(b) Analysis by industry sector:
2016 2015AED’000 AED’000
Government and public sector 4,915,852 4,959,337Commercial and business 46,572,635 43,440,872Personal 14,774,919 14,397,197Financial institutions 3,553,712 2,024,684Other 130,006 421,700
69,947,124 65,243,790
Notes to the consolidated financial statements for the year ended 31 December 2016 (continued)

Mashreq Annual Report 2016110
17 Islamic customers’ deposits
(a) The analysis of Islamic customers’ deposits is as follows:
2016 2015AED’000 AED’000
Current and other accounts 3,784,930 2,845,304Saving accounts 124,373 172,525Time deposits 3,184,080 5,373,661
7,093,383 8,391,490
(b) Analysis by industry sector:
2016 2015AED’000 AED’000
Government and public sector 833,475 2,587,933Commercial and business 3,177,647 2,987,231Personal 626,409 696,499Financial institutions 2,455,852 2,119,827
7,093,383 8,391,490
18 Insurance and life assurance funds
Outstanding claims
Unearned premium
reserveAdditional
reserve
Life assurance
fund
Insurance related other
fund Total
AED’000 AED’000 AED’000 AED’000 AED’000 AED’000
At 1 January 2015 427,365 607,983 73,512 546,279 - 1,655,139Increase/(decrease) (29,772) (118,486) 75,570 (22,747) - (95,435)
At 31 December 2015 397,593 489,497 149,082 523,532 - 1,559,704Increase/(decrease) (21,528) 30,075 (34,153) (32,843) 9,503 (48,946)
At 31 December 2016 376,065 519,572 114,929 490,689 9,503 1,510,758
Unearned premium reserve is calculated on time-proportion basis whilst maintaining the minimum reserve
requirements required by the regulations relating to insurance companies. Unearned premium for group life
and individual life classes of business is estimated by the Group’s actuary in the calculation of the insurance
contracts liabilities for all assurance business.
Life assurance fund is determined by independent actuarial valuation of future policy benefits at the end of
each reporting period.
Notes to the consolidated financial statements for the year ended 31 December 2016 (continued)
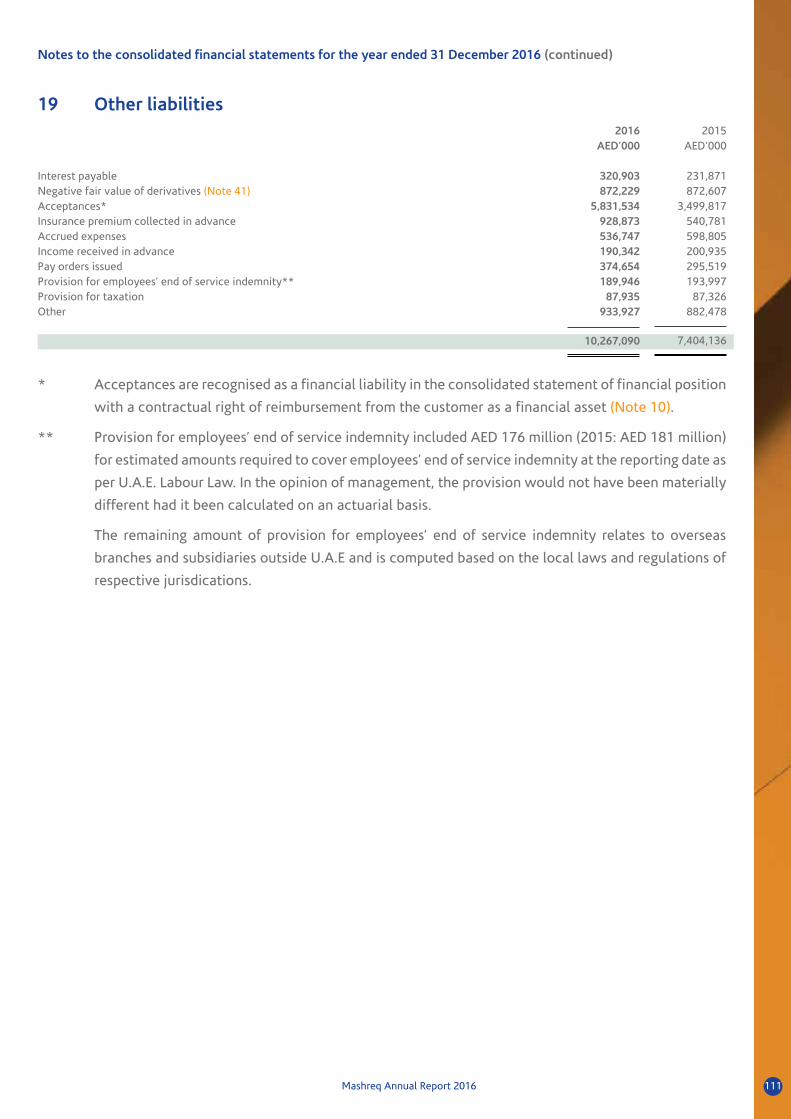
Mashreq Annual Report 2016 111
19 Other liabilities 2016 2015
AED’000 AED’000
Interest payable 320,903 231,871Negative fair value of derivatives (Note 41) 872,229 872,607Acceptances* 5,831,534 3,499,817Insurance premium collected in advance 928,873 540,781Accrued expenses 536,747 598,805Income received in advance 190,342 200,935Pay orders issued 374,654 295,519Provision for employees’ end of service indemnity** 189,946 193,997Provision for taxation 87,935 87,326Other 933,927 882,478
10,267,090 7,404,136
* Acceptances are recognised as a financial liability in the consolidated statement of financial position
with a contractual right of reimbursement from the customer as a financial asset (Note 10).
** Provision for employees’ end of service indemnity included AED 176 million (2015: AED 181 million)
for estimated amounts required to cover employees’ end of service indemnity at the reporting date as
per U.A.E. Labour Law. In the opinion of management, the provision would not have been materially
different had it been calculated on an actuarial basis.
The remaining amount of provision for employees’ end of service indemnity relates to overseas
branches and subsidiaries outside U.A.E and is computed based on the local laws and regulations of
respective jurisdications.
Notes to the consolidated financial statements for the year ended 31 December 2016 (continued)
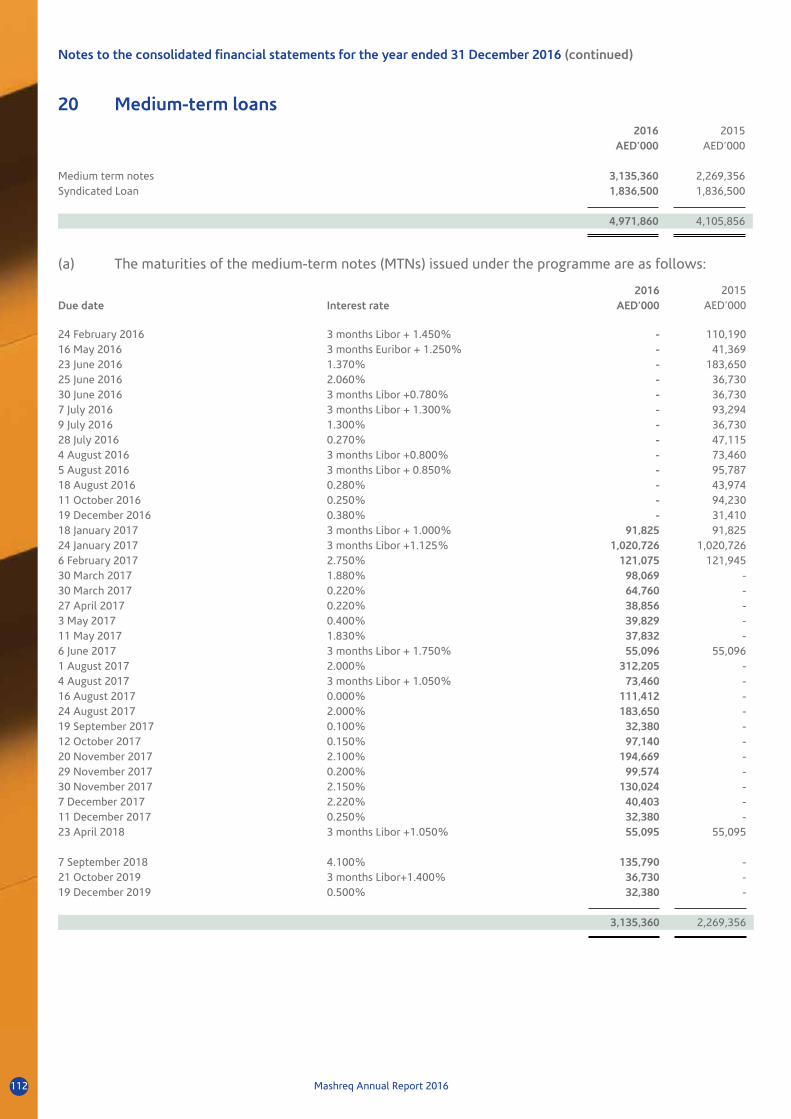
Mashreq Annual Report 2016112
20 Medium-term loans2016 2015
AED’000 AED’000
Medium term notes 3,135,360 2,269,356Syndicated Loan 1,836,500 1,836,500
4,971,860 4,105,856
(a) The maturities of the medium-term notes (MTNs) issued under the programme are as follows:
2016 2015Due date Interest rate AED’000 AED’000
24 February 2016 3 months Libor + 1.450% - 110,19016 May 2016 3 months Euribor + 1.250% - 41,36923 June 2016 1.370% - 183,65025 June 2016 2.060% - 36,73030 June 2016 3 months Libor +0.780% - 36,7307 July 2016 3 months Libor + 1.300% - 93,2949 July 2016 1.300% - 36,73028 July 2016 0.270% - 47,1154 August 2016 3 months Libor +0.800% - 73,4605 August 2016 3 months Libor + 0.850% - 95,78718 August 2016 0.280% - 43,97411 October 2016 0.250% - 94,23019 December 2016 0.380% - 31,41018 January 2017 3 months Libor + 1.000% 91,825 91,82524 January 2017 3 months Libor +1.125% 1,020,726 1,020,7266 February 2017 2.750% 121,075 121,94530 March 2017 1.880% 98,069 -30 March 2017 0.220% 64,760 -27 April 2017 0.220% 38,856 -3 May 2017 0.400% 39,829 -11 May 2017 1.830% 37,832 -6 June 2017 3 months Libor + 1.750% 55,096 55,0961 August 2017 2.000% 312,205 -4 August 2017 3 months Libor + 1.050% 73,460 -16 August 2017 0.000% 111,412 -24 August 2017 2.000% 183,650 -19 September 2017 0.100% 32,380 -12 October 2017 0.150% 97,140 -20 November 2017 2.100% 194,669 -29 November 2017 0.200% 99,574 -30 November 2017 2.150% 130,024 -7 December 2017 2.220% 40,403 -11 December 2017 0.250% 32,380 -23 April 2018 3 months Libor +1.050% 55,095 55,095
7 September 2018 4.100% 135,790 -21 October 2019 3 months Libor+1.400% 36,730 -19 December 2019 0.500% 32,380 -
3,135,360 2,269,356
Notes to the consolidated financial statements for the year ended 31 December 2016 (continued)

Mashreq Annual Report 2016 113
Notes to the consolidated financial statements for the year ended 31 December 2016 (continued)
20 Medium-term loans (continued)
(a) The maturities of the medium-term notes (MTNs) issued under the programme are as follows:
(continued)
Medium term notes are denominated in following currencies:
2016 2015AED’000 AED’000
U.S. Dollars 2,329,784 1,793,526Swiss Francs 111,412 95,787Kuwaiti Dinar 121,075 121,945Euro 139,403 41,369Japanese Yen 297,896 216,729Chinese Yuan 135,790 -
3,135,360 2,269,356
The Group established a Euro Medium Term Note (EMTN) programme for USD 750 million (AED 2.75 billion)
under an agreement dated 4 February 2004. On 15 March 2010, the EMTN programme limit was increased to
USD 5 billion (AED 18.37 billion).
During the year, new medium-term notes of AED 1.792 billion were issued and AED 925 million of medium-
term notes were redeemed.
AED 1.02 billion is a subordinated floating rate note (“FRN”) and qualified and approved by U.A.E. Central
Bank for Tier 2 subordinated loan capital till 2012 and is consequently being amortised at the rate of 20% per
annum for next five years until January 2017 for capital adequacy calculation purposes.
(b) During the year ended 31 December 2014, the Group had signed a USD 500 million (AED 1.8 billion)
syndicated term loan facility. The purpose of the facility is to finance general corporate activities. The facility
has a tenor of 3 years and is payable at maturity. The facility carries an interest rate of LIBOR plus a margin of
125 basis points which is payable on a quarterly basis.
21 Issued and paid up capital and reserves
(a) Issued and paid up capital
As at 31 December 2016, 177,530,823 ordinary shares of AED 10 each (31 December 2015: 177,530,823
ordinary shares of AED 10 each) were fully issued and paid up.
At the Annual General Meeting of the shareholders held on 22 February 2015, the shareholders approved
a stock dividend in respect of the year ended 31 December 2014 at 5% of the issued and paid up capital,
amounting to AED 84.53 million. Accordingly, the authorised and issued share capital increased by the amount
of the stock dividend.
(b) Statutory and legal reserves
In accordance with Union Law 10/80 of U.A.E., 10% of the profit for the year is to be transferred to statutory
reserve. Such transfers to reserves may cease when they reach the levels established by the respective
regulatory authorities (in the U.A.E. this level is 50% of the issued and paid up share capital). The legal reserve
relates to the Group’s foreign operations. Neither the statutory reserve nor the legal reserve is available
for distribution.

Mashreq Annual Report 2016114
21 Issued and paid up capital and reserves (continued)
(c) General reserve
The general reserve is computed pursuant to the Bank’s Articles of Association and can be used for the
purposes determined by the Annual General Meeting.
(d) Cumulative translation adjustment
Exchange differences relating to the translation of the results and net assets of the Group’s foreign operations
from their functional currencies to the Group’s presentation currency (i.e. AED), are recognised directly in
consolidated statement of comprehensive income and accumulated in the cumulative translation adjustment
reserve. Gains and losses on hedging instruments that are designated as hedging instruments for hedges
of net investments in foreign operations are included in the cumulative translation adjustment reserve.
Exchange differences previously accumulated in the cumulative translation adjustment reserve (in respect of
translating both the net assets of foreign operations and hedges of foreign operations) are reclassified to the
consolidated income statement on the disposal of the foreign operation.
(e) Investments revaluation reserve
Investments revaluation reserve shows the effects from the fair value measurement of other financial assets
measured at FVTOCI. The change in fair value for the year amounted to a profit of AED 12 million (2015: loss
of AED 178 million) and was reflected in the consolidated statement of comprehensive income.
(f) Cash flow hedging reserve
The cash flow hedging reserve represents the cumulative effective portion of gains or losses arising on changes
in fair value of hedging instruments entered into for cash flow hedges. The cumulative gain or loss arising
on changes in fair value of the hedging instruments that are recognised and accumulated under the heading
of cash flow hedging reserve will be reclassified to consolidated income statement only when the hedged
transaction affects the consolidated income statement, or included as a basis adjustment to the non-financial
hedged item, consistent with the Group’s accounting policy.
The movement of the cash flow hedging reserve is below:
2016 2015AED’000 AED’000
At 1 January 9,221 -Gain arising on changes in fair value of hedging instruments entered into for cash flow hedges 53,333 10,791Cumulative gain arising on changes in fair value of hedging instruments reclassified to consolidated income statement (54,930) (1,570)
At 31 December 7,624 9,221
(g) Dividends on equity instruments
During the year ended 31 December 2016, a 40% cash dividend amounting to AED 710 million for the year
ended 31 December 2015 (2014: AED 676 million) was approved by the Board of Directors and ratified by the
shareholders at the Annual General Meeting held on 28 February 2016.
Notes to the consolidated financial statements for the year ended 31 December 2016 (continued)

Mashreq Annual Report 2016 115
Notes to the consolidated financial statements for the year ended 31 December 2016 (continued)
22 Non-controlling interests 2016 2015
AED’000 AED’000
At 1 January 717,118 755,668Profit for the year 27,499 32,538Other comprehensive (loss)/income for the year 47 (56,069)Dividends paid (16,655) (18,129)Additional contribution attributable to the new non-controlling interest shareholders* - 3,110
At 31 December 728,009 717,118
* Additional contribution was made during 2015 by the non-controlling interest shareholders of Dubai
Group Sigorta A.S̨.
23 Contra accounts and commitments
(a) The analysis of the Group’s contra accounts and commitments is as follows:
2016 2015AED’000 AED’000
(i) Contra accounts (memoranda)
Guarantees 38,285,010 40,720,747 Letters of credit 4,743,855 5,912,089
43,028,865 46,632,836
(ii) Commitments for acquisition of property and equipment 692,262 110,710
(iii) Operating lease commitments 93,181 124,061
Total contra accounts and commitments 43,814,308 46,867,607
(b) Irrevocable undrawn facilities commitments as at 31 December 2016 amounted to AED 7.9 billion
(2015: AED 4.73 billion).
(c) Contra accounts – maturity profile
The maturity profile of the Group’s contra accounts were as follows:
2016Within 3 months
Over 3 to 6 months
Over 6 to 12 months
Over 1 to 5 years
Over 5 years Total
AED’000 AED’000 AED’000 AED’000 AED’000 AED’000
Guarantees 13,567,567 2,068,757 2,854,051 7,437,463 12,357,172 38,285,010Letters of credit 3,359,779 492,225 332,929 558,922 - 4,743,855
Total 16,927,346 2,560,982 3,186,980 7,996,385 12,357,172 43,028,865

Mashreq Annual Report 2016116
23 Contra accounts and commitments (continued)
(c) Contra accounts – maturity profile (continued)
2015Within 3 months
Over 3 to 6 months
Over 6 to 12 months
Over 1 to 5 years
Over 5 years Total
AED’000 AED’000 AED’000 AED’000 AED’000 AED’000
Guarantees 16,278,449 1,974,273 1,790,644 7,863,492 12,813,889 40,720,747Letters of credit 2,495,726 613,044 1,374,641 1,428,678 - 5,912,089
Total 18,774,175 2,587,317 3,165,285 9,292,170 12,813,889 46,632,836
The analysis of commitments and contingencies by geographic region and industry sector is shown in Note 38
to the consolidated financial statements.
(d) Operating lease commitments
The future minimum lease payments payable under non-cancellable operating leases where the Group is the
lessee are as follows:
2016 2015AED’000 AED’000
Less than 1 year 37,121 40,5221 to 5 years 46,077 53,737Over 5 years 9,983 29,802
Total 93,181 124,061
24 Interest income 2016 2015
AED’000 AED’000
Loans and advances 3,392,622 3,318,455Banks 520,761 379,512Other financial assets 411,008 258,663Central banks 141,688 145,316
4,466,079 4,101,946
Notes to the consolidated financial statements for the year ended 31 December 2016 (continued)
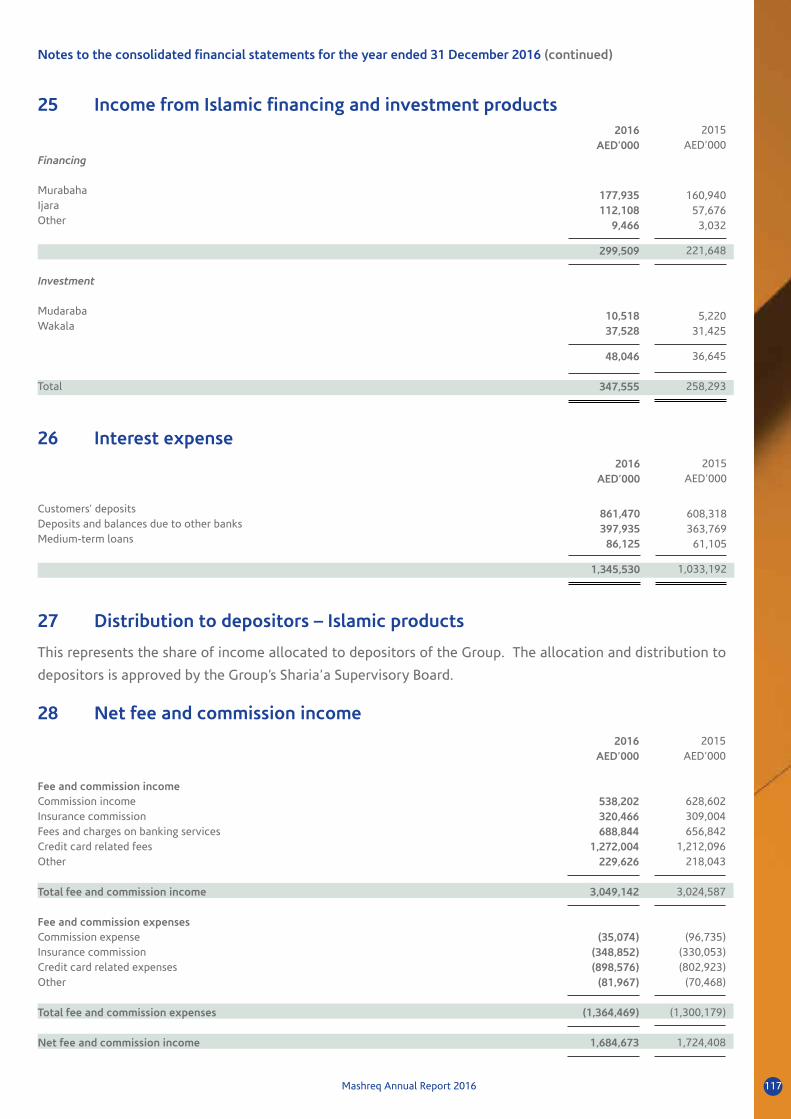
Mashreq Annual Report 2016 117
Notes to the consolidated financial statements for the year ended 31 December 2016 (continued)
25 Income from Islamic financing and investment products2016 2015
AED’000 AED’000Financing
Murabaha 177,935 160,940Ijara 112,108 57,676Other 9,466 3,032
299,509 221,648
Investment
Mudaraba 10,518 5,220Wakala 37,528 31,425
48,046 36,645
Total 347,555 258,293
26 Interest expense 2016 2015
AED’000 AED’000
Customers’ deposits 861,470 608,318Deposits and balances due to other banks 397,935 363,769Medium-term loans 86,125 61,105
1,345,530 1,033,192
27 Distribution to depositors – Islamic products
This represents the share of income allocated to depositors of the Group. The allocation and distribution to
depositors is approved by the Group’s Sharia’a Supervisory Board.
28 Net fee and commission income2016 2015
AED’000 AED’000
Fee and commission incomeCommission income 538,202 628,602Insurance commission 320,466 309,004Fees and charges on banking services 688,844 656,842Credit card related fees 1,272,004 1,212,096Other 229,626 218,043
Total fee and commission income 3,049,142 3,024,587
Fee and commission expensesCommission expense (35,074) (96,735)Insurance commission (348,852) (330,053)Credit card related expenses (898,576) (802,923)Other (81,967) (70,468)
Total fee and commission expenses (1,364,469) (1,300,179)
Net fee and commission income 1,684,673 1,724,408

Mashreq Annual Report 2016118
29 Net investment income2016 2015
AED’000 AED’000
Net realised gain from sale of other financial assets measured at FVTPL 24,029 33,305Fair value adjustments of other financial assets measured at FVTPL [Note 7(k)] 6,310 (41,291)Interest income from debt securities at FVTPL 204,709 160,330Dividends income from other financial assets measured at FVTPL 1,081 1,019Net realised loss from sale of other financial assets measured at amortised cost (490) (10,345)Dividend income from financial assets measured at FVTOCI [Note 7 (j)] 26,878 26,088
262,517 169,106
30 Other income, net 2016 2015
AED’000 AED’000
Fair value adjustments of investment properties (Note 12) (2,161) 34,196Foreign exchange gains, net 423,478 413,100Insurance and other related income, net [Note 30(a)] 393,352 334,048Gain/(loss) on disposal of property and equipment 53,837 (4,959)Loss from disposal of investment properties (250) -Fair value adjustment – derivatives 6,954 7,070Other (16,142) 38,747
859,068 822,202
(a) Insurance and other related income, net
2016 2015AED’000 AED’000
Net insurance premium revenue 1,342,328 1,399,184Net claims incurred (1,249,606) (1,115,567)Other insurance related income, net 300,630 50,431
393,352 334,048
31 General and administrative expenses 2016 2015
AED’000 AED’000
Salaries and employees related expenses 1,365,105 1,405,758Depreciation on property and equipment (Note 13) 155,611 148,637Social contributions - 1,238Other 885,985 916,894
2,406,701 2,472,527
Pension and national insurance contribution for U.A.E. citizens are made by the Group in accordance with
Federal Law No. 7 of 1999.
Notes to the consolidated financial statements for the year ended 31 December 2016 (continued)

Mashreq Annual Report 2016 119
Notes to the consolidated financial statements for the year ended 31 December 2016 (continued)
32 Allowances for impairment, net
2016
Retail Corporate
and othersCollective
impairment Total
AED’000 AED’000 AED’000 AED’000
Allowance for impaired loans and advances, net [Note 8 (d)] 187,055 573,358 142,812 903,225Allowance for other assets, net - 37,617 - 37,617Allowance for impaired islamic assets, net [Note 9(d)] 5,429 14,346 - 19,775Write-off of impaired loans and advances 890,472 - - 890,472Recovery of allowance against impaired loans and advances[Note 8 (d)] - (3,900) - (3,900)
Recovery of loans and advances previously written off (44,858) (68,672) - (113,530)
1,038,098 552,749 142,812 1,733,659
2015
Retail Corporate and
othersCollective
impairment Total AED’000 AED’000 AED’000 AED’000
Allowance for/(reversal of) impaired loans and advances, net [Note 8 (d)] 106,883 987,501 (305,170) 789,214
Allowance for impaired balances due from banks, net [Note 6 (c)] - 261 - 261Allowance for other assets, net - 38,120 - 38,120(Reversal of)/allowance for impaired Islamic assets, net [Note 9(d)] (8,382) - 8,000 (382)Reversal of allowance against impaired other financial assets[Note 7 (d)] - (33,852) - (33,852)
Write-off of impaired loans and advances 470,835 - - 470,835Recovery of allowance against impaired loans and advances[Note 8 (d)] - (5,215) - (5,215)
Recovery of loans and advances previously written off (43,596) (215,580) - (259,176)
525,740 771,235 (297,170) 999,805
33 Earnings per share
The basic earnings per share is calculated by dividing the net profit attributable to owners of the Parent by the
weighted average number of ordinary shares in issue during the year. In accordance with IAS 33 Earnings Per
Share, the impact of bonus shares issued has been considered retrospectively while computing the weighted
average number of ordinary shares during all periods presented as follows:
2016 2015AED AED
Profit for the year (AED’000)(Attributed to owners of the Parent) 1,926,412 2,402,107
Number of ordinary shares outstanding [Note 21 (a)] 177,530,823 177,530,823
Basic and diluted earnings per share (AED) 10.85 13.53

Mashreq Annual Report 2016120
34 Proposed dividends
As of the date of approving the consolidated financial statements, the Board of Directors’ proposed dividends
has been submitted to the Central Bank of the U.A.E. for its approval.
35 Cash and cash equivalents
Cash and cash equivalents consist of cash on hand, current accounts and other balances with central bank
certificates of deposits, balances with banks and money market placements which are maturing within three
months from the value date of the deposit or placement, as follows:
2016 2015AED’000 AED’000
Cash on hand 1,049,505 845,591Balances with central banks: Current accounts and other balances 6,774,795 8,203,244Deposits and balances due from banks maturing within 3 months 12,489,137 10,828,896
20,313,437 19,877,731
36 Investment in subsidiaries
At 31 December 2016, Mashreqbank psc Group (the “Group”) comprises the Bank and the following direct
material subsidiaries:
Name of subsidiary
Place of incorporation (or registration) and operation
Proportion of ownership
interest
Proportion of voting power
held Principal activity
% %
Osool – A Finance Company (PJSC) United Arab Emirates 98.00 98.00 Finance
Oman Insurance Company (PSC) Group United Arab Emirates 63.94 63.94 Insurance & reinsurance
Mindscape FZ LLC United Arab Emirates 100.00 100.00 Software/Application provider
Mashreq Securities LLC United Arab Emirates 99.98 99.98 Brokerage
Injaz Services FZ LLC United Arab Emirates 100.00 100.00 Service provider
Mashreq Al Islami Finance Company (PJSC) United Arab Emirates 99.80 99.80 Islamic finance company
Mashreq Capital (DIFC) Limited United Arab Emirates 100.00 100.00Brokerage and asset & fund management
Makaseb Funds Company BSC Kingdom of Bahrain 99.90 99.90 Fund manager
Makaseb Funds Company BSC II Kingdom of Bahrain 99.90 99.90 Fund manager
Invictus Limited Cayman Islands 100.00 100.00 Special Purpose vehicle
Notes to the consolidated financial statements for the year ended 31 December 2016 (continued)

Mashreq Annual Report 2016 121
Notes to the consolidated financial statements for the year ended 31 December 2016 (continued)
36 Investment in subsidiaries (continued)
(b) Financial details of non-wholly owned subsidiaries of the Bank are as follows:
Name of SubsidiaryProfit allocated to
non-controlling interestAccumulated
non-controlling interest
2016 2015 2016 2015AED ’000 AED ‘000 AED ’000 AED ‘000
Oman Insurance Company (PSC) Group 25,770 31,355 682,225 699,630Individually immaterial subsidiaries with non- controlling interests 1,729 1,183 45,784 17,488
27,499 32,538 728,009 717,118
(c) Below is the summarised financial information of Oman Insurance Company (PSC) Group, the only
subsidiary in which there is a material non-controlling interests. The financial information represents
balances before intra-group eliminations.
2016AED’000
2015AED’000
Statement of financial position
Total assets 7,194,384 5,947,870
Total liabilities 5,235,972 4,031,726
Net equity 1,958,412 1,916,144
2016AED’000
2015AED’000
Statement of comprehensive income
Net insurance premium revenue 1,342,328 1,399,184Net claims incurred (1,249,606) (1,115,567)Net commission and other income/(loss) 15,504 29,415Net investment income 73,290 89,274Net expenses (101,302) (319,823)
Profit for the year 80,214 82,483
Other comprehensive (loss)/income 9,517 (126,994)
Total comprehensive (loss)/income 89,731 (44,511)
Statement of cash flowsNet cash (used in)/generated from operating activities (49,144) 8,649Net cash used in investing activities (52,588) (227,526)Net cash flows used in financing activities 288,056 (9,588)
Net decrease in cash and cash equivalents 186,324 (228,465)
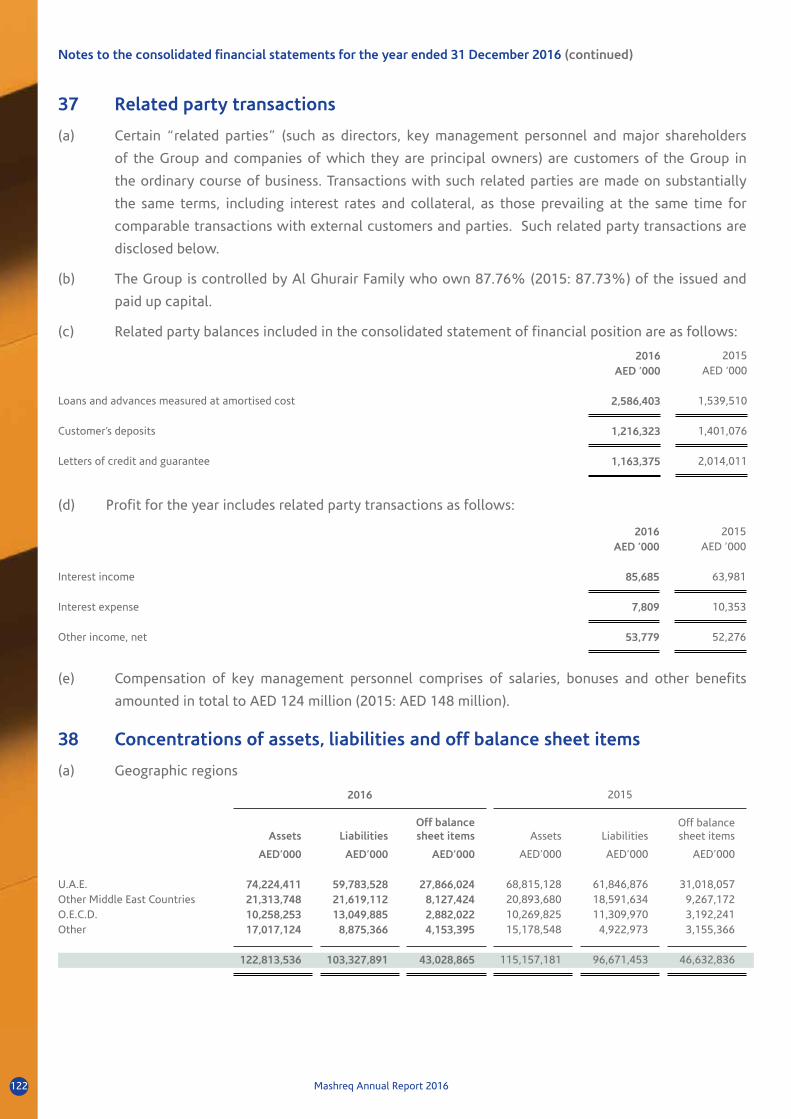
Mashreq Annual Report 2016122
37 Related party transactions
(a) Certain “related parties” (such as directors, key management personnel and major shareholders
of the Group and companies of which they are principal owners) are customers of the Group in
the ordinary course of business. Transactions with such related parties are made on substantially
the same terms, including interest rates and collateral, as those prevailing at the same time for
comparable transactions with external customers and parties. Such related party transactions are
disclosed below.
(b) The Group is controlled by Al Ghurair Family who own 87.76% (2015: 87.73%) of the issued and
paid up capital.
(c) Related party balances included in the consolidated statement of financial position are as follows:
2016 2015AED ’000 AED ‘000
Loans and advances measured at amortised cost 2,586,403 1,539,510
Customer’s deposits 1,216,323 1,401,076
Letters of credit and guarantee 1,163,375 2,014,011
(d) Profit for the year includes related party transactions as follows:
2016 2015AED ’000 AED ’000
Interest income 85,685 63,981
Interest expense 7,809 10,353
Other income, net 53,779 52,276
(e) Compensation of key management personnel comprises of salaries, bonuses and other benefits
amounted in total to AED 124 million (2015: AED 148 million).
38 Concentrations of assets, liabilities and off balance sheet items
(a) Geographic regions
2016 2015
Assets Liabilities Off balance sheet items Assets Liabilities
Off balance sheet items
AED’000 AED’000 AED’000 AED’000 AED’000 AED’000
U.A.E. 74,224,411 59,783,528 27,866,024 68,815,128 61,846,876 31,018,057Other Middle East Countries 21,313,748 21,619,112 8,127,424 20,893,680 18,591,634 9,267,172O.E.C.D. 10,258,253 13,049,885 2,882,022 10,269,825 11,309,970 3,192,241Other 17,017,124 8,875,366 4,153,395 15,178,548 4,922,973 3,155,366
122,813,536 103,327,891 43,028,865 115,157,181 96,671,453 46,632,836
Notes to the consolidated financial statements for the year ended 31 December 2016 (continued)

Mashreq Annual Report 2016 123
Notes to the consolidated financial statements for the year ended 31 December 2016 (continued)
38 Concentrations of assets, liabilities and off balance sheet items (continued)
(b) Industry Sector
2016 2015
Assets Liabilities Off balance sheet items Assets Liabilities
Off balance sheet items
AED’000 AED’000 AED’000 AED’000 AED’000 AED’000
Government and Public Sector 16,159,314 5,938,556 532,353 15,435,113 5,660,054 175,107 Commercial & Business 38,385,617 55,813,577 31,080,882 37,825,368 52,306,710 36,028,354 Personal 17,464,353 15,884,596 659,534 15,015,784 15,431,320 920,813 Financial Institutions 49,325,148 24,989,793 10,753,643 44,848,944 22,269,348 9,439,408 Other 1,479,104 701,369 2,453 2,031,972 1,004,021 69,154
122,813,536 103,327,891 43,028,865 115,157,181 96,671,453 46,632,836
39 Segmental information
Reportable segments
Operating segments are identified on the basis of internal reports about the components of the Group that
are regularly reviewed by the Group’s CEO (the Group’s chief operating decision maker) in order to allocate
resources to the segment and to assess its performance. Information reported to the Group’s CEO for the
purpose of resource allocation and assessment of performance is based on following strategic business units
offering products and services to different markets.
The Group’s reportable segments under IFRS 8 Operating Segments are therefore as follows:
1. The Domestic Corporate segment comprises of corporate and commercial banking customers in the
U.A.E. Trade finance, contracting finance, project finance, investment banking, corporate advisory
and cash management are the major products and / or business lines making up this segment.
2. The Domestic Retail segment includes products and services offered to individuals or small businesses
within the U.A.E. The product offerings to customers include current accounts, savings accounts, fixed
deposits, investment products, “Mashreq Millionaire” deposits, personal loans, auto loans, mortgage
loans, business loans, credit cards with unique loyalty programs, bank assurance, overdraft, priority
banking, SME, Private banking and wealth management services.
3. The Treasury & Capital Markets segment consists of customer flow business and proprietary business.
Customer flow business includes transactions for Foreign Exchange, Derivatives, Margin FX, Futures,
Hedging, Investment Products, Domestic Equities (brokerage) and Asset- Management undertaken on
behalf of customers. The proprietary business includes trading and investing activity undertaken on
behalf of the Group.
4. The International Banking segment consists of Retail and Corporate business for the Group’s overseas
banking branches in Qatar, Egypt, Bahrain & Kuwait and the Group’s correspondent banking business in
other overseas branches which includes trade services, reimbursements, reimbursement undertaking,
reimbursement financing, export bills collection, risk participations.

Mashreq Annual Report 2016124
39 Segmental information (continued)
Reportable segments (continued)
5. All Islamic banking products offered to customers are included under the Islamic Banking segment.
These products are Ijara Home Finance, Mudarabah Deposit, Mudarabah savings account, Musharaka
finance, Murabaha commodity finance, Ijara Equipment Finance, Sukuk Underwriting, Musharaka LC,
Murabaha LC, TR Murabaha, Kafala, Wakala Deposit, Reverse Murabaha Deposit & Sukuk Advisory.
6. The Insurance subsidiary, Oman Insurance Company (PSC) – comprises the Insurance segment. The
product offerings to customers include life, health, motor, marine cargo and hull, aviation, fire and
general accident, engineering, liability and personal lines insurance.
7. The Head office consists of certain investments and assets held centrally due to their strategic
significance to the Group.
The accounting policies of the reportable segments are the same as the Group’s accounting policies described
in Note 3 to the consolidated financial statements. Segment profit represents the profit earned by each
segment without allocation of general and administrative expenses, allowances for impairment and overseas
income tax expenses.
2016
Domestic corporate
Domestic retail
Treasury & capital markets
International banking
Islamicbanking Insurance Head Office Total
AED’000 AED’000 AED’000 AED’000 AED’000 AED’000 AED’000 AED’000Net interest income and earnings from Islamic products 846,995 1,094,443 39,058 696,323 305,836 59,016 320,696 3,362,367Other operating income, net 472,450 589,504 524,848 767,173 15,641 376,003 60,639 2,806,258
Total operating income 1,319,445 1,683,947 563,906 1,463,496 321,477 435,019 381,335 6,168,625
General and administrativeexpenses (2,406,701)
Allowances for impairment (1,733,659)
Profit before taxes 2,028,265Overseas income tax expense (74,354)
Profit for the year 1,953,911
Attributed to:Owners of the Parent 1,926,412Non-controlling interests 27,499
1,953,911
Segment Assets 30,910,557 13,579,281 17,004,042 32,505,293 8,797,296 4,702,638 15,314,429 122,813,536
Segment Liabilities 29,624,000 24,153,152 7,467,659 23,155,000 8,450,303 2,577,053 7,900,724 103,327,891
Notes to the consolidated financial statements for the year ended 31 December 2016 (continued)

Mashreq Annual Report 2016 125
Notes to the consolidated financial statements for the year ended 31 December 2016 (continued)
39 Segmental information (continued)
Reportable segments (continued)
2015
Domestic corporate
Domestic retail
Treasury & capital markets
International banking
Islamicbanking Insurance
Head Office Total
AED’000 AED’000 AED’000 AED’000 AED’000 AED’000 AED’000 AED’000
Net interest income and earnings from Islamic products 876,311 1,202,319 69,458 631,421 193,036 40,963 248,281 3,261,789Other operating income, net 447,411 635,477 483,192 669,321 114,534 352,188 13,593 2,715,716
Total operating income 1,323,722 1,837,796 552,650 1,300,742 307,570 393,151 261,874 5,977,505
General and administrativeexpenses (2,472,527)
Allowances for impairment (999,805)
Profit before taxes 2,505,173Overseas income tax expense (70,528)
Profit for the year 2,434,645Attributed to:Owners of the Parent 2,402,107Non-controlling interests 32,538
2,434,645
Segment Assets 29,500,767 14,430,585 15,657,273 32,831,357 7,594,622 4,204,384 10,938,193 115,157,181
Segment Liabilities 26,799,217 23,041,000 9,009,000 21,281,772 8,459,961 2,336,422 5,744,081 96,671,453
Geographical information
The Group operates in four principal geographical areas – U.A.E. (country of domicile), other Middle East
Countries (Kuwait, Bahrain, Egypt and Qatar), O.E.C.D. (USA and UK) and other countries (India and Hong Kong).
The Group’s revenue from continuing operations from external customers and information about its non-
current assets by geographical location are detailed below:
Operating income from external customers * Non-current assets **
2016 2015 2016 2015AED’000 AED’000 AED’000 AED’000
U.A.E. 5,018,642 4,968,974 1,654,537 1,653,031Other Middle East countries 904,865 790,110 26,987 36,008O.E.C.D. 192,806 167,524 3,625 2,476Other countries 52,312 50,897 16,718 19,530
6,168,625 5,977,505 1,701,867 1,711,045
* Operating income from external customers is based on the Group’s operational centres.
** Non current assets include property and equipment, investment properties and goodwill.

Mashreq Annual Report 2016126
39 Segmental information (continued)
Reportable segments (continued)
Revenue from major products and services
Revenue from major products and services are disclosed in Notes 24, 25, 28, 29 and 30 in the consolidated
financial statements.
Information about major customers
No single customer contributed 10% or more to the Group’s revenue for both years ended 31 December 2016
and 2015.
40 Classification of financial assets and liabilities
(a) The table below sets out the Group’s classification of each class of financial assets and liabilities and
their carrying amounts as at 31 December 2016:
FVTPL
FVTOCI Amortised
cost TotalAED’000 AED’000 AED’000 AED’000
Financial assets:
Cash and balances with central banks - - 18,629,582 18,629,582Deposits and balances due from banks - - 18,667,750 18,667,750Other financial assets measured at fair value 1,650,520 768,679 - 2,419,199Loans and advances measured at amortised cost - - 53,428,461 53,428,461Islamic financing and investment products measured at amortised cost - - 7,565,063 7,565,063Other financial assets measured at amortised cost - - 10,849,298 10,849,298Other assets 863,918 - 8,420,242 9,284,160
Total 2,514,438 768,679 117,560,396 120,843,513
Financial liabilities:
Deposits and balances due to banks - - 8,932,076 8,932,076Repurchase agreements with banks - - 605,600 605,600Customers’ deposits - - 69,947,124 69,947,124Islamic customers’ deposits - - 7,093,383 7,093,383Other liabilities 872,229 - 7,997,765 8,869,994Medium-term loans - - 4,971,860 4,971,860
Total 872,229 - 99,547,808 100,420,037
Notes to the consolidated financial statements for the year ended 31 December 2016 (continued)

Mashreq Annual Report 2016 127
Notes to the consolidated financial statements for the year ended 31 December 2016 (continued)
40 Classification of financial assets and liabilities (continued)
(b) The table below sets out the Group’s classification of each class of financial assets and liabilities and
their carrying amounts as at 31 December 2015:
FVTPL
FVTOCI Amortised
cost Total
AED’000 AED’000 AED’000 AED’000
Financial assets:
Cash and balances with central banks - - 19,423,463 19,423,463Deposits and balances due from banks - - 15,009,990 15,009,990Other financial assets measured at fair value 3,267,810 657,155 - 3,924,965Loans and advances measured at amortised cost - - 53,555,070 53,555,070Islamic financing and investment products measuredat amortised cost - - 6,610,606 6,610,606
Other financial assets measured at amortised cost - - 7,993,072 7,993,072Other assets 879,233 - 5,647,102 6,526,335
Total 4,147,043 657,155 108,239,303 113,043,501
Financial liabilities:
Deposits and balances due to banks - - 9,231,913 9,231,913Repurchase agreements with banks - - 734,564 734,564Customers’ deposits - - 65,243,790 65,243,790Islamic customers’ deposits - - 8,391,490 8,391,490Other liabilities 872,607 - 5,508,490 6,381,097Medium-term loans - - 4,105,856 4,105,856
Total 872,607 - 93,216,103 94,088,710
41 Derivatives
In the ordinary course of business, the Group utilises the following derivative financial instruments for both
trading and hedging purposes:
(a) Swaps are commitments to exchange one set of cash flows for another. For interest rate swaps,
counter-parties generally exchange fixed and floating rate interest payments in a single currency
without exchanging principal. For currency swaps, fixed interest payments and principal are
exchanged in different currencies. For cross-currency rate swaps, principal, fixed and floating
interest payments are exchanged in different currencies.
(b) Credit Default Swap (CDS) is a swap contract in which the buyer of the CDS makes a series of
payments to the seller and, in exchange, receives a payoff if a debt instrument goes into default and
fails to pay.
(c) Forwards and futures are contractual agreements to either buy or sell a specified currency, commodity
or financial instrument at a specified price and date in the future. Forwards are customised contracts
transacted in the over-the-counter market. Foreign currency and interest rate futures are transacted
in standardised amounts on regulated exchanges and changes in futures contract values are marked
to market daily.

Mashreq Annual Report 2016128
41 Derivatives (continued)
(d) Forward rate agreements are similar to interest rate futures, but are individually negotiated. They call
for a cash settlement for the difference between a contracted interest rate and the market rate on a
specified future date, on a notional principal for an agreed period of time.
(e) Options are contractual agreements under which the seller (writer) grants the purchaser (holder)
the right, but not the obligation, to either buy or sell at fixed future date or at any time during
a specified period, a specified amount of a currency, commodity or financial instrument at a
pre-determined price.
Statement of Derivatives as at 31 December 2016
Notional amount by term maturity
Positive fair value
Negative fair value
Notional amount
Up to 3 months
3 – 6 months
6 – 12 months
1 – 5 years
Over 5 Years
AED’000 AED’000 AED’000 AED’000 AED’000 AED’000 AED’000 AED’000
Derivatives held for trading:Forward foreign exchange contract 379,705 452,175 46,706,024 32,647,759 5,809,550 6,970,964 1,277,751 -Foreign exchange options (bought) - 35,128 2,180,458 776,227 240,737 1,163,494 - -Foreign exchange options (sold) 37,591 - 2,082,554 678,323 240,737 1,163,494 - -Interest rate swaps 389,820 383,051 25,663,298 528,393 487,000 1,036,522 16,523,429 7,087,954Credit default swaps - 225 20,000 - 20,000 - - -Equity options - - - - - - - -Futures contracts purchased(Customer) - 990 119,422 111,069 - 8,353 - -
Futures contracts sold (Customer) 660 - 122,862 122,862 - - - -Futures contracts sold (Bank) 990 - 119,422 111,069 - 8,353 - -Futures contracts purchased (Bank) - 660 122,862 122,862 - - - -
808,766 872,229 77,136,902 35,098,564 6,798,024 10,351,180 17,801,180 7,087,954
Derivatives held as cash flow hedges:Cross currency swaps 55,152 - 270,735 270,735 - - - -
Total 863,918 872,229 77,407,637 35,369,299 6,798,024 10,351,180 17,801,180 7,087,954
Notes to the consolidated financial statements for the year ended 31 December 2016 (continued)

Mashreq Annual Report 2016 129
Notes to the consolidated financial statements for the year ended 31 December 2016 (continued)
41 Derivatives (continued)
Statement of Derivatives as at 31 December 2015
Notional amount by term maturity Positive
fair valueNegative
fair valueNotional amount
Up to 3 months
3 – 6 months
6 – 12 months
1 – 5 years
Over 5 years
AED’000 AED’000 AED’000 AED’000 AED’000 AED’000 AED’000 AED’000
Derivatives held for trading:Forward foreign exchange contract 246,524 251,518 52,793,334 42,433,000 5,440,883 4,360,410 559,041 -Foreign exchange options (bought) - 26,821 2,825,778 1,392,343 449,175 173,683 810,577 -Foreign exchange options (sold) 28,804 - 2,416,564 1,894,483 86,427 30,364 405,290 -Interest rate swaps 595,413 591,110 31,254,336 1,611,688 72,424 1,842,172 19,782,517 7,945,535Credit default swaps 17 - 18,365 - 18,365 - - -Equity options 3,499 - 20,234 20,234 - - - -Futures contracts purchased(Customer) - 48 36,551 34,118 2,433 - - -
Futures contracts sold (Customer) - 2,361 122,695 122,695 - - - -Futures contracts sold (Bank) 48 - 36,551 34,118 2,433 - - -Futures contracts purchased (Bank) 2,361 - 122,695 122,695 - - - -
876,666 871,858 89,647,103 47,665,374 6,072,140 6,406,629 21,557,425 7,945,535
Derivatives held as cash flow hedges:Cross currency swaps 2,567 749 270,735 - - - 270,735 -
Total 879,233 872,607 89,917,838 47,665,374 6,072,140 6,406,629 21,828,160 7,945,535
42 Capital management
The Group’s objectives when managing capital, which is a broader concept than the ‘equity’ on the face of the
consolidated statement of financial position, are:
y To comply with the capital requirements set by the BCBS (Basel Committee) and the regulators of the
banking markets where the entities within the Group operate;
y To safeguard the Group’s ability to continue as a going concern so that it can continue to provide
returns for shareholders and benefits for other stakeholders; and
y To maintain a strong capital base and capital buffer to support the development of its business.
Regulatory capital
The Central Bank of the U.A.E. sets and monitors capital requirements for the Group as a whole. The Parent
company and overseas banking operations are directly supervised by their local regulators.
The Central Bank of the U.A.E. adopted the Basel II capital regime in November 2009. The Bank calculates its
Capital Adequacy Ratio in line with guidelines issued by the Central Bank of the U.A.E. The minimum capital
ratio prescribed by the Central Bank is 12% of Risk Weighted Assets (RWA) calculated as per the guidelines
issued by them.
As per Central Bank draft regulation for Basel – III, the capital requirement in year 2016 was 12.25% inclusive
of Capital Conservation and Countercyclical buffers. This is expected to increase to 16% by year 2019.
Mashreq Annual Report 2016130
42 Capital management (continued)
Regulatory capital (continued)
The Group’s regulatory capital is analysed into two tiers:
y Tier 1 capital, which includes issued and paid-up share capital, retained earnings, statutory and legal
reserves, cumulative translation adjustment and non-controlling interests in the equity of subsidiaries
less than wholly owned excluding non-controlling interest in insurance company, after deductions
for goodwill and intangible assets, if any.
y Tier 2 capital, which includes general provisions (Collective allowance for impairment subject to
a limit of 1.25% of CRWA), qualifying subordinated liabilities and the element of the investment
revaluation reserve (up to a maximum of 45% of the excess of market value over the net book value)
relating to unrealised gains on investments classified as other financial assets measured at FVTOCI.
y Deductions from the total of tier 1 capital and tier 2 capital must be made for investments in the
insurance subsidiary to prevent the multiple use of the same capital resources in different parts of
the Group; however the Regulator may allow use of excess capital (over regulatory limits) invested.
Various limits are applied to elements of the capital base. The qualifying tier 2 capital cannot exceed 67% of
Tier 1 capital; and qualifying term subordinated loan capital may not exceed 50 percent of Tier 1 capital. The
Tier 1 capital must be a minimum of 8% of RWA. As per Central Bank draft regulation for Basel – III, the Tier I
Capital requirement was 10.25% of which CET1 is 8.75% in year 2016 inclusive of Capital Conservation and
Countercyclical buffers. This is expected to increase to 14% for Tier 1 of which CET1 is 12.5% by year 2019.
The Group’s assets are risk weighted as to their relative credit, market, and operational risk. Credit risk
includes both on and off-balance sheet risks. Market risk is defined as the risk of losses in on and off-balance
sheet positions arising from movements in market prices and includes interest rate risk, foreign exchange risk,
equity exposure risk, commodity risk, and options risk. Operational risk is defined as the risk of loss resulting
from inadequate or failed internal processes, people or systems, or from external events. For U.A.E. Central
Bank reporting purposes, the bank is currently following the standardised measurement approach for credit,
market and operational risk, as per Pillar 1 of Basel II.
The Group’s policy is to maintain a strong capital base so as to maintain market confidence and to sustain
future development of the business. The impact of the level of capital on shareholders’ return is also recognised
and the Group recognises the need to maintain a balance between the higher returns that might be possible
with greater gearing and the advantages and security afforded by a sound capital position. Historically the
Group has followed a conservative dividend policy to increase capital from internal resources to meet future
growth. To further strengthen the capital base and to ensure effective management of capital, the Group
issued in the year ended 31 December 2007 medium-term floating rates notes.
The Group and its individually regulated operations have complied with all externally imposed capital
requirements throughout the year.
Notes to the consolidated financial statements for the year ended 31 December 2016 (continued)
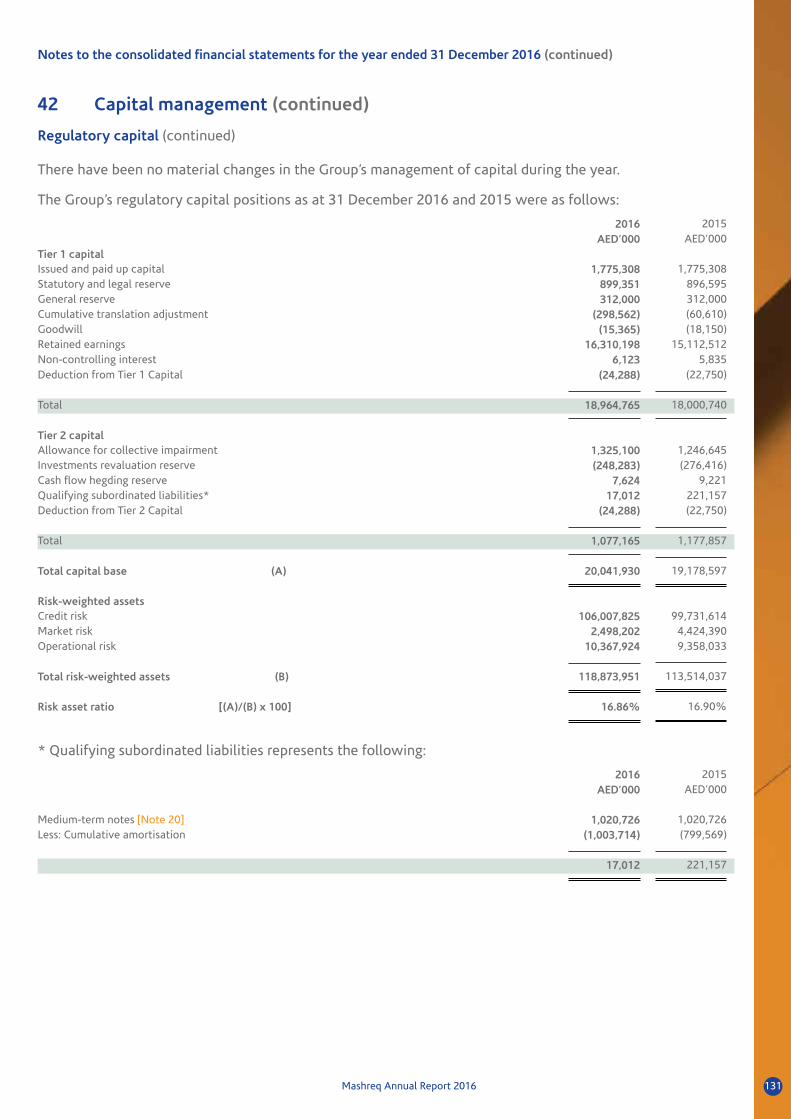
Mashreq Annual Report 2016 131
Notes to the consolidated financial statements for the year ended 31 December 2016 (continued)
42 Capital management (continued)
Regulatory capital (continued)
There have been no material changes in the Group’s management of capital during the year.
The Group’s regulatory capital positions as at 31 December 2016 and 2015 were as follows:
2016 2015AED’000 AED’000
Tier 1 capitalIssued and paid up capital 1,775,308 1,775,308Statutory and legal reserve 899,351 896,595General reserve 312,000 312,000Cumulative translation adjustment (298,562) (60,610)Goodwill (15,365) (18,150)Retained earnings 16,310,198 15,112,512Non-controlling interest 6,123 5,835Deduction from Tier 1 Capital (24,288) (22,750)
Total 18,964,765 18,000,740
Tier 2 capitalAllowance for collective impairment 1,325,100 1,246,645Investments revaluation reserve (248,283) (276,416)Cash flow hegding reserve 7,624 9,221Qualifying subordinated liabilities* 17,012 221,157Deduction from Tier 2 Capital (24,288) (22,750)
Total 1,077,165 1,177,857
Total capital base (A) 20,041,930 19,178,597
Risk-weighted assetsCredit risk 106,007,825 99,731,614Market risk 2,498,202 4,424,390Operational risk 10,367,924 9,358,033
Total risk-weighted assets (B) 118,873,951 113,514,037
Risk asset ratio [(A)/(B) x 100] 16.86% 16.90%
* Qualifying subordinated liabilities represents the following:
2016 2015AED’000 AED’000
Medium-term notes [Note 20] 1,020,726 1,020,726Less: Cumulative amortisation (1,003,714) (799,569)
17,012 221,157

Mashreq Annual Report 2016132
42 Capital management (continued)
Capital allocation
The allocation of capital between specific operations and activities is, to a large extent, driven by optimisation
of the return achieved on the capital allocated. The amount of capital allocated to each operation or activity
is based on the inherent risk it carries. The process of allocating capital to specific operations and activities is
undertaken independently of those responsible for the operation, by Finance and Risk Groups, and is subject to
review by the Bank’s Assets and Liabilities Committee (ALCO) as appropriate.
Although maximisation of the return on risk-adjusted capital is the principal basis used in determining how
capital is allocated within the Group to particular operations or activities, it is not the sole basis used for
decision making. Account also is taken of synergies with other operations and activities, the availability of
management and other resources, and the fit of the activity with the Group’s longer term strategic objectives.
The Group’s policies in respect of capital management and allocation are reviewed regularly by the Board of
Directors.
43 Risk management
The core responsibility of the Risk Management Group is to identify, measure, mitigate, price and manage risk
to ensure that the Bank generates sustainable returns by maintaining acceptable asset quality and meeting the
desired capital return as mandated by the shareholders.
The Group has exposure to the following primary risks:
y Credit risk
y Liquidity risk
y Market risk
y Operational risk
The Groups ability to consistently foster a robust risk management culture and framework is an important
factor in its financial stability and growth.
Risk Management Framework
The Board of Directors (the “BOD”) has overall responsibility for the establishment and oversight of the Group’s
risk management framework and they are assisted by various committees including the Risk Committee, Assets
and Liabilities Committee (ALCO) and Investment Committee etc., who work under the mandate of the BOD.
These committees approve risk management policies of the Bank developed by the Risk Management Group.
The Risk Committee has overall responsibility for the oversight of the risk management framework and the risk
appetite of the Group. The Risk Committee is responsible for the approval of credit policies and procedures
of the Group and to ensure adherence to the approved policies and close monitoring of different risks within
the Group. The Risk Committee also monitors and establishes various concentration limits, approves policy
exceptions and monitors periodic portfolio reviews to ascertain asset quality.
Notes to the consolidated financial statements for the year ended 31 December 2016 (continued)

Mashreq Annual Report 2016 133
Notes to the consolidated financial statements for the year ended 31 December 2016 (continued)
43 Risk management (continued)
Risk Management Framework (continued)
The Risk Management Group function is independent of the business groups and is led by a qualified Risk
Management Head, with enterprise-wide responsibility for the function. The Risk Management Group is
responsible for formulating policies to manage credit, market and operational risk. Experienced and trained Risk
Managers have delegated authority within the risk management framework to approve credit risk transactions
and monitor market and operational risks.
The Audit, Fraud and Compliance Group (AFCG) are independent of Risk Management. AFCG provides
independent assurance to stakeholders and senior management on compliance with all credit policies and
procedures in the Bank and the effectiveness of credit management processes. This is undertaken by a periodic
review of all risk-taking units, in addition to Risk Management. AFCG reports directly to the Chief Executive
Officer (CEO).
Risk Analytics and Modelling:
Mashreq has robust metrics in place for determining Probability of Default (“PD”), Loss Given Default (“LGD”),
and Exposure At Default (“EAD”) variables. The Basel Risk Analytics and Modelling Unit within Risk Management
Group is responsible as per Basel II guidelines for periodically validating various risk rating models including
recalibration PD, LGD and EAD parameters.
The Internal Capital Adequacy Assessment Process (ICAAP) and the Stress Testing team within Risk Management
Group is responsible for calculating the Group’s economic capital requirement and managing the Group’s
Internal Capital Adequacy Assessment Process (ICAAP). This entails monitoring the Group’s capital adequacy
under a variety of stressed scenarios to assess and report the impact upon the Group’s capital buffer (measured
as available capital less risk capital demand) and recommending appropriate actions, as required.
As part of its analysis of portfolio pressure points, the Group carries out periodic stress testing to its entire
portfolio and takes appropriate action to (i) mitigate risks arising out of specific obligors or industries and/or
due to global risk events and their implications on the Group’s client base, and (ii) determine portfolio direction
and resource allocation accordingly.
The Group also calculates the Risk Adjusted Return on Capital (RAROC) for credit applications that are priced
on a risk-adjusted basis.
Credit risk management
Credit risk is the risk that a customer or counterparty to a financial asset fails to meet its contractual obligations
and cause the Group to incur a financial loss. It arises principally from the Group’s loans and advances, dues
from banks and financial institutions and non-trading investment activities.
Credit risk is actively managed and monitored in accordance with defined credit policies and procedures.
The creditworthiness of each counter party is evaluated and appropriate credit limits are established through
adoption of prudent credit structures relevant to the credit risk. To reduce individual counterparty credit risk,
the Group ensures that, whenever necessary, loans are secured by acceptable form of collateral. The Group
uses an internal risk rating system to assess the credit quality of corporate borrowers and counterparties. Each
corporate performing borrower is assigned an internal rating between MRS 1 to MRS 25 and non-performing
borrowers are assigned ratings of non-accrual under restructuring (NAUR), substandard, doubtful and loss.

Mashreq Annual Report 2016134
43 Risk management (continued)
Credit risk management (continued)
The Group also calculates the Risk Adjusted Return on Capital (RAROC) for credit applications that are priced
on a risk-adjusted basis. RAROC calculations are also built into the Credit Appraisal System.
Different credit underwriting procedures are followed for commercial and institutional lending, and retail
lending, as described below.
All credit policies are reviewed and approved by the Bank’s Risk Committee. The policies are reviewed regularly
to reflect changes in market conditions or regulatory requirements.
Whenever possible, loans are secured by acceptable forms of collateral in order to mitigate credit risk. Credit
risk is also mitigated through adoption of prudent credit structures relevant to the credit risk. The Group
further limits risk through diversification of its assets by geography and industry sectors.
Wholesale credit risk management
All credit applications for commercial and institutional lending are subject to the Group’s credit policies,
underwriting standards and industry caps (if any) and to regulatory requirements, as applicable from time to
time. The Group does not lend to companies operating in industries that are considered by the Group inherently
risky or speculative.
Limit setting is based on a combination of factors, including a detailed evaluation of each customer’s
creditworthiness based on proven performance, industry, management and financial analysis (both historical
and projected), risk rating, and analysis of facilities (tenor & types of facilities, pricing, collateral and support).
The Wholesale Credit Risk Management team centrally approves all credit facilities and limits for all corporate,
treasury and capital markets, financial institutions and SME clients of the Group. All credit lines or facilities
extended by the Group are granted subject to prior approval pursuant to a set of delegated credit authority
limits as recommended by the Risk Management Head in line with the Wholesale Credit Policy, and approved
by the Group’s Chief Executive Officer (the “CEO”).
The Group has established limits for managing transferability and convertibility, together defined as cross-
border limits. These limits are regularly reviewed by the Risk Management Group and periodically by the Risk
Committee. Individual country limits are set out based on each country’s financial strength and stability, using
a set of metrics such as external debt, overall fiscal position, exports, imports, foreign exchange reserves and
external debt service ratio. These limits are then applied to all international transaction flows where there is a
risk of default represented by convertibility and/or transferability restrictions.
Wholesale Credit Risk Management includes Special Assets Management Group that manages credits that are
rated as watch list and worse. Special Assets Management Group was established to have a more focused view
on all remedial accounts and, on a pro-active basis, identify and take timely actions on potential weak credits
and also performs recovery function.
Furthermore, all credit facilities are independently administered and monitored by the Credit Operations
(Administration) Department, which separately reports to Operations & Technology Group.
Notes to the consolidated financial statements for the year ended 31 December 2016 (continued)

Mashreq Annual Report 2016 135
Notes to the consolidated financial statements for the year ended 31 December 2016 (continued)
43 Risk management (continued)
Credit risk management (continued)
Retail credit risk management
Retail credit risk is managed on a product basis. Each retail credit application is considered for approval
according to the approved product program, which is devised in accordance with guidelines set out in the
retail credit policy manual approved by the Group’s Risk Committee. The evaluation of a customer’s product
creditworthiness is determined on the basis of statistically validated scoring models for high volume products
such as Credit cards and Personal loans & based on manual underwriting on documented policies for low
volume products such as Mortgages and Auto loans. Periodic and detailed credit reviews are performed at
portfolio level to monitor and track portfolio performance.
All approval authorities are delegated by the Chief Executive Officer (the “CEO”) acting on behalf of the Board
of Directors. Different authority levels are specified for approving product programs and exceptions thereto,
and individual loans and credits under product programs. Each product program contains detailed credit
criteria (such as customer demographics and income eligibility) and regulatory, compliance and documentation
requirements, as well as other operating requirements. Credit authority levels are also captured in the
Product Program.
Credit review procedures
Specialists within AFCG undertake regular reviews of the portfolio. In the wholesale portfolio this involves
sampling of assets. In retail the focus is on testing the Risk Management Process including periodic review
of retail assets portfolio quality and related provision. The specialists subject the Group’s risk assets to an
independent quality evaluation on a regular basis in conformity with the guidelines of the Central Bank of
U.A.E. and the Group’s internal policies in order to assist in the early identification of potential problems and
ensure approved credit policies, guidelines and operating procedures across the Group are implemented.
Loan classification
As per Mashreq’s wholesale credit policy, all performing commercial and institutional loan facilities of the
Group are assigned one of twenty five risk ratings. Non-classified obligors are those rated from 1 – 22. Obligors
at the higher risk end rated 21 and 22 are categorised as “Watch”. Classified exposures fall into 5 categories
representing escalating degrees of severity. Assets rated 23 and 24 are categorised as “Specially Mentioned I”
and 25 are categorised as “Specially Mentioned II”. All Loans and advances rated from 21 to 25 are considered
as Grade 4 – Watch-List in the note below.
The Group has a progressive risk rating system in place, and a conservative policy for early recognition of
impairment and for providing for non–performing assets.
Outside the 25 point scale, there are 4 ratings – Non-Accrual Under Restructuring (NAUR), Sub-standard,
Doubtful and Loss, categorised as Non-Performing assets. NAUR rating is assigned to borrowers that are past
due by more than 90 days on payment of interest and where negotiation for re-structuring is in progress.
Sub-standard loans are assets where the ability to service the debt has been severely impacted and where
the principal or interest is past due for over 90 days and there is no immediate prospects of a restructuring.
Provisions and loans classification are taken in line with the Central Bank of U.A.E. guidelines and IFRS.

Mashreq Annual Report 2016136
43 Risk management (continued)
Credit risk management (continued)
Loan classification (continued)
When interest or principal of a credit is overdue for ninety days or more, interest is suspended and is not
credited to consolidated income statement. Once a loan is designated as non-accrual, all previously accrued but
uncollected interest is reversed and charged against interest income. Interest accruals are no longer recorded
as income, and the amortisation into income of deferred loan fees ceases. Specific allowance for impairment
of classified assets is made based on recoverability of exposure and the risk ratings of the assets.
Any collections on cash basis for non-performing loans are accounted for on the basis of credit policy. Where
provisions are held, the amount collected is applied first towards principal, and then to interest. Where
provisions are not held, the amount collected is applied first to interest and then to principal.
Impaired loans and securities
Impaired loans and other financial assets are loans and other financial assets for which the Group determines
that it will be unable to collect all principal and interest due according to the contractual terms of the loans
and other financial assets agreements. These assets are graded Non-Accrual under Restructuring (NAUR), Sub-
Standard, Doubtful or Loss in the Group’s internal credit risk grading system for wholesale credits. It also
includes assets where interest has been suspended or stopped pending conclusion of the re-structuring.
Impairment of retail loans is calculated by applying a formulaic approach as per Central Bank guidelines
whereby a provision of 25% of principal balance is made when it is past due by more than 90 days and less
than 120 days a provision of 50% of principal balance is made when is past due by more than 120 days and
less than 180 days. Where such a segregation is not possible as to principal balance, the provisions are taken as
aforesaid on the total balance against the facility. Retail loans are written off at a maximum of 181 days past
their due date, based on the characteristics of the underlying product. The only exception to this is mortgages,
where provisioning is based on Central Bank guidelines. Notwithstanding for certain high risk mortgages, the
entire outstanding is fully provided for at 180 days overdue.
Past due but not impaired loans and securities
Past due but not impaired loans and other financial assets are those loans and other financial assets where
contractual interest or principal payments are past due. Very often these overdues are only for a few days and
do not reflect fundamental weaknesses. On this class of asset the Group believes that specific impairment is
not appropriate at the current condition on the basis of the level of security or collateral available and/or the
stage of collection of amounts owed to the Group.
Allowances for impairment
The Group establishes an allowance for impairment losses that represents its estimate of incurred losses in its
loan portfolio. The main components of this allowance are a specific loss component that relates to individually
significant exposures, and a collective impairment allowance established for the statistical possibility that
some of these loan may get impaired in future.
The Group also complies with International Accounting Standards 39 (IAS 39) in accordance with which it
assesses the need for any impairment losses on its loans portfolio by calculating the net present value using
the original effective interest rate of the expected future cash flows for each loan or its recoverability based
on either collateral value or the market value of the asset where such price is available.
Notes to the consolidated financial statements for the year ended 31 December 2016 (continued)

Mashreq Annual Report 2016 137
43 Risk management (continued)
Credit risk management (continued)
Write-off policy
The Group writes off a loan or other financial asset (and any related allowances for impairment losses) when
the Group Credit determines that the loans or other financial assets are uncollectible in whole or in part.
This determination is reached after considering information such as the occurrence of significant changes in
the borrower or issuer’s financial position such that the borrower or issuer can no longer pay its obligation
in full, or that proceeds from collateral will not be sufficient to pay back the entire exposure. For smaller
balance standardised loans, charge off decisions generally are based on a product specific past due status.
Assets are written-off against provisions up to the extent of amount considered un-collectible. However, the
Group retains its full legal claim on, and may continue with its recovery effort including litigation, on written
off accounts.
Set out below is an analysis of the gross and net (of allowances for impairment) amounts of impaired assets by
risk grade.
Due from banks Loans and advancesIslamic financing and
investment
Other financial assets measured at
amortised cost
2016 2015 2016 2015 2016 2015 2016 2015AED’000 AED’000 AED’000 AED’000 AED’000 AED’000 AED’000 AED’000
Impaired
Non-Accrual UnderRestructuring - - 88,287 83,332 8,047 - - -
Substandard - - 351,858 231,154 9,347 25,663 - -Doubtful - - 868,222 989,691 31,382 19,820 - -Loss - - 895,269 648,219 22,278 16,289 111,998 111,998
Gross amount - - 2,203,636 1,952,396 71,054 61,772 111,998 111,998Interest/profit suspended - (122) (310,336) (229,533) (4,574) (4,719) (2,129) (2,129)
Specific allowance forimpairment - - (1,045,147) (774,884) (25,971) (19,212) (109,869) (109,869)
- (122) 848,153 947,979 40,509 37,841 - -
Past due but not impaired
Past due by less than 90 days - - 121,589 99,788 - 94,766 - -Past due beyond 90 days - - 29,938 - - 92,000 - -
Past due retail loans beyond30 days - - 384,100 365,776 41,480 25,873 - -
- - 535,627 465,564 41,480 212,639 - -
Neither past due nor impaired
Gross amount 18,667,750 15,010,112 53,909,731 53,903,279 7,507,774 6,384,826 10,849,298 7,993,072Other allowances - - (202,000) (202,000) - - - -
Collective allowance forimpairment - - (1,663,050) (1,559,752) (24,700) (24,700) - -
18,667,750 15,010,112 52,044,681 52,141,527 7,483,074 6,360,126 10,849,298 7,993,072
Carrying amount 18,667,750 15,009,990 53,428,461 53,555,070 7,565,063 6,610,606 10,849,298 7,993,072
Notes to the consolidated financial statements for the year ended 31 December 2016 (continued)

Mashreq Annual Report 2016138
43 Risk management (continued)
Credit risk management (continued)
The credit quality of the portfolio of loans and advances measured at amortised cost and Islamic financing and
investing products at amortised costs that were neither past due nor impaired as at 31 December 2016 and
2015 can be assessed by reference to the Group’s standard credit grading system. The following information
is based on the system:
Loans and advancesIslamic financing
and investment products2016 2015 2016 2015
Grades AED’000 AED’000 AED’000 AED’000
Grade 1 – Low risk 3,863,219 4,036,364 701,448 547,836Grade 2 – Satisfactory risk 36,675,960 38,850,512 5,217,573 4,668,614Grade 3 – Fair Risk 6,755,585 5,870,094 366,295 672,514Grade 4 – Watch List 6,614,967 5,146,309 1,222,457 495,862
53,909,731 53,903,279 7,507,773 6,384,826
Collateral against loans and advances measured at amortised cost is generally held in the form of mortgage
interests over property, other registered securities over assets, and guarantees. Estimates of fair value are based
on the value of collateral assessed at the time of borrowing. Collateral generally is not held over amounts due
from banks, except when securities are held as part of reverse repurchase and securities borrowing activity.
Collateral usually is not held against other financial assets.
The table below details the fair value of the collateral which is updated regularly:
Loans and advances and Islamic financing and investment products Due from banks
2016 2015 2016 2015AED’000 AED’000 AED’000 AED’000
Against individually impaired loans and advances:Property 197,342 142,859 - -Equities 238,404 477,942 - -Cash 99,878 2,848 - -
Against loans and advances not impaired:Property 10,323,793 10,581,068 - -Equities 1,121,515 1,234,669 - -Cash 916,205 619,112 109,069 192,953Others 4,870,659 4,128,877 - -
Total 17,767,796 17,187,375 109,069 192,953
Notes to the consolidated financial statements for the year ended 31 December 2016 (continued)

Mashreq Annual Report 2016 139
43 Risk management (continued)
Credit risk management (continued)
The distributions by geographical concentration of impaired loans and advances measured at amortised cost
and impairment allowance for credit losses are as follows:
U.A.E.Middle East
countries O.E.C.D. Total
AED’000 AED’000 AED’000 AED’0002016
Impaired loans and advances 1,294,707 908,762 167 2,203,636Impairment allowance for credit losses inclusive of interest in suspense (777,925) (577,354) (203) (1,355,482)
516,782 331,408 (36) 848,154
2015
Impaired loans and advances 906,280 1,045,916 200 1,952,396Impairment allowance for credit losses inclusive of interest in suspense (499,469) (504,712) (236) (1,004,417)
406,811 541,204 (36) 947,979
The distributions by geographical concentration of impaired Islamic financing and investment products
measured at amortised cost and impairment allowance for credit losses are as follows:
U.A.E.Middle East
countries O.E.C.D. Total
AED’000 AED’000 AED’000 AED’0002016Impaired Islamic financing and investment products 71,054 - - 71,054Impairment allowance for credit losses inclusive of profit in suspense
(30,505) - - (30,505)
40,549 - - 40,549
2015Impaired Islamic financing and investment products 48,755 13,017 - 61,772Impairment allowance for credit losses inclusive of profit in suspense (23,931) - - (23,931)
24,824 13,017 - 37,841
Operational risk Management
Operational risk is risk of loss resulting from inadequate or failed internal processes, systems, people or
from external events. Mashreq’s Operational risk policy outlines the approach and governance structure for
monitoring and managing of operational risk.
Governance
Whilst the Bank cannot eliminate all operational risks, it has developed a comprehensive framework of
identifying, assessing, controlling, mitigating, monitoring and reporting Operational risk.
Operational risk management follows three lines of defence model;
y Business units form the first line of defence. They own the risk and have direct responsibility managing
operational risk in their respective areas
y Group Operational risk team is the second line of defence which provides policy, tools and infrastructure
to assist business units in managing their risks
y Internal Audit is the third line of defence who provides independent assurance on the effectiveness
of the risk management process
Notes to the consolidated financial statements for the year ended 31 December 2016 (continued)

Mashreq Annual Report 2016140
43 Risk management (continued)
Governance (continued)
The Board has oversight responsibilities for operational risk management. These responsibilities are exercised
through the Risk management committee, which is the senior Management forum responsible for the oversight
of Operational Risk.
Regulatory capital requirement for operational risk capital is calculated annually. Mashreq has adopted the
Standardized approach in determining its operational risk capital requirements.
Risk identification, monitoring and reporting
Mashreq’s Operational risk framework consist of tools that assist in managing and measuring operational risk
including;
Risk and control self-assessment (RCSA)
RCSA is the process of identifying, recording and assessing potential risks and related controls. It provides a
framework and tools for management to:
(a) Assess and manage Key risks
(b) Testing the effectiveness of controls
(c) Developing action plans
(d) Identify and prioritize their business objectives
Incident management
The reporting of Operational risk incidents is a critical component of Mashreq’s Operational risk management
framework. This ensures greater risk transparency across the organisation and helps to identify gaps and
facilitate timely remedial action for potential risk exposures.
Market risk management
Market Risk is the risk that fair value or cash flows of financial instruments held by Mashreq Group or its
income may be adversely affected by movement in market factors such as interest rates, credit spreads, foreign
exchange rates, equity and commodity prices.
Market Risk at Mashreq Bank is governed by a comprehensive control framework as defined by the approved
Market Risk Policy. This function is completely independent of the business. The Market Risk Function reports
to the Head of Risk Management.
Market risk arises from the Group’s trading and non-trading activities. The Market Risk Management function
primarily addresses risks arising from trading activities. Interest risk exposure arising from non-trading activities
is managed by the Assets & Liabilities Committee (ALCO). Trading risks are concentrated in Treasury and Capital
Markets (TCM) and are managed by a robust framework of market risk limits that reflect the Group’s market
risk appetite. Limits are placed on position sizes, stop loss levels, as well as on market factor sensitivities.
A comprehensive risk reporting framework is in place where by, the positions are monitored daily against
the established limits and monitoring reports are circulated to the Market Risk Management team and the
respective Business Heads. In case of a limit exception, corrective action is taken in line with the Market Risk
Policy and the concerned trading desk’s limits package.
Notes to the consolidated financial statements for the year ended 31 December 2016 (continued)

Mashreq Annual Report 2016 141
43 Risk management (continued)
Market risk management (continued)
Each trading desk has a Permitted Product List comprising of products and structures which have been
determined to be appropriate for the TCM desk to trade. Any addition to this list is made after approval from
the TCM Product Policy Committee which assesses the risks associated with the product and verifies that they
can be controlled effectively prior to approving the product.
The bank uses Value at Risk (VaR) methodology as its core analytical tool to assess risks across proprietary
trading desks. VaR is an estimate of the potential losses arising in a portfolio over a specified time horizon due
to adverse changes in underlying market factors. The Bank calculates its one-day VaR at a 99% confidence
interval using Monte Carlo Simulations approach across its trading portfolio. Value at Risk framework is
supplemented by other limits and sensitivity triggers.
Stress testing is conducted by generating extreme, but plausible scenarios, such as significant movements in
interest rates, credit spreads, etc. and analysing their effect on the Group’s trading positions.
During the year ended 31 December 2016, VaR was calculated regularly and as of 31 December 2016 the 99%
one day VaR was USD 1.145 million (2015: USD 0.769 million).
There has been no change to the Group’s exposure to market risks or the manner in which these risks are
managed and measured.
Interest rate risk management
Interest rate risk arises from the possibility that changes in interest rates will affect the value of financial assets
and liabilities to different extents. The Group is exposed to interest rate risk as a result of mismatches or gaps
in the amounts of assets and liabilities repricing at different times.
The Group uses simulation-modelling tools to measure and monitor interest rate sensitivity. The results are
analysed and monitored by Assets and Liabilities Committee (“ALCO”). Since majority of the Group’s assets
and liabilities are floating rate, deposits and loans generally are repriced within a short period of each other
providing a natural hedge, which reduces interest rate risk exposure. Moreover, the majority of the Group’s
assets and liabilities reprice within one year, thereby further limiting interest rate risk.
The impact of 50 basis points sudden movement in benchmark interest rate on profit over a 12 months period
as at 31 December 2016 would have been an decrease in profit by 5.37% (in case of decrease of interest rate)
and would have been an increase in profit by 5.51% (in case of increase of interest rate) [2015: -3.86% and
+4.35%] respectively.
During the year ended 31 December 2016, the effective interest rate on due from banks and certificates of
deposits with central banks was 1.56% (2015: 1.36%), on loans and advances measured at amortised cost
5.52% (2015: 5.40%), on customers’ deposits 1.10% (2015: 0.87%) and on due to banks (including repurchase
agreements) 0.83% (2015: 0.61%).
The following table depicts the interest rate sensitivity position and interest rate gap position based on
contractual repricing arrangement:
Notes to the consolidated financial statements for the year ended 31 December 2016 (continued)

Mashreq Annual Report 2016142
43 Risk management (continued)
Market risk management (continued)
Interest rate risk management (continued)
Interest rate repricing analysis:
Within 3 months
Over 3 to 6 months
Over 6 to 12 months
Over 1 to 5 years
Over 5 years
Non-interestbearing
items Total
AED’000 AED’000 AED’000 AED’000 AED’000 AED’000 AED’000
2016 Assets
Cash and balances with central banks 6,918,133 1,200,000 1,000,000 - - 9,511,449 18,629,582
Deposits and balances due from banks 10,595,789 4,031,887 783,781 241,652 - 3,014,641 18,667,750
Other financial assets measured at fair value 394,776 373,696 344,910 - - 1,305,817 2,419,199
Loans and advances measured at amortised cost 40,802,830 4,053,755 1,622,752 4,432,714 2,016,447 499,963 53,428,461
Islamic financing and investmentproducts measured at amortised cost 5,766,871 110,857 81,492 679,997 875,431 50,415 7,565,063
Other financial assets measured atamortised cost 5,723,391 3,458,384 366,415 919,317 381,632 159 10,849,298
Other assets - - - - - 9,552,316 9,552,316
Goodwill - - - - - 15,365 15,365
Investment properties - - - - - 520,864 520,864
Property and equipment - - - - - 1,165,638 1,165,638
Total assets 70,201,790 13,228,579 4,199,350 6,273,680 3,273,510 25,636,627 122,813,536
Within 3 months
Over 3 to 6 months
Over 6 to 12 months
Over 1 to 5 years
Over 5years
Non-interestbearing items Total
AED’000 AED’000 AED’000 AED’000 AED’000 AED’000 AED’0002016
Liabilities and equity
Deposits and balances due to banks 5,337,734 389,844 303,034 - - 2,901,464 8,932,076
Repurchase agreements with banks 605,600 - - - - - 605,600
Customers’ deposits 18,487,369 8,075,316 5,494,292 2,484,100 724,337 34,681,710 69,947,124
Islamic customers’ deposits 2,914,884 392,031 675,219 520,868 21,440 2,568,941 7,093,383
Insurance and life assurance funds - - - - - 1,510,758 1,510,758
Other liabilities - - - - - 10,267,090 10,267,090
Medium-term loans 1,396,456 171,612 3,032,385 259,995 - 111,412 4,971,860
Equity attributable to shareholders of the Parent - - - - - 18,757,636 18,757,636
Non-controlling interest - - - - - 728,009 728,009
Total liabilities and equity 28,742,043 9,028,803 9,504,930 3,264,963 745,777 71,527,020 122,813,536
On Balance Sheet gap 41,459,747 4,199,776 (5,305,580) 3,008,717 2,527,948 (45,890,608) -
Off Balance Sheet gap (231,044) 225,034 (6,717) (1,240) 13,967 - -
Cumulative interest rate sensitivity gap 41,228,703 45,653,513 40,341,216 43,348,693 45,890,608 - -
Notes to the consolidated financial statements for the year ended 31 December 2016 (continued)

Mashreq Annual Report 2016 143
43 Risk management (continued)
Market risk management (continued)
Interest rate risk management (continued)
Interest rate repricing analysis (continued)
Within 3 months
Over 3 to 6 months
Over 6 to 12 months
Over 1 to 5 years
Over 5 years
Non-interestbearing items Total
AED’000 AED’000 AED’000 AED’000 AED’000 AED’000 AED’0002015
Assets
Cash and balances with central banks 9,067,710 1,300,000 740,150 - - 8,315,603 19,423,463Deposits and balances due from banks 8,947,999 2,724,705 1,140,866 110,455 50,206 2,035,759 15,009,990
Other financial assets measured at fair value 520,704 542,360 1,128,184 58,713 165,633 1,509,371 3,924,965
Loans and advances measured at amortised cost 36,593,694 6,733,692 1,597,553 6,337,619 2,048,454 244,058 53,555,070
Islamic financing and investment products measured at amortised cost 4,433,943 339,820 616,033 798,420 355,185 67,205 6,610,606
Other financial assets measured at amortised cost 4,026,899 2,578,099 347,064 824,152 179,013 37,845 7,993,072
Other assets - - - - - 6,928,970 6,928,970Goodwill - - - - - 18,150 18,150Investment properties - - - - - 527,525 527,525Property and equipment - - - - - 1,165,370 1,165,370
Total assets 63,590,949 14,218,676 5,569,850 8,129,359 2,798,491 20,849,856 115,157,181
Within 3 months
Over 3 to 6 months
Over 6 to 12 months
Over 1 to 5 years
Over 5years
Non-interestbearing items Total
AED’000 AED’000 AED’000 AED’000 AED’000 AED’000 AED’0002015
Liabilities and equity
Deposits and balances due to banks 5,482,557 308,487 253,757 379,712 - 2,807,400 9,231,913Repurchase agreements with banks - 734,564 - - - - 734,564Customers’ deposits 19,116,841 6,900,445 4,187,829 3,018,212 201,134 31,819,329 65,243,790Islamic customers’ deposits 4,643,417 788,575 481,618 369,843 24,955 2,083,082 8,391,490Insurance and life assurance funds - - - - - 1,559,704 1,559,704Other liabilities - - - - - 7,404,136 7,404,136Medium-term loans 110,190 298,479 516,000 3,181,187 - - 4,105,856
Equity attributable to shareholders ofthe Parent - - - - - 17,768,610 17,768,610
Non-controlling interest - - - - - 717,118 717,118
Total liabilities and equity 29,353,005 9,030,550 5,439,204 6,948,954 226,089 64,159,379 115,157,181
On Balance Sheet gap 34,237,944 5,188,126 130,646 1,180,405 2,572,402 (43,309,523) -Off Balance Sheet gap (313,990) 211,605 98,150 (9,730) 13,965 - -
Cumulative interest rate sensitivity gap 33,923,954 39,323,685 39,552,481 40,723,156 43,309,523 - -
Notes to the consolidated financial statements for the year ended 31 December 2016 (continued)

Mashreq Annual Report 2016144
43 Risk management (continued)
Market risk management (continued)
Currency risk management
Currency risk represents the risk of change in the value of financial instruments due to changes in foreign
exchange rates. Limits on positions by currencies are monitored. The Group’s exposures on 31 December are:2016 2015
Net spotPosition
Forward position Total
Net spotposition
Forward position Total
AED’000 AED’000 AED’000 AED’000 AED’000 AED’000
U.S. Dollars 9,717,274 (7,849,642) 1,867,632 12,182,344 (6,004,068) 6,178,276Qatari Riyals 1,387,794 769,123 2,156,917 1,884,106 368,803 2,252,909Pound Sterling (702,160) 706,186 4,026 (377,285) 397,348 20,063Euro (3,122,223) 3,323,364 201,141 (3,076,294) 3,179,645 103,351Bahrain Dinar 153,179 (30,119) 123,060 532,934 (5,245) 527,689Saudi Riyal (901,433) 960,864 59,431 (735,517) 841,538 106,021Japanese Yen (368,860) 420,037 51,177 (244,606) 210,342 (34,264)Swiss Francs (124,926) 128,107 3,181 (93,424) 92,691 (733)Kuwaiti Dinar 67,936 (578) 67,358 91,587 (58,612) 32,975Chinese Yuan (230,315) 230,300 (15) 78,791 (78,815) (24)Other (32,888) 81,951 49,063 395,864 191,643 587,507
Total 5,843,378 (1,260,407) 4,582,971 10,638,500 (864,730) 9,773,770
The exchange rate of AED against US Dollar is pegged and the Group’s exposure to currency risk is limited to
that extent.
Most of the major positions are in currencies that are pegged to the U.S. Dollar; therefore, any change in
their exchange rates will have insignificant sensitivity on the consolidated income statement or consolidated
statement of comprehensive income.
Liquidity risk management
Liquidity Risk is the risk that the Group’s entities, in various locations and in various currencies, will be unable
to meet a financial commitment to a customer, creditor, or investor when due.
The Group’s senior management’s focus on liquidity management is to:
y better understand the various sources of liquidity risk, particularly under stressed conditions;
y ensure the Group’s short term and long term resilience, as measured by the Basel III proposals, is
sufficiently robust to meet realistic adverse scenarios;
y develop effective contingency plans to deal with liquidity crises;
y develop liquidity risk tolerance levels within the Internal Capital Adequacy Assessment Process
(ICAAP) framework; and
y demonstrate that the bank can survive the closure of one or more funding markets by ensuring that
finance can be readily raised from a variety of sources.
Notes to the consolidated financial statements for the year ended 31 December 2016 (continued)

Mashreq Annual Report 2016 145
43 Risk management (continued)
Liquidity risk management (continued)
Mashreq’s Board of Directors (“BOD”) bears the ultimate responsibility for liquidity risk management within
the bank. The Board members hence are familiar with liquidity risk and how it is managed as well as have a
thorough understanding of how other risks including credit, market, operational and reputation risks affect the
bank’s overall liquidity risk strategy. Among Mashreq’s Board of Directors, Mr. Abdul Aziz Abdulla Al Ghurair,
the Bank’s Chief Executive Officer and Director, is chiefly responsible for the oversight of Liquidity management
within the Bank.
Mashreqbank’s Head Office (HO) and International Banking Group (IBG) Asset and Liability Committees
(“ALCO”) are responsible for formulating policies for implementing the Board approved liquidity risk appetite.
ALCOs have a broad range of authority delegated by the Board of Directors to manage the Group’s assets
and liabilities structure and funding strategy. ALCOs meets on a monthly basis or more often if required to
review liquidity ratios, asset and liability structure, interest rate and foreign exchange exposures, internal and
statutory ratio compliance, funding and repricing gaps and general domestic and international economic and
financial market conditions. ALCOs determine the structure, responsibilities and controls for managing liquidity
risk and for overseeing the liquidity positions of all foreign branches and for outlining these clearly in the bank’s
liquidity policies.
The ALCO comprises of the Chief Executive Officer, the Head of Corporate Affairs, the Head of Retail Banking
Group, the Head of Corporate Banking Group, the Head of Risk Management, the Head of International Banking
and the Head of Treasury & Capital Markets.
The Group has historically relied on customer deposits for its funding needs. Over the years, the Group has
successfully introduced various cash management products and retail savings’ schemes which have enabled
it to mobilise low cost, broad based deposits. In order to diversify the funding sources, a Euro Medium Term
Notes program was launched in 2004 and, to date; this has outstanding balance of AED 3.14 billion (2015:
AED 2.27 billion) [Note 20(a)] in medium-term loans. The Bank also established a Certificate of Deposit (CD)
programme through of its London branch in 2014. The Bank raised a US$ 500 million syndicated loan through
its key relationship Banks in July 2014.
The Central bank of UAE through its circular no. 33/2015 dated 27 May 2015 announced new Regulations
re-Liquidty at Banks followed by a Guidance Manual. The above mentioned regulations introduced a new
Liquidity ratio called Eligible Liquid Assets ratio (“ELAR”) applicable from 1 July, 2015 as well as the intention
to start the transition to the Basel III Liquidity standards from 1 January 2016. To monitor and manage liquidity
risk, the Group uses various indicators including the regulatory ratios of Advances to Stable Resources (“ASRR”)
and the recently implemented ELAR. Other indicators include loans and advances to customers’ deposits,
liquid assets to total assets, deposit concentration risk indicators, and limits for liquidity gaps. Any breach of
any tolerance level needs to be reported to ALCO and remedied within a short period.
The Treasury function in the Group is responsible for managing liquidity and it follows strict guidelines
for deployment of liquid assets within each maturity bucket. Periodic stress tests are performed to ensure
availability of funds during stressed situations.
Notes to the consolidated financial statements for the year ended 31 December 2016 (continued)
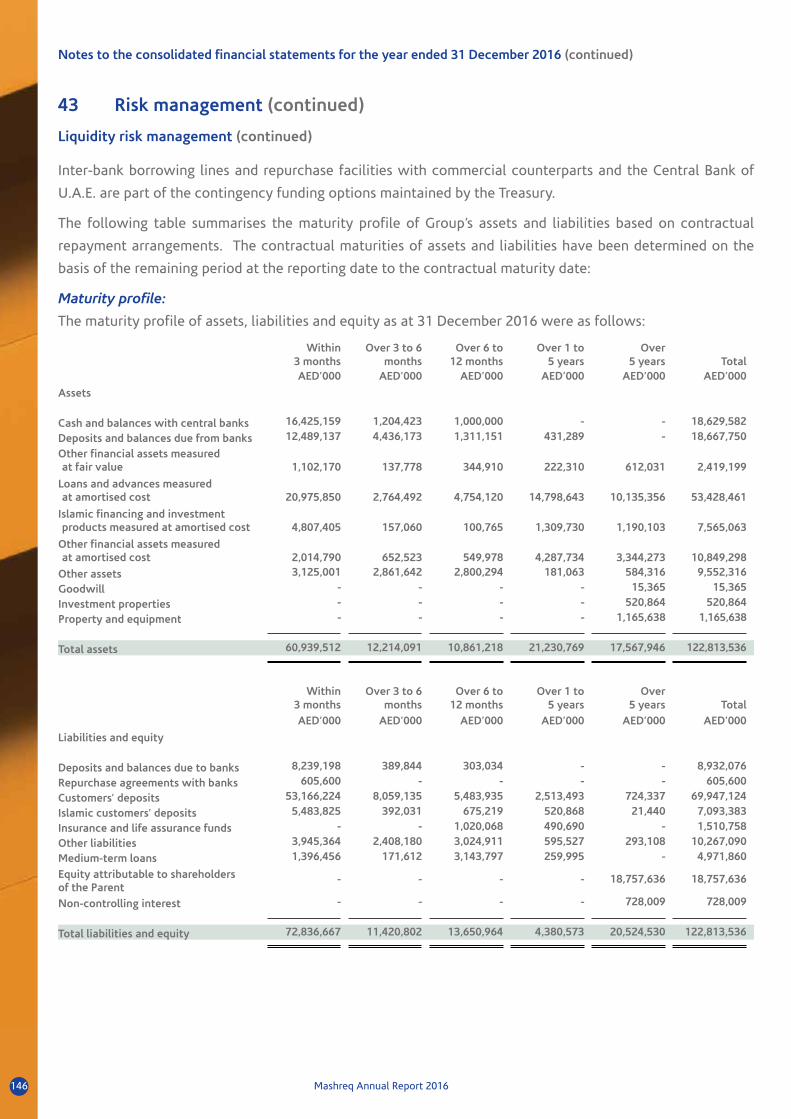
Mashreq Annual Report 2016146
43 Risk management (continued)
Liquidity risk management (continued)
Inter-bank borrowing lines and repurchase facilities with commercial counterparts and the Central Bank of
U.A.E. are part of the contingency funding options maintained by the Treasury.
The following table summarises the maturity profile of Group’s assets and liabilities based on contractual
repayment arrangements. The contractual maturities of assets and liabilities have been determined on the
basis of the remaining period at the reporting date to the contractual maturity date:
Maturity profile:
The maturity profile of assets, liabilities and equity as at 31 December 2016 were as follows:
Within 3 months
Over 3 to 6 months
Over 6 to 12 months
Over 1 to 5 years
Over 5 years Total
AED’000 AED’000 AED’000 AED’000 AED’000 AED’000
Assets
Cash and balances with central banks 16,425,159 1,204,423 1,000,000 - - 18,629,582
Deposits and balances due from banks 12,489,137 4,436,173 1,311,151 431,289 - 18,667,750
Other financial assets measuredat fair value 1,102,170 137,778 344,910 222,310 612,031 2,419,199
Loans and advances measured at amortised cost 20,975,850 2,764,492 4,754,120 14,798,643 10,135,356 53,428,461
Islamic financing and investmentproducts measured at amortised cost 4,807,405 157,060 100,765 1,309,730 1,190,103 7,565,063
Other financial assets measured at amortised cost 2,014,790 652,523 549,978 4,287,734 3,344,273 10,849,298
Other assets 3,125,001 2,861,642 2,800,294 181,063 584,316 9,552,316
Goodwill - - - - 15,365 15,365
Investment properties - - - - 520,864 520,864
Property and equipment - - - - 1,165,638 1,165,638
Total assets 60,939,512 12,214,091 10,861,218 21,230,769 17,567,946 122,813,536
Within 3 months
Over 3 to 6 months
Over 6 to 12 months
Over 1 to 5 years
Over 5 years Total
AED’000 AED’000 AED’000 AED’000 AED’000 AED’000
Liabilities and equity
Deposits and balances due to banks 8,239,198 389,844 303,034 - - 8,932,076
Repurchase agreements with banks 605,600 - - - - 605,600
Customers’ deposits 53,166,224 8,059,135 5,483,935 2,513,493 724,337 69,947,124
Islamic customers’ deposits 5,483,825 392,031 675,219 520,868 21,440 7,093,383
Insurance and life assurance funds - - 1,020,068 490,690 - 1,510,758
Other liabilities 3,945,364 2,408,180 3,024,911 595,527 293,108 10,267,090
Medium-term loans 1,396,456 171,612 3,143,797 259,995 - 4,971,860
Equity attributable to shareholders of the Parent
- - - - 18,757,636 18,757,636
Non-controlling interest - - - - 728,009 728,009
Total liabilities and equity 72,836,667 11,420,802 13,650,964 4,380,573 20,524,530 122,813,536
Notes to the consolidated financial statements for the year ended 31 December 2016 (continued)

Mashreq Annual Report 2016 147
43 Risk management (continued)
Liquidity risk management (continued)
Maturity profile: (continued)
The maturity profile of assets, liabilities and equity as at 31 December 2015 were as follows:
Within 3 months
Over 3 to 6 months
Over 6 to 12 months
Over 1 to 5 years
Over 5 years Total
AED’000 AED’000 AED’000 AED’000 AED’000 AED’000
Assets
Cash and balances with central banks 17,383,313 1,300,000 740,150 - - 19,423,463Deposits and balances due from banks 10,828,896 2,452,057 1,436,148 242,683 50,206 15,009,990
Other financial assets measured at fair value 1,305,403 547,264 1,134,688 256,540 681,070 3,924,965
Loans and advances measured at amortised cost 19,273,866 4,766,025 3,704,998 16,398,763 9,411,418 53,555,070
Islamic financing and investment products measured at amortised cost 2,783,732 583,423 575,342 2,146,992 521,117 6,610,606
Other financial assets measured at amortised cost 498,459 238,192 704,942 3,547,669 3,003,810 7,993,072
Other assets 2,817,479 2,050,944 1,099,923 451,131 509,493 6,928,970Goodwill - - - - 18,150 18,150Investment properties - - - - 527,525 527,525Property and equipment - - - - 1,165,370 1,165,370
Total assets 54,891,148 11,937,905 9,396,191 23,043,778 15,888,159 115,157,181
Within 3 months
Over 3 to 6 months
Over 6 to 12 months
Over 1 to 5 years
Over 5 years Total
AED’000 AED’000 AED’000 AED’000 AED’000 AED’000
Liabilities and equity
Deposits and balances due to banks 6,457,209 319,613 250,006 2,205,085 - 9,231,913
Repurchase agreements with banks - 734,564 - - - 734,564
Customers’ deposits 50,032,423 6,969,927 4,400,894 3,091,190 749,356 65,243,790
Islamic customers’ deposits 6,726,415 788,658 481,618 369,843 24,956 8,391,490
Insurance and life assurance funds - - 1,036,170 523,534 - 1,559,704
Other liabilities 3,635,225 1,785,953 1,140,756 557,662 284,540 7,404,136
Medium-term loans 110,190 298,479 516,000 3,181,187 - 4,105,856Equity attributable to shareholders of the Parent
- - - - 17,768,610 17,768,610
Non-controlling interest - - - - 717,118 717,118
Total liabilities and equity 66,961,462 10,897,194 7,825,444 9,928,501 19,544,580 115,157,181
Fair value measurements
Fair value is the price that would be received to sell an asset or paid to transfer a liability in an orderly
transaction between market participants at the measurement date, regardless of whether that price is directly
observable or estimated using another valuation technique. In estimating the fair value of an asset or a liability,
the Group takes into account the characteristics of the asset or liability if market participants would take those
characteristics into account when pricing the asset or liability at the measurement date.
In addition, for financial reporting purposes, fair value measurements are categorised into Level 1, 2 or 3 based
on the degree to which the inputs to the fair value measurements are observable and the significance of the
inputs to the fair value measurement in its entirety, which are described as follows:
Notes to the consolidated financial statements for the year ended 31 December 2016 (continued)

Mashreq Annual Report 2016148
43 Risk management (continued)Fair value measurements (continued)
y Level 1 inputs are quoted prices (unadjusted) in active markets for identical assets or liabilities that
the entity can access at the measurement date;
y Level 2 inputs are inputs, other than quoted prices included within Level 1, that are observable for the
asset or liability, either directly or indirectly; and
y Level 3 inputs are unobservable inputs for the asset or liability.
Valuation techniques and assumptions applied for the purposes of measuring fair value
The fair values of financial assets and financial liabilities are determined using similar valuation techniques and
assumptions as used for the year ended 31 December 2015.
Fair value of the Group’s financial assets that are measured at fair value on recurring basis
Some of the Group’s financial assets are measured at fair value at the end of the reporting period. The following
table gives information about how the fair values of these financial assets are determined:
Financial assets
Fair value as at
Fair value hierarchy
Valuation techniques and key inputs
Significant unobservable input
Relationship of unobservable inputs to fair value
31-Dec-16 31-Dec-15
AED’000 AED’000Financial assets measured at FVTPL Quoted equity investments
- 16,548 Level 1Quoted bid prices in an active market
None NA
Quoted debt investments
369,195 188,924 Level 1Quoted bid prices in an active market
None NA
Unquoted debt investments
680,364 2,404,569 Level 2Based on the recent similar transaction in market
Similar market transaction
Higher the price of the interest rate lower the value of bond.
Unquoted debt investments
63,837 67,518 Level 3Based on discounted cashflow model
Interest rateHigher the interest rate lower the value of bond.
Mutual and other funds
274,558 327,807 Level 3 Net assets values of the fundsNet assets value
Higher the net asset value, higher the fair value.
Unquoted equity investments
215 508 Level 3
Net assets valuation method due to the unavailability of market and comparable financial information. Net assets values were determined based on the latest available audited/historical financial information.
Net assets value
Higher the net assets value of the investees, higher the fair value.
Mutual and other funds
262,351 261,936 Level 1Quoted bid prices in an active market
None NA
1,650,520 3,267,810
Notes to the consolidated financial statements for the year ended 31 December 2016 (continued)

Mashreq Annual Report 2016 149
43. Risk management (continued)
Fair value measurements (continued)
Financial assetsFair value as at
Fair value hierarchy
Valuation techniques and key inputs
Significant unobservable input
Relationship of unobservable inputs to fair value
31-Dec-16 31-Dec-15AED’000 AED’000
Financial assets measured at FVTOCI Quoted equity investments
384,214 402,783 Level 1Quoted bid prices in an active market
None NA
Unquoted equity investments
348,294 216,650 Level 3
Net assets valuation method due to the unavailability of market and comparable financial information. Net assets values were determined based on the latest available audited/historical financial information.
Net assets valueHigher the net assets value of the investees, higher the fair value.
Mutual and Other funds
36,171 37,722 Level 1Quoted bid prices in an active market
None NA
768,679 657,155 2,419,199 3,924,965
There were no transfers between each of level during the year. There are no financial liabilities which should
be categorised under any of the level in table above.
The movement in the level 3 financial assets were due to exchange differences and changes in fair value.
Reconciliation of Level 3 fair value measurement of other financial assets measured at FVTPL2016 2015
AED’000 AED’000At 1 January 395,834 393,977Purchases 97,250 134,367Disposals/matured (158,298) (199,308)Transfer in - 85,178Change in fair value 3,824 (18,380)
At 31 December 338,610 395,834
Reconciliation of Level 3 fair value measurement of other financial assets measured at FVTOCI2016 2015
AED’000 AED’000
At 1 January 216,650 214,647Purchases 106,165 37,350Disposals/matured (16,643) (21,397)Change in fair value 42,122 (13,950)
At 31 December 348,294 216,650
All gain and losses included in consolidated statement of comprehensive income relate to unquoted investments
in equity instruments held at the end of the reporting period and are reported as changes of ‘investments
revaluation reserve’.
Notes to the consolidated financial statements for the year ended 31 December 2016 (continued)

Mashreq Annual Report 2016150
43. Risk management (continued)
Fair value measurements (continued)
Fair value of financial instruments measured at amortised cost
Except as detailed in the following table, the management considers that the carrying amounts of financial
assets and financial liabilities measured at amortised cost in the consolidated financial statements approximate
their fair values.
Carrying Fair valueamount Level 1 Level 2 Level 3 Total
2016 AED’000 AED’000 AED’000 AED’000 AED’000Financial assets:Other financial assetsmeasured at amortised cost 10,849,298 7,070,188 1,237,774 2,450,533 10,758,495
2015Financial assets:Other financial assets measured at amortised cost 7,993,072 6,232,112 - 1,687,966 7,920,078
Carrying Fair valueAmount Level 1 Level 2 Level 3 Total
2016 AED’000 AED’000 AED’000 AED’000 AED’000Financial liabilitiesMedium-term notes 3,135,360 1,786,183 - 1,340,883 3,127,066
2015Financial liabilitiesMedium-term notes 2,269,356 1,434,794 - 811,281 2,246,075
The following table shows the sensitivity of fair values to 10% increase or decrease as at 31 December 2016
and 2015:
Reflected in consolidated statement of income
Reflected in consolidated statement of comprehensive
income
Favourable change
Unfavourable change
Favourable change
Unfavourable change
AED’000 AED’000 AED’000 AED’0002016Other financial assets measured at fair value 165,052 (165,052) 76,868 (76,868)
2015Other financial assets measured at fair value 326,781 (326,781) 65,715 (65,715)
Majority of the derivatives financial instruments are back to back; therefore, any change to the fair value of
the derivatives resulting from price input changes will have insignificant impact on the consolidated income
statement or consolidated statement of comprehensive income.
Notes to the consolidated financial statements for the year ended 31 December 2016 (continued)
Mashreq Annual Report 2016 151
Notes to the consolidated financial statements for the year ended 31 December 2016 (continued)
44 Fiduciary activities
Assets held by the Group in trust, in a fiduciary and custodial capacity on behalf of its customers, are not
included in these consolidated financial statements. These include assets held in a fiduciary capacity for a
related party as of 31 December 2016 of AED 1 million (2015: AED 1 million).
45 Fund management
Makaseb Funds Company BSC and Mashreq Capital (DIFC) Limited (Note 36) manage a number of funds which
are not consolidated in these consolidated financial statements. The funds have no recourse to the general
assets of the Group; further the Group has no recourse to the assets of the funds.
46 Foreign restricted assets
Net assets equivalent to AED 98 million as at 31 December 2016 (2015: AED 91 million) maintained by certain
branches of the Bank, operating outside the United Arab Emirates, are subject to exchange control regulations
of the countries in which these branches operate.
47 Approval of consolidated financial statements
The consolidated financial statements for the year ended 31 December 2016 were approved by the Board of
Directors and authorised for issue on 25 January 2017.

Mashreq Annual Report 2016152

Mashreq Annual Report 2016 153