Embed Size (px)
Citation preview

2016 Fact Book Undergraduate & Graduate Student
Enrollment Information
October 1, 2016
Prepared by the Division of Enrollment Management
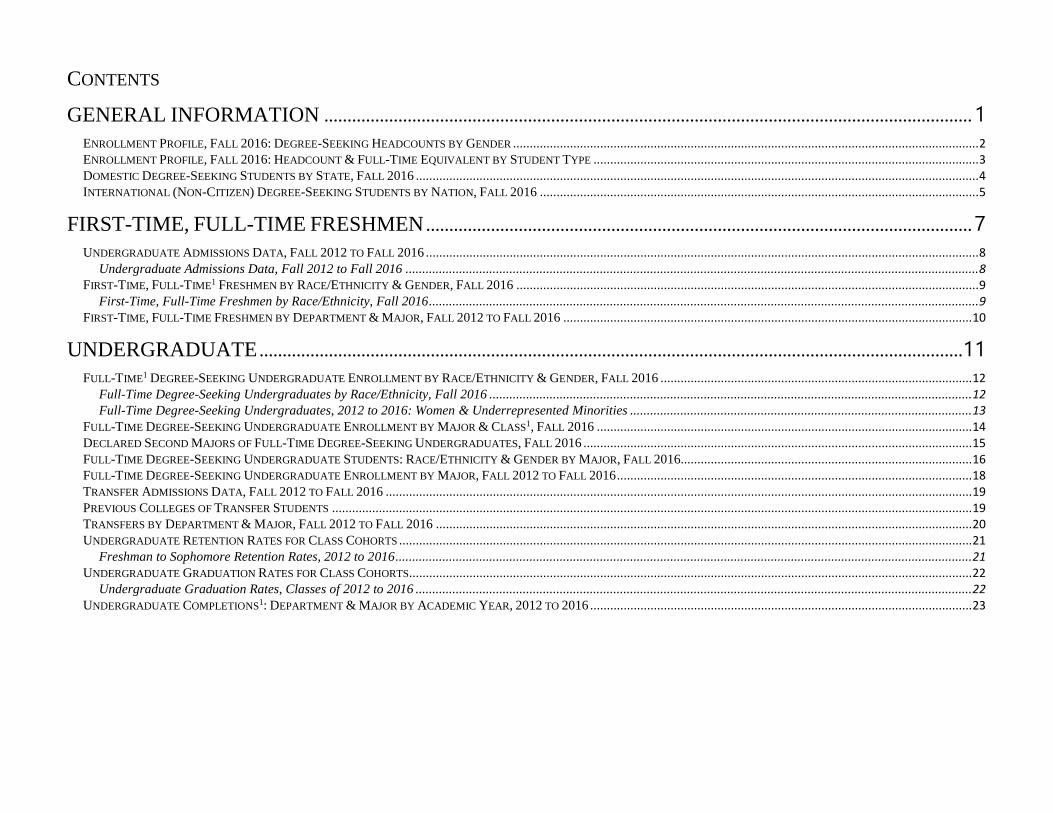
CONTENTS
GENERAL INFORMATION ............................................................................................................................................ 1
ENROLLMENT PROFILE, FALL 2016: DEGREE-SEEKING HEADCOUNTS BY GENDER ........................................................................................................................................... 2 ENROLLMENT PROFILE, FALL 2016: HEADCOUNT & FULL-TIME EQUIVALENT BY STUDENT TYPE ................................................................................................................... 3 DOMESTIC DEGREE-SEEKING STUDENTS BY STATE, FALL 2016 ........................................................................................................................................................................ 4 INTERNATIONAL (NON-CITIZEN) DEGREE-SEEKING STUDENTS BY NATION, FALL 2016 ................................................................................................................................... 5
FIRST-TIME, FULL-TIME FRESHMEN ...................................................................................................................... 7
UNDERGRADUATE ADMISSIONS DATA, FALL 2012 TO FALL 2016 ..................................................................................................................................................................... 8 Undergraduate Admissions Data, Fall 2012 to Fall 2016 ........................................................................................................................................................................... 8
FIRST-TIME, FULL-TIME1 FRESHMEN BY RACE/ETHNICITY & GENDER, FALL 2016 .......................................................................................................................................... 9 First-Time, Full-Time Freshmen by Race/Ethnicity, Fall 2016 .................................................................................................................................................................... 9
FIRST-TIME, FULL-TIME FRESHMEN BY DEPARTMENT & MAJOR, FALL 2012 TO FALL 2016 .......................................................................................................................... 10
UNDERGRADUATE ........................................................................................................................................................11
FULL-TIME1 DEGREE-SEEKING UNDERGRADUATE ENROLLMENT BY RACE/ETHNICITY & GENDER, FALL 2016 ............................................................................................. 12 Full-Time Degree-Seeking Undergraduates by Race/Ethnicity, Fall 2016 ................................................................................................................................................ 12 Full-Time Degree-Seeking Undergraduates, 2012 to 2016: Women & Underrepresented Minorities ...................................................................................................... 13
FULL-TIME DEGREE-SEEKING UNDERGRADUATE ENROLLMENT BY MAJOR & CLASS1, FALL 2016 ................................................................................................................ 14 DECLARED SECOND MAJORS OF FULL-TIME DEGREE-SEEKING UNDERGRADUATES, FALL 2016 .................................................................................................................... 15 FULL-TIME DEGREE-SEEKING UNDERGRADUATE STUDENTS: RACE/ETHNICITY & GENDER BY MAJOR, FALL 2016....................................................................................... 16 FULL-TIME DEGREE-SEEKING UNDERGRADUATE ENROLLMENT BY MAJOR, FALL 2012 TO FALL 2016 .......................................................................................................... 18 TRANSFER ADMISSIONS DATA, FALL 2012 TO FALL 2016 ............................................................................................................................................................................... 19 PREVIOUS COLLEGES OF TRANSFER STUDENTS ............................................................................................................................................................................................... 19 TRANSFERS BY DEPARTMENT & MAJOR, FALL 2012 TO FALL 2016 ................................................................................................................................................................ 20 UNDERGRADUATE RETENTION RATES FOR CLASS COHORTS ........................................................................................................................................................................... 21
Freshman to Sophomore Retention Rates, 2012 to 2016 ............................................................................................................................................................................ 21 UNDERGRADUATE GRADUATION RATES FOR CLASS COHORTS ........................................................................................................................................................................ 22
Undergraduate Graduation Rates, Classes of 2012 to 2016 ...................................................................................................................................................................... 22 UNDERGRADUATE COMPLETIONS1: DEPARTMENT & MAJOR BY ACADEMIC YEAR, 2012 TO 2016 .................................................................................................................. 23

GRADUATE ........................................................................................................................................................................24
FULL- & PART-TIME1 DEGREE-SEEKING GRADUATE ENROLLMENT BY RACE/ETHNICITY & GENDER, FALL 2016 .......................................................................................... 25 Full- & Part-Time Degree-Seeking Graduate Students by Race/Ethnicity, Fall 2016 ............................................................................................................................... 25 Full- & Part-Time Degree-Seeking Graduate Students, 2012 to 2016: Women & Underrepresented Minorities ..................................................................................... 26
FULL- & PART-TIME DEGREE-SEEKING GRADUATE ENROLLMENT BY DEPARTMENT & MAJOR, FALL 2016 .................................................................................................. 27 FULL-TIME DEGREE-SEEKING GRADUATE STUDENTS: RACE/ETHNICITY & GENDER BY MAJOR, FALL 2016 ................................................................................................. 28 PART-TIME DEGREE-SEEKING GRADUATE STUDENTS: RACE/ETHNICITY & GENDER BY MAJOR, FALL 2016 ................................................................................................. 30 FULL- & PART-TIME DEGREE-SEEKING GRADUATE ENROLLMENT BY MAJOR, FALL 2012 TO FALL 2016 ...................................................................................................... 32 GRADUATE COMPLETIONS: DEPARTMENT & MAJOR BY ACADEMIC YEAR, 2012 TO 2016 .............................................................................................................................. 33

W o r c e s t e r P o l y t e c h n i c I n s t i t u t e P a g e | 1 1 0 / 0 1 / 2 0 1 6
FALL 2016:
GENERAL INFORMATION
W o r c e s t e r P o l y t e c h n i c I n s t i t u t e P a g e | 2 1 0 / 0 1 / 2 0 1 6
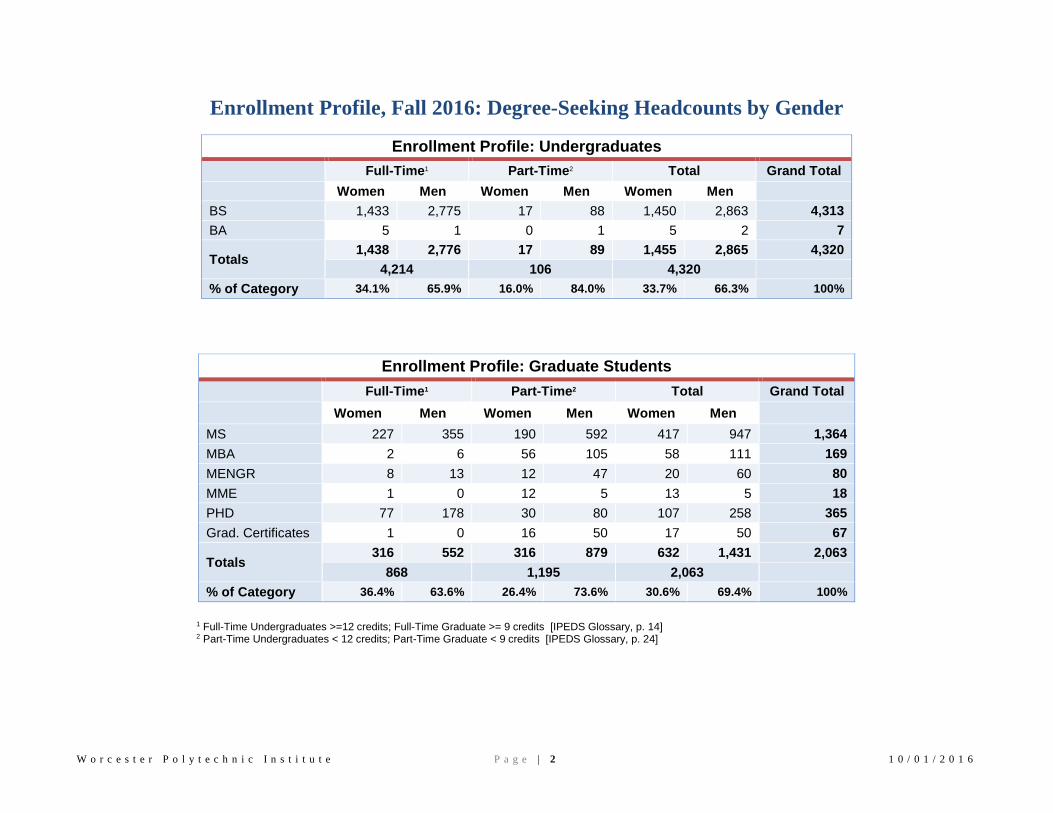
Enrollment Profile, Fall 2016: Degree-Seeking Headcounts by Gender
Enrollment Profile: Undergraduates
Full-Time1 Part-Time2 Total Grand Total
Women Men Women Men Women Men
BS 1,433 2,775 17 88 1,450 2,863 4,313
BA 5 1 0 1 5 2 7
Totals 1,438 2,776 17 89 1,455 2,865 4,320
4,214 106 4,320
% of Category 34.1% 65.9% 16.0% 84.0% 33.7% 66.3% 100%
Enrollment Profile: Graduate Students
Full-Time1 Part-Time2 Total Grand Total
Women Men Women Men Women Men
MS 227 355 190 592 417 947 1,364
MBA 2 6 56 105 58 111 169
MENGR 8 13 12 47 20 60 80
MME 1 0 12 5 13 5 18
PHD 77 178 30 80 107 258 365
Grad. Certificates 1 0 16 50 17 50 67
Totals 316 552 316 879 632 1,431 2,063
868 1,195 2,063
% of Category 36.4% 63.6% 26.4% 73.6% 30.6% 69.4% 100%
1 Full-Time Undergraduates >=12 credits; Full-Time Graduate >= 9 credits [IPEDS Glossary, p. 14] 2 Part-Time Undergraduates < 12 credits; Part-Time Graduate < 9 credits [IPEDS Glossary, p. 24]

W o r c e s t e r P o l y t e c h n i c I n s t i t u t e P a g e | 3 1 0 / 0 1 / 2 0 1 6
Enrollment Profile, Fall 2016: Headcount & Full-Time Equivalent by Student Type
Headcounts
Degree-Seeking Headcounts
Full-Time2 Part-Time3 Total
Undergraduate 4,214 106 4,320
Graduate 868 1,195 2,063
Total 5,082 1,301 6,383
Non-Degree-Seeking Headcounts
Full-Time Part-Time Total
Undergraduate 61 51 112
Graduate 0 147 147
Total 61 198 259
Total Headcounts
Full-Time Part-Time Total
Undergraduate 4,275 157 4,432
Graduate 868 1,342 2,210
Total 5,143 1,499 6,642
IPEDS FTE1
Degree-Seeking FTE
Total
Undergraduate 4,256
Graduate 1,325
Total 5,581
Non-Degree-Seeking FTE
Total
Undergraduate 81
Graduate 56
Total 137
Total FTE
Total
Undergraduate 4,337
Graduate 1,381
Total 5,718
1 Calculation of FTE students (using fall student headcounts): UG = FT + (0.392857)*PT; GR = FT + (0.382059)*PT [IPEDS Glossary, p. 5]
2 Full-Time Undergraduates >=12 credits; Full-Time Graduate >= 9 credits [IPEDS Glossary, p. 14] 3 Part-Time Undergraduates < 12 credits; Part-Time Graduate < 9 credits [IPEDS Glossary, p. 24]
W o r c e s t e r P o l y t e c h n i c I n s t i t u t e P a g e | 4 1 0 / 0 1 / 2 0 1 6
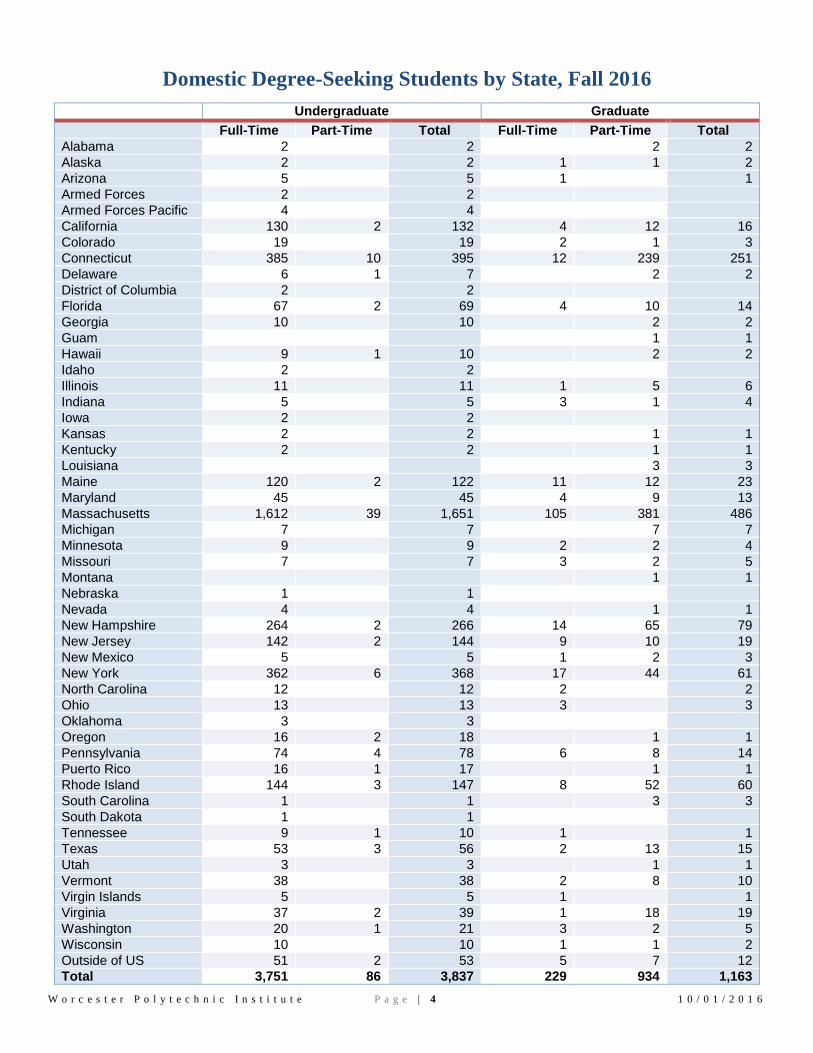
Domestic Degree-Seeking Students by State, Fall 2016
Undergraduate Graduate
Full-Time Part-Time Total Full-Time Part-Time Total
Alabama 2 2 2 2
Alaska 2 2 1 1 2
Arizona 5 5 1 1
Armed Forces 2 2
Armed Forces Pacific 4 4
California 130 2 132 4 12 16
Colorado 19 19 2 1 3
Connecticut 385 10 395 12 239 251
Delaware 6 1 7 2 2
District of Columbia 2 2
Florida 67 2 69 4 10 14
Georgia 10 10 2 2
Guam 1 1
Hawaii 9 1 10 2 2
Idaho 2 2
Illinois 11 11 1 5 6
Indiana 5 5 3 1 4
Iowa 2 2
Kansas 2 2 1 1
Kentucky 2 2 1 1
Louisiana 3 3
Maine 120 2 122 11 12 23
Maryland 45 45 4 9 13
Massachusetts 1,612 39 1,651 105 381 486
Michigan 7 7 7 7
Minnesota 9 9 2 2 4
Missouri 7 7 3 2 5
Montana 1 1
Nebraska 1 1
Nevada 4 4 1 1
New Hampshire 264 2 266 14 65 79
New Jersey 142 2 144 9 10 19
New Mexico 5 5 1 2 3
New York 362 6 368 17 44 61
North Carolina 12 12 2 2
Ohio 13 13 3 3
Oklahoma 3 3
Oregon 16 2 18 1 1
Pennsylvania 74 4 78 6 8 14
Puerto Rico 16 1 17 1 1
Rhode Island 144 3 147 8 52 60
South Carolina 1 1 3 3
South Dakota 1 1
Tennessee 9 1 10 1 1
Texas 53 3 56 2 13 15
Utah 3 3 1 1
Vermont 38 38 2 8 10
Virgin Islands 5 5 1 1
Virginia 37 2 39 1 18 19
Washington 20 1 21 3 2 5
Wisconsin 10 10 1 1 2
Outside of US 51 2 53 5 7 12
Total 3,751 86 3,837 229 934 1,163

W o r c e s t e r P o l y t e c h n i c I n s t i t u t e P a g e | 5 1 0 / 0 1 / 2 0 1 6
International (Non-Citizen) Degree-Seeking Students by Nation, Fall 2016
Undergraduate Graduate
Full-Time Part-Time Total Full-Time Part-Time Total
Afghanistan 2 2
Albania 8 8
Argentina 3 3
Armenia 1 1
Australia 2 2
Bangladesh 4 4 3 3
Barbados 1 1
Belgium 2 2 2 2
Bolivia 2 1 3 1 1
Bosnia And Herzegovina 1 1
Brazil 12 12 6 1 7
British Indian Ocean Ter. 1 1
Bulgaria 1 1 1 1
Burma 2 2 1 1
Cambodia 1 1
Canada 4 4 3 3
Chile 1 1
China 140 7 147 400 139 539
Colombia 4 4
Costa Rica 3 1 4
Cyprus 1 1
Dominican Republic 2 2
Ecuador 9 9 2 1 3
Egypt 3 3 1 1
El Salvador 1 1
Ethiopia 8 8
France 1 1 1 1 2
Georgia 4 4
Germany 1 1
Ghana 3 3 1 1
Greece 18 1 19
Guatemala 2 2 1 1
Guyana 1 1
Honduras 11 11
Hong Kong 3 1 4
India 26 1 27 131 75 206
Indonesia 1 1 5 1 6
Iran 2 2 18 9 27
Iraq 1 1
Israel 2 2 1 1
Italy 3 3 2 2
Jamaica 8 1 9 2 2
Japan 5 5 1 1
W o r c e s t e r P o l y t e c h n i c I n s t i t u t e P a g e | 6 1 0 / 0 1 / 2 0 1 6
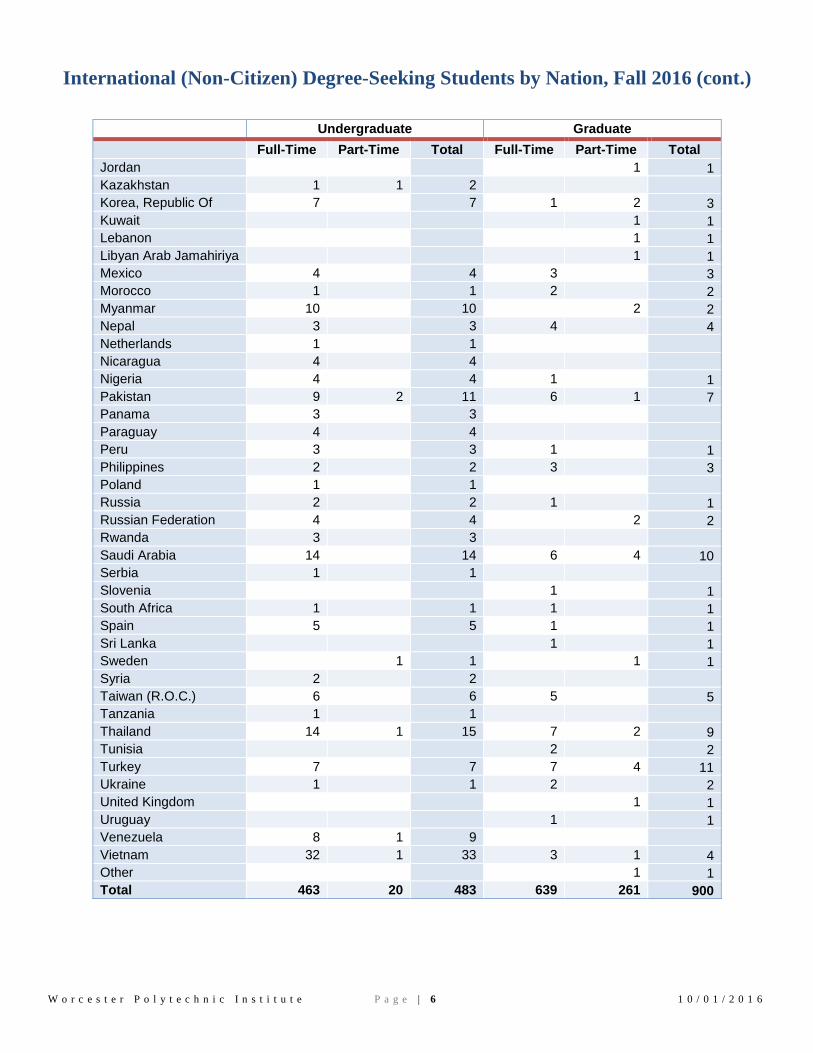
International (Non-Citizen) Degree-Seeking Students by Nation, Fall 2016 (cont.)
Undergraduate Graduate
Full-Time Part-Time Total Full-Time Part-Time Total
Jordan 1 1
Kazakhstan 1 1 2
Korea, Republic Of 7 7 1 2 3
Kuwait 1 1
Lebanon 1 1
Libyan Arab Jamahiriya 1 1
Mexico 4 4 3 3
Morocco 1 1 2 2
Myanmar 10 10 2 2
Nepal 3 3 4 4
Netherlands 1 1
Nicaragua 4 4
Nigeria 4 4 1 1
Pakistan 9 2 11 6 1 7
Panama 3 3
Paraguay 4 4
Peru 3 3 1 1
Philippines 2 2 3 3
Poland 1 1
Russia 2 2 1 1
Russian Federation 4 4 2 2
Rwanda 3 3
Saudi Arabia 14 14 6 4 10
Serbia 1 1
Slovenia 1 1
South Africa 1 1 1 1
Spain 5 5 1 1
Sri Lanka 1 1
Sweden 1 1 1 1
Syria 2 2
Taiwan (R.O.C.) 6 6 5 5
Tanzania 1 1
Thailand 14 1 15 7 2 9
Tunisia 2 2
Turkey 7 7 7 4 11
Ukraine 1 1 2 2
United Kingdom 1 1
Uruguay 1 1
Venezuela 8 1 9
Vietnam 32 1 33 3 1 4
Other 1 1
Total 463 20 483 639 261 900

W o r c e s t e r P o l y t e c h n i c I n s t i t u t e P a g e | 7 1 0 / 0 1 / 2 0 1 6
FALL 2016:
FIRST-TIME, FULL-TIME
FRESHMEN
W o r c e s t e r P o l y t e c h n i c I n s t i t u t e P a g e | 8 1 0 / 0 1 / 2 0 1 6
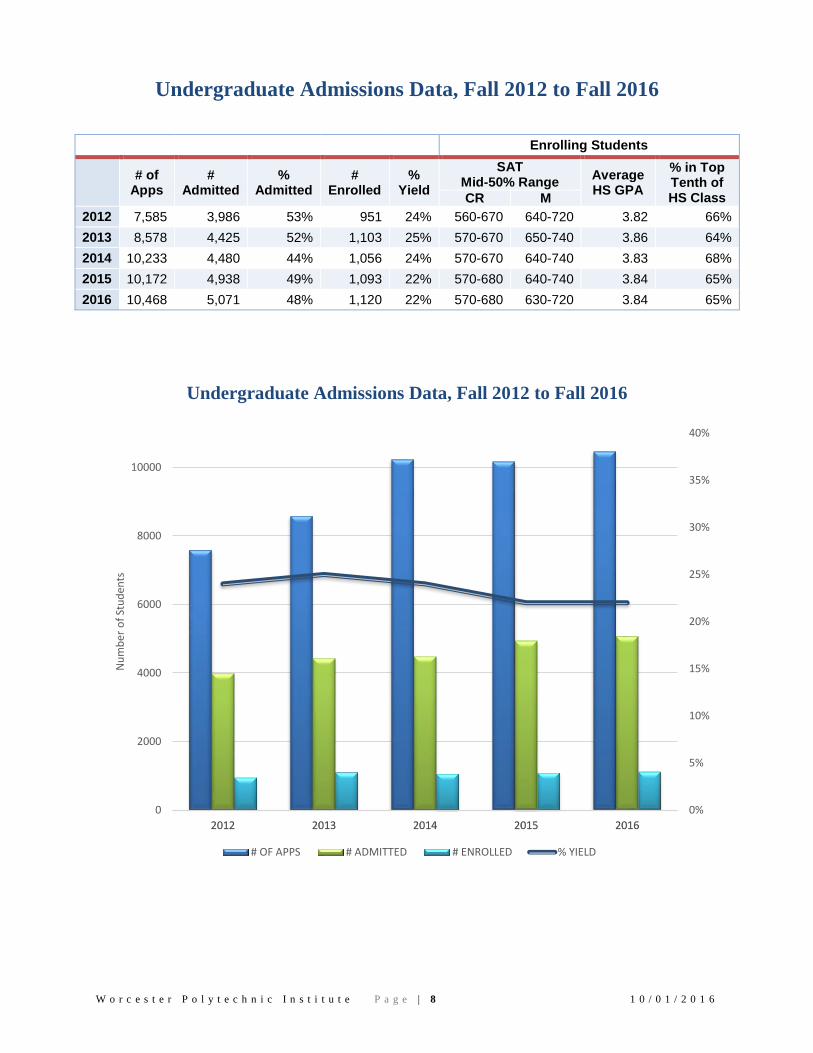
Undergraduate Admissions Data, Fall 2012 to Fall 2016
Enrolling Students
# of
Apps #
Admitted %
Admitted #
Enrolled %
Yield
SAT Mid-50% Range
Average HS GPA
% in Top Tenth of HS Class CR M
2012 7,585 3,986 53% 951 24% 560-670 640-720 3.82 66%
2013 8,578 4,425 52% 1,103 25% 570-670 650-740 3.86 64%
2014 10,233 4,480 44% 1,056 24% 570-670 640-740 3.83 68%
2015 10,172 4,938 49% 1,093 22% 570-680 640-740 3.84 65%
2016 10,468 5,071 48% 1,120 22% 570-680 630-720 3.84 65%
Undergraduate Admissions Data, Fall 2012 to Fall 2016
0%
5%
10%
15%
20%
25%
30%
35%
40%
0
2000
4000
6000
8000
10000
2012 2013 2014 2015 2016
Nu
mb
er o
f St
ud
ents
# OF APPS # ADMITTED # ENROLLED % YIELD
W o r c e s t e r P o l y t e c h n i c I n s t i t u t e P a g e | 9 1 0 / 0 1 / 2 0 1 6
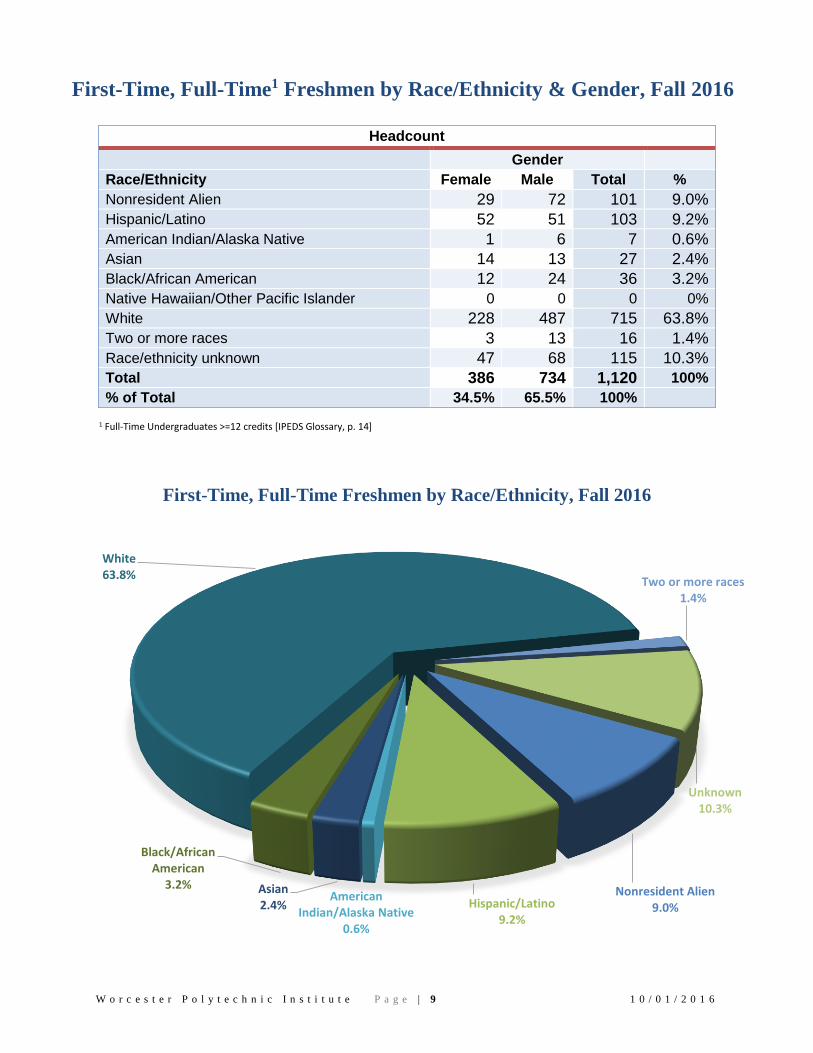
First-Time, Full-Time1 Freshmen by Race/Ethnicity & Gender, Fall 2016
Headcount
Gender
Race/Ethnicity Female Male Total %
Nonresident Alien 29 72 101 9.0%
Hispanic/Latino 52 51 103 9.2%
American Indian/Alaska Native 1 6 7 0.6%
Asian 14 13 27 2.4%
Black/African American 12 24 36 3.2%
Native Hawaiian/Other Pacific Islander 0 0 0 0%
White 228 487 715 63.8%
Two or more races 3 13 16 1.4%
Race/ethnicity unknown 47 68 115 10.3%
Total 386 734 1,120 100%
% of Total 34.5% 65.5% 100% 1 Full-Time Undergraduates >=12 credits [IPEDS Glossary, p. 14]
First-Time, Full-Time Freshmen by Race/Ethnicity, Fall 2016
Nonresident Alien9.0%Hispanic/Latino
9.2%
American Indian/Alaska Native
0.6%
Asian2.4%
Black/African American
3.2%
White 63.8%
Two or more races1.4%
Unknown10.3%
W o r c e s t e r P o l y t e c h n i c I n s t i t u t e P a g e | 1 0 1 0 / 0 1 / 2 0 1 6
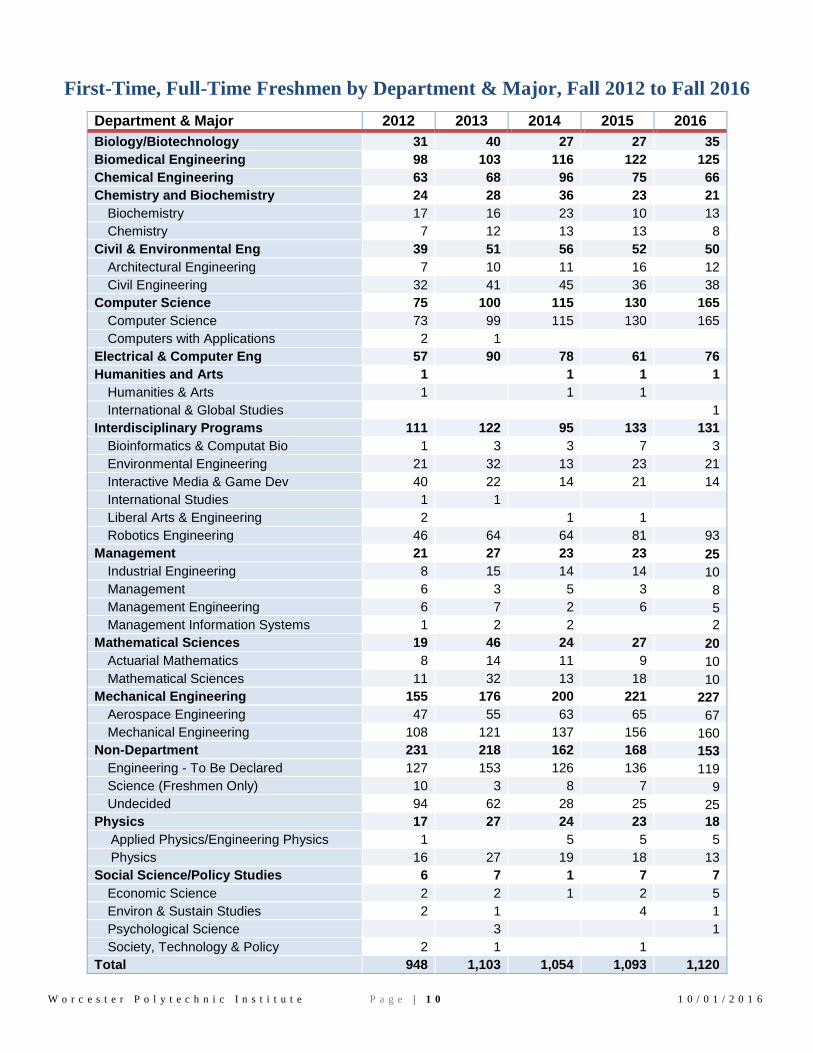
First-Time, Full-Time Freshmen by Department & Major, Fall 2012 to Fall 2016
Department & Major 2012 2013 2014 2015 2016
Biology/Biotechnology 31 40 27 27 35
Biomedical Engineering 98 103 116 122 125
Chemical Engineering 63 68 96 75 66
Chemistry and Biochemistry 24 28 36 23 21
Biochemistry 17 16 23 10 13
Chemistry 7 12 13 13 8
Civil & Environmental Eng 39 51 56 52 50
Architectural Engineering 7 10 11 16 12
Civil Engineering 32 41 45 36 38
Computer Science 75 100 115 130 165
Computer Science 73 99 115 130 165
Computers with Applications 2 1
Electrical & Computer Eng 57 90 78 61 76
Humanities and Arts 1 1 1 1
Humanities & Arts 1 1 1
International & Global Studies 1
Interdisciplinary Programs 111 122 95 133 131
Bioinformatics & Computat Bio 1 3 3 7 3
Environmental Engineering 21 32 13 23 21
Interactive Media & Game Dev 40 22 14 21 14
International Studies 1 1
Liberal Arts & Engineering 2 1 1
Robotics Engineering 46 64 64 81 93
Management 21 27 23 23 25
Industrial Engineering 8 15 14 14 10
Management 6 3 5 3 8
Management Engineering 6 7 2 6 5
Management Information Systems 1 2 2 2
Mathematical Sciences 19 46 24 27 20
Actuarial Mathematics 8 14 11 9 10
Mathematical Sciences 11 32 13 18 10
Mechanical Engineering 155 176 200 221 227
Aerospace Engineering 47 55 63 65 67
Mechanical Engineering 108 121 137 156 160
Non-Department 231 218 162 168 153
Engineering - To Be Declared 127 153 126 136 119
Science (Freshmen Only) 10 3 8 7 9
Undecided 94 62 28 25 25
Physics 17 27 24 23 18
Applied Physics/Engineering Physics 1 5 5 5
Physics 16 27 19 18 13
Social Science/Policy Studies 6 7 1 7 7
Economic Science 2 2 1 2 5
Environ & Sustain Studies 2 1 4 1
Psychological Science 3 1
Society, Technology & Policy 2 1 1
Total 948 1,103 1,054 1,093 1,120

W o r c e s t e r P o l y t e c h n i c I n s t i t u t e P a g e | 1 1 1 0 / 0 1 / 2 0 1 6
FALL 2016:
UNDERGRADUATE

W o r c e s t e r P o l y t e c h n i c I n s t i t u t e P a g e | 1 2 1 0 / 0 1 / 2 0 1 6
Full-Time1 Degree-Seeking Undergraduate Enrollment by
Race/Ethnicity & Gender, Fall 2016
Headcount
Gender
Race/Ethnicity Female Male Total %
Nonresident Alien 128 335 463 11.0%
Hispanic/Latino 174 212 386 9.2%
American Indian/Alaska Native 4 12 16 0.4%
Asian 64 108 172 4.1%
Black/African American 39 73 112 2.7%
Native Hawaiian/Other Pacific Islander 0 0 0 0%
White 876 1,766 2,642 62.7%
Two or more races 45 68 113 2.7%
Race/ethnicity unknown 108 202 310 7.4%
Total 1,438 2,776 4,214 100%
% of Total 34.1% 65.9% 100%
1 Full-Time Undergraduates >=12 credits [IPEDS Glossary, p. 14]
Full-Time Degree-Seeking Undergraduates by Race/Ethnicity, Fall 2016
White62.7%
Nonresident Alien11.0%
Hispanic/Latino9.2%
American Indian/Alaska
Native0.4%
Asian4.1%
Black/African American
2.7%
Two or more races2.7%
Unknown7.4%
W o r c e s t e r P o l y t e c h n i c I n s t i t u t e P a g e | 1 3 1 0 / 0 1 / 2 0 1 6
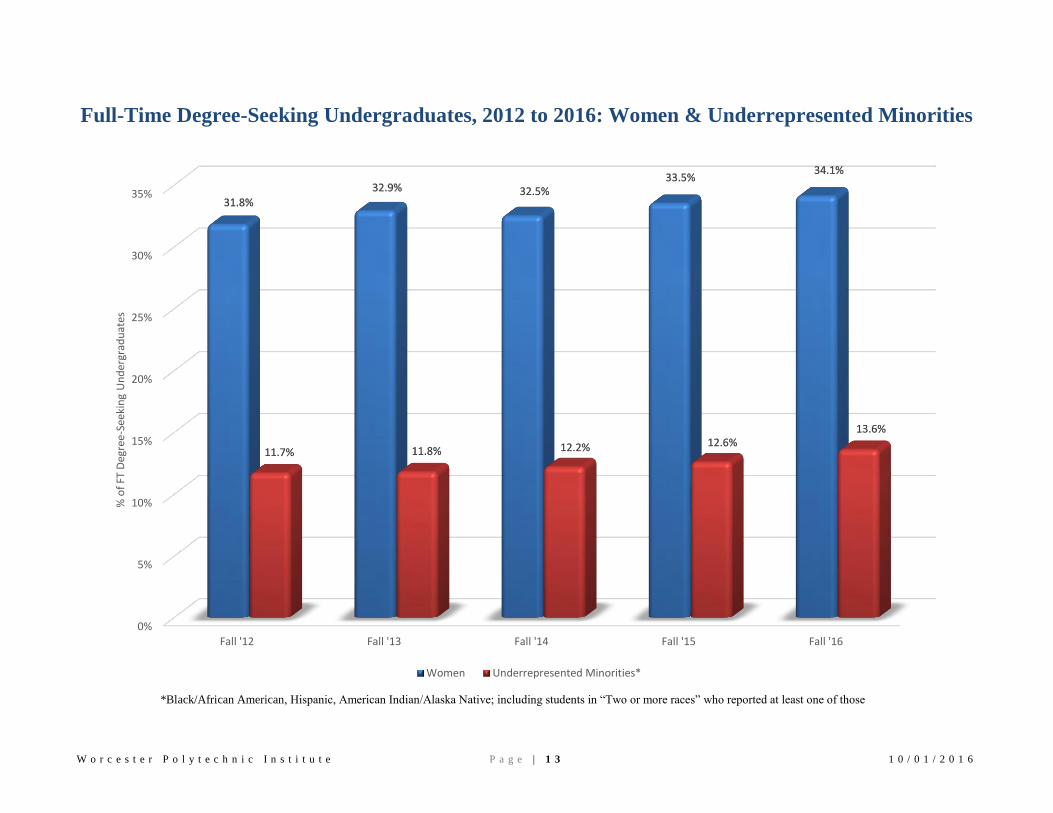
Full-Time Degree-Seeking Undergraduates, 2012 to 2016: Women & Underrepresented Minorities
*Black/African American, Hispanic, American Indian/Alaska Native; including students in “Two or more races” who reported at least one of those
0%
5%
10%
15%
20%
25%
30%
35%
Fall '12 Fall '13 Fall '14 Fall '15 Fall '16
31.8%32.9% 32.5%
33.5%34.1%
11.7% 11.8% 12.2% 12.6%13.6%
% o
f FT
Deg
ree-
Seek
ing
Un
der
grad
uat
es
Women Underrepresented Minorities*

W o r c e s t e r P o l y t e c h n i c I n s t i t u t e P a g e | 1 4 1 0 / 0 1 / 2 0 1 6
Full-Time Degree-Seeking Undergraduate Enrollment by Major & Class1, Fall 2016
Department & Major Freshmen Sophomores Juniors Seniors Total
Biology/ Biotechnology 33 30 25 55 143
Biomedical Engineering 123 82 84 100 389
Chemical Engineering 66 68 89 113 336
Chemistry and Biochemistry 19 20 25 35 99
Biochemistry 14 13 20 24 71
Chemistry 5 7 5 11 28
Civil & Environmental Eng 47 67 47 76 237
Architectural Engineering 11 19 10 19 59
Civil Engineering 36 48 37 57 178
Computer Science 152 140 123 151 566
Electrical & Computer Eng 75 79 84 118 356
Humanities and Arts 1 1 1 1 4
Humanities & Arts 1 1 2
International & Global Studies 1 1 2
Interdisciplinary Programs 126 133 102 160 521
Bioinformatics & Computat Bio 3 8 1 3 15
Environmental Engineering 20 18 12 27 77
Interactive Media & Game Dev 15 30 22 35 102
Interdisciplinary 1 1
Robotics Engineering 88 77 67 94 326
Management 29 43 57 70 199
Industrial Engineering 12 20 26 32 90
Management 9 2 3 4 18
Management Engineering 6 17 21 20 64
Management Information Systems 2 4 7 14 27
Mathematical Sciences 15 26 16 52 109
Actuarial Mathematics 7 15 7 20 49
Mathematical Sciences 8 11 9 32 60
Mechanical Engineering 206 292 225 295 1,018
Aerospace Engineering 63 57 36 64 220
Mechanical Engineering 143 235 189 231 798
Non-Department 148 12 1 161
Engineering - To Be Declared 114 8 1 123
Science (Freshmen Only) 9 9
Undecided 25 4 29
Physics 16 11 18 14 59
Applied Physics/Engineering Physics 3 3 1 7
Physics 13 8 18 13 52
Social Science/Policy Studies 8 4 3 2 17
Economic Science 5 1 1 7
Environ & Sustain Studies 2 3 1 6
Psychological Science 1 1 1 1 4
Grand Total 1,064 1,008 900 1,242 4,214
1 Standing as determined by accumulated credits

W o r c e s t e r P o l y t e c h n i c I n s t i t u t e P a g e | 1 5 1 0 / 0 1 / 2 0 1 6
Declared Second Majors of Full-Time Degree-Seeking Undergraduates, Fall 2016
Department & Major
Biology/Biotechnology 6
Biomedical Engineering 11
Chemical Engineering 3
Chemistry and Biochemistry 18
Biochemistry 10
Chemistry 8
Civil & Environmental Eng 3
Architectural Engineering 1
Civil Engineering 2
Computer Science 90
Electrical & Computer Eng 42
Humanities and Arts 25
Humanities & Arts 5
International & Global Studies 4
Professional Writing 16
Interdisciplinary Programs 57
Bioinformatics & Computat Bio 3
Environmental Engineering 2
Interactive Media & Game Dev 3
International Studies 8
Liberal Arts & Engineering 1
Robotics Engineering 40
Management 14
Industrial Engineering 4
Management 4
Management Engineering 3
Management Information Systems 3
Mathematical Sciences 27
Mathematical Sciences 27
Mechanical Engineering 50
Mechanical Engineering 50
Physics 13
Physics 13
Social Science/Policy Studies 19
Economic Science 5
Environ & Sustain Studies 3
Psychological Science 6
Society, Technology & Policy 4
System Dynamics 1
Total 378

W o r c e s t e r P o l y t e c h n i c I n s t i t u t e P a g e | 1 6 1 0 / 0 1 / 2 0 1 6
Full-Time Degree-Seeking Undergraduate Students: Race/Ethnicity & Gender by Major, Fall 2016
Headcounts
Female Male
Department & Major
No
nre
sid
en
t A
lien
His
pa
nic
/
La
tin
o
Am
er.
In
dia
n/
Ala
ska N
ati
ve
Asia
n
Bla
ck/A
fric
an
A
meri
can
Nat.
Haw
aii
an
/ P
ac. Is
lan
de
r
Wh
ite
Tw
o o
r m
ore
ra
ces
Race/e
thn
icit
y
un
kn
ow
n
To
tal
Wo
men
No
nre
sid
en
t
Ali
en
His
pa
nic
/
La
tin
o
Am
er.
In
dia
n/
Ala
ska N
ati
ve
Asia
n
Bla
ck/A
fric
an
Am
eri
can
Nat.
Haw
aii
an
/
Pac. Is
lan
de
r
Wh
ite
Tw
o o
r m
ore
ra
ces
Race/e
thn
icit
y
un
kn
ow
n
To
tal M
en
Gra
nd
To
tal
Biology/Biotechnology 4 9 5 2 71 5 10 106 1 4 3 1 25 3 37 143
Biomedical Engineering 10 25 14 6 152 7 20 234 11 14 8 3 101 2 16 155 389
Chemical Engineering 16 15 5 4 100 4 11 155 18 13 2 6 7 125 2 8 181 336
Chemistry and Biochemistry 7 7 1 49 1 65 2 3 5 1 19 4 34 99
Biochemistry 6 6 1 35 1 49 1 2 4 1 12 2 22 71
Chemistry 1 1 14 16 1 1 1 7 2 12 28
Civil & Environmental Eng 7 22 2 5 56 3 11 106 9 10 1 1 3 92 6 9 131 237
Architectural Engineering 5 5 1 22 4 37 2 1 1 13 2 3 22 59
Civil Engineering 2 17 2 4 34 3 7 69 9 8 1 2 79 4 6 109 178
Computer Science 24 14 11 1 27 5 8 90 71 31 2 29 11 280 13 39 476 566
Electrical & Computer Eng 11 12 6 3 31 1 3 67 48 24 3 15 6 165 4 24 289 356
Humanities and Arts 1 2 3 1 1 4
Humanities & Arts 1 1 1 1 2
International & Global Studies 1 1 2 2
Interdisciplinary Programs 6 14 2 5 5 93 4 11 140 47 29 3 14 6 242 12 28 381 521
Bioinformatics & Computat Bio 1 6 1 8 6 1 7 15
Environmental Engineering 7 1 2 36 3 4 53 1 1 21 1 24 77
Interactive Media & Game Dev 2 2 1 3 9 1 18 11 8 1 4 1 47 2 10 84 102
Interdisciplinary 1 1 1
Robotics Engineering 4 4 2 2 42 1 5 60 35 20 2 10 5 168 9 17 266 326
Management 12 8 1 4 40 5 6 76 32 10 3 4 58 4 12 123 199
Industrial Engineering 9 5 1 21 1 3 40 24 5 1 18 1 1 50 90
Management 1 3 1 5 1 2 9 1 13 18
Management Engineering 1 2 2 15 4 2 26 5 3 1 2 19 1 7 38 64
Management Information Systems 2 1 1 1 5 2 2 1 12 2 3 22 27

W o r c e s t e r P o l y t e c h n i c I n s t i t u t e P a g e | 1 7 1 0 / 0 1 / 2 0 1 6
Full-Time Degree-Seeking Undergraduate Students: Race/Ethnicity & Gender by Major, Fall 2016
(cont.)
Headcounts
Female Male
Department & Major
No
nre
sid
en
t A
lien
His
pa
nic
/
La
tin
o
Am
er.
In
dia
n/
Ala
ska N
ati
ve
Asia
n
Bla
ck/A
fric
an
Am
eri
can
Nat.
Haw
aii
an
/ P
ac. Is
lan
de
r
Wh
ite
Tw
o o
r m
ore
races
Race/e
thn
icit
y
un
kn
ow
n
To
tal
Wo
men
No
nre
sid
en
t
Ali
en
His
pa
nic
/
La
tin
o
Am
er.
In
dia
n/
Ala
ska N
ati
ve
Asia
n
Bla
ck/A
fric
an
Am
eri
can
Nat.
Haw
aii
an
/
Pac. Is
lan
de
r
Wh
ite
Tw
o o
r m
ore
ra
ces
Race/e
thn
icit
y
un
kn
ow
n
To
tal M
en
Gra
nd
To
tal
Mathematical Sciences 10 3 1 28 1 6 49 7 3 1 1 2 41 1 4 60 109
Actuarial Mathematics 4 2 1 10 4 21 3 2 1 2 17 1 2 28 49
Mathematical Sciences 6 1 18 1 2 28 4 1 1 24 2 32 60
Mechanical Engineering 13 32 1 13 7 174 7 12 259 68 62 20 25 520 19 45 759 1,018
Aerospace Engineering 1 8 1 2 25 1 38 10 13 1 6 136 4 12 182 220
Mechanical Engineering 12 24 1 12 5 149 6 12 221 58 49 19 19 384 15 33 577 798
Non-Department 5 7 1 1 1 41 1 8 65 7 6 1 3 68 4 7 96 161
Engineering - To Be Declared 2 3 1 23 1 7 37 4 6 1 2 62 4 7 86 123
Science (Freshmen Only) 1 1 1 6 9 9
Undecided 2 3 1 12 1 19 3 1 6 10 29
Physics 2 2 7 1 1 13 13 3 2 1 23 1 3 46 59
Applied Physics/Engineering Physics 1 1 2 3 1 6 7
Physics 2 1 7 1 1 12 11 3 2 1 20 1 2 40 52
Social Science/Policy Studies 1 3 5 1 10 7 7 17
Economic Science 1 1 1 3 4 4 7
Environ & Sustain Studies 2 3 5 1 1 6
Psychological Science 1 1 2 2 2 4
Total 128 174 4 64 39 0 876 45 108 1,438 335 212 12 108 73 0 1,766 68 202 2,776 4,214
W o r c e s t e r P o l y t e c h n i c I n s t i t u t e P a g e | 1 8 1 0 / 0 1 / 2 0 1 6
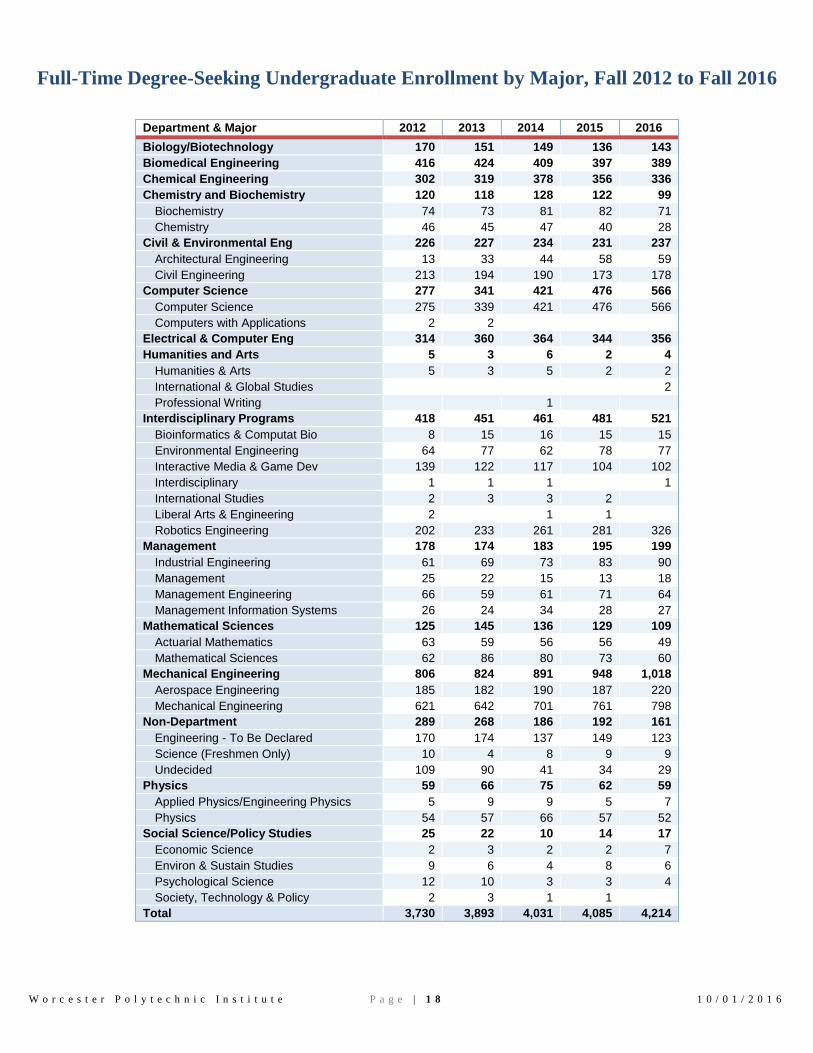
Full-Time Degree-Seeking Undergraduate Enrollment by Major, Fall 2012 to Fall 2016
Department & Major 2012 2013 2014 2015 2016
Biology/Biotechnology 170 151 149 136 143
Biomedical Engineering 416 424 409 397 389
Chemical Engineering 302 319 378 356 336
Chemistry and Biochemistry 120 118 128 122 99
Biochemistry 74 73 81 82 71
Chemistry 46 45 47 40 28
Civil & Environmental Eng 226 227 234 231 237
Architectural Engineering 13 33 44 58 59
Civil Engineering 213 194 190 173 178
Computer Science 277 341 421 476 566
Computer Science 275 339 421 476 566
Computers with Applications 2 2
Electrical & Computer Eng 314 360 364 344 356
Humanities and Arts 5 3 6 2 4
Humanities & Arts 5 3 5 2 2
International & Global Studies 2
Professional Writing 1
Interdisciplinary Programs 418 451 461 481 521
Bioinformatics & Computat Bio 8 15 16 15 15
Environmental Engineering 64 77 62 78 77
Interactive Media & Game Dev 139 122 117 104 102
Interdisciplinary 1 1 1 1
International Studies 2 3 3 2
Liberal Arts & Engineering 2 1 1
Robotics Engineering 202 233 261 281 326
Management 178 174 183 195 199
Industrial Engineering 61 69 73 83 90
Management 25 22 15 13 18
Management Engineering 66 59 61 71 64
Management Information Systems 26 24 34 28 27
Mathematical Sciences 125 145 136 129 109
Actuarial Mathematics 63 59 56 56 49
Mathematical Sciences 62 86 80 73 60
Mechanical Engineering 806 824 891 948 1,018
Aerospace Engineering 185 182 190 187 220
Mechanical Engineering 621 642 701 761 798
Non-Department 289 268 186 192 161
Engineering - To Be Declared 170 174 137 149 123
Science (Freshmen Only) 10 4 8 9 9
Undecided 109 90 41 34 29
Physics 59 66 75 62 59
Applied Physics/Engineering Physics 5 9 9 5 7
Physics 54 57 66 57 52
Social Science/Policy Studies 25 22 10 14 17
Economic Science 2 3 2 2 7
Environ & Sustain Studies 9 6 4 8 6
Psychological Science 12 10 3 3 4
Society, Technology & Policy 2 3 1 1
Total 3,730 3,893 4,031 4,085 4,214
W o r c e s t e r P o l y t e c h n i c I n s t i t u t e P a g e | 1 9 1 0 / 0 1 / 2 0 1 6
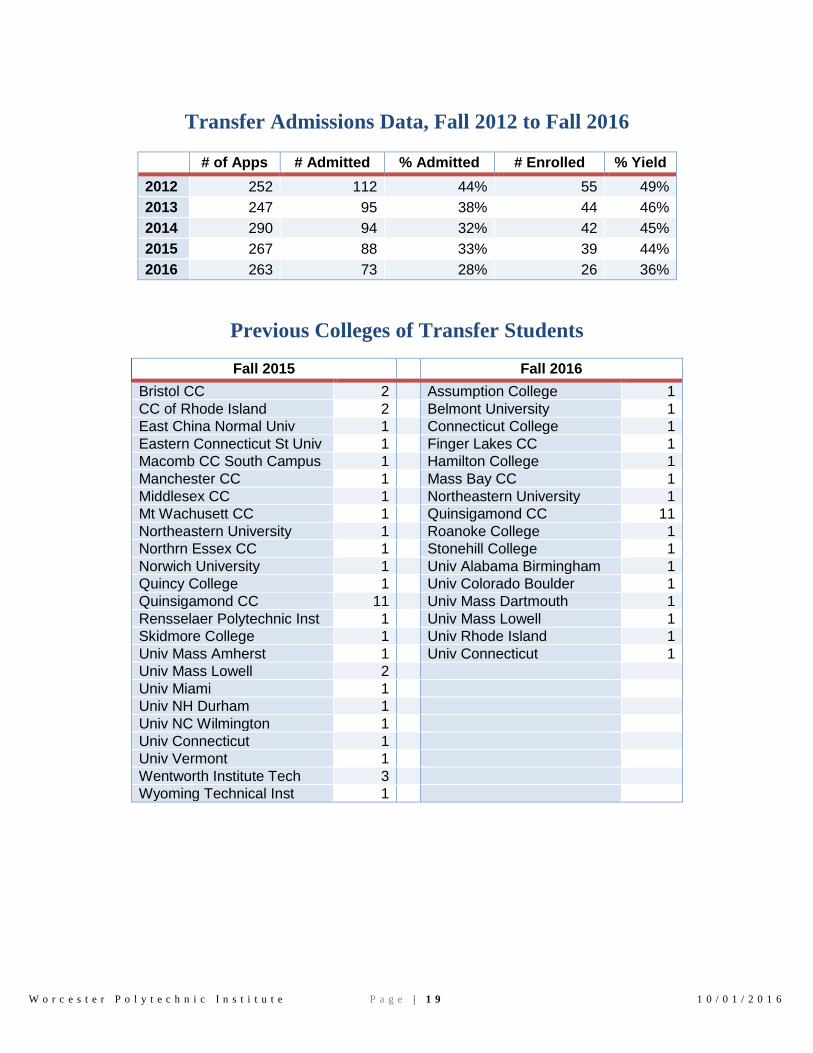
Transfer Admissions Data, Fall 2012 to Fall 2016
# of Apps # Admitted % Admitted # Enrolled % Yield
2012 252 112 44% 55 49%
2013 247 95 38% 44 46%
2014 290 94 32% 42 45%
2015 267 88 33% 39 44%
2016 263 73 28% 26 36%
Previous Colleges of Transfer Students
Fall 2015 Fall 2016
Bristol CC 2 Assumption College 1
CC of Rhode Island 2 Belmont University 1
East China Normal Univ 1 Connecticut College 1
Eastern Connecticut St Univ 1 Finger Lakes CC 1
Macomb CC South Campus 1 Hamilton College 1
Manchester CC 1 Mass Bay CC 1
Middlesex CC 1 Northeastern University 1
Mt Wachusett CC 1 Quinsigamond CC 11
Northeastern University 1 Roanoke College 1
Northrn Essex CC 1 Stonehill College 1
Norwich University 1 Univ Alabama Birmingham 1
Quincy College 1 Univ Colorado Boulder 1
Quinsigamond CC 11 Univ Mass Dartmouth 1
Rensselaer Polytechnic Inst 1 Univ Mass Lowell 1
Skidmore College 1 Univ Rhode Island 1
Univ Mass Amherst 1 Univ Connecticut 1
Univ Mass Lowell 2
Univ Miami 1
Univ NH Durham 1
Univ NC Wilmington 1
Univ Connecticut 1
Univ Vermont 1
Wentworth Institute Tech 3
Wyoming Technical Inst 1

W o r c e s t e r P o l y t e c h n i c I n s t i t u t e P a g e | 2 0 1 0 / 0 1 / 2 0 1 6
Transfers by Department & Major, Fall 2012 to Fall 2016
2012 2013 2014 2015 2016
Biology/Biotechnology 2 1 1 4
Biomedical Engineering 9 12 8 3 1
Chemical Engineering 4 2 2 1 4
Chemistry and Biochemistry 1 1 1 1
Biochemistry 1 1
Chemistry 1 1
Civil & Environmental Eng 3 1 5
Architectural Engineering 2
Civil Engineering 3 1 3
Computer Science 4 4 1 9 2
Electrical & Computer Eng 7 6 7 6 5
Interdisciplinary Programs 7 5 6 2 2
Bioinformatics & Computat Bio 1 1
Environmental Engineering 1 1 2
Interactive Media & Game Dev 1 1 1
Robotics Engineering 4 3 5 1
Management 1
Management 1
Mathematical Sciences 4 1 3 2 2
Actuarial Mathematics 1
Mathematical Sciences 4 1 3 1 2
Mechanical Engineering 5 7 11 9 6
Aerospace Engineering 2 2 2 4 2
Mechanical Engineering 3 5 9 5 4
Non-Department 6 3
Engineering - To Be Declared 4 3
Undecided 2
Physics 2 1 2 1
Applied Physics/Engineering Physics 1
Physics 2 1 1 1
Total 55 44 42 39 26

W o r c e s t e r P o l y t e c h n i c I n s t i t u t e P a g e | 2 1 1 0 / 0 1 / 2 0 1 6
Undergraduate Retention Rates for Class Cohorts
CLASS OF: 2015 2016 2017 2018 2019 2020
ENTERED FALL: 2011 2012 2013 2014 2015 2016
COHORT1 / YEAR 1 1,005 948 1,103 1,054 1,093 1,120
100% 100% 100% 100% 100% 100%
YEAR 2 969 909 1,070 1,011 1,039
FR TO SO YR 96% 96% 97% 96% 95%
YEAR 3 928 862 1,024 979
FR TO JR YR 92% 91% 93% 93%
1First-time, Full-time students
Freshman to Sophomore Retention Rates, 2012 to 2016
1,005
948
1,103
1,054
1093
969
909
1,070
1,0111039
90%
91%
92%
93%
94%
95%
96%
97%
98%
99%
100%
0
100
200
300
400
500
600
700
800
900
1,000
1,100
2011 to 2012 2012 to 2013 2013 to 2014 2014 to 2015 2015 to 2016
Nu
mb
er o
f St
ud
ents
Initial Cohort Returning Students Retention Rate
W o r c e s t e r P o l y t e c h n i c I n s t i t u t e P a g e | 2 2 1 0 / 0 1 / 2 0 1 6
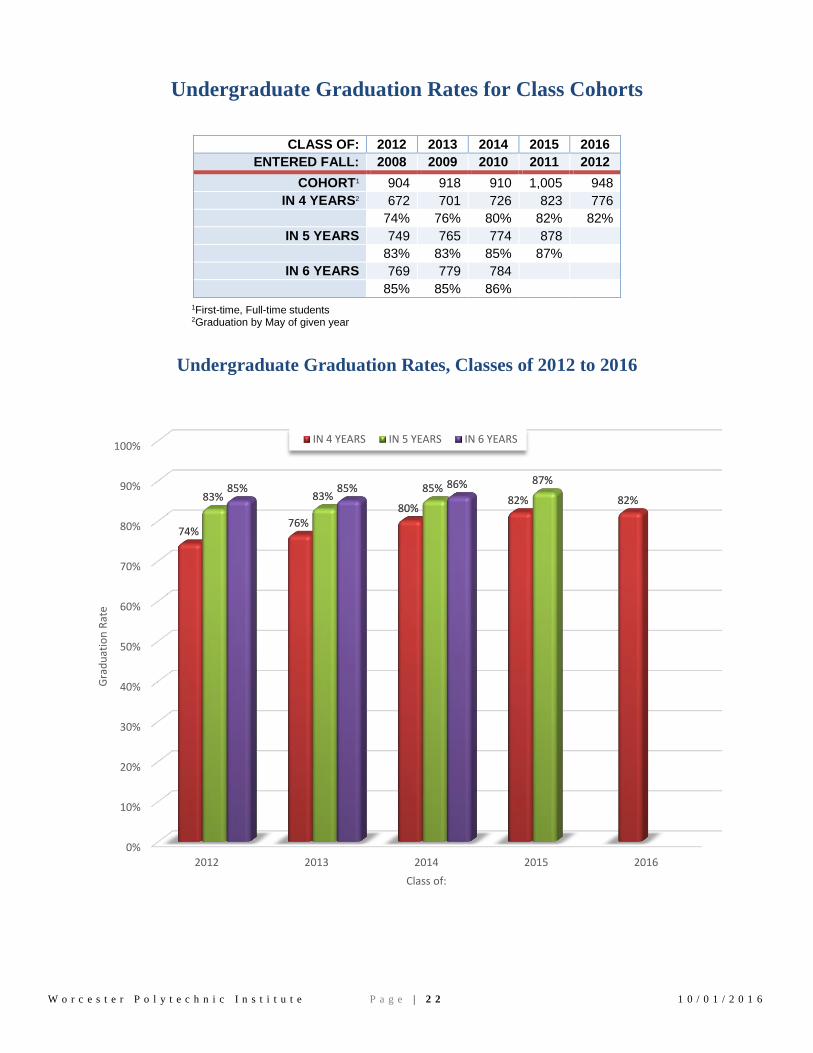
Undergraduate Graduation Rates for Class Cohorts
CLASS OF: 2012 2013 2014 2015 2016
ENTERED FALL: 2008 2009 2010 2011 2012
COHORT1 904 918 910 1,005 948
IN 4 YEARS2 672 701 726 823 776
74% 76% 80% 82% 82%
IN 5 YEARS 749 765 774 878
83% 83% 85% 87%
IN 6 YEARS 769 779 784
85% 85% 86%
1First-time, Full-time students 2Graduation by May of given year
Undergraduate Graduation Rates, Classes of 2012 to 2016
0%
10%
20%
30%
40%
50%
60%
70%
80%
90%
100%
2012 2013 2014 2015 2016
74%76%
80%82% 82%83% 83%
85%87%
85% 85% 86%
Gra
du
atio
n R
ate
Class of:
IN 4 YEARS IN 5 YEARS IN 6 YEARS

W o r c e s t e r P o l y t e c h n i c I n s t i t u t e P a g e | 2 3 1 0 / 0 1 / 2 0 1 6
Undergraduate Completions1: Department & Major by Academic
Year, 2012 to 2016
Department & Major 2011-12 2012-13 2013-14 2014-15 2015-16
Biology/Biotechnology 45 52 46 32 37
Biomedical Engineering 67 88 113 103 77
Chemical Engineering 72 69 64 104 84
Chemistry and Biochemistry 34 38 37 28 32
Biochemistry 22 25 23 13 24
Chemistry 12 13 14 15 8
Civil & Environmental Eng 73 66 58 50 67
Architectural Engineering 6 3 16
Civil Engineering 73 66 52 47 51
Computer Science 61 60 48 103 75
Electrical & Computer Eng 88 77 94 88 96
Humanities and Arts 2 0 2 4 1
Humanities & Arts 2 2 3 1
Professional Writing 1
Interdisciplinary Programs 86 91 102 97 107
Bioinformatics Computat Bio 2 3 3
Environmental Engineering 9 20 21 6 15
Interactive Media & Game Dev 29 29 24 36 40
Interdisciplinary 1 3 1 1
International Studies 1 1
Liberal Arts & Engineering (BA) 3 1
Robotics Engineering 44 37 54 51 48
Management 52 67 60 61 60
Industrial Engineering 8 14 19 15 20
Management 5 7 8 8 2
Management Engineering 34 29 28 25 24
Management Information Systems 5 17 5 13 14
Mathematical Sciences 39 35 30 39 30
Actuarial Mathematics 17 16 19 18 15
Mathematical Sciences 22 19 11 21 15
Mechanical Engineering 186 213 211 229 225
Aerospace Engineering 37 40 34 47 29
Manufacturing Engineering 1 1
Mechanical Engineering 148 173 176 182 196
Physics 12 16 11 11 11
Applied Physics/Engineering Physics 3 4 1
Physics 9 16 7 10 11
Social Science/Policy Studies 6 12 7 9 6
Economic Science 1
Environ & Sustain Studies (BA) 3 6 4 2 4
Psychological Science 1 6 2 5 2
Society, Technology & Policy 1 1 1
System Dynamics 1
Total 823 884 883 958 908
1BS, unless otherwise noted

W o r c e s t e r P o l y t e c h n i c I n s t i t u t e P a g e | 2 4 1 0 / 0 1 / 2 0 1 6
FALL 2016:
GRADUATE
W o r c e s t e r P o l y t e c h n i c I n s t i t u t e P a g e | 2 5 1 0 / 0 1 / 2 0 1 6
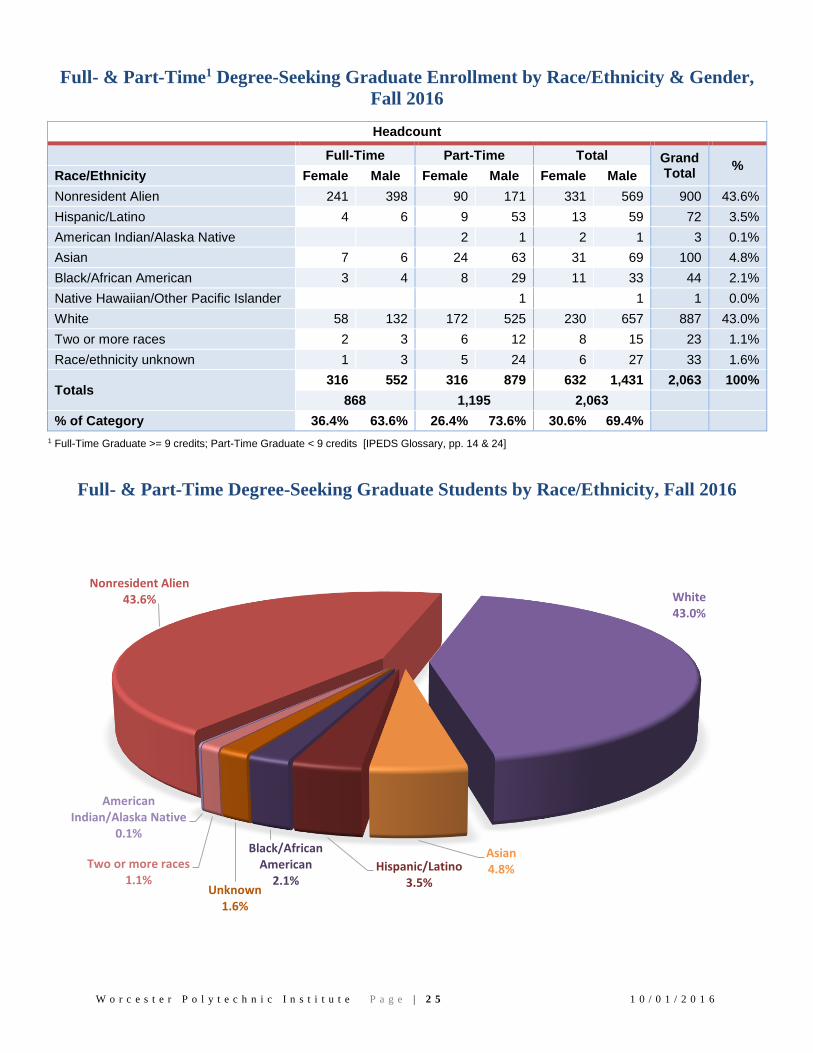
Full- & Part-Time1 Degree-Seeking Graduate Enrollment by Race/Ethnicity & Gender,
Fall 2016
Headcount
Full-Time Part-Time Total Grand Total
% Race/Ethnicity Female Male Female Male Female Male
Nonresident Alien 241 398 90 171 331 569 900 43.6%
Hispanic/Latino 4 6 9 53 13 59 72 3.5%
American Indian/Alaska Native 2 1 2 1 3 0.1%
Asian 7 6 24 63 31 69 100 4.8%
Black/African American 3 4 8 29 11 33 44 2.1%
Native Hawaiian/Other Pacific Islander 1 1 1 0.0%
White 58 132 172 525 230 657 887 43.0%
Two or more races 2 3 6 12 8 15 23 1.1%
Race/ethnicity unknown 1 3 5 24 6 27 33 1.6%
Totals 316 552 316 879 632 1,431 2,063 100%
868 1,195 2,063
% of Category 36.4% 63.6% 26.4% 73.6% 30.6% 69.4%
1 Full-Time Graduate >= 9 credits; Part-Time Graduate < 9 credits [IPEDS Glossary, pp. 14 & 24]
Full- & Part-Time Degree-Seeking Graduate Students by Race/Ethnicity, Fall 2016
Nonresident Alien43.6% White
43.0%
Asian4.8%Hispanic/Latino
3.5%
Black/African American
2.1%Unknown
1.6%
Two or more races1.1%
American Indian/Alaska Native
0.1%

W o r c e s t e r P o l y t e c h n i c I n s t i t u t e P a g e | 2 6 1 0 / 0 1 / 2 0 1 6
Full- & Part-Time Degree-Seeking Graduate Students, 2012 to 2016: Women & Underrepresented Minorities
*Black/African American, Hispanic, American Indian/Alaska Native; including students in “Two or more races” who reported at least one of those
0.0%
5.0%
10.0%
15.0%
20.0%
25.0%
30.0%
35.0%
Fall '12 Fall '13 Fall '14 Fall '15 Fall '16
27.8% 28.1%28.8% 29.1%
30.6%
4.3%5.3% 5.5%
7.0%6.5%
% o
f D
egre
e-Se
ekin
g G
rad
uat
e St
ud
ents
Women Underrepresented Minorities*

W o r c e s t e r P o l y t e c h n i c I n s t i t u t e P a g e | 2 7 1 0 / 0 1 / 2 0 1 6
Full- & Part-Time Degree-Seeking Graduate Enrollment by Department & Major, Fall 2016
Department & Major Full-Time Part-Time Total
GC MBA MENGR MME MS PHD Total GC MBA MENGR MME MS PHD Total
Biology/Biotechnology 3 10 13 2 3 5 18
Biomedical Engineering 11 7 18 36 7 3 5 15 51
Chemical Engineering 4 15 19 5 6 11 30
Chemistry and Biochemistry 16 16 1 1 17
Biochemistry 5 5 5
Chemistry 11 11 1 1 12
Civil & Environmental Eng 2 5 12 19 2 13 4 19 38
Civil Engineering 2 3 12 17 2 8 4 14 31
Construction Project Mgmt 2 2 5 5 7
Computer Science 67 19 86 5 30 18 53 139
Electrical & Computer Eng 8 40 28 76 20 52 80 15 167 243
Electrical & Computer Eng 8 40 28 76 2 15 80 15 112 188
Power Systems Engineering 18 37 55 55
Fire Protection Engineering 25 6 31 2 60 4 66 97
Interdisciplinary Programs 1 135 43 179 20 337 20 377 556
Bioinformatics & Computat Bio 3 3 6 1 1 2 8
Bioscience Administration 30 30 30
Data Science 1 54 15 70 2 43 3 48 118
Environmental Engineering 2 2 11 11 13
Interactive Media & Game Dev 13 13 2 2 15
Interdisciplinary 2 2 2
Learning Sciences & Technology 1 4 5 3 3 8
Nuclear Science & Engineering 1 1 1
Power Systems Management 5 16 21 21
Robotics Engineering 59 21 80 78 9 87 167
System Dynamics/Innovation Mgmt 2 2 2 2 4
Systems Engineering 1 1 11 154 2 167 168
Systems Thinking 1 1 1
Management 8 171 7 186 14 161 60 2 237 423
Business Administration 7 7 2 2 9
Information Technology 78 78 24 24 102
Management 12 12 14 13 27 39
Marketing & Innovation 38 38 6 6 44
Master of Business Admin 8 8 161 161 169
Operations Analytics & Mgmt 43 43 10 10 53
Operations Design & Leadership 7 7 7
Mathematical Sciences 1 62 23 86 17 16 1 34 120
Applied Mathematics 6 6 1 1 7
Applied Statistics 20 20 8 8 28
Financial Mathematics 34 34 4 4 38
Industrial Mathematics 2 2 1 1 3
Master of Mathematics for Educ 1 1 17 17 18
Mathematical Sciences 23 23 1 1 24
Mathematics for Educators 2 2 2
Mechanical Engineering 60 45 105 2 169 23 194 299
Aerospace Engineering 9 6 15 8 2 10 25
Manufacturing Engineering 9 5 14 2 26 1 29 43
Materials Process Eng 1 1 8 8 9
Materials Science and Eng 22 20 42 18 10 28 70
Mechanical Engineering 19 14 33 109 10 119 152
Physics 3 13 16 2 5 7 23
Physics 3 13 16 1 5 6 22
Physics for Educators 1 1 1
Social Science/Policy Studies 1 5 3 9 9
Social Science 1 1 1
System Dynamics 1 5 2 8 8
Total 1 8 21 1 582 255 868 66 161 59 17 782 110 1,195 2,063

W o r c e s t e r P o l y t e c h n i c I n s t i t u t e P a g e | 2 8 1 0 / 0 1 / 2 0 1 6
Full-Time Degree-Seeking Graduate Students: Race/Ethnicity & Gender by Major, Fall 2016
Headcounts
Female Male
Department & Major N
on
resid
en
t
Ali
en
His
pa
nic
/
La
tin
o
Am
er.
In
dia
n/
Ala
ska N
ati
ve
Asia
n
Bla
ck/A
fric
an
Am
eri
can
Nat.
Haw
aii
an
/
Pac. Is
lan
de
r
Wh
ite
Tw
o o
r m
ore
races
Race/e
thn
icit
y
un
kn
ow
n
To
tal
Wo
men
No
nre
sid
en
t
Ali
en
His
pa
nic
/
La
tin
o
Am
er.
In
dia
n/
Ala
ska N
ati
ve
Asia
n
Bla
ck/A
fric
an
Am
eri
can
Nat.
Haw
aii
an
/
Pac. Is
lan
de
r
Wh
ite
Tw
o o
r m
ore
races
Race/e
thn
icit
y
un
kn
ow
n
To
tal M
en
Gra
nd
T
ota
l
Biology/Biotechnology 4 2 6 1 6 7 13
Biomedical Engineering 3 2 1 13 1 20 3 1 12 16 36
Chemical Engineering 3 3 6 6 1 6 13 19
Chemistry and Biochemistry 2 6 8 2 1 1 4 8 16
Biochemistry 1 3 4 1 1 5
Chemistry 1 3 4 2 1 4 7 11
Civil & Environmental Eng 4 3 7 8 4 12 19
Civil Engineering 4 3 7 6 4 10 17
Construction Project Mgmt 2 2 2
Computer Science 23 1 2 1 27 50 1 8 59 86
Electrical & Computer Eng 7 7 61 1 1 6 69 76
Electrical & Computer Eng 7 7 61 1 1 6 69 76
Fire Protection Engineering 2 1 7 10 8 1 1 11 21 31
Interdisciplinary Programs 41 1 3 6 51 95 1 1 29 1 1 128 179
Bioinformatics & Computat Bio 2 2 2 1 1 4 6
Data Science 27 1 3 1 32 33 5 38 70
Environmental Engineering 2 2 2
Interactive Media & Game Dev 1 1 2 8 3 11 13
Learning Sciences & Technology 2 2 2 1 3 5
Robotics Engineering 8 2 10 52 1 1 16 70 80
System Dynamics/Innovation Mgmt 1 1 1 1 2
Systems Engineering 1 1 1

W o r c e s t e r P o l y t e c h n i c I n s t i t u t e P a g e | 2 9 1 0 / 0 1 / 2 0 1 6
Full-Time Degree-Seeking Graduate Students: Race/Ethnicity & Gender by Major, Fall 2016 (cont.)
Headcounts
Female Male
Department & Major N
on
resid
en
t
Ali
en
His
pa
nic
/
La
tin
o
Am
er.
In
dia
n/
Ala
ska N
ati
ve
Asia
n
Bla
ck/A
fric
an
A
meri
can
Nat.
Haw
aii
an
/ P
ac. Is
lan
de
r
Wh
ite
Tw
o o
r m
ore
ra
ces
Race/e
thn
icit
y
un
kn
ow
n
To
tal
Wo
men
No
nre
sid
en
t
Ali
en
His
pa
nic
/
La
tin
o
Am
er.
In
dia
n/
Ala
ska N
ati
ve
Asia
n
Bla
ck/A
fric
an
Am
eri
can
Nat.
Haw
aii
an
/
Pac. Is
lan
de
r
Wh
ite
Tw
o o
r m
ore
races
Race/e
thn
icit
y
un
kn
ow
n
To
tal M
en
Gra
nd
T
ota
l
Management 101 5 1 107 69 2 1 6 1 79 186
Business Administration 3 1 4 2 1 3 7
Information Technology 44 44 32 2 34 78
Management 1 2 3 5 3 1 9 12
Marketing & Innovation 27 27 10 1 11 38
Master of Business Admin 2 2 5 1 6 8
Operations Analytics & Mgmt 24 2 1 27 15 1 16 43
Mathematical Sciences 32 1 4 37 41 7 1 49 86
Applied Mathematics 1 1 2 4 4 6
Applied Statistics 11 11 9 9 20
Financial Mathematics 13 1 14 20 20 34
Industrial Mathematics 2 2 2
Master of Mathematics for Educ 1 1 1
Mathematical Sciences 7 1 1 9 8 5 1 14 23
Mechanical Engineering 16 1 2 1 6 26 46 2 29 2 79 105
Aerospace Engineering 1 1 1 3 4 1 7 12 15
Manufacturing Engineering 1 1 1 3 6 4 1 11 14
Materials Process Eng 1 1 1
Materials Science and Eng 10 4 14 18 1 8 1 28 42
Mechanical Engineering 4 1 1 6 17 10 27 33
Physics 3 1 4 8 4 12 16
Physics 3 1 4 8 4 12 16
Total 241 4 0 7 3 0 58 2 1 316 398 6 0 6 4 0 132 3 3 552 868

W o r c e s t e r P o l y t e c h n i c I n s t i t u t e P a g e | 3 0 1 0 / 0 1 / 2 0 1 6
Part-Time Degree-Seeking Graduate Students: Race/Ethnicity & Gender by Major, Fall 2016
Headcounts
Female Male
Department & Major
No
nre
sid
en
t
Ali
en
His
pa
nic
/
La
tin
o
Am
er.
In
dia
n/
Ala
ska N
ati
ve
Asia
n
Bla
ck/A
fric
an
Am
eri
can
Nat.
Haw
aii
an
/
Pac. Is
lan
de
r
Wh
ite
Tw
o o
r m
ore
races
Race/e
thn
icit
y
un
kn
ow
n
To
tal
Wo
men
No
nre
sid
en
t A
lien
His
pa
nic
/
La
tin
o
Am
er.
In
dia
n/
Ala
ska N
ati
ve
Asia
n
Bla
ck/A
fric
an
A
meri
can
Nat.
Haw
aii
an
/
Pac. Is
lan
de
r
Wh
ite
Tw
o o
r m
ore
races
Race/e
thn
icit
y
un
kn
ow
n
To
tal M
en
Gra
nd
To
tal
Biology/Biotechnology 2 2 3 3 5
Biomedical Engineering 5 5 1 2 7 10 15
Chemical Engineering 2 1 3 2 1 5 8 11
Chemistry and Biochemistry 1 1 1
Chemistry 1 1 1
Civil & Environmental Eng 3 1 4 1 9 1 1 7 1 10 19
Civil Engineering 2 1 3 1 7 1 1 4 1 7 14
Construction Project Mgmt 1 1 2 3 3 5
Computer Science 8 1 3 12 24 2 3 1 8 1 2 41 53
Electrical & Computer Eng 6 4 1 12 23 17 11 15 7 90 4 144 167
Electrical & Computer Eng 5 1 8 14 17 6 11 2 60 2 98 112
Power Systems Engineering 1 3 1 4 9 5 4 5 30 2 46 55
Fire Protection Engineering 3 1 1 9 14 11 3 1 1 35 1 52 66
Interdisciplinary Programs 20 4 1 11 3 55 3 1 98 55 15 24 14 162 3 6 279 377
Bioinformatics & Computat Bio 1 1 1 1 2
Bioscience Administration 1 1 13 1 16 1 1 2 10 14 30
Data Science 12 2 1 2 17 21 2 3 1 4 31 48
Environmental Engineering 1 4 5 1 4 1 6 11
Interactive Media & Game Dev 2 2 2
Interdisciplinary 1 1 2 2
Learning Sciences & Technology 2 2 1 1 3
Nuclear Science & Engineering 1 1 1
Power Systems Management 1 4 5 2 1 3 10 16 21
Robotics Engineering 5 1 3 1 4 14 31 5 3 2 32 73 87
System Dynamics/Innovation Mgmt 1 1 1 1 2
Systems Engineering 1 1 5 1 26 2 1 37 1 5 14 7 95 3 5 130 167
Systems Thinking 1 1 1

W o r c e s t e r P o l y t e c h n i c I n s t i t u t e P a g e | 3 1 1 0 / 0 1 / 2 0 1 6
Part-Time Degree-Seeking Graduate Students: Race/Ethnicity & Gender by Major, Fall 2016 (cont.)
Headcounts
Female Male
Department & Major
No
nre
sid
en
t
Ali
en
His
pa
nic
/
La
tin
o
Am
er.
In
dia
n/
Ala
ska N
ati
ve
Asia
n
Bla
ck/A
fric
an
A
meri
can
Nat.
Haw
aii
an
/
Pac. Is
lan
de
r
Wh
ite
Tw
o o
r m
ore
races
Ra
ce
/eth
nic
ity
un
kn
ow
n
To
tal
Wo
men
No
nre
sid
en
t
Ali
en
His
pa
nic
/
La
tin
o
Am
er.
In
dia
n/
Ala
ska N
ati
ve
Asia
n
Bla
ck/A
fric
an
A
meri
can
Nat.
Haw
aii
an
/
Pac. Is
lan
de
r
Wh
ite
Tw
o o
r m
ore
races
Ra
ce
/eth
nic
ity
un
kn
ow
n
To
tal M
en
Gra
nd
To
tal
Management 31 2 6 2 56 2 99 20 8 10 2 89 1 8 138 237
Business Administration 1 1 1 1 2
Information Technology 13 13 8 3 11 24
Management 1 1 12 14 3 8 2 13 27
Marketing & Innovation 3 3 2 1 3 6
Master of Business Admin 7 2 5 1 39 2 56 6 7 9 2 75 1 5 105 161
Operations Analytics & Mgmt 6 1 7 1 1 1 3 10
Operations Design & Leadership 2 3 5 2 2 7
Mathematical Sciences 5 12 1 18 5 1 8 1 1 16 34
Applied Mathematics 1 1 1
Applied Statistics 3 3 3 2 5 8
Financial Mathematics 1 1 2 1 3 4
Industrial Mathematics 1 1 1
Master of Mathematics for Educ 11 1 12 1 3 1 5 17
Mathematical Sciences 1 1 1
Mathematics for Educators 1 1 1 1 2
Mechanical Engineering 11 2 2 1 12 2 30 32 12 8 4 1 101 5 1 164 194
Aerospace Engineering 2 1 6 1 10 10
Manufacturing Engineering 1 1 1 3 5 4 1 15 1 26 29
Materials Process Eng 1 1 2 1 1 3 1 6 8
Materials Science and Eng 8 1 2 11 11 1 5 17 28
Mechanical Engineering 2 2 1 9 14 14 7 7 2 72 2 1 105 119
Physics 1 1 2 1 3 1 5 7
Physics 1 1 2 1 2 1 4 6
Physics for Educators 1 1 1
Social Science/Policy Studies 1 1 2 6 8 9
Social Science 1 1 1
System Dynamics 1 1 2 5 7 8
Total 90 9 2 24 8 0 172 6 5 316 171 53 1 63 29 1 525 12 24 879 1,195
W o r c e s t e r P o l y t e c h n i c I n s t i t u t e P a g e | 3 2 1 0 / 0 1 / 2 0 1 6
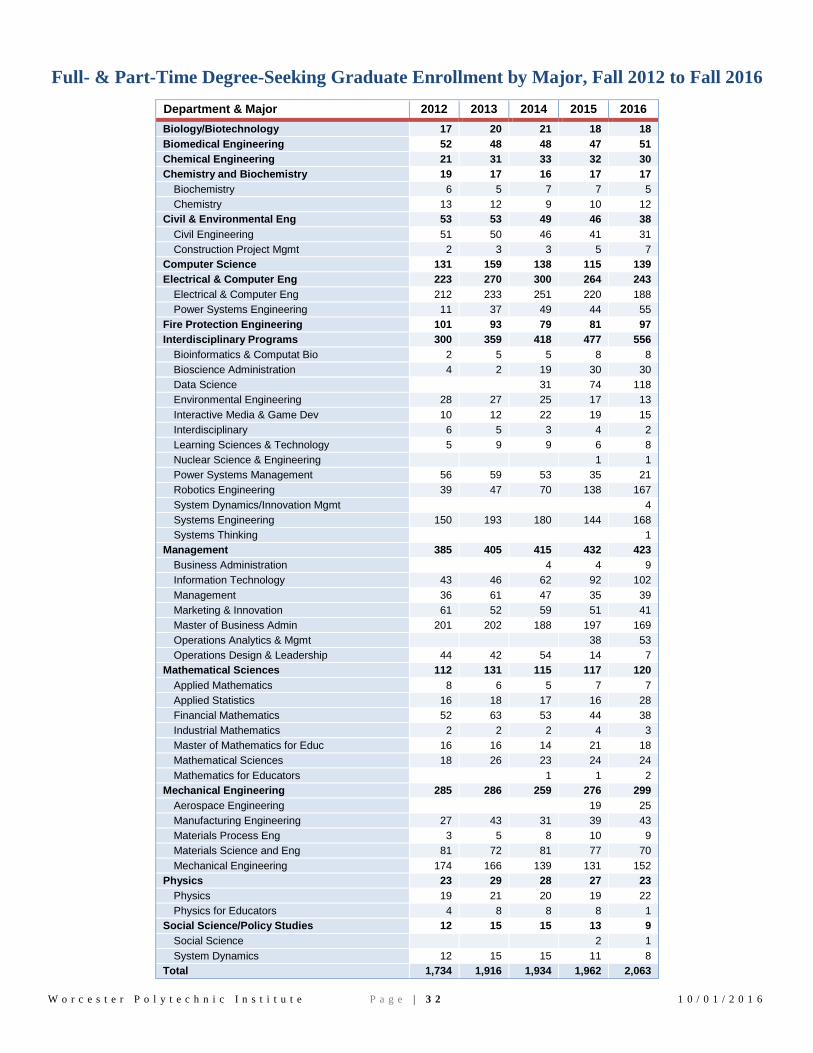
Full- & Part-Time Degree-Seeking Graduate Enrollment by Major, Fall 2012 to Fall 2016
Department & Major 2012 2013 2014 2015 2016
Biology/Biotechnology 17 20 21 18 18
Biomedical Engineering 52 48 48 47 51
Chemical Engineering 21 31 33 32 30
Chemistry and Biochemistry 19 17 16 17 17
Biochemistry 6 5 7 7 5
Chemistry 13 12 9 10 12
Civil & Environmental Eng 53 53 49 46 38
Civil Engineering 51 50 46 41 31
Construction Project Mgmt 2 3 3 5 7
Computer Science 131 159 138 115 139
Electrical & Computer Eng 223 270 300 264 243
Electrical & Computer Eng 212 233 251 220 188
Power Systems Engineering 11 37 49 44 55
Fire Protection Engineering 101 93 79 81 97
Interdisciplinary Programs 300 359 418 477 556
Bioinformatics & Computat Bio 2 5 5 8 8
Bioscience Administration 4 2 19 30 30
Data Science 31 74 118
Environmental Engineering 28 27 25 17 13
Interactive Media & Game Dev 10 12 22 19 15
Interdisciplinary 6 5 3 4 2
Learning Sciences & Technology 5 9 9 6 8
Nuclear Science & Engineering 1 1
Power Systems Management 56 59 53 35 21
Robotics Engineering 39 47 70 138 167
System Dynamics/Innovation Mgmt 4
Systems Engineering 150 193 180 144 168
Systems Thinking 1
Management 385 405 415 432 423
Business Administration 4 4 9
Information Technology 43 46 62 92 102
Management 36 61 47 35 39
Marketing & Innovation 61 52 59 51 41
Master of Business Admin 201 202 188 197 169
Operations Analytics & Mgmt 38 53
Operations Design & Leadership 44 42 54 14 7
Mathematical Sciences 112 131 115 117 120
Applied Mathematics 8 6 5 7 7
Applied Statistics 16 18 17 16 28
Financial Mathematics 52 63 53 44 38
Industrial Mathematics 2 2 2 4 3
Master of Mathematics for Educ 16 16 14 21 18
Mathematical Sciences 18 26 23 24 24
Mathematics for Educators 1 1 2
Mechanical Engineering 285 286 259 276 299
Aerospace Engineering 19 25
Manufacturing Engineering 27 43 31 39 43
Materials Process Eng 3 5 8 10 9
Materials Science and Eng 81 72 81 77 70
Mechanical Engineering 174 166 139 131 152
Physics 23 29 28 27 23
Physics 19 21 20 19 22
Physics for Educators 4 8 8 8 1
Social Science/Policy Studies 12 15 15 13 9
Social Science 2 1
System Dynamics 12 15 15 11 8
Total 1,734 1,916 1,934 1,962 2,063
W o r c e s t e r P o l y t e c h n i c I n s t i t u t e P a g e | 3 3 1 0 / 0 1 / 2 0 1 6
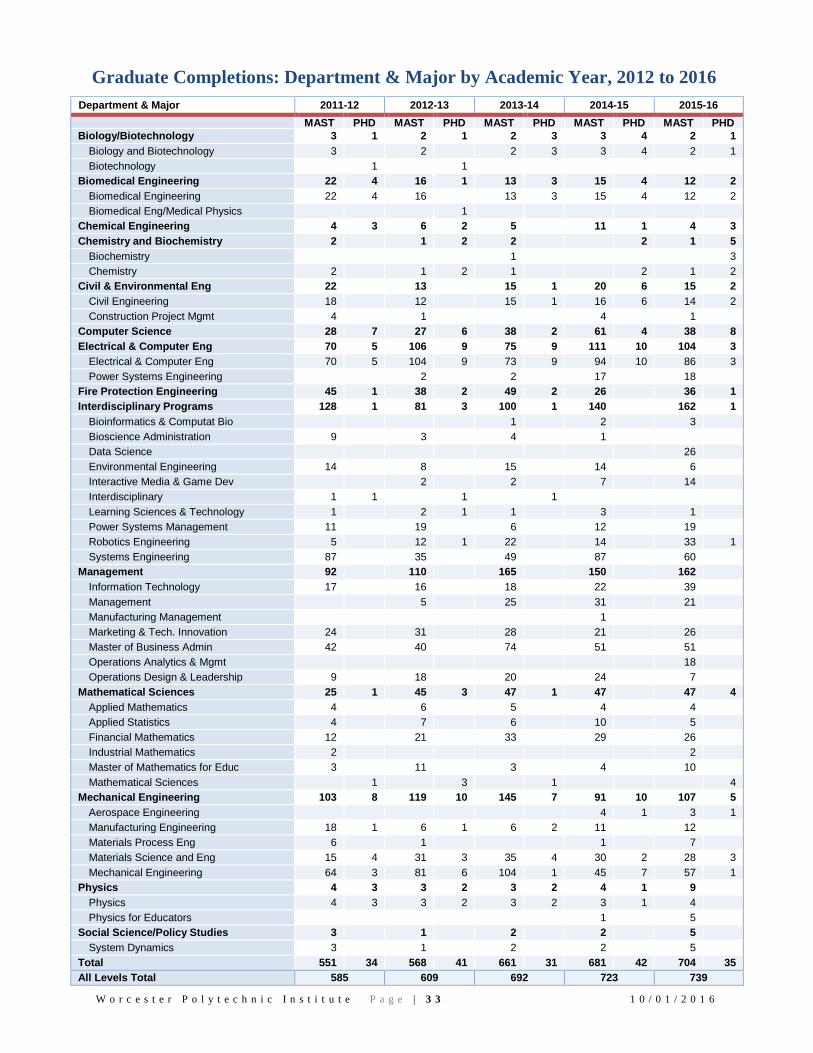
Graduate Completions: Department & Major by Academic Year, 2012 to 2016
Department & Major 2011-12 2012-13 2013-14 2014-15 2015-16
MAST PHD MAST PHD MAST PHD MAST PHD MAST PHD
Biology/Biotechnology 3 1 2 1 2 3 3 4 2 1
Biology and Biotechnology 3 2 2 3 3 4 2 1
Biotechnology 1 1
Biomedical Engineering 22 4 16 1 13 3 15 4 12 2
Biomedical Engineering 22 4 16 13 3 15 4 12 2
Biomedical Eng/Medical Physics 1
Chemical Engineering 4 3 6 2 5 11 1 4 3
Chemistry and Biochemistry 2 1 2 2 2 1 5
Biochemistry 1 3
Chemistry 2 1 2 1 2 1 2
Civil & Environmental Eng 22 13 15 1 20 6 15 2
Civil Engineering 18 12 15 1 16 6 14 2
Construction Project Mgmt 4 1 4 1
Computer Science 28 7 27 6 38 2 61 4 38 8
Electrical & Computer Eng 70 5 106 9 75 9 111 10 104 3
Electrical & Computer Eng 70 5 104 9 73 9 94 10 86 3
Power Systems Engineering 2 2 17 18
Fire Protection Engineering 45 1 38 2 49 2 26 36 1
Interdisciplinary Programs 128 1 81 3 100 1 140 162 1
Bioinformatics & Computat Bio 1 2 3
Bioscience Administration 9 3 4 1
Data Science 26
Environmental Engineering 14 8 15 14 6
Interactive Media & Game Dev 2 2 7 14
Interdisciplinary 1 1 1 1
Learning Sciences & Technology 1 2 1 1 3 1
Power Systems Management 11 19 6 12 19
Robotics Engineering 5 12 1 22 14 33 1
Systems Engineering 87 35 49 87 60
Management 92 110 165 150 162
Information Technology 17 16 18 22 39
Management 5 25 31 21
Manufacturing Management 1
Marketing & Tech. Innovation 24 31 28 21 26
Master of Business Admin 42 40 74 51 51
Operations Analytics & Mgmt 18
Operations Design & Leadership 9 18 20 24 7
Mathematical Sciences 25 1 45 3 47 1 47 47 4
Applied Mathematics 4 6 5 4 4
Applied Statistics 4 7 6 10 5
Financial Mathematics 12 21 33 29 26
Industrial Mathematics 2 2
Master of Mathematics for Educ 3 11 3 4 10
Mathematical Sciences 1 3 1 4
Mechanical Engineering 103 8 119 10 145 7 91 10 107 5
Aerospace Engineering 4 1 3 1
Manufacturing Engineering 18 1 6 1 6 2 11 12
Materials Process Eng 6 1 1 7
Materials Science and Eng 15 4 31 3 35 4 30 2 28 3
Mechanical Engineering 64 3 81 6 104 1 45 7 57 1
Physics 4 3 3 2 3 2 4 1 9
Physics 4 3 3 2 3 2 3 1 4
Physics for Educators 1 5
Social Science/Policy Studies 3 1 2 2 5
System Dynamics 3 1 2 2 5
Total 551 34 568 41 661 31 681 42 704 35
All Levels Total 585 609 692 723 739