Embed Size (px)
Citation preview

Bank Name ING Groep N.V.
LEI Code 549300NYKK9MWM7GGW15
Country Code NLIN
2016 EU-wide Stress Test

Actual
(starting year)Baseline Scenario Adverse Scenario
(mln EUR, %) 31/12/2015 31/12/2018 31/12/2018
Cumulative 3y: Net interest income 34,049.52 28,069.08
Cumulative 3y: Gains or (-) losses on financial assets and liabilities held for trading or designated at fair value through profit
and loss, net2,308.50 86.04
Cumulative 3y: (Impairment or (-) reversal of impairment on financial assets not measured at fair value through profit or loss) -3,686.48 -9,024.05
Cumulative 3y: Profit or (-) loss for the year 8,936.46 -2,691.98
Coverage ratio - Default stock 31.70% 24.89% 28.99%
Common Equity Tier 1 capital 41,553.81 43,622.64 33,989.66
Total Risk exposure amount 321,187.77 348,493.07 377,629.60
Common Equity Tier 1 ratio, % 12.9% 12.5% 9.0%
Fully loaded Common Equity Tier 1 ratio, % 12.7% 12.5% 9.0%
Tier 1 capital 46,411.80 48,662.46 39,029.47
Total leverage ratio exposures 1,072,000.00 1,072,000.00 1,072,000.00
Leverage ratio, % 4.3% 4.5% 3.6%
Fully loaded leverage ratio, % 3.9% 4.2% 3.3%
Total amount of instruments with mandatory conversion into ordinary shares upon a fixed date in the 2016 -2018 period
(cumulative conversions)1 0
Total Additional Tier 1 and Tier 2 instruments eligible as regulatory capital under the CRR provisions that convert into Common
Equity Tier 1 or are written down upon a trigger event2 8,392
Of which: eligible instruments whose trigger is above CET1 capital ratio in the adverse scenario2 0
1 Conversions not considered for CET1 computation
2 Excluding instruments with mandatory conversion into ordinary shares upon a fixed date in the 2016 -2018 period
2016 EU-wide Stress Test: SummaryING Groep N.V.
Memorandum items

2016 EU-wide Stress Test:
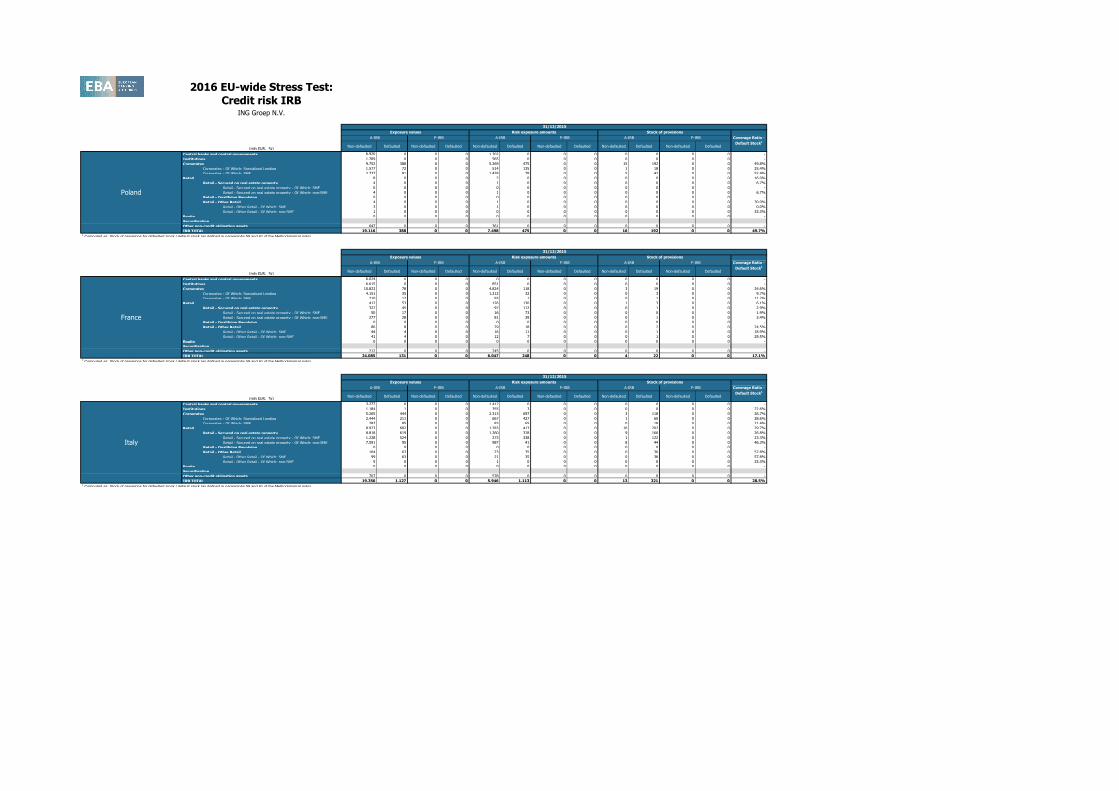
Credit risk IRBING Groep N.V.
(mln EUR, %)
Non-defaulted Defaulted Non-defaulted Defaulted Non-defaulted Defaulted Non-defaulted Defaulted Non-defaulted Defaulted Non-defaulted Defaulted
Central banks and central governments 114,866 18 0 0 5,889 68 0 0 8 1 0 0 2.8%
Institutions 102,342 354 0 0 18,475 206 0 0 10 11 0 0 3.1%
Corporates 252,594 7,834 0 0 106,413 10,557 0 0 239 3,102 0 0 40.4%
Corporates - Of Which: Specialised Lending 90,257 2,501 0 0 30,329 2,770 0 0 57 940 0 0 37.9%
Corporates - Of Which: SME 29,149 1,782 0 0 11,535 2,135 0 0 55 466 0 0 27.3%
Retail 309,559 6,415 0 0 51,716 8,009 0 0 350 1,320 0 0 20.7%
Retail - Secured on real estate property 285,267 5,504 0 0 40,670 6,470 0 0 205 800 0 0 14.6%
Retail - Secured on real estate property - Of Which: SME 11,195 1,038 0 0 3,153 1,211 0 0 21 225 0 0 21.9%
Retail - Secured on real estate property - Of Which: non-SME 274,072 4,466 0 0 37,517 5,259 0 0 184 575 0 0 12.9%
Retail - Qualifying Revolving 0 0 0 0 0 0 0 0 0 0 0 0 -
Retail - Other Retail 24,292 912 0 0 11,046 1,539 0 0 145 519 0 0 58.2%
Retail - Other Retail - Of Which: SME 6,980 437 0 0 2,764 852 0 0 44 231 0 0 54.6%
Retail - Other Retail - Of Which: non-SME 17,312 474 0 0 8,282 687 0 0 100 289 0 0 61.4%
Equity 6,911 0 0 0 15,338 0 0 0 0 0 0 0 -
Securitisation
Other non-credit obligation assets 13,463 0 0 0 21,396 0 0 0 0 0 0 0 -
IRB TOTAL 799,736 14,621 0 0 219,229 18,840 0 0 607 4,432 0 0 30.7%1 Computed as: Stock of provisions for defaulted stock / default stock (as defined in paragraphs 59 and 61 of the Methodological note)
(mln EUR, %)Non-defaulted Defaulted Non-defaulted Defaulted Non-defaulted Defaulted Non-defaulted Defaulted Non-defaulted Defaulted Non-defaulted Defaulted
Central banks and central governments 25,205 0 0 0 224 0 0 0 0 0 0 0 -
Institutions 4,595 342 0 0 983 185 0 0 0 2 0 0 0.6%
Corporates 51,970 3,071 0 0 22,711 4,952 0 0 95 1,273 0 0 41.9%
Corporates - Of Which: Specialised Lending 16,423 1,018 0 0 6,619 936 0 0 25 444 0 0 43.7%
Corporates - Of Which: SME 7,044 607 0 0 3,610 1,133 0 0 28 170 0 0 28.5%
Retail 139,455 3,107 0 0 21,882 4,328 0 0 139 500 0 0 16.1%
Retail - Secured on real estate property 132,011 2,740 0 0 18,147 3,333 0 0 78 307 0 0 11.2%
Retail - Secured on real estate property - Of Which: SME 3,650 184 0 0 1,876 464 0 0 13 51 0 0 27.8%
Retail - Secured on real estate property - Of Which: non-SME 128,361 2,556 0 0 16,271 2,869 0 0 64 256 0 0 10.0%
Retail - Qualifying Revolving 0 0 0 0 0 0 0 0 0 0 0 0 -
Retail - Other Retail 7,444 367 0 0 3,735 995 0 0 61 193 0 0 52.7%
Retail - Other Retail - Of Which: SME 3,013 241 0 0 1,576 551 0 0 28 144 0 0 60.1%
Retail - Other Retail - Of Which: non-SME 4,431 127 0 0 2,159 444 0 0 33 49 0 0 38.6%
Equity 0 0 0 0 0 0 0 0 0 0 0 0 -
Securitisation
Other non-credit obligation assets 4,374 0 0 0 9,035 0 0 0 0 0 0 0 -
IRB TOTAL 225,600 6,521 0 0 54,835 9,465 0 0 234 1,775 0 0 27.4%1 Computed as: Stock of provisions for defaulted stock / default stock (as defined in paragraphs 59 and 61 of the Methodological note)
(mln EUR, %)Non-defaulted Defaulted Non-defaulted Defaulted Non-defaulted Defaulted Non-defaulted Defaulted Non-defaulted Defaulted Non-defaulted Defaulted
Central banks and central governments 24,364 0 0 0 64 0 0 0 0 0 0 0 -
Institutions 3,654 0 0 0 568 0 0 0 0 0 0 0 -
Corporates 7,900 80 0 0 2,855 60 0 0 2 39 0 0 51.1%
Corporates - Of Which: Specialised Lending 1,062 42 0 0 268 33 0 0 1 9 0 0 22.6%
Corporates - Of Which: SME 6 8 0 0 3 19 0 0 0 3 0 0 36.8%
Retail 76,286 777 0 0 19,112 627 0 0 148 382 0 0 49.1%
Retail - Secured on real estate property 67,398 534 0 0 14,310 575 0 0 98 182 0 0 34.1%
Retail - Secured on real estate property - Of Which: SME 6 0 0 0 1 0 0 0 0 0 0 0 -
Retail - Secured on real estate property - Of Which: non-SME 67,392 534 0 0 14,308 575 0 0 97 182 0 0 34.1%
Retail - Qualifying Revolving 0 0 0 0 0 0 0 0 0 0 0 0 -
Retail - Other Retail 8,888 243 0 0 4,802 52 0 0 50 199 0 0 82.2%
Retail - Other Retail - Of Which: SME 18 2 0 0 11 8 0 0 0 0 0 0 1.2%
Retail - Other Retail - Of Which: non-SME 8,870 241 0 0 4,792 44 0 0 50 199 0 0 82.7%
Equity 0 0 0 0 0 0 0 0 0 0 0 0 -
Securitisation
Other non-credit obligation assets 1,005 0 0 0 878 0 0 0 0 0 0 0 -
IRB TOTAL 113,208 857 0 0 23,477 687 0 0 150 421 0 0 49.3%1 Computed as: Stock of provisions for defaulted stock / default stock (as defined in paragraphs 59 and 61 of the Methodological note)
(mln EUR, %)Non-defaulted Defaulted Non-defaulted Defaulted Non-defaulted Defaulted Non-defaulted Defaulted Non-defaulted Defaulted Non-defaulted Defaulted
Central banks and central governments 14,140 0 0 0 146 0 0 0 0 0 0 0 -
Institutions 8,585 1 0 0 1,662 0 0 0 1 0 0 0 12.3%
Corporates 37,167 1,124 0 0 13,876 948 0 0 30 325 0 0 31.6%
Corporates - Of Which: Specialised Lending 3,216 16 0 0 1,508 14 0 0 1 9 0 0 57.0%
Corporates - Of Which: SME 16,927 843 0 0 5,505 747 0 0 20 205 0 0 26.4%
Retail 41,022 1,499 0 0 6,050 2,101 0 0 45 204 0 0 13.8%
Retail - Secured on real estate property 34,414 1,292 0 0 3,884 1,695 0 0 15 120 0 0 9.4%
Retail - Secured on real estate property - Of Which: SME 6,087 302 0 0 947 330 0 0 6 48 0 0 16.3%
Retail - Secured on real estate property - Of Which: non-SME 28,327 990 0 0 2,938 1,365 0 0 9 72 0 0 7.3%
Retail - Qualifying Revolving 0 0 0 0 0 0 0 0 0 0 0 0 -
Retail - Other Retail 6,607 207 0 0 2,165 406 0 0 30 84 0 0 44.3%
Retail - Other Retail - Of Which: SME 3,240 126 0 0 960 244 0 0 13 49 0 0 43.4%
Retail - Other Retail - Of Which: non-SME 3,368 81 0 0 1,205 161 0 0 16 35 0 0 45.6%
Equity 0 0 0 0 0 0 0 0 0 0 0 0 -
Securitisation
Other non-credit obligation assets 3,198 0 0 0 7,708 0 0 0 0 0 0 0 -
IRB TOTAL 104,111 2,623 0 0 29,442 3,049 0 0 76 529 0 0 21.1%1 Computed as: Stock of provisions for defaulted stock / default stock (as defined in paragraphs 59 and 61 of the Methodological note)
Belgium
A-IRB F-IRB A-IRB F-IRB
Germany
31/12/2015
Exposure values Risk exposure amounts Stock of provisions
Coverage Ratio -
Default Stock1
A-IRB F-IRB
Coverage Ratio -
Default Stock1
A-IRB F-IRB A-IRB F-IRB A-IRB F-IRB
Netherlands
31/12/2015
Exposure values Risk exposure amounts Stock of provisions
F-IRB A-IRB F-IRB
31/12/2015
Exposure values Risk exposure amounts Stock of provisions
Coverage Ratio -
Default Stock1
A-IRB F-IRB A-IRB
ING Groep N.V.
F-IRB A-IRB F-IRB A-IRB F-IRB
31/12/2015
Exposure values Risk exposure amounts Stock of provisions
Coverage Ratio -
Default Stock1
A-IRB

2016 EU-wide Stress Test:
Credit risk IRBING Groep N.V.
(mln EUR, %)Non-defaulted Defaulted Non-defaulted Defaulted Non-defaulted Defaulted Non-defaulted Defaulted Non-defaulted Defaulted Non-defaulted Defaulted
Central banks and central governments 3,226 0 0 0 0 0 0 0 0 0 0 0 -
Institutions 13,221 0 0 0 2,209 0 0 0 0 0 0 0 -
Corporates 29,304 296 0 0 14,023 490 0 0 27 65 0 0 23.2%
Corporates - Of Which: Specialised Lending 9,415 76 0 0 2,569 79 0 0 3 22 0 0 30.5%
Corporates - Of Which: SME 127 11 0 0 67 0 0 0 0 9 0 0 83.2%
Retail 142 2 0 0 26 5 0 0 0 0 0 0 15.5%
Retail - Secured on real estate property 105 2 0 0 24 2 0 0 0 0 0 0 5.2%
Retail - Secured on real estate property - Of Which: SME 10 0 0 0 12 0 0 0 0 0 0 0 -
Retail - Secured on real estate property - Of Which: non-SME 95 2 0 0 12 2 0 0 0 0 0 0 5.2%
Retail - Qualifying Revolving 0 0 0 0 0 0 0 0 0 0 0 0 -
Retail - Other Retail 37 1 0 0 2 3 0 0 0 0 0 0 35.0%
Retail - Other Retail - Of Which: SME 31 0 0 0 0 0 0 0 0 0 0 0 40.0%
Retail - Other Retail - Of Which: non-SME 5 1 0 0 2 3 0 0 0 0 0 0 34.7%
Equity 0 0 0 0 0 0 0 0 0 0 0 0 -
Securitisation
Other non-credit obligation assets 780 0 0 0 769 0 0 0 0 0 0 0 -
IRB TOTAL 46,673 298 0 0 17,028 495 0 0 27 66 0 0 23.2%1 Computed as: Stock of provisions for defaulted stock / default stock (as defined in paragraphs 59 and 61 of the Methodological note)
(mln EUR, %)Non-defaulted Defaulted Non-defaulted Defaulted Non-defaulted Defaulted Non-defaulted Defaulted Non-defaulted Defaulted Non-defaulted Defaulted
Central banks and central governments 3,061 0 0 0 0 0 0 0 0 0 0 0 -
Institutions 1,513 0 0 0 214 0 0 0 0 0 0 0 -
Corporates 2,654 0 0 0 683 0 0 0 1 0 0 0 -
Corporates - Of Which: Specialised Lending 1,952 0 0 0 445 0 0 0 0 0 0 0 -
Corporates - Of Which: SME 0 0 0 0 0 0 0 0 0 0 0 0 -
Retail 29,679 133 0 0 1,875 132 0 0 2 4 0 0 3.1%
Retail - Secured on real estate property 29,653 124 0 0 1,871 132 0 0 2 3 0 0 2.4%
Retail - Secured on real estate property - Of Which: SME 0 0 0 0 0 0 0 0 0 0 0 0 -
Retail - Secured on real estate property - Of Which: non-SME 29,652 124 0 0 1,871 132 0 0 2 3 0 0 2.4%
Retail - Qualifying Revolving 0 0 0 0 0 0 0 0 0 0 0 0 -
Retail - Other Retail 27 9 0 0 4 0 0 0 0 1 0 0 13.6%
Retail - Other Retail - Of Which: SME 0 0 0 0 0 0 0 0 0 0 0 0 -
Retail - Other Retail - Of Which: non-SME 27 9 0 0 4 0 0 0 0 1 0 0 13.6%
Equity 0 0 0 0 0 0 0 0 0 0 0 0 -
Securitisation
Other non-credit obligation assets 247 0 0 0 261 0 0 0 0 0 0 0 -
IRB TOTAL 37,154 133 0 0 3,033 132 0 0 2 4 0 0 3.1%1 Computed as: Stock of provisions for defaulted stock / default stock (as defined in paragraphs 59 and 61 of the Methodological note)
(mln EUR, %)Non-defaulted Defaulted Non-defaulted Defaulted Non-defaulted Defaulted Non-defaulted Defaulted Non-defaulted Defaulted Non-defaulted Defaulted
Central banks and central governments 859 0 0 0 0 0 0 0 0 0 0 0 -
Institutions 24,852 0 0 0 2,337 1 0 0 0 0 0 0 0.0%
Corporates 10,699 164 0 0 4,481 21 0 0 5 151 0 0 93.5%
Corporates - Of Which: Specialised Lending 5,323 2 0 0 1,508 0 0 0 1 0 0 0 -
Corporates - Of Which: SME 677 1 0 0 199 0 0 0 0 0 0 0 0.0%
Retail 218 4 0 0 26 6 0 0 0 2 0 0 45.2%
Retail - Secured on real estate property 124 3 0 0 17 2 0 0 0 2 0 0 48.6%
Retail - Secured on real estate property - Of Which: SME 6 1 0 0 2 1 0 0 0 0 0 0 0.0%
Retail - Secured on real estate property - Of Which: non-SME 118 3 0 0 16 1 0 0 0 2 0 0 57.3%
Retail - Qualifying Revolving 0 0 0 0 0 0 0 0 0 0 0 0 -
Retail - Other Retail 94 1 0 0 9 4 0 0 0 0 0 0 34.6%
Retail - Other Retail - Of Which: SME 11 0 0 0 5 0 0 0 0 0 0 0 50.0%
Retail - Other Retail - Of Which: non-SME 83 1 0 0 4 4 0 0 0 0 0 0 34.3%
Equity 0 0 0 0 0 0 0 0 0 0 0 0 -
Securitisation
Other non-credit obligation assets 459 0 0 0 345 0 0 0 0 0 0 0 -
IRB TOTAL 37,086 168 0 0 7,188 28 0 0 6 153 0 0 92.2%1 Computed as: Stock of provisions for defaulted stock / default stock (as defined in paragraphs 59 and 61 of the Methodological note)
(mln EUR, %)Non-defaulted Defaulted Non-defaulted Defaulted Non-defaulted Defaulted Non-defaulted Defaulted Non-defaulted Defaulted Non-defaulted Defaulted
Central banks and central governments 2,871 17 0 0 746 68 0 0 0 0 0 0 0.0%
Institutions 5,519 0 0 0 857 0 0 0 1 0 0 0 -
Corporates 5,379 812 0 0 2,739 1,304 0 0 5 283 0 0 35.9%
Corporates - Of Which: Specialised Lending 2,761 698 0 0 1,158 878 0 0 3 265 0 0 38.2%
Corporates - Of Which: SME 4 3 0 0 1 12 0 0 0 0 0 0 3.8%
Retail 10,412 93 0 0 760 172 0 0 3 17 0 0 18.1%
Retail - Secured on real estate property 10,386 92 0 0 750 171 0 0 2 17 0 0 18.0%
Retail - Secured on real estate property - Of Which: SME 7 4 0 0 5 0 0 0 0 3 0 0 76.6%
Retail - Secured on real estate property - Of Which: non-SME 10,379 88 0 0 745 171 0 0 2 14 0 0 15.6%
Retail - Qualifying Revolving 0 0 0 0 0 0 0 0 0 0 0 0 -
Retail - Other Retail 26 1 0 0 11 1 0 0 0 0 0 0 42.4%
Retail - Other Retail - Of Which: SME 18 0 0 0 8 1 0 0 0 0 0 0 41.0%
Retail - Other Retail - Of Which: non-SME 7 0 0 0 3 1 0 0 0 0 0 0 45.0%
Equity 0 0 0 0 0 0 0 0 0 0 0 0 -
Securitisation
Other non-credit obligation assets 448 0 0 0 361 0 0 0 0 0 0 0 -
IRB TOTAL 24,628 922 0 0 5,463 1,544 0 0 9 299 0 0 33.4%1 Computed as: Stock of provisions for defaulted stock / default stock (as defined in paragraphs 59 and 61 of the Methodological note)
Spain
A-IRB F-IRB A-IRB F-IRB
United Kingdom
31/12/2015
Exposure values Risk exposure amounts Stock of provisions
Coverage Ratio -
Default Stock1
A-IRB F-IRB
Stock of provisions
Coverage Ratio -
Default Stock1
A-IRB F-IRB A-IRB F-IRB A-IRB F-IRB
Australia
31/12/2015
Exposure values Risk exposure amounts
A-IRB F-IRB A-IRB F-IRB
United States
31/12/2015
Exposure values Risk exposure amounts Stock of provisions
Coverage Ratio -
Default Stock1
A-IRB F-IRB
Stock of provisions
Coverage Ratio -
Default Stock1
A-IRB F-IRB A-IRB F-IRB A-IRB F-IRB
31/12/2015
Exposure values Risk exposure amounts
2016 EU-wide Stress Test:
Credit risk IRBING Groep N.V.
(mln EUR, %)Non-defaulted Defaulted Non-defaulted Defaulted Non-defaulted Defaulted Non-defaulted Defaulted Non-defaulted Defaulted Non-defaulted Defaulted
Central banks and central governments 6,920 0 0 0 1,302 0 0 0 0 0 0 0 -
Institutions 1,789 0 0 0 565 0 0 0 0 0 0 0 -
Corporates 9,752 388 0 0 5,269 475 0 0 15 192 0 0 49.8%
Corporates - Of Which: Specialised Lending 1,577 72 0 0 514 135 0 0 1 18 0 0 25.4%
Corporates - Of Which: SME 2,737 81 0 0 1,438 78 0 0 5 42 0 0 52.4%
Retail 8 0 0 0 2 0 0 0 0 0 0 0 16.0%
Retail - Secured on real estate property 4 0 0 0 1 0 0 0 0 0 0 0 6.7%
Retail - Secured on real estate property - Of Which: SME 0 0 0 0 0 0 0 0 0 0 0 0 -
Retail - Secured on real estate property - Of Which: non-SME 4 0 0 0 1 0 0 0 0 0 0 0 6.7%
Retail - Qualifying Revolving 0 0 0 0 0 0 0 0 0 0 0 0 -
Retail - Other Retail 4 0 0 0 1 0 0 0 0 0 0 0 30.0%
Retail - Other Retail - Of Which: SME 3 0 0 0 1 0 0 0 0 0 0 0 0.0%
Retail - Other Retail - Of Which: non-SME 1 0 0 0 0 0 0 0 0 0 0 0 33.3%
Equity 0 0 0 0 0 0 0 0 0 0 0 0 -
Securitisation
Other non-credit obligation assets 647 0 0 0 361 0 0 0 0 0 0 0 -
IRB TOTAL 19,116 388 0 0 7,498 475 0 0 16 192 0 0 49.7%1 Computed as: Stock of provisions for defaulted stock / default stock (as defined in paragraphs 59 and 61 of the Methodological note)
(mln EUR, %)Non-defaulted Defaulted Non-defaulted Defaulted Non-defaulted Defaulted Non-defaulted Defaulted Non-defaulted Defaulted Non-defaulted Defaulted
Central banks and central governments 6,024 0 0 0 0 0 0 0 0 0 0 0 -
Institutions 6,615 0 0 0 851 0 0 0 0 0 0 0 -
Corporates 10,822 78 0 0 4,824 118 0 0 3 19 0 0 24.6%
Corporates - Of Which: Specialised Lending 4,151 35 0 0 1,212 32 0 0 0 3 0 0 9.7%
Corporates - Of Which: SME 210 12 0 0 93 1 0 0 0 1 0 0 11.2%
Retail 412 53 0 0 126 130 0 0 1 3 0 0 6.1%
Retail - Secured on real estate property 327 45 0 0 97 112 0 0 0 1 0 0 2.9%
Retail - Secured on real estate property - Of Which: SME 50 17 0 0 16 73 0 0 0 0 0 0 1.9%
Retail - Secured on real estate property - Of Which: non-SME 277 28 0 0 81 39 0 0 0 1 0 0 3.4%
Retail - Qualifying Revolving 0 0 0 0 0 0 0 0 0 0 0 0 -
Retail - Other Retail 86 8 0 0 29 18 0 0 0 2 0 0 24.5%
Retail - Other Retail - Of Which: SME 44 4 0 0 16 11 0 0 0 1 0 0 18.9%
Retail - Other Retail - Of Which: non-SME 41 4 0 0 12 7 0 0 0 1 0 0 29.5%
Equity 0 0 0 0 0 0 0 0 0 0 0 0 -
Securitisation
Other non-credit obligation assets 212 0 0 0 245 0 0 0 0 0 0 0 -
IRB TOTAL 24,085 131 0 0 6,047 248 0 0 4 22 0 0 17.1%1 Computed as: Stock of provisions for defaulted stock / default stock (as defined in paragraphs 59 and 61 of the Methodological note)
(mln EUR, %)Non-defaulted Defaulted Non-defaulted Defaulted Non-defaulted Defaulted Non-defaulted Defaulted Non-defaulted Defaulted Non-defaulted Defaulted
Central banks and central governments 3,277 0 0 0 1,417 0 0 0 0 0 0 0 -
Institutions 1,184 1 0 0 355 3 0 0 0 0 0 0 22.6%
Corporates 5,265 444 0 0 2,313 697 0 0 3 118 0 0 26.7%
Corporates - Of Which: Specialised Lending 2,444 211 0 0 667 427 0 0 1 60 0 0 28.6%
Corporates - Of Which: SME 287 85 0 0 83 65 0 0 0 18 0 0 21.4%
Retail 8,923 682 0 0 1,283 413 0 0 10 202 0 0 29.7%
Retail - Secured on real estate property 8,818 619 0 0 1,260 378 0 0 9 166 0 0 26.8%
Retail - Secured on real estate property - Of Which: SME 1,228 524 0 0 273 338 0 0 1 122 0 0 23.3%
Retail - Secured on real estate property - Of Which: non-SME 7,591 95 0 0 987 41 0 0 8 44 0 0 46.3%
Retail - Qualifying Revolving 0 0 0 0 0 0 0 0 0 0 0 0 -
Retail - Other Retail 104 63 0 0 23 35 0 0 0 36 0 0 57.8%
Retail - Other Retail - Of Which: SME 99 63 0 0 21 35 0 0 0 36 0 0 57.8%
Retail - Other Retail - Of Which: non-SME 5 0 0 0 1 0 0 0 0 0 0 0 33.3%
Equity 0 0 0 0 0 0 0 0 0 0 0 0 -
Securitisation
Other non-credit obligation assets 707 0 0 0 578 0 0 0 0 0 0 0 -
IRB TOTAL 19,356 1,127 0 0 5,946 1,113 0 0 13 321 0 0 28.5%1 Computed as: Stock of provisions for defaulted stock / default stock (as defined in paragraphs 59 and 61 of the Methodological note)
Italy
Stock of provisions
Coverage Ratio -
Default Stock1
A-IRB F-IRB A-IRB F-IRB A-IRB F-IRB
France
31/12/2015
Exposure values Risk exposure amounts
A-IRB F-IRB A-IRB F-IRB
Poland
31/12/2015
Exposure values Risk exposure amounts Stock of provisions
Coverage Ratio -
Default Stock1
A-IRB F-IRB
Stock of provisions
Coverage Ratio -
Default Stock1
A-IRB F-IRB A-IRB F-IRB A-IRB F-IRB
31/12/2015
Exposure values Risk exposure amounts

2016 EU-wide Stress Test:
Credit risk IRBING Groep N.V.
(mln EUR, %)
Central banks and central governments
Institutions
Corporates
Corporates - Of Which: Specialised Lending
Corporates - Of Which: SME
Retail
Retail - Secured on real estate property
Retail - Secured on real estate property - Of Which: SME
Retail - Secured on real estate property - Of Which: non-SME
Retail - Qualifying Revolving
Retail - Other Retail
Retail - Other Retail - Of Which: SME
Retail - Other Retail - Of Which: non-SME
Equity
Securitisation
Other non-credit obligation assets
IRB TOTAL1 Computed as: Stock of provisions for defaulted stock / default stock (as defined in paragraphs 59 and 61 of the Methodological note)
Belgium
Germany
Netherlands
ING Groep N.V.
Impairment
rate
Stock of
Provisions
Coverage Ratio -
Default Stock1
Impairment
rate
Stock of
Provisions
Coverage Ratio -
Default Stock1
Impairment
rate
Stock of
Provisions
Coverage Ratio -
Default Stock1
Impairment
rate
Stock of
Provisions
Coverage Ratio -
Default Stock1
Impairment
rate
Stock of
Provisions
Coverage Ratio -
Default Stock1
Impairment
rate
Stock of
Provisions
Coverage Ratio -
Default Stock1
0.0% 13 16.7% 0.0% 18 22.4% 0.0% 22 25.4% 0.0% 20 24.7% 0.0% 31 29.8% 0.0% 42 32.0%
0.1% 44 7.3% 0.1% 70 10.0% 0.1% 97 12.0% 0.1% 50 8.3% 0.1% 92 12.6% 0.1% 136 15.4%
0.3% 3,909 34.5% 0.3% 4,466 31.4% 0.3% 5,004 29.4% 0.5% 4,496 35.1% 0.7% 6,283 34.0% 0.6% 7,722 34.1%
0.2% 1,168 32.0% 0.2% 1,345 29.1% 0.2% 1,512 27.1% 0.4% 1,329 33.9% 0.5% 1,884 33.8% 0.5% 2,406 34.6%
0.4% 622 24.1% 0.3% 712 22.2% 0.3% 795 21.1% 0.9% 792 24.3% 1.4% 1,242 24.8% 1.0% 1,540 25.8%
0.2% 2,140 18.7% 0.1% 2,558 17.9% 0.1% 2,943 17.5% 0.3% 2,627 21.1% 0.3% 3,830 21.5% 0.3% 4,998 21.2%
0.1% 1,262 13.0% 0.1% 1,490 12.3% 0.1% 1,699 11.9% 0.2% 1,597 15.3% 0.2% 2,302 15.4% 0.2% 3,046 15.4%
0.3% 277 19.5% 0.2% 304 18.2% 0.2% 328 17.2% 0.5% 324 20.9% 0.7% 435 21.0% 0.6% 518 20.7%
0.1% 985 11.7% 0.1% 1,186 11.3% 0.1% 1,371 11.0% 0.2% 1,273 14.2% 0.2% 1,867 14.5% 0.2% 2,528 14.6%
- 0 - - 0 - - 0 - - 0 - - 0 - - 0 -
0.9% 878 51.9% 0.8% 1,068 49.5% 0.8% 1,244 48.2% 1.5% 1,030 52.4% 2.0% 1,528 52.1% 1.7% 1,952 52.7%
0.8% 333 49.3% 0.7% 383 46.5% 0.7% 428 44.7% 1.4% 383 49.1% 2.0% 539 48.0% 1.5% 649 47.9%
0.9% 545 53.7% 0.8% 686 51.4% 0.8% 816 50.3% 1.5% 647 54.6% 1.9% 989 54.7% 1.7% 1,302 55.5%
- 0 - - 0 - - 0 - - 0 - - 0 - - 0 -
- 0 - - 0 - - 0 - - 0 - - 0 - - 0 -
0.2% 6,106 26.6% 0.2% 7,111 24.6% 0.2% 8,067 23.4% 0.3% 7,192 28.1% 0.4% 10,235 27.7% 0.4% 12,898 27.5%
Impairment
rate
Stock of
Provisions
Coverage Ratio -
Default Stock1
Impairment
rate
Stock of
Provisions
Coverage Ratio -
Default Stock1
Impairment
rate
Stock of
Provisions
Coverage Ratio -
Default Stock1
Impairment
rate
Stock of
Provisions
Coverage Ratio -
Default Stock1
Impairment
rate
Stock of
Provisions
Coverage Ratio -
Default Stock1
Impairment
rate
Stock of
Provisions
Coverage Ratio -
Default Stock1
0.0% 0 12.2% 0.0% 1 11.7% 0.0% 1 11.3% 0.0% 0 11.8% 0.0% 1 11.5% 0.0% 1 11.3%
0.0% 3 0.8% 0.0% 3 0.9% 0.0% 4 1.0% 0.0% 3 1.0% 0.1% 5 1.4% 0.1% 7 1.9%
0.5% 1,574 35.7% 0.4% 1,761 32.6% 0.4% 1,927 30.6% 0.8% 1,766 37.1% 1.0% 2,355 36.6% 0.9% 2,917 37.4%
0.5% 545 36.7% 0.4% 623 33.5% 0.4% 693 31.5% 0.8% 627 38.9% 1.3% 899 39.1% 1.2% 1,188 41.5%
0.8% 249 26.4% 0.7% 291 25.4% 0.6% 325 24.7% 1.2% 288 28.3% 1.3% 397 29.9% 1.1% 487 31.3%
0.1% 824 15.3% 0.1% 986 14.7% 0.1% 1,134 14.3% 0.2% 926 17.2% 0.3% 1,374 18.2% 0.3% 1,931 18.7%
0.1% 487 10.4% 0.1% 578 9.9% 0.1% 663 9.6% 0.1% 563 12.2% 0.2% 859 13.1% 0.2% 1,263 13.9%
0.6% 85 25.2% 0.5% 103 23.9% 0.5% 120 23.1% 0.9% 101 27.0% 1.2% 152 28.3% 1.1% 199 29.6%
0.1% 402 9.3% 0.1% 475 8.8% 0.1% 543 8.5% 0.1% 462 10.9% 0.1% 707 11.8% 0.2% 1,064 12.7%
- 0 - - 0 - - 0 - - 0 - - 0 - - 0 -
1.1% 337 49.7% 1.0% 408 48.4% 0.9% 471 47.6% 1.4% 363 51.5% 1.8% 515 53.5% 1.8% 667 56.2%
1.3% 212 58.1% 1.2% 246 57.0% 1.1% 276 56.2% 1.9% 235 59.8% 2.3% 311 61.0% 1.9% 373 61.9%
1.0% 125 38.7% 0.9% 162 38.6% 0.8% 194 38.6% 1.0% 128 39.6% 1.5% 204 44.4% 1.6% 294 50.1%
- 0 - - 0 - - 0 - - 0 - - 0 - - 0 -
- 0 - - 0 - - 0 - - 0 - - 0 - - 0 -
0.2% 2,401 24.2% 0.2% 2,751 22.5% 0.2% 3,065 21.3% 0.3% 2,696 26.2% 0.4% 3,734 26.3% 0.4% 4,855 26.4%
Impairment
rate
Stock of
Provisions
Coverage Ratio -
Default Stock1
Impairment
rate
Stock of
Provisions
Coverage Ratio -
Default Stock1
Impairment
rate
Stock of
Provisions
Coverage Ratio -
Default Stock1
Impairment
rate
Stock of
Provisions
Coverage Ratio -
Default Stock1
Impairment
rate
Stock of
Provisions
Coverage Ratio -
Default Stock1
Impairment
rate
Stock of
Provisions
Coverage Ratio -
Default Stock1
0.0% 0 33.7% 0.0% 1 33.6% 0.0% 1 33.4% 0.0% 0 35.0% 0.0% 1 35.7% 0.0% 1 35.6%
0.0% 0 9.8% 0.0% 0 9.3% 0.0% 0 9.0% 0.0% 0 7.7% 0.0% 0 7.8% 0.0% 0 8.3%
0.2% 49 40.6% 0.2% 57 35.8% 0.2% 66 33.0% 0.3% 56 39.9% 0.3% 76 37.9% 0.3% 91 36.3%
0.2% 12 20.7% 0.2% 14 20.0% 0.2% 16 19.2% 0.5% 15 22.6% 0.6% 23 25.4% 0.4% 28 25.9%
0.2% 3 36.5% 0.2% 3 36.3% 0.3% 3 35.9% 0.6% 3 38.6% 0.9% 3 40.0% 0.7% 3 39.6%
0.3% 730 44.8% 0.2% 913 42.9% 0.2% 1,085 41.9% 0.6% 970 44.6% 0.6% 1,396 44.4% 0.4% 1,725 43.9%
0.2% 390 31.7% 0.1% 490 30.5% 0.1% 581 29.8% 0.4% 540 33.1% 0.3% 745 32.5% 0.2% 905 31.8%
0.0% 0 0.9% 0.0% 0 1.0% 0.0% 0 1.1% 0.2% 0 3.2% 0.2% 0 4.5% 0.2% 0 4.4%
0.2% 390 31.7% 0.1% 490 30.5% 0.1% 581 29.8% 0.4% 540 33.1% 0.3% 745 32.5% 0.2% 905 31.8%
- 0 - - 0 - - 0 - - 0 - - 0 - - 0 -
1.0% 339 77.1% 1.0% 423 75.1% 0.9% 504 74.0% 2.0% 430 75.1% 2.6% 652 73.3% 2.0% 820 72.9%
1.7% 0 11.8% 1.5% 1 16.3% 1.3% 1 18.7% 2.8% 1 17.8% 2.4% 1 24.5% 1.6% 1 26.1%
1.0% 339 77.5% 1.0% 423 75.4% 0.9% 503 74.3% 2.0% 429 75.5% 2.6% 651 73.5% 2.0% 819 73.1%
- 0 - - 0 - - 0 - - 0 - - 0 - - 0 -
- 0 - - 0 - - 0 - - 0 - - 0 - - 0 -
0.2% 779 44.4% 0.2% 971 42.3% 0.2% 1,151 41.2% 0.5% 1,027 44.3% 0.5% 1,473 43.9% 0.4% 1,817 43.3%
Impairment
rate
Stock of
Provisions
Coverage Ratio -
Default Stock1
Impairment
rate
Stock of
Provisions
Coverage Ratio -
Default Stock1
Impairment
rate
Stock of
Provisions
Coverage Ratio -
Default Stock1
Impairment
rate
Stock of
Provisions
Coverage Ratio -
Default Stock1
Impairment
rate
Stock of
Provisions
Coverage Ratio -
Default Stock1
Impairment
rate
Stock of
Provisions
Coverage Ratio -
Default Stock1
0.0% 1 33.5% 0.0% 1 33.3% 0.0% 2 33.1% 0.0% 0 29.1% 0.0% 1 29.8% 0.0% 1 29.9%
0.0% 2 23.2% 0.0% 3 23.8% 0.0% 5 24.0% 0.0% 3 25.8% 0.1% 7 28.1% 0.0% 9 28.5%
0.2% 411 25.9% 0.2% 467 22.9% 0.2% 523 21.0% 0.6% 545 24.4% 1.2% 922 23.7% 0.7% 1,121 23.7%
0.1% 13 44.2% 0.2% 17 38.4% 0.2% 21 35.3% 0.4% 19 41.6% 0.8% 37 40.6% 0.5% 49 41.2%
0.2% 262 21.8% 0.2% 296 19.3% 0.2% 328 17.8% 0.7% 357 21.1% 1.4% 616 21.1% 0.8% 742 21.1%
0.1% 308 11.3% 0.1% 355 10.6% 0.1% 398 10.3% 0.3% 417 13.5% 0.5% 678 14.7% 0.5% 908 14.9%
0.1% 158 7.2% 0.0% 174 6.5% 0.0% 188 6.1% 0.2% 233 9.4% 0.3% 377 10.2% 0.3% 510 10.5%
0.1% 61 13.3% 0.1% 67 11.9% 0.1% 73 11.1% 0.3% 80 15.0% 0.6% 123 15.2% 0.4% 152 14.7%
0.1% 97 5.6% 0.0% 107 5.0% 0.0% 114 4.7% 0.1% 153 7.9% 0.2% 254 8.8% 0.3% 358 9.3%
- 0 - - 0 - - 0 - - 0 - - 0 - - 0 -
0.6% 151 35.0% 0.5% 181 31.7% 0.5% 211 30.0% 1.0% 184 34.8% 1.6% 301 34.5% 1.4% 398 34.9%
0.5% 78 35.3% 0.4% 92 31.9% 0.4% 105 30.0% 1.2% 103 35.3% 2.1% 178 35.8% 1.4% 222 35.8%
0.6% 73 34.6% 0.5% 90 31.6% 0.5% 106 30.1% 0.8% 81 34.2% 1.2% 123 32.8% 1.5% 176 33.8%
- 0 - - 0 - - 0 - - 0 - - 0 - - 0 -
- 0 - - 0 - - 0 - - 0 - - 0 - - 0 -
0.1% 723 17.0% 0.1% 827 15.5% 0.1% 928 14.7% 0.4% 966 18.3% 0.7% 1,608 18.9% 0.5% 2,039 18.9%
31/12/2016 31/12/2017
Baseline Scenario Adverse Scenario
31/12/2018 31/12/2016 31/12/2017 31/12/2018
31/12/2016 31/12/2017 31/12/2018 31/12/2016 31/12/2017 31/12/2018
Baseline Scenario Adverse Scenario
31/12/2016 31/12/2017 31/12/2018
Baseline Scenario Adverse Scenario
31/12/2016 31/12/2017 31/12/2018
31/12/2017 31/12/2018 31/12/2016 31/12/2017 31/12/201831/12/2016
Baseline Scenario Adverse Scenario

2016 EU-wide Stress Test:
Credit risk IRBING Groep N.V.
(mln EUR, %)
Central banks and central governments
Institutions
Corporates
Corporates - Of Which: Specialised Lending
Corporates - Of Which: SME
Retail
Retail - Secured on real estate property
Retail - Secured on real estate property - Of Which: SME
Retail - Secured on real estate property - Of Which: non-SME
Retail - Qualifying Revolving
Retail - Other Retail
Retail - Other Retail - Of Which: SME
Retail - Other Retail - Of Which: non-SME
Equity
Securitisation
Other non-credit obligation assets
IRB TOTAL1 Computed as: Stock of provisions for defaulted stock / default stock (as defined in paragraphs 59 and 61 of the Methodological note)
(mln EUR, %)
Central banks and central governments
Institutions
Corporates
Corporates - Of Which: Specialised Lending
Corporates - Of Which: SME
Retail
Retail - Secured on real estate property
Retail - Secured on real estate property - Of Which: SME
Retail - Secured on real estate property - Of Which: non-SME
Retail - Qualifying Revolving
Retail - Other Retail
Retail - Other Retail - Of Which: SME
Retail - Other Retail - Of Which: non-SME
Equity
Securitisation
Other non-credit obligation assets
IRB TOTAL1 Computed as: Stock of provisions for defaulted stock / default stock (as defined in paragraphs 59 and 61 of the Methodological note)
(mln EUR, %)
Central banks and central governments
Institutions
Corporates
Corporates - Of Which: Specialised Lending
Corporates - Of Which: SME
Retail
Retail - Secured on real estate property
Retail - Secured on real estate property - Of Which: SME
Retail - Secured on real estate property - Of Which: non-SME
Retail - Qualifying Revolving
Retail - Other Retail
Retail - Other Retail - Of Which: SME
Retail - Other Retail - Of Which: non-SME
Equity
Securitisation
Other non-credit obligation assets
IRB TOTAL1 Computed as: Stock of provisions for defaulted stock / default stock (as defined in paragraphs 59 and 61 of the Methodological note)
(mln EUR, %)
Central banks and central governments
Institutions
Corporates
Corporates - Of Which: Specialised Lending
Corporates - Of Which: SME
Retail
Retail - Secured on real estate property
Retail - Secured on real estate property - Of Which: SME
Retail - Secured on real estate property - Of Which: non-SME
Retail - Qualifying Revolving
Retail - Other Retail
Retail - Other Retail - Of Which: SME
Retail - Other Retail - Of Which: non-SME
Equity
Securitisation
Other non-credit obligation assets
IRB TOTAL1 Computed as: Stock of provisions for defaulted stock / default stock (as defined in paragraphs 59 and 61 of the Methodological note)
Spain
United Kingdom
Australia
United States
Impairment
rate
Stock of
Provisions
Coverage Ratio -
Default Stock1
Impairment
rate
Stock of
Provisions
Coverage Ratio -
Default Stock1
Impairment
rate
Stock of
Provisions
Coverage Ratio -
Default Stock1
Impairment
rate
Stock of
Provisions
Coverage Ratio -
Default Stock1
Impairment
rate
Stock of
Provisions
Coverage Ratio -
Default Stock1
Impairment
rate
Stock of
Provisions
Coverage Ratio -
Default Stock1
- 0 - - 0 - - 0 - - 0 - - 0 - - 0 -
0.0% 1 10.1% 0.0% 1 9.8% 0.0% 2 9.5% 0.0% 1 11.0% 0.0% 2 10.0% 0.0% 3 10.2%
0.3% 147 24.0% 0.3% 207 24.4% 0.3% 272 24.6% 0.3% 157 25.3% 0.6% 278 27.8% 0.5% 366 27.7%
0.1% 32 23.4% 0.1% 40 20.1% 0.1% 48 18.2% 0.1% 35 25.2% 0.2% 54 23.1% 0.2% 67 21.1%
0.2% 10 73.6% 0.3% 10 65.3% 0.3% 10 58.4% 0.3% 10 73.4% 0.6% 10 61.6% 0.5% 11 55.0%
0.1% 1 14.7% 0.1% 1 14.3% 0.1% 1 14.1% 0.2% 1 16.3% 0.2% 1 16.9% 0.2% 1 16.7%
0.1% 0 8.3% 0.2% 1 9.7% 0.2% 1 10.5% 0.2% 0 10.3% 0.2% 1 12.7% 0.2% 1 13.3%
0.9% 0 24.7% 1.1% 0 24.8% 1.2% 0 24.8% 1.1% 0 26.0% 1.5% 0 27.4% 1.6% 0 27.4%
0.1% 0 5.7% 0.1% 0 6.0% 0.1% 0 6.2% 0.1% 0 7.5% 0.1% 0 8.8% 0.1% 0 8.9%
- 0 - - 0 - - 0 - - 0 - - 0 - - 0 -
0.1% 0 32.2% 0.1% 0 29.4% 0.1% 0 27.1% 0.1% 0 33.4% 0.1% 0 31.2% 0.1% 1 29.6%
0.0% 0 14.2% 0.0% 0 8.5% 0.0% 0 6.1% 0.0% 0 15.4% 0.0% 0 10.0% 0.0% 0 7.8%
0.9% 0 35.5% 0.7% 0 35.6% 0.6% 0 35.6% 1.0% 0 36.7% 0.9% 0 38.8% 0.8% 0 40.7%
- 0 - - 0 - - 0 - - 0 - - 0 - - 0 -
- 0 - - 0 - - 0 - - 0 - - 0 - - 0 -
0.2% 148 23.8% 0.3% 210 24.1% 0.3% 275 24.3% 0.3% 158 25.0% 0.5% 281 27.5% 0.4% 370 27.3%
Impairment
rate
Stock of
Provisions
Coverage Ratio -
Default Stock1
Impairment
rate
Stock of
Provisions
Coverage Ratio -
Default Stock1
Impairment
rate
Stock of
Provisions
Coverage Ratio -
Default Stock1
Impairment
rate
Stock of
Provisions
Coverage Ratio -
Default Stock1
Impairment
rate
Stock of
Provisions
Coverage Ratio -
Default Stock1
Impairment
rate
Stock of
Provisions
Coverage Ratio -
Default Stock1
0.0% 0 40.0% 0.0% 0 40.0% 0.0% 0 40.0% 0.0% 0 40.0% 0.0% 0 40.0% 0.0% 0 40.0%
0.0% 0 26.0% 0.0% 0 25.9% 0.0% 0 25.9% 0.0% 0 29.4% 0.0% 0 31.9% 0.0% 0 33.2%
0.0% 2 13.6% 0.1% 3 13.5% 0.1% 5 13.5% 0.1% 3 15.0% 0.2% 7 16.8% 0.2% 11 17.6%
0.0% 1 13.2% 0.1% 2 13.1% 0.1% 3 13.1% 0.1% 2 15.0% 0.1% 4 16.5% 0.2% 7 17.3%
- 0 - - 0 - - 0 - - 0 - - 0 - - 0 -
0.0% 9 2.2% 0.0% 11 2.0% 0.0% 14 1.8% 0.0% 15 3.3% 0.0% 29 3.6% 0.0% 43 3.6%
0.0% 7 1.9% 0.0% 10 1.7% 0.0% 13 1.6% 0.0% 13 3.0% 0.0% 28 3.5% 0.0% 41 3.5%
0.1% 0 22.8% 0.1% 0 22.8% 0.2% 0 22.8% 0.1% 0 25.2% 0.2% 0 26.6% 0.3% 0 27.3%
0.0% 7 1.9% 0.0% 10 1.7% 0.0% 13 1.6% 0.0% 13 3.0% 0.0% 28 3.5% 0.0% 41 3.5%
- 0 - - 0 - - 0 - - 0 - - 0 - - 0 -
0.1% 1 13.7% 0.1% 1 13.8% 0.1% 1 13.9% 0.2% 1 13.8% 0.3% 1 14.3% 0.4% 1 14.8%
0.1% 0 25.2% 0.2% 0 25.0% 0.2% 0 24.9% 0.2% 0 28.9% 0.3% 0 31.0% 0.3% 0 31.8%
0.1% 1 13.7% 0.1% 1 13.8% 0.1% 1 13.9% 0.2% 1 13.8% 0.3% 1 14.3% 0.4% 1 14.8%
- 0 - - 0 - - 0 - - 0 - - 0 - - 0 -
- 0 - - 0 - - 0 - - 0 - - 0 - - 0 -
0.0% 10 2.5% 0.0% 14 2.4% 0.0% 19 2.4% 0.0% 17 3.7% 0.1% 36 4.2% 0.1% 54 4.3%
Impairment
rate
Stock of
Provisions
Coverage Ratio -
Default Stock1
Impairment
rate
Stock of
Provisions
Coverage Ratio -
Default Stock1
Impairment
rate
Stock of
Provisions
Coverage Ratio -
Default Stock1
Impairment
rate
Stock of
Provisions
Coverage Ratio -
Default Stock1
Impairment
rate
Stock of
Provisions
Coverage Ratio -
Default Stock1
Impairment
rate
Stock of
Provisions
Coverage Ratio -
Default Stock1
0.0% 0 39.9% 0.0% 0 39.9% 0.0% 0 39.9% 0.0% 0 39.9% 0.0% 0 39.9% 0.0% 0 39.9%
0.0% 1 20.8% 0.1% 2 21.1% 0.1% 3 21.1% 0.1% 2 23.3% 0.1% 5 25.7% 0.1% 7 27.2%
0.2% 171 75.2% 0.2% 188 64.1% 0.3% 205 56.5% 0.6% 203 67.0% 0.6% 258 59.3% 0.5% 299 55.9%
0.1% 5 16.0% 0.1% 10 17.0% 0.1% 17 17.8% 0.4% 16 21.4% 0.5% 40 27.3% 0.4% 59 29.7%
0.1% 0 4.3% 0.1% 0 6.6% 0.2% 0 7.9% 0.3% 0 7.8% 0.4% 1 12.7% 0.4% 1 15.7%
0.1% 2 11.6% 0.1% 3 8.4% 0.1% 3 7.2% 0.4% 3 8.3% 0.3% 4 7.7% 0.3% 5 7.6%
0.1% 2 35.7% 0.1% 2 29.4% 0.1% 2 25.6% 0.3% 2 26.5% 0.3% 3 23.6% 0.2% 3 22.3%
0.0% 0 0.3% 0.0% 0 0.6% 0.0% 0 0.9% 0.4% 0 2.7% 0.3% 0 4.5% 0.2% 0 5.5%
0.1% 2 40.3% 0.1% 2 32.6% 0.1% 2 27.9% 0.3% 2 29.4% 0.3% 3 25.6% 0.2% 3 23.9%
- 0 - - 0 - - 0 - - 0 - - 0 - - 0 -
0.1% 1 3.6% 0.2% 1 2.8% 0.2% 1 2.7% 0.5% 1 3.3% 0.5% 1 3.4% 0.4% 2 3.5%
0.6% 0 36.1% 0.7% 0 35.2% 0.8% 0 34.9% 1.6% 0 41.2% 1.7% 0 44.0% 1.3% 1 44.7%
0.1% 1 3.2% 0.1% 1 2.3% 0.1% 1 2.0% 0.4% 1 2.7% 0.2% 1 2.5% 0.2% 1 2.5%
- 0 - - 0 - - 0 - - 0 - - 0 - - 0 -
- 0 - - 0 - - 0 - - 0 - - 0 - - 0 -
0.2% 175 69.4% 0.2% 192 57.9% 0.2% 211 50.8% 0.5% 209 59.5% 0.5% 267 52.7% 0.4% 310 50.0%
Impairment
rate
Stock of
Provisions
Coverage Ratio -
Default Stock1
Impairment
rate
Stock of
Provisions
Coverage Ratio -
Default Stock1
Impairment
rate
Stock of
Provisions
Coverage Ratio -
Default Stock1
Impairment
rate
Stock of
Provisions
Coverage Ratio -
Default Stock1
Impairment
rate
Stock of
Provisions
Coverage Ratio -
Default Stock1
Impairment
rate
Stock of
Provisions
Coverage Ratio -
Default Stock1
0.1% 2 6.3% 0.1% 3 10.8% 0.1% 4 14.3% 0.3% 5 15.2% 0.3% 9 22.0% 0.3% 13 25.8%
0.0% 3 8.2% 0.0% 5 7.7% 0.1% 7 7.4% 0.0% 3 8.8% 0.1% 6 8.6% 0.1% 9 8.2%
0.4% 305 34.4% 0.4% 321 33.3% 0.3% 336 32.4% 0.5% 325 36.4% 0.6% 378 38.1% 0.6% 422 38.9%
0.5% 281 36.5% 0.4% 293 35.2% 0.4% 302 34.1% 0.7% 300 38.5% 0.8% 344 40.1% 0.7% 379 41.0%
0.0% 0 3.6% 0.0% 0 3.4% 0.0% 0 3.2% 0.0% 0 4.9% 0.2% 0 7.4% 0.2% 0 8.2%
0.0% 24 17.0% 0.0% 28 16.3% 0.0% 33 15.9% 0.1% 26 18.6% 0.1% 35 18.6% 0.1% 45 18.4%
0.0% 23 16.9% 0.0% 27 16.1% 0.0% 31 15.7% 0.0% 25 18.4% 0.1% 33 18.4% 0.1% 42 18.2%
0.1% 3 57.9% 0.0% 3 49.2% 0.0% 3 44.2% 0.1% 3 56.8% 0.1% 3 48.7% 0.0% 3 44.2%
0.0% 20 15.2% 0.0% 24 14.9% 0.0% 29 14.7% 0.0% 22 16.8% 0.1% 30 17.3% 0.1% 39 17.3%
- 0 - - 0 - - 0 - - 0 - - 0 - - 0 -
1.9% 1 22.2% 1.6% 1 20.6% 1.4% 2 20.0% 2.4% 1 23.1% 2.4% 2 24.3% 2.1% 2 25.0%
2.4% 1 19.8% 2.1% 1 18.6% 1.8% 1 18.2% 3.0% 1 21.0% 3.2% 1 22.7% 2.8% 2 23.6%
0.9% 0 41.9% 0.7% 0 40.7% 0.6% 0 39.9% 0.9% 0 42.6% 0.8% 0 41.4% 0.7% 0 40.9%
- 0 - - 0 - - 0 - - 0 - - 0 - - 0 -
- 0 - - 0 - - 0 - - 0 - - 0 - - 0 -
0.1% 332 31.2% 0.1% 357 29.5% 0.1% 380 28.0% 0.2% 358 33.0% 0.2% 427 33.5% 0.2% 488 33.1%
31/12/2016 31/12/2017
Baseline Scenario Adverse Scenario
31/12/2018 31/12/2016 31/12/2017 31/12/2018
31/12/2016 31/12/2017 31/12/2018 31/12/2016 31/12/2017 31/12/2018
Baseline Scenario Adverse Scenario
31/12/2016 31/12/2017
Baseline Scenario Adverse Scenario
31/12/2018 31/12/2016 31/12/2017 31/12/2018
31/12/2016 31/12/2017 31/12/2018 31/12/2016 31/12/2017 31/12/2018
Baseline Scenario Adverse Scenario

2016 EU-wide Stress Test:
Credit risk IRBING Groep N.V.
(mln EUR, %)
Central banks and central governments
Institutions
Corporates
Corporates - Of Which: Specialised Lending
Corporates - Of Which: SME
Retail
Retail - Secured on real estate property
Retail - Secured on real estate property - Of Which: SME
Retail - Secured on real estate property - Of Which: non-SME
Retail - Qualifying Revolving
Retail - Other Retail
Retail - Other Retail - Of Which: SME
Retail - Other Retail - Of Which: non-SME
Equity
Securitisation
Other non-credit obligation assets
IRB TOTAL1 Computed as: Stock of provisions for defaulted stock / default stock (as defined in paragraphs 59 and 61 of the Methodological note)
(mln EUR, %)
Central banks and central governments
Institutions
Corporates
Corporates - Of Which: Specialised Lending
Corporates - Of Which: SME
Retail
Retail - Secured on real estate property
Retail - Secured on real estate property - Of Which: SME
Retail - Secured on real estate property - Of Which: non-SME
Retail - Qualifying Revolving
Retail - Other Retail
Retail - Other Retail - Of Which: SME
Retail - Other Retail - Of Which: non-SME
Equity
Securitisation
Other non-credit obligation assets
IRB TOTAL1 Computed as: Stock of provisions for defaulted stock / default stock (as defined in paragraphs 59 and 61 of the Methodological note)
(mln EUR, %)
Central banks and central governments
Institutions
Corporates
Corporates - Of Which: Specialised Lending
Corporates - Of Which: SME
Retail
Retail - Secured on real estate property
Retail - Secured on real estate property - Of Which: SME
Retail - Secured on real estate property - Of Which: non-SME
Retail - Qualifying Revolving
Retail - Other Retail
Retail - Other Retail - Of Which: SME
Retail - Other Retail - Of Which: non-SME
Equity
Securitisation
Other non-credit obligation assets
IRB TOTAL1 Computed as: Stock of provisions for defaulted stock / default stock (as defined in paragraphs 59 and 61 of the Methodological note)
Italy
France
Poland
Impairment
rate
Stock of
Provisions
Coverage Ratio -
Default Stock1
Impairment
rate
Stock of
Provisions
Coverage Ratio -
Default Stock1
Impairment
rate
Stock of
Provisions
Coverage Ratio -
Default Stock1
Impairment
rate
Stock of
Provisions
Coverage Ratio -
Default Stock1
Impairment
rate
Stock of
Provisions
Coverage Ratio -
Default Stock1
Impairment
rate
Stock of
Provisions
Coverage Ratio -
Default Stock1
0.0% 1 39.9% 0.0% 2 39.9% 0.0% 3 39.9% 0.1% 2 39.9% 0.1% 4 39.9% 0.1% 6 39.9%
0.0% 1 30.2% 0.0% 1 30.2% 0.0% 2 30.3% 0.1% 1 32.7% 0.1% 2 37.1% 0.1% 4 41.5%
0.4% 237 39.9% 0.4% 268 35.0% 0.4% 306 32.5% 1.0% 307 37.8% 1.7% 489 38.7% 1.6% 690 42.8%
0.2% 23 22.9% 0.2% 28 22.3% 0.3% 33 22.3% 0.5% 28 25.2% 1.0% 51 28.4% 1.5% 87 33.5%
0.4% 57 37.6% 0.4% 67 31.5% 0.5% 80 28.9% 1.4% 85 33.8% 2.3% 154 35.9% 2.1% 227 41.3%
0.4% 0 13.8% 0.3% 0 13.2% 0.3% 0 13.1% 0.8% 0 14.7% 1.0% 0 17.5% 1.0% 0 21.3%
0.1% 0 7.0% 0.1% 0 7.1% 0.1% 0 7.2% 0.2% 0 9.7% 0.3% 0 12.9% 0.5% 0 17.0%
- 0 - - 0 - - 0 - - 0 - - 0 - - 0 -
0.1% 0 7.0% 0.1% 0 7.1% 0.1% 0 7.2% 0.2% 0 9.7% 0.3% 0 12.9% 0.5% 0 17.0%
- 0 - - 0 - - 0 - - 0 - - 0 - - 0 -
0.7% 0 18.6% 0.6% 0 16.8% 0.6% 0 16.2% 1.5% 0 16.9% 1.9% 0 19.3% 1.6% 0 23.2%
0.6% 0 10.1% 0.5% 0 10.4% 0.5% 0 10.7% 1.5% 0 11.9% 1.8% 0 14.7% 1.5% 0 18.6%
1.1% 0 34.5% 0.9% 0 35.2% 0.8% 0 35.6% 1.4% 0 36.4% 2.3% 0 42.7% 2.0% 0 47.8%
- 0 - - 0 - - 0 - - 0 - - 0 - - 0 -
- 0 - - 0 - - 0 - - 0 - - 0 - - 0 -
0.3% 239 39.9% 0.3% 272 35.0% 0.3% 311 32.6% 0.8% 311 37.8% 1.2% 496 38.6% 1.2% 701 42.7%
Impairment
rate
Stock of
Provisions
Coverage Ratio -
Default Stock1
Impairment
rate
Stock of
Provisions
Coverage Ratio -
Default Stock1
Impairment
rate
Stock of
Provisions
Coverage Ratio -
Default Stock1
Impairment
rate
Stock of
Provisions
Coverage Ratio -
Default Stock1
Impairment
rate
Stock of
Provisions
Coverage Ratio -
Default Stock1
Impairment
rate
Stock of
Provisions
Coverage Ratio -
Default Stock1
0.0% 0 40.0% 0.0% 0 40.0% 0.0% 0 40.0% 0.0% 0 40.0% 0.0% 0 40.0% 0.0% 0 40.0%
0.0% 0 27.6% 0.0% 0 27.4% 0.0% 0 27.3% 0.0% 0 30.1% 0.0% 0 32.2% 0.0% 1 33.0%
0.1% 31 22.5% 0.2% 42 22.1% 0.2% 54 21.9% 0.2% 34 23.5% 0.2% 55 25.5% 0.3% 77 26.7%
0.1% 6 10.4% 0.1% 10 12.0% 0.1% 13 12.8% 0.1% 7 11.6% 0.2% 15 16.1% 0.2% 24 19.1%
0.3% 2 11.6% 0.3% 2 11.9% 0.4% 2 12.3% 0.4% 2 11.9% 0.5% 2 13.1% 0.5% 2 13.9%
0.1% 4 4.7% 0.1% 5 4.3% 0.1% 5 4.3% 0.2% 6 5.5% 0.3% 8 5.7% 0.3% 9 6.0%
0.0% 2 2.0% 0.0% 2 1.8% 0.0% 2 1.7% 0.1% 3 3.1% 0.2% 4 3.5% 0.2% 5 3.7%
0.0% 0 2.3% 0.0% 0 2.3% 0.0% 0 2.2% 0.1% 1 3.2% 0.1% 1 3.9% 0.0% 1 4.8%
0.0% 1 2.0% 0.0% 1 1.6% 0.0% 1 1.5% 0.1% 2 3.1% 0.2% 3 3.4% 0.2% 4 3.6%
- 0 - - 0 - - 0 - - 0 - - 0 - - 0 -
0.6% 3 23.5% 0.5% 3 22.9% 0.5% 4 22.6% 0.6% 3 24.6% 0.7% 4 25.3% 0.7% 4 25.6%
0.5% 1 18.4% 0.5% 1 18.5% 0.6% 1 18.8% 0.6% 1 20.5% 0.8% 2 22.8% 0.9% 2 23.9%
0.6% 2 27.9% 0.5% 2 26.8% 0.5% 2 26.0% 0.7% 2 28.5% 0.6% 2 27.8% 0.6% 2 27.3%
- 0 - - 0 - - 0 - - 0 - - 0 - - 0 -
- 0 - - 0 - - 0 - - 0 - - 0 - - 0 -
0.1% 35 15.4% 0.1% 48 15.8% 0.1% 60 16.3% 0.1% 40 16.3% 0.2% 63 18.1% 0.2% 88 19.7%
Impairment
rate
Stock of
Provisions
Coverage Ratio -
Default Stock1
Impairment
rate
Stock of
Provisions
Coverage Ratio -
Default Stock1
Impairment
rate
Stock of
Provisions
Coverage Ratio -
Default Stock1
Impairment
rate
Stock of
Provisions
Coverage Ratio -
Default Stock1
Impairment
rate
Stock of
Provisions
Coverage Ratio -
Default Stock1
Impairment
rate
Stock of
Provisions
Coverage Ratio -
Default Stock1
0.1% 1 39.9% 0.1% 1 39.9% 0.1% 1 39.9% 0.2% 1 39.7% 0.2% 3 39.7% 0.2% 4 39.7%
0.1% 1 21.9% 0.1% 1 22.4% 0.1% 2 23.0% 0.1% 1 24.6% 0.1% 2 28.1% 0.1% 3 29.9%
0.3% 132 25.6% 0.3% 145 25.1% 0.3% 157 24.6% 0.4% 149 28.0% 0.5% 189 30.1% 0.5% 220 30.8%
0.3% 68 26.5% 0.2% 75 25.6% 0.2% 81 24.6% 0.4% 79 29.1% 0.6% 104 31.2% 0.5% 123 32.2%
0.1% 18 20.7% 0.1% 19 20.0% 0.1% 19 19.3% 0.2% 20 22.4% 0.3% 23 23.0% 0.3% 24 22.4%
0.2% 227 27.2% 0.1% 240 25.7% 0.1% 252 24.5% 0.3% 251 28.7% 0.3% 288 28.3% 0.2% 311 27.2%
0.2% 190 24.7% 0.1% 202 23.4% 0.1% 214 22.5% 0.3% 212 26.3% 0.3% 247 26.2% 0.2% 269 25.3%
0.2% 126 21.5% 0.2% 128 20.2% 0.2% 130 19.2% 0.4% 137 22.8% 0.5% 153 22.6% 0.4% 159 21.5%
0.2% 64 37.1% 0.1% 74 33.6% 0.1% 84 31.8% 0.3% 75 38.0% 0.2% 94 36.2% 0.2% 110 34.9%
- 0 - - 0 - - 0 - - 0 - - 0 - - 0 -
0.7% 37 53.5% 0.6% 38 50.5% 0.5% 38 48.2% 1.0% 39 54.4% 1.1% 41 52.3% 1.0% 43 50.0%
0.7% 37 53.6% 0.6% 38 50.6% 0.5% 38 48.3% 1.0% 39 54.4% 1.2% 41 52.4% 1.0% 43 50.2%
0.4% 0 24.8% 0.4% 0 21.7% 0.3% 0 19.7% 0.5% 0 24.4% 0.5% 0 21.5% 0.5% 0 20.0%
- 0 - - 0 - - 0 - - 0 - - 0 - - 0 -
- 0 - - 0 - - 0 - - 0 - - 0 - - 0 -
0.2% 360 26.6% 0.2% 387 25.5% 0.2% 412 24.6% 0.3% 403 28.4% 0.3% 482 29.0% 0.3% 538 28.7%
31/12/2016 31/12/2017 31/12/2018 31/12/2016 31/12/2017 31/12/2018
Baseline Scenario Adverse Scenario
31/12/2016 31/12/2017
Baseline Scenario Adverse Scenario
31/12/2018 31/12/2016 31/12/2017 31/12/2018
31/12/2016 31/12/2017 31/12/2018 31/12/2016 31/12/2017 31/12/2018
Baseline Scenario Adverse Scenario

2016 EU-wide Stress Test:
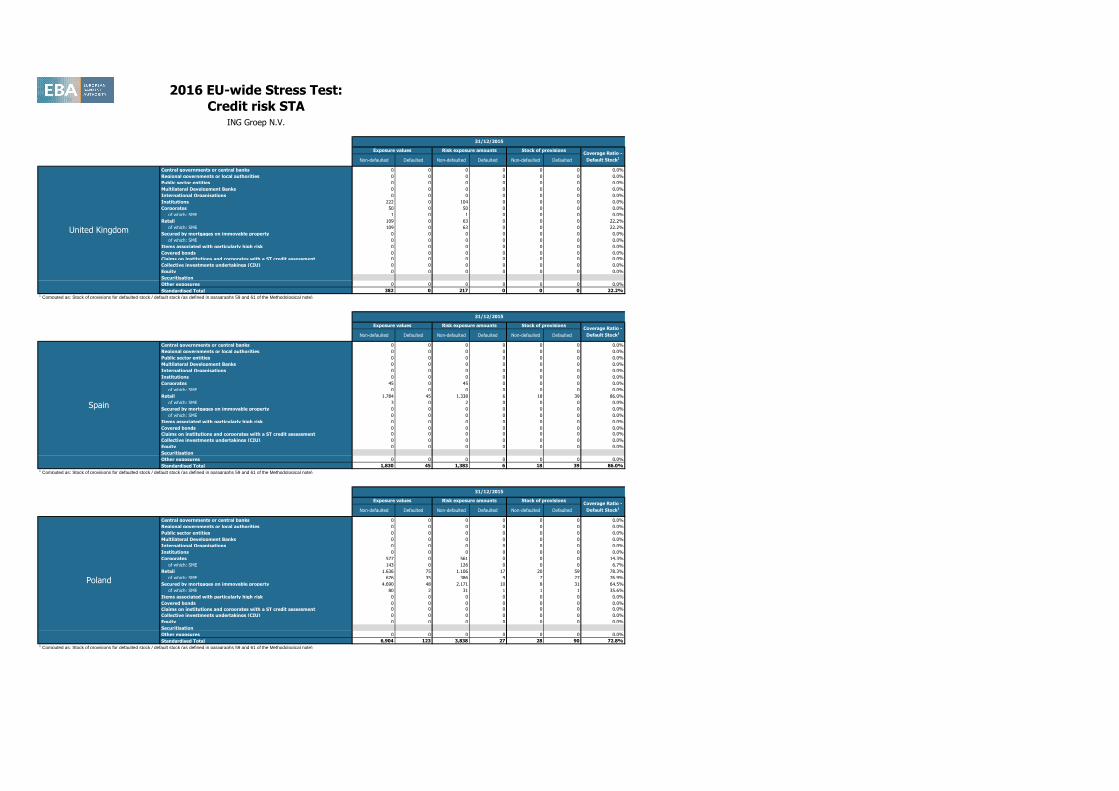
Credit risk STAING Groep N.V.
Non-defaulted Defaulted Non-defaulted Defaulted Non-defaulted Defaulted
Central governments or central banks 2,905 0 2,340 0 1 0 0.0%
Regional governments or local authorities 121 0 60 0 0 0 0.0%
Public sector entities 0 0 0 0 0 0 0.0%
Multilateral Development Banks 0 0 0 0 0 0 0.0%
International Organisations 0 0 0 0 0 0 0.0%
Institutions 4,418 1 1,317 1 1 0 0.0%
Corporates 6,480 69 6,310 42 13 36 50.5%
of which: SME 1,640 24 1,444 13 4 13 53.4%
Retail 9,562 570 6,811 291 90 281 49.2%
of which: SME 2,276 101 1,346 34 17 69 67.8%
Secured by mortgages on immovable property 10,552 159 5,497 85 15 74 46.8%
of which: SME 1,883 49 1,221 33 5 18 36.6%
Items associated with particularly high risk 0 0 0 0 0 0 0.0%
Covered bonds 0 0 0 0 0 0 0.0%
Claims on institutions and corporates with a ST credit assessment 0 0 0 0 0 0 0.0%
Collective investments undertakings (CIU) 0 0 0 0 0 0 0.0%
Equity 0 0 0 0 0 0 0.0%
Securitisation
Other exposures 0 0 0 0 0 0 0.0%
Standardised Total 34,039 799 22,333 419 120 391 48.9%1 Computed as: Stock of provisions for defaulted stock / default stock (as defined in paragraphs 59 and 61 of the Methodological note)
Non-defaulted Defaulted Non-defaulted Defaulted Non-defaulted Defaulted
Central governments or central banks 0 0 0 0 0 0 0.0%
Regional governments or local authorities 0 0 0 0 0 0 0.0%
Public sector entities 0 0 0 0 0 0 0.0%
Multilateral Development Banks 0 0 0 0 0 0 0.0%
International Organisations 0 0 0 0 0 0 0.0%
Institutions 3,029 0 609 0 0 0 0.0%
Corporates 96 1 96 1 0 0 29.7%
of which: SME 0 0 0 0 0 0 0.0%
Retail 42 0 32 0 1 0 33.3%
of which: SME 2 0 2 0 0 0 0.0%
Secured by mortgages on immovable property 2 0 2 0 0 0 40.0%
of which: SME 0 0 0 0 0 0 0.0%
Items associated with particularly high risk 0 0 0 0 0 0 0.0%
Covered bonds 0 0 0 0 0 0 0.0%
Claims on institutions and corporates with a ST credit assessment 0 0 0 0 0 0 0.0%
Collective investments undertakings (CIU) 0 0 0 0 0 0 0.0%
Equity 0 0 0 0 0 0 0.0%
Securitisation
Other exposures 0 0 0 0 0 0 0.0%
Standardised Total 3,170 2 737 1 2 0 30.1%1 Computed as: Stock of provisions for defaulted stock / default stock (as defined in paragraphs 59 and 61 of the Methodological note)
Non-defaulted Defaulted Non-defaulted Defaulted Non-defaulted Defaulted
Central governments or central banks 0 0 0 0 0 0 0.0%
Regional governments or local authorities 0 0 0 0 0 0 0.0%
Public sector entities 0 0 0 0 0 0 0.0%
Multilateral Development Banks 0 0 0 0 0 0 0.0%
International Organisations 0 0 0 0 0 0 0.0%
Institutions 21 0 10 0 0 0 0.0%
Corporates 206 2 206 1 0 1 62.1%
of which: SME 0 0 0 0 0 0 0.0%
Retail 44 1 33 0 0 1 88.9%
of which: SME 0 0 0 0 0 0 0.0%
Secured by mortgages on immovable property 2 0 1 0 0 0 0.0%
of which: SME 0 0 0 0 0 0 0.0%
Items associated with particularly high risk 0 0 0 0 0 0 0.0%
Covered bonds 0 0 0 0 0 0 0.0%
Claims on institutions and corporates with a ST credit assessment 0 0 0 0 0 0 0.0%
Collective investments undertakings (CIU) 0 0 0 0 0 0 0.0%
Equity 0 0 0 0 0 0 0.0%
Securitisation
Other exposures 0 0 0 0 0 0 0.0%
Standardised Total 273 2 250 1 0 2 69.2%1 Computed as: Stock of provisions for defaulted stock / default stock (as defined in paragraphs 59 and 61 of the Methodological note)
Germany
Exposure values Risk exposure amounts Stock of provisionsCoverage Ratio -
Default Stock1
Netherlands
31/12/2015
31/12/2015
Exposure values Risk exposure amounts Stock of provisionsCoverage Ratio -
Default Stock1
ING Groep N.V.
31/12/2015
Exposure values Risk exposure amounts Stock of provisions
Coverage Ratio -
Default Stock1

2016 EU-wide Stress Test:
Credit risk STAING Groep N.V.
Non-defaulted Defaulted Non-defaulted Defaulted Non-defaulted Defaulted
Central governments or central banks 0 0 0 0 0 0 0.0%
Regional governments or local authorities 2 0 0 0 0 0 0.0%
Public sector entities 0 0 0 0 0 0 0.0%
Multilateral Development Banks 0 0 0 0 0 0 0.0%
International Organisations 0 0 0 0 0 0 0.0%
Institutions 4 1 1 1 0 0 0.0%
Corporates 641 2 631 4 0 0 1.1%
of which: SME 202 2 193 4 0 0 1.1%
Retail 25 153 18 114 0 39 25.3%
of which: SME 3 1 2 1 0 0 4.8%
Secured by mortgages on immovable property 0 0 0 0 0 0 0.0%
of which: SME 0 0 0 0 0 0 0.0%
Items associated with particularly high risk 0 0 0 0 0 0 0.0%
Covered bonds 0 0 0 0 0 0 0.0%
Claims on institutions and corporates with a ST credit assessment 0 0 0 0 0 0 0.0%
Collective investments undertakings (CIU) 0 0 0 0 0 0 0.0%
Equity 0 0 0 0 0 0 0.0%
Securitisation
Other exposures 0 0 0 0 0 0 0.0%
Standardised Total 672 156 651 118 0 39 24.8%1 Computed as: Stock of provisions for defaulted stock / default stock (as defined in paragraphs 59 and 61 of the Methodological note)
Non-defaulted Defaulted Non-defaulted Defaulted Non-defaulted Defaulted
Central governments or central banks 0 0 0 0 0 0 0.0%
Regional governments or local authorities 0 0 0 0 0 0 0.0%
Public sector entities 0 0 0 0 0 0 0.0%
Multilateral Development Banks 0 0 0 0 0 0 0.0%
International Organisations 0 0 0 0 0 0 0.0%
Institutions 242 0 119 0 0 0 0.0%
Corporates 0 0 0 0 0 0 0.0%
of which: SME 0 0 0 0 0 0 0.0%
Retail 0 0 0 0 0 0 0.0%
of which: SME 0 0 0 0 0 0 0.0%
Secured by mortgages on immovable property 0 0 0 0 0 0 0.0%
of which: SME 0 0 0 0 0 0 0.0%
Items associated with particularly high risk 0 0 0 0 0 0 0.0%
Covered bonds 0 0 0 0 0 0 0.0%
Claims on institutions and corporates with a ST credit assessment 0 0 0 0 0 0 0.0%
Collective investments undertakings (CIU) 0 0 0 0 0 0 0.0%
Equity 0 0 0 0 0 0 0.0%
Securitisation
Other exposures 0 0 0 0 0 0 0.0%
Standardised Total 242 0 119 0 0 0 0.0%1 Computed as: Stock of provisions for defaulted stock / default stock (as defined in paragraphs 59 and 61 of the Methodological note)
Non-defaulted Defaulted Non-defaulted Defaulted Non-defaulted Defaulted
Central governments or central banks 0 0 0 0 0 0 0.0%
Regional governments or local authorities 0 0 0 0 0 0 0.0%
Public sector entities 0 0 0 0 0 0 0.0%
Multilateral Development Banks 0 0 0 0 0 0 0.0%
International Organisations 0 0 0 0 0 0 0.0%
Institutions 34 0 7 0 0 0 0.0%
Corporates 7 0 7 0 0 0 0.0%
of which: SME 2 0 2 0 0 0 0.0%
Retail 0 0 0 0 0 0 0.0%
of which: SME 0 0 0 0 0 0 0.0%
Secured by mortgages on immovable property 1,140 18 685 9 0 11 63.6%
of which: SME 22 0 14 0 0 0 0.0%
Items associated with particularly high risk 0 0 0 0 0 0 0.0%
Covered bonds 0 0 0 0 0 0 0.0%
Claims on institutions and corporates with a ST credit assessment 0 0 0 0 0 0 0.0%
Collective investments undertakings (CIU) 0 0 0 0 0 0 0.0%
Equity 0 0 0 0 0 0 0.0%
Securitisation
Other exposures 0 0 0 0 0 0 0.0%
Standardised Total 1,182 18 699 9 0 11 63.6%1 Computed as: Stock of provisions for defaulted stock / default stock (as defined in paragraphs 59 and 61 of the Methodological note)
Australia
Exposure values Risk exposure amounts Stock of provisionsCoverage Ratio -
Default Stock1
United States
31/12/2015
Exposure values Risk exposure amounts Stock of provisionsCoverage Ratio -
Default Stock1
Belgium
31/12/2015
Exposure values Risk exposure amounts Stock of provisionsCoverage Ratio -
Default Stock1
31/12/2015
2016 EU-wide Stress Test:
Credit risk STAING Groep N.V.
Non-defaulted Defaulted Non-defaulted Defaulted Non-defaulted Defaulted
Central governments or central banks 0 0 0 0 0 0 0.0%
Regional governments or local authorities 0 0 0 0 0 0 0.0%
Public sector entities 0 0 0 0 0 0 0.0%
Multilateral Development Banks 0 0 0 0 0 0 0.0%
International Organisations 0 0 0 0 0 0 0.0%
Institutions 222 0 104 0 0 0 0.0%
Corporates 50 0 50 0 0 0 0.0%
of which: SME 1 0 1 0 0 0 0.0%
Retail 109 0 63 0 0 0 22.2%
of which: SME 109 0 63 0 0 0 22.2%
Secured by mortgages on immovable property 0 0 0 0 0 0 0.0%
of which: SME 0 0 0 0 0 0 0.0%
Items associated with particularly high risk 0 0 0 0 0 0 0.0%
Covered bonds 0 0 0 0 0 0 0.0%
Claims on institutions and corporates with a ST credit assessment 0 0 0 0 0 0 0.0%
Collective investments undertakings (CIU) 0 0 0 0 0 0 0.0%
Equity 0 0 0 0 0 0 0.0%
Securitisation
Other exposures 0 0 0 0 0 0 0.0%
Standardised Total 382 0 217 0 0 0 22.2%1 Computed as: Stock of provisions for defaulted stock / default stock (as defined in paragraphs 59 and 61 of the Methodological note)
Non-defaulted Defaulted Non-defaulted Defaulted Non-defaulted Defaulted
Central governments or central banks 0 0 0 0 0 0 0.0%
Regional governments or local authorities 0 0 0 0 0 0 0.0%
Public sector entities 0 0 0 0 0 0 0.0%
Multilateral Development Banks 0 0 0 0 0 0 0.0%
International Organisations 0 0 0 0 0 0 0.0%
Institutions 0 0 0 0 0 0 0.0%
Corporates 45 0 45 0 0 0 0.0%
of which: SME 0 0 0 0 0 0 0.0%
Retail 1,784 45 1,338 6 18 39 86.0%
of which: SME 3 0 2 0 0 0 0.0%
Secured by mortgages on immovable property 0 0 0 0 0 0 0.0%
of which: SME 0 0 0 0 0 0 0.0%
Items associated with particularly high risk 0 0 0 0 0 0 0.0%
Covered bonds 0 0 0 0 0 0 0.0%
Claims on institutions and corporates with a ST credit assessment 0 0 0 0 0 0 0.0%
Collective investments undertakings (CIU) 0 0 0 0 0 0 0.0%
Equity 0 0 0 0 0 0 0.0%
Securitisation
Other exposures 0 0 0 0 0 0 0.0%
Standardised Total 1,830 45 1,383 6 18 39 86.0%1 Computed as: Stock of provisions for defaulted stock / default stock (as defined in paragraphs 59 and 61 of the Methodological note)
Non-defaulted Defaulted Non-defaulted Defaulted Non-defaulted Defaulted
Central governments or central banks 0 0 0 0 0 0 0.0%
Regional governments or local authorities 0 0 0 0 0 0 0.0%
Public sector entities 0 0 0 0 0 0 0.0%
Multilateral Development Banks 0 0 0 0 0 0 0.0%
International Organisations 0 0 0 0 0 0 0.0%
Institutions 0 0 0 0 0 0 0.0%
Corporates 577 0 561 0 0 0 14.3%
of which: SME 143 0 126 0 0 0 6.7%
Retail 1,636 75 1,106 17 20 59 78.3%
of which: SME 676 35 386 9 7 27 76.9%
Secured by mortgages on immovable property 4,690 48 2,171 10 8 31 64.5%
of which: SME 80 2 31 1 1 1 35.6%
Items associated with particularly high risk 0 0 0 0 0 0 0.0%
Covered bonds 0 0 0 0 0 0 0.0%
Claims on institutions and corporates with a ST credit assessment 0 0 0 0 0 0 0.0%
Collective investments undertakings (CIU) 0 0 0 0 0 0 0.0%
Equity 0 0 0 0 0 0 0.0%
Securitisation
Other exposures 0 0 0 0 0 0 0.0%
Standardised Total 6,904 123 3,838 27 28 90 72.8%1 Computed as: Stock of provisions for defaulted stock / default stock (as defined in paragraphs 59 and 61 of the Methodological note)
Poland
Exposure values Risk exposure amounts Stock of provisionsCoverage Ratio -
Default Stock1
Spain
31/12/2015
Exposure values Risk exposure amounts Stock of provisionsCoverage Ratio -
Default Stock1
United Kingdom
31/12/2015
Exposure values Risk exposure amounts Stock of provisionsCoverage Ratio -
Default Stock1
31/12/2015
2016 EU-wide Stress Test:
Credit risk STAING Groep N.V.
Non-defaulted Defaulted Non-defaulted Defaulted Non-defaulted Defaulted
Central governments or central banks 0 0 0 0 0 0 0.0%
Regional governments or local authorities 0 0 0 0 0 0 0.0%
Public sector entities 0 0 0 0 0 0 0.0%
Multilateral Development Banks 0 0 0 0 0 0 0.0%
International Organisations 0 0 0 0 0 0 0.0%
Institutions 195 0 89 0 0 0 0.0%
Corporates 39 1 39 0 0 1 82.3%
of which: SME 2 0 2 0 0 0 100.0%
Retail 311 4 233 1 1 3 63.4%
of which: SME 3 0 2 0 0 0 80.0%
Secured by mortgages on immovable property 14 0 7 0 0 0 0.0%
of which: SME 6 0 3 0 0 0 0.0%
Items associated with particularly high risk 0 0 0 0 0 0 0.0%
Covered bonds 0 0 0 0 0 0 0.0%
Claims on institutions and corporates with a ST credit assessment 0 0 0 0 0 0 0.0%
Collective investments undertakings (CIU) 0 0 0 0 0 0 0.0%
Equity 0 0 0 0 0 0 0.0%
Securitisation
Other exposures 0 0 0 0 0 0 0.0%
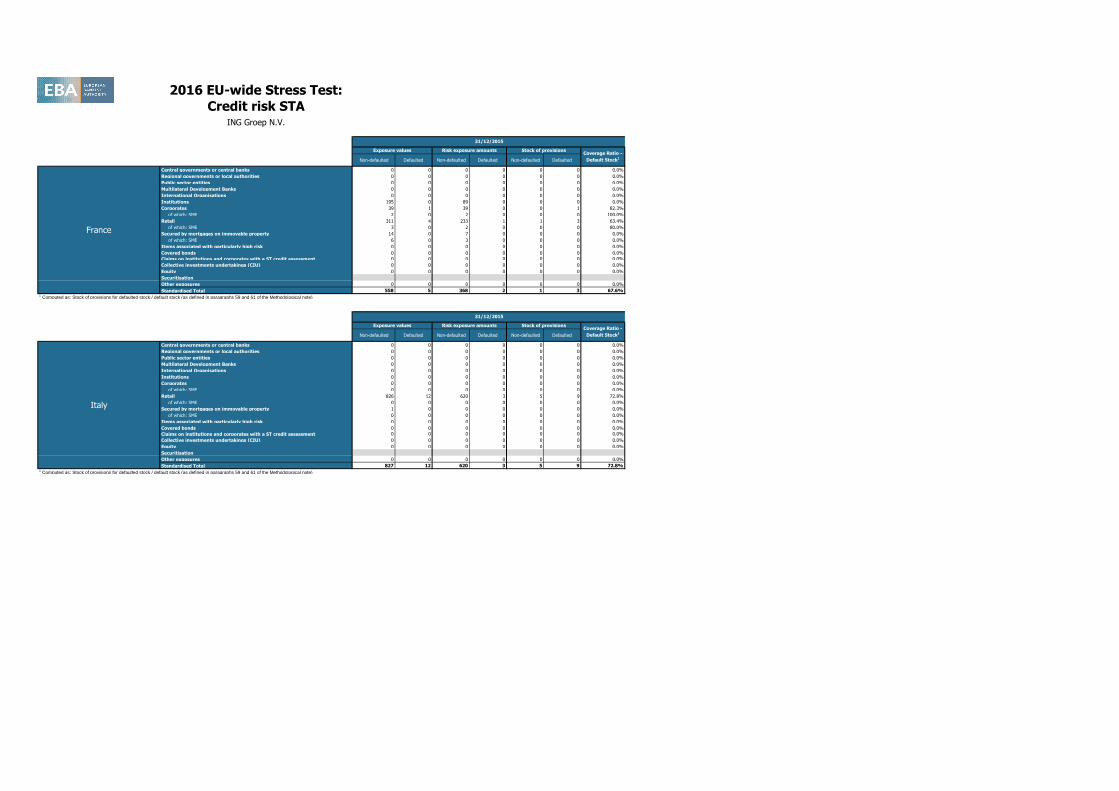
Standardised Total 558 5 368 2 1 3 67.6%1 Computed as: Stock of provisions for defaulted stock / default stock (as defined in paragraphs 59 and 61 of the Methodological note)
Non-defaulted Defaulted Non-defaulted Defaulted Non-defaulted Defaulted
Central governments or central banks 0 0 0 0 0 0 0.0%
Regional governments or local authorities 0 0 0 0 0 0 0.0%
Public sector entities 0 0 0 0 0 0 0.0%
Multilateral Development Banks 0 0 0 0 0 0 0.0%
International Organisations 0 0 0 0 0 0 0.0%
Institutions 0 0 0 0 0 0 0.0%
Corporates 0 0 0 0 0 0 0.0%
of which: SME 0 0 0 0 0 0 0.0%
Retail 826 12 620 3 5 9 72.8%
of which: SME 0 0 0 0 0 0 0.0%
Secured by mortgages on immovable property 1 0 0 0 0 0 0.0%
of which: SME 0 0 0 0 0 0 0.0%
Items associated with particularly high risk 0 0 0 0 0 0 0.0%
Covered bonds 0 0 0 0 0 0 0.0%
Claims on institutions and corporates with a ST credit assessment 0 0 0 0 0 0 0.0%
Collective investments undertakings (CIU) 0 0 0 0 0 0 0.0%
Equity 0 0 0 0 0 0 0.0%
Securitisation
Other exposures 0 0 0 0 0 0 0.0%
Standardised Total 827 12 620 3 5 9 72.8%1 Computed as: Stock of provisions for defaulted stock / default stock (as defined in paragraphs 59 and 61 of the Methodological note)
Italy
Exposure values Risk exposure amounts Stock of provisionsCoverage Ratio -
Default Stock1
France
31/12/2015
Exposure values Risk exposure amounts Stock of provisionsCoverage Ratio -
Default Stock1
31/12/2015

2016 EU-wide Stress Test:
Credit risk STAING Groep N.V.
Central governments or central banks
Regional governments or local authorities
Public sector entities
Multilateral Development Banks
International Organisations
Institutions
Corporates
of which: SME
Retail
of which: SME
Secured by mortgages on immovable property
of which: SME
Items associated with particularly high risk
Covered bonds
Claims on institutions and corporates with a ST credit assessment
Collective investments undertakings (CIU)
Equity
Securitisation
Other exposures
Standardised Total1 Computed as: Stock of provisions for defaulted stock / default stock (as defined in paragraphs 59 and 61 of the Methodological note)
Germany
Netherlands
ING Groep N.V.
Impairment
rate
Stock of
Provisions
Coverage Ratio -
Default Stock1
Impairment
rate
Stock of
Provisions
Coverage Ratio -
Default Stock1
Impairment
rate
Stock of
Provisions
Coverage Ratio -
Default Stock1
Impairment
rate
Stock of
Provisions
Coverage Ratio -
Default Stock1
Impairment
rate
Stock of
Provisions
Coverage Ratio -
Default Stock1
Impairment
rate
Stock of
Provisions
Coverage Ratio -
Default Stock1
0.0% 1 39.8% 0.0% 1 39.8% 0.0% 1 39.8% 0.0% 1 39.5% 0.0% 1 39.5% 0.0% 1 39.5%
0.0% 0 15.5% 0.1% 0 15.5% 0.1% 0 15.5% 0.0% 0 15.9% 0.1% 0 16.1% 0.1% 0 16.1%
- 0 - - 0 - - 0 - - 0 - - 0 - - 0 -
- 0 - - 0 - - 0 - - 0 - - 0 - - 0 -
- 0 - - 0 - - 0 - - 0 - - 0 - - 0 -
0.0% 2 22.6% 0.0% 3 23.7% 0.0% 5 24.5% 0.1% 3 26.1% 0.1% 5 28.2% 0.1% 7 29.4%
0.4% 77 40.1% 0.5% 110 37.4% 0.5% 144 36.3% 0.8% 109 44.6% 0.9% 179 43.8% 1.0% 243 44.2%
0.4% 24 41.5% 0.4% 32 37.7% 0.5% 41 36.1% 0.8% 35 44.1% 1.0% 55 42.1% 1.0% 73 42.6%
1.6% 538 52.0% 1.7% 708 53.0% 1.5% 855 52.9% 2.3% 614 54.2% 2.8% 908 57.2% 2.4% 1,148 58.0%
0.9% 111 61.5% 1.0% 140 58.2% 1.1% 171 56.6% 2.2% 154 65.7% 2.6% 234 67.1% 2.3% 299 67.6%
0.2% 113 37.7% 0.2% 135 33.2% 0.2% 157 30.5% 0.4% 144 42.3% 0.5% 208 41.8% 0.5% 266 40.7%
0.4% 32 30.0% 0.5% 41 27.4% 0.5% 50 26.0% 1.1% 50 40.4% 1.2% 80 43.5% 1.1% 102 43.3%
- 0 - - 0 - - 0 - - 0 - - 0 - - 0 -
- 0 - - 0 - - 0 - - 0 - - 0 - - 0 -
- 0 - - 0 - - 0 - - 0 - - 0 - - 0 -
- 0 - - 0 - - 0 - - 0 - - 0 - - 0 -
- 0 - - 0 - - 0 - - 0 - - 0 - - 0 -
- 0 - - 0 - - 0 - - 0 - - 0 - - 0 -
0.7% 731 47.5% 0.7% 956 46.6% 0.6% 1,162 45.5% 1.0% 870 50.3% 1.2% 1,300 51.7% 1.1% 1,665 51.8%
Impairment
rate
Stock of
Provisions
Coverage Ratio -
Default Stock1
Impairment
rate
Stock of
Provisions
Coverage Ratio -
Default Stock1
Impairment
rate
Stock of
Provisions
Coverage Ratio -
Default Stock1
Impairment
rate
Stock of
Provisions
Coverage Ratio -
Default Stock1
Impairment
rate
Stock of
Provisions
Coverage Ratio -
Default Stock1
Impairment
rate
Stock of
Provisions
Coverage Ratio -
Default Stock1
- 0 - - 0 - - 0 - - 0 - - 0 - - 0 -
- 0 - - 0 - - 0 - - 0 - - 0 - - 0 -
- 0 - - 0 - - 0 - - 0 - - 0 - - 0 -
- 0 - - 0 - - 0 - - 0 - - 0 - - 0 -
- 0 - - 0 - - 0 - - 0 - - 0 - - 0 -
0.0% 1 25.0% 0.0% 2 25.0% 0.0% 3 25.1% 0.0% 1 25.1% 0.0% 2 25.1% 0.0% 3 25.2%
0.3% 1 24.1% 0.3% 1 21.9% 0.2% 1 20.5% 0.6% 1 27.4% 0.8% 2 28.7% 0.6% 2 29.0%
0.1% 0 11.3% 0.2% 0 12.3% 0.2% 0 13.3% 0.2% 0 14.9% 0.6% 0 23.9% 0.7% 0 29.4%
0.3% 1 42.7% 0.3% 1 44.4% 0.3% 2 45.7% 0.3% 1 40.0% 0.6% 2 46.1% 0.8% 2 49.6%
0.4% 0 8.1% 0.5% 0 8.2% 0.5% 0 8.3% 0.9% 0 11.1% 1.5% 0 15.0% 1.6% 0 17.5%
0.0% 0 38.5% 0.0% 0 37.3% 0.0% 0 36.3% 0.0% 0 38.1% 0.0% 0 40.4% 0.0% 0 45.0%
- 0 - - 0 - - 0 - - 0 - - 0 - - 0 -
- 0 - - 0 - - 0 - - 0 - - 0 - - 0 -
- 0 - - 0 - - 0 - - 0 - - 0 - - 0 -
- 0 - - 0 - - 0 - - 0 - - 0 - - 0 -
- 0 - - 0 - - 0 - - 0 - - 0 - - 0 -
- 0 - - 0 - - 0 - - 0 - - 0 - - 0 -
- 0 - - 0 - - 0 - - 0 - - 0 - - 0 -0.0% 3 26.0% 0.0% 4 25.6% 0.0% 5 25.5% 0.0% 3 27.4% 0.1% 5 29.0% 0.1% 7 29.7%
Impairment
rate
Stock of
Provisions
Coverage Ratio -
Default Stock1
Impairment
rate
Stock of
Provisions
Coverage Ratio -
Default Stock1
Impairment
rate
Stock of
Provisions
Coverage Ratio -
Default Stock1
Impairment
rate
Stock of
Provisions
Coverage Ratio -
Default Stock1
Impairment
rate
Stock of
Provisions
Coverage Ratio -
Default Stock1
Impairment
rate
Stock of
Provisions
Coverage Ratio -
Default Stock1
- 0 - - 0 - - 0 - - 0 - - 0 - - 0 -
- 0 - - 0 - - 0 - - 0 - - 0 - - 0 -
- 0 - - 0 - - 0 - - 0 - - 0 - - 0 -
- 0 - - 0 - - 0 - - 0 - - 0 - - 0 -
- 0 - - 0 - - 0 - - 0 - - 0 - - 0 -
0.0% 0 30.0% 0.0% 0 30.0% 0.0% 0 30.0% 0.0% 0 34.1% 0.0% 0 36.9% 0.0% 0 36.9%
0.0% 1 43.5% 0.0% 1 32.3% 0.0% 1 25.2% 0.0% 1 41.1% 0.0% 1 30.9% 0.1% 1 24.4%
- 0 - - 0 - - 0 - - 0 - - 0 - - 0 -
0.2% 1 55.3% 0.3% 1 44.6% 0.3% 2 39.7% 0.6% 1 41.1% 1.1% 3 34.5% 0.9% 4 32.9%
0.1% 0 66.9% 0.1% 0 66.9% 0.1% 0 66.9% 0.3% 0 71.6% 0.4% 0 73.6% 0.2% 0 74.0%
0.1% 0 9.2% 0.1% 0 9.3% 0.1% 0 9.3% 0.2% 0 12.0% 0.3% 0 14.1% 0.2% 0 14.2%
0.2% 0 8.6% 0.2% 0 8.6% 0.2% 0 8.6% 0.3% 0 11.2% 0.5% 0 13.9% 0.4% 0 13.8%
- 0 - - 0 - - 0 - - 0 - - 0 - - 0 -
- 0 - - 0 - - 0 - - 0 - - 0 - - 0 -
- 0 - - 0 - - 0 - - 0 - - 0 - - 0 -
- 0 - - 0 - - 0 - - 0 - - 0 - - 0 -
- 0 - - 0 - - 0 - - 0 - - 0 - - 0 -
- 0 - - 0 - - 0 - - 0 - - 0 - - 0 -
0.1% 2 47.5% 0.1% 2 37.1% 0.1% 3 31.4% 0.3% 3 41.0% 0.5% 4 33.1% 0.4% 5 29.9%
31/12/2018 31/12/2016 31/12/2017 31/12/201831/12/2016 31/12/2017
Baseline Scenario Adverse Scenario
Baseline Scenario Adverse Scenario
31/12/2016 31/12/2017 31/12/2018
31/12/2018
31/12/2016 31/12/2017 31/12/2018
Baseline Scenario Adverse Scenario
31/12/2016 31/12/2017 31/12/2018 31/12/2016 31/12/2017

2016 EU-wide Stress Test:
Credit risk STAING Groep N.V.
Central governments or central banks
Regional governments or local authorities
Public sector entities
Multilateral Development Banks
International Organisations
Institutions
Corporates
of which: SME
Retail
of which: SME
Secured by mortgages on immovable property
of which: SME
Items associated with particularly high risk
Covered bonds
Claims on institutions and corporates with a ST credit assessment
Collective investments undertakings (CIU)
Equity
Securitisation
Other exposures
Standardised Total1 Computed as: Stock of provisions for defaulted stock / default stock (as defined in paragraphs 59 and 61 of the Methodological note)
Central governments or central banks
Regional governments or local authorities
Public sector entities
Multilateral Development Banks
International Organisations
Institutions
Corporates
of which: SME
Retail
of which: SME
Secured by mortgages on immovable property
of which: SME
Items associated with particularly high risk
Covered bonds
Claims on institutions and corporates with a ST credit assessment
Collective investments undertakings (CIU)
Equity
Securitisation
Other exposures
Standardised Total1 Computed as: Stock of provisions for defaulted stock / default stock (as defined in paragraphs 59 and 61 of the Methodological note)
Central governments or central banks
Regional governments or local authorities
Public sector entities
Multilateral Development Banks
International Organisations
Institutions
Corporates
of which: SME
Retail
of which: SME
Secured by mortgages on immovable property
of which: SME
Items associated with particularly high risk
Covered bonds
Claims on institutions and corporates with a ST credit assessment
Collective investments undertakings (CIU)
Equity
Securitisation
Other exposures
Standardised Total1 Computed as: Stock of provisions for defaulted stock / default stock (as defined in paragraphs 59 and 61 of the Methodological note)
Australia
United States
Belgium
Impairment
rate
Stock of
Provisions
Coverage Ratio -
Default Stock1
Impairment
rate
Stock of
Provisions
Coverage Ratio -
Default Stock1
Impairment
rate
Stock of
Provisions
Coverage Ratio -
Default Stock1
Impairment
rate
Stock of
Provisions
Coverage Ratio -
Default Stock1
Impairment
rate
Stock of
Provisions
Coverage Ratio -
Default Stock1
Impairment
rate
Stock of
Provisions
Coverage Ratio -
Default Stock1
- 0 - - 0 - - 0 - - 0 - - 0 - - 0 -
0.0% 0 5.6% 0.0% 0 5.5% 0.0% 0 5.4% 0.0% 0 8.8% 0.0% 0 12.6% 0.1% 0 13.5%
- 0 - - 0 - - 0 - - 0 - - 0 - - 0 -
- 0 - - 0 - - 0 - - 0 - - 0 - - 0 -
- 0 - - 0 - - 0 - - 0 - - 0 - - 0 -
0.1% 0 14.1% 0.1% 0 13.9% 0.1% 0 13.8% 0.3% 0 15.1% 0.8% 0 19.2% 0.5% 0 20.3%
0.1% 1 4.8% 0.1% 2 5.2% 0.1% 3 5.3% 0.4% 3 8.0% 0.9% 9 11.7% 0.6% 12 12.7%
0.1% 0 3.1% 0.1% 1 3.6% 0.1% 1 3.8% 0.4% 1 6.4% 1.0% 3 10.2% 0.6% 4 11.0%
0.0% 39 25.3% 0.0% 39 25.2% 0.0% 39 25.2% 0.1% 39 25.3% 0.2% 39 25.1% 0.2% 39 25.0%
0.1% 0 5.2% 0.1% 0 5.3% 0.2% 0 5.5% 0.5% 0 8.3% 1.3% 0 12.2% 0.8% 0 13.2%
0.2% 0 18.9% 0.2% 0 18.4% 0.2% 0 18.2% 0.3% 0 19.4% 0.7% 0 21.6% 1.1% 0 24.2%
- 0 - - 0 - - 0 - - 0 - - 0 - - 0 -
- 0 - - 0 - - 0 - - 0 - - 0 - - 0 -
- 0 - - 0 - - 0 - - 0 - - 0 - - 0 -
- 0 - - 0 - - 0 - - 0 - - 0 - - 0 -
- 0 - - 0 - - 0 - - 0 - - 0 - - 0 -
- 0 - - 0 - - 0 - - 0 - - 0 - - 0 -
- 0 - - 0 - - 0 - - 0 - - 0 - - 0 -
0.1% 40 23.2% 0.1% 41 22.0% 0.1% 41 20.9% 0.4% 42 22.3% 0.8% 48 20.9% 0.6% 51 20.4%
Impairment
rate
Stock of
Provisions
Coverage Ratio -
Default Stock1
Impairment
rate
Stock of
Provisions
Coverage Ratio -
Default Stock1
Impairment
rate
Stock of
Provisions
Coverage Ratio -
Default Stock1
Impairment
rate
Stock of
Provisions
Coverage Ratio -
Default Stock1
Impairment
rate
Stock of
Provisions
Coverage Ratio -
Default Stock1
Impairment
rate
Stock of
Provisions
Coverage Ratio -
Default Stock1
- 0 - - 0 - - 0 - - 0 - - 0 - - 0 -
- 0 - - 0 - - 0 - - 0 - - 0 - - 0 -
- 0 - - 0 - - 0 - - 0 - - 0 - - 0 -
- 0 - - 0 - - 0 - - 0 - - 0 - - 0 -
- 0 - - 0 - - 0 - - 0 - - 0 - - 0 -
0.0% 0 30.0% 0.0% 0 30.0% 0.0% 0 30.0% 0.0% 0 33.0% 0.0% 0 36.2% 0.0% 0 36.7%
- 0 - - 0 - - 0 - - 0 - - 0 - - 0 -
- 0 - - 0 - - 0 - - 0 - - 0 - - 0 -
1.3% 0 53.9% 1.5% 0 54.1% 1.6% 0 53.9% 1.4% 0 54.7% 2.1% 0 56.7% 2.0% 0 56.4%
1.3% 0 55.0% 1.6% 0 55.0% 1.8% 0 55.0% 1.4% 0 56.8% 2.5% 0 60.4% 2.3% 0 60.0%
0.1% 0 15.1% 0.1% 0 14.9% 0.1% 0 14.7% 0.1% 0 15.8% 0.1% 0 16.9% 0.2% 0 18.0%
- 0 - - 0 - - 0 - - 0 - - 0 - - 0 -
- 0 - - 0 - - 0 - - 0 - - 0 - - 0 -
- 0 - - 0 - - 0 - - 0 - - 0 - - 0 -
- 0 - - 0 - - 0 - - 0 - - 0 - - 0 -
- 0 - - 0 - - 0 - - 0 - - 0 - - 0 -
- 0 - - 0 - - 0 - - 0 - - 0 - - 0 -
- 0 - - 0 - - 0 - - 0 - - 0 - - 0 -
0.1% 0 42.6% 0.1% 0 42.7% 0.1% 0 42.5% 0.1% 0 44.6% 0.1% 0 47.1% 0.1% 0 46.8%
Impairment
rate
Stock of
Provisions
Coverage Ratio -
Default Stock1
Impairment
rate
Stock of
Provisions
Coverage Ratio -
Default Stock1
Impairment
rate
Stock of
Provisions
Coverage Ratio -
Default Stock1
Impairment
rate
Stock of
Provisions
Coverage Ratio -
Default Stock1
Impairment
rate
Stock of
Provisions
Coverage Ratio -
Default Stock1
Impairment
rate
Stock of
Provisions
Coverage Ratio -
Default Stock1
- 0 - - 0 - - 0 - - 0 - - 0 - - 0 -
- 0 - - 0 - - 0 - - 0 - - 0 - - 0 -
- 0 - - 0 - - 0 - - 0 - - 0 - - 0 -
- 0 - - 0 - - 0 - - 0 - - 0 - - 0 -
- 0 - - 0 - - 0 - - 0 - - 0 - - 0 -
0.0% 0 30.0% 0.0% 0 30.0% 0.0% 0 30.0% 0.0% 0 34.0% 0.0% 0 37.0% 0.0% 0 38.6%
- 0 - - 0 - - 0 - - 0 - - 0 - - 0 -
- 0 - - 0 - - 0 - - 0 - - 0 - - 0 -
- 0 59.3% - 0 59.8% - 0 60.2% - 0 4.4% - 0 10.0% - 0 13.6%
- 0 59.3% - 0 59.8% - 0 60.2% - 0 4.4% - 0 10.0% - 0 13.6%
0.2% 13 43.3% 0.2% 15 35.2% 0.2% 19 30.8% 0.4% 16 40.1% 0.6% 25 36.3% 0.7% 36 35.9%
0.1% 0 16.9% 0.2% 0 19.8% 0.2% 0 20.7% 0.3% 0 20.7% 0.6% 0 27.3% 0.6% 0 30.9%
- 0 - - 0 - - 0 - - 0 - - 0 - - 0 -
- 0 - - 0 - - 0 - - 0 - - 0 - - 0 -
- 0 - - 0 - - 0 - - 0 - - 0 - - 0 -
- 0 - - 0 - - 0 - - 0 - - 0 - - 0 -
- 0 - - 0 - - 0 - - 0 - - 0 - - 0 -
- 0 - - 0 - - 0 - - 0 - - 0 - - 0 -
0.1% 13 43.3% 0.2% 15 35.2% 0.2% 19 30.8% 0.3% 16 40.1% 0.6% 25 36.2% 0.7% 36 35.9%
31/12/2018 31/12/2016 31/12/2017 31/12/201831/12/2016 31/12/2017
31/12/2018 31/12/2016 31/12/2017 31/12/2018
Baseline Scenario Adverse Scenario
31/12/2016 31/12/2017
31/12/2018 31/12/2016 31/12/2017 31/12/2018
Baseline Scenario Adverse Scenario
31/12/2016 31/12/2017
Baseline Scenario Adverse Scenario

2016 EU-wide Stress Test:
Credit risk STAING Groep N.V.
Central governments or central banks
Regional governments or local authorities
Public sector entities
Multilateral Development Banks
International Organisations
Institutions
Corporates
of which: SME
Retail
of which: SME
Secured by mortgages on immovable property
of which: SME
Items associated with particularly high risk
Covered bonds
Claims on institutions and corporates with a ST credit assessment
Collective investments undertakings (CIU)
Equity
Securitisation
Other exposures
Standardised Total1 Computed as: Stock of provisions for defaulted stock / default stock (as defined in paragraphs 59 and 61 of the Methodological note)
Central governments or central banks
Regional governments or local authorities
Public sector entities
Multilateral Development Banks
International Organisations
Institutions
Corporates
of which: SME
Retail
of which: SME
Secured by mortgages on immovable property
of which: SME
Items associated with particularly high risk
Covered bonds
Claims on institutions and corporates with a ST credit assessment
Collective investments undertakings (CIU)
Equity
Securitisation
Other exposures
Standardised Total1 Computed as: Stock of provisions for defaulted stock / default stock (as defined in paragraphs 59 and 61 of the Methodological note)
Central governments or central banks
Regional governments or local authorities
Public sector entities
Multilateral Development Banks
International Organisations
Institutions
Corporates
of which: SME
Retail
of which: SME
Secured by mortgages on immovable property
of which: SME
Items associated with particularly high risk
Covered bonds
Claims on institutions and corporates with a ST credit assessment
Collective investments undertakings (CIU)
Equity
Securitisation
Other exposures
Standardised Total1 Computed as: Stock of provisions for defaulted stock / default stock (as defined in paragraphs 59 and 61 of the Methodological note)
Poland
Spain
United Kingdom
Impairment
rate
Stock of
Provisions
Coverage Ratio -
Default Stock1
Impairment
rate
Stock of
Provisions
Coverage Ratio -
Default Stock1
Impairment
rate
Stock of
Provisions
Coverage Ratio -
Default Stock1
Impairment
rate
Stock of
Provisions
Coverage Ratio -
Default Stock1
Impairment
rate
Stock of
Provisions
Coverage Ratio -
Default Stock1
Impairment
rate
Stock of
Provisions
Coverage Ratio -
Default Stock1
- 0 - - 0 - - 0 - - 0 - - 0 - - 0 -
0.0% 0 47.8% 0.1% 0 47.8% 0.1% 0 47.7% 0.1% 0 51.9% 0.1% 0 54.5% 0.1% 0 55.6%
- 0 - - 0 - - 0 - - 0 - - 0 - - 0 -
- 0 - - 0 - - 0 - - 0 - - 0 - - 0 -
- 0 - - 0 - - 0 - - 0 - - 0 - - 0 -
0.1% 0 36.4% 0.1% 0 36.5% 0.1% 0 36.5% 0.1% 0 42.1% 0.2% 0 46.3% 0.2% 0 48.0%
0.0% 0 4.8% 0.0% 0 4.9% 0.0% 0 4.9% 0.1% 0 9.9% 0.2% 0 12.1% 0.2% 0 13.0%
0.1% 0 23.2% 0.2% 0 23.1% 0.2% 0 23.1% 1.0% 0 23.8% 1.1% 0 27.7% 0.7% 0 30.2%
0.1% 0 16.3% 0.1% 0 15.8% 0.1% 0 15.6% 0.9% 1 18.6% 0.9% 2 22.1% 0.5% 3 24.2%
0.1% 0 16.2% 0.1% 0 15.7% 0.1% 0 15.5% 0.9% 1 18.6% 0.9% 2 22.1% 0.5% 3 24.2%
0.1% 0 24.6% 0.1% 0 24.2% 0.2% 0 24.2% 0.4% 0 27.4% 0.4% 0 28.6% 0.3% 0 29.1%
- 0 - - 0 - - 0 - - 0 - - 0 - - 0 -
- 0 - - 0 - - 0 - - 0 - - 0 - - 0 -
- 0 - - 0 - - 0 - - 0 - - 0 - - 0 -
- 0 - - 0 - - 0 - - 0 - - 0 - - 0 -
- 0 - - 0 - - 0 - - 0 - - 0 - - 0 -
- 0 - - 0 - - 0 - - 0 - - 0 - - 0 -
- 0 - - 0 - - 0 - - 0 - - 0 - - 0 -
0.1% 0 13.0% 0.1% 0 12.6% 0.1% 0 12.4% 0.6% 1 17.6% 0.6% 2 20.9% 0.4% 3 22.6%
Impairment
rate
Stock of
Provisions
Coverage Ratio -
Default Stock1
Impairment
rate
Stock of
Provisions
Coverage Ratio -
Default Stock1
Impairment
rate
Stock of
Provisions
Coverage Ratio -
Default Stock1
Impairment
rate
Stock of
Provisions
Coverage Ratio -
Default Stock1
Impairment
rate
Stock of
Provisions
Coverage Ratio -
Default Stock1
Impairment
rate
Stock of
Provisions
Coverage Ratio -
Default Stock1
- 0 - - 0 - - 0 - - 0 - - 0 - - 0 -
- 0 - - 0 - - 0 - - 0 - - 0 - - 0 -
- 0 - - 0 - - 0 - - 0 - - 0 - - 0 -
- 0 - - 0 - - 0 - - 0 - - 0 - - 0 -
- 0 - - 0 - - 0 - - 0 - - 0 - - 0 -
- 0 - - 0 - - 0 - - 0 - - 0 - - 0 -
0.1% 0 16.7% 0.1% 0 16.8% 0.1% 0 17.0% 0.1% 0 18.4% 0.2% 0 22.0% 0.2% 0 23.9%
- 0 - - 0 - - 0 - - 0 - - 0 - - 0 -
4.7% 122 83.5% 4.7% 184 82.9% 2.7% 217 82.7% 5.4% 133 83.6% 6.1% 213 83.0% 4.0% 261 82.8%
0.3% 0 22.1% 0.4% 0 22.1% 0.4% 0 22.1% 0.3% 0 22.1% 0.4% 0 22.1% 0.5% 0 22.1%
0.0% 0 0.1% 0.0% 0 0.1% 0.0% 0 0.1% 0.0% 0 0.1% 0.0% 0 0.1% 0.0% 0 0.1%
0.0% 0 0.1% 0.0% 0 0.1% 0.0% 0 0.1% 0.0% 0 0.1% 0.0% 0 0.1% 0.0% 0 0.1%
- 0 - - 0 - - 0 - - 0 - - 0 - - 0 -
- 0 - - 0 - - 0 - - 0 - - 0 - - 0 -
- 0 - - 0 - - 0 - - 0 - - 0 - - 0 -
- 0 - - 0 - - 0 - - 0 - - 0 - - 0 -
- 0 - - 0 - - 0 - - 0 - - 0 - - 0 -
- 0 - - 0 - - 0 - - 0 - - 0 - - 0 -
4.6% 123 83.4% 4.5% 184 82.8% 2.6% 217 82.4% 5.3% 133 83.4% 5.9% 213 82.8% 3.9% 261 82.5%
Impairment
rate
Stock of
Provisions
Coverage Ratio -
Default Stock1
Impairment
rate
Stock of
Provisions
Coverage Ratio -
Default Stock1
Impairment
rate
Stock of
Provisions
Coverage Ratio -
Default Stock1
Impairment
rate
Stock of
Provisions
Coverage Ratio -
Default Stock1
Impairment
rate
Stock of
Provisions
Coverage Ratio -
Default Stock1
Impairment
rate
Stock of
Provisions
Coverage Ratio -
Default Stock1
- 0 - - 0 - - 0 - - 0 - - 0 - - 0 -
0.0% 0 16.6% 0.0% 0 16.6% 0.0% 0 16.6% 0.0% 0 16.9% 0.0% 0 17.4% 0.0% 0 17.7%
- 0 - - 0 - - 0 - - 0 - - 0 - - 0 -
- 0 - - 0 - - 0 - - 0 - - 0 - - 0 -
- 0 - - 0 - - 0 - - 0 - - 0 - - 0 -
0.0% 0 13.3% 0.0% 0 13.2% 0.0% 0 13.1% 0.0% 0 8.6% 0.1% 0 11.0% 0.1% 0 16.1%
0.2% 1 9.0% 0.2% 2 9.1% 0.2% 3 9.5% 0.4% 3 11.0% 0.8% 8 15.8% 0.9% 15 20.7%
0.2% 0 6.9% 0.2% 1 6.9% 0.2% 1 7.0% 0.6% 1 9.6% 1.2% 3 13.9% 1.2% 5 18.4%
1.4% 105 74.1% 1.5% 132 72.0% 1.6% 161 71.1% 2.9% 132 73.1% 4.7% 218 73.7% 4.0% 289 75.4%
1.3% 44 71.2% 1.5% 55 68.2% 1.7% 68 67.2% 4.1% 66 70.2% 5.8% 110 71.7% 4.7% 144 74.3%
0.2% 46 58.9% 0.1% 54 55.9% 0.1% 60 53.9% 0.3% 51 58.3% 0.3% 69 56.4% 0.4% 87 55.8%
0.9% 2 36.5% 1.1% 3 36.9% 1.2% 4 37.2% 3.1% 4 41.0% 4.9% 8 48.6% 4.4% 12 55.9%
- 0 - - 0 - - 0 - - 0 - - 0 - - 0 -
- 0 - - 0 - - 0 - - 0 - - 0 - - 0 -
- 0 - - 0 - - 0 - - 0 - - 0 - - 0 -
- 0 - - 0 - - 0 - - 0 - - 0 - - 0 -
- 0 - - 0 - - 0 - - 0 - - 0 - - 0 -
- 0 - - 0 - - 0 - - 0 - - 0 - - 0 -
0.5% 153 65.2% 0.5% 188 61.7% 0.5% 225 60.0% 0.9% 186 62.9% 1.5% 295 62.5% 1.3% 392 63.7%
31/12/2018 31/12/2016 31/12/2017 31/12/201831/12/2016 31/12/2017
31/12/2018 31/12/2016 31/12/2017 31/12/2018
Baseline Scenario Adverse Scenario
31/12/2016 31/12/2017
31/12/2018 31/12/2016 31/12/2017 31/12/2018
Baseline Scenario Adverse Scenario
31/12/2016 31/12/2017
Baseline Scenario Adverse Scenario

2016 EU-wide Stress Test:
Credit risk STAING Groep N.V.
Central governments or central banks
Regional governments or local authorities
Public sector entities
Multilateral Development Banks
International Organisations
Institutions
Corporates
of which: SME
Retail
of which: SME
Secured by mortgages on immovable property
of which: SME
Items associated with particularly high risk
Covered bonds
Claims on institutions and corporates with a ST credit assessment
Collective investments undertakings (CIU)
Equity
Securitisation
Other exposures
Standardised Total1 Computed as: Stock of provisions for defaulted stock / default stock (as defined in paragraphs 59 and 61 of the Methodological note)
Central governments or central banks
Regional governments or local authorities
Public sector entities
Multilateral Development Banks
International Organisations
Institutions
Corporates
of which: SME
Retail
of which: SME
Secured by mortgages on immovable property
of which: SME
Items associated with particularly high risk
Covered bonds
Claims on institutions and corporates with a ST credit assessment
Collective investments undertakings (CIU)
Equity
Securitisation
Other exposures
Standardised Total1 Computed as: Stock of provisions for defaulted stock / default stock (as defined in paragraphs 59 and 61 of the Methodological note)
Italy
France
Impairment
rate
Stock of
Provisions
Coverage Ratio -
Default Stock1
Impairment
rate
Stock of
Provisions
Coverage Ratio -
Default Stock1
Impairment
rate
Stock of
Provisions
Coverage Ratio -
Default Stock1
Impairment
rate
Stock of
Provisions
Coverage Ratio -
Default Stock1
Impairment
rate
Stock of
Provisions
Coverage Ratio -
Default Stock1
Impairment
rate
Stock of
Provisions
Coverage Ratio -
Default Stock1
- 0 - - 0 - - 0 - - 0 - - 0 - - 0 -
- 0 - - 0 - - 0 - - 0 - - 0 - - 0 -
- 0 - - 0 - - 0 - - 0 - - 0 - - 0 -
- 0 - - 0 - - 0 - - 0 - - 0 - - 0 -
- 0 - - 0 - - 0 - - 0 - - 0 - - 0 -
0.0% 0 0.2% 0.0% 0 0.2% 0.0% 0 0.2% 0.0% 0 0.2% 0.0% 0 0.2% 0.0% 0 0.3%
0.1% 1 41.7% 0.2% 1 30.0% 0.2% 1 24.5% 0.2% 1 39.1% 0.3% 1 29.9% 0.3% 1 26.0%
0.2% 0 9.3% 0.2% 0 6.2% 0.1% 0 5.2% 0.3% 0 8.2% 0.3% 0 6.3% 0.3% 0 5.7%
0.3% 5 55.9% 0.5% 7 52.3% 0.5% 9 50.5% 0.3% 5 55.3% 0.5% 7 51.6% 0.6% 9 50.0%
0.1% 0 51.8% 0.1% 0 39.1% 0.1% 0 32.0% 0.2% 0 50.7% 0.2% 0 38.2% 0.2% 0 31.7%
0.0% 0 0.6% 0.0% 0 1.5% 0.0% 0 1.8% 0.0% 0 0.6% 0.0% 0 2.4% 0.0% 0 3.8%
0.0% 0 0.8% 0.0% 0 2.4% 0.0% 0 3.0% 0.0% 0 0.8% 0.0% 0 3.8% 0.0% 0 6.4%
- 0 - - 0 - - 0 - - 0 - - 0 - - 0 -
- 0 - - 0 - - 0 - - 0 - - 0 - - 0 -
- 0 - - 0 - - 0 - - 0 - - 0 - - 0 -
- 0 - - 0 - - 0 - - 0 - - 0 - - 0 -
- 0 - - 0 - - 0 - - 0 - - 0 - - 0 -
- 0 - - 0 - - 0 - - 0 - - 0 - - 0 -
0.3% 6 45.1% 0.4% 8 39.5% 0.5% 10 37.6% 0.3% 6 42.7% 0.4% 8 37.7% 0.6% 11 36.9%
Impairment
rate
Stock of
Provisions
Coverage Ratio -
Default Stock1
Impairment
rate
Stock of
Provisions
Coverage Ratio -
Default Stock1
Impairment
rate
Stock of
Provisions
Coverage Ratio -
Default Stock1
Impairment
rate
Stock of
Provisions
Coverage Ratio -
Default Stock1
Impairment
rate
Stock of
Provisions
Coverage Ratio -
Default Stock1
Impairment
rate
Stock of
Provisions
Coverage Ratio -
Default Stock1
- 0 - - 0 - - 0 - - 0 - - 0 - - 0 -
- 0 - - 0 - - 0 - - 0 - - 0 - - 0 -
- 0 - - 0 - - 0 - - 0 - - 0 - - 0 -
- 0 - - 0 - - 0 - - 0 - - 0 - - 0 -
- 0 - - 0 - - 0 - - 0 - - 0 - - 0 -
0.2% 0 30.0% 0.3% 0 30.0% 0.3% 0 30.0% 0.4% 0 33.7% 0.5% 0 36.6% 0.5% 0 37.4%
- 0 - - 0 - - 0 - - 0 - - 0 - - 0 -
- 0 - - 0 - - 0 - - 0 - - 0 - - 0 -
1.2% 24 66.5% 1.4% 35 64.5% 1.6% 48 63.5% 1.4% 26 66.3% 1.9% 41 64.7% 2.4% 61 64.3%
- 0 - - 0 - - 0 - - 0 - - 0 - - 0 -
0.0% 0 - 0.0% 0 - 0.0% 0 - 0.0% 0 - 0.0% 0 - 0.0% 0 -
- 0 - - 0 - - 0 - - 0 - - 0 - - 0 -
- 0 - - 0 - - 0 - - 0 - - 0 - - 0 -
- 0 - - 0 - - 0 - - 0 - - 0 - - 0 -
- 0 - - 0 - - 0 - - 0 - - 0 - - 0 -
- 0 - - 0 - - 0 - - 0 - - 0 - - 0 -
- 0 - - 0 - - 0 - - 0 - - 0 - - 0 -
- 0 - - 0 - - 0 - - 0 - - 0 - - 0 -
1.2% 24 66.5% 1.4% 35 64.5% 1.6% 48 63.5% 1.4% 26 66.3% 1.9% 41 64.7% 2.4% 61 64.3%
31/12/2018 31/12/2016 31/12/2017 31/12/201831/12/2016 31/12/2017
31/12/2018 31/12/2016 31/12/2017 31/12/2018
Baseline Scenario Adverse Scenario
31/12/2016 31/12/2017
Baseline Scenario Adverse Scenario
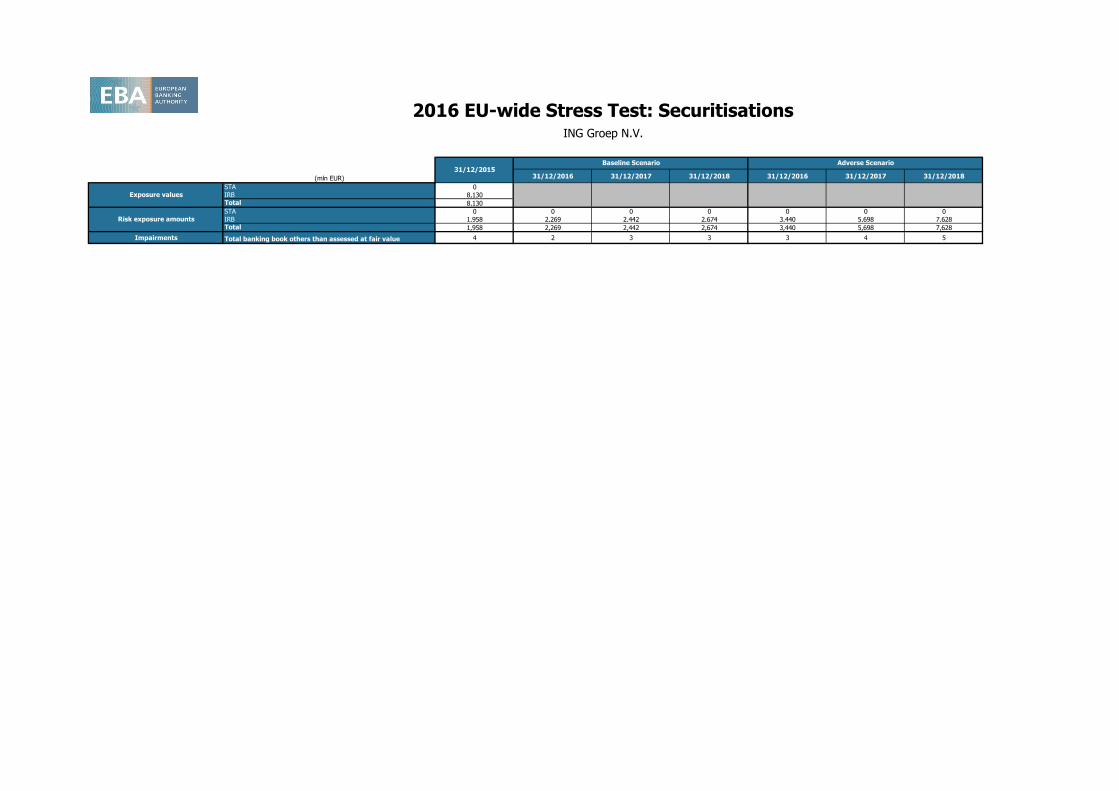
(mln EUR) 31/12/2016 31/12/2017 31/12/2018 31/12/2016 31/12/2017 31/12/2018
STA 0IRB 8,130Total 8,130
STA 0 0 0 0 0 0 0IRB 1,958 2,269 2,442 2,674 3,440 5,698 7,628Total 1,958 2,269 2,442 2,674 3,440 5,698 7,628
Impairments Total banking book others than assessed at fair value 4 2 3 3 3 4 5
2016 EU-wide Stress Test: SecuritisationsING Groep N.V.
Risk exposure amounts
31/12/2015Baseline Scenario Adverse Scenario
Exposure values

2016 EU-wide Stress Test: Sovereign
(mln EUR)
[ 0 - 3M [ 3 3 0 0 3 0 0 0 0 0 0 0 0 0 0
[ 3M - 1Y [ 206 206 206 0 0 0 0 0 0 0 0 0 0 0 0
[ 1Y - 2Y [ 1,000 1,000 425 0 17 559 0 0 0 0 0 14 0 15 0
[ 2Y - 3Y [ 220 219 220 0 -1 0 0 0 0 0 0 0 0 0 0
[3Y - 5Y [ 843 843 839 0 4 0 0 0 0 0 0 0 0 23 -1
[5Y - 10Y [ 2,204 2,201 2,198 0 3 0 0 0 0 0 0 0 0 0 0
[10Y - more 3 2 0 0 2 0 0 0 0 0 0 0 0 0 0Tot 4,479 4,475 3,889 0 28 559 0 0 0 0 0 14 0 38 -1
[ 0 - 3M [ 359 359 284 0 54 0 21 10 0 442 -9 22 0 22 0
[ 3M - 1Y [ 2,466 2,466 1,129 0 538 0 799 34 0 36 -1 9 0 17 0
[ 1Y - 2Y [ 1,648 1,648 1,233 0 103 278 34 276 3 43 0 40 1 44 -1
[ 2Y - 3Y [ 1,170 1,170 825 0 9 295 41 203 12 68 -1 7 0 7 0
[3Y - 5Y [ 1,691 1,673 1,236 0 -11 202 245 136 4 26 0 8 0 8 0
[5Y - 10Y [ 2,780 2,567 1,735 0 -180 171 843 1,147 129 846 -59 133 164 5 0
[10Y - more 3,040 2,953 201 0 27 0 2,726 2,442 348 311 -6 0 0 34 -48Tot 13,153 12,836 6,642 0 541 945 4,708 4,247 496 1,773 -76 220 165 136 -49
[ 0 - 3M [ 35 35 35 0 0 0 0 0 0 0 0 0 0 0 0
[ 3M - 1Y [ 2 2 2 0 0 0 0 0 0 0 0 0 0 0 0
[ 1Y - 2Y [ 14 14 14 0 0 0 0 0 0 0 0 0 0 0 0
[ 2Y - 3Y [ 11 11 11 0 0 0 0 0 0 0 0 0 0 0 0
[3Y - 5Y [ 7 7 7 0 0 0 0 0 0 0 0 0 0 0 0
[5Y - 10Y [ 0 0 0 0 0 0 0 0 0 0 0 0 0 0 0
[10Y - more 0 0 0 0 0 0 0 0 0 0 0 0 0 0 0Tot 69 68 68 0 0 0 0 0 0 0 0 0 0 0 0
[ 0 - 3M [ 0 0 0 0 0 0 0 0 0 0 0 0 0 0 0
[ 3M - 1Y [ 0 0 0 0 0 0 0 0 0 0 0 0 0 0 0
[ 1Y - 2Y [ 0 0 0 0 0 0 0 0 0 0 0 0 0 0 0
[ 2Y - 3Y [ 0 0 0 0 0 0 0 0 0 0 0 0 0 0 0
[3Y - 5Y [ 0 0 0 0 0 0 0 0 0 0 0 0 0 0 0
[5Y - 10Y [ 0 0 0 0 0 0 0 0 0 0 0 0 0 0 0
[10Y - more 0 0 0 0 0 0 0 0 0 0 0 0 0 0 0Tot 0 0 0 0 0 0 0 0 0 0 0 0 0 0 0
[ 0 - 3M [ 0 0 0 0 0 0 0 0 0 0 0 0 0 0 0
[ 3M - 1Y [ 511 511 509 0 3 0 0 0 0 100 0 0 0 0 0
[ 1Y - 2Y [ 141 141 44 0 97 0 0 0 0 0 0 0 0 0 0
[ 2Y - 3Y [ 4 4 0 0 4 0 0 0 0 0 0 0 0 0 0
[3Y - 5Y [ 53 53 47 0 6 0 0 0 0 0 0 0 0 0 0
[5Y - 10Y [ 7 7 0 0 7 0 0 0 0 0 0 0 0 0 0
[10Y - more 3 3 0 0 3 0 0 0 0 0 0 0 0 0 0Tot 719 719 600 0 120 0 0 0 0 100 0 0 0 0 0
[ 0 - 3M [ 0 0 0 0 0 0 0 0 0 0 0 0 0 0 0
[ 3M - 1Y [ 0 0 0 0 0 0 0 0 0 0 0 0 0 0 0
[ 1Y - 2Y [ 0 0 0 0 0 0 0 0 0 0 0 0 0 0 0
[ 2Y - 3Y [ 0 0 0 0 0 0 0 0 0 0 0 0 0 0 0
[3Y - 5Y [ 0 0 0 0 0 0 0 0 0 0 0 0 0 0 0
[5Y - 10Y [ 0 0 0 0 0 0 0 0 0 0 0 0 0 0 0
[10Y - more 0 0 0 0 0 0 0 0 0 0 0 0 0 0 0Tot 0 0 0 0 0 0 0 0 0 0 0 0 0 0 0
[ 0 - 3M [ 0 0 0 0 0 0 0 0 0 0 0 0 0 0 0
[ 3M - 1Y [ 0 0 0 0 0 0 0 0 0 0 0 0 0 0 0
[ 1Y - 2Y [ 0 0 0 0 0 0 0 0 0 0 0 0 0 0 0
[ 2Y - 3Y [ 0 0 0 0 0 0 0 0 0 0 0 0 0 0 0
[3Y - 5Y [ 0 0 0 0 0 0 0 0 0 0 0 0 0 0 0
[5Y - 10Y [ 0 0 0 0 0 0 0 0 0 0 0 0 0 0 0
[10Y - more 0 0 0 0 0 0 0 0 0 0 0 0 0 0 0Tot 0 0 0 0 0 0 0 0 0 0 0 0 0 0 0
ING Groep N.V.
31/12/2015
Residual Maturity Country / Region
GROSS DIRECT LONG
EXPOSURES
(accounting value gross
of provisions)
(1)
NET DIRECT EXPOSURES
(accounting value gross of provisions)
(1)
Notional value Fair-value (+) Fair-value (-) Notional value Fair-value (+)
DIRECT SOVEREIGN EXPOSURES IN DERIVATIVES (1) INDIRECT SOVEREIGN EXPOSURES (3) (on and off balance sheet)
Derivatives with positive fair value Derivatives with negative fair value Derivatives with positive fair value Derivatives with negative fair value
Notional value Fair-value (-)Notional value
Cyprus
Czech Republic
of which: Loans and
receivablesof which: AFS
of which: FVO
(designated at fair
value through
profit&loss)
of which: HFT
(2)of which: HTM
Austria
Belgium
Bulgaria
Denmark
Estonia
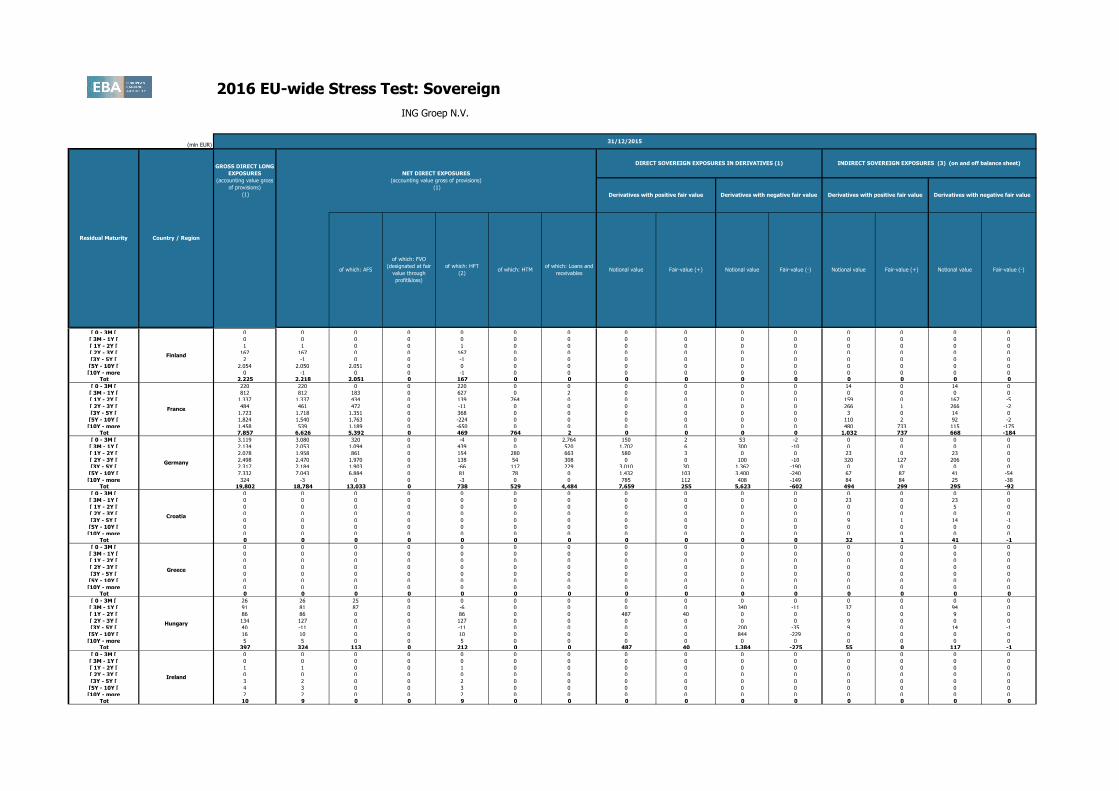
2016 EU-wide Stress Test: Sovereign
(mln EUR)
ING Groep N.V.
31/12/2015
Residual Maturity Country / Region
GROSS DIRECT LONG
EXPOSURES
(accounting value gross
of provisions)
(1)
NET DIRECT EXPOSURES
(accounting value gross of provisions)
(1)
Notional value Fair-value (+) Fair-value (-) Notional value Fair-value (+)
DIRECT SOVEREIGN EXPOSURES IN DERIVATIVES (1) INDIRECT SOVEREIGN EXPOSURES (3) (on and off balance sheet)
Derivatives with positive fair value Derivatives with negative fair value Derivatives with positive fair value Derivatives with negative fair value
Notional value Fair-value (-)Notional valueof which: Loans and
receivablesof which: AFS
of which: FVO
(designated at fair
value through
profit&loss)
of which: HFT
(2)of which: HTM
Austria
[ 0 - 3M [ 0 0 0 0 0 0 0 0 0 0 0 0 0 0 0
[ 3M - 1Y [ 0 0 0 0 0 0 0 0 0 0 0 0 0 0 0
[ 1Y - 2Y [ 1 1 0 0 1 0 0 0 0 0 0 0 0 0 0
[ 2Y - 3Y [ 167 167 0 0 167 0 0 0 0 0 0 0 0 0 0
[3Y - 5Y [ 2 -1 0 0 -1 0 0 0 0 0 0 0 0 0 0
[5Y - 10Y [ 2,054 2,050 2,051 0 0 0 0 0 0 0 0 0 0 0 0
[10Y - more 0 -1 0 0 -1 0 0 0 0 0 0 0 0 0 0Tot 2,225 2,218 2,051 0 167 0 0 0 0 0 0 0 0 0 0
[ 0 - 3M [ 220 220 0 0 220 0 0 0 0 0 0 14 0 14 0
[ 3M - 1Y [ 812 812 183 0 627 0 2 0 0 0 0 0 0 0 0
[ 1Y - 2Y [ 1,337 1,337 434 0 139 764 0 0 0 0 0 159 0 167 -5
[ 2Y - 3Y [ 484 461 472 0 -11 0 0 0 0 0 0 266 1 266 -2
[3Y - 5Y [ 1,723 1,718 1,351 0 368 0 0 0 0 0 0 3 0 14 0
[5Y - 10Y [ 1,824 1,540 1,763 0 -224 0 0 0 0 0 0 110 2 92 -2
[10Y - more 1,458 539 1,189 0 -650 0 0 0 0 0 0 480 733 115 -175Tot 7,857 6,626 5,392 0 469 764 2 0 0 0 0 1,032 737 668 -184
[ 0 - 3M [ 3,119 3,080 320 0 -4 0 2,764 150 2 53 -2 0 0 0 0
[ 3M - 1Y [ 2,134 2,053 1,094 0 439 0 520 1,702 6 300 -10 0 0 0 0
[ 1Y - 2Y [ 2,078 1,958 861 0 154 280 663 580 3 0 0 23 0 23 0
[ 2Y - 3Y [ 2,498 2,470 1,970 0 138 54 308 0 0 100 -10 320 127 206 0
[3Y - 5Y [ 2,317 2,184 1,903 0 -66 117 229 3,010 30 1,362 -190 0 0 0 0
[5Y - 10Y [ 7,332 7,043 6,884 0 81 78 0 1,432 103 3,400 -240 67 87 41 -54
[10Y - more 324 -3 0 0 -3 0 0 785 112 408 -149 84 84 25 -38Tot 19,802 18,784 13,033 0 738 529 4,484 7,659 255 5,623 -602 494 299 295 -92
[ 0 - 3M [ 0 0 0 0 0 0 0 0 0 0 0 0 0 0 0
[ 3M - 1Y [ 0 0 0 0 0 0 0 0 0 0 0 23 0 23 0
[ 1Y - 2Y [ 0 0 0 0 0 0 0 0 0 0 0 0 0 5 0
[ 2Y - 3Y [ 0 0 0 0 0 0 0 0 0 0 0 0 0 0 0
[3Y - 5Y [ 0 0 0 0 0 0 0 0 0 0 0 9 1 14 -1
[5Y - 10Y [ 0 0 0 0 0 0 0 0 0 0 0 0 0 0 0
[10Y - more 0 0 0 0 0 0 0 0 0 0 0 0 0 0 0Tot 0 0 0 0 0 0 0 0 0 0 0 32 1 41 -1
[ 0 - 3M [ 0 0 0 0 0 0 0 0 0 0 0 0 0 0 0
[ 3M - 1Y [ 0 0 0 0 0 0 0 0 0 0 0 0 0 0 0
[ 1Y - 2Y [ 0 0 0 0 0 0 0 0 0 0 0 0 0 0 0
[ 2Y - 3Y [ 0 0 0 0 0 0 0 0 0 0 0 0 0 0 0
[3Y - 5Y [ 0 0 0 0 0 0 0 0 0 0 0 0 0 0 0
[5Y - 10Y [ 0 0 0 0 0 0 0 0 0 0 0 0 0 0 0
[10Y - more 0 0 0 0 0 0 0 0 0 0 0 0 0 0 0Tot 0 0 0 0 0 0 0 0 0 0 0 0 0 0 0
[ 0 - 3M [ 26 26 25 0 0 0 0 0 0 0 0 0 0 0 0
[ 3M - 1Y [ 91 81 87 0 -6 0 0 0 0 340 -11 37 0 94 0
[ 1Y - 2Y [ 86 86 0 0 86 0 0 487 40 0 0 0 0 9 0
[ 2Y - 3Y [ 134 127 0 0 127 0 0 0 0 0 0 9 0 0 0
[3Y - 5Y [ 40 -11 0 0 -11 0 0 0 0 200 -35 9 0 14 -1
[5Y - 10Y [ 16 10 0 0 10 0 0 0 0 844 -229 0 0 0 0
[10Y - more 5 5 0 0 5 0 0 0 0 0 0 0 0 0 0Tot 397 324 113 0 212 0 0 487 40 1,384 -275 55 0 117 -1
[ 0 - 3M [ 0 0 0 0 0 0 0 0 0 0 0 0 0 0 0
[ 3M - 1Y [ 0 0 0 0 0 0 0 0 0 0 0 0 0 0 0
[ 1Y - 2Y [ 1 1 0 0 1 0 0 0 0 0 0 0 0 0 0
[ 2Y - 3Y [ 0 0 0 0 0 0 0 0 0 0 0 0 0 0 0
[3Y - 5Y [ 3 2 0 0 2 0 0 0 0 0 0 0 0 0 0
[5Y - 10Y [ 4 3 0 0 3 0 0 0 0 0 0 0 0 0 0
[10Y - more 2 2 0 0 2 0 0 0 0 0 0 0 0 0 0Tot 10 9 0 0 9 0 0 0 0 0 0 0 0 0 0
Greece
Ireland
Finland
France
Germany
Croatia
Hungary

2016 EU-wide Stress Test: Sovereign
(mln EUR)
ING Groep N.V.
31/12/2015
Residual Maturity Country / Region
GROSS DIRECT LONG
EXPOSURES
(accounting value gross
of provisions)
(1)
NET DIRECT EXPOSURES
(accounting value gross of provisions)
(1)
Notional value Fair-value (+) Fair-value (-) Notional value Fair-value (+)
DIRECT SOVEREIGN EXPOSURES IN DERIVATIVES (1) INDIRECT SOVEREIGN EXPOSURES (3) (on and off balance sheet)
Derivatives with positive fair value Derivatives with negative fair value Derivatives with positive fair value Derivatives with negative fair value
Notional value Fair-value (-)Notional valueof which: Loans and
receivablesof which: AFS
of which: FVO
(designated at fair
value through
profit&loss)
of which: HFT
(2)of which: HTM
Austria
[ 0 - 3M [ 273 273 250 0 15 0 9 0 0 0 0 0 0 0 0
[ 3M - 1Y [ 1,059 1,053 614 0 438 0 1 0 0 0 0 0 0 0 0
[ 1Y - 2Y [ 672 617 459 0 153 0 5 0 0 0 0 0 0 0 0
[ 2Y - 3Y [ 686 659 290 0 -4 369 3 0 0 0 0 46 0 90 -51
[3Y - 5Y [ 886 655 727 0 -74 0 2 1,000 27 0 0 3 0 3 0
[5Y - 10Y [ 488 159 0 0 140 0 19 0 0 0 0 0 0 0 0
[10Y - more 491 146 184 0 -125 0 87 0 0 0 0 0 0 5 -7Tot 4,556 3,562 2,524 0 543 369 126 1,000 27 0 0 49 0 98 -58
[ 0 - 3M [ 0 0 0 0 0 0 0 0 0 0 0 0 0 0 0
[ 3M - 1Y [ 0 0 0 0 0 0 0 0 0 0 0 0 0 0 0
[ 1Y - 2Y [ 0 0 0 0 0 0 0 0 0 0 0 0 0 0 0
[ 2Y - 3Y [ 0 0 0 0 0 0 0 0 0 0 0 0 0 0 0
[3Y - 5Y [ 0 0 0 0 0 0 0 0 0 0 0 0 0 0 0
[5Y - 10Y [ 0 -1 0 0 -1 0 0 0 0 0 0 0 0 0 0
[10Y - more 0 0 0 0 0 0 0 0 0 0 0 0 0 0 0Tot 0 0 0 0 0 0 0 0 0 0 0 0 0 0 0
[ 0 - 3M [ 0 0 0 0 0 0 0 0 0 0 0 0 0 0 0
[ 3M - 1Y [ 0 0 0 0 0 0 0 0 0 0 0 5 0 5 0
[ 1Y - 2Y [ 1 1 0 0 1 0 0 0 0 0 0 0 0 0 0
[ 2Y - 3Y [ 0 0 0 0 0 0 0 0 0 0 0 0 0 5 0
[3Y - 5Y [ 0 0 0 0 0 0 0 0 0 0 0 5 0 5 0
[5Y - 10Y [ 1 1 0 0 1 0 0 0 0 0 0 0 0 0 0
[10Y - more 0 0 0 0 0 0 0 0 0 0 0 0 0 0 0Tot 3 3 0 0 3 0 0 0 0 0 0 9 0 14 0
[ 0 - 3M [ 0 0 0 0 0 0 0 0 0 0 0 0 0 0 0
[ 3M - 1Y [ 10 10 0 0 0 0 10 0 0 0 0 0 0 0 0
[ 1Y - 2Y [ 0 0 0 0 0 0 0 0 0 0 0 0 0 0 0
[ 2Y - 3Y [ 1 1 0 0 0 0 1 0 0 0 0 0 0 0 0
[3Y - 5Y [ 35 35 33 0 0 0 2 0 0 0 0 0 0 0 0
[5Y - 10Y [ 165 165 165 0 0 0 0 0 0 0 0 0 0 0 0
[10Y - more 1 1 0 0 0 0 1 0 0 0 0 0 0 0 0Tot 213 213 198 0 0 0 15 0 0 0 0 0 0 0 0
[ 0 - 3M [ 0 0 0 0 0 0 0 0 0 0 0 0 0 0 0
[ 3M - 1Y [ 0 0 0 0 0 0 0 0 0 0 0 0 0 0 0
[ 1Y - 2Y [ 0 0 0 0 0 0 0 0 0 0 0 0 0 0 0
[ 2Y - 3Y [ 0 0 0 0 0 0 0 0 0 0 0 0 0 0 0
[3Y - 5Y [ 0 0 0 0 0 0 0 0 0 0 0 0 0 0 0
[5Y - 10Y [ 0 0 0 0 0 0 0 0 0 0 0 0 0 0 0
[10Y - more 0 0 0 0 0 0 0 0 0 0 0 0 0 0 0Tot 0 0 0 0 0 0 0 0 0 0 0 0 0 0 0
[ 0 - 3M [ 0 0 0 0 0 0 0 2,170 59 95 -3 0 0 0 0
[ 3M - 1Y [ 502 462 123 0 310 0 29 4,203 121 5,546 -60 0 0 0 0
[ 1Y - 2Y [ 1,352 1,352 633 0 708 0 10 5,673 242 3,450 -114 0 0 0 0
[ 2Y - 3Y [ 563 563 316 0 231 0 15 4,262 355 4,861 -285 0 0 0 0
[3Y - 5Y [ 2,699 2,310 2,517 0 -207 0 0 6,542 389 4,544 -514 0 0 0 0
[5Y - 10Y [ 6,802 6,767 5,426 0 217 1,124 0 6,696 156 10,883 -1,368 0 0 0 0
[10Y - more 239 36 0 0 28 0 8 252 89 4,916 -2,202 0 0 0 0Tot 12,157 11,491 9,015 0 1,289 1,124 63 29,798 1,411 34,295 -4,545 0 0 0 0
[ 0 - 3M [ 28 28 0 0 25 0 3 0 0 0 0 0 0 0 0
[ 3M - 1Y [ 141 141 62 0 43 0 35 0 0 0 0 9 0 9 0
[ 1Y - 2Y [ 875 866 769 0 26 0 71 0 0 0 0 6 0 6 0
[ 2Y - 3Y [ 651 642 310 0 7 0 324 0 0 0 0 0 0 0 0
[3Y - 5Y [ 3,042 3,014 2,161 0 16 239 598 0 0 0 0 0 0 115 -2
[5Y - 10Y [ 2,027 1,962 1,199 0 -9 95 676 0 0 0 0 0 0 0 0
[10Y - more 127 126 15 0 54 0 57 0 0 0 0 0 0 0 0Tot 6,891 6,778 4,517 0 161 334 1,764 0 0 0 0 16 0 130 -2
Italy
Latvia
Lithuania
Malta
Netherlands
Poland
Luxembourg

2016 EU-wide Stress Test: Sovereign
(mln EUR)
ING Groep N.V.
31/12/2015
Residual Maturity Country / Region
GROSS DIRECT LONG
EXPOSURES
(accounting value gross
of provisions)
(1)
NET DIRECT EXPOSURES
(accounting value gross of provisions)
(1)
Notional value Fair-value (+) Fair-value (-) Notional value Fair-value (+)
DIRECT SOVEREIGN EXPOSURES IN DERIVATIVES (1) INDIRECT SOVEREIGN EXPOSURES (3) (on and off balance sheet)
Derivatives with positive fair value Derivatives with negative fair value Derivatives with positive fair value Derivatives with negative fair value
Notional value Fair-value (-)Notional valueof which: Loans and
receivablesof which: AFS
of which: FVO
(designated at fair
value through
profit&loss)
of which: HFT
(2)of which: HTM
Austria
[ 0 - 3M [ 0 0 0 0 0 0 0 0 0 0 0 0 0 0 0
[ 3M - 1Y [ 0 0 0 0 0 0 0 0 0 0 0 0 0 0 0
[ 1Y - 2Y [ 0 0 0 0 0 0 0 0 0 0 0 0 0 0 0
[ 2Y - 3Y [ 0 0 0 0 0 0 0 0 0 0 0 0 0 0 0
[3Y - 5Y [ 0 0 0 0 0 0 0 0 0 0 0 0 0 0 0
[5Y - 10Y [ 2 0 0 0 0 0 0 0 0 0 0 0 0 0 0
[10Y - more 0 0 0 0 0 0 0 0 0 0 0 0 0 0 0Tot 3 1 0 0 1 0 0 0 0 0 0 0 0 0 0
[ 0 - 3M [ 68 68 29 35 4 0 0 0 0 0 0 0 0 0 0
[ 3M - 1Y [ 149 148 59 0 78 0 11 0 0 0 0 5 0 0 0
[ 1Y - 2Y [ 311 311 306 0 5 0 0 0 0 0 0 9 0 0 0
[ 2Y - 3Y [ 162 152 0 15 126 0 11 0 0 0 0 0 0 0 0
[3Y - 5Y [ 177 160 139 37 -16 0 0 0 0 0 0 0 0 0 0
[5Y - 10Y [ 67 41 0 0 -19 0 60 0 0 0 0 0 0 0 0
[10Y - more 0 -1 0 0 -1 0 0 0 0 0 0 0 0 0 0Tot 935 878 533 86 177 0 82 0 0 0 0 14 0 0 0
[ 0 - 3M [ 8 8 8 0 0 0 0 0 0 0 0 0 0 0 0
[ 3M - 1Y [ 49 49 49 0 0 0 0 0 0 0 0 9 0 5 0
[ 1Y - 2Y [ 79 79 79 0 0 0 0 0 0 0 0 0 0 0 0
[ 2Y - 3Y [ 0 0 0 0 0 0 0 0 0 0 0 0 0 0 0
[3Y - 5Y [ 6 6 6 0 0 0 0 0 0 0 0 0 0 0 0
[5Y - 10Y [ 0 -6 0 0 -6 0 0 0 0 0 0 0 0 0 0
[10Y - more 0 0 0 0 0 0 0 0 0 0 0 0 0 0 0Tot 143 136 142 0 -6 0 0 0 0 0 0 9 0 5 0
[ 0 - 3M [ 1 1 0 0 1 0 0 0 0 0 0 0 0 0 0
[ 3M - 1Y [ 0 0 0 0 0 0 0 0 0 0 0 0 0 0 0
[ 1Y - 2Y [ 0 0 0 0 0 0 0 0 0 0 0 0 0 0 0
[ 2Y - 3Y [ 1 1 0 0 1 0 0 0 0 0 0 0 0 0 0
[3Y - 5Y [ 0 0 0 0 0 0 0 0 0 0 0 0 0 0 0
[5Y - 10Y [ 2 2 0 0 2 0 0 0 0 0 0 0 0 0 0
[10Y - more 0 -1 0 0 -1 0 0 0 0 0 0 0 0 0 0Tot 3 2 0 0 2 0 0 0 0 0 0 0 0 0 0
[ 0 - 3M [ 103 103 0 0 103 0 0 0 0 0 0 0 0 0 0
[ 3M - 1Y [ 65 65 0 0 65 0 0 0 0 0 0 0 0 0 0
[ 1Y - 2Y [ 522 522 0 0 30 492 0 0 0 0 0 0 0 0 0
[ 2Y - 3Y [ 1,145 1,145 209 0 22 914 0 0 0 0 0 0 0 0 0
[3Y - 5Y [ 521 517 487 0 13 0 17 0 0 0 0 0 0 0 0
[5Y - 10Y [ 569 547 513 0 34 0 0 0 0 0 0 0 0 0 0
[10Y - more 18 16 0 0 16 0 0 0 0 0 0 0 0 0 0Tot 2,942 2,914 1,209 0 282 1,406 17 0 0 0 0 0 0 0 0
[ 0 - 3M [ 0 0 0 0 0 0 0 0 0 0 0 0 0 0 0
[ 3M - 1Y [ 0 0 0 0 0 0 0 0 0 0 0 0 0 0 0
[ 1Y - 2Y [ 183 183 183 0 0 0 0 0 0 0 0 0 0 0 0
[ 2Y - 3Y [ 2 0 0 0 0 0 0 0 0 0 0 0 0 0 0
[3Y - 5Y [ 231 231 231 0 0 0 0 0 0 0 0 0 0 0 0
[5Y - 10Y [ 0 0 0 0 0 0 0 0 0 0 0 0 0 0 0
[10Y - more 0 0 0 0 0 0 0 0 0 0 0 0 0 0 0Tot 417 415 414 0 1 0 0 0 0 0 0 0 0 0 0
[ 0 - 3M [ 0 0 0 0 0 0 0 0 0 82 0 0 0 0 0
[ 3M - 1Y [ 0 0 0 0 0 0 0 0 0 11 0 0 0 0 0
[ 1Y - 2Y [ 0 0 0 0 0 0 0 0 0 63 -1 0 0 0 0
[ 2Y - 3Y [ 0 0 0 0 0 0 0 0 0 0 0 0 0 0 0
[3Y - 5Y [ 0 0 0 0 0 0 0 0 0 0 0 0 0 0 0
[5Y - 10Y [ 0 0 0 0 0 0 0 0 0 0 0 0 0 0 0
[10Y - more 12 12 12 0 0 0 0 0 0 0 0 0 0 0 0Tot 12 12 12 0 0 0 0 0 0 156 -2 0 0 0 0
Portugal
Romania
Slovakia
Slovenia
Spain
Sweden
United Kingdom

2016 EU-wide Stress Test: Sovereign
(mln EUR)
ING Groep N.V.
31/12/2015
Residual Maturity Country / Region
GROSS DIRECT LONG
EXPOSURES
(accounting value gross
of provisions)
(1)
NET DIRECT EXPOSURES
(accounting value gross of provisions)
(1)
Notional value Fair-value (+) Fair-value (-) Notional value Fair-value (+)
DIRECT SOVEREIGN EXPOSURES IN DERIVATIVES (1) INDIRECT SOVEREIGN EXPOSURES (3) (on and off balance sheet)
Derivatives with positive fair value Derivatives with negative fair value Derivatives with positive fair value Derivatives with negative fair value
Notional value Fair-value (-)Notional valueof which: Loans and
receivablesof which: AFS
of which: FVO
(designated at fair
value through
profit&loss)
of which: HFT
(2)of which: HTM
Austria
[ 0 - 3M [ 0 0 0 0 0 0 0 0 0 0 0 0 0 0 0
[ 3M - 1Y [ 0 0 0 0 0 0 0 0 0 0 0 0 0 0 0
[ 1Y - 2Y [ 0 0 0 0 0 0 0 0 0 0 0 0 0 0 0
[ 2Y - 3Y [ 0 0 0 0 0 0 0 0 0 0 0 0 0 0 0
[3Y - 5Y [ 0 0 0 0 0 0 0 0 0 0 0 0 0 0 0
[5Y - 10Y [ 0 0 0 0 0 0 0 0 0 0 0 0 0 0 0
[10Y - more 0 0 0 0 0 0 0 0 0 0 0 0 0 0 0Tot 0 0 0 0 0 0 0 0 0 0 0 0 0 0 0
[ 0 - 3M [ 134 134 33 0 0 0 100 0 0 0 0 0 0 0 0
[ 3M - 1Y [ 912 912 912 0 0 0 0 0 0 0 0 0 0 0 0
[ 1Y - 2Y [ 406 406 406 0 0 0 0 0 0 0 0 0 0 0 0
[ 2Y - 3Y [ 221 221 221 0 0 0 0 0 0 0 0 0 0 0 0
[3Y - 5Y [ 157 157 157 0 0 0 0 0 0 0 0 0 0 0 0
[5Y - 10Y [ 944 944 944 0 0 0 0 0 0 0 0 0 0 0 0
[10Y - more 0 0 0 0 0 0 0 0 0 0 0 0 0 0 0Tot 2,773 2,773 2,673 0 0 0 100 0 0 0 0 0 0 0 0
[ 0 - 3M [ 0 0 0 0 0 0 0 0 0 0 0 0 0 0 0
[ 3M - 1Y [ 0 0 0 0 0 0 0 0 0 0 0 0 0 0 0
[ 1Y - 2Y [ 0 0 0 0 0 0 0 0 0 0 0 0 0 0 0
[ 2Y - 3Y [ 0 0 0 0 0 0 0 0 0 0 0 0 0 0 0
[3Y - 5Y [ 71 68 67 0 1 0 0 0 0 0 0 0 0 0 0
[5Y - 10Y [ 472 470 468 0 2 0 0 0 0 0 0 0 0 0 0
[10Y - more 0 0 0 0 0 0 0 0 0 0 0 0 0 0 0Tot 543 538 536 0 2 0 0 0 0 0 0 0 0 0 0
[ 0 - 3M [ 0 0 0 0 0 0 0 0 0 0 0 0 0 0 0
[ 3M - 1Y [ 0 0 0 0 0 0 0 0 0 0 0 9 0 9 0
[ 1Y - 2Y [ 0 0 0 0 0 0 0 0 0 0 0 0 0 0 0
[ 2Y - 3Y [ 0 0 0 0 0 0 0 0 0 0 0 0 0 0 0
[3Y - 5Y [ 0 0 0 0 0 0 0 0 0 0 0 0 0 0 0
[5Y - 10Y [ 0 0 0 0 0 0 0 0 0 0 0 0 0 0 0
[10Y - more 0 0 0 0 0 0 0 0 0 0 0 0 0 0 0Tot 0 0 0 0 0 0 0 0 0 0 0 9 0 9 0
[ 0 - 3M [ 76 76 76 0 0 0 0 0 0 0 0 0 0 0 0
[ 3M - 1Y [ 0 0 0 0 0 0 0 0 0 0 0 0 0 0 0
[ 1Y - 2Y [ 0 0 0 0 0 0 0 0 0 0 0 0 0 0 0
[ 2Y - 3Y [ 0 0 0 0 0 0 0 0 0 0 0 211 4 323 -3
[3Y - 5Y [ 0 0 0 0 0 0 0 0 0 0 0 156 3 18 0
[5Y - 10Y [ 0 0 0 0 0 0 0 0 0 0 0 73 1 0 0
[10Y - more 0 0 0 0 0 0 0 0 0 0 0 0 0 0 0Tot 76 76 76 0 0 0 0 0 0 0 0 441 8 341 -3
Liechtenstein
Iceland
Norway
Australia
Canada
Hong Kong
Japan
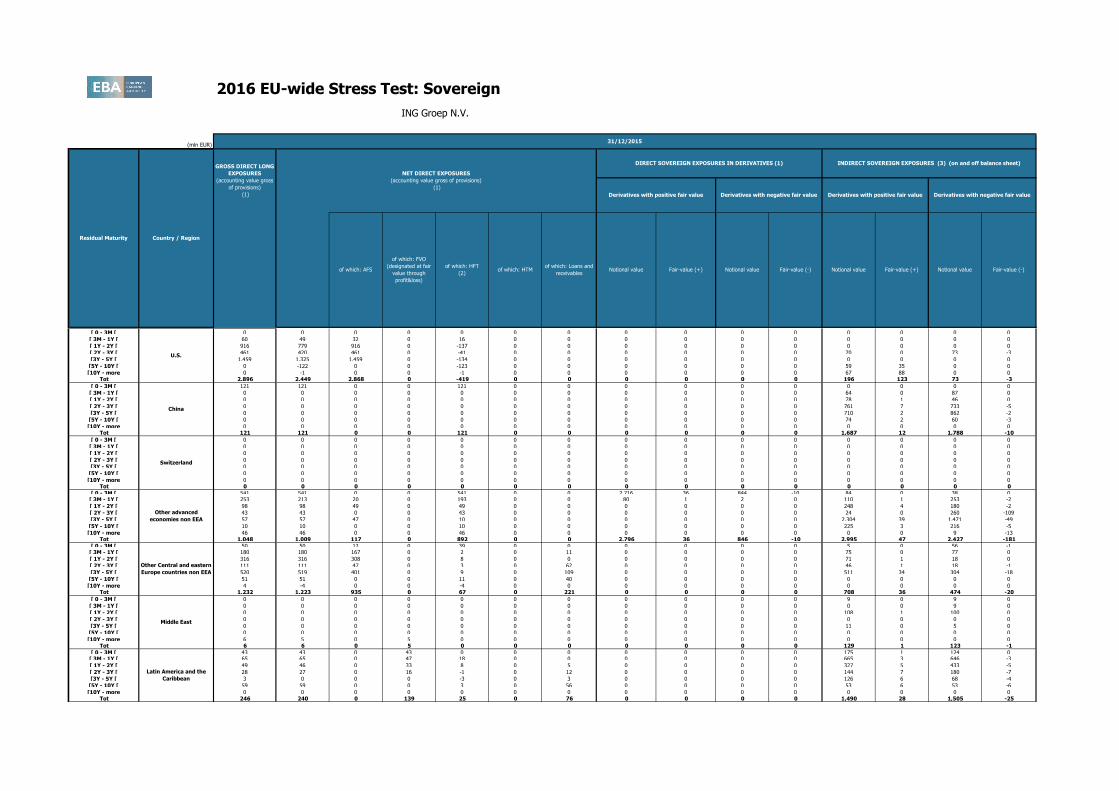
2016 EU-wide Stress Test: Sovereign
(mln EUR)
ING Groep N.V.
31/12/2015
Residual Maturity Country / Region
GROSS DIRECT LONG
EXPOSURES
(accounting value gross
of provisions)
(1)
NET DIRECT EXPOSURES
(accounting value gross of provisions)
(1)
Notional value Fair-value (+) Fair-value (-) Notional value Fair-value (+)
DIRECT SOVEREIGN EXPOSURES IN DERIVATIVES (1) INDIRECT SOVEREIGN EXPOSURES (3) (on and off balance sheet)
Derivatives with positive fair value Derivatives with negative fair value Derivatives with positive fair value Derivatives with negative fair value
Notional value Fair-value (-)Notional valueof which: Loans and
receivablesof which: AFS
of which: FVO
(designated at fair
value through
profit&loss)
of which: HFT
(2)of which: HTM
Austria
[ 0 - 3M [ 0 0 0 0 0 0 0 0 0 0 0 0 0 0 0
[ 3M - 1Y [ 60 49 32 0 16 0 0 0 0 0 0 0 0 0 0
[ 1Y - 2Y [ 916 779 916 0 -137 0 0 0 0 0 0 0 0 0 0
[ 2Y - 3Y [ 461 420 461 0 -41 0 0 0 0 0 0 70 0 73 -3
[3Y - 5Y [ 1,459 1,325 1,459 0 -134 0 0 0 0 0 0 0 0 0 0
[5Y - 10Y [ 0 -122 0 0 -123 0 0 0 0 0 0 59 35 0 0
[10Y - more 0 -1 0 0 -1 0 0 0 0 0 0 67 88 0 0Tot 2,896 2,449 2,868 0 -419 0 0 0 0 0 0 196 123 73 -3
[ 0 - 3M [ 121 121 0 0 121 0 0 0 0 0 0 0 0 0 0
[ 3M - 1Y [ 0 0 0 0 0 0 0 0 0 0 0 64 0 87 0
[ 1Y - 2Y [ 0 0 0 0 0 0 0 0 0 0 0 78 1 46 0
[ 2Y - 3Y [ 0 0 0 0 0 0 0 0 0 0 0 761 7 733 -5
[3Y - 5Y [ 0 0 0 0 0 0 0 0 0 0 0 710 2 862 -2
[5Y - 10Y [ 0 0 0 0 0 0 0 0 0 0 0 74 2 60 -3
[10Y - more 0 0 0 0 0 0 0 0 0 0 0 0 0 0 0Tot 121 121 0 0 121 0 0 0 0 0 0 1,687 12 1,788 -10
[ 0 - 3M [ 0 0 0 0 0 0 0 0 0 0 0 0 0 0 0
[ 3M - 1Y [ 0 0 0 0 0 0 0 0 0 0 0 0 0 0 0
[ 1Y - 2Y [ 0 0 0 0 0 0 0 0 0 0 0 0 0 0 0
[ 2Y - 3Y [ 0 0 0 0 0 0 0 0 0 0 0 0 0 0 0
[3Y - 5Y [ 0 0 0 0 0 0 0 0 0 0 0 0 0 0 0
[5Y - 10Y [ 0 0 0 0 0 0 0 0 0 0 0 0 0 0 0
[10Y - more 0 0 0 0 0 0 0 0 0 0 0 0 0 0 0Tot 0 0 0 0 0 0 0 0 0 0 0 0 0 0 0
[ 0 - 3M [ 541 541 0 0 541 0 0 2,716 36 844 -10 84 0 38 0[ 3M - 1Y [ 253 213 20 0 193 0 0 80 1 2 0 110 1 253 -2
[ 1Y - 2Y [ 98 98 49 0 49 0 0 0 0 0 0 248 4 180 -2
[ 2Y - 3Y [ 43 43 0 0 43 0 0 0 0 0 0 24 0 260 -109
[3Y - 5Y [ 57 57 47 0 10 0 0 0 0 0 0 2,304 39 1,471 -49
[5Y - 10Y [ 10 10 0 0 10 0 0 0 0 0 0 225 3 216 -5
[10Y - more 46 46 0 0 46 0 0 0 0 0 0 0 0 9 -13Tot 1,048 1,009 117 0 892 0 0 2,796 36 846 -10 2,995 47 2,427 -181
[ 0 - 3M [ 50 50 12 0 39 0 0 0 0 0 0 5 0 56 -1[ 3M - 1Y [ 180 180 167 0 2 0 11 0 0 0 0 75 0 77 0
[ 1Y - 2Y [ 316 316 308 0 8 0 0 0 0 0 0 71 1 18 0
[ 2Y - 3Y [ 111 111 47 0 3 0 62 0 0 0 0 46 1 18 -1
[3Y - 5Y [ 520 519 401 0 9 0 109 0 0 0 0 511 34 304 -18
[5Y - 10Y [ 51 51 0 0 11 0 40 0 0 0 0 0 0 0 0
[10Y - more 4 -4 0 0 -4 0 0 0 0 0 0 0 0 0 0Tot 1,232 1,223 935 0 67 0 221 0 0 0 0 708 36 474 -20
[ 0 - 3M [ 0 0 0 0 0 0 0 0 0 0 0 9 0 9 0
[ 3M - 1Y [ 0 0 0 0 0 0 0 0 0 0 0 0 0 9 0
[ 1Y - 2Y [ 0 0 0 0 0 0 0 0 0 0 0 108 1 100 0
[ 2Y - 3Y [ 0 0 0 0 0 0 0 0 0 0 0 0 0 0 0
[3Y - 5Y [ 0 0 0 0 0 0 0 0 0 0 0 11 0 5 0
[5Y - 10Y [ 0 0 0 0 0 0 0 0 0 0 0 0 0 0 0
[10Y - more 6 5 0 5 0 0 0 0 0 0 0 0 0 0 0Tot 6 6 0 5 0 0 0 0 0 0 0 129 1 123 -1
[ 0 - 3M [ 43 43 0 43 0 0 0 0 0 0 0 175 1 124 0[ 3M - 1Y [ 65 65 0 47 18 0 0 0 0 0 0 665 3 646 -3
[ 1Y - 2Y [ 49 46 0 33 8 0 5 0 0 0 0 327 5 433 -5
[ 2Y - 3Y [ 28 27 0 16 -1 0 12 0 0 0 0 144 7 180 -7
[3Y - 5Y [ 3 0 0 0 -3 0 3 0 0 0 0 126 6 68 -4
[5Y - 10Y [ 59 59 0 0 3 0 56 0 0 0 0 53 6 53 -6
[10Y - more 0 0 0 0 0 0 0 0 0 0 0 0 0 0 0Tot 246 240 0 139 25 0 76 0 0 0 0 1,490 28 1,505 -25
Latin America and the
Caribbean
Middle East
U.S.
China
Switzerland
Other advanced
economies non EEA
Other Central and eastern
Europe countries non EEA

2016 EU-wide Stress Test: Sovereign
(mln EUR)
ING Groep N.V.
31/12/2015
Residual Maturity Country / Region
GROSS DIRECT LONG
EXPOSURES
(accounting value gross
of provisions)
(1)
NET DIRECT EXPOSURES
(accounting value gross of provisions)
(1)
Notional value Fair-value (+) Fair-value (-) Notional value Fair-value (+)
DIRECT SOVEREIGN EXPOSURES IN DERIVATIVES (1) INDIRECT SOVEREIGN EXPOSURES (3) (on and off balance sheet)
Derivatives with positive fair value Derivatives with negative fair value Derivatives with positive fair value Derivatives with negative fair value
Notional value Fair-value (-)Notional valueof which: Loans and
receivablesof which: AFS
of which: FVO
(designated at fair
value through
profit&loss)
of which: HFT
(2)of which: HTM
Austria
[ 0 - 3M [ 0 0 0 0 0 0 0 0 0 0 0 0 0 0 0
[ 3M - 1Y [ 0 0 0 0 0 0 0 0 0 0 0 9 0 9 0
[ 1Y - 2Y [ 0 0 0 0 0 0 0 0 0 0 0 0 0 0 0
[ 2Y - 3Y [ 0 0 0 0 0 0 0 0 0 0 0 14 1 14 -1
[3Y - 5Y [ 0 0 0 0 0 0 0 0 0 0 0 11 1 12 -1
[5Y - 10Y [ 83 83 0 0 0 0 83 0 0 0 0 0 0 0 0
[10Y - more 0 0 0 0 0 0 0 0 0 0 0 0 0 0 0Tot 84 84 0 0 0 0 84 0 0 0 0 34 2 35 -2
[ 0 - 3M [ 11 11 8 0 0 0 3 0 0 0 0 184 0 110 0
[ 3M - 1Y [ 64 64 7 13 38 0 6 0 0 0 0 499 2 448 -2
[ 1Y - 2Y [ 114 114 31 29 8 0 46 0 0 0 0 600 10 271 -3
[ 2Y - 3Y [ 27 26 0 0 8 0 18 0 0 0 0 195 4 70 -1
[3Y - 5Y [ 136 134 0 0 23 0 111 0 0 0 0 2,012 124 1,579 -85
[5Y - 10Y [ 98 80 0 0 12 0 68 0 0 0 0 52 1 12 -1
[10Y - more 27 17 0 0 9 0 8 0 0 0 0 0 0 0 0Tot 477 446 46 42 99 0 259 0 0 0 0 3,542 142 2,491 -92
86,487 81,429 57,601 273 5,524 6,029 12,001 45,987 2,266 44,177 -5,509 13,174 1,604 10,807 -725
Notes, definitions and regions:
(1) The exposures reported cover only exposures to central, regional and local governments on immediate borrower basis, and do not include exposures to other counterparts with full or partial government guarantees. Exposures to central banks should not be included here.(2) For positions in HFT this should include gross exposures (long) net of cash short positions of sovereign debt to other counterpaties only where there is a maturity matching(3) The exposures reported include the positions towards counterparts (other than sovereign) on sovereign credit risk (i.e. CDS) booked in all the accounting portfolio (on-off balance sheet). Irrespective of the denomination and or accounting classification of the positions.Other advanced non EEA: Israel, Korea, New Zealand, San Marino, Singapore,Taiwan and RussiaOther CEE non EEA: Albania, Bosnia and Herzegovina, Kosovo, FYR Macedonia, Montenegro, Serbia, and Turkey.Middle East: Yemen,United Arab Emirates,Syrian ,Sudan,Saudi Arabia,Qatar ,Oman ,Mauritania ,Libya ,Lebanon ,Kuwait ,Jordan ,Iraq ,Iran,Djibouti and Bahrain.Latin America: Venezuela,Uruguay ,Trinidad and Tobago,Suriname ,St. Vincent and the Grenadines,St. Lucia,St. Kitts and Nevis,Peru ,Paraguay ,Panama ,Nicaragua ,Mexico ,Jamaica ,Honduras ,Haiti ,Guyana ,Guatemala ,Grenada ,El Salvador,Ecuador ,Dominican Republic,Dominica ,Costa Rica,Colombia ,Chile ,Brazil ,Bolivia and Belize.Africa: South Africa, Tunisia ,Morocco ,Egypt and Algeria.
Africa
Others
Total

2016 EU-wide Stress Test - Risk exposure amounts
(mln EUR) 31/12/2015 31/12/2016 31/12/2017 31/12/2018 31/12/2016 31/12/2017 31/12/2018
Risk exposure amount for credit risk 263,412 272,333 280,727 288,858 275,252 292,784 303,632
Risk exposure amount for securitisations and re-securitisations 1,958 2,269 2,442 2,674 3,440 5,698 7,628
Risk exposure amount other credit risk 261,454 270,064 278,285 286,184 271,812 287,085 296,005
Risk exposure amount for market risk 14,639 14,760 14,874 14,983 16,985 17,318 17,517
Risk exposure amount for operational risk 43,137 43,137 44,142 44,652 48,205 53,145 56,480
Other risk exposure amounts 0 0 0 0 0 0 0
Total risk exposure amount 321,188 330,229 339,743 348,493 340,442 363,246 377,630
Baseline scenario Adverse scenario
ING Groep N.V.

2016 EU-wide Stress Test - P&L
31/12/2015 31/12/2016 31/12/2017 31/12/2018 31/12/2016 31/12/2017 31/12/2018
Net interest income (1) 12,58711,653 11,276 11,120 9,609 9,290 9,170
Interest income 46,355 48,559 53,670 59,572 55,128 63,447 68,212
(Interest expense) -33,768 -36,906 -42,394 -48,452 -45,519 -54,157 -59,042
Dividend income 82 82 82 82 39 39 39
Net fee and commission income 2,320 2,320 2,320 2,320 2,107 2,107 2,107
Gains or (-) losses on financial assets and liabilities held for trading, net 782 770 770 770 -1,079 565 577
Gains or (-) losses on financial assets and liabilities designated at fair
value through profit and loss, net370 23
Other operating income not listed above, net 738 16 16 16 -14 16 16
Total operating income, net 16,880 14,841 14,464 14,308 10,685 12,016 11,909
(Impairment or (-) reversal of impairment on financial assets not
measured at fair value through profit or loss)-1,481 -1,288 -1,234 -1,164 -2,515 -3,477 -3,032
Other income and expenses not listed above, net -9,236 -9,191 -9,034 -8,934 -10,913 -9,327 -9,193
Profit or (-) loss before tax from continuing operations 6,163 4,361 4,196 4,210 -2,742 -788 -316
(Tax expenses or (-) income related to profit or loss from continuing operations) -1,634 -1,308 -1,259 -1,263 823 236 95
Profit or (-) loss after tax from discontinued operations -447 0 0 0 0 0 0
Profit or (-) loss for the year 4,082 3,053 2,937 2,947 -1,919 -552 -221
Attributable to owners of the parent 4,010 2,981 2,865 2,875 -1,991 -624 -293
Amount of dividends paid 2,515 2,553 2,007 1,973 0 0 0
Attributable to owners of the parent net of estimated dividends 1,495 427 858 902 -1,991 -624 -293
(mln EUR)
Baseline Scenario Adverse Scenario
ING Groep N.V.
(1) Projected NII may differ from the sum of interest income and interest expenses due to the application of the cap on NII (paragraphs 308 of the methodological note).

2016 EU-wide Stress Test: Capital
(mln EUR,%) 31/12/2015 31/12/2016 31/12/2017 31/12/2018 31/12/2016 31/12/2017 31/12/2018
A OWN FUNDS 54,324 55,521 56,547 57,334 49,889 48,617 47,701
A.1 COMMON EQUITY TIER 1 CAPITAL (net of deductions and after applying transitional adjustments) 41,554 41,867 42,689 43,623 36,245 34,859 33,990
A.1.1 Capital instruments eligible as CET1 Capital (including share premium and net own capital instruments) 16,964 16,964 16,964 16,964 16,964 16,964 16,964
A.1.1.1 Of which: CET1 instruments subscribed by Government 0 0 0 0 0 0 0
A.1.2 Retained earnings 23,573 24,000 24,858 25,760 21,581 20,958 20,665
A.1.3 Accumulated other comprehensive income 5,710 5,710 5,710 5,710 3,559 3,559 3,559
A.1.3.1 Of which: arising from unrealised gains/losses from Sovereign exposure in AFS portfolio 833 833 833 833 -556 -556 -556
A.1.3.2 Of which: arising from unrealised gains/losses from the rest of AFS portfolio 430 430 430 430 -989 -989 -989
A.1.4 Other Reserves 0 0 0 0 0 0 0
A.1.5 Funds for general banking risk 0 0 0 0 0 0 0
A.1.6 Minority interest given recognition in CET1 capital 305 314 323 331 323 345 359
A.1.7 Adjustments to CET1 due to prudential filters -720 -720 -720 -720 -718 -720 -720
A.1.8 (-) Intangible assets (including Goodwill) -1,594 -1,594 -1,594 -1,594 -1,594 -1,594 -1,594
A.1.9 (-) DTAs that rely on future profitability and do not arise from temporary differences net of associated DTLs -282 -235 -189 -143 -1,104 -1,341 -1,435
A.1.10 (-) IRB shortfall of credit risk adjustments to expected losses -1,135 -1,045 -1,001 -971 -1,213 -1,439 -1,533
A.1.11 (-) Defined benefit pension fund assets -643 -643 -643 -643 -980 -980 -980
A.1.12 (-) Reciprocal cross holdings in CET1 Capital 0 0 0 0 0 0 0
A.1.13 (-) Excess deduction from AT1 items over AT1 Capital 0 0 0 0 0 0 0
A.1.14 (-) Deductions related to assets which can alternatively be subject to a 1.250% risk weight 0 0 0 0 0 0 0
A.1.14.1 Of which: from securitisation positions (-) 0 0 0 0 0 0 0
A.1.15(-) Holdings of CET1 capital instruments of financial sector entities where the institiution does not have a significant
investment0 0 0 0 0 0 0
A.1.16 (-) Deductible DTAs that rely on future profitability and arise from temporary differences 0 0 0 0 0 0 0
A.1.17 (-) CET1 instruments of financial sector entities where the institiution has a significant investment -1,396 -1,340 -1,239 -1,132 -1,194 -1,300 -1,355
A.1.18 (-) Amount exceding the 17.65% threshold 0 0 0 0 0 0 0
A.1.19 (-) Additional deductions of CET1 Capital due to Article 3 CRR 0 0 0 0 0 0 0
A.1.20 CET1 capital elements or deductions - other 0 0 0 0 0 0 0
A.1.21 Transitional adjustments 772 458 221 61 620 407 61
A.1.21.1 Transitional adjustments due to grandfathered CET1 Capital instruments (+/-) 0 0 0 0 0 0 0
A.1.21.2 Transitional adjustments due to additional minority interests (+/-) 0 0 0 0 0 0 0
A.1.21.3Transitional adjustments to CET1 Capital from unrealised gains/losses from Sovereign exposure in AFS portfolio (+/-
)-500 -333 -167 0 222 111 0
A.1.21.4 Transitional adjustments to CET1 Capital from unrealised gains/losses from the rest of AFS portfolio (+/-) -258 -172 -86 0 396 198 0
A.1.21.5 Other transitional adjustments to CET1 Capital 1,530 963 474 61 2 98 61
A.1.21.5.1 Of which: due to DTAs that rely on future profitability and do not arise from temporary differences 169 94 38 0 113 56 0
A.1.21.5.2Of which: due to DTAs that rely on future profitability and arise from temporary differences and CET1
instruments of financial sector entities where the institution has a significant investment0 0 0 0 0 0 0
A.2 ADDITIONAL TIER 1 CAPITAL (net of deductions and after transitional adjustments) 4,858 5,459 5,410 5,040 5,455 5,360 5,040
A.2.1 Additional Tier 1 Capital instruments 2,061 2,061 2,061 2,061 2,061 2,061 2,061
A.2.2 (-) Excess deduction from T2 items over T2 capital 0 0 0 0 0 0 0
A.2.3 Other Additional Tier 1 Capital components and deductions -675 -675 -675 -675 -675 -675 -675
A.2.4 Additional Tier 1 transitional adjustments 3,471 4,072 4,024 3,653 4,068 3,974 3,653
A.3 TIER 1 CAPITAL (net of deductions and after transitional adjustments) 46,412 47,326 48,100 48,662 41,699 40,219 39,029
A.4 TIER 2 CAPITAL (net of deductions and after transitional adjustments) 7,913 8,195 8,448 8,672 8,190 8,398 8,672
A.4.1 Tier 2 Capital instruments 6,330 6,330 6,330 6,330 6,330 6,330 6,330
A.4.2 Other Tier 2 Capital components and deductions 0 0 0 0 0 0 0
A.4.3 Tier 2 transitional adjustments 1,582 1,864 2,117 2,341 1,860 2,068 2,341
B TOTAL RISK EXPOSURE AMOUNT 321,188 330,229 339,743 348,493 340,442 363,246 377,630
B.1 Of which: Transitional adjustments included 0 0 0 0 0 0 0
C.1 Common Equity Tier 1 Capital ratio 12.94% 12.68% 12.57% 12.52% 10.65% 9.60% 9.00%
C.2 Tier 1 Capital ratio 14.45% 14.33% 14.16% 13.96% 12.25% 11.07% 10.34%
C.3 Total Capital ratio 16.91% 16.81% 16.64% 16.45% 14.65% 13.38% 12.63%
D.1 Common Equity Tier 1 Capital ratio (1) 12.70% 12.54% 12.50% 12.50% 10.46% 9.48% 8.98%
D.2 Tier 1 Capital ratio (2) 13.13% 12.96% 12.91% 12.90% 10.87% 9.87% 9.35%
D.3 Total Capital ratio (3) 15.10% 14.88% 14.77% 14.71% 12.73% 11.61% 11.03%
ETotal amount of instruments with mandatory conversion into ordinary shares upon a fixed date in the 2016 -2018 period
(cumulative conversions) (4)0 0 0 0 0 0 0
FTotal Additional Tier 1 and Tier 2 instruments eligible as regulatory capital under the CRR provisions that convert into
Common Equity Tier 1 or are written down upon a trigger event (5)8392 8392 8392
F.1 Of which: eligible instruments whose trigger is above CET1 capital ratio in the adverse scenario (5) 0 0 0
G.1 Total leverage ratio exposures (transitional) 1,072,000 1,072,000 1,072,000 1,072,000 1,072,000 1,072,000 1,072,000
G.2 Total leverage ratio exposures (fully loaded) 1,073,000 1,073,000 1,073,000 1,073,000 1,073,000 1,073,000 1,073,000
G.3 Leverage ratio (transitional) 4.33% 4.41% 4.49% 4.54% 3.89% 3.75% 3.64%
G.4 Leverage ratio (fully loaded) 3.93% 3.99% 4.09% 4.19% 3.45% 3.34% 3.29%
(1) Fully loaded CET1 capital ratio estimation: [A.1-A.1.13-A.1.21+MIN(A.2+A.1.13-A.2.2-A.2.4+MIN(A.4+A.2.2-A.4.3,0),0)]/[B-B.1]
(2) Fully loaded T1 capital ratio estimation: [A.1-A.1.21+A.2-A.2.2-A.2.4+MIN(A.4+A.2.2-A.4.3,0)]/[B-B.1]
(3) Fully loaded Total capital ratio estimation: [A.1-A.1.21+A.2-A.2.4+A.4-A.4.3)/[B-B.1]. This ratio does not include grandfathered AT1 capital instruments meeting the conditions laid down in Article 63 of CRR and, hence, eligible as fully loaded T2 capital. Therefore, the ratio could be underestimated for banks with material instruments of such kind.
(4) Conversions not considered for CET1 computation
(5) Excluding instruments included in row E
Memorandum items
Baseline Scenario Adverse Scenario
CAPITAL RATIOS (%)
Transitional period
ING Groep N.V.
OWN FUNDS
CAPITAL RATIOS (%)
Fully loaded
TOTAL RISK EXPOSURE
AMOUNT

(mln EUR)
Of which:
defaulted
Debt securities (including at amortised cost and fair value) 101,567 0 171 171 12 120 0
Central banks 1,303 0 0 0 0 0 0
General governments 63,027 0 0 0 1 0 0
Credit institutions 26,536 0 0 0 0 0 0
Other financial corporations 5,273 0 0 0 6 0 0
Non-financial corporations 5,428 0 171 171 5 120 0
Loans and advances(including at amortised cost and fair value) 572,518 735 14,892 14,892 860 4,926 8,103
Central banks 28,148 0 0 0 6 0 0
General governments 15,053 0 19 19 2 1 0
Credit institutions 20,936 0 7 7 10 6 0
Other financial corporations 6,090 0 330 330 3 6 9
Non-financial corporations 208,960 18 9,202 9,202 463 3,812 4,434
Households 293,330 717 5,334 5,334 376 1,101 3,659
DEBT INSTRUMENTS other than HFT 674,084 735 15,064 15,064 872 5,046 8,103
OFF-BALANCE SHEET EXPOSURES 142,198 444 444 - - 1001 For the definition of non-performing exposures please refer to COMMISSION IMPLEMENTING REGULATION (EU) 2015/227 of 9 January 2015, ANNEX V, Part 2-Template related instructions, subtitle 29
2 Insitutions report here collective allowances for incurrred but not reported losses (instruments at amortised cost) and changes in fair value of performing exposures due to credit risk and provisions (instruments at fair value other than HFT)
3 Insitutions report here specific allowances for financial assets, individually and collectively estimated (instruments at amortised cost) and changes in fair value of NPE due to credit risk and provisions (instruments at fair value other than HFT)
On non-performing
exposures3
2016 EU-wide Stress Test Information on performing and non-performing exposures
1
31/12/2015
Gross carrying amount
Accumulated impairment,
accumulated changes in fair value due
to credit risk and provisions Collaterals and
financial
guarantees
received on non-
performing
exposures
Of which performing
but past due >30 days
and <=90 days
Of which non-performing
On performing
exposures2
ING Groep N.V.

(mln EUR)
Debt securities (including at amortised cost and fair value) 0 0 0 0 0
Central banks 0 0 0 0 0
General governments 0 0 0 0 0
Credit institutions 0 0 0 0 0
Other financial corporations 0 0 0 0 0
Non-financial corporations 0 0 0 0 0
Loans and advances (including at amortised cost and fair value) 10,530 6,458 1,795 1,752 7,428
Central banks 0 0 0 0 0
General governments 1 0 0 0 0
Credit institutions 0 0 0 0 0
Other financial corporations 28 26 1 1 8
Non-financial corporations 5,891 4,064 1,521 1,495 3,443
Households 4,610 2,368 274 256 3,978
DEBT INSTRUMENTS other than HFT 10,530 6,458 1,795 1,752 7,428
Loan commitments given 127 63 0 0 151 For the definition of forborne exposures please refer to COMMISSION IMPLEMENTING REGULATION (EU) 2015/227 of 9 January 2015, ANNEX V, Part 2-Template related instructions, subtitle 30
2016 EU-wide Stress Test Information on forborne exposures
1
31/12/2015
Of which non-
performing
exposures with
forbearance
measures
Of which on non-
performing
exposures with
forbearance
measures
Gross carrying amount of exposures
with forbearance measures
Accumulated impairment, accumulated
changes in fair value due to credit risk
and provisions for exposures with
forbearance measures Collateral and financial
guarantees received on
exposures with forbearance
measures
ING Groep N.V.