Embed Size (px)
Citation preview
2016
Chief Legal Officer Survey
An Altman Weil Flash Survey

© 2016 Altman Weil, Inc. 2016 Chief Legal Officer Survey
Contact Altman Weil 3748 West Chester Pike, Suite 203 Newtown Square, PA 19073 (610) 886-2000 www.altmanweil.com [email protected]

SUMMARY & ANALYSIS
© 2016 Altman Weil, Inc. 2016 Chief Legal Officer Survey - i
2016 Chief Legal Officer Survey
Each year the Chief Legal Officer Survey provides insights into the state of in-
house law departments from the perspective of their leaders and chief lawyers. In
2016 the survey shows an incremental strengthening of trends that we have seen
emerging since the recession.
Chief Legal Officers (CLOs) report that their departments are most valued for their
ability to advise the CEO and corporate board, support the organization’s business
objectives and manage legal risk. They are buffeted by market forces that include
the challenges of new technologies, an increasingly complex regulatory
environment, a profoundly unsettled relationship between law, risk, and compliance,
and a chronically slow-growth economy with powerful global trade volatility. They’re
also concerned about persistent cost pressures, the lack of innovation in service
delivery by law firms, and the career expectations of millennials coupled with the
retirement of senior lawyers.
In this demanding environment, many Chief Legal Officers are embracing the role of
change agents, wielding their buying power, leveraging technology and process
efficiency, and outsourcing to alternative providers, all to build a more effective and
flexible legal function.
Cost Control and Efficiency
Cost pressures are a primary concern for CLOs, encompassing both internal budget
constraints and outside counsel fees.
The number one tactic used by law departments to control costs, according to the
survey, is improving the efficiency of how they get work done within the department.
Top efficiency initiatives are the greater use of technology tools, and restructuring or
reorganizing internal resources. Other process improvements include the collection
and analysis of management metrics, knowledge management efforts, and project
management training.
The importance of administrative professionals is growing in law departments. One
third of all departments and three-quarters of law departments with 50 or more
lawyers now employ a Legal Administrator to manage day-to-day operations,
oversee financial operations, department technology and personnel. This role (with

SUMMARY & ANALYSIS
© 2016 Altman Weil, Inc. 2016 Chief Legal Officer Survey - ii
its myriad titles) is still being defined and its incumbents represent a wide variety of
experience and talent.
Externally, outside counsel present a broad target for cost cutting. The survey shows
this is usually a multi-pronged effort that includes negotiating discounts and
alternative fee arrangements, reducing the total amount of work sent to law firms
and shifting work to lower priced firms.
When law departments reduce their total outside counsel spend, they usually bring
much of the work previously done by law firms in-house to be done by their lawyers
and non-lawyer staff. Sometimes they outsource the work to non-firm vendors (e.g.
for e-discovery, document review, due diligence, legal research, etc.), or reassess
the risk profile and decide that it’s work they no longer need to do.
More than half of all law departments report that they outsource some work to non-
firm vendors (up from 43% in 2012, when we last asked the question, to 57% this
year). The two types of work most likely to be outsourced are litigation discovery
(including e-discovery) and document review.
Overall, Chief Legal Officers continue to struggle with rebalancing the mix of
resources they rely on to provide legal services. To do this, they are shifting work
from outside law firms to their own in-house lawyers; making greater use of contract
and temporary lawyers; moving some in-house work from lawyers to paralegals and
other paraprofessionals; and outsourcing to non-law-firm vendors. By
disaggregating legal work and pushing each element down to its most cost-effective
level, CLOs keep refining the legal service equation.
Technology and Data Analytics
The ongoing evolution of technology applicable to law practices is another market
force affecting the legal profession, according to CLOs surveyed. This can
represent new costs – as law departments must manage new risks arising from data
privacy and data security concerns. But technology can also be a tool to control
costs and play a contributory role in redesigning the in-house legal function in a new
and more efficient form.
One of the ways law departments can leverage technology is through management
metrics and data analytics, but most departments are at the beginning of the
learning curve in these areas. While 39% of law departments report collecting and
analyzing management metrics to improve efficiency, only 6.6% report getting great
value from those efforts. In the coming years, we expect to see steady increases in

SUMMARY & ANALYSIS
© 2016 Altman Weil, Inc. 2016 Chief Legal Officer Survey - iii
both the use of more sophisticated data analysis, and the value that CLOs will derive
from it.
In assessing their departments’ effectiveness in analyzing data on outside counsel
spending, CLOs give themselves a median rating of five on a zero to ten scale.
When asked how many of their top ten law firms have provided useful spend
analysis to the law department, 73% of CLOs reported that none of them had.
Although law departments still have much room to improve in this area, it seems that
law firms aren’t even in the game. We think law departments would reward law firms
that seized this obvious opportunity to provide meaningful data – and the bar for
success here is low.
Law Department Staffing and Budgeting
In the next twelve months, four times as many law departments plan to add in-house
lawyers as those planning to make cuts to lawyer staff, continuing a seven-year
survey trend in which increases exceed decreases by many multiples. The same
pattern of more increases than decreases is also planned for contract lawyers,
paralegals and support staff in law departments.
From 2015 to 2016, half of law departments increased their internal budgets, while
just over a quarter decreased in-house spend. This is the seventh year in a row that
the survey has found about twice as many departments increasing internal spend
compared to those decreasing the internal budget. For outside counsel budgets from
2015 to 2016, 41% of law departments decreased their spend, while 32% of law
departments made increases.
The Inside-Outside Relationship
Among the reasons that law departments switch law firms, the themes of
problematic service, cost and efficiency appear prominently. In the last twelve
months, 53% of law departments say they shifted a portfolio of work worth $50,000
or more because of a client service issue; 41% switched to another firm in pursuit of
lower fees; and 30% moved their work to a firm that was more effective in managing
matters.
Every year since 2009, the survey has asked law departments to assess law firms’
seriousness about changing their legal service delivery model. In 2016, for the
eighth year running, CLOs rated law firms at a median three on a zero to ten scale in
which zero equals ‘not at all serious’ about change and ten equals ‘doing everything
they can.’ For their part, law departments say they’re putting a moderate amount of
SUMMARY & ANALYSIS
© 2016 Altman Weil, Inc. 2016 Chief Legal Officer Survey - iv
pressure on law firms to change. Departments rate the level of pressure they apply
at a median six on a zero to ten scale.
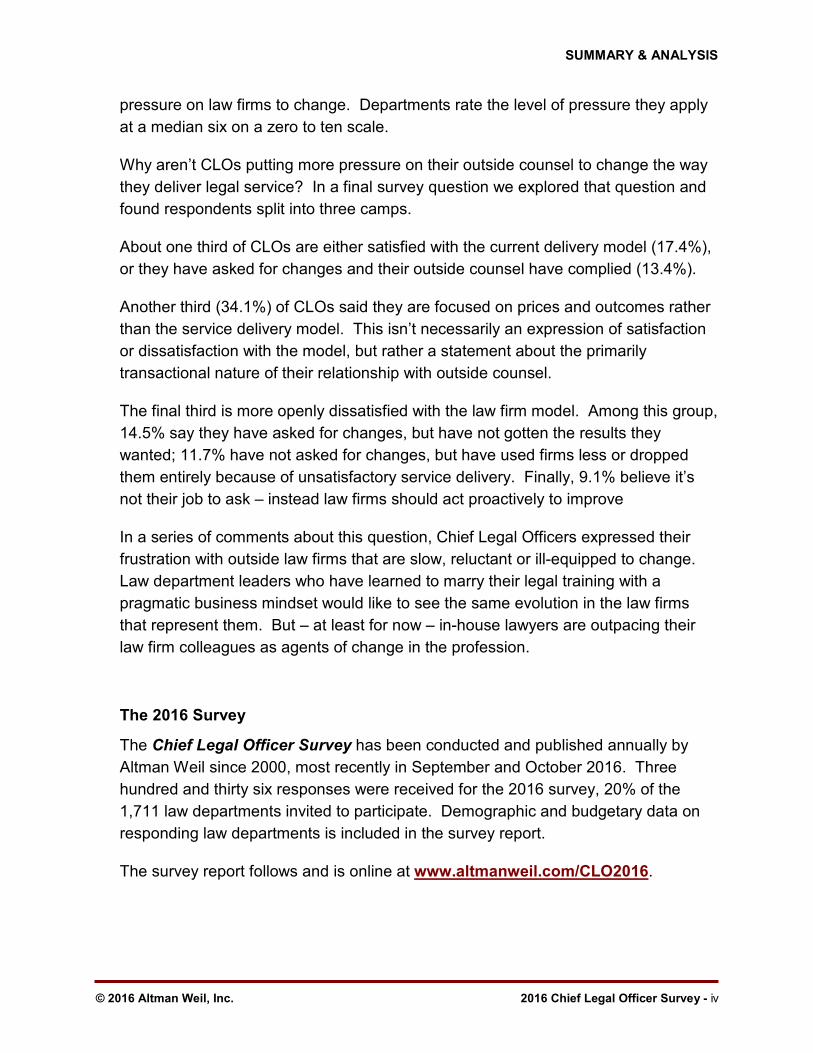
Why aren’t CLOs putting more pressure on their outside counsel to change the way
they deliver legal service? In a final survey question we explored that question and
found respondents split into three camps.
About one third of CLOs are either satisfied with the current delivery model (17.4%),
or they have asked for changes and their outside counsel have complied (13.4%).
Another third (34.1%) of CLOs said they are focused on prices and outcomes rather
than the service delivery model. This isn’t necessarily an expression of satisfaction
or dissatisfaction with the model, but rather a statement about the primarily
transactional nature of their relationship with outside counsel.
The final third is more openly dissatisfied with the law firm model. Among this group,
14.5% say they have asked for changes, but have not gotten the results they
wanted; 11.7% have not asked for changes, but have used firms less or dropped
them entirely because of unsatisfactory service delivery. Finally, 9.1% believe it’s
not their job to ask – instead law firms should act proactively to improve
In a series of comments about this question, Chief Legal Officers expressed their
frustration with outside law firms that are slow, reluctant or ill-equipped to change.
Law department leaders who have learned to marry their legal training with a
pragmatic business mindset would like to see the same evolution in the law firms
that represent them. But – at least for now – in-house lawyers are outpacing their
law firm colleagues as agents of change in the profession.
The 2016 Survey
The Chief Legal Officer Survey has been conducted and published annually by
Altman Weil since 2000, most recently in September and October 2016. Three
hundred and thirty six responses were received for the 2016 survey, 20% of the
1,711 law departments invited to participate. Demographic and budgetary data on
responding law departments is included in the survey report.
The survey report follows and is online at www.altmanweil.com/CLO2016.

SUMMARY & ANALYSIS
© 2016 Altman Weil, Inc. 2016 Chief Legal Officer Survey - v
Survey Methodology
The large majority of survey questions were posed in a multiple choice format and
responses are reported as received. Question text is transcribed in the following
report exactly as it appeared in the survey. Where there were special instructions,
rating scales, or supplemental definitions, that information is also included.
Free text data submitted by respondents was reviewed and, in a handful of cases,
edited to correct obvious typographical errors. For numeric entries, we made a
small number of corrections where the intended response was clear. In a few
instances we omitted a data point as impossible to derive from the information
provided.
About Altman Weil
Founded in 1970, Altman Weil, Inc. is dedicated exclusively to the legal profession.
It provides management consulting services to law firms, law departments and legal
vendors worldwide. The firm is independently owned by its professional
consultants, who have backgrounds in law, industry, finance, marketing,
administration and government.
More information on Altman Weil can be found at www.altmanweil.com.

[This page is intentionally blank.]

2016 CHIEF LEGAL OFFICER SURVEY
© 2016 Altman Weil, Inc. An Altman Weil Flash Survey - 1
1. Law Department Workforce
Within the next 12 months do you plan to increase or decrease your Law Department workforce?
TREND: Increase or decrease your in-house lawyer workforce
41.4%
38.1% 37.7%
42.0% 42.6%
37.9% 37.2%
9.2%5.7%
7.4%5.4%
11.5%
6.0%
8.5%
0%
10%
20%
30%
40%
50%
2010 2011 2012 2013 2014 2015 2016
Increase Decrease
78.6%
50.3%
18.3%
23.6%
12.5%
8.3%
8.5%
3.7%
4.3%
69.0%
68.2%
37.2%
0% 20% 40% 60% 80% 100%
Support staff
Paralegals
Contract lawyers
In-House Lawyers
Not sure Decrease Remain the same Increase
Trend data compiled from 2010 - 2016 Chief Legal Officer Surveys.
4.4 times as many
departments plan
increases as plan
decreases in 2016.
2016 CHIEF LEGAL OFFICER SURVEY
© 2016 Altman Weil, Inc. An Altman Weil Flash Survey - 2
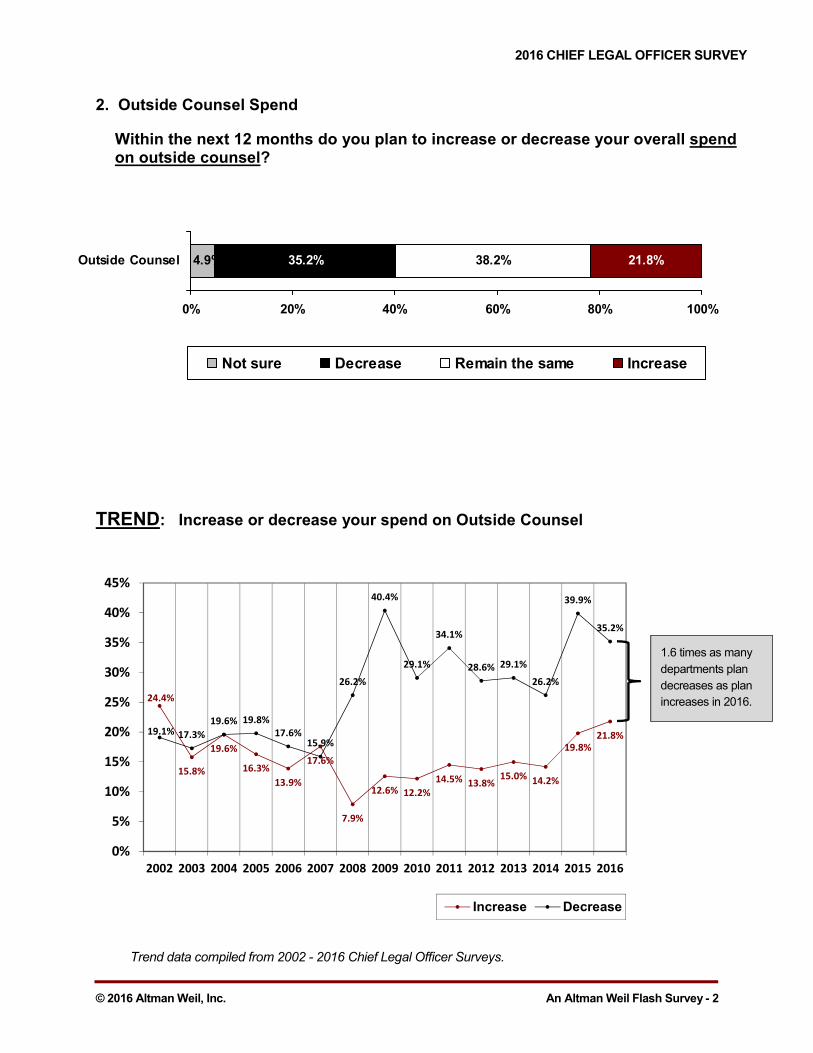
2. Outside Counsel Spend
Within the next 12 months do you plan to increase or decrease your overall spend on outside counsel?
TREND: Increase or decrease your spend on Outside Counsel
24.4%
15.8%
19.6%
16.3%
13.9%
17.6%
7.9%
12.6% 12.2%
14.5%13.8%
15.0%14.2%
19.8%
21.8%19.1% 17.3%
19.6% 19.8%
17.6%
15.9%
26.2%
40.4%
29.1%
34.1%
28.6% 29.1%
26.2%
39.9%
35.2%
0%
5%
10%
15%
20%
25%
30%
35%
40%
45%
2002 2003 2004 2005 2006 2007 2008 2009 2010 2011 2012 2013 2014 2015 2016
Increase Decrease
4.9% 35.2% 38.2% 21.8%
0% 20% 40% 60% 80% 100%
Outside Counsel
Not sure Decrease Remain the same Increase
Trend data compiled from 2002 - 2016 Chief Legal Officer Surveys.
1.6 times as many
departments plan
decreases as plan
increases in 2016.
2016 CHIEF LEGAL OFFICER SURVEY
© 2016 Altman Weil, Inc. An Altman Weil Flash Survey - 3
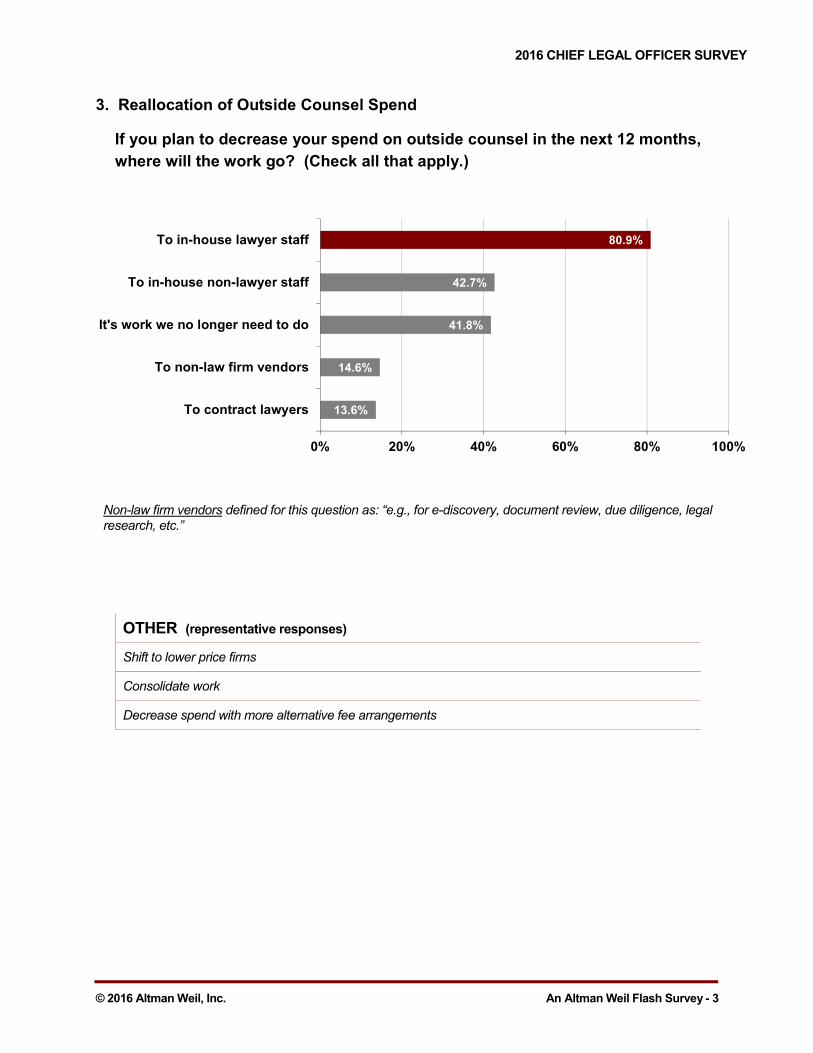
3. Reallocation of Outside Counsel Spend
If you plan to decrease your spend on outside counsel in the next 12 months,
where will the work go? (Check all that apply.)
13.6%
14.6%
41.8%
42.7%
80.9%
0% 20% 40% 60% 80% 100%
To contract lawyers
To non-law firm vendors
It's work we no longer need to do
To in-house non-lawyer staff
To in-house lawyer staff
Non-law firm vendors defined for this question as: “e.g., for e-discovery, document review, due diligence, legal research, etc.”
OTHER (representative responses)
Shift to lower price firms
Consolidate work
Decrease spend with more alternative fee arrangements

2016 CHIEF LEGAL OFFICER SURVEY
© 2016 Altman Weil, Inc. An Altman Weil Flash Survey - 4
4. Outsourcing
What types of work have you outsourced to non-law firm vendors in the last 12 months that you used to give to law firms? (Check all that apply.)
4a. What is the approximate total dollar value of the work shifted from law firms to non-law firm vendors in the last 12 months?
43.5%
8.3%
9.3%
12.0%
13.0%
33.3%
35.2%
0% 10% 20% 30% 40% 50%
None
Legal research
Contract management
Due diligence
Patent / IP work
Document review
Litigation discovery (including e-discovery)
Types of work outsourced
Minimum 1st
Quartile Median 3rd
Quartile Maximum Average
2016 $10,000 $100,000 $250,000 $825,000 $5,000,000 $754,644
45% of those who reported shifting work away from law firms provided the dollar value of that work.

2016 CHIEF LEGAL OFFICER SURVEY
© 2016 Altman Weil, Inc. An Altman Weil Flash Survey - 5
TREND: Outsourcing 2012 v. 2016 What types of work have you outsourced to non-law firm vendors in the last 12 months that you used to give to law firms? (Check all that apply.)
What is the approximate total dollar value of the work shifted from law firms to non-law firm vendors in the last 12 months?
43.5%
8.3%
9.3%
12.0%
13.0%
33.3%
35.2%
56.8%
5.2%
NA
10.9%
NA
26.0%
32.3%
0% 10% 20% 30% 40% 50% 60%
None
Legal research
Contract management
Due diligence
Patent / IP work
Document review
Litigation discovery (including e-discovery)
2012 2016
Minimum 1st
Quartile Median 3rd
Quartile Maximum Average
2016 $10,000 $100,000 $250,000 $825,000 $5,000,000 $754,644
2012 $40,000 $100,000 $300,000 $750,000 $2,000,000 $496,784
Trend data compiled from 2012 and 2016 Chief Legal Officer Surveys.
Additional outsourcing options were added in the 2016 survey.

2016 CHIEF LEGAL OFFICER SURVEY
© 2016 Altman Weil, Inc. An Altman Weil Flash Survey - 6
5. Law Department Management - Efficiency
In the last 12 months, have you done any of the following to increase your law department’s efficiency in its delivery of legal services? (Check all that apply.)
7.8%
13.8%
17.8%
25.9%
31.6%
39.1%
44.7%
56.9%
60.0%
0% 10% 20% 30% 40% 50% 60%
None
Project management training
Outsourcing to non-law firm vendors
Project staffing with contract / temporary lawyers
Knowledge management
Collection and analysis of management metrics
Greater use of paralegals and otherparaprofessionals
Internal restructuring / reorganization of resources
Greater use of technology tools
Efficiency tactics
OTHER (representative responses)
Creation of Chief Operations Officer role
Use of agile and lean methodologies
Strategic reset of outside counsel partnerships and pricing
More sophisticated matter level budgeting
Streamlined contract management

2016 CHIEF LEGAL OFFICER SURVEY
© 2016 Altman Weil, Inc. An Altman Weil Flash Survey - 7
5a. Value Achieved from Efficiency Tactics
Of the initiatives you’ve undertaken to improve efficiency in the last 12 months, please rate them on the value of the improvement you’ve achieved.
Rate 0 to 10: 0 = No value to 10 = Enormous value
11.6%
12.2%
6.3%
10.8%
9.9%
20.7%
31.7%
16.3%
15.1%
11.4%
8.6%
8.6%
13.6%
60.3%
58.5%
58.0%
67.9%
68.0%
71.4%
62.9%
56.8%
6.6%
7.3%
11.2%
13.2%
13.7%
16.4%
17.2%
18.5%
0% 20% 40% 60% 80% 100%
Collection and analysis ofmanagement metrics
Project management training
Knowledge management efforts
Outsourcing to non-law-firmvendors
Internal restructuring /reorganization of resources
Greater use of paralegals and otherparaprofessionals
Greater use of technology tools
Project staffing with contract /temporary lawyers
���� 0 – 1 ���� 2 – 4 ���� 5 ���� 6 – 8 ���� 9 - 10
0 = No value 10 = Enormous value
2016 CHIEF LEGAL OFFICER SURVEY
© 2016 Altman Weil, Inc. An Altman Weil Flash Survey - 8
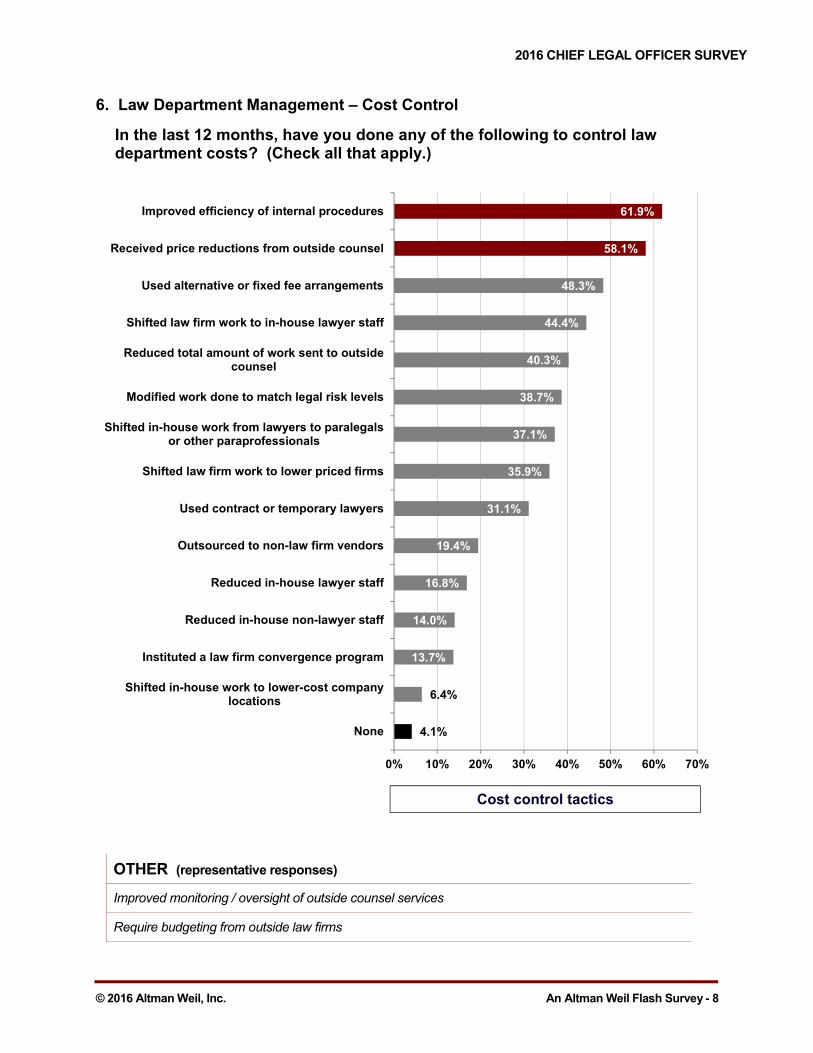
6. Law Department Management – Cost Control
In the last 12 months, have you done any of the following to control law department costs? (Check all that apply.)
4.1%
6.4%
13.7%
14.0%
16.8%
19.4%
31.1%
35.9%
37.1%
38.7%
40.3%
44.4%
48.3%
58.1%
61.9%
0% 10% 20% 30% 40% 50% 60% 70%
None
Shifted in-house work to lower-cost companylocations
Instituted a law firm convergence program
Reduced in-house non-lawyer staff
Reduced in-house lawyer staff
Outsourced to non-law firm vendors
Used contract or temporary lawyers
Shifted law firm work to lower priced firms
Shifted in-house work from lawyers to paralegalsor other paraprofessionals
Modified work done to match legal risk levels
Reduced total amount of work sent to outsidecounsel
Shifted law firm work to in-house lawyer staff
Used alternative or fixed fee arrangements
Received price reductions from outside counsel
Improved efficiency of internal procedures
Cost control tactics
OTHER (representative responses)
Improved monitoring / oversight of outside counsel services
Require budgeting from outside law firms
2016 CHIEF LEGAL OFFICER SURVEY
© 2016 Altman Weil, Inc. An Altman Weil Flash Survey - 9
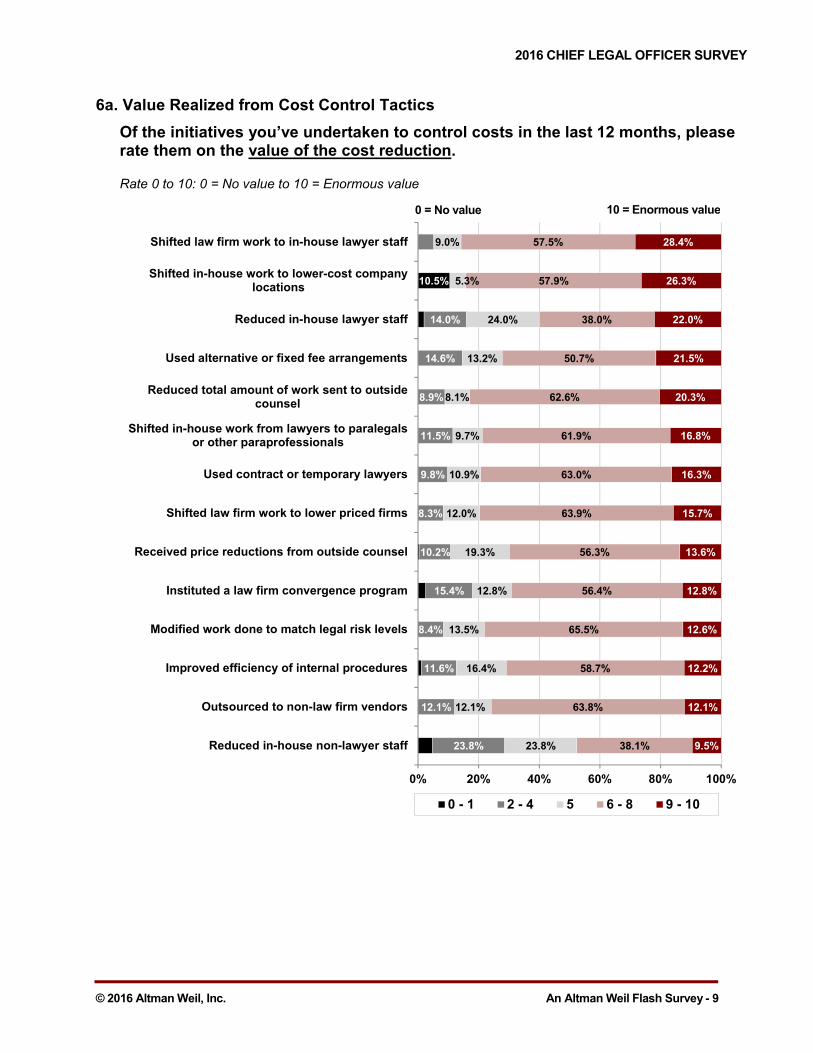
6a. Value Realized from Cost Control Tactics
Of the initiatives you’ve undertaken to control costs in the last 12 months, please rate them on the value of the cost reduction.
Rate 0 to 10: 0 = No value to 10 = Enormous value
10.5%
23.8%
12.1%
11.6%
8.4%
15.4%
10.2%
8.3%
9.8%
11.5%
8.9%
14.6%
14.0%
23.8%
12.1%
16.4%
13.5%
12.8%
19.3%
12.0%
10.9%
9.7%
8.1%
13.2%
24.0%
5.3%
9.0%
38.1%
63.8%
58.7%
65.5%
56.4%
56.3%
63.9%
63.0%
61.9%
62.6%
50.7%
38.0%
57.9%
57.5%
9.5%
12.1%
12.2%
12.6%
12.8%
13.6%
15.7%
16.3%
16.8%
20.3%
21.5%
22.0%
26.3%
28.4%
0% 20% 40% 60% 80% 100%
Reduced in-house non-lawyer staff
Outsourced to non-law firm vendors
Improved efficiency of internal procedures
Modified work done to match legal risk levels
Instituted a law firm convergence program
Received price reductions from outside counsel
Shifted law firm work to lower priced firms
Used contract or temporary lawyers
Shifted in-house work from lawyers to paralegalsor other paraprofessionals
Reduced total amount of work sent to outsidecounsel
Used alternative or fixed fee arrangements
Reduced in-house lawyer staff
Shifted in-house work to lower-cost companylocations
Shifted law firm work to in-house lawyer staff
0 - 1 2 - 4 5 6 - 8 9 - 10
0 = No value 10 = Enormous value

2016 CHIEF LEGAL OFFICER SURVEY
© 2016 Altman Weil, Inc. An Altman Weil Flash Survey - 10
7. Discounts on Outside Counsel Rates
If you received discounts on standard rates from outside counsel in the last 12 months, what was the average price reduction received?
TREND: Average Price Reductions from Outside Counsel
7.7%
58.0%
24.1%
10.2%
0%
10%
20%
30%
40%
50%
60%
70%
1% to 5% 6% to 10% 11% to 15% Over 15%
15%
50%
27%
9%7%
61%
24%
8%8%
58%
24%
10%
0%
10%
20%
30%
40%
50%
60%
70%
1% to 5% 6% to 10% 11% to 15% Over 15%
2014
2015
2016

2016 CHIEF LEGAL OFFICER SURVEY
© 2016 Altman Weil, Inc. An Altman Weil Flash Survey - 11
8. Outside Counsel Spend Analysis – Law Department Effectiveness
How effectively does your law department analyze and apply the data available to you on outside counsel spending?
The midpoint 5 = You have outside counsel spending data by firm and matter and periodically prepare reports for senior management.
BY DEPARTMENT SIZE: Effectiveness of data analysis
3.4%4.0%
7.4%
15.1%
7.0%
18.8%
13.1%
10.7%11.4%
4.0%5.0%
0%
5%
10%
15%
20%
25%
0 1 2 3 4 5 6 7 8 9 10
0 = Not effective 10 = Highly effective
Effectiveness of law department’s data analysis
EFFECTIVENESS
OF DATA ANALYSIS
DEPT. SIZE MEDIAN AVERAGE
1 lawyer 4 3.8
2-5 lawyers 5 4.8
6-10 lawyers 5 5.0
11-50 lawyers 5.5 5.4
50+ lawyers 6 6.1
All departments 5 5.2

2016 CHIEF LEGAL OFFICER SURVEY
© 2016 Altman Weil, Inc. An Altman Weil Flash Survey - 12
9. Outside Counsel Spend Analysis – Useful Analysis from Law Firms
Considering the ten law firms that receive the largest portion of your outside counsel spend, in the last 12 months how many of those firms have provided you with an analysis of spending data that was useful to your law department?
BY DEPARTMENT SIZE: Provision of useful analysis by top ten firms
73.0%
7.7% 9.3%
4.0%1.3% 1.3% 0.0% 1.0% 0.3% 0.3% 1.7%
0%
20%
40%
60%
80%
0 1 2 3 4 5 6 7 8 9 10
Number of your top ten law firms that provide useful data analysis
0 = None of our top ten firms 10 = All of our top ten firms
NUMBER OF TOP TEN FIRMS PROVIDING USEFUL ANALYSIS
DEPT. SIZE MEDIAN AVERAGE
1 lawyer 0 0.2
2-5 lawyers 0 0.4
6-10 lawyers 0 0.8
11-50 lawyers 0 0.7
50+ lawyers 0 1.6
All departments 0 0.8

2016 CHIEF LEGAL OFFICER SURVEY
© 2016 Altman Weil, Inc. An Altman Weil Flash Survey - 13
10. Reasons for Switching Law Firms
In the last 12 months, have you shifted a portfolio of work worth $50,000 or more from one law firm to another for any of the following reasons? (Check all that apply.)
2.0%
2.0%
8.0%
8.5%
22.1%
25.1%
26.6%
29.7%
41.2%
50.8%
53.3%
0% 10% 20% 30% 40% 50% 60%
Technology sophistication
Data security concerns
Geographic breadth
Predictable fees
Our lead lawyer(s) changed firms
Size or depth of firm resources
Conflicts
Managing matter efficiency
Lower fees
Legal expertise
Client service
Reasons for switching law firms
OTHER (representative responses)
Diversity
Responsiveness
Insurance requirements
2016 CHIEF LEGAL OFFICER SURVEY
© 2016 Altman Weil, Inc. An Altman Weil Flash Survey - 14
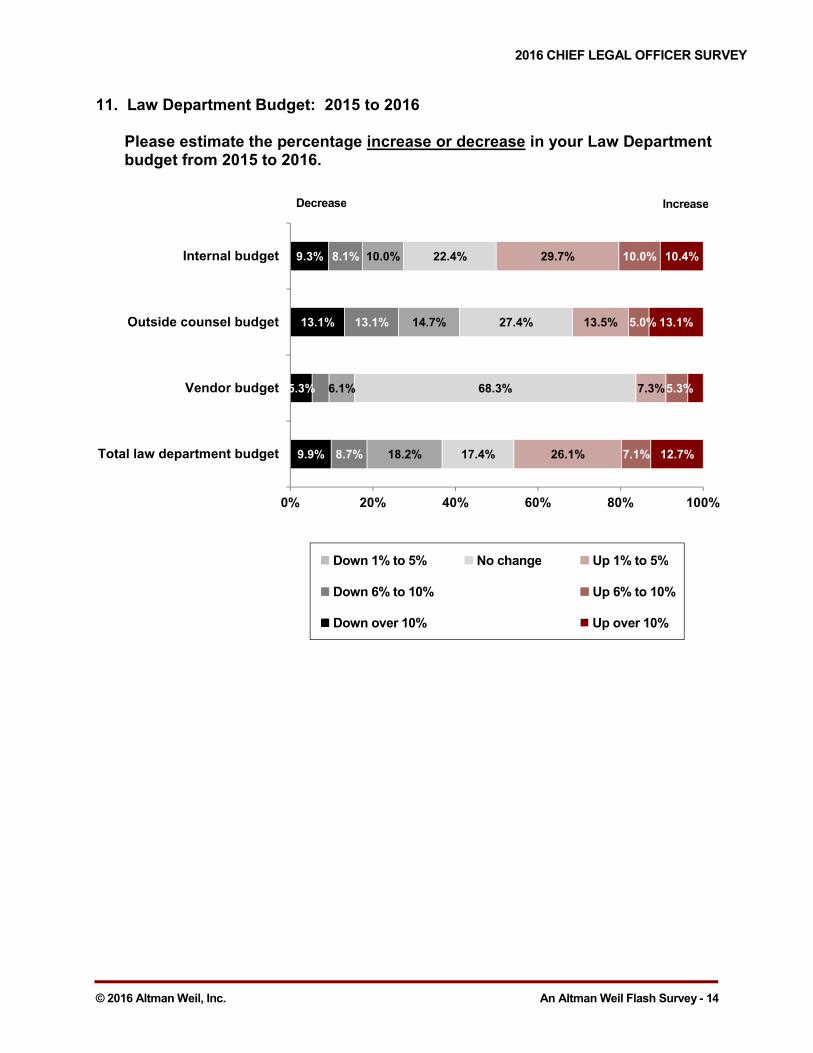
11. Law Department Budget: 2015 to 2016
Please estimate the percentage increase or decrease in your Law Department budget from 2015 to 2016.
9.9%
5.3%
13.1%
9.3%
8.7%
13.1%
8.1%
18.2%
6.1%
14.7%
10.0%
17.4%
68.3%
27.4%
22.4%
26.1%
7.3%
13.5%
29.7%
7.1%
5.3%
5.0%
10.0%
12.7%
13.1%
10.4%
0% 20% 40% 60% 80% 100%
Total law department budget
Vendor budget
Outside counsel budget
Internal budget
���� Down 1% to 5% ���� No change ���� Up 1% to 5%
���� Down 6% to 10% ���� Up 6% to 10%
���� Down over 10% � Up over 10%
Decrease Increase

2016 CHIEF LEGAL OFFICER SURVEY
© 2016 Altman Weil, Inc. An Altman Weil Flash Survey - 15
TREND: Increase or decrease in your Law Department budget
Tables show what percentage of departments increased their budget; what percentage decreased their budget; and what percentage made no change to the budget in each category.
Change in Law Department Internal Budget
Year Decreased Same Increased
% of Depts. % of Depts. % of Depts.
2011 to 2012 27.6% 26.3% 46.1%
2012 to 2013 17.3% 26.2% 56.6%
2013 to 2014 24.8% 20.8% 54.4%
2014 to 2015 25.2% 24.0% 50.9%
2015 to 2016 27.4% 22.4% 50.1%
Change in Outside Counsel Budget
Year Decreased Same Increased
% of Depts. % of Depts. % of Depts.
2011 to 2012 39.0% 26.9% 34.2%
2012 to 2013 47.0% 24.1% 28.9%
2013 to 2014 48.0% 26.0% 26.1%
2014 to 2015 43.5% 25.0% 31.6%
2015 to 2016 40.9% 27.4% 31.6%
Trend data compiled from the 2012 - 2016 Chief Legal Officer Surveys.

2016 CHIEF LEGAL OFFICER SURVEY
© 2016 Altman Weil, Inc. An Altman Weil Flash Survey - 16
TREND: Increase or decrease in your Law Department budget
Tables show what percentage of departments increased their budget; what percentage decreased their budget; and what percentage made no change to the budget in each category.
Change in Legal Matter Vendor Budget
Year Decreased Same Increased
% of Depts. % of Depts. % of Depts.
2011 to 2012 12.8% 65.2% 21.9%
2012 to 2013 13.9% 65.2% 20.9%
2013 to 2014 14.8% 69.7% 15.5%
2014 to 2015 15.6% 68.1% 16.3%
2015 to 2016 15.4% 68.3% 16.3%
Change in Total Law Department Budget
Year Decreased Same Increased
% of Depts. % of Depts. % of Depts.
2011 to 2012 34.1% 19.5% 46.3%
2012 to 2013 36.9% 26.2% 36.8%
2013 to 2014 40.4% 17.9% 41.7%
2014 to 2015 41.6% 16.7% 41.8%
2015 to 2016 36.8% 17.4% 45.9%
Trend data compiled from the 2012 - 2016 Chief Legal Officer Surveys.

2016 CHIEF LEGAL OFFICER SURVEY
© 2016 Altman Weil, Inc. An Altman Weil Flash Survey - 17
12. Law Department Budget Allocation
Please estimate the percentage of your total 2016 Law Department budget (internal and external legal spend) that each of the following components comprise. (Responses must equal 100%.)
Definitions:
Internal expenditures: e.g., Department compensation and benefits; contract lawyers, facilities,
technology and other operating costs
Outside Counsel: Total expenditures to outside law firms
Non Law-Firm Vendor: Expenditures for legal matters, e.g., e-discovery, document review, due diligence,
legal research, etc.
TREND – Law Department budget allocation
Budget allocation
Internal Outside Counsel
Non-firm vendor
2012 44.1% 52.0% 3.9%
2013 44.4% 49.6% 6.0%
2014 42.6% 50.3% 7.1%
2015 41.4% 52.4% 6.1%
2016 44.4% 49.4% 6.2%
44.4%
49.4%
6.2%
Internal expenditures
Outside Counsel
Non-law firm vendors
Trend data compiled from the 2012 - 2016 Chief Legal Officer Surveys.
2016 CHIEF LEGAL OFFICER SURVEY
© 2016 Altman Weil, Inc. An Altman Weil Flash Survey - 18
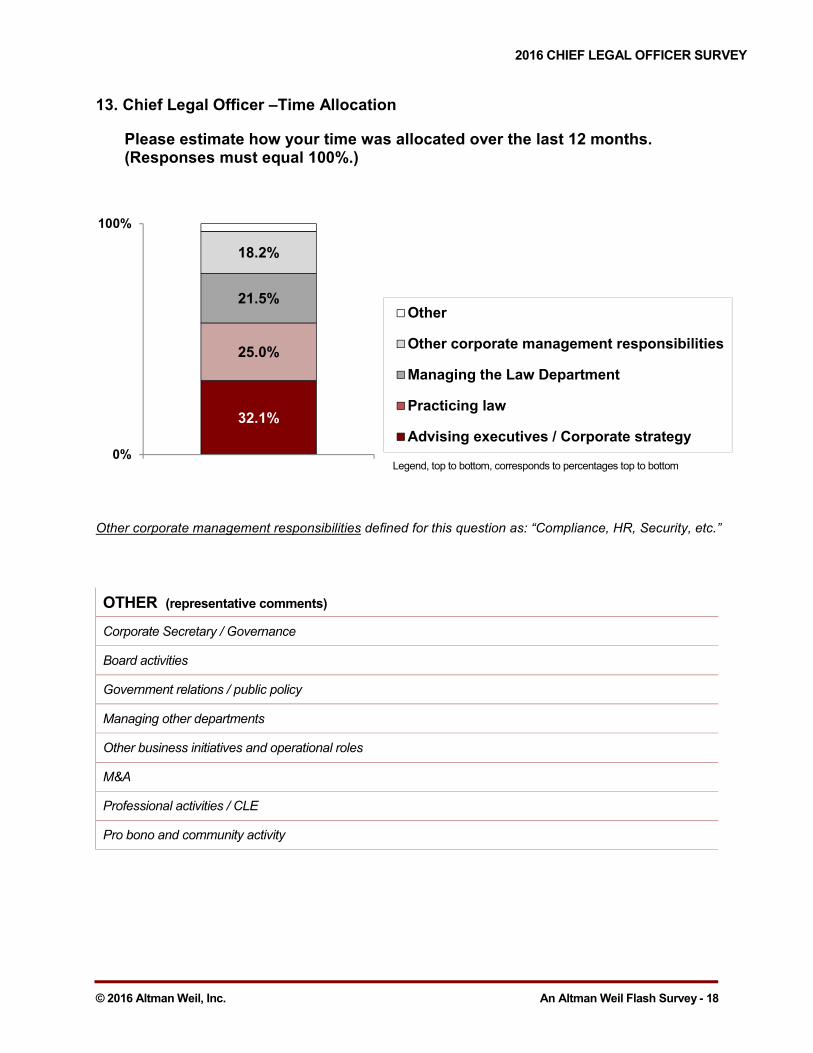
13. Chief Legal Officer –Time Allocation
Please estimate how your time was allocated over the last 12 months. (Responses must equal 100%.)
Other corporate management responsibilities defined for this question as: “Compliance, HR, Security, etc.”
OTHER (representative comments)
Corporate Secretary / Governance
Board activities
Government relations / public policy
Managing other departments
Other business initiatives and operational roles
M&A
Professional activities / CLE
Pro bono and community activity
32.1%
25.0%
21.5%
18.2%
0%
100%
Other
Other corporate management responsibilities
Managing the Law Department
Practicing law
Advising executives / Corporate strategy
Legend, top to bottom, corresponds to percentages top to bottom
2016 CHIEF LEGAL OFFICER SURVEY
© 2016 Altman Weil, Inc. An Altman Weil Flash Survey - 19
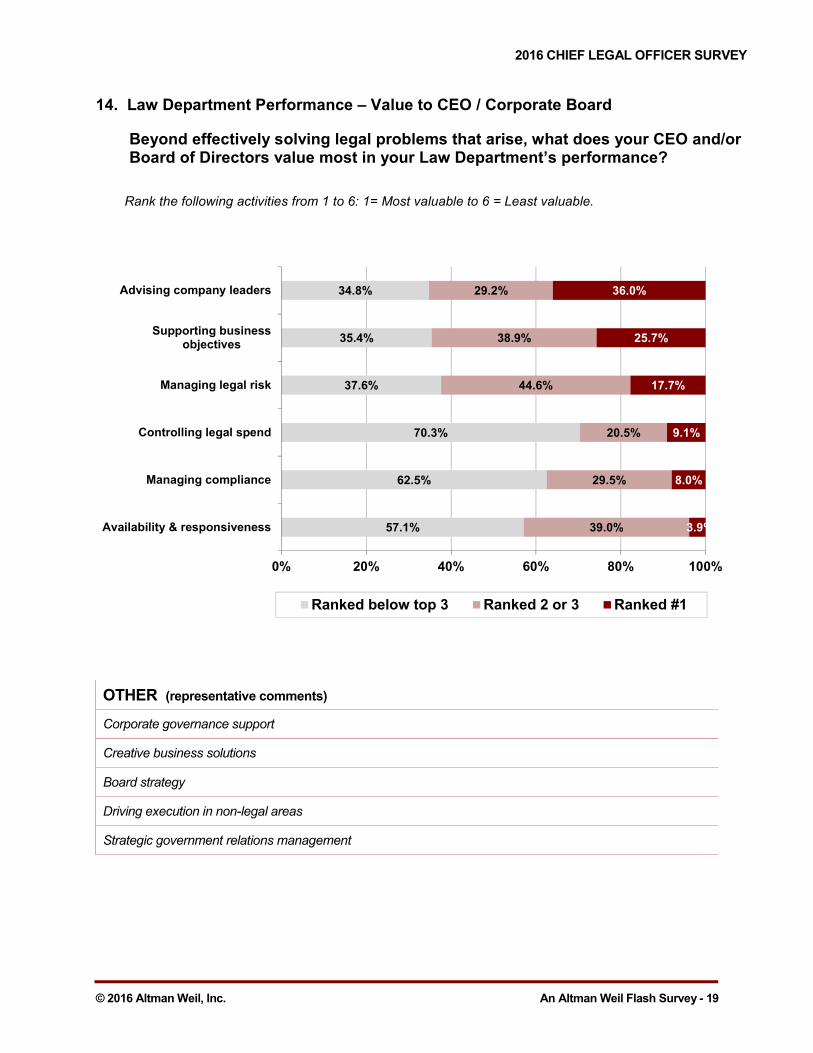
14. Law Department Performance – Value to CEO / Corporate Board
Beyond effectively solving legal problems that arise, what does your CEO and/or Board of Directors value most in your Law Department’s performance?
Rank the following activities from 1 to 6: 1= Most valuable to 6 = Least valuable.
OTHER (representative comments)
Corporate governance support
Creative business solutions
Board strategy
Driving execution in non-legal areas
Strategic government relations management
57.1%
62.5%
70.3%
37.6%
35.4%
34.8%
39.0%
29.5%
20.5%
44.6%
38.9%
29.2%
3.9%
8.0%
9.1%
17.7%
25.7%
36.0%
0% 20% 40% 60% 80% 100%
Availability & responsiveness
Managing compliance
Controlling legal spend
Managing legal risk
Supporting businessobjectives
Advising company leaders
Ranked below top 3 Ranked 2 or 3 Ranked #1

2016 CHIEF LEGAL OFFICER SURVEY
© 2016 Altman Weil, Inc. An Altman Weil Flash Survey - 20
15. Law Department Administrator
Do you have an administrator or other business manager who manages law department operations?
15a. Law Department Administrator
Where did your law department administrator / business manager come from?
33.3%
64.0%
2.7%
Yes
No
No, but we plan to in the next 12 months
3.4%
15.7%
34.8%
46.1%
0% 10% 20% 30% 40% 50%
A law firm
Another law department
Within the company / organization (but notfrom the law department)
Within the law department
BY DEPARTMENT SIZE
Yes No Plan to
1 lawyer 7.7% 92.3% 0.0%
2-5 lawyers 9.9% 88.7% 1.4%
6-10 lawyers 14.0% 82.5% 3.5%
11-50 lawyers 48.8% 47.7% 3.5%
50+ lawyers 77.6% 22.5% 0.0%

2016 CHIEF LEGAL OFFICER SURVEY
© 2016 Altman Weil, Inc. An Altman Weil Flash Survey - 21
15b. Law Department Administrator – Time Allocation
Please estimate the percentage of time your department administrator / business manager spends on each of the following functions.
OTHER (representative responses)
Practicing law
General administrative duties
Records management
Contract management
Project management / Process improvement
Paralegal responsibilities
Predictive analytics assessment
Special projects and planning
27.0%
19.8%
15.9%
14.9%
12.9%
9.6%
0%
100%
Other
People management
Technology management
Outside Counsel spend tracking and analysis
Financial management
Day-to-day operations
Legend, top to bottom, corresponds to percentages top to bottom
2016 CHIEF LEGAL OFFICER SURVEY
© 2016 Altman Weil, Inc. An Altman Weil Flash Survey - 22
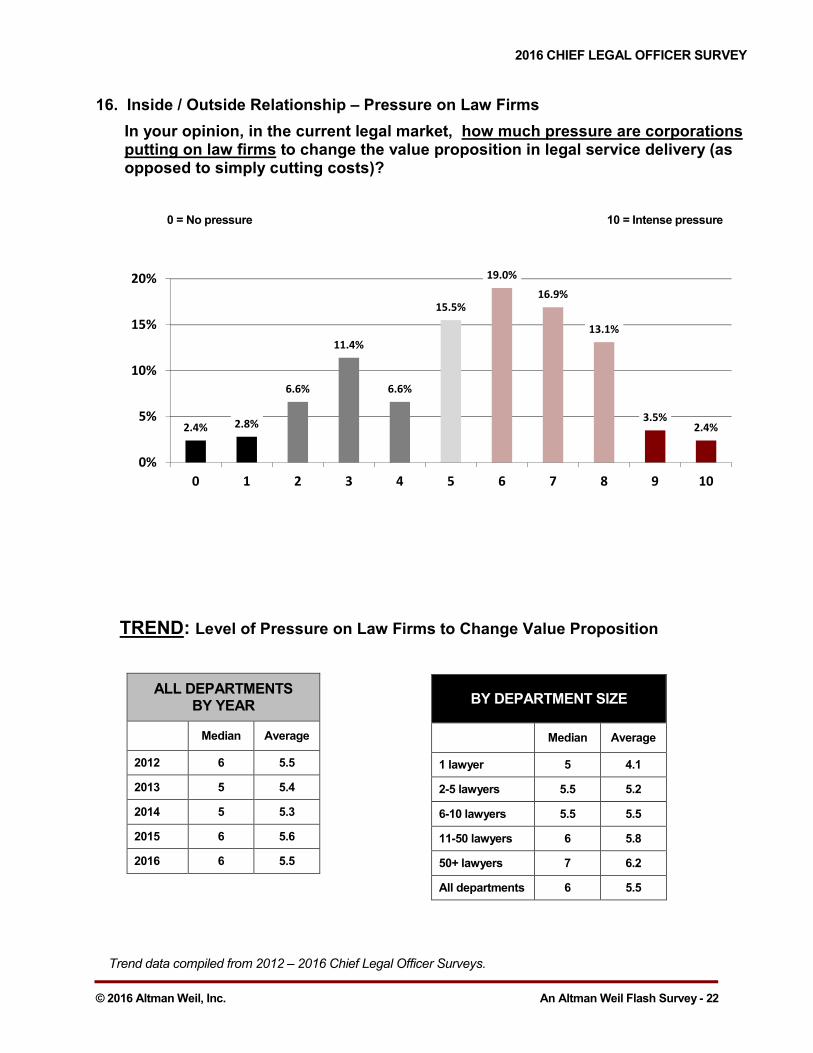
16. Inside / Outside Relationship – Pressure on Law Firms
In your opinion, in the current legal market, how much pressure are corporations putting on law firms to change the value proposition in legal service delivery (as opposed to simply cutting costs)?
TREND: Level of Pressure on Law Firms to Change Value Proposition
2.4% 2.8%
6.6%
11.4%
6.6%
15.5%
19.0%
16.9%
13.1%
3.5%
2.4%
0%
5%
10%
15%
20%
0 1 2 3 4 5 6 7 8 9 10
ALL DEPARTMENTS BY YEAR
Median Average
2012 6 5.5
2013 5 5.4
2014 5 5.3
2015 6 5.6
2016 6 5.5
Trend data compiled from 2012 – 2016 Chief Legal Officer Surveys.
BY DEPARTMENT SIZE
Median Average
1 lawyer 5 4.1
2-5 lawyers 5.5 5.2
6-10 lawyers 5.5 5.5
11-50 lawyers 6 5.8
50+ lawyers 7 6.2
All departments 6 5.5
0 = No pressure 10 = Intense pressure

2016 CHIEF LEGAL OFFICER SURVEY
© 2016 Altman Weil, Inc. An Altman Weil Flash Survey - 23
17. Inside / Outside Relationship – Law Firm Change Efforts
In your opinion, in the current legal market, how serious are law firms about changing their legal service delivery model to provide greater value to clients (as opposed to simply cutting costs)?
TREND: Law Firms’ Seriousness About Changing Service Delivery Model
6.2%
9.0%
21.0%
23.5%
13.8%
11.0%
8.6%
3.8%
2.1%1.0%
0.0%
0%
5%
10%
15%
20%
25%
0 1 2 3 4 5 6 7 8 9 10
0 = Not at all serious 10 = Doing everything they can
Trend data compiled from 2012 - 2016 Chief Legal Officer Surveys.
ALL DEPARTMENTS BY YEAR
Median Average
2012 3 3.8
2013 3 3.6
2014 3 3.4
2015 3 3.4
2016 3 3.4
BY DEPARTMENT SIZE
Median Average
1 lawyer 3 3.3
2-5 lawyers 3 3.3
6-10 lawyers 3 3.2
11-50 lawyers 3 3.5
50+ lawyers 3 3.6
All departments 3 3.4

2016 CHIEF LEGAL OFFICER SURVEY
© 2016 Altman Weil, Inc. An Altman Weil Flash Survey - 24
18. Outside Counsel Management
Please rate your law department’s effectiveness in getting good results from the following outside counsel management activities. The midpoint 5 = What you understand to be typical in US law departments of approximately your size.
18.9% 36.0%
25.2%
16.7%
10.7%
6.8%
4.4%
17.5%
18.0%
23.7%
19.8%
17.8%
11.4%
24.0%
42.9%
44.8%
51.7%
49.7%
50.8%
3.6%
10.2%
12.4%
14.4%
22.6%
32.7%
0% 20% 40% 60% 80% 100%
Data analysis
Budgets for matters
Bill review
Fee arrangements / pricing
Matter management (directing lawfirm's handling)
Law firm selection
���� 0 – 1 ���� 2 – 4 ���� 5 ���� 6 – 8 ���� 9 - 10
0 = Not effective 10 = Highly effective
2016 CHIEF LEGAL OFFICER SURVEY
© 2016 Altman Weil, Inc. An Altman Weil Flash Survey - 25
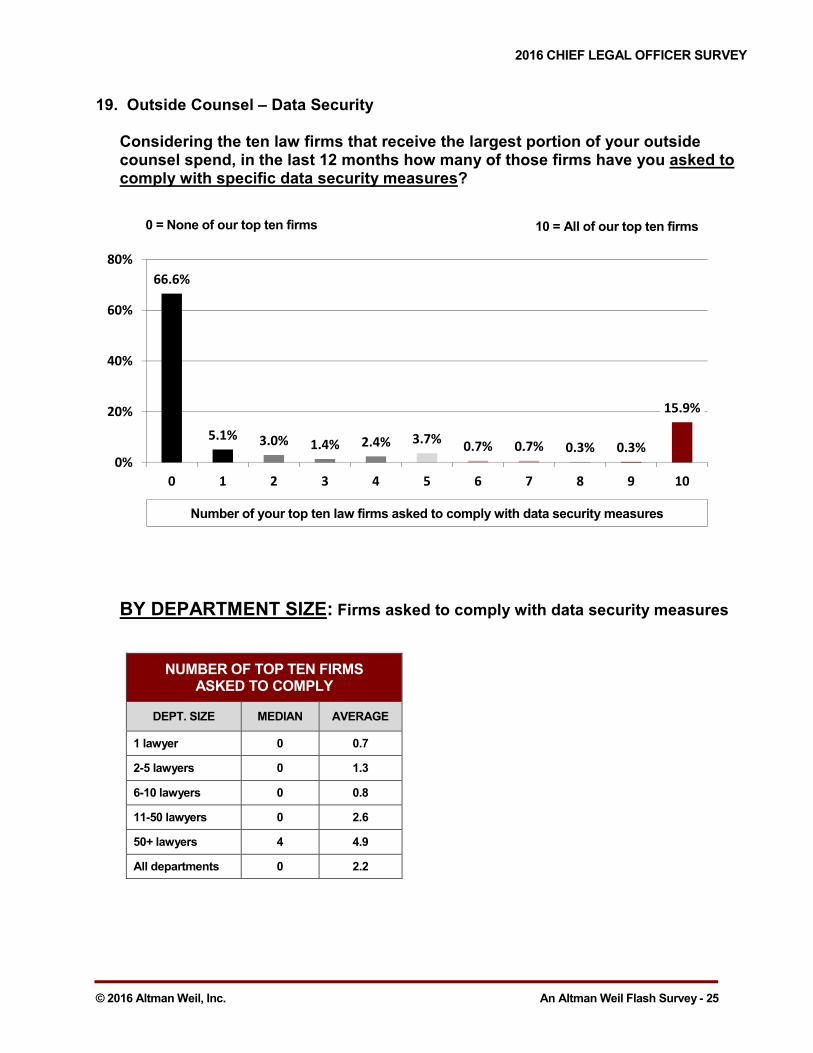
19. Outside Counsel – Data Security
Considering the ten law firms that receive the largest portion of your outside counsel spend, in the last 12 months how many of those firms have you asked to comply with specific data security measures?
BY DEPARTMENT SIZE: Firms asked to comply with data security measures
66.6%
5.1%3.0% 1.4% 2.4% 3.7%
0.7% 0.7% 0.3% 0.3%
15.9%
0%
20%
40%
60%
80%
0 1 2 3 4 5 6 7 8 9 10
Number of your top ten law firms asked to comply with data security measures
0 = None of our top ten firms 10 = All of our top ten firms
NUMBER OF TOP TEN FIRMS ASKED TO COMPLY
DEPT. SIZE MEDIAN AVERAGE
1 lawyer 0 0.7
2-5 lawyers 0 1.3
6-10 lawyers 0 0.8
11-50 lawyers 0 2.6
50+ lawyers 4 4.9
All departments 0 2.2

2016 CHIEF LEGAL OFFICER SURVEY
© 2016 Altman Weil, Inc. An Altman Weil Flash Survey - 26
20. Law Firm Service Improvements
Of the following service improvements and innovations, please select up to three that you would most like to see from your outside counsel. (Select up to three.)
OTHER (representative comments)
Diversity
More non-billed time to develop client relationships, gain understanding of the business
Outsourcing and/or other low cost alternatives for e-discovery and other discovery
Hybrid model, i.e. internal and outside counsel resources working together on the same matter
10.0%
13.4%
16.7%
22.4%
23.4%
32.8%
33.1%
36.1%
43.1%
52.5%
0% 10% 20% 30% 40% 50% 60%
Technology efficiencies
Alternative project staffing
Preventative law strategies
Greater effort to understand our business
Improved communication and responsiveness
More efficient project management
Modification of work to match our legal risk
Non-hourly based pricing structures
Improved budget forecasting
Greater cost reduction
Alternative project staffing defined for this question as “greater use of contract lawyers, paraprofessionals, etc.”

2016 CHIEF LEGAL OFFICER SURVEY
© 2016 Altman Weil, Inc. An Altman Weil Flash Survey - 27
21. Legal Market – Forces Driving Change
What one or two forces do you think will most change the legal market in the next 3 to 5 years? (Open-ended question) We categorized free-text responses and have included a selection of comments from the top categories presented in order of most-frequently cited topics.
TECHNOLOGY
Technology allowing for more in-house work
Better technology should lead to reduced costs
Effect of technological innovation in reducing demand for hourly services
Technology tools reduce the need for lawyers on more work
Value-added metrics will change outside counsel usage
Technology, including cloud and analytics which commoditize some legal work and [create] security risk
Data security – what happens when a big law firm’s network is breached and confidential client info is thrust
into the public domain?
Big data – more automated legal work
Development of artificial intelligence
Changes in laws or regulations arising out of technology advances
COST PRESSURES / PRICING
Cost pressures on companies will result in downward pressure on legal spend
Increased pressure to obtain excellent outside counsel at mitigated prices
Companies not willing to pay high hourly rates for other than bet the company work
Better budgeting and fixed fee arrangements to match costs of legal work to value
2016 CHIEF LEGAL OFFICER SURVEY
© 2016 Altman Weil, Inc. An Altman Weil Flash Survey - 28
COST PRESSURES / PRICING (continued)
Hourly rates at top end pushing clients to second-tier firms
Increasing limit on use of money center/national firms to true ‘bet the company’ matters
More routine work going to smaller, regional firms
An increasingly small number of increasingly senior law firm lawyers will be able to command high rates;
everything else will become commoditized
Need to address ever-escalating starting salaries with alternative fee arrangements
LEGAL PROFESSION DEMOGRAPHICS
Retirement of the older generation out of law firms (the people most change averse)
Decline in law school enrollments will create a dearth of good young lawyers
Continuing push-back by younger lawyers against being a “slave” to a law firm practice
War for talentI losing too many talented people to technology, banking and other professions
Excess lawyers in the market making internal hires cheaper and more efficient
REGULATORY BURDEN
Continuing increases in regulatory enforcement drive even greater compliance focus
Increased regulatory burden will drive innovation in delivery of legal services
Cost containment needed due to increased regulation
Speed of regulatory change
Globalization of business and trade with uncoordinated international regulatory regimes
Increasing regulatory complexity will increase the importance of having depth, expertise and relationships in
Washington

2016 CHIEF LEGAL OFFICER SURVEY
© 2016 Altman Weil, Inc. An Altman Weil Flash Survey - 29
INSOURCING LEGAL WORK
Continued emphasis from companies to bring more work in-house to save money
Decline in importance of outside law firms in favor of more in-house experience and staffing
Advancing sophistication and capabilities of in-house teams
Greater reliance on in-house for commodity type legal work
Greater use of in-house legal resources, leaving primarily litigation and large M&A to law firms
ALTERNATIVE SERVICE PROVIDERS
Increasing use of non-lawyer professionals for work such as contracting, e-discovery, dispute resolution
Accounting firms increasingly providing legal services
Unbundling of law firm services to non-legal contractors
LAW FIRM BUSINESS MODEL
Supply and demand mismatch for legal services will force law firms to change their economic models – with a strata
of top tier firms and practice areas that may still be able to command premium rates but a huge swath of firms and
practice areas that will need to compete on price (with quality a given)
The widening gap between traditional legal practice and modern business practice
Big companies forcing a change in the business model
Firms figuring out how to fundamentally change their business model and forcing others to follow

2016 CHIEF LEGAL OFFICER SURVEY
© 2016 Altman Weil, Inc. An Altman Weil Flash Survey - 30
22. BONUS QUESTION – Law Firm Service Delivery Model
In Altman Weil’s 2016 survey of law firm leaders, Law Firm in Transition, 59% of
Chairs and Managing Partners said their law firms were not doing more to change
the way they deliver legal services because “Clients aren’t asking for it.”
Which of the following statements best reflects your law department’s position on
changing the way your outside counsel deliver legal services? (Choose one.)
4.4%
7.3%
9.1%
13.4%
14.5%
17.4%
34.1%
0% 10% 20% 30% 40%
We have not asked for changes, but we havedropped firms for unsatisfactory service delivery
We have not asked for changes, but we haveused firms less because of unsatisfactory
service delivery
It shouldn't be our job to ask - law firms shouldact proactively to improve.
We have asked for changes and our outsidecounsel have complied.
We have asked for changes, but we have notgotten the results we want.
We are generally satisfied with current servicedelivery models.
We are focused on prices and outcomes, ratherthan the service delivery model.
Your law department’s position

2016 CHIEF LEGAL OFFICER SURVEY
© 2016 Altman Weil, Inc. An Altman Weil Flash Survey - 31
22. BONUS QUESTION – Law Firm Service Delivery Model
In Altman Weil’s 2016 survey of law firm leaders, Law Firm in Transition, 59% of
Chairs and Managing Partners said their law firms were not doing more to change
the way they deliver legal services because “Clients aren’t asking for it.”
COMMENTS
I have had conversations with outside counsel about changing the way they deliver legal services but those
who care have trouble figuring out how to do it and are hesitant to do it if it doesn't make them more money,
while others either don't care or typically engage in communication that is only transactional as opposed to
strategic. In other words, they focus on the case and the fees and don't have insight into a broader business
approach to strategy.
Internal counsel is typically very stretched for time and thus find it challenging to develop proactive plans for
improvement to legal services. Outside firms need to do this.
Firms and vendors should not get so comfortable in their spaces and be foolish to believe they may not be at
risk of losing business. Business is business. Customer service should always be a top objective driving
behavior.
The business model is broken. There will be continued pressure on fees. It is up to law firms to solve this.
I personally believe it's B.S. that clients aren't asking for change. There's no way law firms can believe that
they are entitled to increase their billing rates by 4-10% per year without limit. I hated the billable hour model
as a billing partner, and I hate it more as a GC.
Absolutely believe that outside counsel should periodically inform clients of additional offerings, or other
alternative arrangements that may work for their clients to enhance satisfaction.
Our current counsel has been largely responsive to requests for changes. Typically, traditional big law firms
are less flexible on changing fee approach.
We are generally cost benefit focused, but have favored firms that are willing to consider alternative
approaches.
It is false to just sit down and expect that law firms will change on their own. Change takes place when the
market asks for it. Focus on pricing may however lead into negative development on quality - must maintain a
careful balance.
Any law firm that says its clients have not asked for changes is being willfully blind. As an industry, law firms may delay the advent of new service models, but not block it. The first few firms to radically change the model and focus on delivering value have the potential to become market leaders overnight.

[This page is intentionally blank.]

2016
Chief Legal Officer Survey
Participant Demographics

2016 CLO SURVEY – PARTICIPANT DEMOGRAPHICS
© 2016 Altman Weil, Inc. An Altman Weil Flash Survey - 32
1. How many in-house attorneys are in your department (in all locations)?
Minimum 1st
Quartile Median 3rd
Quartile Maximum Average
Lawyers 1 4 9 28 980 35
2. What are your organization’s annual revenues?
Minimum 1st
Quartile Median 3rd
Quartile Maximum Average
Revenue $12M $1.1B $3.5B $9B $150B $9.1B
SIZE / REVENUE CORRELATION:
29%
10%
29%
50%
17%
36%
13%
24%
41%
62%
27%
7%
72%
53%
8%
5%
0% 20% 40% 60% 80% 100%
Over $20B
$10.1B to $20B
$5.1B to $10B
$1B to $5B
Under $1B
1 lawyer 2-5 lawyers 6-10 lawyers 11-50 lawyers Over 50 lawyers

2016 CLO SURVEY – PARTICIPANT DEMOGRAPHICS
© 2016 Altman Weil, Inc. An Altman Weil Flash Survey - 33
3. What percentage of the lawyers in your department are based outside the US?
4. Is your organization:
8.0%
14.6%
6.6%
4.2%
3.8%
62.7%
0% 10% 20% 30% 40% 50% 60% 70%
Over 50%
26% - 50%
16% - 25%
11% - 15%
6% - 10%
0% - 5%
1.1%
8.9%
0.7%
28.0%
61.4%
0% 10% 20% 30% 40% 50% 60% 70%
Government Legal Agency
Not-for-Profit
Partnership
Private
Public

© 2016 Altman Weil, Inc. 2016 Chief Legal Officer Survey
Contact Altman Weil 3748 West Chester Pike, Suite 203 Newtown Square, PA 19073 (610) 886-2000 www.altmanweil.com [email protected]