Embed Size (px)
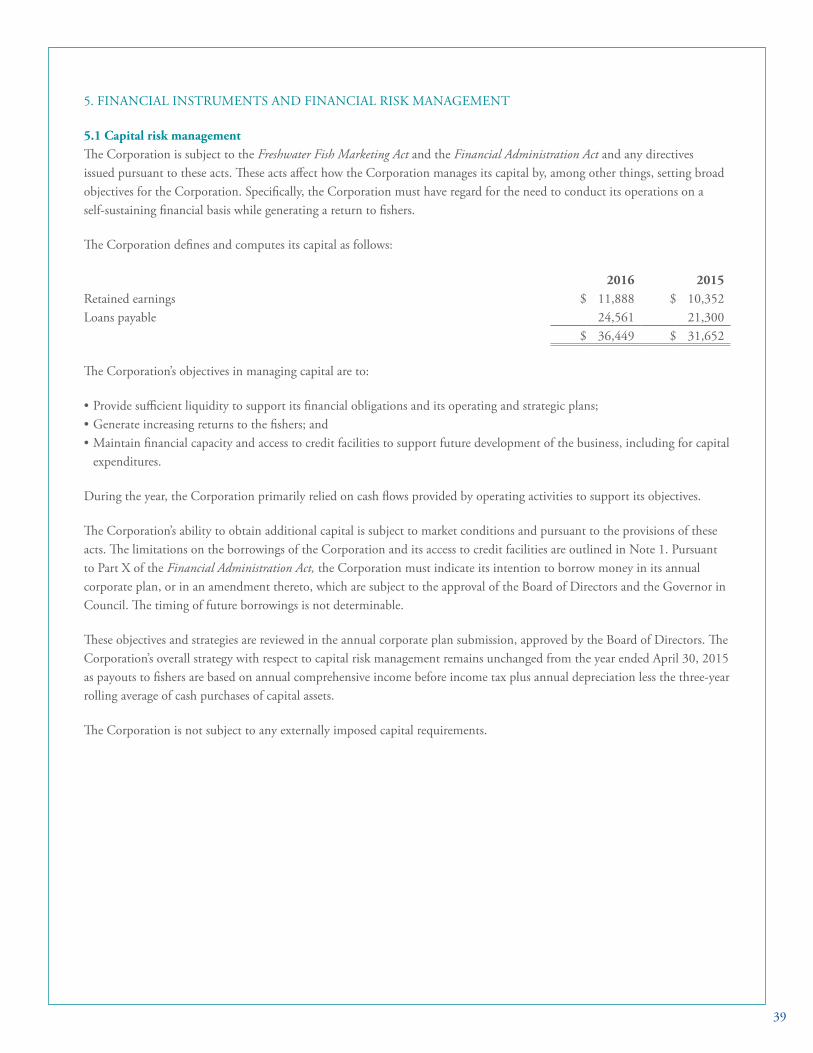
Citation preview
2016 ANNUAL REPORT


3
Letter of Transfer 5
President’s Report 6
Corporate Profile 8
Returns to Fishers 9
Management Discussion and Analysis 10
Financial Returns and Deliveries 18
Ten Year Financial Summary 20
Management’s Responsibility for Financial 22Reporting
Independent Auditor’s Report 23
Financial Statements 24
Corporate Governance 56
Board of Directors 57
Audit and Risk Committee 57
Corporate Officers 58
Employee Recognition 58

5
LETTER OF TRANSFER FROM CHAIRPERSON OF THE BOARD OF DIRECTORS TO MINISTER OF FISHERIES AND OCEANSHonourable Dominic LeBlanc Government of Canada Minister of Fisheries and Oceans Room 556, Confederation Building Ottawa, Ontario K1A 0A6
Dear Minister:
We are pleased to submit Freshwater Fish Marketing Corporation’s Annual Report, in accordance with Section 150 of the Financial Administration Act (FAA). The Annual Report includes audited financial statements for the fiscal year ending April 30, 2016.
It has proven to be a difficult year for Freshwater, as Board composition changed significantly. Freshwater began the year with one vacant seat and Russell Fast as Chairperson; he resigned his position on December 14, 2015. With the subsequent resignation of Director Krista Boryskavich, the Board found itself with a total of three vacant seats. Finally, a fourth member on leave for the fiscal year, Marielle Wharton, advised she will not return.
To fill the vacant positions, David Bevan was appointed Chairperson, and Dwight Williamson and John Wood were appointed as Directors. All three appointments were effective February 26, 2016, to be reviewed after six months. David Bevan was formerly the Associate Deputy Minister at the Department of Fisheries and Oceans Canada (2010-2014). Dwight Williamson was Assistant Deputy Minister for Manitoba Conservation and Water Stewardship (2008-2013); and John Wood was the previous President and CEO of Freshwater (2006-2014).
On March 11, 2016, the Board appointed John Wood to the position of Interim President for a period of 60 days to stand in for Donald Salkeld, who has been on leave from his position as President and CEO.
Yours sincerely,
David Bevan Chairperson of the Board
PRESIDENT’S REPORTAs I prepared to write my ninth President’s Report in 10 years, I took a look at previous reports. During these 10 years, the Corporation has invested significantly to maintain and improve the plant, processing equipment and field operations infrastructure. The bricks and mortar of the plant or the numbers in financial statements are visible indicators of Freshwater and its performance, but Freshwater has many strengths and assets defining its value that are difficult to quantify.
Freshwater’s value can be found in its stakeholders – all the fishers, employees, customers, suppliers and government shareholders working towards a common goal. Achieving that goal has been challenging without a strategic plan supported by all stakeholders, and yet fishers in approximately 50 communities served by Freshwater have seen their economies greatly improved with their local resource, the fish harvest, having access to global markets.
The Freshwater brand is known and trusted globally. This brand recognition is an asset that opens doors to new markets and helps stabilize pricing. The fishing industry and Freshwater have remained resilient in the face of past crises – from floods in Manitoba, fires in Alberta, the closure of the Russian market and the untimely mid-season closure of the ice-making facility at the Winnipeg processing plant. Freshwater’s reputation and brand equity has been achieved by nearly half a century of consistently producing and delivering quality fish products supported by all stakeholders.
For many of the years that I served as President and CEO (2006-2014), Freshwater was faced with significant pressure in three main areas: a weak U.S. dollar that reduced prices in Canadian dollar terms; a

7
need to invest in capital for the Winnipeg processing plant to remain in operation and a government shareholder focus on increasing retained earnings to healthier financial levels. The impact of these challenges are now largely behind us.
The year ending April 30, 2016 has had its share of issues. The decline of walleye deliveries and the make-up of the size grades for the species, favouring less than prime sizes, is the most concerning of the issues. Higher-than-planned lake whitefish deliveries, along with a poorly-executed marketing strategy, contributed to significant lake whitefish inventory growth. Staff turnover during the year was another critical issue, with nearly 30% of salaried staff departing.
Freshwater looks forward to continuing to work with fishers to deliver the wild-caught fish from the pristine lakes of Canada to customers around the world.
Yours sincerely,
John Wood Interim President Winnipeg, Manitoba
CORPORATE PROFILEFreshwater is a self-sustaining federal Crown corporation – the buyer, processor and marketer of all commercially-caught freshwater fish from our mandate region of Manitoba, Alberta and the Northwest Territories. The Corporation also buys fish from outside our mandate region, specifically Saskatchewan. Although Alberta remains a signatory to the Freshwater Fish Marketing Act, the Province of Alberta has suspended commercial fishing in order to focus its resources on sport fishing, resulting in no deliveries from Alberta since the end of fiscal 2014/15.
Freshwater’s mission is to provide the core activities of the legislated mandate, including purchasing all fish offered for sale; creating an orderly market; promoting international markets; increasing trade in fish; and maximizing returns to commercial fishers. To fulfill this mandate, Freshwater supports the orderly management of the freshwater fishery through planned harvesting, processing and marketing strategies. Final payments to fishers are distributed annually by species pool from available cash surpluses.
A Board of nine Directors, including two sequential Chairpersons and two Presidents, governed Freshwater during the 2015/16 fiscal year. Russell Fast was the Chair of the Board of Directors until his resignation on December 14, 2015. David Bevan, former Associate Deputy Minister for the Department of Fisheries and Oceans, was appointed Chairperson effective February 26, 2016.
Donald Salkeld served as President and CEO until March 8, 2016, but has
been on leave from the Corporation
since
that date. In February 2016, former President and CEO John Wood returned to the Board as a Director and was subsequently appointed Interim President by the Board. One Board member remained on leave until year-end, resigning shortly thereafter.
All Board positions are federal Order-in-Council appointments with three members selected on recommendation of the participating provincial/territorial governments.
Freshwater employs more than 180 full-time production staff and adds to the workforce during peak periods. Fish are caught by approximately 1,650 fishers across the mandate region and then are purchased and graded by contracted agents and corporate agencies at more than 49 delivery points. Freshwater is a significant contributor to the economies of more than 50 communities in Canada’s north and does this by acting as the marketer of their harvest to over 14 countries.
The Freshwater brand remains at the top of the U.S. walleye (pickerel) market. Freshwater is the largest supplier of lake whitefish and lake whitefish caviar to Finland and of northern pike to France. It is the largest individual supplier of freshwater fish products to the U.S. gefilte fish market and maintains a kosher-certified plant. During the fiscal year, markets were expanded for carp, carp roe and milt in eastern Europe and Israel.
In over four decades of business in Canada and abroad, Freshwater has established and sustained a solid reputation based on product reliability, quality and safety. We are a recognized price leader, exercising our mandate to market fish inter-provincially and internationally.

9
RETURNS TO FISHERSFreshwater uses a payment structure that determines initial and final payments under a pooling system. The final payments are determined by allocating receipts and costs by fish species.
The profit distribution policy ensures that at the end of the fiscal year an appropriate portion of net income from each species pool is allocated to long-term reinvestment in Freshwater. After the annual audit by the Office of the Auditor General of Canada, Freshwater determines final payments from the pooled receipts. Final payments are made from any corporate cash surpluses when sales revenues exceed all direct and allocated costs for a species. The table on pages 18 and 19 provides a ten-year history of pool results.
The average price paid to fishers this year (inclusive of final payments) was $1.98/kg.
Freshwater continues to develop existing and new international markets and demand remains strong for our products. Our access to a wide variety of species and year-round inventory gives us a competitive advantage worldwide.
MANAGEMENT DISCUSSION AND ANALYSIS
The Corporation did meet its profit, per cent return to fishers, and fish delivery volume targets, but a number of factors in 2016 adversely affected the operational and financial performance of the Corporation. The major factors that impacted Freshwater over the year were:
• Deliveries of walleye were below plan. Lower levels of walleye to sell to Freshwater’s major markets in the U.S. midwest reduced gross sales revenue and the opportunity to realize price gains while the U.S. dollar (USD) was strong. Walleye volume processed through the plant absorbs significant overhead and since overall processing volume in the plant was reduced because of lower than planned walleye deliveries, species with lower margins absorbed additional overhead costs. Production volume
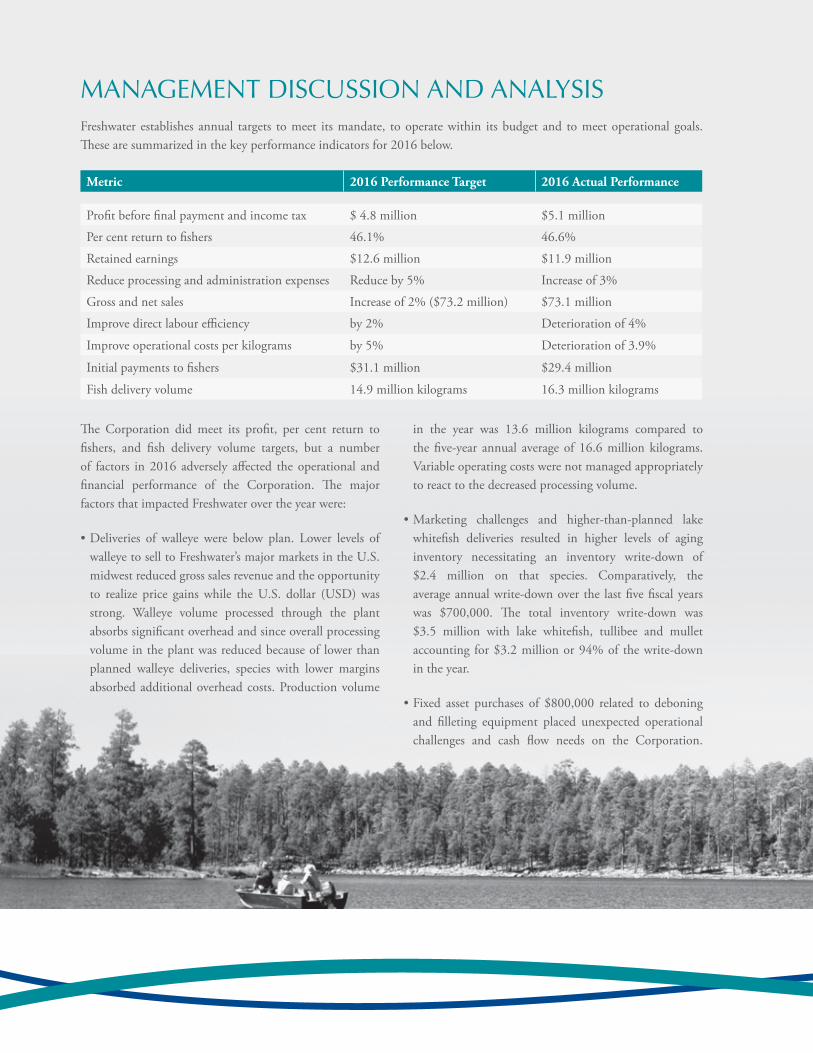
Freshwater establishes annual targets to meet its mandate, to operate within its budget and to meet operational goals. These are summarized in the key performance indicators for 2016 below.
Metric 2016 Performance Target 2016 Actual Performance
Profit before final payment and income tax $ 4.8 million $5.1 million
Per cent return to fishers 46.1% 46.6%
Retained earnings $12.6 million $11.9 million
Reduce processing and administration expenses Reduce by 5% Increase of 3%
Gross and net sales Increase of 2% ($73.2 million) $73.1 million
Improve direct labour efficiency by 2% Deterioration of 4%
Improve operational costs per kilograms by 5% Deterioration of 3.9%
Initial payments to fishers $31.1 million $29.4 million
Fish delivery volume 14.9 million kilograms 16.3 million kilograms
in the year was 13.6 million kilograms compared to the five-year annual average of 16.6 million kilograms. Variable operating costs were not managed appropriately to react to the decreased processing volume.
• Marketing challenges and higher-than-planned lake whitefish deliveries resulted in higher levels of aging inventory necessitating an inventory write-down of $2.4 million on that species. Comparatively, the average annual write-down over the last five fiscal years was $700,000. The total inventory write-down was $3.5 million with lake whitefish, tullibee and mullet accounting for $3.2 million or 94% of the write-down in the year.
• Fixed asset purchases of $800,000 related to deboning and filleting equipment placed unexpected operational challenges and cash flow needs on the Corporation.
11
A deboning machine that was purchased for mincing was not operational between November 2015 and January 2016. Critical sales revenue was lost and inventory write-downs were necessary as a result. $96,000 in impairment costs was recognized and the bulk of the equipment purchased remains idle.
• Employee turnover was excessive during the year. Of approximately 50 salaried employees, 16 people or about 30% of Freshwater’s staff left between May 1, 2015 and April 30, 2016. A lack of critical skills and human resources affected the operational and financial health of the Corporation in the year.
• An environmental liability to remediate the Corporation’s property in Hay River, Northwest Territories (NWT) was recognized for $1.1 million. The liability is for fuel storage tanks that leaked fuel into the groundwater on the property. The Corporation has worked with the Government of the NWT over the last few years to negotiate the remediation.
Although the Corporation faced these challenges, at April 30, 2016, Freshwater exceeded its planned operating profit before tax and final payment to fishers of $4.8 million by $300,000 to $5.1 million. Freshwater’s operating profit in 2015 was $6.2 million.
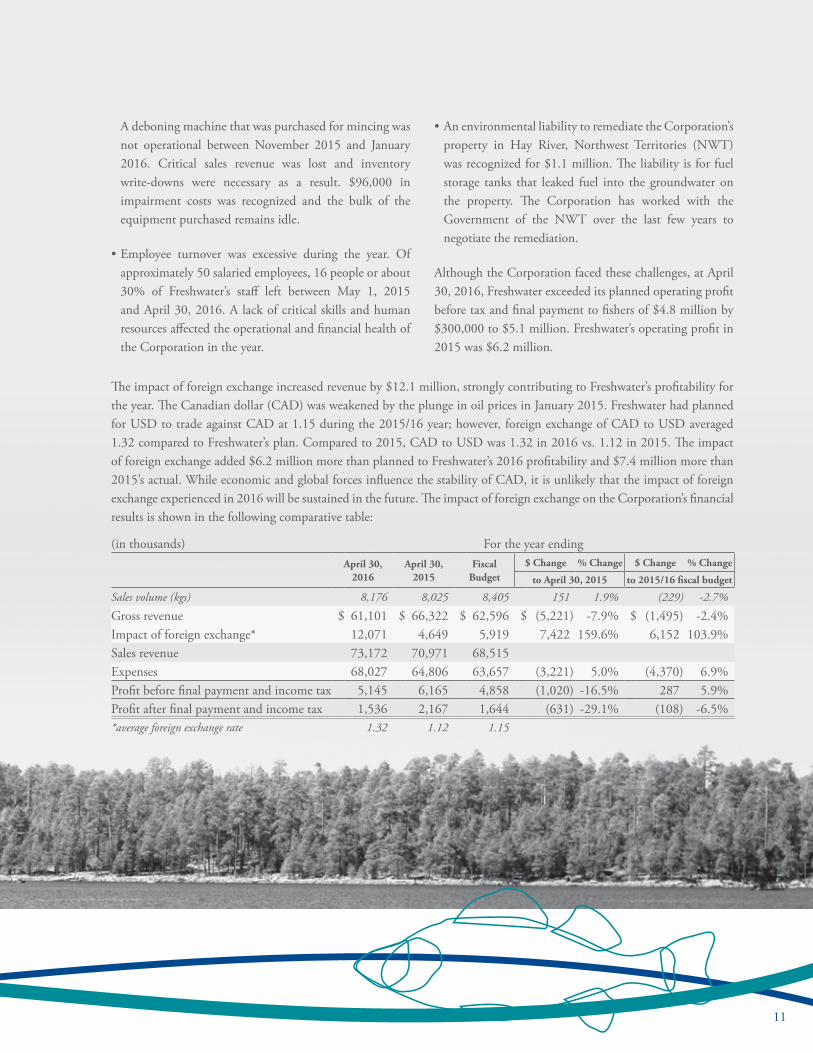
The impact of foreign exchange increased revenue by $12.1 million, strongly contributing to Freshwater’s profitability for the year. The Canadian dollar (CAD) was weakened by the plunge in oil prices in January 2015. Freshwater had planned for USD to trade against CAD at 1.15 during the 2015/16 year; however, foreign exchange of CAD to USD averaged 1.32 compared to Freshwater’s plan. Compared to 2015, CAD to USD was 1.32 in 2016 vs. 1.12 in 2015. The impact of foreign exchange added $6.2 million more than planned to Freshwater’s 2016 profitability and $7.4 million more than 2015’s actual. While economic and global forces influence the stability of CAD, it is unlikely that the impact of foreign exchange experienced in 2016 will be sustained in the future. The impact of foreign exchange on the Corporation’s financial results is shown in the following comparative table:
(in thousands) For the year endingApril 30,
2016April 30,
2015Fiscal
Budget$ Change % Change $ Change % Change
to April 30, 2015 to 2015/16 fiscal budget
Sales volume (kgs) 8,176 8,025 8,405 151 1.9% (229) -2.7%
Gross revenue $ 61,101 $ 66,322 $ 62,596 $ (5,221) -7.9% $ (1,495) -2.4%Impact of foreign exchange* 12,071 4,649 5,919 7,422 159.6% 6,152 103.9%Sales revenue 73,172 70,971 68,515Expenses 68,027 64,806 63,657 (3,221) 5.0% (4,370) 6.9%Profit before final payment and income tax 5,145 6,165 4,858 (1,020) -16.5% 287 5.9%Profit after final payment and income tax 1,536 2,167 1,644 (631) -29.1% (108) -6.5%*average foreign exchange rate 1.32 1.12 1.15
Although 2016 presented challenges for the Corporation, to fulfill its legislated mandate, seven key strategies set the Corporation’s focus and direction and were used to manage risks and leverage opportunities to ensure a sustainable future for all stakeholders – fishers, governments, customers and employees.
The following provides a brief summary of each strategy, achievements realized through the end of 2015, performance in 2016 and longer term goals for each strategy:
1. Expand and diversify the business – Create broader product lines and a more diverse set of key markets to reduce dependence on core species and markets.
Key new products have been developed including battered walleye, minced tullibee for the U.S. kosher market, smoked lake trout and tullibee, lake trout and carp caviar. Between 2010 and 2015, $4.5 million in additional sales revenue was earned from these initiatives. Including these products, market development in Russia, Israel, Romania, Ukraine and China have all contributed $18 million in sales revenue over the five-year period.
In 2016, a key initiative focused on increasing the sales volume and revenue of value-added lake whitefish by 160,000 kilograms for $1.5 million. During the year, value-added lake whitefish volume increased by 118,000 kilograms for $1.3 million.
Key initiatives for 2017 include a targeted reduction of lake whitefish inventory to 1 to 1.5 million kilograms and successful implementation of a battered sauger program.
Between 2018 and 2021, this strategy is focused on growing lake whitefish pin-bone-out fillet volume to 300,000 kilograms annually ($3.1 million) and continued expansion into China with a target of $2.5 million in annual revenue by the end of 2021. Increasing sales volume of the carp fishery to over 500,000 kilograms, including 40,000 kilograms of caviar ($1.35 million) and growing battered sauger to 80,000 kgs and $1.5 million sales, round out this initiative.
2. Manage the business with a market orientation – Operate using species-specific business plans and sound market assessments to drive investment and harvest management, with the goal of increasing revenues.
Margin and financial contribution management by species was developed and is used to support marketing and supply decisions to meet the Corporation’s mandate and operating goals. Freshwater has gained significant market points of entry for products in retail and foodservice. Highlights are northern pike caviar sales to cruise ship lines in Finland and expansion of business in Poland.
In 2016, the focus on recently launched new products such as mullet heads, walleye roe, and dressed northern pike resulted in an additional 150,000 kilograms of volume and $135,000 of sales revenue over 2015. Expansion of markets
13
for carp and carp roe, through agreements signed with key customers in countries such as Israel, increased sales volume and revenue by 10,000 kilograms and $200,000 for that species.
The strategic direction in 2017 and looking forward is to maintain price gains that were achieved in 2016 in local currency dollars. The focus will be on growth markets including China, Iran and Israel, reaching 5% of Freshwater’s sales revenue by 2021. Expanding value-added products such as portions, battered fish and caviar to $6.5 million or 9% of revenue by 2021 is the remaining focus of this strategy.
3. Promote sustainable development and commercial viability of the fishery – Work with fishing communities and government to improve opportunities and income for fishers.
Freshwater successfully managed the transition of Saskatchewan fish supply when that province withdrew from the Freshwater Fish Marketing Act in 2012. Today deliveries from Saskatchewan account for 17% of the Corporation’s volume, virtually the same level as in 2012. Carp deliveries from all regions have increased from 20,000 kilograms in 2013 to 460,000 kilograms in 2016. In 2013 Freshwater supported the establishment of the Hay River, NWT fishing agency as an independent agency.
In 2016, Freshwater’s primary goal was to react to changing fish populations in Lake Winnipeg to meet market demand. The goals were deliveries of 3.2 million
kilograms of walleye and 1.8 million kilograms of lake whitefish from Lake Winnipeg. Actual deliveries were 2.4 million kilograms of walleye and 2.3 million kilograms of lake whitefish.
Increasing deliveries to develop the commercial viability of the fishery remains a key challenge for the Corporation and initiatives are in place to continue to improve financial returns to fishers. Freshwater is committed to returning over 50% of available funds to fishers in 2017.
4. Develop processing infrastructure to meet fishery and market needs – Invest in infrastructure and develop systems to add value to products, reduce costs and meet current standards for food safety, security and quality.
Since 2010, over $8 million has been invested in infrastructure, equipment and processes. Key capital improvements to infrastructure at the Winnipeg processing plant included a new well and water piping, receiving area upgrades and an upgraded caviar processing area. These capital investments totaled nearly $1.5 million and were necessary to maintain processing capabilities. Equipment including a new tunnel freezer ($4.5 million) and the new frozen grader ($2.1 million) improved two key areas of fish processing. In 2015 and 2016, $900,000 was spent on constructing a dry dock at Hnausa, Manitoba to maintain and service the Poplar River barge, used to transport fish and supplies on Lake Winnipeg.
In 2016, $2.7 million was planned for capital investments; $2.3 million was spent.

Future goals target annual capital investments of $2.5 million for plant and equipment and establish a long-term plant productivity plan with annual goals. A material yield improvement plan is a key component of this strategy.
5. Ensure long-term financial viability of the Corporation – Create or modify policies and put in place programs to reduce short-term debt, properly finance the long-term capital expenditure program and operate on best practice principles.
In 2011, Freshwater’s long-term debt and retained earnings policy was established. Between 2010 and 2015, retained earnings increased by $8.7 million, contributing to increased financial stability. Since 2012, $1.8 million of demand installment debt has been repaid. Cost management initiatives and standard costing have been implemented and utilized for sales pricing and expense management.
In 2016, $900,000 in additional demand installment debt was repaid. The total demand installment debt repaid is $2.7 million as of April 30, 2016. Retained earnings increased by $1.5 million to $11.9 million and final payment to fishers was $3 million.
The long-term strategy for 2017 through 2021 is to meet the retained earnings goal of 20% of net sales ($13.5 million) in 2018, improve net sales revenue annually by 2% and reduce plant and administrative costs by 2% annually, and to continue to aggressively pay down debt. Achieving these goals should provide additional financial returns to fishers.
6. Promote environment of total quality, lake to plate – Develop a culture of total quality management throughout the supply chain to meet customer needs effectively, efficiently and consistently.
Processes have been implemented, including software, to improve inventory accuracy and new inventory scanning guns. Multi-language labels to improve efficiency and accuracy, and product labelling to conform to global requirements were implemented. Processing at the Winnipeg plant is scheduled using work orders that utilize resources efficiently and track fish by lot number to meet traceability requirements.
Targets established and met for 2016 were to maintain compliance with the Canadian Food Inspection Agency (CFIA) and pass all customer audits.
Longer-term, the strategy will focus on incorporating Freshwater’s quality specifications into the enterprise requirements planning (ERP) system and on meeting the Global Food Safety Initiative (GFSI) standards by 2020.
7. Stakeholder communications – Execute a two-way communications strategy for each stakeholder group (fishers, employees, customers, government and the public) to maximize the fishery resources and increase returns to fishers.
The stakeholder communications strategy has focused on a human resources initiative, and developed and implemented revised policies that have been communicated

15
to all employees. Communication programs with fishers, governments, the public and employees have been improved. Board governance has also been strengthened.
Going forward, Freshwater will continue to focus on improving communications with all stakeholders.
SPECIES PERFORMANCEWalleyeSales volume was 1.9 million kilograms, down almost 0.40 million kilograms from the previous year and reflecting both a decrease in deliveries and a smaller opening inventory. Extreme shortages were seen in all fillets over 6 ounces.
At $42 million revenue was down only by about $800,000 reflecting very strong market pricing due to a shortage of supply and strong USD. In Canadian dollars, the 2015/16 average selling price of $22.34/kg was 18.7% above the previous year’s price of $18.81/kg.
Reduced deliveries led to a strategic pull-out from our lowest-margined market in Europe. This also helped to increase the average selling price.
On the supply end, Freshwater’s main source of walleye, Lake Winnipeg, produced mainly small and large size grades with few in the prime medium sizes. This reduced overall availability. In the fall, a price incentive for jumbo
sizes brought more of this size grade and the winter premium pricing was moved forward to October as a production incentive. After several years of discussions, the communities in the Island Lake area sold production to Freshwater, and this had a positive impact on inventory.
Lake WhitefishSales volume was 2.4 million kilograms, up only 0.2 million kilograms from the previous year due to a very strong effort to reduce ‘at risk’ inventories in the fourth quarter. This reflected a reduced average selling price of whole dressed fish from $6.19/kg in 2015 to $5.89/kg in 2016, despite the strong USD.
Revenue was at $13.9 million, up only by about $450,000 despite the increased volume and stronger USD. Major markets include the U.S. east coast for smoked and gefilte fish, Europe for both whole fish and fillets and Canada for fresh lake whitefish product. Third party processing was utilized to re-introduce pin-bone-out fillets to Europe.
The minced market remained stable with a 2016 volume of 600,000 kilograms and average selling price of $6.42/kg, compared to a 2015 volume of 570,000 kilograms and average selling price of $5.37/kg. The increase in selling price was a result of moderate price increases and the strong USD.

The lake whitefish caviar market was solid, with stable volumes and an increase of approximately 10% on the selling price.
A very large increase in production from Lake Winnipeg was due in part to an increase in the lake whitefish optimization program. As well, Manitoba production of lake whitefish caviar increased dramatically and more than made up for closure of the Alberta commercial fishery, which had previously produced most of Freshwater’s lake whitefish roe.
Northern PikeSales volume in 2016 was 1 million kilograms and revenue increased by about $750,000 to a total of $5.54 million.
Major markets for northern pike are: France for processed product and China for whole fish. Currency valuations had little impact on the pool as most sales are conducted in Canadian dollars. Both Chinese-produced pin-bone-out portions and the sale of whole fish to China were essentially flat due to a reduction in development of the investment in this market.
This year saw the highest production of northern pike roe yet and it has now surpassed lake whitefish in volume. This incredible growth means that production reached over 53,000 kilograms and sales of $1,725,000, a huge increase from no product or sales just six years ago.
The volume of deliveries was high, resulting in higher-than-normal inventories by year-end.
MulletSales volume increased by approximately 75,000 kilograms, for a total of 842,000 kilograms in 2016. Revenue also was up $960,000 from 2015, resulting in total revenue of $4.2 million. The volume and revenue increases would have been greater, except the product produced by the new deboning line was unacceptable to major customers and thus had to be shut down until the old line was reinstalled. This resulted in six weeks of lost sales.
A moderate price increase on minced mullet and fillets, combined with the effect of the strong USD, saw an increase in the average selling price from $4.26/kg to $5.01/kg. Sales were greatly influenced by the Jewish calendar as religious holidays fell close to key harvest periods for mullet; this allowed Freshwater to maximize fresh sales.
The volume and sale of mullet heads used for bait increased from 360,000 kilograms and $284,000 in 2015 to 514,000 kilograms and $417,000 in 2016. There was a temporary closure of the U.S. market for this product when mullet heads were removed from the approved import list.
In addition, a good spring run helped raise fresh deliveries over previous year levels.
Lake TroutDespite the continuing impact of the Russian embargo, lake trout sales volumes increased by 104,000 kilograms to a total of 228,000 kilograms. Revenue was at $625,000 though the selling price was $0.35/kg lower than 2015.

17
CarpWhile sales volumes were stagnant on whole fish (at 403,000 kilograms in 2016), greater emphasis on roe and milt production and marketing saw an increase in this niche from the 2015 volume of 46,000 kilograms to the 2016 volume of 55,000 kilograms. The average roe and milt selling price also increased from $7.55/kg in 2015 to $8.80/kg in 2016. Revenue for 2016 was $1.2 million.
The markets for roe, milt and whole carp in Israel and Romania are building very nicely and Freshwater will be investing in new equipment to improve both production efficiency and the product itself. More production is needed to meet demand.
For the 2015/16 season, buying prices were increased by $0.23/kg to incent harvest increases.

18
FINANCIAL RETURNS AND DELIVERIES
Ten Year Summary (2007 – 2016), Fiscal Year Ended April 30 Initial and Final Payments – Millions of Dollars (Current Dollars)
2007 2008 2009 2010 2011 2012 2013 2014 2015 2016
Walleye (Pickerel)Delivered Weight1 6.4 6.2 6.2 5.8 5.9 6.0 5.7 5.7 4.8 4.6Price/Round Kg.2 $3.36 $3.50 $3.35 $3.22 $2.83 $3.19 $3.13 $2.88 $3.50 $4.00Initial Payment3 $20.8 $20.2 $20.8 $17.5 $15.5 $16.4 $15.8 $15.5 $14.5 $15.5Final Payment $0.7 $1.5 $0.0 $1.2 $1.2 $2.7 $2.0 $0.9 $2.3 $2.9Total Payment $21.5 $21.7 $20.8 $18.7 $16.7 $19.1 $17.8 $16.4 $16.8 $18.43 Yr. Moving Avg.4 $19.8 $20.7 $21.3 $20.4 $18.7 $18.2 $17.9 $17.8 $17.0 $17.2
Lake WhitefishDelivered Weight1 5.5 3.8 5.1 5.1 4.6 3.8 3.7 3.6 4.0 4.8Price/Round Kg.2 $1.09 $1.08 $1.49 $1.39 $1.17 $1.18 $1.44 $1.56 $1.81 $1.69Initial Payment3 $6.0 $3.9 $7.6 $7.1 $5.4 $4.5 $5.4 $5.4 $6.6 $8.1Final Payment $0.0 $0.2 $0.0 $0.0 $0.0 $0.0 $0.0 $0.2 $0.6 $0.0Total Payment $6.0 $4.1 $7.6 $7.1 $5.4 $4.5 $5.4 $5.6 $7.2 $8.13 Yr. Moving Avg.4 $5.8 $5.2 $5.9 $6.3 $6.7 $5.7 $5.1 $5.2 $6.1 $7.0
Northern PikeDelivered Weight1 1.7 1.9 2.1 1.9 1.8 1.9 2.0 2.0 2.2 2.3Price/Round Kg.2 $0.59 $0.79 $0.90 $0.89 $0.78 $0.79 $0.80 $0.80 $0.89 $0.91Initial Payment3 $1.0 $1.2 $1.9 $1.6 $1.4 $1.5 $1.6 $1.6 $1.9 $2.1Final Payment $0.0 $0.3 $0.0 $0.1 $0.0 $0.0 $0.0 $0.0 $0.1 $0.0Total Payment $1.0 $1.5 $1.9 $1.7 $1.4 $1.5 $1.6 $1.6 $2.0 $2.13 Yr. Moving Avg.4 $1.0 $1.1 $1.5 $1.7 $1.7 $1.5 $1.5 $1.6 $1.7 $1.9
SaugerDelivered Weight1 0.2 0.1 0.3 0.6 0.2 0.2 0.2 0.3 0.3 0.3Price/Round Kg.2 $2.50 $4.00 $3.33 $3.17 $3.00 $2.29 $2.71 $2.67 $2.67 $2.33Initial Payment3 $0.5 $0.4 $1.0 $1.9 $0.6 $0.4 $0.6 $0.8 $0.8 $0.7Final Payment $0.0 $0.0 $0.0 $0.0 $0.0 $0.1 $0.0 $0.0 $0.0 $0.0Total Payment $0.5 $0.4 $1.0 $1.9 $0.6 $0.5 $0.6 $0.8 $0.8 $0.73 Yr. Moving Avg.4 $1.1 $0.6 $0.6 $1.1 $1.2 $1.0 $0.6 $0.6 $0.7 $0.8

19
FINANCIAL RETURNS AND DELIVERIES
Ten Year Summary (2007 – 2016), Fiscal Year Ended April 30 Initial and Final Payments – Millions of Dollars (Current Dollars)
2007 2008 2009 2010 2011 2012 2013 2014 2015 2016
MulletDelivered Weight1 1.9 1.8 2.0 2.2 1.0 1.6 1.3 2.0 2.6 2.8Price/Round Kg.2 $0.37 $0.39 $0.35 $0.36 $0.30 $0.46 $0.49 $0.45 $0.42 $0.46Initial Payment3 $0.7 $0.6 $0.7 $0.8 $0.3 $0.7 $0.6 $0.9 $1.1 $1.3Final Payment $0.0 $0.1 $0.0 $0.0 $0.0 $0.0 $0.0 $0.0 $0.0 $0.0Total Payment $0.7 $0.7 $0.7 $0.8 $0.3 $0.7 $0.6 $0.9 $1.1 $1.33 Yr. Moving Avg.4 $0.7 $0.7 $0.7 $0.7 $0.6 $0.6 $0.6 $0.8 $0.9 $1.1
PerchDelivered Weight1 0.2 0.3 0.1 0.2 0.2 0.3 0.1 0.1 0.1 0.1Price/Round Kg.2 $3.00 $2.67 $3.00 $2.00 $2.00 $3.75 $3.16 $2.00 $2.00 $3.00Initial Payment3 $0.6 $0.8 $0.3 $0.4 $0.4 $1.0 $0.3 $0.2 $0.2 $0.2Final Payment $0.0 $0.0 $0.0 $0.0 $0.0 $0.1 $0.0 $0.0 $0.0 $0.1Total Payment $0.6 $0.8 $0.3 $0.4 $0.4 $1.1 $0.3 $0.2 $0.2 $0.33 Yr. Moving Avg.4 $0.6 $0.7 $0.6 $0.5 $0.4 $0.6 $0.6 $0.6 $0.2 $0.2
OtherDelivered Weight1 1.0 0.6 0.8 0.5 0.5 0.5 0.6 0.7 1.3 1.5Price/Round Kg.2 $0.60 $0.83 $0.88 $0.60 $0.60 $0.60 $0.79 $1.00 $1.17 $1.07Initial Payment3 $0.6 $0.5 $0.7 $0.3 $0.3 $0.3 $0.4 $0.7 $1.5 $1.6Final Payment $0.0 $0.0 $0.0 $0.0 $0.0 $0.0 $0.0 $0.0 $0.0 $0.0Total Payment $0.6 $0.5 $0.7 $0.3 $0.3 $0.3 $0.4 $0.7 $1.5 $1.63 Yr. Moving Avg.4 $0.6 $0.6 $0.6 $0.5 $0.4 $0.3 $0.3 $0.5 $0.9 $1.3
All PoolsDelivered Weight1 16.9 14.7 16.6 16.3 14.2 14.3 13.6 14.4 15.3 16.4Price/Round Kg.2 $1.83 $2.02 $1.99 $1.90 $1.77 $1.94 $1.97 $1.82 $1.93 $1.98Initial Payment3 $30.2 $27.6 $33.0 $29.6 $23.9 $24.8 $24.8 $25.1 $26.5 $29.4Final Payment $0.7 $2.1 $0.0 $1.3 $1.2 $3.0 $2.0 $1.1 $3.0 $3.0Total Payment $30.9 $29.7 $33.0 $30.9 $25.1 $27.8 $26.8 $26.2 $29.5 $32.43 Yr. Moving Avg.4 $29.6 $29.6 $31.2 $31.2 $29.7 $27.9 $26.6 $26.9 $27.5 $29.4
1 Delivered Weight – Round Equivalent Weight (millions of kilograms). 2 Price/Round Kg. – Based on Initial Payment plus Final Payment.
3 Initial Payment – Net of Freight. 4 Three Year Moving Average of Total Payments.

20
TEN YEAR FINANCIAL SUMMARY
Fiscal Year ended April 30 All amounts in millions of dollars.
2007 2008 2009 2010 2011 2012 2013 2014 2015 2016
Sales $61.6 $58.2 $62.5 $66.4 $66.8 $66.9 $63.5 $68.5 $71.0 $73.2
Net Income (Loss) Before $0.7 $2.3 ($0.7) $1.5 $0.1 $5.7 $4.5 $3.3 $6.2 $5.1Final Payments andIncome Tax
Fish Purchases $32.1 $29.2 $35.3 $31.6 $26.6 $27.8 $27.4 $28.0 $29.5 $32.6
Net Income Before $32.8 $31.5 $34.6 $33.1 $26.7 $33.5 $31.9 $31.3 $35.7 $37.7Income Tax PlusFish Purchases
Accounts Receivable $6.0 $5.5 $6.2 $8.1 $7.0 $6.4 $6.4 $7.1 $6.6 $8.7
Inventory – $12.0 $10.6 $16.0 $15.0 $9.1 $9.6 $12.7 $12.6 $15.4 $18.6Processed Fish Products
Inventory – Packaging $0.9 $0.7 $0.8 $0.9 $0.9 $0.9 $1.1 $0.9 $0.8 $1.1Material and Parts
Capital and Intangible $8.6 $10.6 $13.9 $14.3 $13.8 $17.7 $21.2 $20.9 $19.4 $20.0Assets – Net Book Value
Loans Payable $20.7 $18.8 $30.8 $29.4 $23.6 $21.1 $27.2 $26.0 $21.3 $24.6
Retained Earnings $3.3 $3.6 $2.8 $2.7* $1.7* $4.2 $6.8 $8.2 $10.4 $11.9
*Restated to conform with International Financial Reporting Standards (IFRS) presentation.

21
22
MANAGEMENT’S RESPONSIBILITY FOR FINANCIAL REPORTING
The accompanying financial statements of Freshwater Fish Marketing Corporation and all information in this annual report are the responsibility of the Corporation’s management.
These financial statements have been prepared in accordance with International Financial Reporting Standards as issued by the International Accounting Standards Board using the best estimates and judgments of management, where appropriate. The financial statements include certain amounts, such as the allowance for impairment loss, the provision to reduce slow moving or unsellable finished fish inventories to their estimated net realizable value, the derivative financial instruments measured at fair value and the estimated useful lives of plant and equipment, that are necessarily based on management’s best estimates and judgment. The integrity and objectivity of the data in these financial statements are management’s responsibility. Financial information presented elsewhere in the annual report is consistent with that contained in the financial statements.
In discharging its responsibility for the integrity and fairness of the financial statements, management maintains financial and management control systems and practices designed to provide reasonable assurance that transactions are authorized, assets are safeguarded and proper records are maintained and that transactions of the Corporation are in accordance with Part X of the Financial Administration Act (FAA) and regulations, the Freshwater Fish Marketing Act and regulations and the by-laws of the Corporation and the directive (P.C. 2015-1108) issued pursuant to section 89 of the FAA.
The Board of Directors is responsible for ensuring that management fulfills its responsibilities for financial reporting and internal control. The Board exercises its responsibilities through the Audit and Risk Committee. The Committee meets with management and the independent external auditor to discuss auditing, internal controls and other relevant financial matters. The Audit and Risk Committee meets to review the financial statements with the external auditors and submits its reports to the Board of Directors. The Board of Directors reviews and approves the financial statements.
The Corporation’s independent external auditor, the Auditor General of Canada, audits the financial statements of the Corporation in accordance with Canadian Auditing Standards and expressed his opinion on the financial statements to the Minister responsible for Freshwater Fish Marketing Corporation.
John K. Wood Interim President Freshwater Fish Marketing Corporation
Stanley A. Lazar, CPA, CMA Chief Financial Officer Freshwater Fish Marketing Corporation
Winnipeg, Canada July 13, 2016

23
24
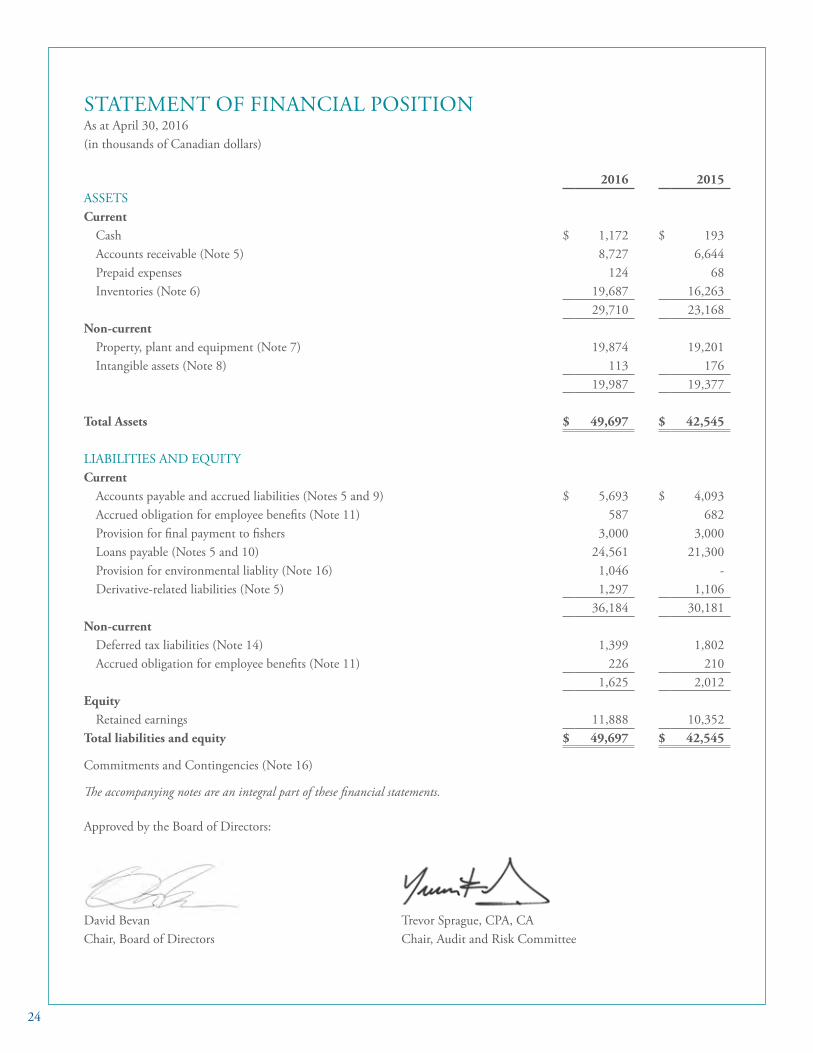
STATEMENT OF FINANCIAL POSITIONAs at April 30, 2016 (in thousands of Canadian dollars)
2016 2015ASSETSCurrent
Cash $ 1,172 $ 193Accounts receivable (Note 5) 8,727 6,644 Prepaid expenses 124 68 Inventories (Note 6) 19,687 16,263
29,710 23,168 Non-current
Property, plant and equipment (Note 7) 19,874 19,201 Intangible assets (Note 8) 113 176
19,987 19,377
Total Assets $ 49,697 $ 42,545
LIABILITIES AND EQUITYCurrent
Accounts payable and accrued liabilities (Notes 5 and 9) $ 5,693 $ 4,093 Accrued obligation for employee benefits (Note 11) 587 682 Provision for final payment to fishers 3,000 3,000 Loans payable (Notes 5 and 10) 24,561 21,300 Provision for environmental liablity (Note 16) 1,046 -Derivative-related liabilities (Note 5) 1,297 1,106
36,184 30,181 Non-current
Deferred tax liabilities (Note 14) 1,399 1,802 Accrued obligation for employee benefits (Note 11) 226 210
1,625 2,012 Equity
Retained earnings 11,888 10,352 Total liabilities and equity $ 49,697 $ 42,545
Commitments and Contingencies (Note 16)
The accompanying notes are an integral part of these financial statements.
Approved by the Board of Directors:
David Bevan Chair, Board of Directors
Trevor Sprague, CPA, CA Chair, Audit and Risk Committee
25
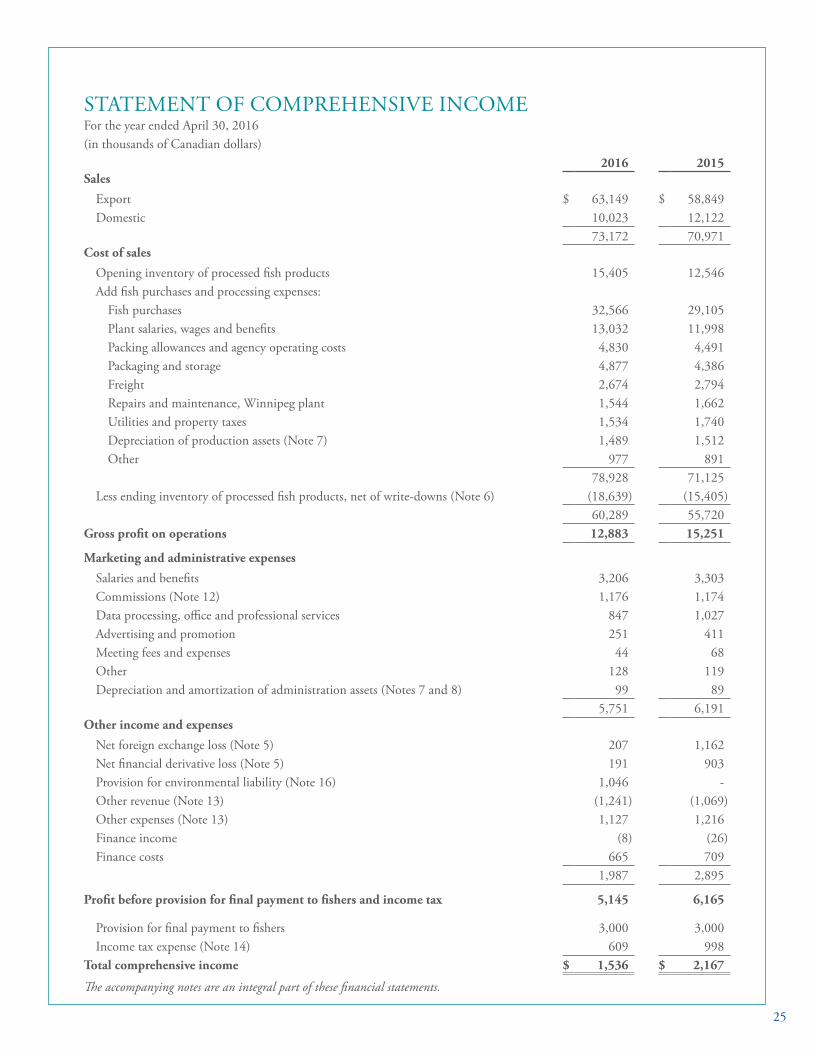
STATEMENT OF COMPREHENSIVE INCOMEFor the year ended April 30, 2016 (in thousands of Canadian dollars)
2016 2015Sales
Export $ 63,149 $ 58,849 Domestic 10,023 12,122
73,172 70,971 Cost of sales
Opening inventory of processed fish products 15,405 12,546 Add fish purchases and processing expenses:
Fish purchases 32,566 29,105 Plant salaries, wages and benefits 13,032 11,998 Packing allowances and agency operating costs 4,830 4,491 Packaging and storage 4,877 4,386 Freight 2,674 2,794 Repairs and maintenance, Winnipeg plant 1,544 1,662 Utilities and property taxes 1,534 1,740Depreciation of production assets (Note 7) 1,489 1,512Other 977 891
78,928 71,125 Less ending inventory of processed fish products, net of write-downs (Note 6) (18,639) (15,405)
60,289 55,720 Gross profit on operations 12,883 15,251
Marketing and administrative expenses
Salaries and benefits 3,206 3,303 Commissions (Note 12) 1,176 1,174 Data processing, office and professional services 847 1,027 Advertising and promotion 251 411 Meeting fees and expenses 44 68 Other 128 119 Depreciation and amortization of administration assets (Notes 7 and 8) 99 89
5,751 6,191 Other income and expenses
Net foreign exchange loss (Note 5) 207 1,162 Net financial derivative loss (Note 5) 191 903 Provision for environmental liability (Note 16) 1,046 -Other revenue (Note 13) (1,241) (1,069)Other expenses (Note 13) 1,127 1,216 Finance income (8) (26)Finance costs 665 709
1,987 2,895
Profit before provision for final payment to fishers and income tax 5,145 6,165
Provision for final payment to fishers 3,000 3,000 Income tax expense (Note 14) 609 998
Total comprehensive income $ 1,536 $ 2,167
The accompanying notes are an integral part of these financial statements.

26
STATEMENT OF CHANGES IN EQUITYFor the year ended April 30, 2016 (in thousands of Canadian dollars)
2016 2015
Retained earnings at the beginning of the year $ 10,352 $ 8,185Total comprehensive income 1,536 2,167Retained earnings at the end of the year $ 11,888 $ 10,352
The accompanying notes are an integral part of these financial statements.
27
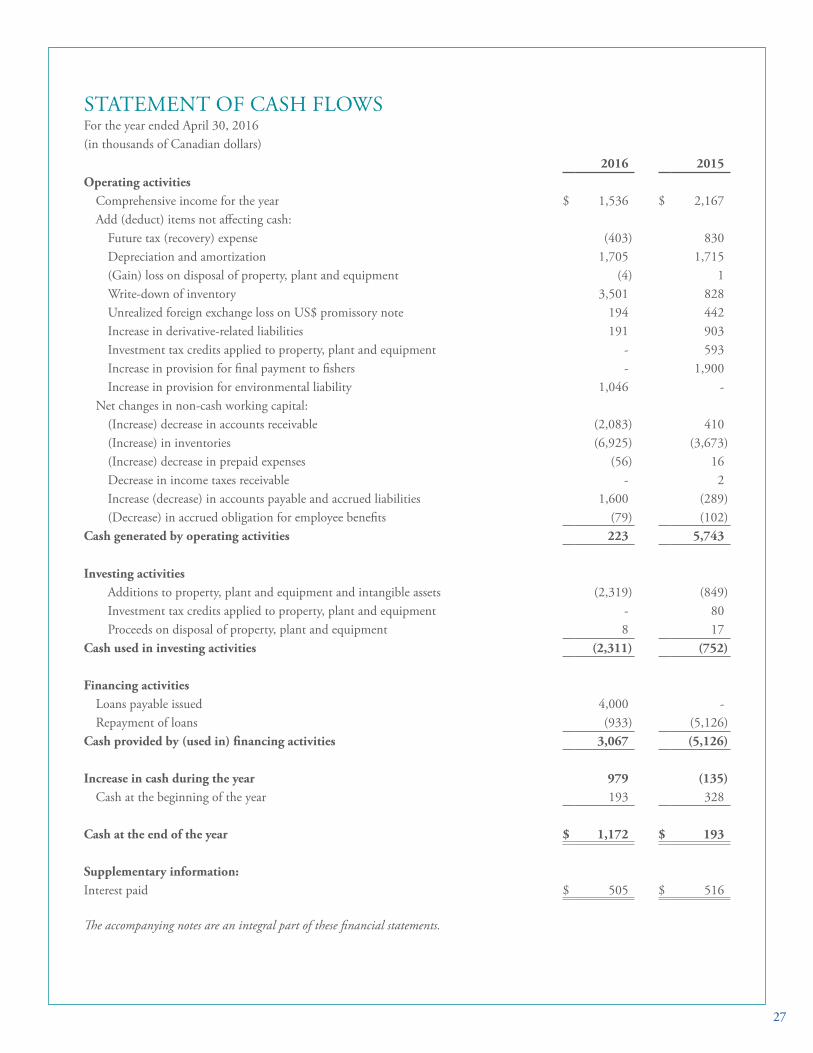
STATEMENT OF CASH FLOWSFor the year ended April 30, 2016 (in thousands of Canadian dollars)
2016 2015Operating activities
Comprehensive income for the year $ 1,536 $ 2,167 Add (deduct) items not affecting cash:
Future tax (recovery) expense (403) 830 Depreciation and amortization 1,705 1,715 (Gain) loss on disposal of property, plant and equipment (4) 1 Write-down of inventory 3,501 828Unrealized foreign exchange loss on US$ promissory note 194 442 Increase in derivative-related liabilities 191 903 Investment tax credits applied to property, plant and equipment - 593 Increase in provision for final payment to fishers - 1,900 Increase in provision for environmental liability 1,046 -
Net changes in non-cash working capital:(Increase) decrease in accounts receivable (2,083) 410 (Increase) in inventories (6,925) (3,673)(Increase) decrease in prepaid expenses (56) 16 Decrease in income taxes receivable - 2 Increase (decrease) in accounts payable and accrued liabilities 1,600 (289)(Decrease) in accrued obligation for employee benefits (79) (102)
Cash generated by operating activities 223 5,743
Investing activitiesAdditions to property, plant and equipment and intangible assets (2,319) (849)Investment tax credits applied to property, plant and equipment - 80Proceeds on disposal of property, plant and equipment 8 17
Cash used in investing activities (2,311) (752)
Financing activitiesLoans payable issued 4,000 -Repayment of loans (933) (5,126)
Cash provided by (used in) financing activities 3,067 (5,126)
Increase in cash during the year 979 (135)Cash at the beginning of the year 193 328
Cash at the end of the year $ 1,172 $ 193
Supplementary information:Interest paid $ 505 $ 516
The accompanying notes are an integral part of these financial statements.

28
NOTES TO THE FINANCIAL STATEMENTS
April 30, 2016 (in thousands of dollars)
1. NATURE AND DESCRIPTION OF THE CORPORATION
The Freshwater Fish Marketing Corporation (the Corporation) was established in 1969 pursuant to the Freshwater Fish Marketing Act for the purpose of marketing and trading in fish, fish products, and fish by-products in and outside of Canada. The address of the Corporation’s registered office and principal place of business is 1199 Plessis Road in Winnipeg, Manitoba. The Corporation is required to purchase all fish legally caught in the freshwater region, which currently encompasses the provinces of Alberta, Manitoba, and the Northwest Territories. Participation of these provinces and territory was established by agreement with the Government of Canada.
The Corporation has the exclusive right to trade and market the products of the commercial fishery on an interprovincial and export basis, and it exercises that right with the objectives of marketing fish in an orderly manner, maximizing returns to fishers, promoting international markets, and increasing interprovincial and export trade in fish, fish products, and fish by-products.
The Corporation is an agent Crown corporation named in Part I of Schedule III of the Financial Administration Act. The Corporation is required to conduct its operations on a self-sustaining basis without appropriations from Parliament. In accordance with the Freshwater Fish Marketing Act, the legislative borrowing limit of the Corporation is $50 million. As at April 30, 2016, the total borrowings of the Corporation may not exceed $39.5 million as authorized by the Minister of Finance.
In July 2015, the Corporation was issued a directive (P.C. 2015-1108) pursuant to section 89 of the Financial Administration Act to align its travel, hospitality, conference and event expenditure policies, guidelines and practices with Treasury Board policies, directives and related instruments on travel, hospitality, conference and event expenditures in a manner that is consistent with its legal obligations, and to report on the implementation of this directive in the Corporation’s next corporate plan. The Corporation is currently in the process of implementing a travel, hospitality, conference and event policy that meets this directive. This new integrated policy will align with Treasury Board policies, directives and related instruments on travel, hospitality, conference and event expenditures. The Corporation is planning to achieve full implementation of this directive by December, 2016.
The Corporation is a prescribed federal Crown corporation for tax purposes and is subject to federal income tax under the Income Tax Act.
2. SIGNIFICANT ACCOUNTING POLICIES
2.1 Basis of presentationThe financial statements have been prepared in accordance with International Financial Reporting Standards (IFRS), as issued by the International Accounting Standards Board (IASB).
The financial statements were prepared on the historical cost basis, except for derivative instruments which were measured at fair value and the workers’ compensation, pension deficiency, and sick leave benefits which were measured at the actuarially determined amount.
All figures are stated in Canadian dollars unless otherwise specified.
The financial statements have been approved for public release by the Board of Directors of the Corporation on July 13, 2016.

29
2.2 CashCash represents money in the bank.
2.3 Accounts receivableAccounts receivable are recognized at their anticipated realizable value, which is the original invoice amount less an estimated allowance for impairment loss on these receivables. An estimated impairment loss on receivables is made when there is objective evidence that the Corporation will not be able to collect all amounts due according to the original terms of the receivables.
2.4 InventoriesProcessed fish products are recorded at the actual cost of fish purchases throughout the year plus direct labour and overhead directly related to processing. The Corporation uses a weighted-average cost formula to assign fixed and variable overhead costs to processed fish product inventory. At the reporting date inventories are valued at the lower of cost and net realizable value. Net realizable value is the estimated selling price in the ordinary course of business less estimated costs of completion and the estimated costs necessary to make the sale. Inventory write-downs and reversals of write-downs are included in cost of sales in the statement of comprehensive income.
2.5 Financial instrumentsFinancial assets and financial liabilities are recognized when the Corporation becomes a party to the contractual provisions of the instrument.
Financial assets and financial liabilities are initially measured at fair value. Transaction costs that are directly attributable to the acquisition or issuance of financial assets and financial liabilities (other than financial assets and financial liabilities at fair value through profit or loss) are added to or deducted from the fair value of the financial assets or financial liabilities, as appropriate, on initial recognition.
Transaction costs directly attributable to the acquisition of financial assets or financial liabilities at fair value through profit or loss are recognized immediately in profit or loss.
2.5.1 Effective interest methodThe effective interest method is a method of calculating the amortized cost of a financial asset or liability and of allocating interest expense over the relevant periods. The effective interest rate is the rate that exactly discounts estimated future cash payments through the expected life of the financial liability, or where appropriate a shorter period, to the net carrying amount on initial recognition.
2.6 Financial assetsThe Corporation’s financial assets are classified into the following specified categories: financial assets at fair value through profit or loss and loans and receivables. The classification depends on the nature and purpose of the financial assets and is determined at the time of initial recognition. All regular purchases or sales of financial assets are recognized and derecognized on a trade date basis.
2.6.1 Loans and receivablesLoans and receivables are non-derivative financial assets with fixed or determinable payments that are not quoted in an active market. Loans and receivables are measured at amortized cost using the effective interest method, less any impairment write downs. Assets in this category include accounts receivable and are classified as current assets in the statement of financial position.
Interest income is recognized by applying the effective interest rate, except for short-term receivables when the recognition of interest would be insignificant.

30
2.6.2 Financial assets at fair value through profit or loss (FVTPL)Financial assets are classified as FVTPL when the financial asset is either held for trading or it is designated as FVTPL.
A financial asset is classified as held for trading if:• it has been acquired principally for the purpose of selling it in the near term;• on initial recognition, it is part of a portfolio of identified financial instruments that the Corporation manages together and
has a recent actual pattern of short-term profit-taking;• it is a derivative that is not designated or effective as a hedging instrument; or• a financial asset other than a financial asset held for trading may be designated as FVTPL upon initial recognition.
Financial assets classified as FVTPL are presented at fair value, with any gains or losses arising on remeasurement recognized in profit or loss. Fair value is determined in the manner described in Note 5.2.
The Corporation has not designated any financial assets as FVTPL at the end of the reporting period.
2.6.3 Impairment of financial assetsFinancial assets, other than those classified as FVTPL, are assessed for indicators of impairment at the end of each reporting period. Financial assets are considered to be impaired when there is objective evidence that, as a result of one or more events that occurred after the initial recognition of the financial asset, the estimated future cash flows of the asset have been affected.
Objective evidence of impairment could include:• significant financial difficulty of the debtor;• breach of contract, such as a default or delinquency in payments;• it becoming probable that the debtor will enter bankruptcy or financial re-organization; or• significant decrease in creditworthiness of the debtor.
For financial assets carried at amortized cost, the amount of the impairment loss recognized is the difference between the asset’s carrying amount and the present value of estimated future cash flows, discounted at the financial asset’s original effective interest rate.
The carrying amount of the financial asset is reduced by the impairment loss directly for all financial assets with the exception of accounts receivable, where the carrying amount is reduced through the use of an allowance account. When a trade receivable is considered uncollectible, it is written off against the allowance account. Subsequent recoveries of amounts previously written off are credited against the bad debt. Changes in the carrying amount of the allowance account are recognized in profit or loss.
For financial assets measured at amortized cost, if, in a subsequent period, the amount of the impairment loss decreases and the decrease can be related objectively to an event occurring after the impairment was recognized, the previously recognized impairment loss is reversed through profit or loss to the extent that the carrying amount of the asset at the date the impairment is reversed does not exceed what the amortized cost would have been had the impairment not been recognized.
2.6.4 Derecognition of financial assetsThe Corporation derecognizes a financial asset only when the contractual rights to the cash flows from the asset expire, or when it transfers the financial asset and substantially all the risks and rewards of ownership of the asset to another entity.
31
2.7 Financial liabilitiesFinancial liabilities are classified as either financial liabilities at FVTPL or other financial liabilities.
2.7.1 Financial liabilities at fair value through profit or loss (FVTPL)Financial liabilities are classified as FVTPL when the financial liability is either held for trading or it is designated as FVTPL.
A financial liability is classified as held for trading using the same criteria described in Note 2.6.2 for a financial asset classified as held for trading.
The Corporation has not designated any financial liabilities as FVTPL at the end of the reporting period.
Financial liabilities classified as FVTPL are presented at fair value, with any gains or losses arising on remeasurement recognized in profit or loss. Fair value is determined in the manner described in Note 5.2.
2.7.2 Other financial liabilitiesOther financial liabilities are initially measured at fair value net of transaction costs. Other financial liabilities (including borrowings) are subsequently measured at amortized cost using the effective interest method.
2.7.3 Derecognition of financial liabilitiesThe Corporation derecognizes financial liabilities when the Corporation’s obligations are discharged, cancelled or they expire.
2.8 Derivative financial instrumentsThe Corporation selectively utilizes derivative financial instruments primarily to manage financial risks and to manage exposure to fluctuations in foreign exchange rates and interest rates. The Corporation’s policy is not to enter into derivative instruments for trading or speculative purposes.
Derivatives are initially recognized at fair value when the Corporation becomes a party to the contractual provisions of the instrument and are subsequently remeasured to their fair value at the end of each reporting period. The hedges entered into represent economic hedges. Attributable transaction costs are recognized in profit or loss as incurred. The resulting gain or loss is recognized in profit or loss immediately.
A derivative with a positive fair value is recognized as a financial asset; a derivative with a negative fair value is recognized as a financial liability. A derivative is presented as a non-current asset or a non-current liability on the statement of financial position if the remaining contractual maturity of the instrument is more than 12 months and it is not expected to be realized or settled within 12 months. Other derivatives are presented as current assets or current liabilities.
2.9 Capital assets
2.9.1 Asset recognitionProperty, plant and equipment are recorded at cost less accumulated depreciation and any accumulated impairment losses. Costs include directly attributable costs. The cost of self-constructed assets includes the cost of materials and direct labour, and other costs directly attributable to bringing the assets to a working condition for their intended use, the cost of dismantling and removing the items and restoring the site on which they are located, and borrowing costs on qualifying assets for which the commencement date for capitalization is on or after May 1, 2010.

32
When parts of an item of property, plant and equipment have different useful lives, they are accounted for as separate items (major components) of property, plant and equipment.
2.9.2 DepreciationDepreciation is based on the estimated useful lives of the assets using the straight-line method.
Buildings: Lake stations and other building improvements 5 to 65 yearsPlant 40 years
Equipment Machinery and office equipment 3 to 40 yearsAutomotive 5 years
Fresh fish delivery tubs/totes 3 to 10 yearsVessels 3 to 35 years
The cost for plant assets being upgraded or purchased that are not yet operational are charged to construction in progress. When the assets become operational, the cost is transferred to the appropriate property, plant and equipment classification and depreciated accordingly.
Freehold land is not depreciated.
Useful lives, residual values and depreciation methods are reviewed at each reporting period and necessary adjustments are recognized on a prospective basis as changes in estimates.
2.9.3 Subsequent costsRepairs and maintenance costs are expensed when incurred.
Costs incurred on a replacement part for property, plant and equipment are recognized in the carrying amount of the part that was replaced.
The costs of major inspections or overhauls are recognized in the carrying amount of the item or as a replacement. Any remaining carrying amount of the cost of the previous inspection is derecognized.
2.9.4 DerecognitionAn item of property, plant and equipment is derecognized upon disposal or when no further future economic benefit is expected from its use or disposal. The gain or loss on disposal or retirement of an item is determined as the difference between the sales proceeds and the carrying amount of the asset and is recognized in profit or loss when the item is derecognized.
2.10 Intangible assetsIntangible assets include costs associated with information systems software, including initial set-up and configuration costs. These costs are amortized, after technological feasibility is established, using a straight-line method over the estimated useful life of five years. The Corporation has no indefinite intangible assets. The amortization period and the amortization method for an intangible asset with a finite useful life are reviewed at each reporting period. If the expected useful life of the asset is different from previous estimates, the amortization period shall be changed accordingly on a prospective basis as a change in estimate.

33
2.11 Impairment of tangible and intangible assetsThe Corporation assesses at each reporting date whether there is an indication that an asset may be impaired. If such an indication exists, or when annual testing for an asset is required, the Corporation estimates the asset’s recoverable amount. The recoverable amount is the higher of an asset’s fair value less costs to sell and its value in use. Where the carrying amount of an asset exceeds its recoverable amount, the asset is considered impaired and is written down to its recoverable amount.
Value in use is determined by discounting estimated future cash flows using a pre-tax discount rate that reflects the current market assessment of the time value of money and the specific risks of the asset. In determining fair value less costs to sell, recent market transactions are taken into account, if available. If no such transactions can be identified, an appropriate valuation model is used.
The Corporation bases its impairment calculation on a detailed budget and forecast to which the assets are allocated. The budget and forecast calculations generally cover a period of five years. For longer periods, a long-term growth rate is calculated and applied to project future cash flows after the fifth year.
An impairment loss is recognized in the statement of comprehensive income if an asset’s carrying amount is higher than its recoverable amount. Impairment losses are recognized in those expense categories consistent with the function of the impaired asset.
An assessment is made at each reporting date as to whether there is any indication that previously recognized impairment losses may no longer exist or may have decreased. If such indication exists, the Corporation estimates the asset’s recoverable amount. A previously recognized impairment loss is reversed only if there has been a change in the assumptions used to determine the asset’s recoverable amount since the last impairment loss was recognized. The reversal is limited so that the carrying amount of the asset does not exceed its recoverable amount, nor exceed the carrying amount that would have been determined, net of depreciation or amortization, had no impairment loss been recognized for the asset in a prior period. Such a reversal is recognized in the statement of comprehensive income.
2.12 Payments to fishers and retained earningsThe Corporation purchases fish at initial prices established by the Board of Directors based upon operational forecasts prepared by the Corporation and the cost of such purchases is included in cost of sales. Final payments to fishers, if any, are approved by the Board of Directors. The Corporation recognizes the final payment to fishers as a liability in the statement of financial position and as an expense on the statement of comprehensive income.
A final payment to fishers is calculated based on the following formula: Annual comprehensive income before income tax plus annual depreciation less the three-year rolling average (the current and previous two fiscal years) of cash purchases of capital assets.
However, regardless of the formulated final payment calculation, the Board of Directors reserves final decision as to when and how much cash and/or retained earnings will be distributed to fishers in the form of a final payment.
2.13 Foreign currency translationRevenues and expenses are translated into Canadian dollars using the monthly average exchange rate for the month in which the transaction occurred. Monetary assets and liabilities denominated in foreign currencies are translated into Canadian dollars at the exchange rate in effect at the reporting date. All foreign exchange gains and losses incurred are included in net foreign exchange gain or loss in the statement of comprehensive income.

34
2.14 Employee benefits
2.14.1 Current employee benefitsCurrent employee benefits are employee benefits that are due to be settled within twelve months after the end of the period in which the employees render their related service. The Corporation’s current benefits include wages and salaries, annual leave and other types of current benefits.
The Corporation recognizes the undiscounted amount of current employee benefits earned by an employee in exchange for services rendered during the period as a liability in the statement of financial position, after deducting any amounts already paid as an expense in profit and loss.
2.14.2 Pension benefitsSubstantially all of the employees of the Corporation are covered by the Public Service Pension Plan (the Plan), a contributory defined benefit plan established through legislation and sponsored by the Government of Canada. Contributions are required by both the employees and the Corporation to cover current service cost. Pursuant to legislation currently in place, the Corporation has no legal or constructive obligation to pay further contributions with respect to any past service or funding deficiencies of the Plan. Consequently, contributions are recognized as an expense in the year when employees have rendered service and represent a pension obligation of the Corporation.
The accrued obligation for employee benefits includes the actuarially determined net present value of the liability for the employer’s cost of buyback service related to an agreement with the Corporation’s union that established the employment status of its fish plant employees on a go forward basis and retroactively to April 1, 1973. The Corporation is required to fund the employer’s portion of any employee contributions that arise from this agreement.
Changes in the net present value of this unfunded liability are based on updated actuarial estimates of future costs as a result of actual experience and changes in actuarial assumptions. Adjustments arising from actuarial gains and losses are recognized in the year in which they occur.
2.14.3 Accrued obligation for workers’ compensationThe Corporation is subject to the Government Employees Compensation Act and, therefore, is self-insured for benefits for work-related injuries of the employees of the Freshwater Fish Marketing Corporation. As a self-insured employer, the Corporation is accountable for all such liabilities incurred since incorporation. Liabilities for workers’ compensation benefits are recorded based on known injuries or illnesses that have occurred.
The accrued obligation for workers’ compensation represents the actuarially determined net present value of liabilities for benefits for work-related injuries of the employees of the Freshwater Fish Marketing Corporation when awards are approved by the Workers Compensation Board of Manitoba, or when legislative amendments are made and the anticipated future costs can be reasonably calculated.
Changes in the net present value of this unfunded liability are based on updated actuarial estimates of future costs as a result of actual experience and changes in actuarial assumptions. Adjustments arising from actuarial gains and losses are recognized in the year in which they occur.
2.14.4 Accrued obligation for sick leave benefitsThe Corporation’s sick leave benefit plan provides accumulating sick leave benefits to eligible employees. The plan is an unfunded defined benefit plan paid on a cash basis by contributions from the Freshwater Fish Marketing Corporation.
35
The accrued obligation for sick leave benefits represents the actuarially determined net present value of liabilities for sick leave benefits for eligible employees of the Freshwater Fish Marketing Corporation.
Changes in the net present value of this unfunded liability are based on updated actuarial estimates of future costs as a result of actual experience and changes in actuarial assumptions. Adjustments arising from actuarial gains and losses are recognized in the year in which they occur.
2.15 Revenue recognitionSales, net of promotional allowances and sales returns, are recorded on an accrual basis and are recognized when all of the following criteria have been satisfied: the Corporation has transferred to the buyer the significant risks and rewards of ownership; the Corporation retains neither continuing managerial involvement to the degree usually associated with ownership nor effective control over the goods sold; the amount of revenue can be measured reliably; it is probable that the economic benefits associated with the transaction will flow to the Corporation; and the costs incurred or to be incurred in respect of the transaction can be measured reliably.
2.16 ProvisionsProvisions are recognized when the Corporation has a present obligation (legal or constructive) as a result of a past event, it is probable that an outflow of resources embodying economic benefits required to settle the obligation, and a reliable estimate can be made of the amount of the obligation. When the Corporation expects some or all of a provision to be reimbursed, the reimbursement is recognized as a separate asset but only when the reimbursement is virtually certain. The expense relating to any provision is presented in the statement of comprehensive income net of any reimbursement. If the effect of the time value of money is material, provisions are discounted using a current rate that reflects, where appropriate, the risks specific to the liability. Where discounting is used, the increase in the provision due to the passage of time is recognized as a finance cost.
2.17 Income taxIncome tax expense comprises the sum of the tax currently payable and deferred tax.
2.17.1 Current taxThe tax currently payable is based on taxable profit for the year. Taxable profit differs from profit as reported in the statement of comprehensive income because of items of income or expense that are taxable or deductible in other years and items that are never taxable or deductible. The Corporation’s liability for current tax is calculated using tax rates that have been enacted or substantively enacted by the end of the reporting period.
2.17.2 Deferred taxDeferred tax is recognized on temporary differences between the carrying amounts of assets and liabilities in the financial statements and the corresponding tax bases used in the computation of taxable profit.
Deferred tax liabilities are generally recognized for all taxable temporary differences. Deferred tax assets are generally recognized for all deductible temporary differences to the extent that it is probable that taxable profits will be available against which those deductible temporary differences can be utilized.
The carrying amount of deferred tax assets is reviewed at the end of each reporting period and reduced to the extent that it is no longer probable that sufficient taxable profits will be available to allow all or part of the asset to be recovered.

36
Deferred tax assets and liabilities are measured at the tax rates that are expected to apply in the period in which the liability is settled or the asset realized, based on tax rates and tax laws that have been enacted or substantively enacted by the end of the reporting period. The measurement of deferred tax liabilities and assets reflects the tax consequences that would follow from the manner in which the Corporation expects, at the end of the reporting period, to recover or settle the carrying amount of its assets and liabilities.
2.17.3 Current and deferred tax for the periodCurrent and deferred tax are recognized in profit or loss, except when they relate to items that are recognized in other comprehensive income or directly in equity, in which case, the current and deferred tax are also recognized in other comprehensive income or directly in equity respectively.
3. KEY SOURCES OF ESTIMATION UNCERTAINTY AND CRITICAL JUDGEMENTS
3.1 Key sources of estimation uncertaintyPreparation of the financial statements requires the use of estimates and assumptions to be made in applying the accounting policies that affect the reported amounts of assets, liabilities, income, expenses and the disclosure of contingent liabilities. The estimates and related assumptions are based on previous experience and other factors considered reasonable under the circumstances, the results of which form the basis of making assumptions about the carrying values of assets and liabilities that are not readily apparent from other sources.
The estimates and underlying assumptions are reviewed on an ongoing basis. Revisions to estimates are recognized in the period in which the estimate is revised if the revision affects only that period, or in the period of the revision and future periods if the revision affects both current and future periods. Judgments made by management in the application of IFRS that have significant effect on the financial statements relate to the following:
3.1.1 Impairment of non-financial assetsThe Corporation’s impairment test is based on value in use calculations that use a discounted cash flow model. The cash flows are derived from the budget for the next five years and are sensitive to the discount rate used as well as the expected future cash-inflows and the growth rate used for extrapolation purposes. Refer to Note 2.11.
3.1.2 Capital assetsCapital assets, comprising property, plant and equipment and intangible assets with finite useful lives are depreciated or amortized over their useful lives. Useful lives are based on management’s estimates of the periods of service provided by the assets. The useful lives of these assets are periodically reviewed for continued appropriateness. Changes to the useful life estimates would affect future depreciation and amortization expense and the future carrying value of assets. Refer to Notes 2.9.2 and 2.10.
37
3.1.3 Inventory valuation allowanceInventory valuation allowance is estimated for slow moving or obsolete inventories. Management reviews the estimation regularly. Any change in the estimation will impact the inventory valuation allowance.
3.1.4 Income taxThe Corporation operates in a jurisdiction which requires calculations for which the ultimate tax determination is uncertain during the ordinary course of business. Liabilities are recognized for anticipated tax exposures based on estimates of the additional taxes that are likely to become due. Where the final tax outcome of these matters is different from the amount that was initially recorded, such differences will affect the income tax and deferred tax provisions in the period in which such determination is made.
Deferred tax liabilities are comprised of temporary differences between the carrying values and tax basis of liabilities. The timing of the reversal of temporary differences may take many years and the related deferred tax is calculated using substantively enacted tax rates for the related period.
If future outcomes were to adversely differ from management’s best estimate of future results from operations affecting the timing of reversal of deductible temporary differences, the Corporation could experience material deferred income tax adjustments. Such deferred income tax adjustments would not result in an immediate cash outflow nor would they affect the Corporation’s immediate liquidity.
3.2 Critical judgmentsThe critical judgments that the Corporation’s management has made in the process of applying the Corporation’s accounting policies, apart from those involving estimations, that have the most significant effects on the amounts recognized in the Corporation’s financial statements are as follows:
3.2.1 Provisions and contingent liabilitiesIn determining whether a liability should be recorded in the form of a provision, management is required to exercise judgment in assessing whether the Corporation has a present legal or constructive obligation as a result of a past event, whether it is probable that an outflow of resources will be required to settle the obligation, and whether a reasonable estimate can be made of the amount of the obligation. In making this determination, management may use past experience, prior external precedents and the opinions and views of legal counsel. If management determines that the above three conditions are met, a provision is recorded for the obligation. Alternatively, a contingent liability is disclosed in the notes to the financial statements if management determines that any one of the above three conditions is not met, unless the possibility of outflow in settlement is considered to be remote.
3.2.2 Inventory valuation allowanceProcessed fish inventories are assessed for impairment by comparing the carrying value of each item of processed fish inventory with its selling price less its costs to market and sell. If an item of inventory is impaired, its carrying amount is reduced to selling price less costs to market and sell, and an inventory write-down of processed fish products is expensed immediately in cost of sales. If an inventory write-off subsequently reverses, the carrying amount of the inventory is increased. Details of the processed fish inventory valuation allowance are included in Note 6.

38
4. APPLICATION OF NEW AND REVISED IFRS
4.1 New and revised IFRS affecting amounts reported and/or disclosed in the financial statementsIn the current year, the Corporation reviewed new and revised IFRS issued by the International Accounting Standards Board (IASB) that became effective during the year ended April 30, 2016. The new and revised IFRS did not have any impact on the Corporation’s financial statements.
4.2 New and revised IFRS in issue but not yet effectiveThe Corporation reviewed new and revised accounting pronouncements that have been issued but are not yet effective and determined that the following may have an impact on the Corporation’s financial statements in future years.
IFRS 9 Financial Instruments In July 2014, the IASB issued the complete version of IFRS 9, “Financial Instruments”, first issued in November 2009, which brings together the classification and measurement, impairment and hedge accounting phases of the IASB’s project to replace IAS 39 Financial Instruments: Recognition and Measurement. IFRS 9 introduces a principles-based approach to the classification of financial assets based on an entity’s business model and the nature of the cash flows of the asset. The mandatory effective date of IFRS 9 is January 1, 2018.
The Corporation is currently evaluating the impact of the adoption of IFRS 9 on its financial statements therefore, the impact is not known at this time.
IFRS 15 Revenue from Contracts with Customers In May 2014, the IASB issued IFRS 15, “Revenue from Contracts with Customers”, which establishes principles for reporting about the nature, amount, timing and uncertainty of revenue and cash flows arising from an entity’s contracts with customers. The mandatory effective date of IFRS 15 is January 1, 2018.
The Corporation has not assessed the impact of the adoption of IFRS 15 on its financial statements; however, adoption of the amendment is not expected to have a significant impact on the Corporation’s financial statements.
IFRS 16 Leases In January 2016, the IASB issued IFRS 16, “Leases”, which sets out the principles that both parties to a contract apply in order to provide relevant information about leases in a manner that faithfully represents those transactions. IFRS 16 requires all significant leases to be reported on the lessee’s statement of financial position. There are also changes in accounting over the life of the lease. In particular, the lessee will recognize a front-loaded pattern of expense for most leases, even when it pays constant annual rentals. Lessors’ accounting treatment remains similar to current practice. They continue to classify leases as finance and operating leases. The mandatory effective date of IFRS 16 is January 1, 2019.
The Corporation has not assessed the impact of the adoption of IFRS 16 on its financial statements; however, adoption of the amendment is not expected to have a significant impact on the Corporation’s financial statements.
IAS 7 Statement of Cash Flows In January 2016, the IASB amended IAS 7, “Statement of Cash Flows”, which requires an entity to present a statement of cash flows as an integral part of its primary financial statements. These narrow-scope amendments to IAS 7 requires entities to disclose information about changes in their financing liabilities as part of this statement. The mandatory effective date of the amendment is January 1, 2017.
The Corporation is currently evaluating the impact of the adoption of the IAS 7 amendments on its financial statements therefore the impact is not known at this time.
39
5. FINANCIAL INSTRUMENTS AND FINANCIAL RISK MANAGEMENT
5.1 Capital risk managementThe Corporation is subject to the Freshwater Fish Marketing Act and the Financial Administration Act and any directives issued pursuant to these acts. These acts affect how the Corporation manages its capital by, among other things, setting broad objectives for the Corporation. Specifically, the Corporation must have regard for the need to conduct its operations on a self-sustaining financial basis while generating a return to fishers.
The Corporation defines and computes its capital as follows:
2016 2015Retained earnings $ 11,888 $ 10,352 Loans payable 24,561 21,300
$ 36,449 $ 31,652
The Corporation’s objectives in managing capital are to:
• Provide sufficient liquidity to support its financial obligations and its operating and strategic plans;• Generate increasing returns to the fishers; and• Maintain financial capacity and access to credit facilities to support future development of the business, including for capital
expenditures.
During the year, the Corporation primarily relied on cash flows provided by operating activities to support its objectives.
The Corporation’s ability to obtain additional capital is subject to market conditions and pursuant to the provisions of these acts. The limitations on the borrowings of the Corporation and its access to credit facilities are outlined in Note 1. Pursuant to Part X of the Financial Administration Act, the Corporation must indicate its intention to borrow money in its annual corporate plan, or in an amendment thereto, which are subject to the approval of the Board of Directors and the Governor in Council. The timing of future borrowings is not determinable.
These objectives and strategies are reviewed in the annual corporate plan submission, approved by the Board of Directors. The Corporation’s overall strategy with respect to capital risk management remains unchanged from the year ended April 30, 2015 as payouts to fishers are based on annual comprehensive income before income tax plus annual depreciation less the three-year rolling average of cash purchases of capital assets.
The Corporation is not subject to any externally imposed capital requirements.

40
5.2 Classification and fair value measurements of financial instruments
5.2.1 Carrying amount and fair value of financial instrumentsThe carrying amounts of the Corporation’s financial assets and financial liabilities approximate the fair values of the financial assets and liabilities.
The Corporation did not have any held-to-maturity or available-for-sale financial assets at the end of the reporting period presented.
The Corporation estimated the fair values of its financial instruments as follows:
i) The carrying amounts of cash, accounts receivable and accounts payable and accrued liabilities approximate their fair values as a result of the relatively short-term nature of these financial instruments.
ii) The fair value of loans payables has been estimated based on a discounted cash flow approach using current market rates appropriate as at the respective date presented.
iii) The fair values of the Corporation’s interest rate swap contracts are based on estimated credit-adjusted market prices. The Corporation takes counterparty risk and its own risk into consideration for the fair value of financial instruments.
5.2.2 Fair value hierarchyFinancial instruments, other than those that are not subsequently measured at fair value and for which fair value approximates carrying value, whether or not they are carried at fair value in the statement of financial position, must have their fair value disclosed and be classified using a fair value hierarchy that reflects the significance of the inputs used in making the measurements:
• Level 1: Quoted prices (unadjusted) in active markets for identical assets or liabilities• Level 2: Inputs other than quoted prices included within Level 1 that are observable for the asset or liability, either directly
(i.e., as prices) or indirectly (i.e., derived from prices)• Level 3: Inputs for the asset or liability that are not based on observable market data (unobservable inputs)
The fair value measurement of cash is classified as Level 1 of the fair value hierarchy as at April 30, 2016 and 2015. The fair value measurements of all other financial instruments held by the Corporation are classified as Level 2 of the fair value hierarchy as at April 30, 2016 and 2015.
There were no transfers of financial instruments between levels during the year ended April 30, 2016.
The fair value measurements of the derivative financial instruments as recorded in the statement of financial position are classified as follows:
(CAD$ thousands)2016 2015
Derivative-related liabilities $ 1,297 $ 1,106
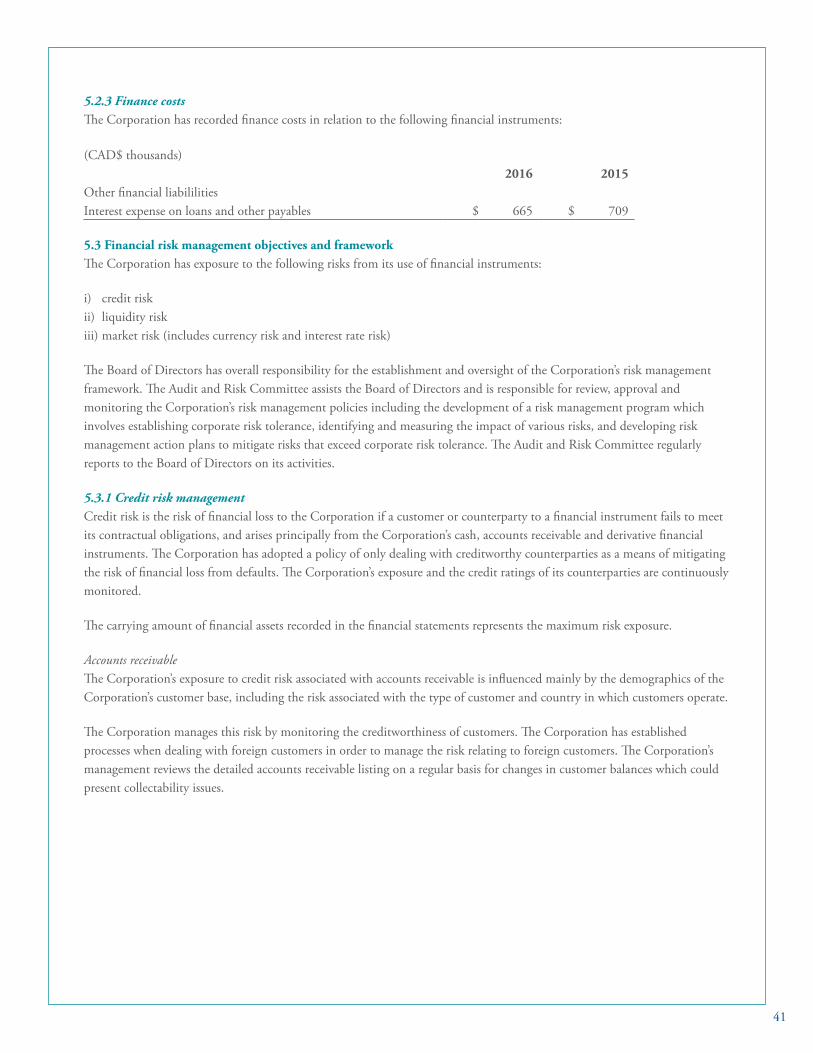
41
5.2.3 Finance costsThe Corporation has recorded finance costs in relation to the following financial instruments:
(CAD$ thousands)2016 2015
Other financial liabililitiesInterest expense on loans and other payables $ 665 $ 709
5.3 Financial risk management objectives and frameworkThe Corporation has exposure to the following risks from its use of financial instruments:
i) credit riskii) liquidity riskiii) market risk (includes currency risk and interest rate risk)
The Board of Directors has overall responsibility for the establishment and oversight of the Corporation’s risk management framework. The Audit and Risk Committee assists the Board of Directors and is responsible for review, approval and monitoring the Corporation’s risk management policies including the development of a risk management program which involves establishing corporate risk tolerance, identifying and measuring the impact of various risks, and developing risk management action plans to mitigate risks that exceed corporate risk tolerance. The Audit and Risk Committee regularly reports to the Board of Directors on its activities.
5.3.1 Credit risk managementCredit risk is the risk of financial loss to the Corporation if a customer or counterparty to a financial instrument fails to meet its contractual obligations, and arises principally from the Corporation’s cash, accounts receivable and derivative financial instruments. The Corporation has adopted a policy of only dealing with creditworthy counterparties as a means of mitigating the risk of financial loss from defaults. The Corporation’s exposure and the credit ratings of its counterparties are continuously monitored.
The carrying amount of financial assets recorded in the financial statements represents the maximum risk exposure.
Accounts receivable The Corporation’s exposure to credit risk associated with accounts receivable is influenced mainly by the demographics of the Corporation’s customer base, including the risk associated with the type of customer and country in which customers operate.
The Corporation manages this risk by monitoring the creditworthiness of customers. The Corporation has established processes when dealing with foreign customers in order to manage the risk relating to foreign customers. The Corporation’s management reviews the detailed accounts receivable listing on a regular basis for changes in customer balances which could present collectability issues.

42
The maximum exposure to credit risk for accounts receivable by geographic region was as follows:
2016 2015Original currency (CAD $)
Original currency (U.S. $) $CAD
Original currency (CAD $)
Original currency (U.S. $) $CAD
Canada $ 571 $ - $ 571 $ 932 $ - $ 932 United States 232 4,088 5,362 19 3,689 4,533 Europe 2,043 265 2,376 554 - 554 Non-trade accounts receivable 418 - 418 625 - 625
$ 8,727 $ 6,644
Accounts receivable are classified as loans and receivables and are measured at amortized cost.
At April 30, 2016, four customers represented 34% of the total accounts receivable balance. At April 30, 2015 four customers represented 43% of the total accounts receivable balance. Customers primarily represent distributors.
The Corporation establishes an allowance for doubtful accounts that reflects the estimated impairment of accounts receivable. The allowance is based on specific accounts and is determined by considering the Corporation’s knowledge of the financial condition of its customers, the aging of accounts receivable, the current business and geopolitical climate, customer and industry concentrations and historical experience.
The aging of accounts receivable, net of allowance, is as follows:
(CAD$ thousands) 2016 2015Current 0-30 days $ 6,767 $ 5,075 Past due 31-60 days 673 869 Past due over 61 days 869 75 Non-trade accounts receivable 418 625
$ 8,727 $ 6,644
The change in the allowance for doubtful accounts is as follows:
2016 2015Balance at the beginning of the year $ 3 $ 3 Additions - -Write-offs (3) -Balance at the end of the year $ - $ 3
The Corporation does not hold any collateral in respect of accounts receivable.
Cash The Corporation manages its exposure to credit risk for its cash by depositing only with creditworthy counterparties, such as major Canadian financial institutions. The maximum exposure to credit risk for cash at April 30, 2016 was $1,172 (2015 – $193).
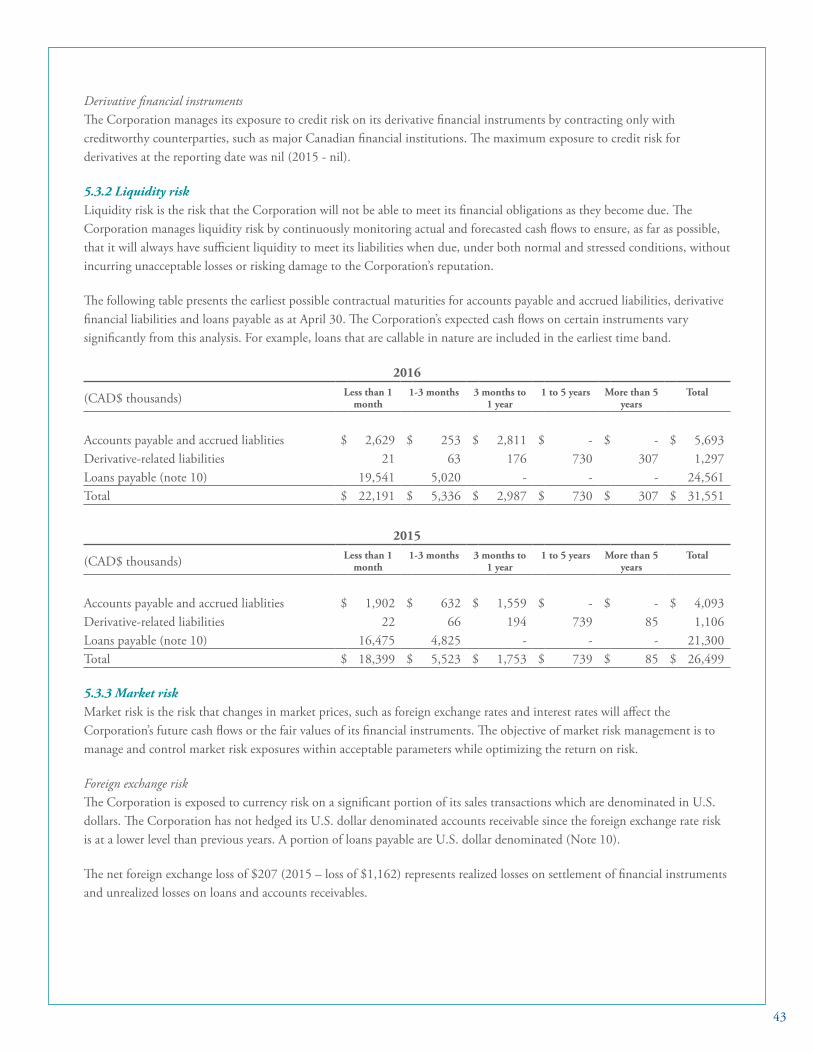
43
Derivative financial instruments The Corporation manages its exposure to credit risk on its derivative financial instruments by contracting only with creditworthy counterparties, such as major Canadian financial institutions. The maximum exposure to credit risk for derivatives at the reporting date was nil (2015 - nil).
5.3.2 Liquidity riskLiquidity risk is the risk that the Corporation will not be able to meet its financial obligations as they become due. The Corporation manages liquidity risk by continuously monitoring actual and forecasted cash flows to ensure, as far as possible, that it will always have sufficient liquidity to meet its liabilities when due, under both normal and stressed conditions, without incurring unacceptable losses or risking damage to the Corporation’s reputation.
The following table presents the earliest possible contractual maturities for accounts payable and accrued liabilities, derivative financial liabilities and loans payable as at April 30. The Corporation’s expected cash flows on certain instruments vary significantly from this analysis. For example, loans that are callable in nature are included in the earliest time band.
2016
(CAD$ thousands) Less than 1 month
1-3 months 3 months to 1 year
1 to 5 years More than 5 years
Total
Accounts payable and accrued liablities $ 2,629 $ 253 $ 2,811 $ - $ - $ 5,693 Derivative-related liabilities 21 63 176 730 307 1,297 Loans payable (note 10) 19,541 5,020 - - - 24,561 Total $ 22,191 $ 5,336 $ 2,987 $ 730 $ 307 $ 31,551
2015
(CAD$ thousands) Less than 1 month
1-3 months 3 months to 1 year
1 to 5 years More than 5 years
Total
Accounts payable and accrued liablities $ 1,902 $ 632 $ 1,559 $ - $ - $ 4,093 Derivative-related liabilities 22 66 194 739 85 1,106 Loans payable (note 10) 16,475 4,825 - - - 21,300 Total $ 18,399 $ 5,523 $ 1,753 $ 739 $ 85 $ 26,499
5.3.3 Market riskMarket risk is the risk that changes in market prices, such as foreign exchange rates and interest rates will affect the Corporation’s future cash flows or the fair values of its financial instruments. The objective of market risk management is to manage and control market risk exposures within acceptable parameters while optimizing the return on risk.
Foreign exchange risk The Corporation is exposed to currency risk on a significant portion of its sales transactions which are denominated in U.S. dollars. The Corporation has not hedged its U.S. dollar denominated accounts receivable since the foreign exchange rate risk is at a lower level than previous years. A portion of loans payable are U.S. dollar denominated (Note 10).
The net foreign exchange loss of $207 (2015 – loss of $1,162) represents realized losses on settlement of financial instruments and unrealized losses on loans and accounts receivables.
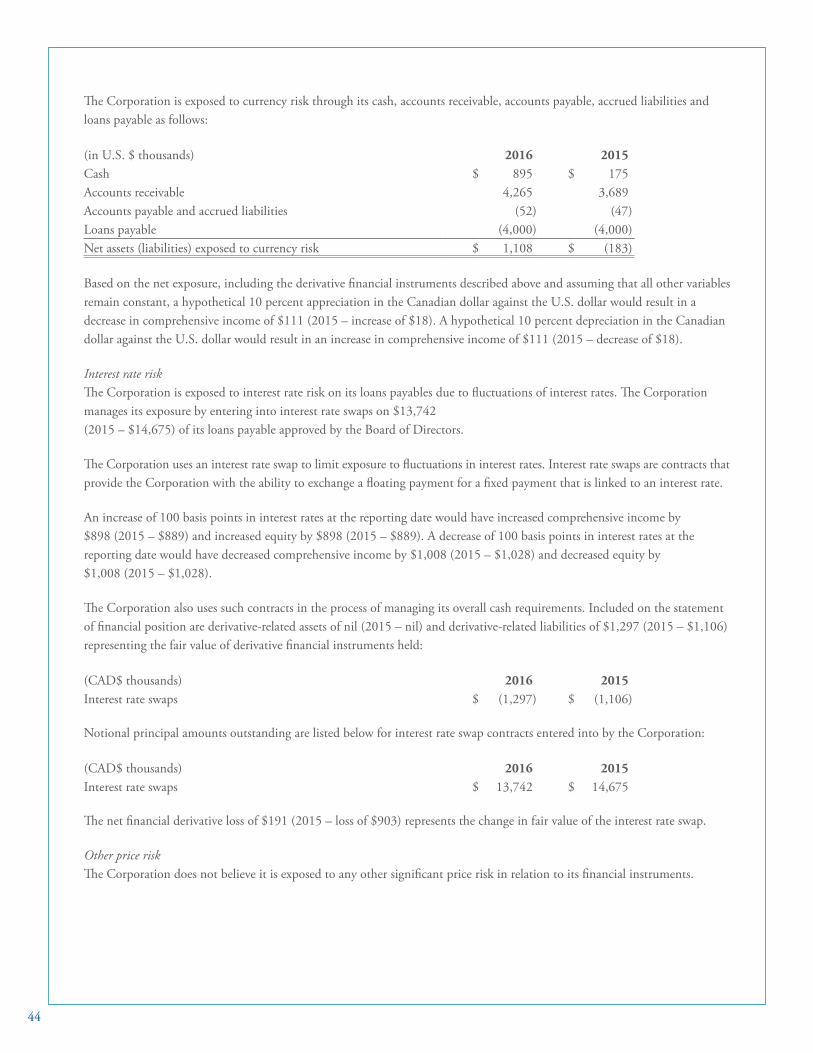
44
The Corporation is exposed to currency risk through its cash, accounts receivable, accounts payable, accrued liabilities and loans payable as follows:
(in U.S. $ thousands) 2016 2015Cash $ 895 $ 175 Accounts receivable 4,265 3,689 Accounts payable and accrued liabilities (52) (47)Loans payable (4,000) (4,000)Net assets (liabilities) exposed to currency risk $ 1,108 $ (183)
Based on the net exposure, including the derivative financial instruments described above and assuming that all other variables remain constant, a hypothetical 10 percent appreciation in the Canadian dollar against the U.S. dollar would result in a decrease in comprehensive income of $111 (2015 – increase of $18). A hypothetical 10 percent depreciation in the Canadian dollar against the U.S. dollar would result in an increase in comprehensive income of $111 (2015 – decrease of $18).
Interest rate risk The Corporation is exposed to interest rate risk on its loans payables due to fluctuations of interest rates. The Corporation manages its exposure by entering into interest rate swaps on $13,742 (2015 – $14,675) of its loans payable approved by the Board of Directors.
The Corporation uses an interest rate swap to limit exposure to fluctuations in interest rates. Interest rate swaps are contracts that provide the Corporation with the ability to exchange a floating payment for a fixed payment that is linked to an interest rate.
An increase of 100 basis points in interest rates at the reporting date would have increased comprehensive income by $898 (2015 – $889) and increased equity by $898 (2015 – $889). A decrease of 100 basis points in interest rates at the reporting date would have decreased comprehensive income by $1,008 (2015 – $1,028) and decreased equity by $1,008 (2015 – $1,028).
The Corporation also uses such contracts in the process of managing its overall cash requirements. Included on the statement of financial position are derivative-related assets of nil (2015 – nil) and derivative-related liabilities of $1,297 (2015 – $1,106) representing the fair value of derivative financial instruments held:
(CAD$ thousands) 2016 2015Interest rate swaps $ (1,297) $ (1,106)
Notional principal amounts outstanding are listed below for interest rate swap contracts entered into by the Corporation:
(CAD$ thousands) 2016 2015Interest rate swaps $ 13,742 $ 14,675
The net financial derivative loss of $191 (2015 – loss of $903) represents the change in fair value of the interest rate swap.
Other price risk The Corporation does not believe it is exposed to any other significant price risk in relation to its financial instruments.

45
6. INVENTORIES
(CAD$ thousands) 2016 2015Supplies $ 1,048 $ 858 Processed fish products 22,140 16,233 Write-down of processed fish products expensed in the year (3,501) (828)
$ 19,687 $ 16,263
Inventory write-downs of $3,501 (2015 – $828) are included in inventory values in the cost of sales. The amount of inventories recognized as an expense during the year is $60,289 (2015 – $55,720). There is no pledged collateral in respect of inventory. There were no prior write-downs reversed in the current year.
7. PROPERTY, PLANT AND EQUIPMENT
(CAD$ thousands) 2016 2015Cost $ 42,677 $ 40,437 Accumulated depreciation (22,803) (21,236)Carrying amount $ 19,874 $ 19,201
Carrying amount by asset classLand $ 336 $ 336 Buildings 5,146 5,285 Equipment 10,911 11,028 Fresh fish delivery tubs/totes 123 160 Vessels 2,164 2,271 Construction in progress 1,194 121 Carrying amount $ 19,874 $ 19,201

46
(CAD$ thousands)Land Buildings Equipment Fresh fish
delivery tubs/totes
Vessels Constructionin progress
Total
CostBalance at May 1, 2014 $ 336 $ 13,516 $ 21,933 $ 1,295 $ 3,364 $ - $ 40,444 Additions - 290 369 - 69 121 849 Transfers - - - - - - -Adjustment - (67) (606) - - - (673)Disposals - (2) (181) - - - (183)Balance at April 30, 2015 336 13,737 21,515 1,295 3,433 121 40,437
Additions - 235 1,065 28 13 1,057 2,398 Transfers - - (96) - - 16 (80)Disposals - - (78) - - - (78)Balance at April 30, 2016 $ 336 $ 13,972 $ 22,406 $ 1,323 $ 3,446 $ 1,194 $ 42,677
Accumulated depreciationBalance at May 1, 2014 $ - $ 8,070 $ 9,576 $ 1,057 $ 1,048 $ - $ 19,751 Depreciation - 390 1,148 78 114 - 1,730 Adjustment - (7) (73) - - - (80)Disposals - (1) (164) - - - (165)Balance at April 30, 2015 - 8,452 10,487 1,135 1,162 - 21,236
Depreciation - 374 1,082 65 120 - 1,641 Disposals - - (74) - - - (74)Balance at April 30, 2016 $ - $ 8,826 $ 11,495 $ 1,200 $ 1,282 $ - $ 22,803
Carrying amount at April 30, 2016 $ 336 $ 5,146 $ 10,911 $ 123 $ 2,164 $ 1,194 $ 19,874
Depreciation expense is recorded on the statement of comprehensive income in cost of sales (2016 – $1,489; 2015 – $1,512), in marketing and administrative expenses (2016 – $35; 2015 – $24) and in other expenses (2016 – $117; 2015 – $114).
The Corporation recorded an impairment loss of $96 (2015 – nil) that is included in repairs and maintenance, Winnipeg plant under cost of sales on the statement of comprehensive income.
No property, plant and equipment were pledged as security for borrowing as at April 30, 2016.
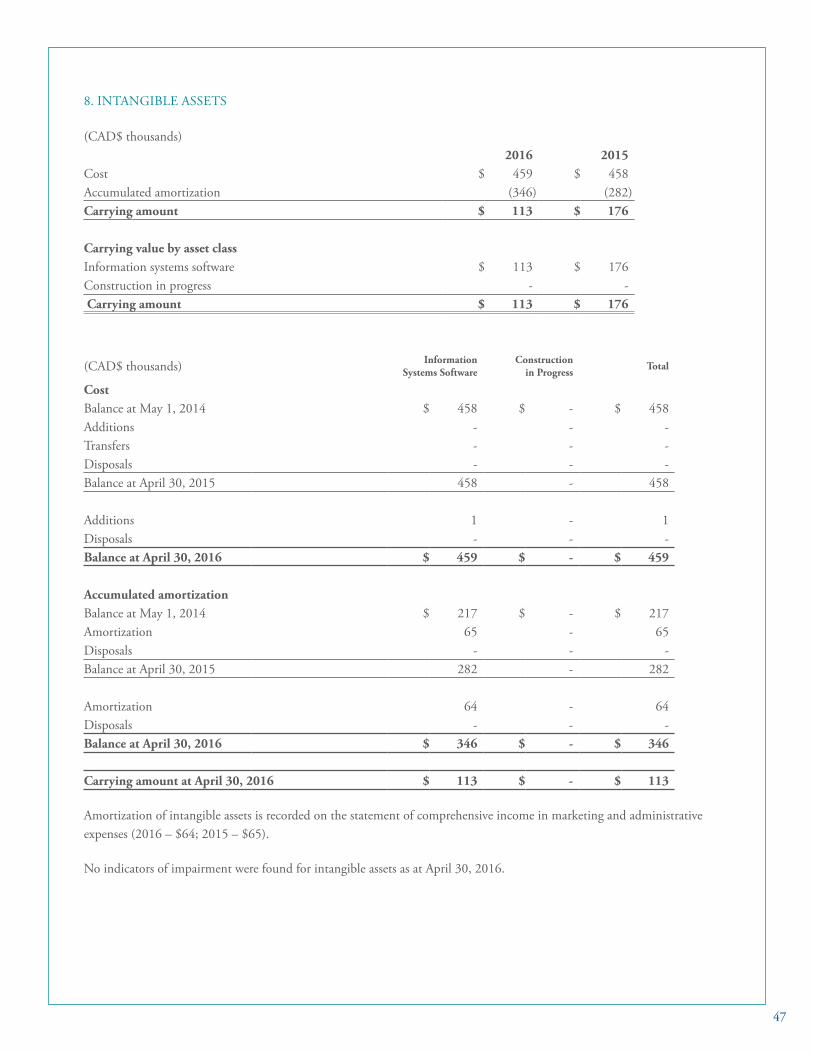
47
8. INTANGIBLE ASSETS
(CAD$ thousands)2016 2015
Cost $ 459 $ 458 Accumulated amortization (346) (282)Carrying amount $ 113 $ 176
Carrying value by asset classInformation systems software $ 113 $ 176 Construction in progress - - Carrying amount $ 113 $ 176
(CAD$ thousands) Information Systems Software
Construction in Progress Total
CostBalance at May 1, 2014 $ 458 $ - $ 458 Additions - - -Transfers - - -Disposals - - -Balance at April 30, 2015 458 - 458
Additions 1 - 1 Disposals - - -Balance at April 30, 2016 $ 459 $ - $ 459
Accumulated amortizationBalance at May 1, 2014 $ 217 $ - $ 217 Amortization 65 - 65 Disposals - - -Balance at April 30, 2015 282 - 282
Amortization 64 - 64 Disposals - - -Balance at April 30, 2016 $ 346 $ - $ 346
Carrying amount at April 30, 2016 $ 113 $ - $ 113
Amortization of intangible assets is recorded on the statement of comprehensive income in marketing and administrative expenses (2016 – $64; 2015 – $65).
No indicators of impairment were found for intangible assets as at April 30, 2016.

48
9. ACCOUNTS PAYABLE AND ACCRUED LIABILITIES
(CAD$ thousands)2016 2015
Canadian dollars $ 5,628 $ 4,036 U.S. dollars 65 57 Total trade and other payables and accrued liabilities $ 5,693 $ 4,093
10. LOANS PAYABLE
(CAD$ thousands)2016 2015
Promissory note $ 5,020 $ 4,825 Bankers’ acceptances 19,541 16,475 Total loans payable $ 24,561 $ 21,300
The loans payable consist of the following borrowing facilities:
A $5,799 (2015 – $1,800) bankers’ acceptance bearing interest at an annual rate of 1.55% (2015 – 1.61%) and maturing on May 5, 2016. The weighted-average interest rate during the year was 1.73% (2015 – 1.75%). Subsequent to May 5, 2016, new bankers’ acceptances were entered into at a rate of 1.65%.
An $8,000 (2015 – $8,500) bankers’ acceptance with an interest rate swap bearing an interest rate at 3.47% if the floating rate option on any reset date is less than or equal to 3.65%. If the floating rate option on any reset date is greater than 3.65%, the fixed rate for the calculation period is 4.22%. The Corporation hedges the loan for interest rate risk via an interest rate swap exchanging variable rate interest for fixed rate interest. The structure of the loan involves the use of a revolving bankers’ acceptance and an interest rate swap to lock in the interest rate for 16 years. At April 30, 2016, $2,000 in principal has been paid on the loan.
A $5,742 (2015 – $6,175) bankers’ acceptance with an interest rate swap bearing an interest rate at 3.50% if the floating rate option on any reset date is less than or equal to 3.80%. If the floating rate option on any reset date is greater than 3.80%, the fixed rate for the calculation period is 4.25%. The Corporation hedges the loan for interest rate risk via an interest rate swap exchanging variable rate interest for fixed rate interest. The structure of the loan involves the use of a revolving bankers’ acceptance and an interest rate swap to lock in the interest rate for 13.25 years. At April 30, 2016, $758 in principal has been paid on the loan.
The principal of the bankers’ acceptances as at April 30, 2016 is $19,541 (2015 – $16,475) and the fair value of the loans are $19,541 (2015 – $16,475).
A $4,000 U.S. dollar (2015 – $4,000 U.S. dollar) denominated promissory note ($5,020 Canadian dollars, 2015 – $4,825 Canadian dollars) repayable in U.S. dollars, bearing interest at an annual rate of 1.17% (2015 – 0.83%) and maturing on June 30, 2016. The weighted-average interest rate during the year was 1.02% (2015 – 0.90 %). The balance of the principal as at April 30, 2016 is $5,020 (2015 – $4,825) and the fair value of the loan is $5,020 (2015 – $4,825).
The bankers’ acceptances and promissory note are authorized by the Minister of Finance (Note 1).
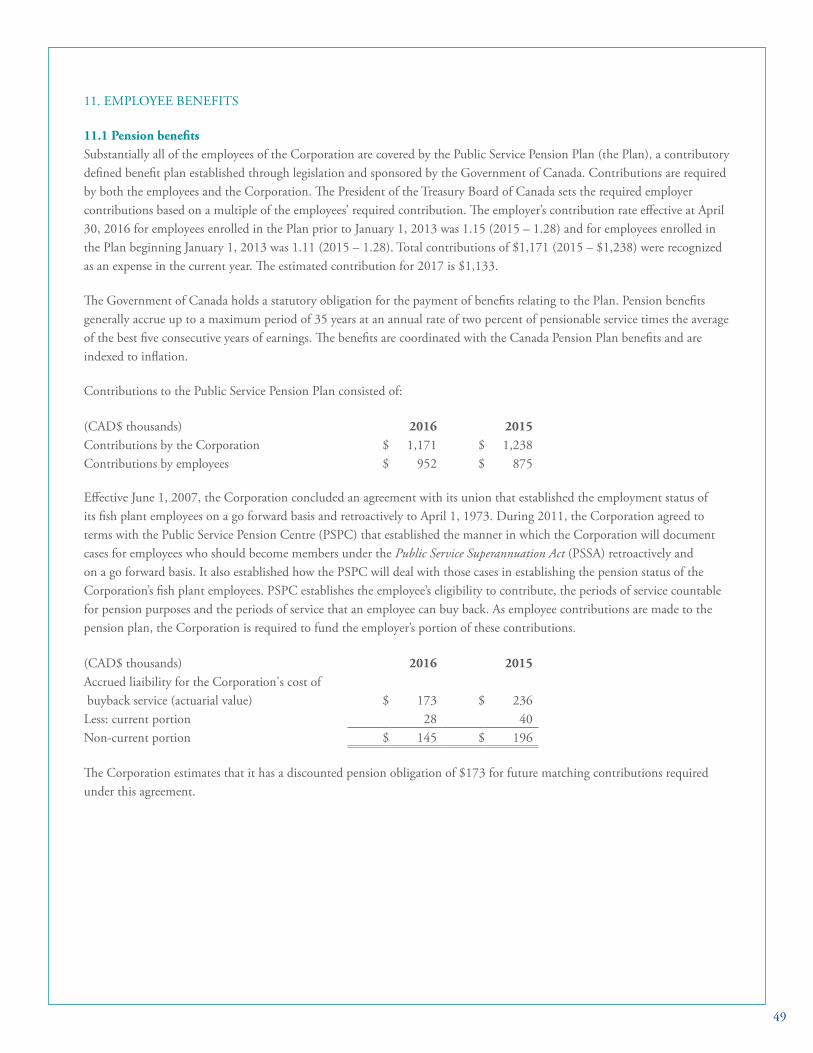
49
11. EMPLOYEE BENEFITS
11.1 Pension benefitsSubstantially all of the employees of the Corporation are covered by the Public Service Pension Plan (the Plan), a contributory defined benefit plan established through legislation and sponsored by the Government of Canada. Contributions are required by both the employees and the Corporation. The President of the Treasury Board of Canada sets the required employer contributions based on a multiple of the employees’ required contribution. The employer’s contribution rate effective at April 30, 2016 for employees enrolled in the Plan prior to January 1, 2013 was 1.15 (2015 – 1.28) and for employees enrolled in the Plan beginning January 1, 2013 was 1.11 (2015 – 1.28). Total contributions of $1,171 (2015 – $1,238) were recognized as an expense in the current year. The estimated contribution for 2017 is $1,133.
The Government of Canada holds a statutory obligation for the payment of benefits relating to the Plan. Pension benefits generally accrue up to a maximum period of 35 years at an annual rate of two percent of pensionable service times the average of the best five consecutive years of earnings. The benefits are coordinated with the Canada Pension Plan benefits and are indexed to inflation.
Contributions to the Public Service Pension Plan consisted of:
(CAD$ thousands) 2016 2015Contributions by the Corporation $ 1,171 $ 1,238 Contributions by employees $ 952 $ 875
Effective June 1, 2007, the Corporation concluded an agreement with its union that established the employment status of its fish plant employees on a go forward basis and retroactively to April 1, 1973. During 2011, the Corporation agreed to terms with the Public Service Pension Centre (PSPC) that established the manner in which the Corporation will document cases for employees who should become members under the Public Service Superannuation Act (PSSA) retroactively and on a go forward basis. It also established how the PSPC will deal with those cases in establishing the pension status of the Corporation’s fish plant employees. PSPC establishes the employee’s eligibility to contribute, the periods of service countable for pension purposes and the periods of service that an employee can buy back. As employee contributions are made to the pension plan, the Corporation is required to fund the employer’s portion of these contributions.
(CAD$ thousands) 2016 2015Accrued liaibility for the Corporation's cost of buyback service (actuarial value) $ 173 $ 236 Less: current portion 28 40Non-current portion $ 145 $ 196
The Corporation estimates that it has a discounted pension obligation of $173 for future matching contributions required under this agreement.

50
The principal actuarial assumptions used at the end of the reporting period were as follows (weighted-average):
2016 2015Discount rate 2.95% per year 2.95% per yearMortality rates – base table 100% CPM 2014 100% CPM 2014Rates of mortality improvement Based on Scale CPM-B Based on Scale CPM-BRetirement age Age 65 Age 65Employer preferred rate 115% of employee contributions 128% of employee contributions
The actuarial liability could be different if assumptions on which the valuation is based vary significantly in future years. Changes in the liability are recognized based on an extrapolation of actuarial results and adjustments arising from actuarial gains and losses in the year in which they occur. An actuarial valuation of the liability was performed at April 30, 2016 to establish a measurement of the liability.
11.2 Accrued obligation for sick leave benefits and workers’ compensationThe Corporation’s accrued obligation for sick leave benefits provides accumulating sick leave benefits to eligible employees. The liability was actuarially determined as the present value of all future payouts, multiplied by the employee’s service at the valuation date to the employee’s service at the date when the employee is eligible for the benefit and considered the current balances in any sick leave banks, the annual accumulation of net sick leave credits and the future entitlement to, or utilization of, sick leave benefits.
The Corporation’s accrued obligation for workers’ compensation represents the unfunded liability for the costs of benefits specified and administered by the Workers Compensation Board of Manitoba for work-related injuries of Freshwater Fish Marketing Corporation employees. The actuarially determined liability consists of long-term pension awards and temporary compensation costs related to future claims payment administration by the Workers Compensation Board of Manitoba.
The actuary used assumptions, as agreed with management, in the calculation of the liabilities including inflation rates, interest rates, mortality rates and aggregate claim projections for incidents which have occurred for the workers’ compensation liability. The actuarial liability could be materially different if assumptions on which the valuation is based vary significantly in future years. Changes in the liability are recognized based on an extrapolation of actuarial results and adjustments arising from actuarial gains and losses in the year in which they occur. An actuarial valuation of the sick leave and workers’ compensation liabilities was performed at April 30, 2016 to establish a measurement of these liabilities.
The statement of comprehensive income includes a charge of $150 (2015 – $98) which relates to current service costs, interest charges on the workers’ compensation obligation and an actuarial gain/loss. The statement of comprehensive income also includes a charge of $53 (2015 – $47), which relates to current service costs, interest cost and an actuarial gain/loss related to the sick leave liability.

51
The Corporation’s obligation for workers’ compensation and sick leave consists of the following:
(CAD$ thousands) Workers’ compensation Sick leave2016 2015 2016 2015
Actuarial value $ 142 $ 190 $ 498 $ 466 Less: current portion 61 176 498 466 Non-current portion $ 81 $ 14 $ - $ -
Benefits paid $ 198 $ 172 $ 21 $ 7
Workers’ compensation Sick leave2016 2015 2016 2015
Current service costs $ 208 $ 223 $ 42 $ 39 Interest costs 9 14 16 17 Actuarial loss from demographic assumptions - 19 - -Actuarial loss from financial assumptions 4 5 - 21 Actuarial (gain) from experience adjustments (71) (163) (5) (30)Total costs $ 150 $ 98 $ 53 $ 47
Included in the actuarial (gains)/losses from financial assumptions are the adjustments due to the effect of the discount rate applied to the obligations. Actuarial (gains)/losses from experience adjustments are the adjustments due to the effect of differences between the previous actuarial assumptions and what has actually occurred, and the effects of changes in actuarial assumptions.
Mortality rates are a key demographic assumption used in the valuation of the workers’ compensation and sick leave obligations. Tables published in February 2014 by The Canadian Institute of Actuaries were used in the valuation of the sick leave obligation. The Ontario WSIB Workers Compensation 2006-2010 mortality table projected to 2015 was used in the valuation of the workers’ compensation.
The weighted-average duration of the defined benefit obligation for the workers’ compensation liability is 4 years and 8.2 years for the sick leave liability.
The estimated portion of the workers’ compensation liability the Corporation expects to settle in the year ending April 30, 2017 is $61 and $12 for the sick leave liability.
The principal actuarial assumptions used at the end of the reporting period were as follows (weighted-average):
Workers’ compensation Sick leave2016 2015 2016 2015
Discount rate for obligation 3.0% 3.0% 3.2% 3.2%Rate of compensation increase 2.0% 2.0%Health care trend 5.0% 5.0%All other cost indexation 2.0% 2.0%
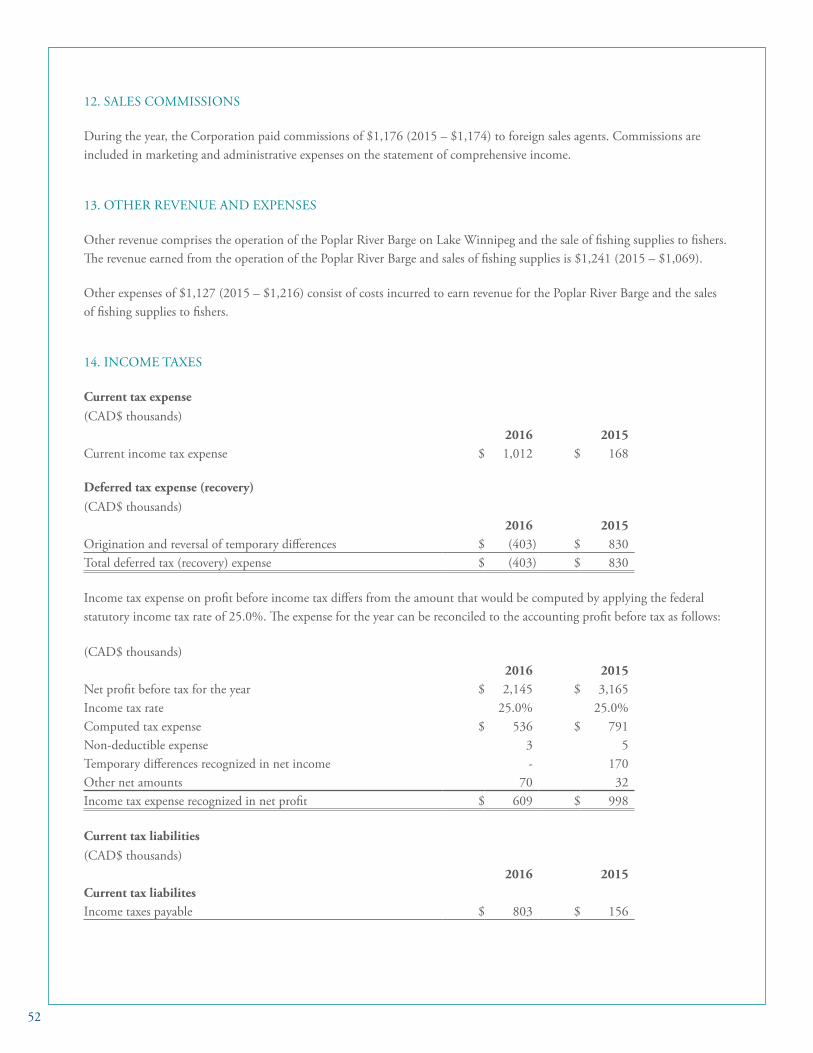
52
12. SALES COMMISSIONS
During the year, the Corporation paid commissions of $1,176 (2015 – $1,174) to foreign sales agents. Commissions are included in marketing and administrative expenses on the statement of comprehensive income.
13. OTHER REVENUE AND EXPENSES
Other revenue comprises the operation of the Poplar River Barge on Lake Winnipeg and the sale of fishing supplies to fishers. The revenue earned from the operation of the Poplar River Barge and sales of fishing supplies is $1,241 (2015 – $1,069).
Other expenses of $1,127 (2015 – $1,216) consist of costs incurred to earn revenue for the Poplar River Barge and the sales of fishing supplies to fishers.
14. INCOME TAXES
Current tax expense(CAD$ thousands)
2016 2015Current income tax expense $ 1,012 $ 168
Deferred tax expense (recovery)(CAD$ thousands)
2016 2015Origination and reversal of temporary differences $ (403) $ 830 Total deferred tax (recovery) expense $ (403) $ 830
Income tax expense on profit before income tax differs from the amount that would be computed by applying the federal statutory income tax rate of 25.0%. The expense for the year can be reconciled to the accounting profit before tax as follows:
(CAD$ thousands)2016 2015
Net profit before tax for the year $ 2,145 $ 3,165 Income tax rate 25.0% 25.0%Computed tax expense $ 536 $ 791 Non-deductible expense 3 5 Temporary differences recognized in net income - 170 Other net amounts 70 32 Income tax expense recognized in net profit $ 609 $ 998
Current tax liabilities(CAD$ thousands)
2016 2015Current tax liabilitesIncome taxes payable $ 803 $ 156

53
The tax effects of temporary differences that give rise to deferred tax assets and liabilities are presented below:
Temporary differences for 2016(CAD$ thousands)
Opening balance
Recognized in profit or (loss)
Ending balance
Deferred tax assetsEmployee benefits $ 223 $ (20) $ 203Foreign exchange loss 150 (99) 51Financial instrument loss 115 209 324Provision for environmental liability - 261 261Deferred tax liabilityProperty, plant and equipment (2,246) 36 (2,210)Intangible assets (44) 16 (28)Net deferred tax liability $ (1,802) $ 403 $ (1,399)
Temporary differences for 2015(CAD$ thousands)
Opening balance
Recognized in profit or (loss)
Ending balance
Deferred tax assetsEmployee benefits $ 248 $ (25) $ 223 Foreign exchange loss 108 42 150 Financial instrument loss 51 64 115 Deferred tax liabilityProperty, plant and equipment (1,353) (893) (2,246)Intangible assets (26) (18) (44)Net deferred tax liability $ (972) $ (830) $ (1,802)

54
15. RELATED PARTY TRANSACTIONS
The Corporation is related in terms of common ownership to all Government of Canada owned entities.
The Corporation enters into transactions with these entities in the normal course of business, at fair value, under the same terms and conditions that apply to unrelated parties. In accordance with the disclosure exemption regarding government-related entities, the Corporation is exempt from certain disclosure requirements of IAS 24 relating to its transactions and outstanding balances with:
• a government that has control, joint control or significant influence over the reporting entity; or• another entity that is a related party because the same government has control, joint control or significant influence over
both the reporting entity and the other entity.
Based on this exemption, as the Corporation has not entered into any transactions with these related parties which are considered to be individually or collectively significant, the Corporation has not disclosed any details of its transactions with:
• the Government of Canada, and departments and agencies thereof; or• federal Crown corporations.
Certain members of the Board of Directors and their closely related family members are fishers who sell their catch to the Corporation. During the year, delivered fish volume by Board members and their closely related family members was 42,000 kilograms (2015 – 42,000 kilograms) valued at $85 (2015 – $102). These transactions are measured at fair value and were incurred during the normal course of business on similar terms and conditions to those entered into with unrelated parties.
Compensation of key management personnel Compensation of key management personnel include members of the Board of Directors and executive officers of the Corporation who have the authority and responsibility for planning, directing and controlling the activities of the Corporation.
Compensation of key management personnel for the year was as follows:
(CAD$ thousands) 2016 2015Short-term employee benefits $ 858 $ 747 Total compensation paid to key management personnel $ 858 $ 747
Compensation for executive officers of the Corporation is recorded on the statement of comprehensive income as salaries and benefits in marketing and administrative expenses. Compensation for members of the Board of Directors is recorded on the statement of comprehensive income as meeting fees and expenses in marketing and administrative expenses.
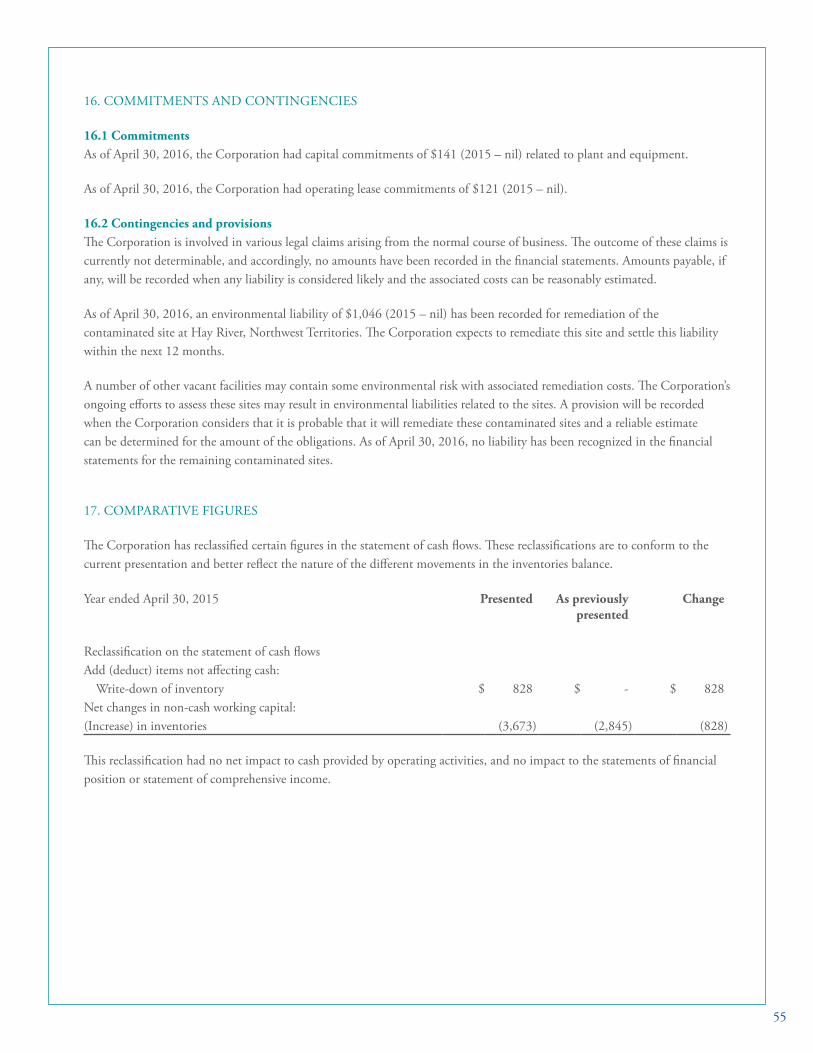
55
16. COMMITMENTS AND CONTINGENCIES
16.1 CommitmentsAs of April 30, 2016, the Corporation had capital commitments of $141 (2015 – nil) related to plant and equipment.
As of April 30, 2016, the Corporation had operating lease commitments of $121 (2015 – nil).
16.2 Contingencies and provisionsThe Corporation is involved in various legal claims arising from the normal course of business. The outcome of these claims is currently not determinable, and accordingly, no amounts have been recorded in the financial statements. Amounts payable, if any, will be recorded when any liability is considered likely and the associated costs can be reasonably estimated.
As of April 30, 2016, an environmental liability of $1,046 (2015 – nil) has been recorded for remediation of the contaminated site at Hay River, Northwest Territories. The Corporation expects to remediate this site and settle this liability within the next 12 months.
A number of other vacant facilities may contain some environmental risk with associated remediation costs. The Corporation’s ongoing efforts to assess these sites may result in environmental liabilities related to the sites. A provision will be recorded when the Corporation considers that it is probable that it will remediate these contaminated sites and a reliable estimate can be determined for the amount of the obligations. As of April 30, 2016, no liability has been recognized in the financial statements for the remaining contaminated sites.
17. COMPARATIVE FIGURES
The Corporation has reclassified certain figures in the statement of cash flows. These reclassifications are to conform to the current presentation and better reflect the nature of the different movements in the inventories balance.
Year ended April 30, 2015 Presented As previously presented
Change
Reclassification on the statement of cash flowsAdd (deduct) items not affecting cash:
Write-down of inventory $ 828 $ - $ 828Net changes in non-cash working capital:(Increase) in inventories (3,673) (2,845) (828)
This reclassification had no net impact to cash provided by operating activities, and no impact to the statements of financial position or statement of comprehensive income.

56
CORPORATE GOVERNANCE
Freshwater’s Board of Directors is comprised of nine members, including the President and Chief Executive Officer. During the 2015/16 fiscal year, six Directors governed the Corporation, as three seats were vacant. All Board positions are federal Order-in-Council appointments with three appointed on recommendation of the participating provincial/territorial governments. Three Board members resigned, including Chairperson Russell Fast, Krista Boryskavich and Marielle Wharton. New appointments to the Board included Chairperson David Bevan and Directors John Wood and Dwight Williamson. John Wood was subsequently appointed by the Board to the position of Interim President.
While Directors are normally removed from Freshwater’s day-to-day decision-making, their role is vitally important. Freshwater’s management presents information, seeks advice and requests the approval of proposals and capital expenditures from the Board of Directors. Each Director is called upon to exercise judgement and an independent position in formulating the Board’s decisions to approve, reject or request deferral of the proposals brought forward by management.
Board members exercise their role as liaisons with all levels of government and fisher association stakeholders by attending both private and public meetings, conferences and information sessions in the provinces and communities they represent.
Freshwater Board members met five times in Winnipeg during the fiscal year; in addition, five teleconferences were conducted. Each quarter, the Board undertook a comprehensive review of financial results and operational issues. During the July 2015 meeting, the Board received the annual audit report from the Office of the Auditor General of Canada (OAG) and approved the 2014/15 Annual Report.
The Board reviewed the first quarter of the 2015/16 fiscal year at its September 2015 meeting. In November 2015, after the second quarter review, Freshwater held its sixth Annual Public Meeting with approximately 100 stakeholders in attendance. In February and April 2016, the Board met to approve its five-year annual Corporate Plan and operating budget for submission to the Minister of Fisheries and Oceans.
Freshwater’s Audit and Risk Committee – comprised of Chairperson Trevor Sprague and Board Directors Vince Crate, Bert Buckley and Dwight Williamson – met four times during the 2015/16 fiscal year. Marielle Wharton, also a member of this Committee, was on approved leave from the Board through this fiscal year. This Committee oversees Freshwater’s financial reporting process on behalf of the Board and reports to the full Board at each meeting.
Freshwater’s Quarterly Report is issued in a detailed format in compliance with International Financial Reporting Standards (IFRS). Each report is posted on our website (www.freshwaterfish.com/content/pages/governance) in both official languages within 60 days of the end of the quarter.
Board members attended other major governance-related conferences or meetings, including the Fisheries Council of Canada’s Annual General Meeting.

57
BOARD OF DIRECTORSDavid BevanChairperson of the Board(appointed February 2016)Ottawa, OntarioOccupation: Retired Associate Deputy Minister, DFOServed on Board: 2 months
Bert BuckleyHay River, Northwest TerritoriesOccupation: FisherServed on Board: 17 years
Russell FastChairperson of the Board(served November 2014-December 2015)Steinbach, ManitobaOccupation: Financial entrepreneur/ credit union executiveServed on Board: 1 year
Vince CrateKoostatak, ManitobaOccupation: Band Councillor, Fisher River Cree Nation/FisherServed on Board: 2 years
John Wood(appointed Director February 2016)Interim President(appointed March 2016)Sarnia, OntarioOccupation: Consultant/former President and CEO of FreshwaterServed on Board: 8+ years
Dwight WilliamsonWinnipeg, ManitobaOccupation: Retired Assistant Deputy Minister, Manitoba Conservation and Water StewardshipServed on Board: 2 months
Donald SalkeldPresident and Chief Executive Officer(on leave since March 2016)Petersfield, ManitobaOccupation: Former entrepreneurServed on Board: 1 year
Marielle Wharton(on leave for fiscal year)Winnipeg Beach, ManitobaOccupation: Former co-owner/ Vice-President of Globe Moving and Storage Ltd.Served on Board: 1 year
Trevor Sprague, CPA, CAChairperson of the Audit and Risk CommitteeWinnipeg, ManitobaOccupation: Chartered Professional Accountant and Tax Partner, MNP, LLPServed on Board: 2 years
Krista Boryskavich(served July-December 2015)Winnipeg, ManitobaOccupation: LawyerServed on Board: 6 months
AUDIT AND RISK COMMITTEE
Trevor Sprague – Chairperson, Winnipeg, ManitobaVince Crate – Member, Koostatak, ManitobaBert Buckley – Member, Hay River, Northwest TerritoriesDwight Williamson – Member, Winnipeg, Manitoba
Photo Not Available

58
CORPORATE OFFICERS
John Wood (March 11, 2016 – current) Interim President Email: [email protected]
Donald Salkeld (on leave from March 8, 2016) President and Chief Executive Officer
Stan Lazar Chief Financial Officer Email: [email protected]
Wendy Matheson Vice-President, Human Resources and Government Services Email: [email protected]
EMPLOYEE RECOGNITION
Freshwater extends gratitude to the following employees who have dedicated their careers to ensuring a dependable supply of high quality freshwater fish products, excellent customer value and maximum returns to fishers.
35 years: Jim Whitehill; Dale Johnstone; Diane Cassells; Craig Prudhomme; Richard Weedmark; Lorraine Young; Denise Helbren; Damian D’Souza
25 years: Jim Therrien20 years: Diana Morgielewicz (21); Deborah Stevenson; Elizabeth Isbister; Sandra Peters; Sandra Bergquist;
Sandra Jensen; Shirley Marcoux; Cesar Romero; Robert Quesnel


1199 Plessis RoadWinnipeg, Manitoba, Canada R2C 3L4
p. 204.983.6600f. 204.983.6497
www.freshwaterfish.com