Embed Size (px)
Citation preview

Alberta Health Services Annual Report2016-17

2016-17 | Alberta Health Services Annual Report
2
TABLE OF CONTENTS Table of Contents .............................................................................................................................................................................. 2 Message from the Board Chair and the President & CEO .................................................................................................................. 3 Who We Are ...................................................................................................................................................................................... 4 Vision, Mission, Values and Foundational Strategies ......................................................................................................................... 5 Provincial Quick Facts ....................................................................................................................................................................... 6 Bed Numbers .................................................................................................................................................................................... 7 Governance ....................................................................................................................................................................................... 8 Organizational Structure .................................................................................................................................................................... 8 Advisory Councils .............................................................................................................................................................................. 9 AHS Map and Zone Overview.......................................................................................................................................................... 10
South Zone ................................................................................................................................................................................. 11 Calgary Zone .............................................................................................................................................................................. 13 Central Zone ............................................................................................................................................................................... 15 Edmonton Zone .......................................................................................................................................................................... 17 North Zone.................................................................................................................................................................................. 19
2016-17 Health Plan Results ........................................................................................................................................................... 21 Build a Culture of Patient-Centred Care to Improve Experience .................................................................................................. 21 Health Outcomes and Clinical Best Practice ............................................................................................................................... 26 Our People ................................................................................................................................................................................. 32 Financial Health and Operational Best Practice .......................................................................................................................... 33
PERFORMANCE RESULTS ........................................................................................................................................................... 35 Leading in Health ........................................................................................................................................................................ 36 Performance Measures ............................................................................................................................................................... 37 Monitoring Measures .................................................................................................................................................................. 40
FINANCIAL INFORMATION ............................................................................................................................................................ 42 Financial Statement Discussion and Analysis ............................................................................................................................. 43 Consolidated Financial Statements ............................................................................................................................................. 68 Compensation Analysis and Discussion .................................................................................................................................... 115
APPENDIX .................................................................................................................................................................................... 117 Public Interest Disclosure (Whistleblower Protection) Act .............................................................................................................. 118 Non-Hospital Surgical Facility Contracts under the Health Care Protection Act (Alberta) ............................................................... 119 AHS Funded Facilities ................................................................................................................................................................... 120
Facility Definitions ..................................................................................................................................................................... 120 Facility by Zone......................................................................................................................................................................... 121 Provincial Overview of Community-Based Capacity .................................................................................................................. 122 Number of Continuing Care Facilities by Provider ..................................................................................................................... 122
Zone Overview of Bed Numbers .................................................................................................................................................... 123 Summary of Bed Numbers by Zone .......................................................................................................................................... 123 Change in Bed Numbers by Zone from 2015-16 to 2016-17 ..................................................................................................... 140
For more information about our programs and services, please visit www.ahs.ca
or call HEALTHLink at 811
2016-17 | Alberta Health Services Annual Report
3
MESSAGE FROM THE BOARD CHAIR AND THE PRESIDENT & CEO We are pleased to present the Annual Report for Alberta Health Services (AHS) for the fiscal year ended March 31, 2017. This report summarizes AHS progress and accomplishments over the past 12 months as we continue our progress as a high-performing, learning healthcare organization. AHS was widely recognized for our prompt and effective response to the Fort McMurray wildfire in May 2016. AHS staff, physicians and volunteers safely evacuated more than 100 patients and clients from the Northern Lights Regional Health Centre in two hours, transported patients and clients to safety, ensured continuity of care for patients with chronic conditions and serious illnesses, supported evacuees throughout Alberta, and restored most hospital services just one month after the biggest evacuation in Alberta history. AHS focused on its community engagement work in 2016-17. Our Health Advisory Councils around the province were revitalized and grew to nearly 190 members after a robust recruitment effort. Meetings with community leaders occurred across the province addressing area-specific concerns in communities such as Fort McMurray, Red Deer, Beaver Lodge, Slave Lake, Sylvan Lake and Sundre. During 2016-17, we continued to work with our partners to address the opioid crisis. We opened new and upgraded facilities and units, and continued to drive research, innovation implement programs that are improving patient outcomes and experiences. You can learn more about these highlights, and more, in this report. The 2016-17 AHS Annual Report was prepared in accordance with the Fiscal Management Act, Regional Health Authorities Act and instructions as provided by Alberta Health. All material economic and fiscal implications known as of June 1, 2017 have been considered in preparing the Report. Respectfully submitted on behalf of Alberta Health Services.
[Original Signed By] [Original Signed By]
Linda Hughes Chair, Alberta Health Services Board
Dr. Verna Yiu President and CEO, Alberta Health Services

2016-17 | Alberta Health Services Annual Report
4
WHO WE ARE AHS is Canada’s first and largest provincewide, fully integrated health system, responsible for delivering health services to more than 4.2 million people living in Alberta, as well as to some residents of Saskatchewan, British Columbia and the Northwest Territories. Being a provincewide integrated healthcare system allows us to share information, work seamlessly and provide standardized care to Albertans. AHS cares for a growing and aging population with diverse needs. Alberta is one of the fastest-growing provinces in Canada. Alberta’s population growth remains ahead of the national average. Alberta has urban, rural and remote populations. Certain geographical areas within our province are home to different population structures and unique health needs requiring tailored approaches to healthcare delivery.
AHS has more than 109,000 employees, including over 101,000 direct AHS employees (excluding Covenant Health staff). Over 8,300 staff work in AHS’ wholly-owned subsidiaries, such as Carewest, CapitalCare Group and Calgary Laboratory Services. We have 13,900 volunteers who have contributed over one million volunteer hours this past year. We are also supported by more than 10,000 physicians, more than 8,100 of whom are members of the AHS medical staff (physicians, dentists, podiatrists, oral and maxillofacial surgeons). Students from Alberta’s universities and colleges, as well as from educational institutions outside of Alberta, receive clinical education in AHS facilities and community locations. AHS programs and services are offered at more than 650 facilities throughout the province, including hospitals, clinics, continuing care facilities, cancer centres, mental health facilities and community health sites. We also have community-based services designed to help Albertans maintain and/or improve their health status. All facilities and programs are operated in compliance with specific sections of program legislation.

2016-17 | Alberta Health Services Annual Report
5
VISION, MISSION, VALUES AND FOUNDATIONAL STRATEGIES AHS refreshed its vision, mission and values and rolled out four foundational strategies that help us reach our goals. Our vision tells us where we need to go and where we want to be. Our mission is our reason for being; it defines our purpose, who we serve and how we serve them. Our five values are at the heart of everything that we do; they inspire, empower and guide how we work together with patients, clients, families and each other.
Vision: Healthy Albertans. Healthy Communities. Together. Mission: To provide a patient-focused, quality health system that is accessible and sustainable for all Albertans. Values: Compassion, Accountability, Respect, Excellence, and Safety (CARES)
AHS has developed four foundational strategies that guide our efforts to sustain safe, high-quality healthcare delivery for the benefit of all Albertans.
Patient First Strategy puts patients and families at the centre of all healthcare activities, decisions and teams.
Our People Strategy creates a culture in which AHS staff, physicians, and volunteers feel safe, healthy and valued.
Clinical Health Research, Innovation and Analytics Strategy drives research and innovation to improve patient outcomes and health system performance.
Information Management/Information Technology Strategy puts information at the fingertips of patients, clinicians and researchers in an effort to inform and to improve decision-making.
Volunteers – Our Most Valuable Resource
Volunteers are a central part of building environments that support patient- and family-centred care.
Over the course of a year, more than 13,900 volunteers dedicated over one million hours of their time to help keep Albertans safe and healthy.
In honour of the important roles our volunteers play, this year, members of the AHS Executive and Senior
Leadership Teams shadowed a volunteer and learned the ropes of various volunteer roles.
Among their many contributions, volunteers manage patient visits, give input to improve the quality and safety of healthcare, play wayfinding roles and tend our retail shops to raise funds.

2016-17 | Alberta Health Services Annual Report
6
PROVINCIAL QUICK FACTS The numbers below provide a snapshot of AHS’ activity and demonstrate the change in services provided in the last few years.
Alberta Health Services 2013-14 2014-15 2015-16 2016-17 % Change 2015-16 to 2016-17
Primary Care / Population Health
Ambulatory Care Visits 5,909,207 6,238,749 6,421,309 n/a 2.9%
Number of Unique Home Care Clients 112,062 114,990 116,462 118,834 2.0%
Number of People Placed in Continuing Care 7,694 7,810 7,879 8,002 1.6%
Health Link Calls 778,353 813,471 755,334 744,278 -1.5%
Poison & Drug Information Service (PADIS) Calls 34,174 35,080 36,375 39,467 8.5%
Seasonal Influenza Immunizations 1,157,550 1,254,950 1,146,569 1,171,728 2.2%
EMS Events 461,813 503,769 517,640 512,167 -1.1%
Food Safety Inspections 95,389 92,723 92,857 82,482 -11.2%*
Acute Care
Emergency Department Visits (all sites) 2,142,633 2,181,369 2,134,945 2,079,280 -2.6%
Urgent Care Visits 205,354 195,312 189,775 187,798 -1.0%
Hospital Discharges 393,764 401,331 404,514 403,908 -0.1%
Births 52,323 54,203 55,283 53,650 -3.0%
Total Hospital Days 2,670,814 2,808,990 2,812,244 2,837,673 0.9%
Average Length of Stay (in days) 6.8 7.0 7.0 7.0 0.0% Diagnostic / Specific Procedures
Total Hip Replacements (scheduled and emergency) 5,243 5,397 5,564 6,003 7.9%
Total Knee Replacements (scheduled and emergency) 6,224 6,377 6,645 6,690 0.7%
Cataract Surgery 36,785 36,583 36,807 37,904 3.0%
Main Operating Room Activity 272,708 275,925 281,401 287,991 2.3%
MRI Exams 190,024 199,928 195,419 192,375 -1.6%
CT Exams 365,181 387,116 391,600 405,332 3.5%
X-rays 1,848,122 1,868,044 1,874,879 1,843,076 -1.7%
Lab Tests 70,911,298 73,994,032 75,512,771 76,282,777 1.0%
Cancer Care Cancer Patient Visits (patients may have multiple visits) 560,340 578,005 616,237 641,856 4.2%
Unique Cancer Patients 51,105 52,288 55,020 57,549 4.6%
Addiction & Mental Health Mental Health Hospital Discharges (acute care sites) 21,008 21,429 22,810 24,307 6.6% Community Treatment Orders (CTOs) Issued 361 443 452 444 -1.8% Addiction Residential Treatment & Detoxification Admissions 9,978 11,180 11,976 11,726 -2.1%
n/a = data not available at time of report * Food inspections in all zones decreased in 2016-17 to support emergency response and recovery for the Fort McMurray wildfire which required reprioritization of service delivery.

2016-17 | Alberta Health Services Annual Report
7
BED NUMBERS AHS is committed to providing more community-based options for Albertans, including long-term care, supportive living, palliative care and home care. A key objective in healthcare is to shift services from acute care hospital and facility living to the community – bringing care closer to home for patients. In 2016-17, AHS opened 376 continuing care beds for a total of 25,323 community-based spaces. Since April 2010, AHS has opened 5,623 community-based beds/spaces.
Number of Beds/Spaces March 31, 2016 March 31, 2017 Difference % Change
Acute & Sub-Acute Care
Acute Care 8,479 8,430 -49 -0.6%
Sub-acute in Auxiliary Hospital 490 510 20 4.1%
TOTAL ACUTE AND SUB-ACUTE CARE 8,969 8,940 -29 0%
Continuing Care
Auxiliary Hospital (includes 50 restorative beds) 5,610 5,606 -4 -0.1%
Nursing Home 9,158 9,139 -19 -0.2%
Long-Term Care (LTC) Subtotal 14,768 14,745 -23 -0.2%
Supportive Living Level 4 – Dementia 2,659 2,904 245 9.2%
Supportive Living Level 4 (includes 5 restorative beds) 5,739 5,914 175 3.0%
Supportive Living Level 3 1,538 1,517 -21 -1.4%
Supportive Living (SL) Subtotal 9,936 10,335 399 4.0% LONG-TERM CARE & SUPPORTIVE LIVING SUBTOTAL 24,704 25,080 376 1.5%
Community Palliative and Hospice (out of hospital) 243 243 0 0.0%
TOTAL CONTINUING CARE (LTC, SL and palliative) 24,947 25,323 376 1.5%
Addiction & Mental Health
Psychiatric (standalone facilities) 955 955 0 0.0%
Addiction Treatment 955 968 13 1.4%
Community Mental Health 625 736 111 17.8%
TOTAL ADDICTION & MENTAL HEALTH 2,535 2,659 124 4.9%
ALBERTA TOTAL 36,451 36,922 471 1.3% Refer to appendix for more information on beds.

2016-17 | Alberta Health Services Annual Report
8
GOVERNANCE The eight-member AHS Board is responsible for the governance of AHS, working in partnership with Alberta Health to ensure all Albertans have access to high-quality health services across the province. The Board is accountable to the Minister of Health. The AHS Board has established the following committees to assist in governing AHS and overseeing the management of AHS’ business and affairs: Audit & Risk Committee, Community Engagement Committee (established April 2016), Finance Committee, Governance Committee, Human Resources Committee, and Quality & Safety Committee. The Board Chair is a member of each committee, and the President and Chief Executive Officer is a non-voting ex-officio member of each committee. The purpose and scope of each committee is in accordance with good governance practices and is consistent with the governing legislation of AHS. ORGANIZATIONAL STRUCTURE Dr. Verna Yiu is President and Chief Executive Officer (CEO) of AHS. Dr. Yiu leads a staff of over 109,000 caring and dedicated individuals who make up the AHS workforce. In this role, she is leading health services through transformational change, shaping the future for AHS to allow achievement of our strategic directions. With leaders and staff in the organization, AHS will build a culture that exemplifies our values, takes a provincial perspective on issues and ensures good ideas developed in one part of the province are shared across the province. The AHS organizational structure is arranged under the AHS Executive Leadership Team reporting directly to the President and CEO.
ZONES
Minister of Health
Alberta Health Service Board
President & CEO Alberta Health Services
Chief Audit Executive Internal Audit & Enterprise Risk Management
Chief Ethics & Compliance Officer
Vice PresidentQuality& Chief Medical Officer
Vice President
Collaborative Practice,Nursing &
Health Professions
Vice President Clinical Support Services
Vice President Research, Innovation & Analytics
Vice President Corporate Services &
Chief Financial Officer
Vice President Community
Engagement & Communications
Vice President &
Medical Director Northern Alberta
Vice President & Medical Director
Central & Southern Alberta
VicePresident& Chief Health
Operations Officer
Northern Alberta
VicePresident& Chief Health
Operations Officer
Central & Southern Alberta
As of March 2017
* Denotes Clinical Leader Dyad / Partner Relationship
Advisory Councils
Vice President People, Legal & Privacy
South Zone*
Edmonton Zone*
Wisdom Council
North Zone*
Calgary Zone*
Central Zone*
AHS Board Members
Linda Hughes – Board Chair Dr. Brenda Hemmelgarn – Vice Chair
Heather Hirsch Hugh D. Sommerville
David Carpenter Marliss Taylor Glenda Yeates Richard Dicerni

2016-17 | Alberta Health Services Annual Report
9
ADVISORY COUNCILS Advisory councils help bring the voice of Alberta’s communities to healthcare services. Community input allows us to better address the health needs of Albertans and brings decision-making to the local level. AHS is committed to engaging the public in a respectful, open and accountable manner to support our strategic directions. AHS has established the following councils to support ongoing collaboration and engagement. In 2016-17, more than 80 new volunteer members were added to the councils, with a total of over 190 members on these councils. Health Advisory Councils (HACs) engage members of the public in communities throughout Alberta and provide advice and feedback from a local perspective on what is working well in the healthcare system and where there are areas in need of improvement. Each of the 12 HACs was established in 2009-10 and represents a different geographical area within the province. The HACs report to the AHS Board Chair.
1. True North – La Crete, High LeveI & Area 2. Peace – Peace River, Grande Prairie & Area 3. Lesser Slave Lake – Slave Lake, High Prairie & Area 4. Wood Buffalo – Fort McMurray & Area 5. Lakeland Communities – Lac LaBiche, Redwater,
Cold Lake & Area 6. Tamarack – Hinton, Edson, Whitecourt & Area
7. Oldman River – Lethbridge & Area 8. Greater Edmonton – Edmonton & Area 9. Yellowhead East – Camrose, Lloydminster &
Area 10. David Thompson – Red Deer & Area 11. Prairie Mountain – Calgary & Area 12. Palliser Triangle – Medicine Hat & Area
Wisdom Council provides guidance and recommendations to ensure AHS develops and implements culturally appropriate and innovative health service delivery for Indigenous Peoples. It is comprised of Indigenous People who provide their time on the council. Their backgrounds are wide-ranging, including traditional knowledge-holders (ceremonial leaders), contemporary trained physicians, nursing professionals and health consultants, all equally important when discussing challenges to inform AHS on Indigenous health and well-being. Provincial Advisory Council on Addiction and Mental Health advises AHS on programs and services for provincewide addiction and mental health treatment. Its members provide evidence-based suggestions that improve quality of services and patient satisfaction through effective service planning. Provincial Advisory Council on Cancer advises AHS on programs and service for provincewide cancer care. Its members provide evidence-based suggestions on prevention and screening, diagnosis, treatment and care, and research. Alberta Clinician Council is an organization-wide forum comprised of front-line clinicians from a variety of disciplines and zones. Applying their collective knowledge, experience and expertise, the council advises senior leadership on issues and opportunities to improve quality, access and patient safety across Alberta. Patient and Family Advisory Group continues to be an important avenue for bringing patient and family voices into AHS. The group partners with senior leaders to review policy and strategies and share insights from patients’ perspectives for the planning and delivery of healthcare services. In 2016-17, this group consulted and advised on a number of organizational priorities such as the AHS vision, medical assistance in dying, family presence and visitation, and the clinical information system. For more information, refer to the Patient and Family Advisory Group Annual Report. Patient Engagement Reference Group brings together Strategic Clinical Network™ (SCN) patient and family advisors and Patient and Community Engagement Researchers (PaCERs). Members ensure patients’ voices are heard and incorporated in the SCNs by sitting on committees and contributing to projects with leadership, researchers, healthcare providers and decision-makers. The group meets quarterly to provide an opportunity for consultation with a larger group of advisors and PaCERs. Meetings also consist of updates, networking opportunities, specific advisor learning and promoting partnerships between advisors and SCN leaders. The creation of a Provincial Advisory Council for Seniors and Continuing Care was approved by AHS Executive Leadership Team in August 2016. The Terms of Reference and Bylaws have been developed and are pending approval.

2016-17 | Alberta Health Services Annual Report
10
AHS MAP AND ZONE OVERVIEW AHS is organized into five geographic zones – South, Calgary, Central, Edmonton and North. Our zones are invaluable in terms of providing decision-making at a local level, and listening to and responding to local communities, local staff members, and our patients and clients. Provincewide services, such as emergency medical services; population, public and Indigenous health; diagnostic imaging; quality and safety; and so on, work in co-operation with the zones to deliver care. The next section includes an overview, highlights and Quick Facts about each zone.

2016-17 | Alberta Health Services Annual Report
11
South Zone Population Statistics (2016) Overall Population: 303,663 Aging Population (over 65 years): 45,546 Life Expectancy: 79.8 years Median Age: 36.4 years (2015) Facts at your Fingertips 29% are obese 14% smoke daily 51% are active or moderately active 39% eat 5 or more servings of fruit/vegetables daily 17% are heavy drinkers (≥ 5 drinks on one occasion, at least once a month) Source: Canadian Community Health Survey 2014
South Zone Highlights
Lethbridge and its surrounding area have increased access to outpatient services, specialized care and emergency services thanks to the redevelopment of Chinook Regional Hospital. The redevelopment added a new five-story wing to the hospital and includes expansions and renovations to several departments, including emergency department, day surgery and neonatal intensive care. The new wing also includes a Ceremonial Room for use by people of various faiths. The first phase of the expansion and renovation of the Medicine Hat Regional Hospital is complete. The project includes a six-story wing with added space for surgical services, ambulatory (outpatient) care, cardio-respiratory services, a renal program, a cancer clinic, sterile processing, and maternal newborn services. In addition, the building features a rooftop heliport, diagnostic imaging, an expanded day procedures department, and physiotherapy and occupational therapy. The next phase of the project started in spring 2017 and will include a major expansion of the emergency department. Individuals in Medicine Hat who experience mental health, addiction or psychosocial crises and are at risk will now be identified for treatment by a Police and Crisis Team (PACT). PACT, a partnership between AHS and the Medicine Hat Police Service, pairs a mental health clinician and a police officer who attend emergency calls to assist individuals in crisis and diverts individuals toward the most appropriate community services and resources to stabilize them. AHS ID Program was expanded to Medicine Hat for homeless and at-risk patients to store their newly obtained identification and/or healthcare card until they have the ability to secure these documents independently. Based on their consent, client information can be shared with healthcare providers to initiate referrals to followup programs and services. The program currently runs in Edmonton, Lethbridge and Calgary, where it launched in 2013. Since then, more than 2,470 homeless, at-risk and recently-housed patients have acquired identification through the program. Patients and families at Chinook and Medicine Hat Regional Hospitals can refer to patient-friendly placemats located at their bedside tables for concise and basic information on what to expect while in hospital and the services and amenities available. It also serves as a tool for staff when providing face-to-face orientation to the patients. This initiative is in support of providing patient- and family-centred care by bringing the patient and family into the conversation about their care. After much work with the Town of Cardston, the Kainai First Nation, local physicians and pharmacists, South Zone opened an Opioid Dependency Treatment Clinic in the Cardston Health Centre in May 2016. The Cardston Clinic’s voluntary Recovery and Wellness Program is open to all people with opioid addictions in southwest Alberta. In the first year, the clinic saw approximately 120 patients, and more are added each week. The clinic is open five days a week. Physician services are provided three days a week via Telehealth by the Metro City Medical Clinic located in Edmonton. Other staffing includes a registered nurse, an addiction counsellor, and administrative support.
Land Mass: 65,500 km2

2016-17 | Alberta Health Services Annual Report
12
SOUTH ZONE QUICK FACTS 2013-14 2014-15 2015-16 2016-17 % Change
2015-16 to 2016-17
Primary Care / Population Health
Ambulatory Visits 358,836 365,293 376,743 n/a 3.1%
Number of Unique Home Care Clients 11,577 12,044 12,060 12,381 2.7%
Number of People Placed in Continuing Care 868 866 887 930 4.8%
Health Link Calls 32,186 32,108 34,773 34,061 -2.0%
Seasonal Influenza Immunizations 89,634 96,663 88,172 90,273 2.4%
Food Safety Inspections 8,402 8,609 7,866 7,707 -2.0%
Acute Care
Emergency Department Visits (all sites) 196,576 194,352 194,257 192,083 -1.1%
Hospital Discharges 31,093 31,125 30,485 30,521 0.1%
Births 3,973 4,156 4,217 3,940 -6.6%
Total Hospital Days 199,672 212,020 219,218 228,311 4.1%
Average Length of Stay (in days) 6.4 6.8 7.2 7.5 4.2%
Diagnostic / Specific Procedures
Total Hip Replacements (scheduled and emergency) 526 571 578 591 2.2%
Total Knee Replacements (scheduled and emergency) 804 822 838 784 -6.4%
Cataract Surgery 2,653 2,878 2,847 2,955 3.8%
Main Operating Room Activity 23,049 23,501 23,209 23,352 0.6%
MRI Exams 13,380 14,227 14,288 13,809 -3.4%
CT Exams 24,906 26,185 26,964 28,926 7.3%
X-rays 156,503 163,095 166,251 165,091 -0.7%
Lab Tests 4,843,124 5,085,305 5,263,114 5,195,905 -1.3%
Cancer Care
Cancer Patient Visits (patients may have multiple visits) 31,529 30,277 32,144 34,055 5.9%
Unique Cancer Patients 4,522 4,349 4,273 4,379 2.5%
Addiction & Mental Health
Mental Health Hospital Discharges (acute care sites) 2,019 2,026 2,058 2,169 5.4%
Staffing
Head Count 6,947 7,238 7,280 7,431 2.1%
Volunteers* 2,130 1,933 1,746 1,632 -6.5%
AHS Physicians n/a 704 569 578 1.6% *Decrease in volunteers is attributed to removing duplications and inactive volunteers in the database.

2016-17 | Alberta Health Services Annual Report
13
Calgary Zone Population Statistics (2016) Overall Population: 1,622,391 Aging Population (over 65 years): 180,327 Life Expectancy: 83.3 years Median Age: 36.5 years (2015) Facts at your Fingertips 20% are obese 12% smoke daily 61% are active or moderately active 44% eat 5 or more servings of fruit/vegetables daily 20% are heavy drinkers (≥ 5 drinks on one occasion, at least once a month) Source: Canadian Community Health Survey 2014
Calgary Zone Highlights
Cancer patients have access to a larger space and new treatment areas with the opening of the newly renovated and expanded High River Community Cancer Clinic. With the exception of radiation, a full treatment plan is followed (chemotherapy, symptom management, transfusions, monitoring blood levels, followup visits and intravenous fluids). The cancer clinic, part of the original pilot for rural Alberta, considers the expansion a step forward in the patient-friendly philosophy. A new AHS Improvement Way (AIW) project is helping clinicians discuss and document Advance Care Planning and Goals of Care Designations (ACP/GCD) with their patients. The project began in September in four clinical areas (Bowmont Medical Clinic, Foothills Medical Centre’s Unit 81 and Heart Function Outpatient Clinic, and Calgary Zone’s Heart Failure Home Care team). ACP empowers clinicians to help patients document their wishes for healthcare in the event that they become incapable to consent. The GCD is a medical order used to describe and communicate the focus of care, including the preferred location of care. Printed resources and training are available to ensure the care team is prepared to discuss ACP/GCD with their patients, and to improve the quality of these conversations. Oilfields General Hospital in Black Diamond is piloting a Telehealth project that allows patients to stay in their rural communities while receiving videoconference care from specialists in Calgary. With this system, the patient has the entire care team engaged in the appointment. It also reduces stress, saves time and eliminates tying up patient transport that may be better used for a more critical situation. A home-based primary care project was developed in conjunction with the West Central Primary Care Network (PCN) to include support for clients of home care – allowing them to remain in their homes and receive appropriate care as required. This is a partnership that includes physicians, case managers, and specialized professional staff who work together to determine the needs of specific clients of the PCN and care for them in their homes. Work continues in partnership with current operations to assist with creating a community-based unit to quickly move alternate level of care (ALC) patients from acute care to community beds in advance of their placement to allow for more time to achieve optimal functioning. This initiative will expand in the coming year to include non-ALC patients who may require more time before being assessed for an alternative level of care. Alberta Children’s Hospital’s neonatal intensive care unit (NICU) went live with e-critical implementation in December 2016. Staff were trained and the new system has been integrated well into practice. The NICU will be able to use the data generated by the e-critical system to make improvements in care for patients and families, and to benchmark across sites and zones to inform improved use of resources.
Land Mass: 39,300 km2

2016-17 | Alberta Health Services Annual Report
14
CALGARY ZONE QUICK FACTS 2013-14 2014-15 2015-16 2016-17 % Change
2015-16 to 2016-17
Primary Care / Population Health
Ambulatory Visits 2,298,894 2,573,583 2,646,960 n/a 2.9%
Number of Unique Home Care Clients 32,648 33,548 34,690 35,892 3.5%
Number of People Placed in Continuing Care 2,164 2,548 2,722 2,450 -10.0%
Health Link Calls 325,215 325,566 318,422 310,333 -2.5%
Seasonal Influenza Immunizations 461,442 511,151 467,942 491,931 5.1%
Food Safety Inspections 31,805 31,121 30,496 27,093 -11.2%
Acute Care
Emergency Department Visits (all sites) 485,803 493,861 487,862 475,415 -2.6%
Urgent Care Visits 181,377 183,230 179,832 176,131 -2.1%
Hospital Discharges 136,598 140,563 143,063 143,633 0.4%
Births 18,865 19,554 19,720 19,395 -1.6%
Total Hospital Days 959,949 1,025,776 1,030,612 1,024,250 -0.6%
Average Length of Stay (in days) 7.0 7.3 7.2 7.1 1.4%
Diagnostic / Specific Procedures
Total Hip Replacements (scheduled and emergency) 1,897 1,960 2,099 2,184 4.0%
Total Knee Replacements (scheduled and emergency) 2,185 2,388 2,511 2,490 -0.8%
Cataract Surgery 13,799 13,378 13,578 13,489 -0.7%
Main Operating Room Activity 94,403 97,177 99,697 101,659 2.0%
MRI Exams 75,273 78,175 76,850 77,116 0.3%
CT Exams 134,515 143,496 142,863 145,678 2.0%
X-rays 539,337 541,087 546,546 537,800 -1.6%
Lab Tests 26,521,983 28,407,412 28,800,108 29,212,267 1.4%
Cancer Care
Cancer Patient Visits (patients may have multiple visits) 176,552 180,811 200,599 213,828 6.6%
Unique Cancer Patients 20,926 21,717 22,934 23,792 3.7%
Addiction & Mental Health
Mental Health Hospital Discharges (acute care sites) 7,798 8,150 9,067 9,513 4.9%
Staffing
Head Count 35,909 37,000 37,023 36,887 -0.4%
Volunteers* 4,165 4,623 5,100 4,206 -17.5%
AHS Physicians n/a 3,076 3,326 3,439 3.4% *Decrease in volunteers is attributed to removing duplications and inactive volunteers in the database.

2016-17 | Alberta Health Services Annual Report
15
Central Zone Population Statistics (2016) Overall Population: 478,050 Aging Population (over 65 years): 69,778 Life Expectancy: 80.7 years Median Age: 37.3 years (2015)
Facts at your Fingertips 27% are obese 18% smoke daily 57% are active or moderately active 39% eat 5 or more servings of fruit/vegetables daily 19% are heavy drinkers (≥ 5 drinks on one occasion, at least once a month) Source: Canadian Community Health Survey 2014
Central Zone Highlights
Terminally ill residents located in Sundre and surrounding rural communities are provided support enabling them to die at home. A new, one-of-a kind palliative program was created in partnership with AHS that helps patients remain in their homes by maximizing local resources, as well as using a multidisciplinary team approach. Local physicians and nurses provide 24/7 access (via phone or house visits) to manage crises. Local pharmacists provide access to medications needed by patients in expedited fashion, including after-hours and weekends. An interdisciplinary team works together to provide care and assistance/advice, allowing patients to have the journey that they desire at the end of their days. To help transition the care of patients between nursing shifts, the postpartum unit at Red Deer Regional Hospital Centre (RDRHC) introduced the Patient Handover At Bedside (PHAB) initiative. PHAB helps staff transition the care of patients between nursing shifts while ensuring patients are included in the process. Staff and physicians at RDRHC worked diligently to accommodate patients who were scheduled for surgical procedures after a flood forced shutdown of five out of the nine operating rooms. Dedicated staff and physicians offered longer operating room hours at RDRHC and were able to leverage resources at other hospitals in Olds, Innisfail and Stettler during flood remediation. All patients were accommodated in a timely manner through effective use of existing resources and good crisis management practices. Residents of Lloydminster received enhanced Emergency Medical Services (EMS) through the introduction of an advanced life support (ALS) service, ensuring a broader range of cardiac interventions, breathing supports, and medicines are available in emergency situations. ALS allows EMS to perform lifesaving protocols and skills performed by paramedics and other medical professionals. Previously, EMS was only able to perform basic life support in Lloydminster. Didsbury and Viking and surrounding areas receive increased access to EMS through new hospital helipads at each location. Local ambulance services are now connected directly to STARS air ambulance services. The new heliports are able to accommodate the new, larger STARS helicopters ensuring emergency transport of local residents. Cardiac patients awaiting treatment or diagnosis can expect shorter wait times thanks to the new central referral system at Foothills Medical Centre developed jointly between South, Central and Calgary Zones. This new system has helped decrease wait times and ensures urgent cases are prioritized. With the new system, all referrals go to a single location and are triaged by a nurse. For patients, it means improved access to care, and for clinicians, it streamlines the referral process. The project also included implementation of a new information technology system that provides better tracking of each referral and measuring key points in the patient journey.
Land Mass: 95,000 km2
Land Mass: 95,000 km2

2016-17 | Alberta Health Services Annual Report
16
CENTRAL ZONE QUICK FACTS 2013-14 2014-15 2015-16 2016-17 % Change
2015-16 to 2016-17
Primary Care / Population Health
Ambulatory Visits 450,619 471,522 479,723 n/a 1.7%
Number Of Unique Home Care Clients 17,483 18,245 18,370 18,770 2.2%
Number of People Placed in Continuing Care 1,189 1,259 1,060 1,365 28.8%
Health Link Calls 57,847 62,035 68,388 61,431 -10.2%
Seasonal Influenza Immunizations 109,014 115,539 105,872 106,934 1.0%
Food Safety Inspections 10,626 11,234 11,390 9.944 -12.7%
Acute Care
Emergency Department Visits (all sites) 372,122 380,367 360,966 344,643 -4.5%
Hospital Discharges 44,589 45,691 45,577 45,242 -0.7%
Births 4,812 4,926 5,037 4,765 -5.4%
Total Hospital Days 322,478 330,752 323,983 338,113 4.4%
Average Length of Stay (in days) 7.2 7.2 7.1 7.5 5.6%
Diagnostic / Specific Procedures
Total Hip Replacements (scheduled and emergency) 574 569 585 632 8.0%
Total Knee Replacements (scheduled and emergency) 669 654 616 678 10.1%
Cataract Surgery 3,495 3,722 3,782 3,711 -1.9%
Main Operating Room Activity 27,847 29,330 29,999 30,930 3.1%
MRI Exams 13,137 12,610 12,406 11,034 -11.1%
CT Exams 33,708 36,143 37,485 38,679 3.2%
X-rays 259,979 256,595 255,147 251,374 -1.5%
Lab Tests 6,088,885 6,187,163 6,374,514 6,426,497 0.8%
Cancer Care
Cancer Patient Visits (patients may have multiple visits) 18,686 27,298 32,098 33,366 4.0%
Unique Cancer Patients 2,172 2,461 2,762 2,970 7.5%
Addiction & Mental Health
Mental Health Hospital Discharges (acute care sites) 2,169 2,281 2,514 2,636 4.9%
Staffing
Head Count 12,361 12,631 12,772 12,813 0.3%
Volunteers* 3,297 3,292 3,409 2,852 -16.3%
AHS Physicians n/a 707 710 725 2.1%
*Decrease in volunteers is attributed to removing duplications and inactive volunteers in the database.

2016-17 | Alberta Health Services Annual Report
17
Edmonton Zone Population Statistics (2016) Overall Population: 1,363,653 Aging Population (over 65 years): 164,827 Life Expectancy: 82.1 years Median Age: 36.2 years (2015)
Facts at your Fingertips 21% are obese 15% smoke daily 55% are active or moderately active 35% eat 5 or more servings of fruit/vegetables daily 18% are heavy drinkers (≥ 5 drinks on one occasion, at least once a month) Source: Canadian Community Health Survey 2014
Edmonton Zone Highlights
Stollery Children’s Hospital celebrated the opening of its redeveloped operating room suite. The redeveloped space features five operating rooms and two procedure rooms along with modern infrastructure and equipment. Roughly 10,000 surgeries are performed in the Stollery operating room suite each year. This redesigned operating suite will enable our health providers to deliver quality, patient- and family-centred care that will ease anxieties and improve both patient outcomes and patient experiences. Canada’s first nurse practitioner-led outpatient trauma clinic, which supports trauma patients from emergency and hospital bedside to post-discharge followups opened at the University of Alberta Hospital’s Kaye Edmonton Clinic. This clinic focuses on seamless transitions in care, which is especially important for populations vulnerable to poor health outcomes, including those who live with domestic abuse, drug or alcohol abuse, mental health issues and post-traumatic stress disorder, many of whom do not have a family physician. Teams work together with emergency medical services (EMS) to deliver care in the community for specific patient populations with a goal of decreasing EMS usage and subsequent emergency department presentations:
• Edmonton Continuing Care Urgent Response team provides community-based medical interventions typically received in the emergency department such as lab analysis, diagnostic imaging, suturing, casting, intravenous antibiotic treatment of infections, wound management and other diagnostic and treatment pathways. The focus of the team is to stabilize onsite, develop a treatment plan with nursing staff, reconnect the patient with their physician, and provide followup when required. The program operates 17 hours per day with a team of community paramedics and nurse practitioners.
• Crisis Response EMS (CREMS) team works with mental health therapists to respond to clients in mental health crisis and has the ability to use primary care and existing community supports, addiction and mental health clinics and inpatient beds to best meet a client’s immediate needs.
• City Centre Paramedic Response Unit (CC-PRU) responds to calls in the core of Edmonton with a focus on events that involve inner-city support sites and their clients. CC-PRU’s goal is to foster strengthened relationships with these sites and to build trust with inner-city clients by improving access to primary care and other community supports as alternatives to EDs and EMS.
Northern Alberta Renal Program (NARP) serves northern and central Alberta, northwestern Saskatchewan, northeastern British Columbia and the Northwest Territories. A multidisciplinary approach to care is utilized for patients with end-stage renal disease. NARP has expanded its efforts in providing patients with education and opportunities to choose treatment modalities. Recent initiatives include the introduction of a modality nurse who meets with all new patients, and patient/family educational events such as the ‘Home Sweet Home’ educational day.
Land Mass: 11,800 km2

2016-17 | Alberta Health Services Annual Report
18
EDMONTON ZONE QUICK FACTS 2013-14 2014-15 2015-16 2016-17 % Change
2015-16 to 2016-17
Primary Care / Population Health
Ambulatory Visits 2,383,476 2,410,006 2,490,807 n/a 3.4%
Number of Unique Home Care Clients 38,011 38,183 37,554 38,013 1.2%
Number of People Placed in Continuing Care 2,742 2,443 2,506 2,582 3.0%
Health Link Calls 296,362 325,440 269,205 278,755 3.5%
Seasonal Influenza Immunizations 387,959 417,388 384,723 389,918 1.4%
Food Safety Inspections 29,678 26,170 27,788 23,188 -16.6%
Acute Care
Emergency Department Visits (all sites) 502,838 535,146 541,451 545,146 0.7%
Urgent Care Visits 23,977 12,082 9,943 11,667 17.3%
Hospital Discharges 135,969 139,052 141,279 142,582 0.9%
Births 18,374 19,258 19,751 19,849 0.5%
Total Hospital Days 940,956 984,395 975,054 995,660 2.1%
Average Length of Stay (in days) 6.9 7.1 6.9 7.0 1.4%
Diagnostic / Specific Procedures
Total Hip Replacements (scheduled and emergency) 1,936 1,957 1,987 2,269 14.2%
Total Knee Replacements (scheduled and emergency) 2,156 2,068 2,166 2,191 1.2%
Cataract Surgery 14,525 14,411 14,458 15,751 8.9%
Main Operating Room Activity 104,219 102,467 102,463 106,999 4.4%
MRI Exams 75,665 81,945 78,254 77,523 -0.9%
CT Exams 139,743 147,226 149,237 157,225 5.4%
X-rays 597,028 609,179 613,135 603,962 -1.5%
Lab Tests 26,734,776 27,278,431 27,781,396 28,233,276 1.6%
Cancer Care
Cancer Patient Visits (patients may have multiple visits) 319,104 325,538 337,234 344,170 2.1%
Unique Cancer Patients 23,507 23,868 25,074 26,442 5.5%
Addiction & Mental Health
Mental Health Hospital Discharges (acute care sites) 6,061 5,978 6,188 6,929 12.0%
Staffing
Head Count 31,497 32,657 32,921 33,473 1.7%
Volunteers* 2,522 2,680 2,903 2,771 -4.5%
AHS Physicians n/a 2,659 2,714 2,824 4.1% *Decrease in volunteers is attributed to removing duplications and inactive volunteers in the database.

2016-17 | Alberta Health Services Annual Report
19
North Zone Population Statistics (2016) Overall Population: 484,964 Aging Population (over 65 years): 46,322 Life Expectancy: 79.9 years Median Age: 33.9 years (2015)
Facts at your Fingertips 31% are obese 21% smoke daily 54% are active or moderately active 31% eat 5 or more servings of fruit/vegetables daily 21% are heavy drinkers (≥ 5 drinks on one occasion, at least once a month) Source: Canadian Community Health Survey 2014
North Zone Highlights
In early May 2016, nearly 90,000 Albertans were forced to leave their homes and communities when a wildfire swept through Fort McMurray in what would become Canada’s largest natural disaster. AHS staff, physicians and volunteers in the Wood Buffalo area were faced with immense challenges as they assisted in evacuating affected sites, including the Northern Lights Regional Health Centre, relocating 73 patients and 32 continuing care clients to safety. At the same time, AHS teams around the province also responded. Thousands of people worked to keep patients safe, arrange for health services in makeshift locations, and provide care and support to those displaced from their homes. Response to the Fort McMurray wildfires required a provincewide effort co-ordinated by North Zone Addiction and Mental Health, First Responder Support Team. Nursing staff at the Northwest Health Centre worked with the AHS Human Factors team to redesign crash carts to improve quality and patient safety. A crash cart is a mobile unit that holds a collection of emergency equipment, such as a defibrillator, medications and intubation supplies. Changes include arranging medication by order of use and removing supplies not needed during a code. These changes reduce the potential for medication errors, and improve accessibility to all items on the cart. The new Edson Healthcare Centre opened in November 2016 and provides new continuing care beds, and expanded staffing in emergency and acute care. Many health services in the community are provided at the new facility including acute care, emergency, obstetrics, public health, mental health, and home care as well as primary care through the Community Health and Wellness Clinic. Services are supported by pharmacy, rehabilitation, ultrasound, X-ray and laboratory. The High Prairie enhanced primary care clinic is operational and focuses on comprehensive, interdisciplinary primary care in communities with higher Indigenous populations, including enhanced mobile chronic disease management screening services. Integrated Crisis and Access Team in Grande Prairie was launched to provide seven-days-a-week, 10-hour access to an intake assessment for addiction and mental health. The objectives are to increase ease of access to addiction and mental health services and decrease presentation to the emergency department. Early Hearing Detection and Intervention program was implemented at Queen Elizabeth II Hospital (QEII) in November 2016. Phase I focused on screening of neonatal intensive care infants and Phase II focused on testing of well babies. The program builds on the previous Newborn Hearing Screening Program in place at the QEII and former Peace Country Health Region since 2000. QEII was flooded as a result of a rain storm in August 2016. Flood remediation work was completed in December 2016. All staff worked together to support continued patient service. Despite the widespread extent of flood damage, work was completed with minimal interruptions to patient care activities.
Land Mass: 448,500 km2

2016-17 | Alberta Health Services Annual Report
20
NORTH ZONE QUICK FACTS 2013-14 2014-15 2015-16 2016-17 % Change
2015-16 to 2016-17
Primary Care / Population Health
Ambulatory Visits 417,382 418,345 427,076 n/a 2.1%
Number of Unique Home Care Clients 12,343 12,970 13,788 13,778 -0.1%
Number of People Placed in Continuing Care 731 694 704 675 -4.1%
Health Link Calls 66,743 68,322 64,546 59,698 -7.5%
Seasonal Influenza Immunizations 109,501 114,209 99,860 92,672 -7.2%
Food Safety Inspections 14,878 15,589 15,317 14,550 -5.0%
Acute Care
Emergency Department Visits (all sites) 585,294 577,643 550,409 521,993 -5.2%
Hospital Discharges 45,515 44,900 44,110 41,930 -4.9%
Births 6,299 6,309 6,558 5,701 -13.1%
Total Hospital Days 247,759 256,047 263,377 251,339 -4.6%
Average Length of Stay (in days) 5.4 5.7 6.0 6.0 0.0%
Diagnostic / Specific Procedures
Total Hip Replacements (scheduled and emergency) 310 340 315 327 3.8%
Total Knee Replacements (scheduled and emergency) 410 445 514 547 6.4%
Cataract Surgery 2,313 2,194 2,142 1,998 -6.7%
Main Operating Room Activity 23,190 23,450 26,033 25,051 -3.8%
MRI Exams 12,569 12,971 13,621 12,893 -5.3%
CT Exams 32,309 34,066 35,051 34,824 -0.6%
X-rays 295,275 298,088 293,800 284,849 -3.0%
Lab Tests 4,774,459 4,883,055 5,038,109 4,937,068 -2.0%
Cancer Care
Cancer Patient Visits (patients may have multiple visits) 14,469 14,081 14,162 16,437 16.1%
Unique Cancer Patients 2,272 2,199 2,318 2,378 2.6%
Addiction & Mental Health
Mental Health Hospital Discharges (acute care sites) 2,961 2,994 2,983 3,060 2.6%
Staffing
Head Count 9,987 10,411 10,403 10,574 1.6%
Volunteers* 3,356 3,083 2,774 1,626 -41.4%
AHS Physicians n/a 579 607 594 -2.1%
*Decrease in volunteers is attributed to removing duplications and inactive volunteers in the database.
2016-17 | Alberta Health Services Annual Report
21
2016-17 HEALTH PLAN RESULTS
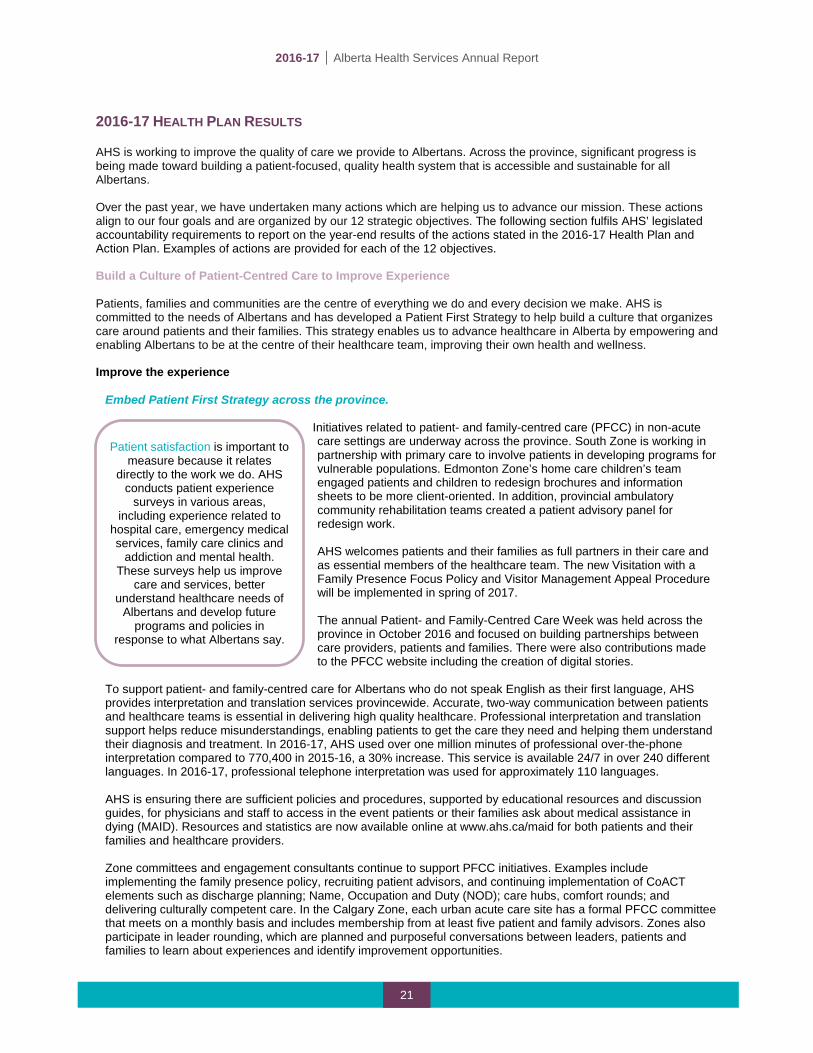
AHS is working to improve the quality of care we provide to Albertans. Across the province, significant progress is being made toward building a patient-focused, quality health system that is accessible and sustainable for all Albertans. Over the past year, we have undertaken many actions which are helping us to advance our mission. These actions align to our four goals and are organized by our 12 strategic objectives. The following section fulfils AHS’ legislated accountability requirements to report on the year-end results of the actions stated in the 2016-17 Health Plan and Action Plan. Examples of actions are provided for each of the 12 objectives. Build a Culture of Patient-Centred Care to Improve Experience Patients, families and communities are the centre of everything we do and every decision we make. AHS is committed to the needs of Albertans and has developed a Patient First Strategy to help build a culture that organizes care around patients and their families. This strategy enables us to advance healthcare in Alberta by empowering and enabling Albertans to be at the centre of their healthcare team, improving their own health and wellness. Improve the experience
Embed Patient First Strategy across the province. Initiatives related to patient- and family-centred care (PFCC) in non-acute care settings are underway across the province. South Zone is working in partnership with primary care to involve patients in developing programs for vulnerable populations. Edmonton Zone’s home care children’s team engaged patients and children to redesign brochures and information sheets to be more client-oriented. In addition, provincial ambulatory community rehabilitation teams created a patient advisory panel for redesign work. AHS welcomes patients and their families as full partners in their care and as essential members of the healthcare team. The new Visitation with a Family Presence Focus Policy and Visitor Management Appeal Procedure will be implemented in spring of 2017. The annual Patient- and Family-Centred Care Week was held across the province in October 2016 and focused on building partnerships between care providers, patients and families. There were also contributions made to the PFCC website including the creation of digital stories.
To support patient- and family-centred care for Albertans who do not speak English as their first language, AHS provides interpretation and translation services provincewide. Accurate, two-way communication between patients and healthcare teams is essential in delivering high quality healthcare. Professional interpretation and translation support helps reduce misunderstandings, enabling patients to get the care they need and helping them understand their diagnosis and treatment. In 2016-17, AHS used over one million minutes of professional over-the-phone interpretation compared to 770,400 in 2015-16, a 30% increase. This service is available 24/7 in over 240 different languages. In 2016-17, professional telephone interpretation was used for approximately 110 languages. AHS is ensuring there are sufficient policies and procedures, supported by educational resources and discussion guides, for physicians and staff to access in the event patients or their families ask about medical assistance in dying (MAID). Resources and statistics are now available online at www.ahs.ca/maid for both patients and their families and healthcare providers. Zone committees and engagement consultants continue to support PFCC initiatives. Examples include implementing the family presence policy, recruiting patient advisors, and continuing implementation of CoACT elements such as discharge planning; Name, Occupation and Duty (NOD); care hubs, comfort rounds; and delivering culturally competent care. In the Calgary Zone, each urban acute care site has a formal PFCC committee that meets on a monthly basis and includes membership from at least five patient and family advisors. Zones also participate in leader rounding, which are planned and purposeful conversations between leaders, patients and families to learn about experiences and identify improvement opportunities.
Patient satisfaction is important to measure because it relates
directly to the work we do. AHS conducts patient experience
surveys in various areas, including experience related to
hospital care, emergency medical services, family care clinics and
addiction and mental health. These surveys help us improve
care and services, better understand healthcare needs of
Albertans and develop future programs and policies in
response to what Albertans say.

2016-17 | Alberta Health Services Annual Report
22
AHS has processes in place to review and respond to feedback from patients and families regarding care and services. The provincial team works to resolve concerns with patients, families and staff. If a resolution is not possible, a concern will be forwarded to the Patient Concerns Officer (PCO) for review. All concerns and commendations reported are tracked in the Feedback and Concerns Tracking (FACT) database and monitored to identify areas for broader improvement. The table below displays the types of feedback provided to the provincial Patient Relations team and the number of concerns escalated to the PCO.
Concerns and Commendations 2015-16 2016-17 Total Number of Commendations 1,845 1,847 Total Number of Concerns 9,845 10,596 Total Number of Concerns reviewed by PCO 9 14 % of actions arising from concerns resolved in 30 days or less 59% 62%
Improve resident experience in long-term care. Publicly accessible tools and resources are available on the AHS website to help clients understand the continuing care system and to provide clients and families with information to assist them with choosing the most appropriate living option. Improvement strategies and action plans for sites with lower satisfaction levels were implemented. For example, staff practice compassionate communication and active listening to better tailor interventions for residents in Central Zone facilities. Continuing Care Quality Indicator Working Group meets regularly to provide expertise and advice to support continuous improvement of continuing care measures for quality assurance and quality improvement. Sharing information about health service quality and success stories are ways that quality of care can be reviewed, monitored and improved. The Alberta Long-Term Care Quality Indicators report is available on the AHS website and complements Canadian Institute for Health Information (CIHI) data. It illustrates how Alberta is doing compared to national averages, shows comparisons between zones and describes actions undertaken or underway to improve care for residents in the zones. Ongoing public reporting raises awareness of good, quality care and flags areas for improvement.
Provide better transitions in care
Increase addiction and mental health capacity in primary care and the community to address recommendations in the “Valuing Mental Health Review.” Protection of Children Abusing Drugs Act (PChAD) is an Alberta law that helps children under 18 whose use of alcohol or drugs is likely to cause significant psychological or physical harm. AHS offers the PChAD program and currently has four safe houses in Calgary, Edmonton, Red Deer and Grande Prairie which provide a secure and supportive home-like setting for these children and give them direct access to addiction counselors and other health professionals to help them address their alcohol, substance abuse or concurrent disorders. As of March 31, 2017, AHS opened 13 addiction spaces (including three new PChAD beds) and 111 community mental health spaces. With a provincial total of 25 PChAD beds, approximately 600 youth were admitted to PChAD in 2016-17. A new local clinic will open in Edmonton in April 2017 that will offer a centralized option for addiction and mental health services and supports for local and area residents ages 11 to 25. Clinicians at the Access Open Minds clinic will screen clients to determine what services are needed and then co-ordinate those services.
Online training modules were developed to support community-based agencies and Primary Care Networks to expand the InRoads Drug Treatment Funding Program. The program’s goal is to develop capacity to increase access to sustainable, evidence-informed, early intervention treatment services for children and youth in Alberta with addiction and mental health concerns.

2016-17 | Alberta Health Services Annual Report
23
AHS continues to support communities to prevent and reduce the harms associated with alcohol and other drug use under the umbrella of the Alberta Alcohol Strategy. Thirty-two community coalitions across the province were supported to implement promotion and prevention activities. AHS is committed to addressing the increased misuse and effects of fentanyl use. Information and resources are provided on the AHS website to support staff and community agencies working with individuals using fentanyl. Free Take Home Naloxone kits were made available for all Albertans at pharmacies, mental health and addiction offices, harm reduction agencies and other walk-in clinics across the province. As of March 31, 2017, nearly 15,000 were dispensed to Albertans with a reported 1,130 reversals, through 1,095 registered sites including local pharmacies. New opioid dependency treatment services were opened in Cardston, Ponoka and surrounding communities, Fort McMurray, and soon to open in Grande Prairie. These services provide patients with methadone treatment in an outpatient setting where they are stabilized under close medical supervision. In response to the wildfire disaster in Fort McMurray, AHS developed nine disaster and emergency resources. Over 80,000 resources were distributed and more than 1,700 participants were trained with a focus on addiction and mental health preparedness, response and recovery.
Expand access to cancer care.
The Community Paramedic program and Tom Baker Cancer Centre (TBCC) partnered to deliver supportive care interventions such as hydration, electrolyte replacement and transfusions to cancer patients outside of acute care. This partnership resulted in over 1,500 patients receiving care at home rather than going to the hospital. This program has enhanced the patient experience, supported better symptom management, decreased TBCC and emergency department visits, and increased emergency medical services job satisfaction.
An electronic Putting Patient First form was completed to support how providers respond to priority issues identified by patients. It includes a newly developed dashboard to help identify patients who have significant symptoms. Other actions that support patient outcomes include the development of fatigue management and patient transition videos to support self-management, and a systemic therapy (chemotherapy) treatment series that enables patients to understand what is being prescribed, what to expect and how to self-manage so that they are partners in care and optimize their well-being throughout the treatment.
Investments were made in community and regional cancer centres to enhance patient access to care closer to home. This included expanding clinic hours and opening the newly renovated High River, Hinton, and Barrhead Community Cancer Centres.
Number of curative radiation therapy techniques and palliative radiation oncology
clinics that improve treatment quality, efficiency and patient experience increased by 9.4% to
over 124,000 treatments compared to 2015-16.
Total number of cancer patient visits increased to over 640,000 visits in 2016-17, representing
a 3.9% increase from 2015-16.
Telemental health uses technology to ensure clients receive help without leaving their community by linking them to mental health professionals. The utilization of telemental health events increased by 36% from 2015-16
to over 10,000 events.
2016-17 | Alberta Health Services Annual Report
24
Implement integrated service delivery models in rural and urban communities, with particular focus on seamless transitions of care and support for complex patients. The planning phase of a new Primary Health Care Integration Network has been created to help Albertans access healthcare. The network focuses on improving transitions of care between primary care providers and acute care, emergency departments, specialized services and other community-based services. Integrated care partnership (ICP) is an approach that helps primary care providers, zones and community partners to collaboratively develop and implement models of care to address care co-ordination challenges. Three ICPs were launched for chronic obstructive pulmonary disease (COPD) and heart failure, foot care and community geriatric service planning to enhance integrated care for patients with complex health needs. AHS completed a report to better understand populations in Alberta that do not have primary care physicians. The report revealed that 12% of Albertans did not have a single visit with a primary care provider and 27% had low attachment and/ or low continuity. Findings from this report will be used to support physicians and teams, AHS programs, Primary Care Networks, Alberta Health and other stakeholders to improve attachment to primary care. Edmonton Zone is working on an initiative to address the health of people with complex high needs and compromised social determinants of health. The objectives are to improve the experience of care for the individual, improve the health of this population and reduce the overall cost of care. The seven teams involved in this work are the Addictions and Mental Health Inner City Support Team working with adults experiencing homelessness and mental health and addictions issues, the Women and Addictions Team working with young women of child-bearing age with addictions, the Boyle McCauley Health Centre, the East Edmonton Health Centre, Home Care, Inner City Palliative Care and EMS community services. The learnings and approach will be leveraged to support developmental work in other zones. A Provincial Community & Rural Maternity Care Plan was completed and approved for implementation. The plan focuses on keeping maternity care closer to home while maintaining principles of safety and best practice. It provides direction to address current service planning needs for maternal patients as well as a stepping stone to support future primary healthcare and acute care health service planning activities. Web pages were launched on AHS Insite to support midwives with staff appointments and admitting privileges. The web pages help build understanding about the midwifery profession and the role midwives play as primary care providers for maternal and newborn care in Alberta. Midwifery services are funded through the “Course of Care” model, which encompasses antepartum care, labour, and birth support to women with low-risk pregnancies and postpartum care to women and infants. Midwifery Services added 3,174 courses of care in 2016-17, an increase of 15% from 2015-16. Address access and culturally appropriate care for underserved populations. Alberta Screening and Prevention (ASaP) Program supports primary care providers in offering screening and prevention to patients who do not present for screening care. In September 2016, ASaP was launched in the Elbow River Healing Lodge located at the Sheldon M. Chumir Health Centre in Calgary. This facility offers a full range of primary care services to First Nations, Métis, and Inuit people and their families. Three Indigenous communities (First Nations, Inuit and Métis) recruited community prevention practitioners to support communities to apply evidence-based comprehensive cancer prevention and screening plans and to increase awareness of prevention and screening. The Improving Cultural Safety with Indigenous Patients, Families and Communities at Wetaskiwin Hospital and Care Centre (WHCC) project is under progress. This project aims to improve Indigenous patient and provider experiences at WHCC and establish culturally-safe delivery of care for Indigenous people. A new initiative is underway to improve access and quality of maternal healthcare of Indigenous women in Edmonton, Maskwacis and Little Red River Cree Nation. The three communities will benefit through enhanced quality of prenatal care closer to home, culturally grounded education and peer support before and after birth as well as improved care coordination and evaluation.

2016-17 | Alberta Health Services Annual Report
25
Enhance community-based options
Offer more continuing care living options. In 2016-17, AHS opened 376 net new continuing care spaces including 245 for seniors with dementia for a total of 25,323 community-based beds/spaces (including palliative). Since April 2010, AHS has added 5,623 spaces in the continuing care system to support individuals who need community-based housing, care and supports. Details on continuing care bed capacity can be found in the Appendix. Home care helps people remain well, safe and independent in their home for as long as possible. Home care promotes client independence, and supplements care and supports provided by families and community services. Nearly 118,834 clients with unique needs received home care in 2016-17, an increase of 2% from 2015-16. The Emergency Medical Services (EMS) Palliative End-of-Life Care Assess, Treat, and Refer program expanded in October 2016, increasing access to community clinicians and EMS. This program provides services across the province to help manage patients’ palliative emergencies in their homes when they do not wish to go to the hospital. To support palliative and end-of-life care, a provincial bereavement package and White Rose program were developed and launched. The White Rose program provides tools and supports for staff to help families in times of grief. In addition, a resource guide was developed and is available online to help communities build local supports and services in Alberta.
Improve system flow
Continue implementation of collaborative practice through CoACT and TeamCARE. CoACT is an innovative model of care in which care providers collaborate with patients. Elements of CoACT include integrated plans of care, transition rounds, patient scheduling, standard transition process, right bed first time, home team, home unit and partnerships with support services. Overall implementation of the project is 73%. TeamCARE is a team-based training program that seeks to improve the reliability of care and enhance patient safety by empowering staff with teamwork, communication and quality improvement skills and techniques. TeamCARE refresh training programs were designed to increase the number of trainees per team to reduce the impact of turnover, align with AHS content, and provide more opportunities for teams to practice key techniques in a safe environment. In 2016-17, nine teams with over 70 staff and supports participated in refresh training. Address patient flow, emergency department throughput and capacity. Zones continue to implement initiatives to improve emergency department (ED) flow. Real-time Emergency Department Patient Access & Co-ordination (REPAC) was implemented in the South Zone to provide information on patient volumes, incoming EMS volumes and information on capacity to improve ED workload balance between hospitals. Calgary Zone completed a rural ED satisfaction survey and created plans to improve care and flow. Central Zone’s Red Deer Regional Hospital Centre developed daily RAPID discharge rounds on inpatient units, trialed use of recliner chairs for patients waiting to be discharged, and began work on improving bed turnaround. Edmonton Zone conducted process improvements in consult times for general surgery and mental health, implemented a Rapid Transfer Unit at the University of Alberta Hospital and provided new mental health space at the Royal Alexandra Hospital. Mental health teams are working to improve community services by opening a clinic to reduce usage of the Queen Elizabeth II ED in the North Zone. Dementia Advice was launched in Calgary and Edmonton Zones in May 2016 and is now available in all five zones through Health Link and can be accessed by dialing 811. Dementia Advice nurses help support anyone living with or caring for someone who has dementia, including those with Alzheimer’s disease. AHS launched the Health, Education and Learning (HEAL) website in September 2016, a resource aimed at providing families across Alberta with easily accessible, reliable information about common minor illness and injuries in children. The content was developed by Pediatric Emergency Medicine experts at the Alberta Children’s Hospital and Stollery Children’s Hospital. The Provincial Patient Repatriation Policy and Procedure was revised to facilitate proactive planning and timely transfer of patients from hospitals to healthcare facilities closer to the patient’s home community.

2016-17 | Alberta Health Services Annual Report
26
Health Outcomes and Clinical Best Practice AHS encourages Albertans to be partners in health to achieve better health outcomes for themselves, their families and their communities. Through collaboration with various stakeholders, we are building a health system that gives patients control over factors that affect their health, improves service quality, promotes leading practices, consistently applies standards and increases local decision-making. Ensure a quality and safety focus in patient care
Focus on accreditation standards that address patient safety areas.
AHS continues to hold accredited status based on the Accreditation Canada on-site survey, which demonstrates our commitment to meeting national standards for quality and safety in providing healthcare services. The results capture the successes and challenges of our provincewide, integrated health system. In the report, Accreditation Canada surveyors recognized AHS’ passionate and caring staff who work collaboratively in interdisciplinary teams to meet the needs of patients, both within the organization and with community partners. Surveyors also acknowledged additional strengths contributing to AHS’ ability to provide safe, quality patient care such as a committed executive leadership and front-line managers; positive interactions between staff, patients and families at the point of care; continued progress and dedication to quality improvement; and significantly improved medication reconciliation practice from the last survey. With the incorporation of the Pharmacy Good Catch program into AHS’ Reporting and Learning System for Patient Safety (RLS), the process for entering and reviewing parenteral nutrition-related events has become more intuitive and accessible for both front-lines and administrators. These changes improve patient safety and meet Health Quality Council of Alberta (HQCA) recommendations.
Antimicrobial Stewardship committees continue to implement Clostridium difficile Infection (CDI) toolkits. These include pre-printed care orders, environmental cleaning protocols, nursing checklist and a management flow map. Cases of CDI are reviewed by AHS Infection, Prevention & Control and AHS Pharmacy for proper treatment, order set use, precautions, cleaning, and appropriate antibiotic and proton pump inhibitor de-escalation to evaluate the use of the CDI toolkit components. Overall, antimicrobial usage of the 16 sites for the 14 antimicrobials highly associated with CDI decreased in the last two years. This is due in part to AHS implementing targeted initiatives, such as education and awareness campaigns, aimed at reducing the use of antimicrobials highly associated with CDI. Proper cleaning and disinfection of the healthcare environment can prevent cross-transmission of microbes, thereby preventing healthcare-acquired infections. AHS implemented the standardized clinical equipment cleaning program at four Edmonton Zone sites: Royal Alexandra Hospital, Glenrose Rehabilitation Hospital, University of Alberta Hospital, and Sturgeon Community Hospital; remaining AHS sites will be completed in 2017-18.
Implement business continuity and disaster recovery plans. A Provincial Framework for Emergency/Disaster Management was completed in October 2016 with a business plan completed in April 2017. This framework is a health-focused, comprehensive, integrated document that provides a context for co-ordination of emergencies/disasters. The Business Continuity Management Program serves as a treatment of risk associated with the loss or interruption of any of the requirements for healthcare delivery. The program began implementation of business continuity and disaster recovery plans across AHS to ensure effective readiness. This work will continue in 2017-18.
Hand hygiene is the most-effective way to prevent the spread of communicable diseases and infections. At the provincial level, hand hygiene reviews were performed by 521 reviewers, including 510 site-based reviewers, at 155 sites. Hand hygiene compliance was 82.2%, an improvement of 3% from last year. At the zone level, hand hygiene compliance varied from 77.6% (Central Zone) to 88.0% (North Zone); a total of 382,993 observations were collected. AHS is in the process of redesigning the Hand Hygiene Reviewer Training to be more efficient and effective.

2016-17 | Alberta Health Services Annual Report
27
Ensure appropriate clinical practice through innovation. Strategic Clinical Networks (SCNs) are bringing new models of care, along with evidence-based care pathways, to improve clinical care and utilization by removing barriers that lead to variation in practice. Below is a sample of key SCN highlights: • Two new SCNs were launched – Population, Public & Indigenous
Health SCN (May 2016) and Digestive Health (November 2016). • The Appropriate Use of Antipsychotics (AUA) project started at 11
early adopter sites, then spread to 170 long-term care facilities and now is spreading to over 80 supportive living sites. The project aims to reduce antipsychotic medication use for continuing care residents. The Resident Assessment Instrument quality indicator for AUA improved from 26.8% in 2015-16 to 17.5% in 2016-17. Alberta is leading Canada in this indicator.
• Four High Risk Foot Teams in Brooks, Slave Lake, Westview and Calgary were mobilized to support primary care teams to provide treatment for diabetic foot ulcers – thereby decreasing the need for emergency care or amputations.
• Eight early adopter sites implemented basal bolus insulin therapy to allow clinicians to customize insulin based on unique needs of patients.
• Quality Improvement & Clinical Research (QuICR) initiative, which focuses on reducing median door-to-needle (DTN) time to improve stroke outcomes, was completed. Results show that the median DTN time improved from 45 minutes with 65% treated in 60 minutes or less (October 2015) to 36 minutes with 82% treated in 60 minutes or less (February 2017).
• Endovascular Reperfusion Alberta project was implemented in the zones to improve endovascular therapy access for patients with acute ischemic stroke to reduce mortality and disability.
• All 50 acute care sites that provide obstetrical services have implemented the new Postpartum and Newborn Clinical Pathways developed in 2016.
• Zones continue to reduce emergency department stat toxicology in rural areas and to ensure appropriate use of antipsychotics and benzodiazepines in addiction and mental health patients (Choosing Wisely).
Continue to implement and spread AHS Improvement Way (AIW) initiatives. AIW provides training and application support in principles, knowledge and tools necessary to help make positive changes. The number of staff and medical staff receiving AIW training in 2016-17 was 2,345, a 6.2% increase from 2015-16. Over 15,000 people have received AIW training. There were 14 large AIW initiatives with 10 initiatives showing a more than 20% improvement and over 100,000 patients positively impacted. Examples of AIW projects include: • Neonatal intensive care unit program at the Stollery Children’s Hospital made improvements that led to freeing
up staff time and improved patient experience. • Gastro-Intestinal Bleed initiative was conducted in partnership with the Emergency Strategic Clinical Network
at seven sites that impacts over 10,000 patients. A clinical pathway was created to reduce unnecessary admissions to the medicine units as well as unnecessary blood transfusions.
Clinical care pathways outline a sequence of activities for specific diagnosis groups or patient populations to maximize quality of care, efficient use of resources and improve transitions of care. The following pathways were developed in 2016-17:
Diabetic Foot Care Inpatient Diabetes Management Repetitive Transcranial
Magnetic Stimulation Breast Health Provincial Delirium Initiative Heart Failure Chronic Obstructive Pulmonary
Disease (COPD) Conservative Kidney
Management Provincial Perinatal

2016-17 | Alberta Health Services Annual Report
28
Improve surgical capacity management
Improve outcomes for patients after surgery. The Enhanced Recovery After Surgery (ERAS) program, and SCN initiative, standardizes care before, during and after surgery to get patients back on their feet quicker while shortening hospital stays and reducing complications after surgery. The program started with one pathway (colon/rectal cancer) at two sites, then 10 pathways at 16 sites and is now spreading to over 50 sites. The implementation of the ERAS colorectal pathway has generated 3,024 days of bed capacity, as well as patients returning home 2.3 days sooner with 11% fewer complications. The National Surgery Quality Improvement Program (NSQIP) uses clinical data to improve performance by reducing rate of preventable surgical complications at five hospitals in Lethbridge, Calgary, Red Deer, Edmonton and Grande Prairie. The readmission rate for 2016-17 showed an improvement since previous year (4.5% compared to 5.2%). The emergent and urgent coding project was launched to standardize wait time measurement and processes around emergent and urgent surgeries. This project will enable AHS to have a full measurement of surgical access/demand across the province.
Improve co-ordination of emergency medical services in rural and remote communities
Implement the Emergency Medical Services (EMS) Plan. The AHS Emergency Medical Dispatch system was recognized by the International Academies of Emergency Dispatch as an Accredited Centre of Excellence (ACE). Recognition as a medical ACE service is one of the highest achievements in the medical dispatch community and is an acknowledgment of the skill and dedication demonstrated by the nearly 250 EMS dispatch professionals. Fort McMurray was consolidated into the EMS Dispatch Model, including the roll-out of the Alberta First Responder Radio Communications System to all EMS units in the province. This dispatch model ensures all patients have access to the closest ambulance in an emergency. Six centres – Northern Communication Centre, Central Communication Centre, Southern Communication Centre, Red Deer, Fort McMurray and City of Lethbridge – are utilizing the collaborative computer-aided dispatch system. AHS EMS played a significant role in the successful response to the Fort McMurray wildfire disaster in patient evacuation by air ambulance, support (first responders during the event), and recovery. To support the region’s fire and EMS services, AHS EMS provided additional ambulances for the duration of the disaster to ensure medical support was available, deployed a portable isolation containment system to establish a temporary field hospital, and provided continual logistical support until it was demobilized. AHS EMS continues to support the implementation of the new stroke ambulance in Edmonton which is a specially built and equipped ambulance that travels to stroke patients in central and northern Alberta. With the new vehicle, stroke diagnosis and treatment that was previously only available in hospitals is brought directly to the patient. A fentanyl training package for Medical First Responder agencies was established for those interested in providing treatment for opioid overdose patients. Education modules for registered midwives with privileges and EMS were developed to gain a better understanding of how they can collaborate to provide effective care to Albertans and to improve neonatal and maternal outcomes. This was a joint project between AHS Provincial Midwifery Services and AHS Emergency Medical Services. In support of the EMS Strategic Framework, four communities with ambulance stations were engaged with service planning. Plans are underway to continue engagement with communities in 2017-18. Based on the EMS patient experience survey, 96% of surveyed patients agreed or strongly agreed with the statement “overall, I was satisfied with my experience with EMS.” AHS publicly posts six EMS-specific performance measures in the form of a performance dashboard on its website.

2016-17 | Alberta Health Services Annual Report
29
Integrate research, innovation and analytics in the delivery of care
Integrate research, innovation and analytics to guide decision-making, improve performance and deliver quality care. AHS continues to strengthen health research innovations, new technologies and new knowledge to apply to clinical settings. A total of 91 projects were funded through formal, peer-reviewed processes. There were a total of 66 requests submitted by the SCNs for review of technologies under the Health Technology Assessment process.
Examples of research and innovation highlights from the past year: Alberta’s 17 stroke treatment centres are among the fastest in the world in giving patients the clot-
busting drug tPA (tissue Plasminogen Activator). The average time it takes from a patient’s arrival at hospital to being diagnosed with stroke and treated has been halved from 70 minutes to 36 minutes.
A new approach is used to treat recurrent Clostridium difficile Infection (CDI). Fecal Microbiota Transplantation (FMT) is the process of transplanting fecal bacteria from a healthy individual into a recipient with CDI. FMT has an overall treatment success rate of 93%. Timely FMT can prevent subsequent emergency room visits and hospitalization, and improve quality of life for patients.
Alberta Children’s Hospital offers a new surgical procedure to ease the pressure of hydrocephalus. The
minimally invasive procedure creates new channels for cerebrospinal fluid to drain and circulate normally. Standard practice has been to place a shunt to drain the fluid, which can have complications.
A new high-tech heart-valve fix heals seniors who are too weak for open-heart surgery. The minimally
invasive procedure provides patients with a rapid recovery time and improved quality of life.
Stroke patients at risk of choking can benefit from a new assessment tool, Fiberoptic Endoscopic Evaluation of Swallowing, offered at the Brooks Health Centre and Medicine Hat Regional Hospital. The new tool means a reduction in wait times and helps patients, families and care teams make decisions about nutrition.
Work continues on a research project that provides a complete and accurate measurement of
immunization coverage in children in two Alberta First Nation communities and identifies barriers and supports to childhood immunizations in these communities. The project will help guide policy and practices to improve immunization access and uptake through development of culturally appropriate solutions.
AHS is engaged in a national research project that identifies tests, treatments and procedures to avoid
in Emergency Medicine. The Emergency Strategic Clinical Network has implemented strategies to improve efficiency of evidence-based care by avoiding unnecessary tests, improve safety of care, and improve stewardship of healthcare resources.

2016-17 | Alberta Health Services Annual Report
30
Promote and support wellness for our communities
Reduce communicable disease through preventative measures. Immunizations, also known as vaccinations, help protect against infectious disease. Vaccines are safe and they are important for two key reasons: vaccinations protect you and protect those around you. For more information, visit the website at immunizealberta.ca.
Immunization 2015-16 2016-17 Influenza:
Children 36% 34% Long-Term Care Resident 90% 89% Health Care Worker 61% 63%
Childhood Immunization by age 2: Diphtheria / Tetanus /Acellular Pertussis, Polio, Hib (DTPP) 78% 78% Measles / Mumps / Rubella (MMR) 87% 87%
Rotavirus immunization coverage in infants (completion rate of 2-dose series) 56% 80% Sexually transmitted infections (STI) screening rates for 20-24 year olds 23% (2015) 24% (2016)
In response to the mumps outbreak declared in the South and Edmonton Zones, AHS Communicable Disease Control (CDC) worked closely with Alberta Health, Medical Officers of Health and senior management on reporting number of cases, vaccine supplies and updating policies (i.e., a new policy for adult immunization is planned to go into effect in June 2017). CDC also opened a virtual Emergency Co-ordination Centre to ensure a co-ordinated provincial response. For more current information, visit www.ahs.ca/mumps. Promote healthy social and physical environments and focus on health promotion, wellness, and disease and injury prevention. The Better Health, Better Business website outlines steps and provides tools on how workplaces can create sustainable changes to health culture and employee health practices that influence cancer and chronic disease. For 2016-17, eight workplaces completed the workplace health assessment, 14 completed action plans, and 11 completed evaluation plans. To support recovery operations in communities impacted by the Fort McMurray wildfire, there were 40 rental/public inspections, 106 private home inspections, 138 housing inspections, 785 demand inspections, 116 risk management inspections, and 659 service requests completed in 2016-17. Several safe and healthy environment initiatives were conducted across the zones. For example, Calgary Zone responded to residential properties contaminated with fentanyl and created an interim solution to ensure properties were assessed and remediated without exposing public health inspectors to fentanyl contamination.
Work continues with school boards to implement comprehensive school health and healthy public policy related to nutrition, physical activity and positive mental health. For 2016-17, 90% of school jurisdictions implemented comprehensive school health and 79% of school jurisdictions have a healthy public policy in place. A Million Messages standardizes child injury prevention messages given to parents and caregivers. In 2016-17, 770 AHS staff (compared to 466 in 2015-16) completed the module which is an electronic self-learning tool for staff working with parents and caregivers to learn about the burden of injury. Applied Suicide Intervention Skills Training (ASIST) is a workshop in suicide first aid that teaches participants to recognize when someone may have thoughts of suicide and work with them to create a plan that will support their immediate safety. In 2016-17, 834 AHS staff completed ASIST and other suicide prevention training courses. AHS is developing the Early Hearing Detection and Intervention program which offers screening to newborns in Alberta for hearing loss prior to hospital discharge. Infants not passing the screening receive diagnostic evaluation and, when necessary, are enrolled in early intervention programs. Three neonatal intensive care units - Medicine Hat Regional Hospital, Queen Elizabeth II Hospital (Grande Prairie) and Grey Nun’s Hospital (Edmonton) – implemented the program in 2016-17. This program will continue implementation into 2017-18.

2016-17 | Alberta Health Services Annual Report
31
Reduce risk factors for cancer and chronic disease through direct intervention. Alberta’s cancer incidence rates have declined by about 0.6% annually between 2001 and 2014. Mortality rates have also decreased over the past 20 years, falling on average by 2.1% annually between 2004 and 2014. The data in the 2014 Report on Cancer Statistics in Alberta – released February 2017 – shows the significant impact early detection and cancer screening can have on a rate of survival and years lived. AHS continues to support a number of effective screening and prevention programs, and expand these services every year. Alberta cancer screening programs (breast, cervical and colorectal cancers) continue to provide education and awareness across the province. For example, collaborative work is underway with Primary Care Networks to understand diverse populations and address access to services. Screen Test celebrated 25 years of mobile breast cancer screening services, reaching over 117 communities, including 26 Indigenous communities (New Sarepta, Fort McMurray First Nation, Kehewin Cree Nations and Alexander First Nation added this year). Screen Test has seen a 67% increase in First Nations clients since 2013. This year, Screen Test sent approximately 800,000 letters to Albertans and their healthcare providers on cancer screening status and recommended actions; as well, 135,260 visits to www.screeningforlife.ca were recorded. Twelve communities completed the community health assessment for cancer prevention and screening, and 14 implemented action plans. Five additional communities were recruited – two rural Alberta and three Métis Settlements. Total number of visitors to AlbertaPreventsCancer.ca was 114,859, a 23% increase from 2015-16. New content and enhancements made to the website to improve user experience include:
• Upgrade to the Human Papilloma Virus (HPV) vaccine decision tool, a tool
for parents of children who are eligible for the HPV vaccine, resulting in an increase in the number of site visits (2,017 compared to 47,564) and completion rates (15.5% compared to 18.1%) from 2015-16.
• BeSunsible website was optimized to better support employers of outdoor workers to incorporate sun safety into their occupational health and safety practices; site visits increased 70% from 2015-16.
• Online community cancer prevention and screening dashboard was launched, and Albertans can access information on how to reduce cancer risk in their communities and see how their community is performing compared to other communities.
Chronic diseases, including some cancers, cardiovascular diseases, chronic respiratory disease and diabetes are leading causes of death in the province. As Alberta’s population increases and gets proportionately older, the rising burden of chronic disease on the healthcare system will also become unsustainable. There are strong associations with four risk factors (tobacco, alcohol consumption, physical inactivity and unhealthy eating) and the most common chronic diseases. Examples of AHS activities related to chronic disease management in 2016-17:
• AlbertaQuits connects people to support services, such as counselling, to help quit smoking. There were a total of 2,900 registrations and 2,752 quit attempts at AlbertaQuits.ca in 2016-17, a significant increase from 2015-16.
• The Find Your Stride program, which targets smokers to increase physical activity was piloted and evaluated.
• Four new communities (including one Indigenous community) are engaged in WalkABle Alberta. There are a total of 19 communities participating in WalkABle Alberta.
• Resources related to healthy drinks, vegetable and fruit consumption, and sodium were completed and posted on healthyeatingstartshere.ca, including a Community Gardens Handbook.
• A Collective Kitchens toolkit was developed and disseminated to community groups across Alberta. • Ten alcohol and health educational resources to improve the health and safety of groups at high risk of
alcohol misuses were developed.
AlbertaPreventsCancer.ca connects Albertans to useful resources and strategies they can use to reduce the risk of
cancer or detect cancer earlier. It provides online tools and resources to support cancer prevention, screening and
research.
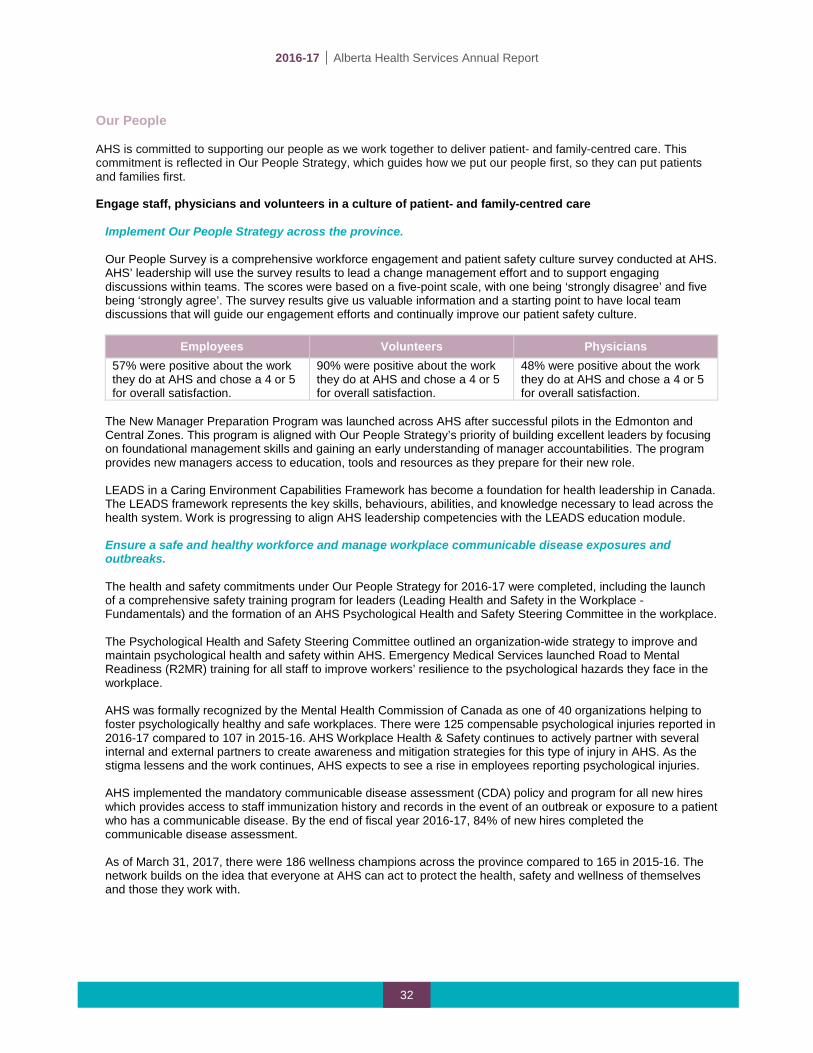
2016-17 | Alberta Health Services Annual Report
32
Our People AHS is committed to supporting our people as we work together to deliver patient- and family-centred care. This commitment is reflected in Our People Strategy, which guides how we put our people first, so they can put patients and families first. Engage staff, physicians and volunteers in a culture of patient- and family-centred care
Implement Our People Strategy across the province. Our People Survey is a comprehensive workforce engagement and patient safety culture survey conducted at AHS. AHS’ leadership will use the survey results to lead a change management effort and to support engaging discussions within teams. The scores were based on a five-point scale, with one being ‘strongly disagree’ and five being ‘strongly agree’. The survey results give us valuable information and a starting point to have local team discussions that will guide our engagement efforts and continually improve our patient safety culture.
Employees Volunteers Physicians
57% were positive about the work they do at AHS and chose a 4 or 5 for overall satisfaction.
90% were positive about the work they do at AHS and chose a 4 or 5 for overall satisfaction.
48% were positive about the work they do at AHS and chose a 4 or 5 for overall satisfaction.
The New Manager Preparation Program was launched across AHS after successful pilots in the Edmonton and Central Zones. This program is aligned with Our People Strategy’s priority of building excellent leaders by focusing on foundational management skills and gaining an early understanding of manager accountabilities. The program provides new managers access to education, tools and resources as they prepare for their new role. LEADS in a Caring Environment Capabilities Framework has become a foundation for health leadership in Canada. The LEADS framework represents the key skills, behaviours, abilities, and knowledge necessary to lead across the health system. Work is progressing to align AHS leadership competencies with the LEADS education module. Ensure a safe and healthy workforce and manage workplace communicable disease exposures and outbreaks. The health and safety commitments under Our People Strategy for 2016-17 were completed, including the launch of a comprehensive safety training program for leaders (Leading Health and Safety in the Workplace - Fundamentals) and the formation of an AHS Psychological Health and Safety Steering Committee in the workplace. The Psychological Health and Safety Steering Committee outlined an organization-wide strategy to improve and maintain psychological health and safety within AHS. Emergency Medical Services launched Road to Mental Readiness (R2MR) training for all staff to improve workers’ resilience to the psychological hazards they face in the workplace. AHS was formally recognized by the Mental Health Commission of Canada as one of 40 organizations helping to foster psychologically healthy and safe workplaces. There were 125 compensable psychological injuries reported in 2016-17 compared to 107 in 2015-16. AHS Workplace Health & Safety continues to actively partner with several internal and external partners to create awareness and mitigation strategies for this type of injury in AHS. As the stigma lessens and the work continues, AHS expects to see a rise in employees reporting psychological injuries. AHS implemented the mandatory communicable disease assessment (CDA) policy and program for all new hires which provides access to staff immunization history and records in the event of an outbreak or exposure to a patient who has a communicable disease. By the end of fiscal year 2016-17, 84% of new hires completed the communicable disease assessment. As of March 31, 2017, there were 186 wellness champions across the province compared to 165 in 2015-16. The network builds on the idea that everyone at AHS can act to protect the health, safety and wellness of themselves and those they work with.
2016-17 | Alberta Health Services Annual Report
33
Financial Health and Operational Best Practice AHS continues to address challenges through fiscal management, a focus on sustainability, development of our workforce, implementation of leading practices, process improvement and preparing for the future health needs of Albertans. Ensure investment in new technology and/or information management systems supports care delivery
Use information for front-line automated clinical decision support and provincial electronic health records. AHS co-ordinates provision of access to the Alberta Netcare Portal to staff and physicians. The number of active provider accounts within Netcare increased by 5.5% compared to last year. Netcare usage increased in part due to significant enhancements in Netcare in 2016, such as the addition of immunization history for all Albertans and the Best Possible Medication History report. MyHealth.Alberta.ca provides trusted health and wellness information to Albertans and is also the access point to Albertans' personal health records. There was a 20% increase in the number of visits to MyHealth.Alberta.ca in 2016-17 compared to 2015-16. Other highlights to MyHealth.Alberta.ca include:
• Home page feature carousel was used to support emerging events such as measles, mumps, World Cancer Day, Alzheimer’s disease, oral health, fentanyl awareness, and Fort McMurray wildfire mental health support.
• “Help4Me” website launched in May 2016 in collaboration with Alberta Health and Human Services to improve access to youth addictions and mental health resources.
• Two new learning modules were added on weight management for adults and insulin pump education. • Over 550 pages of new content were added to the website, including drug monographs, health
information, videos and patient care handouts. Enhance clinical information systems in ambulatory and acute care settings. A key focus for the past fiscal year has been the AHS Provincial Clinical Information Systems (CIS) Request for Proposal (RFP). AHS is reviewing proposals and a final decision will be made early in the new fiscal year. A provincial CIS will ensure that healthcare providers have access to accurate patient information. With a single comprehensive record and care plan for every patient, quality and safety of care is improved, and patients and their families across the healthcare system will have a better experience. Supporting the Provincial CIS, 18 new clinical guidance knowledge topics (i.e., emergency, cancer, maternal and seniors’ health topics) were released which provide standardized guidance to clinicians on a particular disease or condition. In addition, 25 new order/service catalogues (i.e., pharmacy medications, diagnostic imaging reporting, special chemistry (lab), and respiratory) were released which standardizes orders and clinical services provincially.
Alberta Netcare is a secure and confidential electronic system of Alberta patients' health
information, collected through point-of-service systems in hospitals, laboratories, testing facilities, pharmacies, and clinics.
2016-17 | Alberta Health Services Annual Report
34
Optimize service delivery through needs-based service planning and operational best practices
Focus on operational best practices, identifying where we vary from other jurisdictions. Senior leaders continue to implement business efficiency initiatives through an attrition model based on direction from the Government of Alberta. While this resulted in delays in implementation of initiatives as the natural attrition rates have slowed within AHS, cumulative savings of $135 million and a reduction of 833,000 in worked hours have been realized to the end of March 31, 2017. In addition to identifying business efficiencies, opportunities were identified for data quality improvement. These improvements provide AHS leaders with increased levels of consistent, relevant and comparable information to improve operational decision-making, peer comparison and consultation. Create comprehensive health service delivery models to achieve optimal health outcomes for Albertans. Long-range planning is underway in both the Calgary and Central Zones with a focus on a 15-year vision for healthcare, as well as assessing potential options for transforming care into the community. Community and staff engagement sessions and online opportunities for providing input begin in November 2016 and continues. These inputs will contribute to informing a high-level health system strategy, which will be further developed in 2017. Long-range plans for North and South Zones will follow. Access to service guidelines are part of a comprehensive, provincial, community-based planning approach to health system/service planning. They provide consistency and transparency in service planning and decision-making, while considering access, quality and sustainability as well as improved patient outcomes, improved patient experience, lower cost of care, and improved provider experience. They will ensure local population needs and unique community characteristics are considered in service planning and delivery. Guideline development for three priority planning areas were identified to be further advanced in 2017. The following are examples of service plans completed in 2016-17: South Zone Aboriginal Health and Action Plan, Airdrie Urgent Care Service Plan, Calgary Zone Child and Adolescent Mental Health Program Brain Health Service Plan, Edmonton Zone Trauma Plan, Sylvan Lake Enhanced Services Plan, and Beaverlodge Health Service Plan in the North Zone. A Guide to Community Engagement was developed and shared across AHS to help build understanding of and support for practicing meaningful engagement. The guide has been applied to various engagement activities and feedback has been positive. Continue implementation of a consolidated Laboratory Service Delivery Model. AHS continues to work with Alberta Health to finalize the new laboratory service model for Alberta. A new model will focus on patient needs, safety and quality by addressing challenges of increasingly sophisticated testing and increased demand for services, and also by providing a cost-effective solution.
2016-17 | Alberta Health Services Annual Report
35
PERFORMANCE RESULTS
Leading in Health
Performance Measures
Monitoring Measures

2016-17 | Alberta Health Services Annual Report
36
Measuring and Monitoring our Progress AHS continues to monitor a number of measures that help inform us about the performance of our health system and support priority setting and local decision-making. The measures track our performance using a broad range of indicators that span the continuum of care. They include population and public health, primary care, continuing care, cancer care, emergency department and surgery. Some of these measures do not have targets or national benchmarks across the country for comparison. However, these measures are familiar and of interest to Albertans. These measures are updated quarterly and posted on the AHS website. Leading in Health
The following indicators were developed by the Canadian Institute for Health Information (CIHI) that measure the health of Canadians and health system performance in Canada. These indicators help inform AHS and Albertans on how we perform nationally but may not align with the measures developed by AHS and Alberta Health to measure performance in Alberta. While AHS is always striving to improve and address challenges in healthcare, these examples highlight where Alberta already excels in the country. AHS is a national leader in many areas of healthcare, according to the latest statistics from the CIHI, including having administration costs that are among the lowest in the country as a percentage of total spending. We want to make sure we maintain or further improve this level of performance and the excellent clinical care that is already being provided.
FIRST IN COUNTRY FOR: SECOND IN COUNTRY FOR: THIRD IN COUNTRY FOR: Lowest total time spent in
emergency department for admitted patients (all sites)
Fewest repeat hospital stays for mental illness
Lowest hospital deaths following major surgery (tied)
Lowest potentially inappropriate use of antipsychotics in long-term care
Lowest administrative expense
Best perceived health
Lowest number of obstetric patients readmitted to hospital (tied)
Lowest restraint use in long-term care
Highest improved physical functioning in long-term care
Fewest patients experiencing pain in long-term care
Highest physical activity during leisure time
Fewest low-risk caesarean sections
Highest life expectancy at age 65
Fewest hospitalized heart attacks
Fewest self-injury hospitalizations
Source: CIHI 2014-15

2016-17 | Alberta Health Services Annual Report
37
Performance Measures The following 17 AHS performance measures were established in collaboration with Alberta Health. These measures reflect a balance across the spectrum of healthcare and accurately reflect health system performance. They were developed to enable us to compare AHS performance nationally. The performance measures are aligned to the Alberta Quality Matrix for Health, developed by the Health Quality Council of Alberta (HQCA), which describes six dimensions of quality: acceptability, accessibility, appropriateness, effectiveness, efficiency and safety. The measures play a key role in advising staff and physicians about our progress and where we may need to adjust actions to achieve the identified targets; they also help in communicating with Albertans about the value provided by health funding expenditures. The 2016-17 targets were established in the AHS 2016-17 Health Plan and Business Plan. These performance targets help us measure our progress and improve the health system. In many areas, AHS continues to see increases in volume and demand for services. Initiatives within AHS are being put in place in an effort to not only move measures toward their targets, but also to compensate for these increases. The chart on the following page represents the full fiscal period ending March 31, 2017. These results are produced by AHS Analytics with national comparisons from Canadian Institute for Health Information (CIHI), where applicable. There are 15 measures that are reported quarterly; of these, nine measures include the most current data available (2016-17) and six measures are updated to the end of the third quarter. These latter measures either rely on patient followup after a patient’s discharge date and require additional information to become available after discharge (e.g., readmission rates) or require longer periods of time for verification (hospital-acquired infections and mortality rates). The reporting cycles for two measures, Early Detection of Cancer (source: Alberta Cancer Registry Data) and Satisfaction with Long-Term Care (source: HQCA), do not align with AHS’ reporting cycle. Performance trending is done by comparing current reporting period (2016-17) to the same period last year (2015-16). Further analysis and explanation of variances can be found in the Q4 year-to-date 2016-17 performance measure report – available on the AHS website.
• Three performance measures achieved 2016-17 target regardless of performance comparison ( ). • Five performance measures are better than the same time period as last year but have not met target (). • Six performance measures are stable, within 3% from the same time period as last year (). • Two measures have deteriorated from the same period as last year ().
Continuing care placement: To address the rate of spending in 2016-17, a decision was made to defer the opening of some continuing care and addiction and mental health community care spaces and minimize growth of home care program spending. These changes are driving longer waits and higher waitlists for placement into continuing care living options. The average wait time for continuing care placement in acute /subacute care is 46 days (compared to 44 days for the same period last year). The number of people waiting in acute/sub-acute care has increased to 846 as of March 31, 2017 (compared with more than 628 people waiting in 2015-16). It is important to note that not all of these patients are waiting in an acute care hospital bed in a busy urban hospital. Many are staying in transition beds, sub-acute beds, restorative/rehabilitation care beds, and rural hospitals where system flow pressures and patient acuity are not as intense. In 2016-17, there were 8,002 people placed into continuing care compared to 7,879 for the same period last year. Work continues across the province to implement the Seniors Health Continuing Care Capacity Plan. In 2016-17, AHS opened 376 net new continuing care spaces including 245 for seniors with dementia for a total of 25,323 community-based beds/spaces (including palliative). Since April 2010, AHS has added 5,623 spaces in the continuing care system to support individuals who need community-based housing, care and supports. All delayed/deferred care spaces are planned to open in the 2017-18 fiscal year.
Access to Children’s Mental Health: Overall, there has been an improvement in access to children's mental health services from quarter to quarter this fiscal year; however, year-to-date results have been impacted by increased demand for children's mental health services combined with staff vacancies/leaves that impact the availability of services and wait-times. Strategies to improve efficiency include: process improvement and service innovation, parenting programs and walk-in sessions, successful recruitment into long-standing vacancies, implementation of regional collaborative school delivery projects as well as children and youth mental health projects via child and family services and primary care networks, expanded in-reach into high schools and improved access to care for families in south Edmonton through the newly opened Rutherford Clinic.

2016-17 | Alberta Health Services Annual Report
38
AHS Performance Measure 2012-13 2013-14 2014-15 2015-16 2016-17 Target 2016-17 Trend
2015-16 National
Comparison* Acceptability: Health services are respectful and responsive to user needs, preferences and expectations. Satisfaction with Hospital Care: Percentage of adult patients who rated their overall care in hospital as 8, 9 or 10, where zero is the lowest level of satisfaction possible and 10 is the best.
81% 82% 82% 82% 83% Q3 YTD 85%
Not available
Satisfaction with Long-Term Care: Percentage of families of long-term care residents who rated the overall care as 8, 9 or 10; zero is the lowest level of satisfaction possible and 10 is the best.
2007 = 71% 2010 = 73% 2014 = 72%
Reported by HQCA Not available
Safety: Mitigate risks to avoid unintended or harmful results. Hospital-Acquired Clostridium difficile Infections: Number of Clostridium difficile infections (C-diff) acquired for every 10,000 patient days. A rate of 4.0 means approximately 100 patients per month acquire C-diff infections in Alberta.
4.1 4.4 3.5 3.5 3.4 Q3 YTD 3.3
Better than national
results based on
surveillance data
Hand Hygiene: Percentage of opportunities for which healthcare workers clean their hands during the course of patient care.
58.6% 66.4% 75.0% 79.8% 82.2% 90% Not available
Hospital Mortality: Actual number of deaths compared to the expected number of deaths in hospital. Values less than 100 mean fewer than expected deaths In Alberta.
95 95 93 93 93 90 5th out of 9 provinces
Accessibility: Health services are obtained in the most suitable setting in a reasonable time and distance. Emergency Department (ED) Wait to see a Physician: Average patient’s length of time in ED before being seen by a physician at the busiest EDs.
1.3 hours
1.3 hours
1.4 hours
1.3 hours
1.3 hours
1.2 hours
4th out of 5 provinces
ED Length of Stay for Admitted Patients: Average patient’s length of time in the ED before being admitted to a hospital bed at the busiest EDs.
8.7 hours
8.6 hours
9.9 hours
9.4 hours
9.5 hours
9.3 hours
2nd out of 5 provinces
(busiest sites)
ED Length of Stay for Discharged Patients: Average patient’s length of time in the ED before being discharged at the busiest EDs.
3.1 hours
3.0 hours
3.2 hours
3.2 hours
3.2 hours
3.1 hours
4th out of 5 provinces
Access to Radiation Therapy: Length of time that 9 out of 10 patients wait to receive radiation therapy.
3.0 weeks
3.0 weeks
3.1 weeks
2.9 weeks
2.7 weeks
2.6 weeks
4th out of 9 provinces
(Q2 2016-17)
Children’s Mental Health Access: Percentage of children (age 0-17 years) offered scheduled community mental health treatment within 30 days from referral.
n/a 87% 89% 85% 81% 90% Not available

2016-17 | Alberta Health Services Annual Report
39
AHS Performance Measure 2012-13 2013-14 2014-15 2015-16 2016-17 Target 2016-17 Trend
2015-16 National
Comparison* Appropriateness: Health services are relevant to user needs and are based on accepted or evidence-based practice. Continuing Care Placement: Percentage of people placed into continuing care within 30 days of being referred.
67% 69% 60% 60% 56% 62% Not available
Efficiency: Resources are optimally used in achieving desired outcomes. Acute (Actual) Length of Hospital Stay Compared to Expected Stay: Actual length of stay in hospital compared to the expected length of stay in hospital. Every .01 drop in this ratio means we can treat over 3,200 more patients in hospital every year.
1.04 1.03 1.02 1.00 0.98 0.98 3rd out of 9 provinces
Effectiveness: Health services are based on scientific knowledge to achieve desired outcomes. Early Detection of Cancer: Percentage of patients with breast, cervical and colorectal cancers who are diagnosed at early stages.
66% (2011) 67% (2012) 68% (2013) 69% (2014) 70% (2015)
70% (2015-
16 target)
2nd for breast cancer and 8th for colorectal cancer out of 9 provinces
(2010) Mental Health Readmissions: Percentage of mental health patients with unplanned readmission to hospital within 30 days of leaving hospital.
9.6% 8.9% 8.8% 8.6% 8.6% Q3 YTD 8.5%
2nd out of 10 provinces (2014-15)
Surgical Readmissions: Percentage of surgical patients with unplanned readmission to hospital within 30 days of leaving hospital.
6.6% 6.7% 6.5% 6.5% 6.7% Q3 YTD 6.3%
5th out of 10 provinces (2014-15)
Heart Attack Mortality: Percentage of patients dying in hospital within 30 days of being admitted for a heart attack.
5.9% 7.2% 6.2% 6.3% 5.8% Q3 YTD 5.9%
4th out of 10 provinces (2014-15)
Stroke Mortality: Percentage of patients dying in hospital within 30 days of being admitted for a stroke.
15.0% 14.1% 13.9% 14.1% 13.5% Q3 YTD 13.2%
4th out of 10 provinces (2014-15)
*National comparison is based on data and information provided by the Canadian Institute for Health Information (CIHI). However, the analyses, conclusions, opinions and statements expressed herein are those of the author, and not necessarily those of the CIHI.

2016-17 | Alberta Health Services Annual Report
40
Monitoring Measures There are a number of measures that AHS monitors internally to help inform us about other areas of the health system. These monitoring measures do not have targets, and some of these measures do not have benchmarks across the country for comparison. However, these measures are familiar and of interest to Albertans. These measures are updated quarterly and posted on the AHS website. The following measures contribute to balanced performance monitoring and reporting that have been tracked over many years. These measures are tactical as they inform the performance of an operational area or reflect the performance of key drivers of a performance measure. The measures represent a broad range of indicators that span the continuum of care. The trend column indicates comparison of the most recent available data over the earliest data available for each measure: an upward arrow () indicates improvement; a horizontal arrow () indicates stability and a downward arrow () indicates areas that require additional focus.
LIFE EXPECTANCY 2012 2013 2014 2015 2016 Trend The number of years a person would be expected to live, starting at birth, on the basis of mortality statistics. Both sexes combined. Provincial 81.7 81.7 81.8 81.8 81.9
Females 83.9 83.7 83.9 84.1 84.2 Males 79.4 79.6 79.7 79.5 79.7 First Nations 72.2 72.5 71.6 70.4 n/a Non-First Nations 82.0 82.1 82.2 82.3 n/a
POTENTIAL YEARS OF LIFE LOST 2012 2013 2014 2015 2016 Trend The total number of years not lived (per 1,000 population) by an individual who died before their 75th birthday. Both 48.4 48.2 49.5 50.1 48.9
Females 37.5 38.3 38.7 38.1 37.8 Males 58.9 57.7 59.7 61.5 59.5
CANCER SCREENING PARTICIPATION RATES 2012-13 2013-14 2014-15 2015-16 2016-17 Trend Breast n/a 62.2% 62.7% 62.8% n/a Colorectal n/a n/a 39.2% 38.0% n/a
Cervical 64.2% (2011-13)
62.7% (2012-14)
62.0% (2013-15)
61.5% (2014-16) n/a
INFLUENZA IMMUNIZATION 2012-13 2013-14 2014-15 2015-16 2016-17 Trend Rates of seasonal influenza immunization by age group.
Adults aged 65 years and older 60.0% 63.6% 60.5% 62.7% 62.4% Children aged six to 23 months 30.2% 35.7% 35.6% 35.9% 34.4% AHS Healthcare Workers n/a 60.0% 63.9% 60.9% 62.5%
CHILDHOOD IMMUNIZATION 2012 2013 2014 2015 2016 Trend Rates of childhood immunization by two years of age.
Diphtheria/ tetanus/ acellular pertussis, polio, Hib 75.0% 74.8% 75.8% 75.6% 77.0% Measles/ mumps/ rubella 85.9% 86.1% 88.1% 87.4% 87.9%
PRIMARY CARE 2012-13 2013-14 2014-15 2015-16 2016-17 Trend
Albertans Enrolled in a Primary Care Network (%) 76% 78% 79% 80% 81%
Ambulatory Care Sensitive Conditions: Rate of hospital admissions for health conditions that may be prevented or managed by appropriate primary healthcare.
293 291 288 281 269
Family Practice Sensitive Conditions: Percentage of emergency department or urgent care visits for health conditions that may be appropriately managed at a family physician’s office.
26.0% 25.1% 24.3% 23.0% 22.1%
HEALTH INFORMATION 2012-13 2013-14 2014-15 2015-16 2016-17 Trend Health Link: Percentage of calls to Health Link that are answered within two minutes. 78% 79% 77% 76% 74%

2016-17 | Alberta Health Services Annual Report
41
CHILDREN’S MENTAL HEALTH SERVICES 2012-13 2013-14 2014-15 2015-16 2016-17 Trend Percentage of children aged 0 to 17 years receiving scheduled mental health treatment within 30 days. 80% 81% 82% 73% 73%
EMERGENCY DEPARTMENT WAIT TIME in hours 2012-13 2013-14 2014-15 2015-16 2016-17 Trend Percentage of patients treated and discharged from the Emergency Department within 4 hours.
Busiest 16 sites 65% 66% 63% 63% 62% All sites 80% 80% 78% 78% 78%
Percentage of patients treated and admitted to hospital from the Emergency Department within 8 hours. Busiest 15 sites 45% 46% 39% 41% 41% All sites 55% 54% 48% 49% 49%
ACUTE CARE 2012-13 2013-14 2014-15 2015-16 2016-17 Trend Acute Care Occupancy – Busiest Hospitals (Percentage of patient days in hospital compared to available bed days in the reporting period for top 16 AHS sites).
n/a 97.4% 97.1% 95.6% 96.5%
Alternate Level of Care (ALC) days – Percentage of Total Hospital Days classified as ALC. n/a 10.1% 12.2% 13.5% 15.1%
CANCER WAIT TIME in weeks (90th percentile) 2012-13 2013-14 2014-15 2015-16 2016-17 Trend Radiation Oncology Access – referral to first consult (from referral to the time of their first appointment with a radiation oncologist).
4.9 4.9 4.9 5.0 5.0
Medical Oncology Access – referral to first consult (from referral to the time of their first appointment with a medical oncologist).
4.9 5.6 5.6 5.6 5.1
SURGERY WAIT TIME in weeks 2012-13 2013-14 2014-15 2015-16 2016-17 Trend CABG (Coronary Artery Bypass Graft) Urgency III – Scheduled 25.9 21.5 23.7 19.8 15.5
CABG RTT Urgency III – Scheduled n/a 13.3 14.9 12.1 10.7 Cataract Surgery DTT 31.6 31.6 33.3 35.9 36.9 Cataract Surgery RTT n/a 27.9 29.9 33.0 34.0 Hip Replacement Surgery DTT 36.3 36.7 36.3 38.0 38.3 Hip Replacement Surgery RTT n/a 27.9 28.7 31.4 32.9 Knee Replacement Surgery DTT 40.9 41.9 44.9 43.9 47.0 Knee Replacement Surgery RTT n/a 31.4 33.0 34.7 37.1 Hip Fracture Repair: Percentage within 48 hours 84.9% 88.4% 86.2% 90.0% 91.9% CONTINUING CARE 2012-13 2013-14 2014-15 2015-16 2016-17 Trend Total Number of People Placed into Continuing Care 7,761 7,694 7,810 7,879 7,963*
Number of patients placed from acute / subacute hospital bed into continuing care. 5,561 5,522 5,548 5,405 5,395
Number of clients placed from community (at home) into continuing care. 2,200 2,172 2,262 2,474 2,568
Average wait time in acute / subacute care hospital bed for continuing care placement (in days). 34 31 42 44 46 Total Number Waiting For Continuing Care Placement: 1,154 1,193 1,544 1,411 1,873
Number of persons waiting in acute / subacute hospital bed for continuing care placement. 453 512 690 628 846 Number of persons waiting in community (at home) for continuing care placement. 701 681 854 783 1,027
Number of unique home care clients 109,184 112,062 114,990 116,462 118,834 Data updated as of May 18, 2017 Surgery Wait Time: RTT (Ready to Treat to Treatment); DTT (Decision to Treat to Treatment) * Number Placed amended Aug. 10, 2017 from 8,002 to 7,963.

2016-17 | Alberta Health Services Annual Report
42
FINANCIAL INFORMATION
Financial Statement Discussion and Analysis Consolidated Financial Statements Compensational Analysis and Discussion

2016-17 | Alberta Health Services Annual Report
43
FINANCIAL STATEMENT DISCUSSION AND ANALYSIS For the year ended March 31, 2017 This Financial Statement Discussion and Analysis (FSD&A) is provided to enable readers to assess the results of Alberta Health Services’ (AHS) operations and financial condition for the year ended March 31, 2017. In particular, the FSD&A reports to stakeholders how financial resources are being managed to provide a patient-focused, quality health system that is accessible and sustainable for all Albertans. It serves as an opportunity to communicate with stakeholders and other report users regarding AHS’ 2016-17 financial performance, as well as significant financial policies, cost drivers, strategies and plans to address financial risk and sustainability. This FSD&A has been prepared by management and should be read in conjunction with the March 31, 2017 audited consolidated financial statements, notes, and schedules. The consolidated financial statements are prepared in accordance with Canadian Public Sector Accounting Standards (PSAS) and the Financial Directives issued by Alberta Health (AH). All amounts are presented in millions of dollars unless otherwise specified. Additional information about AHS including financial reports from prior periods is available on the AHS website at www.albertahealthservices.ca.

2016-17 | Alberta Health Services Annual Report
44
2016-17 FINANCIAL HIGHLIGHTS Recognizing the overall provincial fiscal climate and the economic challenges facing the Province of Alberta (Province), AHS continued its efforts to manage costs and maximize benefits within available resources. AHS has continued its efforts in supporting health services to meet the healthcare needs of Albertans, enhance effective service delivery, and develop business efficiency initiatives. The demands on the healthcare system continue to increase in Alberta, resulting in the need for new and different approaches to delivering healthcare at a time when AHS must continue to manage limited available resources. AHS has continued to focus on strengthening public health and primary care, improving access and flow, and enhancing community-based options. While expenses continued to increase, driven by a growing and aging population, and healthcare inflation, the current growth rate of expenses has decreased significantly compared to the average rate seen historically. The AHS 2016-17 budget was approved by the Minister of Health on June 29, 2016. The overall goal has been consistent: to ensure AHS’ resources are used to maximize benefits and to achieve the best results – timely, high quality, patient-centred, and effective health services and patient outcomes. AHS finished the year with a $67 annual operating surplus, reflecting 0.5% of total revenues primarily due to additional funding received at the end of the year. The strategic deferral of certain initiatives throughout the year, and an ongoing effort to find cost savings and efficiencies also contributed in enabling AHS to finish the year in a small surplus position. While expenses increased as a result of increasing demand for healthcare services and increasing costs to deliver those services, AHS has begun to slow the rate of increased spending while maintaining a focus on delivering high quality services. Faced with a challenging fiscal climate and limited resources, AHS continued to support current programs and services levels, while managing expenses. AHS continued to work internally and with external stakeholders, including AH, to implement and realize ongoing operational efficiencies. The identification and implementation of Operational Best Practices (OBP) in 2016-17 has led to marked improvements in the cost of delivering healthcare services, and will continue to be instrumental in supporting the long-term sustainability of the Alberta healthcare system.
Did You Know?
• Alberta’s population grew by 1.5% in 2016-17, which contributed to the growing need for healthcare services.
• Historically, AHS’ expenses have grown by over 6.0% per year.
• In 2016-17, expenses increased by 2.1% as compared to the prior year. For the next three years, expenses are budgeted to increase by an average of 1.8% per year.
• Health represents 40% of the
provincial budget in Alberta and AHS accounts for 70% of this amount.

2016-17 | Alberta Health Services Annual Report
45
ALIGNMENT TO THE 2016-17 HEALTH PLAN AND BUSINESS PLAN The 2016-17 Health Plan and Business Plan support the four AHS goals of building a culture of patient, family, and community-centred care to improve patient experience, improving health outcomes through clinical best practices, ensuring our people feel safe, healthy, and valued, and achieving financial sustainability through operational best practices. AHS continued to support current services to meet the healthcare needs of Albertans, while strategically delaying some targeted new investments in order to focus on addressing service pressures, strategic priorities, and enterprise risks. AHS is facing challenging times, operating in an environment of limited resources, rising healthcare costs and increasing demand and expectations for services. As a result, AHS has had to find cost savings and efficiencies in order to be financially sustainable, now and in the long-term. Focusing on how care is provided to patients and working to ensure clinical best practices and clinical appropriateness, AHS has had to reallocate resources to where care is needed most and make strategic investments within the limitations described above. Build a Culture of Patient-Centred Care to Improve Experience
• AHS continued to respond to the demand for continuing care by building and contracting new spaces across Alberta, opening 376 net new continuing care spaces in 2016-17. Creating community capacity has positive impacts for clients who need continuing care, and also improves system flow for individuals who need emergency and acute care services by freeing up capacity in these areas.
• Additional home care visits and an increase of 2.0% in the number of home care clients further supported Albertans remaining within their homes and local communities, avoiding hospital admissions, and reducing the demand on acute care services.
• AHS increased addiction and mental health capacity in the community. • AHS made additional investments in cancer care, including the purchase of high-tech equipment such as
linear accelerators as part of a continuing multi-year purchase plan, and through expanding access to cancer care in the community, as patients received cancer care at home and in cancer centres.
• AHS increased the number of courses of care delivered by midwives by over 400, increasing access to this maternity service.
• AHS and community partners took action together to increase support for opioid dependency treatment services throughout the province.
Health Outcomes and Clinical Best Practices
• As part of AHS’ continued efforts to improve patient experience, facility openings, enhancements and upgrades were carried out to ensure that quality and safe care continued to be provided to Albertans in clean and healthy environments.
• AHS continued to invest in Infrastructure Maintenance Program projects, as well as the procurement of equipment under the Medical Equipment Replacement and Upgrade Program.
• Increased surgical volumes of 2.3% resulted from a focus on surgical capacity management. • There was increased focus on ensuring appropriate clinical practice and innovation in various pathways
including Enhanced Recovery after Surgery, Inpatient Diabetes Management, Heart Failure, Chronic Obstructive Pulmonary Disease and Conservative Kidney Management.
• There was continued focus on finding new, efficient and innovative ways of delivering healthcare in order to improve the healthcare system through Strategic Clinical Networks, Primary Care Networks (PCNs), various clinical pathways, research, and education.
Our People
• AHS continued to focus on leadership development and learning initiatives. • The implementation of the Manager Preparation and Leadership Development Program enhanced the
capability of, and support to, frontline managers. • The successful rollout of a comprehensive workforce engagement and patient safety culture survey, with
increased organization-wide participation rates, took place in 2016-17. Survey results provided valuable feedback on what staff, physicians and volunteers need to feel safe, healthy, and valued.
2016-17 | Alberta Health Services Annual Report
46
Financial Health and Operational Best Practice
• With a focus on achieving operational efficiencies and continuing to reduce costs, AHS began the implementation of OBP in late 2015-16, which led to efficiencies in operations and will be expanded upon in 2017-18 and beyond.
o OBP is the practice of comparing AHS’ cost of providing healthcare services within Alberta, as well as externally, to ensure overall efficiency and quality care. Where necessary, changes will continue to be made to improve practices and reduce costs. Quality and patient safety are paramount while implementing OBP initiatives.
o The implementation of OBP operates under the principles of no reduction in core front-line services, an attrition only strategy, adherence to union collective agreements, and the commitment to quality and continuous improvement in the healthcare system.
• AHS implemented various information technology initiatives including increasing access to the Personal Health and Alberta Netcare web portals (part of the provincial electronic health record). Investments were also made in anticipation of the Provincial Clinical Information System (CIS) program, including development of wireless technology, data centres, and modernizing technological infrastructure, applications and end user devices.
• AHS continued to address and invest in services to meet clinical needs, while managing spending growth related to workforce compensation, clinical contract inflation, healthcare support, and physician fees.
As detailed throughout the annual report, these goals guided AHS in its delivery of health services throughout Alberta. As AHS enters its next planning cycle, there will be continued focus on strengthening public health and wellness while improving access, flow and community-based options. AHS will continue to focus on transforming the delivery of healthcare in a way that improves quality and, at the same time, save costs by enhancing care in the community and reducing the need for hospital admissions. Further discussion on the future outlook can be found at the end of the FSD&A.

2016-17 | Alberta Health Services Annual Report
47
FINANCIAL OVERVIEW Operations
AHS’ consolidated revenues in 2016-17 were $14,470, an increase of $515 as compared to 2015-16. The change was a result of increased funding received from AH and other government transfers, partially offset by lower fees and charges. Relative to the budget, revenues were higher due to increased investment and other income, and government funding, offset by lower fees and charges. AHS’ consolidated expenses in 2016-17 were $14,403, an increase of $303 as compared to 2015-16. The change was a result of increased activity resulting from an increased demand for services, continued implementation of priority initiatives, collective bargaining increases, and inflation, partially offset by the implementation of savings initiatives, including OBP, and a decrease in amortization expense. When compared to the budget, expenses were $85 higher largely due to increased activity and compensation costs. As AHS continued to find cost savings, while addressing the growing demand for healthcare services, there were delays in the implementation of planned savings initiatives, which are expected to be realized through the continued implementation of OBP. The overall variance was partially offset by vacancies, timing delays of initiatives, and cost mitigation strategies. In 2016-17, the provision of healthcare services for Albertans cost AHS an average of $39 per day (2015-16 – $39 per day). Financial Position AHS’ net debt position at March 31, 2017 was $35, a decrease of $66 from the prior year. Facilities, medical equipment, and information technology are integral to AHS’ clinical and business processes and are key enablers for innovation and transformation. AHS continued to invest in new facilities, various information technologies, as well as equipment purchases and upgrades in areas such as cancer care, emergency medical services (EMS), and surgical services. The AHS accumulated surplus at March 31, 2017 was $1,226 and consists of four main components: unrestricted surplus, internally restricted surplus for future purposes, invested in tangible capital assets, and endowments. The unrestricted surplus at March 31, 2017 of $212 does not have any restrictions attached to its future use. Internally restricted surplus for future purposes of $225 has been restricted internally by AHS for specific purposes, as approved by the Board. Invested in tangible capital assets of $714 represents tangible capital assets purchased with internal funds, and endowments of $75 are externally restricted and must be maintained in perpetuity.
2016-17 Highlights
• Total revenue exceeded budget by 1.1% and increased by 3.7% over 2015-16, with Alberta Health transfers accounting for 90% of total revenue.
• Total expenses were 0.6% higher than budget and increased by 2.1% over 2015-16. With a
number of efficiencies implemented, AHS has reduced the rate of spending.
• There was increased investment in continuing care, community care, and home care - a 3.4% increase over 2015-16.
• Inpatient and outpatient acute care expenses continued to increase, albeit at a lower growth rate - a 1.5% increase over 2015-16.
• At 3.3%, administration expense as a percentage of total expense remains amongst the lowest of all provinces and territories in Canada, according to the Canadian Institute for Health Information (CIHI).

2016-17 | Alberta Health Services Annual Report
48
FINANCIAL ANALYSIS STATEMENT OF OPERATIONS The Consolidated Statement of Operations shows the revenue earned by AHS and its application to provide health services. Revenue
Total 2016-17 revenues increased by $515 or 3.7% from 2015-16 and were higher by $152 or 1.1% compared to the budget. The overall increase in revenue from 2015-16 was primarily due to increased base operating transfers from AH, which is AHS’ primary source of funding. The AH funding comprised 90% (2015-16 – 89%) of total revenue in 2016-17. Revenues Budget
2017 Actual 2017
Variance 2017
Actual 2016
Increase (Decrease)
Alberta Health transfers $ 12,909 $ 12,965 $ 56 0.4% $ 12,480 $ 485 3.9% Other government transfers 408 456 48 11.8% 417 39 9.4% Fees and charges 513 479 (34) (6.6%) 491 (12) (2.4%) Ancillary operations 133 136 3 2.3% 133 3 2.3% Donations, fundraising and non-government contributions 150 164 14 9.3% 166 (2) (1.2%) Investment and other income 205 270 65 31.7% 268 2 0.7% Total revenues $ 14,318 $ 14,470 $ 152 1.1% $ 13,955 $ 515 3.7% Significant variances and changes are explained as follows:

2016-17 | Alberta Health Services Annual Report
49
Alberta Health transfers are comprised of all funding received from AH – unrestricted, restricted operating, and capital. Unrestricted AH transfers are the main source of operating funding to provide health-care services to the population of Alberta. Restricted operating and capital funding can only be used for specific purposes and are recognized when the related expenses are incurred. Consequently, the variances for restricted funding discussed below are directly attributed to the recognition of the related expense.
Alberta Health Transfers
Budget 2017
Actual 2017
Variance 2017
Actual 2016
Increase (Decrease)
Base operating $ 11,860 $ 11,860 $ - 0% $ 11,330 $530 4.7% One-time base operating - 50 50 - - 50 - Grant funding transferred to one-time base operating - 15 15 - - 15 - Other operating 968 953 (15) (1.5%) 1,065 (112) (10.5%) Recognition of expended deferred capital revenue 81 87 6 7.4% 85 2 2.4% Total AH transfers $12,909 $ 12,965 $56 0.4% $ 12,480 $485 3.9%
Base operating transfers amounted to $11,860, which is consistent with the budget.
Compared to the prior year, base operating transfers increased by $530 or 4.7% mainly due to base funding increases received in 2016-17 for the delivery of health services across Alberta, as well as the transition of various restricted grants into base operating funding.
One-time base operating and grant funding transferred to one-time base operating totalled $65, which was $65 higher compared to both the budget and the prior year amount of $nil mainly due to one-time base operating funding, and recognition of unexpended funds from restricted grants in prior years, which transitioned into base funding as unrestricted revenue.
Other operating transfers amounted to $953, which was $15 or 1.5% lower than the budget of $968 mainly due to vacancies in physician services programs, delayed implementation of various community, seniors, addiction and mental health initiatives, and reduced prices of certain specialized high cost drugs, all funded from restricted grants. The overall variance was partially offset by higher revenue resulting from increased physician remuneration paid under the Academic Alternate Relationship Plan programs, and the increased volume of outpatient drugs provided at no cost to patients, all of which are funded on a restricted basis. Compared to the prior year, other operating transfers decreased by $112 or 10.5% primarily due to the transition of various restricted grants into base operating funding, and a decline in specialized high cost drug prices. The overall decrease was partially offset by increased revenue resulting from a higher volume of outpatient drugs provided at no cost to patients, increased activity in various Academic Alternative Relationship Plan programs, and increases in physician compensation rates, all of which are funded on a restricted basis.
Recognition of expended deferred capital revenue was consistent with the budget and the prior fiscal year.
Other government transfers are comprised of funding from federal, provincial (other than AH), and municipal governments that can be unrestricted or restricted for operating or capital purposes. Restricted amounts received are recognized as revenue when the related stipulations are met. Revenues from other government transfers amounted to $456, which was $48 or $11.8% higher than the budget of $408 primarily due to revenue recognized in relation to the expense portion of infrastructure maintenance programs being higher than planned and, unbudgeted revenue recognized for the reimbursement of Fort McMurray wildfire costs. Compared to the prior year, other government transfers increased by $39 or 9.4% primarily due to an increased number of operating projects implemented for infrastructure maintenance, incremental revenue recognized for the amortization of externally funded tangible capital asset additions, partially offset by reductions related to externally funded tangible capital assets that were fully amortized in 2016-17, and revenue recognized for the reimbursement of Fort McMurray wildfire costs.

2016-17 | Alberta Health Services Annual Report
50
Fees and charges consist of patient revenue for health services provided at rates set by the Minister of Health, and collected by AHS from individuals, Workers’ Compensation Board (WCB), federal and provincial governments, and other parties, such as Alberta Blue Cross and other insurance companies. Revenues from fees and charges amounted to $479, which was $34 or 6.6% lower than the budget of $513 mainly due to the economic downturn in Alberta which resulted in fewer temporary workers (non-residents of Alberta or Canada) requiring healthcare services, as well as reduced acuity, and healthcare insurance coverage retroactively granted by AH to patients previously classified as non-residents of Canada. Compared to the prior year, revenue from fees and charges decreased by $12 or 2.4% mainly due to lower activity and acuity involving services billable to other Canadian jurisdictions, non-residents of Canada, and WCB, and healthcare insurance coverage retroactively granted by AH to patients previously classified as non-residents of Canada. The overall decrease was partially offset by increased reciprocal billing rates, long-term care accommodation fees, and higher activity and acuity involving services billable to the federal government. Ancillary operations consist of revenue from the sale of goods and services that are unrelated to the direct provision of health services, and include parking, non-patient food services, and rental operations. Revenue from ancillary operations were consistent with the budget and the prior year. Donations, fundraising and non-government contributions are comprised of revenue that can be unrestricted or restricted for operating or capital purposes. Revenue from donations, fundraising and non-government contributions amounted to $164, which was $14 or 9.3% higher than the budget of $150 mainly due to higher than anticipated revenue related to spending for various research studies and clinical trials. The overall variance was partially offset by lower revenue recognized due to lower than budgeted amortization expense for major equipment, which are restricted due to being funded by donations and non-government contributions. Revenue from donations, fundraising and non-government contributions were consistent with the prior year. Investment and other income is comprised of interest income, dividends, net realized gains and losses on disposal of investments, and recoveries from external sources other than ancillary operations. Included are revenues from third parties, such as drug and medical supply companies, and universities (for purposes other than research). Investment and other income amounted to $270, which was $65 or 31.7% higher than the budget of $205 mainly due to higher than budgeted recoveries for services provided to external entities, unbudgeted other income including a WCB surplus distribution, outpatient cancer drugs received at no cost from suppliers, and accrued Fort McMurray wildfire insurance proceeds.
Investment and other income was consistent with the prior year.

2016-17 | Alberta Health Services Annual Report
51
Expenses – By Object AHS reviews and reports expenses by object and by function in order to fully describe the results of current operations, strategic priorities, and new investments.
The overall distribution of expenses by object remained consistent with prior years, with salaries and benefits making up more than half of total expenses (2015-16 – 55%). Expenses continued to be driven higher by salaries and benefits both within AHS, and within contracts with health service providers, resulting from increased demand for healthcare services. Rate increases in union wages and benefits, as well as clinical contract inflation increases have also contributed to the variance.

2016-17 | Alberta Health Services Annual Report
52
Expenses Budget 2017
Actual 2017
Variance 2017
Actual 2016
Increase (Decrease)
Salaries and benefits $ 7,760 $ 7,983 $ (223) (2.9%) $ 7,742 $ 241 3.1% Contracts with health service providers 2,635 2,540 95 3.6% 2,451 89 3.6% Contracts under the Health Care Protection Act 18 20 (2) (11.1%) 19 1 5.3% Drugs and gases 425 450 (25) (5.9%) 417 33 7.9% Medical and surgical supplies 390 385 5 1.3% 414 (29) (7.0%) Other contracted services 1,173 1,107 66 5.6% 1,134 (27) (2.4%) Other expenses 1,330 1,367 (37) (2.8%) 1,334 33 2.5% Amortization, disposals and write-downs 587 551 36 6.1% 589 (38) (6.5%) Total expenses $ 14,318 $ 14,403 $ (85) (0.6%) $ 14,100 $ 303 2.1%
Significant variances and changes are explained as follows: Salaries and benefits are comprised of compensation for hours worked, vacation and sick leave, other cash benefits (which includes overtime), employer benefit contributions made on behalf of employees, and severance. Salaries and benefits amounted to $7,983, which was $223 or 2.9% higher than the budget of $7,760 mainly due to increased activity resulting in the need for higher worked hours. While AHS strived to make the best use of compensation related costs through sound leadership and implementation of OBP initiatives, low attrition rates limited the progress required to meet the budgeted savings plan. Compensation rate variances including shift differentials and weekend premium rate differences, as well as the insourcing of certain contracted positions also contributed to the variance. The overall increase was partially offset by vacant positions throughout AHS, the mediated contract for auxiliary nursing, and delayed initiatives resulting in hiring delays. Compared to the prior year, salaries and benefits increased by $241 or 3.1% mainly due to compensation rate variances and higher costs resulting from collective agreement settlements. AHS’ management, non-union and exempt employees continued to be included in the provincial government salary freeze. Increased activity also contributed to the variance as AHS continued to invest in priority new investments, resulting in an increase of 1.2% in worked hours, which includes overtime and relief hours. While the number of clinical operations and clinical support employees increased compared to the prior year, vacancies continued to persist throughout AHS resulting in increased costs for casual relief and overtime, which increased by 4.2% and 0.6%, respectively. Further contributing to the overall increase were compensation costs resulting from the insourcing of certain contracted positions, and additional costs arising from the Fort McMurray wildfire. The overall increase was partially offset by the achievement of cost containment strategies, including OBP. Calculated Full Time Equivalents (FTE) amounted to 78,434 FTE compared to the prior year of 77,007 FTE, resulting in an increase of 1,427 or 1.9%. Calculated FTEs are determined by actual hours earned divided by 2,022.75 annual base hours for fiscal 2017. This is a decrease from the previous 2,030.50 annual base hours used in fiscal 2016. The decrease in the annual base hours was due to 2016 being a leap year, resulting in one additional day in the prior fiscal year. The overall increase in FTEs was primarily due to increased worked hours. Clinical positions, including medical doctors, regulated nurses, health technical and professional staff, and unregulated health service providers account for 48,977 FTEs, which was an increase of 1.8% compared to the prior year. Other Staff, which include support services such as food services, facilities and maintenance, clerical staff, and secretarial support, account for 26,383 FTEs, which was an increase of 2.1% compared to the prior year, primarily due to insourcing. Total management accounts for 3,052 FTEs, which was an increase of 0.9% compared to the prior year.

2016-17 | Alberta Health Services Annual Report
53
Contracts with health service providers include voluntary and private health service providers with whom AHS contracts for health services, such as long-term care facilities, acute care providers, home care providers and lab service providers. Contracts with health service providers amounted to $2,540, which was $95 or 3.6% lower than the budget of $2,635 mainly due to timing delays of budgeted initiatives, lower than anticipated clinical contract inflation due to the implementation of a revised methodology based on the Consumer Price Index, and mitigation strategies to reduce spending. The overall variance was partially offset by higher than budgeted activity, due in part to the continued expansion of home care services in response to increased home care clients, resulting in increased vendor hours. Compared to the prior year, contracts with health service providers increased by $89 or 3.6% mainly due to increased activity, particularly in community-based care, facility-based care and home care, with the addition of 376 net new beds as a result of planned initiatives including Continuing Care Capacity Plan and supportive living initiatives. Further contributing to the increased costs were collective agreement costs and clinical contract inflation. Contracts under the Health Care Protection Act relates to contracts with surgical facilities pursuant to the Health Care Protection Act which ensures quality while promoting the delivery of publicly funded services by allowing contracting out to profit-orientated surgical facilities. Costs associated with Contracts under the Health Care Protection Act were consistent with budget and the prior fiscal year. Drugs and gases include all drugs used by AHS, including medicines, certain chemicals, anaesthetic gas, oxygen, and other medical gases used for patient treatment. Drugs used for purposes other than patient treatment such as diagnostic reagents, are not included in this category, and are reported in other expenses. Drugs and gases amounted to $450, which was $25 or 5.9% higher than the budget of $425 mainly due to higher drug utilization due to new cancer drugs added to the cancer grant, as approved by the Minister of Health. The overall variance was partially offset by price changes and higher than budgeted drug rebates. Compared to the prior year, drugs and gases increased by $33 or 7.9% mainly due to higher drug utilization due to new cancer drugs added to the cancer grant as noted above, as well as increased demand for specialized drugs. The overall variance was partially offset by price changes on certain specialized high cost drugs as well as higher drug rebates. Medical and surgical supplies include prostheses, instruments used in surgical procedures and in treating and examining patients, sutures, and other supplies. Costs associated with medical and surgical supplies were consistent with the budget. Compared to the prior year, medical and surgical supplies decreased by $29 or 7.0% mainly due to a decision during the year, in which AHS decided to treat value added benefits as a reduction to the cost of the contract the benefits are associated with. The achievement of cost containment strategies, including OBP also contributed to the variance. The overall decrease was partially offset by increased activity in surgical procedures.

2016-17 | Alberta Health Services Annual Report
54
Other contracted services are payments to those under contract that are not considered to be employees. This category includes payments to physicians for referred-out services and purchased services, as well as home support contracts and various self-managed care contracts. Other contracted services amounted to $1,107, which was $66 or 5.6% lower than the budget of $1,173 mainly due to hard-to-recruit physician vacancies and the insourcing of certain contracted positions. Timing variances associated with the implementation of various budgeted initiatives further contributed to the variance, as well as the continued achievement of cost control strategies implemented by AHS. The overall positive variance was partially offset by increased activity relating to the Academic Alternative Relationship Plan, and in the areas of genetic testing within lab services, as well as diagnostic imaging. Compared to the prior year, other contracted services decreased by $27 or 2.4% mainly due to performing more functions in house which were previously contracted out. The overall decrease over the prior year is partially offset by increased activity, in particular, resulting from the Academic Alternative Relationship Plan, and contract inflation mainly relating to the areas of diagnostic and therapeutic services and home care. Other expenses relate to those expenses not classified elsewhere. Other expenses amounted to $1,367, which was $37 or 2.8% higher than the budget of $1,330 mainly due to additional Infrastructure Maintenance Program projects, higher one-time information technology hardware and infrastructure costs, as well as increased activity. An insurance deductible relating to an overland flood, costs relating to the Fort McMurray fire, and delays in the implementation of savings initiatives also contributed to the variance. The overall variance was partially offset by mitigation strategies relating to general supplies, travel, minor equipment purchases, reduced operating parking projects, and delays in budgeted initiatives. Compared to the prior year, other expenses increased by $33 or 2.5% mainly due to increased costs due to higher activity, including infrastructure and equipment maintenance costs, leases, and costs related to the Fort McMurray wildfire. The overall increase was partially offset by achieved savings initiatives including decreased spending on general costs, such as travel and supply costs, minor equipment purchases and reduced project costs, such as parking related initiatives. Amortization, disposals and write-downs relates to the periodic charges to expenses representing the estimated portion of the cost of the respective tangible capital asset that expired through use and age during the period.
Amortization, disposal and write-downs amounted to $551, which was $36 or 6.1% lower than the budget of $587, mainly due to both timing differences between anticipated and actual purchases and lower capitalized costs, particularly with respect to information technology systems and equipment. In addition, changes to the expected completion costs and deployment date of system and facilities projects further contributed to the variance. Compared to the prior year, amortization, disposal and write-downs decreased by $38 or 6.5%, mainly due to the impact realized from assets that were fully amortized over the course of the current and prior year, particularly within facilities, information technology systems, and equipment. The overall decrease was partially offset by increased deployment of facilities and building service equipment compared to the prior year.

2016-17 | Alberta Health Services Annual Report
55
Expenses – By Function
The overall 2.1% increase in 2016-17 expenses was primarily due to increased salary and benefit costs, and contracts with health service provider costs, offset by a decrease in medical and surgical supplies, other contracted services and amortization expense. AHS’ overall distribution of expenses has remained consistent with prior years, with inpatient acute nursing services and diagnostic and therapeutic expenses making up 39% of total expenses (2015-16 – 39%). Focusing on community-based care and capacity, there were higher relative increases in these areas, as compared to inpatient acute nursing services. Enhancing the care in communities should ease the pressures on hospitals, while ensuring the right services are offered to support the growing and aging population of Alberta. Total expenses have increased annually due to continued cost pressures such as, salary rate increases related to collective agreement settlements, increased activity, planned initiatives, and inflation.

2016-17 | Alberta Health Services Annual Report
56
Expenses Budget 2017
Actual 2017
Variance 2017
Actual 2016
Increase (Decrease)
Inpatient acute nursing services * $ 3,235 $ 3,169 $ 66 2.0% $ 3,130 $ 39 1.2% Emergency and other outpatient services 1,646 1,672 (26) (1.6%) 1,641 31 1.9% Facility-based continuing care services 1,080 1,053 27 2.5% 1,043 10 1.0% Ambulance services 479 498 (19) (4.0%) 479 19 4.0% Community-based care 1,317 1,249 68 5.2% 1,192 57 4.8% Home care * 611 585 26 4.3% 556 29 5.2% Diagnostic and therapeutic services * 2,273 2,400 (127) (5.6%) 2,344 56 2.4% Promotion, prevention and protection Services * 393 355 38 9.7% 353 2 0.6% Research and education * 240 285 (45) (18.8%) 278 7 2.5% Administration 458 478 (20) (4.4%) 434 44 10.1% Information technology 572 513 59 10.3% 572 (59) (10.3%) Support services * 2,014 2,146 (132) (6.6%) 2,078 68 3.3% Total expenses $ 14,318 $ 14,403 $(85) (0.6%) $ 14,100 $303 2.1%
* During the year, certain costs were reclassified within the expenses by function categories to better align with
the Canadian Institute of Health Information (CIHI) standards and definitions. This allowed AHS to improve comparability with other health entities across Canada, and enable better discussions to identify operational differences and efficiencies. Reclassifications were made for the years ended March 31, 2017, and the March 31, 2016 comparative financial statements. The 2016-17 budget however, was not adjusted and reflects the original Board approved budget at the start of the fiscal year. This significantly impacts the budget to actual variances for some functions, which are identified below. The reclassifications did not impact expenses by object, or the annual surplus on the Statement of Operations.
Significant variances and changes are explained as follows: Inpatient acute nursing services are comprised predominantly of patient care units such as medical, surgical, intensive care, obstetrics, pediatrics, and mental health. This category also includes operating and recovery rooms. Inpatient acute nursing services amounted to $3,169, which was $66 or 2.0% lower than the budget of $3,235 mainly due to the unbudgeted reclassification of $141 out of inpatient acute nursing services, to better align with CIHI standards and definitions, as noted above. Excluding this reclassification, inpatient acute nursing services would have been higher than budget by $75, mainly due to delayed implementation of savings initiatives, zone activity including increased elapsed patient days and surgical activity, as well as activity levels related to unfunded transition beds and units. Increased activity also resulted in compensation rate variances due to shift premiums and the incurrence of overtime and relief coverage. The variance was partially offset by vacancies related to physician and staff positions, settlement of union agreements, lower contract inflation, timing delays of new investments, and the achievement of cost containment strategies. Compared to the prior year, inpatient acute nursing services increased by $39 or 1.2% mainly due to increased compensation costs related to collective agreements, which also resulted in increased contract costs for health service providers. While elapsed patient days remained relatively constant compared to the prior year, there were increases in various other activities, including surgical activity, in line with the planned increase in procedural access, as well as increased activity under the Academic Alternative Relationship Plan and the Alternative Relationship Plan. Increased activity also resulted in increased staffing costs. The overall increase was partially offset by savings due to the achievement of OBP initiatives.

2016-17 | Alberta Health Services Annual Report
57
Emergency and other outpatient services are comprised primarily of emergency, day/night care, clinics, day surgery, and contracted surgical services. Emergency and other outpatient services amounted to $1,672, which was $26 or 1.6% higher than the budget of $1,646 mainly due to delayed implementation of savings initiatives, increased cancer drug utilization, and increased activity, particularly within clinics and to a lesser extent, emergency visits. Further contributing to the variance were compensation rate variances due to shift premiums. The overall variance was partially offset by staff and physician vacancies, various cost containment strategies, union settlements, some timing delays in new investments and initiatives, and market rate fluctuations for high cost drugs. Compared to the prior year, emergency and other outpatient services increased by $31 or 1.9% mainly due to increased drug utilization as additional new cancer drugs were made available in the current year. The increase in activity within various areas including surgical, cardiac sciences, and day/night clinics, also contributed to the increase in drug usage and overall costs. While emergency visits decreased year-over-year, this was offset by an increase in the number of urgent visits as compared to non-urgent visits. Increased compensation costs related to collective agreements, and increased activity, particularly in the area of surgical cases, also contributed to the increase. The overall increase was partially offset by cost mitigation strategies and OBP savings implemented during the year as well as drug price reductions and rebates. Facility-based continuing care services are comprised of long-term care including chronic and psychiatric care in facilities operated by AHS and contracted providers. Facility-based continuing care services amounted to $1,053, which was $27 or 2.5% lower than the budget of $1,080 mainly due to lower contract inflation, union settlements, and vacancies. The overall variance was partially offset by compensation rate variances due to shift premiums. Compared to the prior year, facility-based continuing care services increased by $10 or 1.0% mainly due to increased long-term care capacity. Ambulance services are comprised of ground ambulance, air ambulance, patient transport, and Emergency Medical Services (EMS) central dispatch. AHS also supports community paramedic programs, as well as other programs that support the learning, development, quality and safety of EMS professionals. Ambulance services amounted to $498, which was $19 or 4.0% higher than the budget of $479 mainly due to increased activity resulting in higher relief coverage and overtime, as well as the extension of dispatch contracts, which were budgeted to be partial year contracts. Compensation costs relating to the Fort McMurray wildfire also contributed to the variance. The overall variance was partially offset by vacancies.
Compared to the prior year, ambulance services increased by $19, or 4.0% mainly due to union settlements, contract inflation, and salaries and benefit costs related to additional front-line responders as a result of the Fort McMurray wildfire. Community-based care refers to the services provided to those who need care and support in their living environments including supportive living, and palliative and hospice care, but excludes community-based dialysis, oncology, and surgical services. This category also consists of community programs including Primary Care Networks, Family Care Clinics, urgent care centres, and community mental health. Community-based care amounted to $1,249, which was $68 or 5.2% lower than the budget of $1,317 mainly due to delays in budgeted initiatives, in particular the Continuing Care Capacity Plan, and vacancies. Further contributing to the variance was a reduction in costs relating to travel, hiring and administrative costs, and reduced clinical contract inflation. The overall decrease was partially offset by the delayed implementation of savings initiatives and increased activity resulting from higher demand in areas such as, adult housing initiatives and correctional facilities.
Compared to the prior year, community-based care increased by $57 or 4.8% mainly due to increased capacity under the Continuing Care Capacity Plan and supportive living initiatives. Further contributing to the variance were higher compensation costs related to collective agreements. The overall variance was partially offset by mitigation of costs related to supplies and travel.

2016-17 | Alberta Health Services Annual Report
58
Home care is comprised of home nursing and support. Home care amounted to $585, which was $26 or 4.3% lower than the budget of $611 mainly due to delayed initiatives and the unbudgeted reclassification of $12 out of home care, to better align with CIHI standards and definitions, as noted above. Reduced administrative, travel, relief and overtime costs, in addition to vacancies, further contributed to the variance. The overall variance was partially offset by higher activity stemming from increased demand which resulted in increased home care hours and costs.
Compared to the prior year, home care increased by $29 or 5.2% mainly due to increased activity resulting from increased home care clients and unique client visits, as well as increased contract inflation costs.
Diagnostic and therapeutic services support and provide care for patients through clinical lab (both in the community and acute), diagnostic imaging, pharmacy, acute and therapeutic services such as physiotherapy, occupational therapy, respiratory therapy, and speech language pathology. Diagnostic and therapeutic services amounted to $2,400, which was $127 or 5.6% higher than the budget of $2,273 mainly due to the unbudgeted reclassification of $64 in to diagnostic and therapeutic services to better align with CIHI standards and definitions, as noted above. Excluding this reclassification, diagnostic and therapeutic services would have continued to exceed budget, but to a lesser extent, of $63, due to delays in the implementation of savings initiatives, and higher compensation benefit and rate variances. Increased activity throughout AHS such as, increased referred-out specialized testing, changes in the mix of exams resulting in higher cost procedures, and staff premiums also contributed to the variance. The overall variance was partially offset by vacancies, reduced relief and overtime costs, and decreases in minor purchases and office supplies. Delayed initiatives and reduced amortization expense resulting from timing differences between anticipated and actual purchases also offset the overall variance. Compared to the prior year, diagnostic and therapeutic services increased by $56 or 2.4% mainly due to compensation increases related to collective agreements, increased activity throughout the organization, and contract inflation particularly within laboratory services. Further contributing to the variance is higher activity resulting from new facilities, and from initiatives such as the Continuing Care Capacity Plan, cancer care, and surgical initiatives. The overall increase was partially offset by reduced amortization expense resulting from a declining diagnostic and therapeutic capital asset base, achieved savings initiatives and reduced contract pricing for cardiac devices. Promotion, prevention and protection services are comprised primarily of health promotion, disease and injury prevention, and health protection. Promotion, prevention and protection services amounted to $355, which was $38 or 9.7% lower than the budget of $393 mainly due to the unbudgeted reclassification of $12 out of promotion, prevention and protection services to better align with CIHI standards and definitions, as noted above. Vacancies, the reduction of general expenses such as travel, supply and hiring costs, and delays in hiring for various budgeted initiatives also contributed to the variance. Promotion, prevention and protection services were consistent with the prior fiscal year. Research and education is comprised primarily of costs pertaining to formally organized health research and graduate medical education, primarily funded by donations, and third party contributions. Research and education amounted to $285, which was $45 or 18.8% higher than the budget of $240 mainly due to the unbudgeted reclassification of $51 in to research and education to better align with CIHI standards and definitions, as noted above. Excluding this reclassification, research and education would have been consistent with the budget. Research and education costs were consistent with the prior year.

2016-17 | Alberta Health Services Annual Report
59
Administration is comprised of human resources, finance, communications and general administration, as well as a share of administration of certain contracted health service providers. General administration includes senior executives and many functions such as planning and development, infection control, quality assurance, patient safety, insurance, privacy, risk management, internal audit, and legal. Activities and costs directly supporting clinical activities are excluded. In 2016-17 AHS’ administration expense was $478 which represents 3.3% (2015-16 – 3.1%) of total expenses. The Canadian Institute for Health Information (CIHI) reports administration expense as a financial performance indicator calculated based on administration expense, net of recoveries, and total expenses, net of recoveries and inclusive of bad debt expense. For 2016-17 AHS’ indicator was 3.3% (2015-16 – 3.1%).
Administration amounted to $478, which was $20 or 4.4% higher than the budget of $458 mainly due to an insurance deductible for an overland flood, higher legal and arbitration costs, and increased information technology costs. Also contributing to the variance were higher liability insurance claims and higher compensation and benefit rate variances. The overall increase was partially offset by vacancies and the mitigation of costs related to recruitment, travel, and supplies. Compared to the prior year, administration increased by $44 or 10.1% mainly due to higher insurance expenses resulting from higher liability claims and property settlements, and increased legal and reinsurance expense. A higher provision for unpaid claims, including increased insurance deductibles, also contributed to the variance. The overall variance was partially offset by achieved savings initiatives and reduced office costs. Information technology is comprised of costs pertaining to the provision of services to design, develop, implement, and maintain effective and efficient management support systems in the areas of data processing, systems engineering, technical support, and systems research and development. This includes clinical and corporate enterprise systems and infrastructure, as well as support of provincial systems such as, Alberta Netcare. Information technology amounted to $513, which was $59 or 10.3% lower than the budget of $572 mainly due to lower amortization resulting from changes in system project completion costs, deployment dates, and timing differences between anticipated and actual purchases. Lower project expenditures, timing delays with budgeted initiatives, and vacancies also contributed to the variance. Reduced travel, education and purchased service costs further contributed to the variance. The overall decrease was partially offset by unbudgeted contract growth, inflation, market rate fluctuations, and minor equipment purchases. Compared to the prior year, information technology decreased by $59 or 10.3% mainly due to reduced amortization expense resulting from a declining information technology capital asset base arising from a slowdown in the reinvestment of related assets, and increased savings due to the insourcing of several information technology services. Reduced spending on projects due to prioritization in order to align with organizational objectives and human resource capacity also contributed to the variance. The overall decrease was partially offset by reduced vacancies resulting from increased staffing levels required to support the organization, which also resulted in higher minor equipment purchases.

2016-17 | Alberta Health Services Annual Report
60
Support services are comprised of building maintenance operations (including utilities), materials management (including purchasing, central warehousing, distribution and sterilization), housekeeping, patient registration, health records, food services, and emergency preparedness. Support services amounted to $2,146, which was $132 or 6.6% higher than the budget of $2,014 mainly due to the unbudgeted reclassification of $25 in to support services to better align with CIHI standards and definitions, as noted above. Excluding this reclassification, support services would have continued to exceed budget, but to a lesser extent, of $107 mainly due to higher compensation and benefit rate variances, and increased activity including the completion of projects, particularly with respect to the Infrastructure Maintenance Program. Further contributing to the variance are higher amortization expenses resulting from timing differences related to capital expenditures, higher equipment purchases relating to Alberta Infrastructure (AI) projects, continued work resulting from the Fort McMurray wildfire and delayed implementation of savings initiatives. The overall increase was partially offset by vacancies, cost mitigation strategies, including reduced travel and supply costs, delayed initiatives, and general hiring delays. Compared to the prior year, support services increased by $68 or 3.3% mainly due to increased Infrastructure Maintenance Program costs, higher benefit and compensation rate variances, and increased amortization costs due to the deployment of facilities. Further contributing to the variance were costs for new and upcoming facility openings, implementation of strategic new initiatives, as well as continued work resulting from the Fort McMurray wildfire. The overall increase was partially offset by cost mitigation strategies, including reduced parking projects and lower general purchases.

2016-17 | Alberta Health Services Annual Report
61
STATEMENT OF FINANCIAL POSITION
Consolidated Statement of Financial Position Actual 2017
Actual 2016
Increase (Decrease)
Cash $ 46 $ 80 $ (34) Investments 2,265 2,188 77 Total cash and investments 2,311 2,268 43 Accounts receivable 386 393 (7) Total financial assets 2,697 2,661 36 Accounts payable and accrued liabilities 1,210 1,236 (26) Employee future benefits 653 621 32 Unexpended deferred operating revenue 411 430 (19) Unexpended deferred capital revenue 138 148 (10) Debt 320 327 (7) Total liabilities 2,732 2,762 (30) Net debt (35) (101) (66) Tangible capital assets 7,619 7,573 46 Inventories for consumption 92 94 (2) Prepaid expenses and other non-financial assets 128 128 - Total non-financial assets 7,839 7,795 44 Expended deferred capital revenue 6,549 6,530 19 Net assets $ 1,255 $ 1,164 $ 91 Accumulated surplus $ 1,226 $ 1,159 $ 67 Accumulated remeasurement gains 29 5 24
AHS prepares its financial statements using the net debt presentation which emphasizes financial vs. non-financial assets on the Consolidated Statement of Financial Position. Net debt provides a measure of the future revenues required by AHS to pay for past transactions and services. It provides information regarding the extent to which the expenditures of the accounting period are met by the revenues recognized in the Consolidated Statement of Operations during the period.

2016-17 | Alberta Health Services Annual Report
62
Financial Assets Financial assets are the financial resources available to AHS for settling its liabilities or to finance future activities. Cash and Investments AHS receives its base operating funding from AH on a semi-monthly basis. The arrangement allows AHS to manage its operating cash balances effectively to meet its immediate and ongoing liabilities as they become due. AHS’ investment portfolio employs a conservative strategy and is highly liquid in nature, enabling AHS to respond to cash flow requirements quickly and efficiently. Focusing on prudent stewardship of funds, AHS monitors its bank balances closely and transfers cash to or from its investment portfolio to ensure that cash balances earn maximum returns until they need to be utilized. Cash and investments increased during the year by $43 due to higher operating and restricted funding received, offset by slightly higher expense growth year over year. AHS’ investment portfolio generated a return of 2.9% during 2016-17 (2015-16 - 3.7%). AHS’ investment portfolio benefited from growth returns from its equity investments offset by lower yielding fixed income investments. The cash and investment balance of $2,311 will be used to cover future liabilities including accounts payable and accrued liabilities, unexpended deferred operating revenue, unexpended deferred capital revenue, and debt. AHS has an investment philosophy designed to ensure that its funds are invested in a way that promotes the short and long-term sustainability of AHS’ operations. The investment philosophy assures preservation of capital by minimizing exposure to undue risk of loss or impairment, while maintaining a reasonable expectation of fair return or appreciation while offsetting the effects of inflation. This strategy protects the original capital while providing reasonable returns with a conservative exposure to more volatile equity markets. As at March 31, 2017, management believes that the current balance is appropriate to cover immediate and upcoming obligations as they become due. Accounts Receivable Accounts receivable decreased by $7 during the year mainly as a result of a decline in patients’ receivables of $13 offset by a net increase in operating and capital transfers receivable from AH and AI respectively, amounting to $6.

2016-17 | Alberta Health Services Annual Report
63
Liabilities Liabilities are existing financial obligations at the date of the financial statements. Accounts Payable and Accrued Liabilities Accounts payable and accrued liabilities decreased by $26 compared to prior year. The decrease is mainly attributed to earlier remittances of statutory payroll deductions compared to prior year as well as retroactive payments related to the ratification of collective bargaining agreements which resulted in the related payables and accruals declining by $128. This was offset by an increase of $102 in trade accounts payable and other liabilities mainly due to timing of payments. Employee Future Benefits Employee future benefits, which is comprised of vacation and accumulated non-vesting sick leave liability, increased by $32, mainly due to the vacation liability, which increased by $26 due to salary rate increases related to collective agreement ratifications which occurred in the year. Unexpended Deferred Operating Revenue Unexpended deferred operating revenue is comprised of unspent operating funds that have been received by AHS for which spending restrictions, imposed by a funder or donor, exist. During the year, AHS received or accrued, net of repayments, interest income, and unrealized gains/losses, $1,151 in restricted funding. An additional $47 was transferred from unexpended deferred capital revenue to fund operating initiatives. AHS recognized $1,217 of offsetting revenue, reflecting the amount spent in related expenses. Unexpended Deferred Capital Revenue Unexpended deferred capital revenue is comprised of unspent capital funds that have been received by AHS for which spending restrictions, imposed by donors, exist. During the year, AHS received or accrued, net of repayments, $459 in restricted capital funding of which $216 comprised a transfer of tangible capital assets from AI. AHS incurred $422 in offsetting capital expenditures and transferred $47 to unexpended deferred operating revenue to fund operating initiatives. Debt AHS issues debentures to Alberta Capital Financing Authority (ACFA) to finance the construction of parking facilities and for Energy Savings initiatives. AHS pledges the revenue derived from all parking facilities as security for the debentures, while for Energy Savings initiatives, land at the respective sites has been pledged as security. During the year, a $52 debenture was issued of which $5 in debt proceeds was received to begin financing the construction of a parking facility at the Foothills Medical Centre in Calgary. The remainder will be drawn by March 2018. A second debenture totalling $26 was issued in the year. Of this amount, $5 in debt proceeds was received in the year to begin financing Energy Savings initiatives at the Royal Alexandra Hospital and Alberta Hospital in Edmonton. The remainder is expected to be drawn by December 2017. The net principal repayments in the year on all outstanding debt amounted to $17. AHS has access to a $220 revolving demand loan facility with a Canadian chartered bank, which may be used for operating purposes. This facility was not utilized during the year. Additionally, AHS has access to a $33 revolving demand letter of credit facility of which $3 in letters of credit was outstanding as at March 31, 2017 (March 31, 2016 - $3).

2016-17 | Alberta Health Services Annual Report
64
Non-Financial Assets Non-financial assets are assets that AHS uses when providing services to the public and are not intended to be monetized for settling its liabilities with external parties. Tangible Capital Assets
Actual 2017
Actual 2016 Increase
Cost $ 14,606 $ 14,054 $ 552 Accumulated amortization 6,987 6,481 506 Net book value $ 7,619 $ 7,573 $ 46
Over the course of the year, several capital projects totalling $590 previously included in work in progress (WIP), were brought into service. Notable projects included the Medicine Hat Regional Hospital Renovation and Redevelopment Facility, High Prairie Health Complex, Royal Alexandra Hospital – Concurrent Disorders Capable Treatment Continuum Facility, Edson Healthcare Centre – Continuing Care Centre and The Stollery Pediatric Surgical Suite Expansion Facility. The remaining WIP balance of $914 includes infrastructure and information technology capital projects at the following sites:
• Grande Prairie Regional Hospital • Foothills Medical Centre • University of Alberta Hospital • Red Deer Regional Hospital Centre • Lethbridge Chinook Regional Hospital • Northern Lights Regional Health Centre
• Taber Health Centres Renovation • Peter Lougheed Centre • Northern Alberta Urology Centre
At March 31, 2017, AHS had approved capital commitments to purchase tangible capital assets of $157 for facilities and improvements, $10 for information systems, and $58 for equipment. Financing of Tangible Capital Assets AHS primarily relies on transfers from AI for funding the acquisition of tangible capital assets. Facilities and building service equipment were 90% externally funded (2015-16 – 94%), equipment purchases were 52% externally funded (2015-16 – 69%) and information technology equipment purchases were 20% externally funded (2015-16 – 51%). The general decline in the percentage of externally funded tangible capital assets in the current year is mainly the result of increased capital financing from AHS’ accumulated surplus compared to the prior year. Expended Deferred Capital Revenue Expended deferred capital revenue represents funding received from donors which has been spent on the acquisition of tangible capital assets but has not yet been recognized in the Consolidated Statement of Operations through matching with the related amortization expense. Tangible capital assets acquired with donor funding are utilized for the duration of their economic useful lives, and on the same basis, AHS recognizes revenue equivalent to the amortization expense charged as the assets are utilized. The assets include hospitals and other related facilities, equipment and information systems. Funding from the GOA, mainly AI, represents $6,368 (97%) of the $6,549 total balance

2016-17 | Alberta Health Services Annual Report
65
Accumulated Surplus
Actual 2017
Actual 2016
Increase (Decrease)
Accumulated surplus $ 1,226 $ 1,159 $ 67 Less: Invested in tangible capital assets (714) (677) (37) Less: Internally restricted surplus for future purposes (225) (284) 59 Less: Endowments (75) (73) (2) Unrestricted surplus $ 212 $ 125 $ 87
The unrestricted surplus of $212 at March 31, 2017 does not have any restrictions attached to its future use and may be used at AHS’ discretion for operating or capital purposes. The accumulated surplus invested in tangible capital assets at March 31, 2017 of $714 represents the net book value of tangible capital assets that have previously been purchased with AHS’ unrestricted surplus. AHS has no plans to monetize these assets to cover future operations The internally restricted surplus for future purposes at March 31, 2017 of $225 has been approved by the Board for future purposes. The reduction in the internally restricted surplus is primarily due to the Clinical Information System capital reserve having been collapsed as AH is now funding this project through a multiyear funding program and, as such AHS no longer has the requirement for this specific reserve.
The endowments of $75 are comprised of financial resources received by AHS where the principal amount is maintained in perpetuity and investment income earned on the principal is available for use as stipulated by the endowment donors. Endowment contributions in the year amounted to $2. HISTORICAL 5-YEAR INFORMATION
Select Annual Financial Information Years Ended March 31
Actual 2017
Actual 2016
Actual 2015
Actual 2014
Actual 2013
Revenue $ 14,470 $ 13,955 $ 13,828 $ 13,221 $ 12,685 Expenses 14,403 14,100 13,827 13,062 12,578 Annual surplus (deficit) $ 67 $ (145) $ 1 $ 159 $ 107 Accumulated surplus $ 1,226 $ 1,159 $ 1,304 $ 1,303 $ 1,144
REVENUE

2016-17 | Alberta Health Services Annual Report
66
FINANCIAL REPORTING, CONTROL AND ACCOUNTABILITY Alberta Health Services was established under the Regional Health Authorities Act (Alberta), effective April 1, 2009, as a result of the amalgamation of 12 formerly separate health entities in Alberta. The AHS consolidated financial statements have been prepared in accordance with Canadian Public Sector Accounting Standards and the financial directives issued by Alberta Health. The chart of accounts that AHS uses to report expenses by function and by object is based on the national standard of CIHI. Detailed site-based results are submitted to CIHI annually for analysis and reporting on Canada’s health system and the health of Canadians. AHS’ annual financial reports are available at www.ahs.ca under data, statistics, and reporting. An effective, integrated governance model is an essential component in support of improving:
• the delivery of care and services to Albertans; • support for people who deliver care and services; and • the way the organization operates.
AHS performance measures are aligned with the Alberta Quality Matrix for Health, a framework that provides a common language, understanding and approach for thinking about quality among health-care organizations, professionals and other stakeholders. The Board provides oversight and carries out its risk management mandate primarily through sub committees, which include the Audit & Risk Committee, Finance Committee, Quality & Safety Committee, Governance Committee, Human Resources Committee, and Community Engagement Committee. The Audit & Risk Committee has the responsibility to assist in fulfilling the oversight responsibilities of the Board with respect to management and compliance, external financial reporting, internal controls over financial reporting, internal audit, and the external audit. The Finance Committee has responsibility to assist in fulfilling the financial oversight responsibilities of the Board such as including those pertaining to the Health Plan, Business Plan, budget, and its investment portfolio. AHS has established an Internal Audit function with the mandate of providing independent advisory and assurance services to management and the Board on AHS operations. The scope of Internal Audit’s work is to determine whether AHS’ risk management, control and governance processes are adequate and functioning effectively. The Chief Audit Executive is also responsible for coordinating AHS’ Enterprise Risk Management function including development and implementation of policies and processes for identifying, monitoring, and reporting risks within the organization. As a component of the Internal Audit function, AHS has an Internal Controls over Financial Reporting (ICOFR) group, which is tasked with ensuring that the financial reporting environment mitigates the risk of material misstatements by establishing a sustainable framework of internal controls over financial reporting. In fulfilling its mandate, ICOFR continues to work on the implementation of its plan to ensure that appropriate internal controls are designed, implemented, and documented within AHS. The Auditor General of Alberta is the appointed external auditor of AHS. In addition to expressing an audit opinion on the AHS annual consolidated financial statements, the Auditor General of Alberta also reports to the legislature recommendations related to AHS along with other government entities. The Auditor General of Alberta’s reports are available at www.oag.ab.ca under public reports.
FORWARD-LOOKING STATEMENTS DISCLOSURE The FSD&A includes forward-looking statements and information about the organization’s outlook, direction, operations, and future financial results that are subject to risks, uncertainties, and assumptions. As a consequence, actual results in the future may differ materially from any conclusion, forecast or projection in such forward-looking statements. Therefore, forward-looking statements should be considered carefully and undue reliance should not be placed on them.

2016-17 | Alberta Health Services Annual Report
67
Outlook Over the next 3 years, AHS must operate within the budget approved by the Minister of Health while also meeting the priorities of Albertans. Starting in 2017-18, funding will be provided for enhancing community and home care, and will allow patients and families to have more responsibility for their healthcare. The plan will also include the funding needed to delivery our current programs and services and will take into account the budget challenges we face as an organization in the current provincial fiscal environment. AHS must continue to maximize every dollar we invest in order to deal with the cost drivers described in the previous sections. AHS must continue to improve how we work so that we can offset the costs of a growing and aging population, reallocate resources to where they are most needed, and make strategic investments within the infrastructure and programs of the health system. For 2017-20, expenses are budgeted to grow by less than 2% per year. While AHS has seen a decrease in the growth of expenses, we must continue to focus on using resources more efficiently and appropriately and provide better care in more effective ways. AHS will continue to achieve business efficiencies through Operational Best Practices and we will also work to ensure clinical best practices and appropriateness. As mentioned, by enhancing care in the community and focusing on the health and wellness of Albertans rather than on treating disease and illness, we will be more sustainable over time. Cost Pressures The following pressures are specific to the outlook and include: Population and demand: the population of Alberta continues to increase and is aging and living longer. On average, we are using more healthcare per person compared to previous generations, creating increased demand in all areas of the healthcare system. Costs: healthcare costs have been rising more rapidly than general inflation and costs per unit of service are also increasing. AHS’ salaries and benefits expenses comprise approximately 55% of total expenses. Workforce: to support a transition from “hospital to community” there is a need for trained healthcare workers to also shift from a hospital setting to community and home care settings. AHS respects staff preferences and is committed to using a voluntary attrition-based approach to allocate staff where they are needed most. This means though that the transition will take longer and it will take time before savings will be realized and the growth of expenses decreases. Multiple priorities: AHS must continue to work with AH to find the right balance of programs and services to ensure that the needs of Albertans are met while working efficiently. One of the priorities for 2017-18 is to enhance community and home care options for Albertans. To do this successfully, there must be a reduction in reliance on acute care and resulting costs so that resources can be redeployed to areas that will build better health long-term for Albertans. Engagement: enhancing the care that’s provided requires engagement from multiple stakeholders, including Albertans, AHS employees, physicians, other healthcare providers, and the Government of Alberta. AHS will need to work with key stakeholders to determine how to successfully transition the focus to placing more resources in our communities. AHS also has an Enterprise Risk Management (ERM) program which actively supports management in identifying, analyzing, and monitoring risks that may impact the achievement of its strategic objectives. Priority strategic risks for AHS for future years is updated annually and where needed, risk mitigation strategies are developed and monitored to guide management decision-making and actions.

2016-17 | Alberta Health Services Annual Report
68
CONSOLIDATED FINANCIAL STATEMENTS
MARCH 31, 2017

2016-17 | Alberta Health Services Annual Report
69
Management’s Responsibility for Financial Reporting Independent Auditor’s Report Consolidated Statement of Operations Consolidated Statement of Financial Position Consolidated Statement of Change in Net Debt Consolidated Statement of Remeasurement Gains and Losses Consolidated Statement of Cash Flows Notes to the Consolidated Financial Statements Schedule 1 – Consolidated Schedule of Expenses by Object Schedule 2 – Consolidated Schedule of Salaries and Benefits
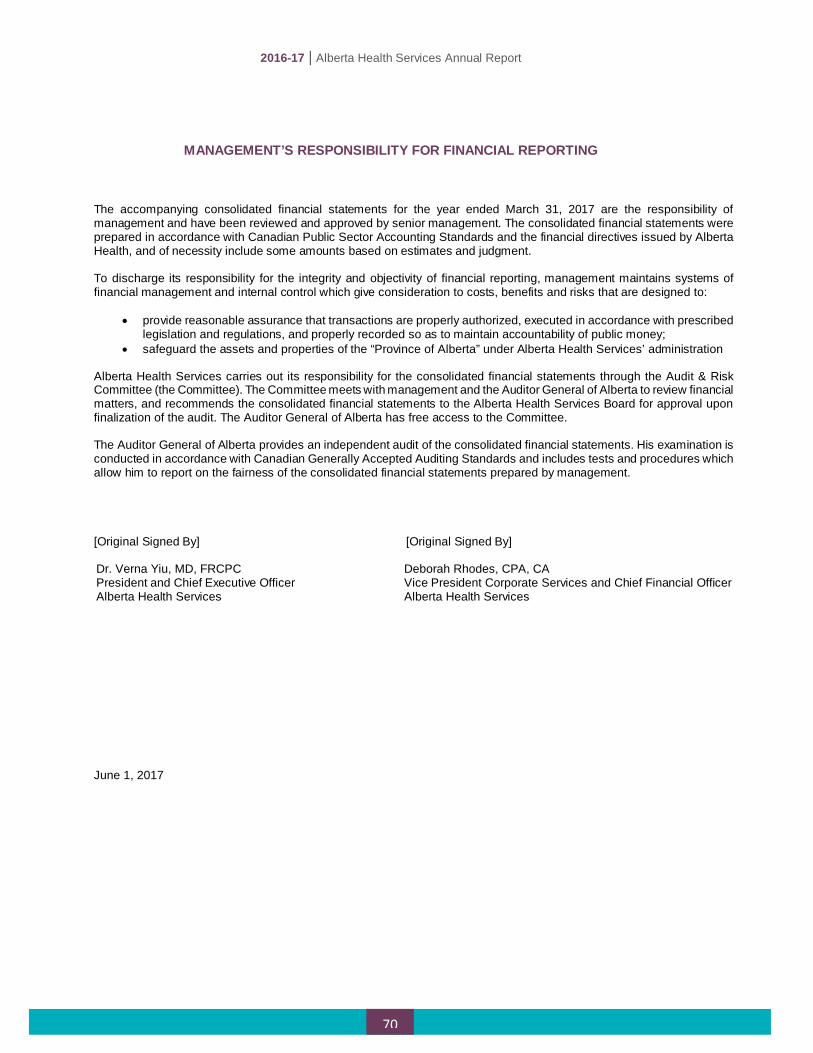
2016-17 | Alberta Health Services Annual Report
70
MANAGEMENT’S RESPONSIBILITY FOR FINANCIAL REPORTING
The accompanying consolidated financial statements for the year ended March 31, 2017 are the responsibility of management and have been reviewed and approved by senior management. The consolidated financial statements were prepared in accordance with Canadian Public Sector Accounting Standards and the financial directives issued by Alberta Health, and of necessity include some amounts based on estimates and judgment. To discharge its responsibility for the integrity and objectivity of financial reporting, management maintains systems of financial management and internal control which give consideration to costs, benefits and risks that are designed to:
• provide reasonable assurance that transactions are properly authorized, executed in accordance with prescribed legislation and regulations, and properly recorded so as to maintain accountability of public money;
• safeguard the assets and properties of the “Province of Alberta” under Alberta Health Services’ administration Alberta Health Services carries out its responsibility for the consolidated financial statements through the Audit & Risk Committee (the Committee). The Committee meets with management and the Auditor General of Alberta to review financial matters, and recommends the consolidated financial statements to the Alberta Health Services Board for approval upon finalization of the audit. The Auditor General of Alberta has free access to the Committee. The Auditor General of Alberta provides an independent audit of the consolidated financial statements. His examination is conducted in accordance with Canadian Generally Accepted Auditing Standards and includes tests and procedures which allow him to report on the fairness of the consolidated financial statements prepared by management. [Original Signed By] [Original Signed By] Dr. Verna Yiu, MD, FRCPC President and Chief Executive Officer Alberta Health Services
Deborah Rhodes, CPA, CA Vice President Corporate Services and Chief Financial Officer Alberta Health Services
June 1, 2017

Independent Auditor’s Report To the Minister of Health Report on the Consolidated Financial Statements I have audited the accompanying consolidated financial statements of Alberta Health Services, which comprise the consolidated statement of financial position as at March 31, 2017, and the consolidated statements of operations, remeasurement gains and losses, change in net debt, and cash flows for the year then ended, and a summary of significant accounting policies and other explanatory information. Management’s Responsibility for the Consolidated Financial Statements Management is responsible for the preparation and fair presentation of these consolidated financial statements in accordance with Canadian public sector accounting standards, and for such internal control as management determines is necessary to enable the preparation of consolidated financial statements that are free from material misstatement, whether due to fraud or error. Auditor’s Responsibility My responsibility is to express an opinion on these consolidated financial statements based on my audit. I conducted my audit in accordance with Canadian generally accepted auditing standards. Those standards require that I comply with ethical requirements and plan and perform the audit to obtain reasonable assurance about whether the consolidated financial statements are free from material misstatement. An audit involves performing procedures to obtain audit evidence about the amounts and disclosures in the consolidated financial statements. The procedures selected depend on the auditor’s judgment, including the assessment of the risks of material misstatement of the consolidated financial statements, whether due to fraud or error. In making those risk assessments, the auditor considers internal control relevant to the entity’s preparation and fair presentation of the consolidated financial statements in order to design audit procedures that are appropriate in the circumstances, but not for the purpose of expressing an opinion on the effectiveness of the entity’s internal control. An audit also includes evaluating the appropriateness of accounting policies used and the reasonableness of accounting estimates made by management, as well as evaluating the overall presentation of the consolidated financial statements. I believe that the audit evidence I have obtained is sufficient and appropriate to provide a basis for my audit opinion. Opinion In my opinion, the consolidated financial statements present fairly, in all material respects, the financial position of Alberta Health Services as at March 31, 2017, and the results of its operations, its remeasurement gains and losses, its changes in net debt, and its cash flows for the year then ended in accordance with Canadian public sector accounting standards. [Original signed by Merwan N. Saher FCPA, FCA] Auditor General June 1, 2017 Edmonton, Alberta

2016-17 | Alberta Health Services Annual Report
CONSOLIDATED FINANCIAL STATEMENTS (thousands of dollars)
72
CONSOLIDATED STATEMENT OF OPERATIONS YEAR ENDED MARCH 31
2017 2016 Budget Actual Actual (Note 3) Revenues:
Alberta Health transfers Base operating $ 11,860,000 $ 11,859,923 $ 11,329,851 One-time base operating - 50,000 - Grant funding transferred to one-time base operating - 14,515 - Other operating 968,000 953,328 1,064,739 Recognition of expended deferred capital revenue 81,000 86,784 84,716 Other government transfers (Note 4) 408,000 456,152 416,554 Fees and charges 513,000 479,180 491,487 Ancillary operations 133,000 135,660 133,220 Donations, fundraising, and non-government contributions (Note 5) 150,000 164,016 166,806
Investment and other income (Note 6) 205,000 270,410 267,931 TOTAL REVENUE
14,318,000 14,469,968 13,955,304
Expenses:
Inpatient acute nursing services 3,235,000 3,169,177 3,129,520 Emergency and other outpatient services 1,646,000 1,671,830 1,641,261 Facility-based continuing care services 1,080,000 1,053,118 1,043,410 Ambulance services 479,000 497,686 479,031 Community-based care 1,317,000 1,249,031 1,191,605 Home care 611,000 585,313 555,831 Diagnostic and therapeutic services 2,273,000 2,400,242 2,343,794 Promotion, prevention, and protection services 393,000 354,700 353,028 Research and education 240,000 285,300 277,908 Administration (Note 7) 458,000 478,074 434,426 Information technology 572,000 513,420 572,545 Support services (Note 8) 2,014,000 2,145,541 2,077,504
TOTAL EXPENSES (Schedule 1)
14,318,000 14,403,432 14,099,863
ANNUAL OPERATING SURPLUS (DEFICIT) - 66,536 (144,559) Accumulated surplus, beginning of year 1,159,000 1,159,123 1,303,682 Accumulated surplus, end of year (Note 19) $ 1,159,000 $ 1,225,659 $ 1,159,123
The accompanying notes and schedules are part of these consolidated financial statements.

2016-17 | Alberta Health Services Annual Report
CONSOLIDATED FINANCIAL STATEMENTS (thousands of dollars)
73
CONSOLIDATED STATEMENT OF FINANCIAL POSITION AS AT MARCH 31
2017 2016 Actual Actual Financial Assets: Cash $ 46,103 $ 79,867 Investments (Note 10) 2,264,866 2,187,506 Accounts receivable (Note 11) 386,292 393,493
2,697,261 2,660,866
Liabilities: Accounts payable and accrued liabilities (Note 12) 1,209,974 1,236,312 Employee future benefits (Note 13) 653,037 620,687 Unexpended deferred operating revenue (Note 14) 411,079 429,515 Unexpended deferred capital revenue (Note 15) 137,806 148,319 Debt (Note 17) 320,087 326,909
2,731,983 2,761,742
NET DEBT (34,722) (100,876) Non-Financial Assets: Tangible capital assets (Note 18) 7,619,077 7,573,071 Inventories for consumption 91,882 94,439 Prepaid expenses and other non-financial assets 128,058 127,943
7,839,017 7,795,453
NET ASSETS BEFORE EXPENDED DEFERRED CAPITAL REVENUE 7,804,295 7,694,577 Expended deferred capital revenue (Note 16) 6,549,770 6,530,432 NET ASSETS 1,254,525 1,164,145 Net Assets is comprised of: Accumulated surplus (Note 19) 1,225,659 1,159,123 Accumulated remeasurement gains 28,866 5,022 $ 1,254,525 $ 1,164,145
Contractual Obligations and Contingent Liabilities (Note 20) The accompanying notes and schedules are part of these consolidated financial statements.
Approved by the Board of Directors:
[Original Signed By] [Original Signed By]
__________________________________ __________________________________ Linda Hughes David Carpenter, FCPA, FCA Board Chair Audit & Risk Committee Chair

2016-17 | Alberta Health Services Annual Report
CONSOLIDATED FINANCIAL STATEMENTS (thousands of dollars)
74
CONSOLIDATED STATEMENT OF CHANGE IN NET DEBT
YEAR ENDED MARCH 31 2017 2016 Budget Actual Actual (Note 3) Annual operating surplus (deficit) $ - $ 66,536 $ (144,559) Effect of changes in tangible capital assets: Acquisition of tangible capital assets (Note 18) (402,000) (597,021) (650,785) Amortization and disposals of tangible capital assets
(Note 18) 587,000 551,015 588,851 Effect of other changes: Net increase (decrease) in expended deferred capital
revenue (217,000) 19,338 166,733 Net (increase) decrease in inventories for consumption 1,000 2,557 2,144 Net (increase) decrease in prepaid expenses and other non-financial assets
(5,000)
(115) 10,846
Net remeasurement gains (losses) for the year (19,000) 23,844 (33,753) (Increase) decrease in net debt for the year (55,000) 66,154 (60,523) Net debt, beginning of year (101,000) (100,876) (40,353) Net debt, end of year $ (156,000) $ (34,722) $ (100,876)
The accompanying notes and schedules are part of these consolidated financial statements.

2016-17 | Alberta Health Services Annual Report
CONSOLIDATED FINANCIAL STATEMENTS (thousands of dollars)
75
CONSOLIDATED STATEMENT OF REMEASUREMENT GAINS AND LOSSES
YEAR ENDED MARCH 31 2017 2016
Actual Actual
Unrestricted unrealized gains (losses) attributable to: Derivatives $ 643 $ (2,451) Portfolio investments Equity instruments quoted in an active market 14,456 (12,894) Financial instruments designated to the fair value category (786) (3,360) Amounts reclassified to the Consolidated Statement of Operations: Portfolio investments Equity instruments quoted in an active market 555 783 Financial instruments designated to the fair value category 8,976 (15,831) Net remeasurement gains (losses) for the year 23,844 (33,753) Accumulated remeasurement gains, beginning of year 5,022 38,775
Accumulated remeasurement gains, end of year (Note 10) $ 28,866 $ 5,022
The accompanying notes and schedules are part of these consolidated financial statements.

2016-17 | Alberta Health Services Annual Report
CONSOLIDATED FINANCIAL STATEMENTS (thousands of dollars)
76
CONSOLIDATED STATEMENT OF CASH FLOWS
YEAR ENDED MARCH 31 2017 2016 Actual Actual
Operating transactions:
Annual operating surplus (deficit) $ 66,536 $ (144,559) Non-cash items: Amortization and disposals of tangible capital assets 551,015 588,851 Recognition of expended deferred capital revenue (402,887) (394,294) Revenue recognized for acquisition of land (687) - Decrease (increase) in:
Accounts receivable related to operating transactions (26,890) (49,250) Inventories for consumption 2,557 2,144 Prepaid expenses and other non-financial assets (115) 10,846
Increase (decrease) in: Accounts payable and accrued liabilities
related to operating transactions (51,771) (39,564) Employee future benefits 32,350 26,084 Unexpended deferred operating revenue (70,148) (80,367)
Cash provided by (applied to) operating transactions 99,960 (80,109) Capital transactions:
Acquisition of tangible capital assets (380,401) (233,213) Increase (decrease) in accounts payable and
accrued liabilities related to capital transactions
25,433 (6,434) Cash applied to capital transactions (354,968) (239,647) Investing transactions:
Purchase of investments (3,339,338) (4,230,911) Proceeds on disposals of investments 3,290,394 4,133,948
Cash applied to investing transactions (48,944) (96,963)
Financing transactions: Restricted capital contributions received 278,230 164,359 Unexpended deferred capital revenue returned (1,220) (4,698) Proceeds from debt 10,000 20,300 Principal payments on debt (16,822) (15,222)
Cash provided by financing transactions 270,188 164,739 Decrease in cash (33,764) (251,980) Cash, beginning of year 79,867 331,847 Cash, end of year $ 46,103 $ 79,867
The accompanying notes and schedules are part of these consolidated financial statements.

2016-17 | Alberta Health Services Annual Report
NOTES TO THE CONSOLIDATED FINANCIAL STATEMENTS
(thousands of dollars)
77
NOTES TO THE CONSOLIDATED FINANCIAL STATEMENTS MARCH 31, 2017
Note 1 Authority, Purpose and Operations
Alberta Health Services (AHS) was established under the Regional Health Authorities Act (Alberta), effective April 1, 2009, as a result of the merger of 12 formerly separate health entities in Alberta. Pursuant to Section 5 of the Regional Health Authorities Act (Alberta), AHS is responsible in Alberta to:
• promote and protect the health of the population in the health region and work toward the prevention of disease and injury;
• assess on an ongoing basis the health needs of the health region; • determine priorities in the provision of health services in the health region and allocate resources accordingly; • ensure that reasonable access to quality health services is provided in and through the health region; and • promote the provision of health services in a manner that is responsive to the needs of individuals and
communities and supports the integration of services and facilities in the health region.
Additionally, AHS is accountable to the Minister of Health (the Minister) for the delivery and operation of the public health system. The AHS consolidated financial statements include the revenue and expenses associated with its responsibilities. These consolidated financial statements do not reflect the complete costs of provincial health care. For a complete picture of the costs of provincial health care, readers should consult the consolidated financial statements of the Government of Alberta (GOA). AHS and its contracted health service providers deliver health services at facilities and sites grouped in the following areas: addiction treatment, community mental health, standalone psychiatric facilities, acute care hospitals, sub-acute care in auxiliary hospitals, long-term care, palliative care, supportive living, cancer care, community ambulatory care centres, and urgent care centres. Under the Income Tax Act (Canada), AHS is a registered charity.
Note 2 Significant Accounting Policies and Reporting Practices
(a) Basis of Presentation
These consolidated financial statements have been prepared in accordance with Canadian Public Sector Accounting Standards (PSAS) and the financial directives issued by Alberta Health (AH). AHS is a Government Not-for-Profit Organization under PSAS. These financial statements have been prepared on a consolidated basis and include the following entities:
(i) Controlled Entities
The consolidated financial statements reflect the assets, liabilities, revenues, and expenses of the reporting entity, which is comprised of the organizations controlled by AHS as noted below:
AHS owns 100% of the Class A voting shares in the following three entities: • Calgary Laboratory Services Ltd. (CLS) - provides medical diagnostic services in Calgary and southern
Alberta. • Capital Care Group Inc. (CCGI) - manages continuing care programs and facilities in the Edmonton area. • Carewest - manages continuing care programs and facilities in the Calgary area.
2016-17 | Alberta Health Services Annual Report
NOTES TO THE CONSOLIDATED FINANCIAL STATEMENTS
(thousands of dollars)
78
Note 2 Significant Accounting Policies and Reporting Practices (continued)
AHS has the majority representation indicating control of the following entities and therefore constitute part of the consolidated reporting entity:
• Foundations:
Airdrie Health Foundation Alberta Cancer Foundation (ACF) American Friends of the Calgary Health Trust Foundation Bassano and District Health Foundation Bow Island and District Health Foundation Brooks and District Health Foundation Calgary Health Trust (CHT) Canmore and Area Health Care Foundation Cardston and District Health Foundation Claresholm and District Health Foundation Crowsnest Pass Health Foundation David Thompson Health Trust (inactive) Fort Macleod and District Health Foundation Fort Saskatchewan Community Hospital Foundation Grande Cache Hospital Foundation (inactive) Grimshaw/Berwyn and District Hospital Foundation Jasper Health Care Foundation
Lac La Biche Regional Health Foundation Lacombe Health Trust Medicine Hat and District Health Foundation Mental Health Foundation North County Health Foundation Oyen and District Health Care Foundation Peace River and District Health Foundation Ponoka and District Health Foundation Stettler Health Services Foundation Strathcona Community Hospital Foundation Tofield and Area Health Services Foundation Two Hills Health Centre Foundation Vermillion and Region Health and Wellness Foundation (inactive) Viking Health Foundation Vulcan County Health and Wellness Foundation Windy Slopes Health Foundation
• Provincial Health Authorities of Alberta Liability and Property Insurance Plan (LPIP) - AHS has the majority of
representation on the LPIP’s governance board and is therefore considered to control the LPIP. The main purpose of the LPIP is to share the risks of general and professional liability to lessen the impact on any one subscriber.
• Queen Elizabeth II Hospital Child Care Centre
(ii) Government Partnerships
AHS uses the proportionate consolidation method to account for its 50% interest in the Primary Care Network (PCN) government partnerships with physician groups, and its 50% interest in the Northern Alberta Clinical Trials Centre (NACTRC) partnership with the University of Alberta (Note 22). AHS has joint control with various physician groups over PCNs. AHS entered into local primary care initiative agreements to jointly manage and operate the delivery of primary care services, to achieve the PCN business plan objectives, and to contract and hold property interests required in the delivery of PCN services.

2016-17 | Alberta Health Services Annual Report
NOTES TO THE CONSOLIDATED FINANCIAL STATEMENTS
(thousands of dollars)
79
Note 2 Significant Accounting Policies and Reporting Practices (continued)
The following PCNs are included in these consolidated financial statements on a proportionate basis:
Alberta Heartland Primary Care Network Aspen (Athabasca/Westlock) Primary Care Network Big Country Primary Care Network Bighorn Primary Care Network (previously Grande Cache) Bonnyville Primary Care Network Bow Valley Primary Care Network Calgary Foothills Primary Care Network Calgary Rural Primary Care Network Calgary West Central Primary Care Network Camrose Primary Care Network Chinook Primary Care Network Cold Lake Primary Care Network Drayton Valley Primary Care Network Edmonton North Primary Care Network Edmonton Oliver Primary Care Network Edmonton Southside Primary Care Network Edmonton West Primary Care Network Grande Prairie Primary Care Network Highland Primary Care Network Kalyna Country Primary Care Network Lakeland (St. Paul/Aspen) Primary Care Network
Leduc Beaumont Devon Primary Care Network Lloydminster Primary Care Network McLeod River Primary Care Network Mosaic Primary Care Network Northwest Primary Care Network Palliser Primary Care Network Peace Region Primary Care Network Peaks to Prairies Primary Care Network Provost Primary Care Network Red Deer Primary Care Network Rocky Mountain House Primary Care Network Sexsmith/Spirit River Primary Care Network Sherwood Park/Strathcona County Primary Care Network South Calgary Primary Care Network St. Albert & Sturgeon Primary Care Network Wainwright Primary Care Network West Peace Primary Care Network WestView Primary Care Network Wetaskiwin Primary Care Network Wolf Creek Primary Care Network Wood Buffalo Primary Care Network
(iii) Other
These consolidated financial statements do not include trusts administered on behalf of others (Note 23).
All inter-entity accounts and transactions between these organizations are eliminated upon consolidation. Adjustments are made for consolidated entities whose fiscal year-ends are different from AHS’ fiscal year end. This only consists of LPIP with a fiscal year-end of December 31, 2016.
(b) Revenue Recognition
Revenue is recognized in the period in which the transactions or events that give rise to the revenue as described below occur. All revenue is recorded on an accrual basis, except when the accrual cannot be determined within a reasonable degree of certainty or when estimation is impracticable.
(i) Government Transfers
Transfers from AH, other GOA ministries and agencies, and other government entities are referred to as government transfers.
Government transfers and the associated externally restricted investment income are recorded as deferred revenue if the eligibility criteria for the use of the transfer, or the stipulations together with AHS’ actions and communications as to the use of the transfer, create a liability. These transfers are recognized as revenue as the stipulations are met and, when applicable, AHS complies with its communicated use of the transfer. All other government transfers, without stipulations for the use of the transfer, are recorded as revenue when the transfer is authorized and AHS meets the eligibility criteria. Deferred revenue consists of unexpended deferred operating revenue, unexpended deferred capital revenue, and expended deferred capital revenue. The term deferred revenue in these consolidated financial statements refers to the components of deferred revenue as described.

2016-17 | Alberta Health Services Annual Report
NOTES TO THE CONSOLIDATED FINANCIAL STATEMENTS
(thousands of dollars)
80
Note 2 Significant Accounting Policies and Reporting Practices (continued)
(ii) Donations, Fundraising, and Non-Government Contributions
Donations, fundraising, and non-government contributions are received from individuals, corporations, and other not-for-profit organizations. Donations, fundraising, and non-government contributions may be unrestricted or externally restricted for operating or capital purposes.
Unrestricted donations, fundraising, and non-government contributions are recorded as revenue in the year received or in the year the funds are committed to AHS if the amount can be reasonably estimated and collection is reasonably assured. Externally restricted donations, fundraising, non-government contributions, and realized and unrealized gains and losses for the associated externally restricted investment income are recorded as deferred revenue if the terms for their use, or the terms along with AHS’ actions and communications as to their use create a liability. These resources are recognized as revenue as the terms are met and, when applicable, AHS complies with its communicated use. Endowment contributions are recognized in the Consolidated Statement of Operations in the period they are received. Donors have placed restrictions on these contributions. Realized and unrealized gains and losses attributable to endowments are recorded as deferred revenue and only recognized as revenue when the terms of use are met, as stipulated by the donors.
In-kind donations of services and materials are recorded at fair value when such value can reasonably be determined. While volunteers contribute a significant amount of time each year to assist AHS, the value of their services is not recognized as revenue and expenses in the consolidated financial statements because fair value cannot be reasonably determined.
(iii) Transfers and Donations of or for Land
AHS records transfers and donations to buy land as a liability when received and recognizes as revenue when AHS buys the land. AHS recognizes in-kind contributions of land as revenue at the fair value of the land when a fair value can be reasonably determined. When AHS cannot determine the fair value, it records such in-kind contributions at nominal value.
(iv) Fees and Charges, Ancillary Operations, and Other Income
Fees and charges, ancillary operations, and other income are recognized in the period that goods are delivered or services are provided. Amounts received for which goods or services have not been provided by year end are recorded as deferred revenue.
(v) Investment Income
Investment income includes dividend income, interest income, and realized gains or losses on the sale of portfolio investments. Unrealized gains and losses on portfolio investments exclusive of restricted transfers or donations are recognized in the Consolidated Statement of Remeasurement Gains and Losses until the related investments are sold. When realized, these gains or losses are recognized in the Consolidated Statement of Operations. Investment income and unrealized gains and losses from restricted transfers or donations are allocated to their respective balances according to the provisions within the individual agreements.
(c) Expenses
Expenses are reported on an accrual basis. The cost of all goods consumed and services received during the year are expensed. Interest expense includes debt servicing costs. Expenses include grants and transfers under shared cost agreements. Grants and transfers are recorded as expenses when the transfer is authorized and eligibility criteria have been met by the recipient.
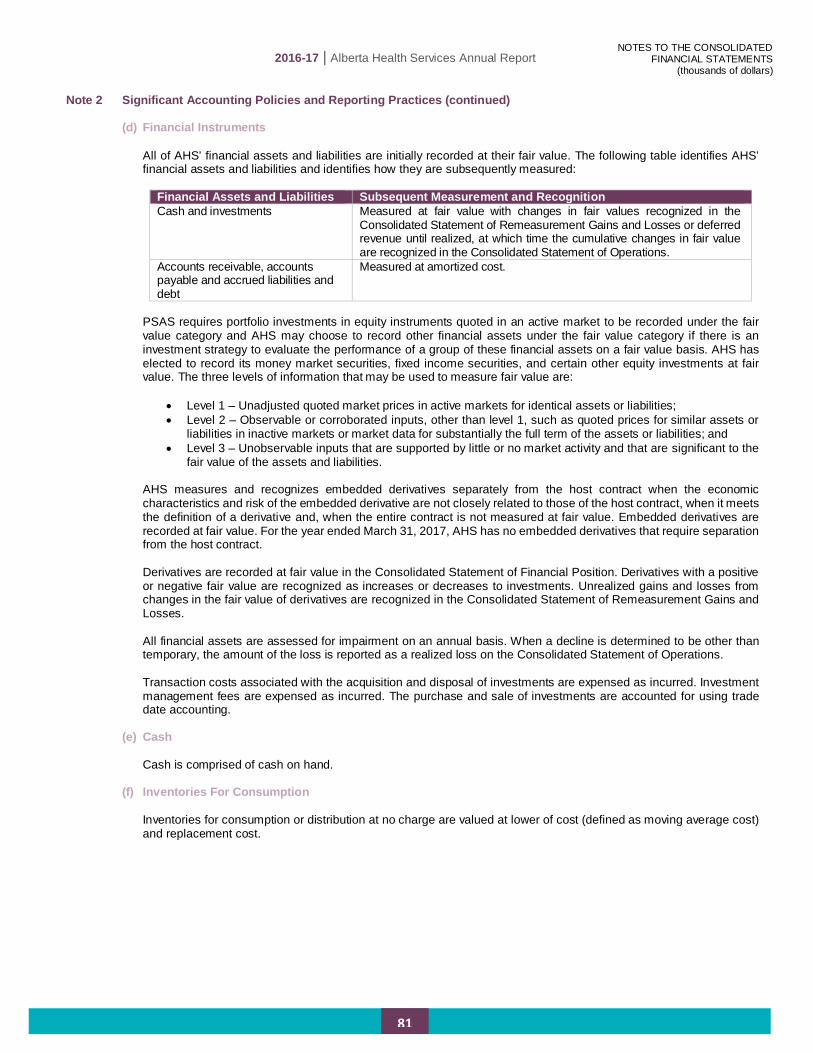
2016-17 | Alberta Health Services Annual Report
NOTES TO THE CONSOLIDATED FINANCIAL STATEMENTS
(thousands of dollars)
81
Note 2 Significant Accounting Policies and Reporting Practices (continued)
(d) Financial Instruments
All of AHS’ financial assets and liabilities are initially recorded at their fair value. The following table identifies AHS’ financial assets and liabilities and identifies how they are subsequently measured:
Financial Assets and Liabilities Subsequent Measurement and Recognition Cash and investments Measured at fair value with changes in fair values recognized in the
Consolidated Statement of Remeasurement Gains and Losses or deferred revenue until realized, at which time the cumulative changes in fair value are recognized in the Consolidated Statement of Operations.
Accounts receivable, accounts payable and accrued liabilities and debt
Measured at amortized cost.
PSAS requires portfolio investments in equity instruments quoted in an active market to be recorded under the fair value category and AHS may choose to record other financial assets under the fair value category if there is an investment strategy to evaluate the performance of a group of these financial assets on a fair value basis. AHS has elected to record its money market securities, fixed income securities, and certain other equity investments at fair value. The three levels of information that may be used to measure fair value are:
• Level 1 – Unadjusted quoted market prices in active markets for identical assets or liabilities; • Level 2 – Observable or corroborated inputs, other than level 1, such as quoted prices for similar assets or
liabilities in inactive markets or market data for substantially the full term of the assets or liabilities; and • Level 3 – Unobservable inputs that are supported by little or no market activity and that are significant to the
fair value of the assets and liabilities.
AHS measures and recognizes embedded derivatives separately from the host contract when the economic characteristics and risk of the embedded derivative are not closely related to those of the host contract, when it meets the definition of a derivative and, when the entire contract is not measured at fair value. Embedded derivatives are recorded at fair value. For the year ended March 31, 2017, AHS has no embedded derivatives that require separation from the host contract. Derivatives are recorded at fair value in the Consolidated Statement of Financial Position. Derivatives with a positive or negative fair value are recognized as increases or decreases to investments. Unrealized gains and losses from changes in the fair value of derivatives are recognized in the Consolidated Statement of Remeasurement Gains and Losses. All financial assets are assessed for impairment on an annual basis. When a decline is determined to be other than temporary, the amount of the loss is reported as a realized loss on the Consolidated Statement of Operations. Transaction costs associated with the acquisition and disposal of investments are expensed as incurred. Investment management fees are expensed as incurred. The purchase and sale of investments are accounted for using trade date accounting.
(e) Cash
Cash is comprised of cash on hand.
(f) Inventories For Consumption
Inventories for consumption or distribution at no charge are valued at lower of cost (defined as moving average cost) and replacement cost.
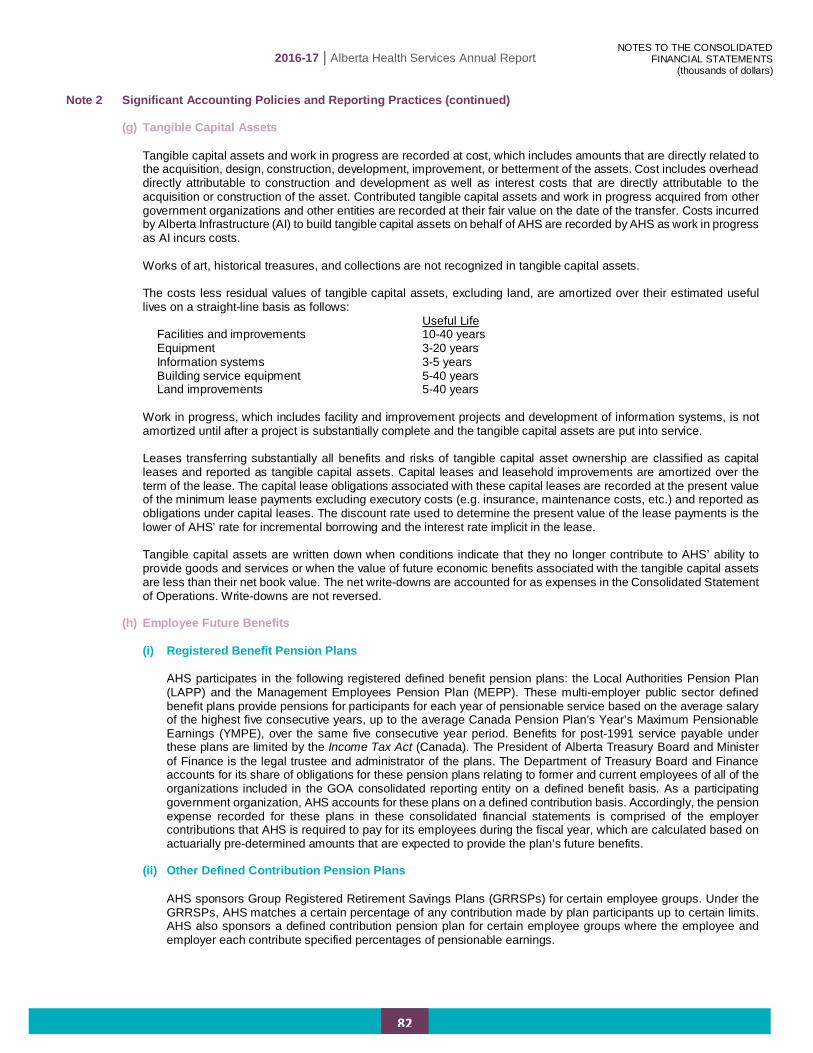
2016-17 | Alberta Health Services Annual Report
NOTES TO THE CONSOLIDATED FINANCIAL STATEMENTS
(thousands of dollars)
82
Note 2 Significant Accounting Policies and Reporting Practices (continued)
(g) Tangible Capital Assets Tangible capital assets and work in progress are recorded at cost, which includes amounts that are directly related to the acquisition, design, construction, development, improvement, or betterment of the assets. Cost includes overhead directly attributable to construction and development as well as interest costs that are directly attributable to the acquisition or construction of the asset. Contributed tangible capital assets and work in progress acquired from other government organizations and other entities are recorded at their fair value on the date of the transfer. Costs incurred by Alberta Infrastructure (AI) to build tangible capital assets on behalf of AHS are recorded by AHS as work in progress as AI incurs costs. Works of art, historical treasures, and collections are not recognized in tangible capital assets.
The costs less residual values of tangible capital assets, excluding land, are amortized over their estimated useful lives on a straight-line basis as follows:
Useful Life Facilities and improvements 10-40 years Equipment 3-20 years Information systems 3-5 years Building service equipment 5-40 years Land improvements 5-40 years
Work in progress, which includes facility and improvement projects and development of information systems, is not amortized until after a project is substantially complete and the tangible capital assets are put into service. Leases transferring substantially all benefits and risks of tangible capital asset ownership are classified as capital leases and reported as tangible capital assets. Capital leases and leasehold improvements are amortized over the term of the lease. The capital lease obligations associated with these capital leases are recorded at the present value of the minimum lease payments excluding executory costs (e.g. insurance, maintenance costs, etc.) and reported as obligations under capital leases. The discount rate used to determine the present value of the lease payments is the lower of AHS’ rate for incremental borrowing and the interest rate implicit in the lease. Tangible capital assets are written down when conditions indicate that they no longer contribute to AHS’ ability to provide goods and services or when the value of future economic benefits associated with the tangible capital assets are less than their net book value. The net write-downs are accounted for as expenses in the Consolidated Statement of Operations. Write-downs are not reversed.
(h) Employee Future Benefits
(i) Registered Benefit Pension Plans
AHS participates in the following registered defined benefit pension plans: the Local Authorities Pension Plan (LAPP) and the Management Employees Pension Plan (MEPP). These multi-employer public sector defined benefit plans provide pensions for participants for each year of pensionable service based on the average salary of the highest five consecutive years, up to the average Canada Pension Plan’s Year’s Maximum Pensionable Earnings (YMPE), over the same five consecutive year period. Benefits for post-1991 service payable under these plans are limited by the Income Tax Act (Canada). The President of Alberta Treasury Board and Minister of Finance is the legal trustee and administrator of the plans. The Department of Treasury Board and Finance accounts for its share of obligations for these pension plans relating to former and current employees of all of the organizations included in the GOA consolidated reporting entity on a defined benefit basis. As a participating government organization, AHS accounts for these plans on a defined contribution basis. Accordingly, the pension expense recorded for these plans in these consolidated financial statements is comprised of the employer contributions that AHS is required to pay for its employees during the fiscal year, which are calculated based on actuarially pre-determined amounts that are expected to provide the plan’s future benefits.
(ii) Other Defined Contribution Pension Plans
AHS sponsors Group Registered Retirement Savings Plans (GRRSPs) for certain employee groups. Under the GRRSPs, AHS matches a certain percentage of any contribution made by plan participants up to certain limits. AHS also sponsors a defined contribution pension plan for certain employee groups where the employee and employer each contribute specified percentages of pensionable earnings.

2016-17 | Alberta Health Services Annual Report
NOTES TO THE CONSOLIDATED FINANCIAL STATEMENTS
(thousands of dollars)
83
Note 2 Significant Accounting Policies and Reporting Practices (continued)
(iii) Supplemental Retirement Plan for Designated Employees (SERP)
Previously, AHS sponsored multiple SERPs, with assets held in three Retirement Compensation Arrangements (RCA). Since March 31, 2016, amendments were made to consolidate the SERPs into a single plan with assets consolidated under one RCA arrangement. The consolidation did not affect SERP members’ accrued benefit entitlements, which continue to be funded. The SERP covers certain employees and supplement the benefits under AHS’ registered plans that are limited by the Income Tax Act (Canada). Prior to consolidation, the SERPs were closed and continue to be closed to new entrants since April 1, 2009. The SERP provides future pension benefits to participants based on years of service and earnings. Due to Income Tax Act (Canada) requirements, the SERP is subject to the RCA rules; therefore, approximately half of the assets are held in a non-interest bearing Refundable Tax Account with the Canada Revenue Agency. The remaining assets of the SERP are invested in a combination of Canadian equities and Canadian fixed income securities. The obligations and costs of SERP benefits are determined annually through an actuarial valuation as at March 31 using the projected benefit method pro-rated on service. AHS uses a discount rate based on plan asset earnings to calculate the accrued benefit obligation.
The net SERP retirement benefit cost reported in these consolidated financial statements is comprised of the retirement benefits expense and the retirement benefits interest expense. Costs shown reflect the total estimated cost to provide annual pension income over an actuarially determined post employment period. The key components of retirement benefits expense include the cost of any plan amendments including related net actuarial gains or losses incurred in the period, gains and losses from any plan settlements or curtailments incurred in the period, and amortization of actuarial gains and losses. Retirement benefit costs are not cash payments in the period but are the period expense for rights to future compensation. The retirement benefits interest expense is net of the interest cost on the accrued benefit obligation and the expected return on plan assets.
The actuarial gains and losses that arise are accounted for in accordance with PSAS whereby AHS amortizes actuarial gains and losses from the liability or asset over the average remaining service life of the related employee group. Prior period service costs arising from plan amendments are recognized in the period of the plan amendment. When an employee’s accrued benefit obligation is fully discharged, all unrecognized amounts associated with that employee are fully recognized in the net retirement benefit cost in the following year.
(iv) Supplemental Pension Plan (SPP)
Subsequent to April 1, 2009, staff eligible for SERP are enrolled in a defined contribution SPP. Similar to the SERP, the SPP supplements the benefits under AHS registered plans that are limited by the Income Tax Act (Canada). AHS contributes a certain percentage of an eligible employee’s pensionable earnings, in excess of the limits of the Income Tax Act (Canada). This plan provides participants with an account balance at retirement based on the contributions made to the plan and investment income earned on the contributions based on investment decisions made by the participant.

2016-17 | Alberta Health Services Annual Report
NOTES TO THE CONSOLIDATED FINANCIAL STATEMENTS
(thousands of dollars)
84
Note 2 Significant Accounting Policies and Reporting Practices (continued)
(v) Sick Leave Liability Sick leave benefits accumulate with employees’ service and are provided by AHS to certain employee groups of AHS, as defined by employment agreements, to cover illness related absences that are outside of short-term and long-term disability coverage. Benefit amounts are determined and accumulate with reference to employees’ final earnings at the time they are paid out. The cost of the accumulating non-vesting sick leave benefits is expensed as the benefits are earned. AHS accrues its liabilities for accumulating non-vesting sick leave benefits but does not record a liability for sick leave benefits that do not accumulate beyond the current reporting period as these are renewed annually. The accumulating non-vesting sick leave liability is actuarially determined using the projected benefit method pro-rated for service and management's best estimates of expected discount rate, inflation, rate of compensation increase, termination and retirement rates, and mortality. The liability associated with these benefits is calculated as the present value of expected future payments pro-rated for service. Any resulting net actuarial gain (loss) is deferred and amortized on a straight-line basis over the expected average remaining service life of the related employee groups.
(vi) Other Benefits
AHS provides its employees with basic life, accidental death and dismemberment, short-term disability, long-term disability, extended health, dental, and vision benefits through benefits carriers. AHS fully accrues its obligations for employee non-pension future benefits.
(i) Liability for Contaminated Sites
Contaminated sites are a result of contamination being introduced into air, soil, water, or sediment of a chemical, organic or radioactive material or live organism that exceeds an environmental standard. The liability is recognized net of any expected recoveries. A liability for remediation of contaminated sites normally results from operations that are no longer in productive use and is recognized when all of the following criteria are met:
(i) an environmental standard exists; (ii) contamination exceeds the environmental standard; (iii) AHS is directly responsible or accepts responsibility; (iv) it is expected that future economic benefits will be given up; and (v) a reasonable estimate of the amount can be made.
(j) Measurement Uncertainty The consolidated financial statements, by their nature, contain estimates and are subject to measurement uncertainty. Measurement uncertainty exists when there is a difference between the recognized or disclosed amount and another reasonably possible amount. The amount recorded for amortization of tangible capital assets is based on the estimated useful life of the related tangible capital assets while the recognition of expended deferred capital revenue depends on when the terms for the use of the funding are met and, when applicable, AHS complies with its communicated use of the funding. The amounts recorded for employee future benefits are based on estimated future cash flows. The provision for unpaid claims, allowance for doubtful accounts and accrued liabilities are subject to significant management estimates and assumptions. The establishment of the provision for unpaid claims relies on the judgment and opinions of many individuals; historical precedent and trends; prevailing legal, economic, social, and regulatory trends; and expectation as to future developments. The process of determining the provision necessarily involves risks that the actual results will deviate perhaps materially from the best estimates made. These estimates and assumptions are reviewed at least annually. Actual results could differ from the estimates determined by management in these consolidated financial statements, and these differences, which may be material, could require adjustment in subsequent reporting periods.
(k) Internally Restricted Surplus for Future Purposes
Certain amounts, as approved by the AHS Board, are set aside in accumulated surplus for use by AHS for future operating and capital purposes, to restrict amounts for legislatively required restricted equity and donation amounts restricted by 3rd parties. Transfers to or from internally restricted surplus for future purposes are recorded to the respective reserved surplus when approved.

2016-17 | Alberta Health Services Annual Report
NOTES TO THE CONSOLIDATED FINANCIAL STATEMENTS
(thousands of dollars)
85
Note 2 Significant Accounting Policies and Reporting Practices (continued)
(l) Foreign Currency Translation Transaction amounts denominated in foreign currencies are translated into their Canadian dollar equivalents at exchange rates prevailing at the transaction dates. Carrying values of monetary assets and liabilities and non-monetary items included in the fair value category reflect the exchange rates at the Consolidated Statement of Financial Position date. Unrealized foreign exchange gains and losses are recognized in the Consolidated Statement of Remeasurement Gains and Losses. In the period of settlement, foreign exchange gains and losses are reclassified to the Consolidated Statement of Operations, and the cumulative amount of remeasurement gains and losses are reversed in the Consolidated Statement of Remeasurement Gains and Losses.
(m) Future Accounting Changes
The Public Sector Accounting Board has issued the following accounting standards in recent years:
• PS 2200 – Related Party Disclosures (effective April 1, 2017)
PS 2200 defines a related party and establishes disclosures required for related party transactions. • PS 3420 – Inter-Entity Transactions (effective April 1, 2017)
PS 3420 establishes standards on how to account for and report transactions between public sector entities that comprise a government’s reporting entity from both a provider and recipient perspective.
• PS 3210 – Assets (effective April 1, 2017) PS 3210 provides guidance for applying the definition of assets set out in PS 1000 – Financial Statement Concepts and establishes general disclosure standards for assets.
• PS 3320 – Contingent Assets (effective April 1, 2017) PS 3320 defines and establishes disclosure standards on contingent assets.
• PS 3380 – Contractual Rights (effective April 1, 2017) PS 3380 defines and establishes disclosure standards on contractual rights.
• PS 3430 – Restructuring Transactions (effective April 1, 2018) PS 3430 provides guidance on how to account for and report restructuring transactions by both transferors and recipients of assets and/or liabilities, together with related programs or operating responsibilities.
AHS’ management is currently assessing what the impact of these new standards will be on future consolidated financial statements.
Note 3 Budget
The AHS Health Plan and Business Plan 2016-17, which included the 2016-17 annual budget, was approved by the Minister of Health on June 29, 2016.
Note 4 Other Government Transfers
2017 2016 Unrestricted operating $ 59,737 $ 60,272 Restricted operating (Note 14) 118,303 88,192 Recognition of expended deferred capital revenue (Note 16) 278,112 268,090 $ 456,152 $ 416,554
Other government transfers include $449,067 (2016 – $409,882) transferred from the GOA and $7,085 (2016 – $6,672) from the federal government, and exclude amounts from AH as these amounts are separately disclosed on the Consolidated Statement of Operations.

2016-17 | Alberta Health Services Annual Report
NOTES TO THE CONSOLIDATED FINANCIAL STATEMENTS
(thousands of dollars)
86
Note 5 Donations, Fundraising, and Non-Government Contributions
2017 2016 Unrestricted operating $ 4,597 $ 2,622 Restricted operating 120,120 119,111 Recognition of expended deferred capital revenue 37,991 41,488 Endowment contributions and reinvested income 1,308 3,585 $ 164,016 $ 166,806
Note 6 Investment and Other Income
2017 2016 Investment income $ 65,552 $ 84,900 Other income:
GOA (Note 21) 37,422 31,118 AH 19,166 20,371 Other(a) 148,270 131,542
$ 270,410 $ 267,931
(a) Other includes revenue related to administrative services provided to other organizations of $15,547 (2016 – $10,906).
Note 7 Administration
2017 2016 General administration(a) $ 251,703 $ 221,472 Human resources(b) 92,695 91,370 Finance(c) 73,394 61,872 Communications(d) 21,354 22,078 Administration expense of full-spectrum contracted health service providers(e)
38,928
37,634
$ 478,074 $ 434,426
(a) General administration includes senior leaders’ expenses, the former Official Administrator expenses, Board expenses, and other administrative functions such as planning and development, privacy, risk management, internal audit, infection control, quality assurance, insurance, patient safety, and legal.
(b) Human resources includes personnel services, staff recruitment and selection, orientation, labour relations, employee
health, and employee record keeping. (c) Finance includes the recording, monitoring, and reporting of the financial and statistical aspects of AHS’ planned and
actual activities. (d) Communications includes the receipt and transmission of AHS’ communications including electronic communication,
visitor information, and mail services. It also includes personnel dedicated to maintenance and repair of communication systems and devices.
(e) Administration expense of full spectrum contracted health service providers is AHS’ estimate of the portion that AHS
funds of the general administration, human resources, finance, and communication expenses incurred by service providers with whom AHS contracts for a full spectrum of health services.
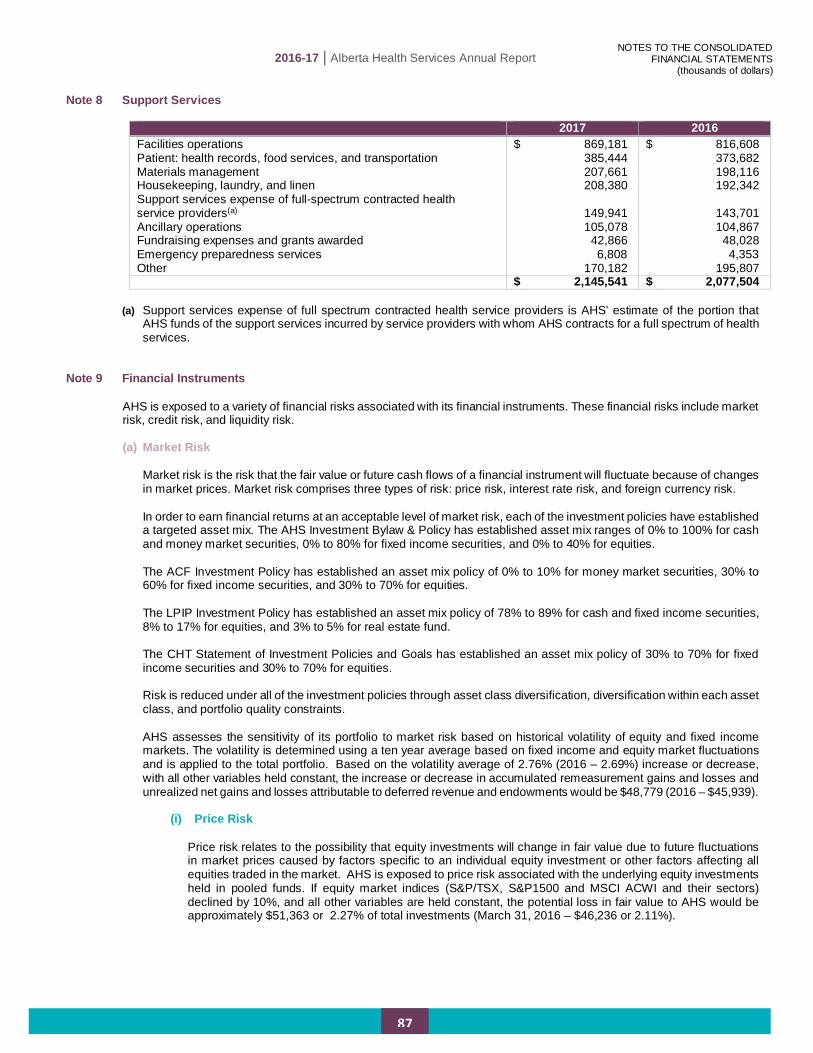
2016-17 | Alberta Health Services Annual Report
NOTES TO THE CONSOLIDATED FINANCIAL STATEMENTS
(thousands of dollars)
87
Note 8 Support Services
2017 2016 Facilities operations $ 869,181 $ 816,608 Patient: health records, food services, and transportation 385,444 373,682 Materials management 207,661 198,116 Housekeeping, laundry, and linen 208,380 192,342 Support services expense of full-spectrum contracted health service providers(a) 149,941 143,701 Ancillary operations 105,078 104,867 Fundraising expenses and grants awarded 42,866 48,028 Emergency preparedness services 6,808 4,353 Other 170,182 195,807 $ 2,145,541 $ 2,077,504
(a) Support services expense of full spectrum contracted health service providers is AHS’ estimate of the portion that
AHS funds of the support services incurred by service providers with whom AHS contracts for a full spectrum of health services.
Note 9 Financial Instruments
AHS is exposed to a variety of financial risks associated with its financial instruments. These financial risks include market risk, credit risk, and liquidity risk.
(a) Market Risk
Market risk is the risk that the fair value or future cash flows of a financial instrument will fluctuate because of changes in market prices. Market risk comprises three types of risk: price risk, interest rate risk, and foreign currency risk. In order to earn financial returns at an acceptable level of market risk, each of the investment policies have established a targeted asset mix. The AHS Investment Bylaw & Policy has established asset mix ranges of 0% to 100% for cash and money market securities, 0% to 80% for fixed income securities, and 0% to 40% for equities. The ACF Investment Policy has established an asset mix policy of 0% to 10% for money market securities, 30% to 60% for fixed income securities, and 30% to 70% for equities. The LPIP Investment Policy has established an asset mix policy of 78% to 89% for cash and fixed income securities, 8% to 17% for equities, and 3% to 5% for real estate fund. The CHT Statement of Investment Policies and Goals has established an asset mix policy of 30% to 70% for fixed income securities and 30% to 70% for equities. Risk is reduced under all of the investment policies through asset class diversification, diversification within each asset class, and portfolio quality constraints.
AHS assesses the sensitivity of its portfolio to market risk based on historical volatility of equity and fixed income markets. The volatility is determined using a ten year average based on fixed income and equity market fluctuations and is applied to the total portfolio. Based on the volatility average of 2.76% (2016 – 2.69%) increase or decrease, with all other variables held constant, the increase or decrease in accumulated remeasurement gains and losses and unrealized net gains and losses attributable to deferred revenue and endowments would be $48,779 (2016 – $45,939).
(i) Price Risk
Price risk relates to the possibility that equity investments will change in fair value due to future fluctuations in market prices caused by factors specific to an individual equity investment or other factors affecting all equities traded in the market. AHS is exposed to price risk associated with the underlying equity investments held in pooled funds. If equity market indices (S&P/TSX, S&P1500 and MSCI ACWI and their sectors) declined by 10%, and all other variables are held constant, the potential loss in fair value to AHS would be approximately $51,363 or 2.27% of total investments (March 31, 2016 – $46,236 or 2.11%).

2016-17 | Alberta Health Services Annual Report
NOTES TO THE CONSOLIDATED FINANCIAL STATEMENTS
(thousands of dollars)
88
Note 9 Financial Instruments (continued)
(ii) Interest Rate Risk
Interest rate risk is the risk that the value of a financial instrument might be adversely affected by a change in market interest rates. Changes in market interest rates may have an effect on the cash flows associated with some financial assets and liabilities, known as cash flow risk, and on the fair value of other financial assets or liabilities, known as price risk. AHS manages the interest rate risk exposure of its fixed income investments by management of average duration and laddered maturity dates.
AHS is exposed to interest rate risk through its investments in fixed income securities with both fixed and floating interest rates. AHS has fixed interest rate loans for all debt, thereby mitigating interest rate risk from rate fluctuations over the term of the outstanding debt. The fair value of fixed rate debt fluctuates with changes in market interest rates but the related future cash flows will not change.
In general, investment returns for bonds and mortgage funds are sensitive to changes in the level of interest rates, with longer term interest bearing securities being more sensitive to interest rate changes than shorter term bonds.
A 1% change in market yield relating to fixed income securities would have increased or decreased fair value by approximately $68,009 (March 31, 2016 – $65,654).
Fixed income securities include bonds and money market securities. The fixed income securities have the following average maturity structure ranging from 2017 and 2067.:
2017 2016 0 – 5 years 78% 76% 6 – 10 years 13% 13% Over 10 years
9% 11%
Effective Market Yield Average
Effective Market Yield Asset Class < 1 year 1-5 years > 5 years
Interest bearing securities 1.28% 1.31% 2.69% 1.76%
(iii) Foreign Currency Risk
Foreign currency risk is the risk that the fair value of future cash flows of a financial instrument will fluctuate because of changes in foreign exchange rates. The fair value of cash and investments denominated in foreign currencies is translated into Canadian dollars on a daily basis using the reporting date exchange rate. AHS is exposed to foreign exchange fluctuations on its cash denominated in foreign currencies. At March 31, 2017, no investment balances were denominated in foreign currency (2016 – $nil).
Foreign currency risk is managed by the fact that the investment policies limit non-Canadian equities to a maximum of 10% to 45% of the total investment portfolio, depending on the policy. At March 31, 2017, investments in non-Canadian equities represented 15.7% (March 31, 2016 – 13.40%) of total portfolio investments.
Foreign exchange fluctuations on cash balances are mitigated by forward contracts and holding minimal foreign currency cash balances. At March 31, 2017, AHS held US dollar forward contracts with ATB Financial to manage currency fluctuations relating to its US dollar accounts payable requirements. As at March 31, 2017, AHS held derivatives in the form of forward contracts for future settlement of $18,000 (2016 – $24,000). The fair value of these forward contracts as at March 31, 2017 was a gain of $501 (2016 – loss of $141) and is included in investments (Note 10).

2016-17 | Alberta Health Services Annual Report
NOTES TO THE CONSOLIDATED FINANCIAL STATEMENTS
(thousands of dollars)
89
Note 9 Financial Instruments (continued)
(b) Credit Risk Credit risk is the risk of loss arising from the failure of a counterparty to fully honour its financial obligations. The credit quality of financial assets is generally assessed by reference to external credit ratings. Credit risk can also lead to losses when issuers and debtors are downgraded by credit rating agencies. All of the investment policies restrict the types and proportions of eligible investments, thus mitigating AHS’ exposure to credit risk. Accounts receivable primarily consists of amounts receivable from AH, other Alberta government reporting entities, patients, other provinces and territories, Workers’ Compensation Board, and the federal government. AHS periodically reviews the collectability of its accounts receivable and establishes an allowance based on its best estimate of potentially uncollectible amounts. Under the AHS Investment Bylaw, money market securities are limited to a rating of R1 or equivalent or higher, and no more than 10% may be invested in any one issuer. Investments in corporate bonds are limited to BBB or equivalent rated bonds or higher and no more than 40% of the total fixed income securities. Investments in debt and equity of any one issuer are limited to 5% of the issuer’s total debt and equity. AHS holds unrated mortgage fund investments. Short selling is not permitted. The ACF Investment Policy limits the overall rating of all fixed income instruments to at least an A rating, and no more than 10% of publicly traded equities may be invested in any one issuer. The LPIP Investment Policy limits money market securities to a rating of R1 or equivalent or higher, and no more than 10% may be invested in any one issuer, unless guaranteed by the Government of Canada or a Canadian province. Investments in corporate bonds are limited to BBB or equivalent rated bonds or higher. Investments in debt and equity of any one issuer are limited to 10% of total equities. LPIP holds unrated mortgage fund investments. The CHT Statement of Investment Policies and Goals limits the overall rating of fixed income securities to BBB or equivalent or higher, and no more than 10% of fixed income securities or equities may be invested in any one issuer. The following table summarizes AHS’ investment in debt securities by counterparty credit rating at March 31, 2017.
Credit Rating 2017 2016 Investment Grade (AAA to BBB-) 90% 90% Unrated 10% 10% 100% 100%
(c) Liquidity Risk
Liquidity risk is the risk that AHS will encounter difficulty in meeting obligations associated with financial liabilities that are settled by delivery of cash or another financial asset. Liquidity requirements of AHS are met through funding in advance by AH, income generated from investments, and by investing in liquid assets, such as money market investments, equities, and bonds traded in an active market that are easily sold and converted to cash.

2016-17 | Alberta Health Services Annual Report
NOTES TO THE CONSOLIDATED FINANCIAL STATEMENTS
(thousands of dollars)
90
Note 10 Investments
2017 2016 Fair Value Cost Fair Value Cost
Cash held for investments $ 106,666 $ 106,666 $ 108,650 $ 108,650 Interest bearing securities:
Money market securities 101,113 101,113 139,986 139,986 Fixed income securities 1,543,462 1,546,500 1,476,511 1,466,168
1,644,575 1,647,613 1,616,497 1,606,154 Equities:
Canadian public pooled equity funds 157,446 136,403 169,064 155,830 Global public pooled equity funds 356,179 312,159 293,295 283,265
513,625 448,562 462,359 439,095 $ 2,264,866 $ 2,202,841 $ 2,187,506 $ 2,153,899
2017 2016
Items at Fair Value Financial instruments designated to the fair value category $ 1,750,740 $ 1,725,288
Portfolio investments in equity instruments that are quoted in an active market
513,625 462,359
Derivatives 501 (141) $ 2,264,866 $ 2,187,506
Included in the investments is $161,134 (March 31, 2016 – $147,572) that is restricted for use as per the requirements in Sections 99 and 100 of the Insurance Act of Alberta. Endowments included in investments amount to $74,710 (March 31, 2016 – $73,402). As AHS is comprised of multiple entities as described in Note 2(a), investments are governed independently under multiple investment policies and procedures. The fair value of investments governed under each investment policy is as follows:
2017 2016
AHS Investment Bylaw & Policy $ 1,801,679 $ 1,752,970 ACF Investment Policy 160,219 153,158 LPIP Investment Policy 184,000 176,610 CHT Statement of Investment Policies and Goals 118,968 104,768
$ 2,264,866 $ 2,187,506
Investments are measured at fair value with the differences between cost and fair value being recorded as a remeasurement gain or loss or recorded as deferred revenue. The following are the total net remeasurement gains on investments:
2017 2016
Accumulated remeasurement gains $ 28,866 $ 5,022 Restricted unrealized net gains attributable to
unexpended deferred operating revenue and endowments (Note 14(b))
32,811
28,558
Restricted unrealized net gains attributable to unexpended deferred capital revenue (Note 15(b)) 348 27
$ 62,025 $ 33,607

2016-17 | Alberta Health Services Annual Report
NOTES TO THE CONSOLIDATED FINANCIAL STATEMENTS
(thousands of dollars)
91
Note 10 Investments (continued) Fair Value Hierarchy
2017 Level 1 Level 2 Level 3 Total
Cash held for investments $ 106,666 $ - $ - $ 106,666 Interest bearing securities: Money market securities - 101,113 - 101,113 Fixed income securities - 1,406,541 136,921 1,543,462 Equities: Canadian public pooled
equity funds 156,154 1,292 - 157,446 Global public pooled equity
funds 254,321 101,858 - 356,179 $ 517,141 $ 1,610,804 $ 136,921 $ 2,264,866 Percent of total 23% 71% 6% 100%
2016
Level 1 Level 2 Level 3 Total Cash held for investments $ 108,650 $ - $ - $ 108,650 Interest bearing securities: Money market securities - 139,986 - 139,986 Fixed income securities - 1,351,309 125,202 1,476,511 Equities: Canadian public pooled
equity funds
167,817 1,247 - 169,064 Global public pooled equity
funds
193,722 99,573 - 293,295 $ 470,189 $ 1,592,115 $ 125,202 $ 2,187,506 Percent of total 21% 73% 6% 100%
Note 11 Accounts Receivable
2017 2016
Gross Allowance
for Doubtful Accounts
Net Net
Patient accounts receivable $ 109,658 $ 24,301 $ 85,357 $ 98,632 AH operating transfers receivable 89,247 - 89,247 72,387 Other operating transfers receivable 45,810 - 45,810 20,984
Other capital transfers receivable 82,797 - 82,797 116,888 Other accounts receivable 83,103 22 83,081 84,602
$ 410,615 $ 24,323 $ 386,292 $ 393,493 At March 31, 2016, the total allowance for doubtful accounts was $29,199.
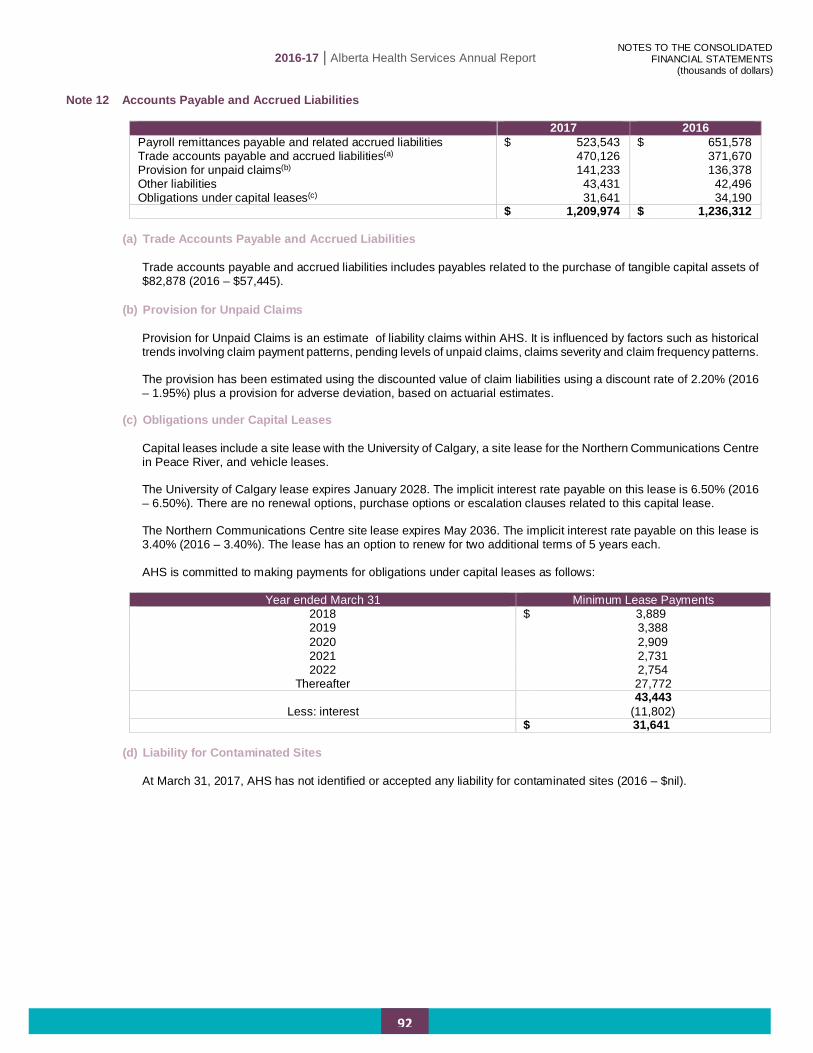
2016-17 | Alberta Health Services Annual Report
NOTES TO THE CONSOLIDATED FINANCIAL STATEMENTS
(thousands of dollars)
92
Note 12 Accounts Payable and Accrued Liabilities
2017 2016 Payroll remittances payable and related accrued liabilities $ 523,543 $ 651,578 Trade accounts payable and accrued liabilities(a) 470,126 371,670 Provision for unpaid claims(b) 141,233 136,378 Other liabilities 43,431 42,496 Obligations under capital leases(c) 31,641 34,190 $ 1,209,974 $ 1,236,312
(a) Trade Accounts Payable and Accrued Liabilities
Trade accounts payable and accrued liabilities includes payables related to the purchase of tangible capital assets of $82,878 (2016 – $57,445).
(b) Provision for Unpaid Claims Provision for Unpaid Claims is an estimate of liability claims within AHS. It is influenced by factors such as historical trends involving claim payment patterns, pending levels of unpaid claims, claims severity and claim frequency patterns.
The provision has been estimated using the discounted value of claim liabilities using a discount rate of 2.20% (2016 – 1.95%) plus a provision for adverse deviation, based on actuarial estimates.
(c) Obligations under Capital Leases Capital leases include a site lease with the University of Calgary, a site lease for the Northern Communications Centre in Peace River, and vehicle leases. The University of Calgary lease expires January 2028. The implicit interest rate payable on this lease is 6.50% (2016 – 6.50%). There are no renewal options, purchase options or escalation clauses related to this capital lease.
The Northern Communications Centre site lease expires May 2036. The implicit interest rate payable on this lease is 3.40% (2016 – 3.40%). The lease has an option to renew for two additional terms of 5 years each.
AHS is committed to making payments for obligations under capital leases as follows:
Year ended March 31 Minimum Lease Payments
2018 $ 3,889 2019 3,388 2020 2,909 2021 2,731 2022 2,754
Thereafter 27,772 43,443
Less: interest (11,802) $ 31,641
(d) Liability for Contaminated Sites At March 31, 2017, AHS has not identified or accepted any liability for contaminated sites (2016 – $nil).

2016-17 | Alberta Health Services Annual Report
NOTES TO THE CONSOLIDATED FINANCIAL STATEMENTS
(thousands of dollars)
93
Note 13 Employee Future Benefits
(a) Accumulating Non-Vesting Sick Leave Liability
Sick leave benefits are paid by AHS; there are no employee contributions and no assets set aside to support the obligation. The AHS sick leave liability is based on an actuarial valuation as at March 31, 2015, and extrapolated to March 31, 2017 by AHS. The next actuarial valuation will be performed as at March 31, 2018. The following table summarizes the accumulating non-vesting sick leave liability.
2017 2016 Change in accrued benefit obligation and funded status
Accrued benefit obligation and funded status, beginning of year
$ 118,969 $ 114,979
Current service cost 10,262 9,939 Interest cost 3,621 3,486 Benefits paid (8,675) (9,435) Actuarial gain (9,000) - Accrued benefit obligation and funded status, end of year $ 115,177 $ 118,969
Reconciliation to accrued benefit liability
Funded status – deficit $ 115,177 $ 118,969 Unamortized net actuarial loss (2,687) (12,954) Accrued benefit liability $ 112,490 $ 106,015
Components of expense
Current service cost $ 10,262 $ 9,939 Interest cost 3,621 3,486 Amortization of net actuarial loss 1,267 1,267 Net expense $ 15,150 $ 14,692
Assumptions
Discount rate – beginning of year 2.90% 2.90% Discount rate – end of year 2.02% 2.90% Rate of compensation increase per year 2016-2017
2.43% 2015-2016
3.21% 2017-2018
0.75% 2016-2017
2.43%
Thereafter 2.75%
Thereafter 3.25%
2017 2016 Accrued vacation pay $ 540,547 $ 514,672 Accumulating non-vesting sick leave liability(a) 112,490 106,015 Registered defined benefit pension plans(b) (c) - - $ 653,037 $ 620,687

2016-17 | Alberta Health Services Annual Report
NOTES TO THE CONSOLIDATED FINANCIAL STATEMENTS
(thousands of dollars)
94
Note 13 Employee Future Benefits (continued)
(b) Local Authorities Pension Plan (LAPP) (i) AHS Participation in the LAPP
The majority of AHS employees participate in the LAPP. AHS is not responsible for future funding of the plan deficit other than through contribution increases. As AHS is exposed to the risk of contribution rate increases, the following disclosure is provided to explain this risk. The LAPP provides for a pension of 1.4% for each year of pensionable service based on the average salary of the highest five consecutive years up to the average Canada Pension Plan’s Year’s Maximum Pensionable Earnings (YMPE), over the same five consecutive year period and 2.0% on the excess, subject to the maximum pension benefit limit allowed under the Income Tax Act (Canada). The maximum pensionable service allowable under the plan is 35 years.
(ii) LAPP Deficit
An actuarial valuation of the LAPP was carried out as at December 31, 2015 by Mercer (Canada) Limited and these results were then extrapolated to December 31, 2016 for use in the LAPP 2016 audited financial statements. LAPP’s December 31, 2016 net assets available for benefits divided by LAPP’s pension obligation shows that the LAPP is 98% (2015 – 97%) funded.
December 31, 2016 December 31, 2015 LAPP net assets available for benefits $ 37,722,943 $ 34,419,584 LAPP pension obligation 38,360,300 35,343,000 LAPP deficiency $ (637,357) $ (923,416)
The 2016 and 2017 LAPP contribution rates are as follows:
Calendar 2017 Calendar 2016
Employer Employees Employer Employees 11.39% of pensionable
earnings up to the YMPE and 15.84% of the excess
10.39% of pensionable earnings up to the YMPE and 14.84% of the excess
11.39% of pensionable earnings up to the YMPE and 15.84% of the excess
10.39% of pensionable earnings up to the YMPE and 14.84% of the excess
(c) Pension Expense
2017 2016 Local Authorities Pension Plan $ 595,795 $ 570,438 Defined contribution pension plans and group RRSPs 48,397 46,763 Supplemental Pension Plan 2,230 1,882 Supplemental Executive Retirement Plans 2,240 (788) Management Employees Pension Plan 585 668 $ 649,247 $ 618,963

2016-17 | Alberta Health Services Annual Report
NOTES TO THE CONSOLIDATED FINANCIAL STATEMENTS
(thousands of dollars)
95
Note 14 Unexpended Deferred Operating Revenue
(a) Changes in the unexpended deferred operating revenue balance are as follows:
2017 2016
AH Other Government(i)
Donors and Non-
Government Total Total
Balance, beginning of year $ 153,253 $ 25,055 $ 251,207 $ 429,515 $ 491,254 Received or receivable during the year,
net of repayments 927,960 76,747 134,360 1,139,067 1,210,987 Restricted investment income 253 1,645 5,818 7,716 6,579 Transferred from (to) unexpended
deferred capital revenue 3,696 60,529 (16,764) 47,461 48,395 Recognized as revenue (953,328) (118,303) (120,120) (1,191,751) (1,272,042) Miscellaneous other revenue recognized (196) (5) (24,981) (25,182) (25,891) 131,638 45,668 229,520 406,826 459,282 Changes in unrealized net gains
attributable to portfolio investments related to endowments and unexpended deferred operating revenue
(1,783) 18 6,018 4,253 (29,767) Balance, end of year $ 129,855 $ 45,686 $ 235,538 $ 411,079 $ 429,515
(i) The balance at March 31, 2017 for other government includes $582 of unexpended deferred operating revenue received from the federal government (March 31, 2016 – $549). The remaining balance in other government all relates to the GOA, see Note 21.
(b) The unexpended deferred operating revenue balance at the end of the year is externally restricted for the following
purposes:
2017 2016
AH Other Government
Donors and Non-
Government Total Total
Research and education $ 19,263 $ 3,080 $ 134,835 $ 157,178 $ 158,148 Cancer prevention, screening and treatment 27,454 - 711 28,165 18,861 Physician revenue and alternate relationship plans 26,129 1,112 - 27,241 21,660 Promotion, prevention and community 6,748 19,486 605 26,839 14,120 Addiction and mental health 20,912 - - 20,912 19,330 Primary Care Networks 19,372 - - 19,372 44,146 Long term care partnerships - 17,227 - 17,227 15,479 Emergency and outpatient services 2,297 305 1,413 4,015 11,033 Administration and support services 4,852 3,361 51,161 59,374 67,240 Others less than $10,000 4,588 1,095 12,262 17,945 30,940
131,615 45,666 200,987 378,268 400,957 Unrealized net gain (loss) attributable to portfolio investments related to endowments and unexpended deferred operating revenue (Note 10) (1,760) 20 34,551 32,811 28,558
$ 129,855 $ 45,686 $ 235,538 $ 411,079 $ 429,515

2016-17 | Alberta Health Services Annual Report
NOTES TO THE CONSOLIDATED FINANCIAL STATEMENTS
(thousands of dollars)
96
Note 15 Unexpended Deferred Capital Revenue
(a) Changes in the unexpended deferred capital revenue balance are as follows:
2017 2016
AH Other Government(i)
Donors and Non-
Government Total Total
Balance, beginning of year $ 57,916 $ 9,175 $ 81,228 $ 148,319 $ 178,078 Received or receivable during the year 30,300 184,468 29,371 244,139 194,567 Transferred tangible capital assets (Note 18(a)) - 215,933 - 215,933 399,992
Restricted investment income - - - - 63 Unexpended deferred capital revenue returned - - (1,220) (1,220) (4,698)
Transfer to expended deferred capital revenue (45,285) (332,402) (43,851) (421,538) (561,027)
Used for the acquisition of land - (687) - (687) - Transferred (to) from unexpended deferred operating revenue (3,696) (60,529) 16,764 (47,461) (48,395)
39,235 15,958 82,292 137,485 158,580 Changes in unrealized net gain on portfolio investments related to unexpended deferred capital revenue 321 - - 321 (10,261)
Balance, end of year $ 39,556 $ 15,958 $ 82,292 $ 137,806 $ 148,319 (i) The balance at March 31, 2017 for other government all relates to the GOA, see Note 21.
(b) The unexpended deferred capital revenue balance at the end of the year is externally restricted for the following
purposes:
2017 2016 AH
Information systems less than $10,000 $ 32,504 $ 38,741 Medical Equipment Replacement Upgrade Program 18 11,367 Equipment less than $10,000 6,686 7,781
Total AH 39,208 57,889 Other government
Facilities and improvements less than $10,000 15,958 9,176 Total other government 15,958 9,176 Donors and non-government
Equipment less than $10,000 80,482 73,918 Facilities and improvements less than $10,000 1,810 7,309
Total donors and non-government 82,292 81,227 Unrealized net gain on portfolio investments related to unexpended deferred capital revenue (Note 10) 348 27
$ 137,806 $ 148,319

2016-17 | Alberta Health Services Annual Report
NOTES TO THE CONSOLIDATED FINANCIAL STATEMENTS
(thousands of dollars)
97
Note 16 Expended Deferred Capital Revenue
Changes in the expended deferred capital revenue balance are as follows:
2017 2016
AH Other Government(i)
Donors and Non-
Government Total Total
Balance, beginning of year $ 297,812 $ 6,056,411 $ 176,209 $ 6,530,432 $ 6,363,699 Transferred from unexpended deferred
capital revenue
45,285 332,402 43,851 421,538 561,027 Used for the acquisition of land - 687 - 687 - Less: amounts recognized as revenue (86,784) (278,112) (37,991) (402,887) (394,294) Balance, end of year $ 256,313 $ 6,111,388 $ 182,069 $ 6,549,770 $ 6,530,432
(i) The balance at March 31, 2017 for other government includes $78 of expended deferred capital revenue received from the federal government (March 31, 2016 – $nil). The remaining balance in other government all relates to the GOA, see Note 21.
Note 17 Debt
2017 2016 Debentures payable(a):
Parkade loan #1 $ 32,223 $ 34,903 Parkade loan #2 30,278 32,505 Parkade loan #3 39,089 41,432 Parkade loan #4 147,262 154,086 Parkade loan #5 35,605 37,204 Parkade loan #6 24,418 25,300 Parkade loan #7(b) 51,500 -
Energy savings initiative loan(b) 25,800 - Other 1,212 1,479
387,387 326,909 Loan proceeds to be received(b) (67,300) -
$ 320,087 $ 326,909
(a) AHS issued debentures to Alberta Capital Financing Authority (ACFA), a related party, to finance the construction of parkades. AHS has pledged revenue derived directly or indirectly from the operations of all parking facilities being built, renovated, owned, and operated by AHS as security for these debentures.
AHS issued a debenture to ACFA relating to an energy savings initiative. AHS has pledged the mortgage on the Royal Alexandra Lands and Alberta Hospital Lands as security for this debenture.
The maturity dates and interest rates for the debentures are as follows:
Maturity Date Fixed Interest Rate Parkade loan #1 Parkade loan #2 Parkade loan #3 Parkade loan #4 Parkade loan #5 Parkade loan #6 Parkade loan #7 Energy savings initiative loan Other
September 2026 September 2027 March 2029 September 2031 June 2032 December 2035 March 2038 December 2030 March 2021
4.4025% 4.3870% 4.9150% 4.9250% 4.2280% 3.6090% 2.6400% 2.4160% 4.6000%
(b) At March 31, 2017, $5,000 of $51,500 had been advanced to AHS relating to the Foothills Medical Centre Lot 1
parkade debenture with the remainder to be drawn by March 2018. Semi-annual principal and interest payments of $1,665 will commence September 2018. At March 31, 2017, $5,000 of $25,800 had been advanced to AHS relating to the Energy Savings initiative with the remainder to be drawn by December 2017. Semi-annual principal and interest payments of $1,162 will commence June 2018.

2016-17 | Alberta Health Services Annual Report
NOTES TO THE CONSOLIDATED FINANCIAL STATEMENTS
(thousands of dollars)
98
Note 17 Debt (continued)
AHS is committed to making payments as follows:
Debentures Payable, Term/Other Loan and
Mortgages Payable Year ended March 31 Principal Payments
2018 $ 17,612 2019 22,133 2020 23,091 2021 24,092 2022 24,800
Thereafter 275,659 $ 387,387
During the year, the amount of total interest expensed, including interest related to obligations under capital leases, was $16,221 (2016 – $15,249).
(c) As at March 31, 2017, AHS has access to a $220,000 (March 31, 2016 – $220,000) revolving demand facility with a Canadian chartered bank which may be used for operating purposes. Draws on the facility bear interest at the bank’s prime rate less 0.50% per annum. As at March 31, 2017, AHS has $nil (March 31, 2016 – $nil) draws against this facility.
AHS also has access to a $33,000 (March 31, 2016 – $33,000) revolving demand letter of credit facility which may be used to secure AHS’ obligations to third parties. At March 31, 2017, AHS has $3,469 (March 31, 2016 – $3,664) in a letter of credit outstanding against this facility. AHS is in compliance with the terms of the agreement relating to the letter of credit, therefore no liability has been recorded.

2016-17 | Alberta Health Services Annual Report
NOTES TO THE CONSOLIDATED FINANCIAL STATEMENTS
(thousands of dollars)
99
Note 18 Tangible Capital Assets
Cost 2016 Additions(a) Transfers out of
Work in Progress
Disposals 2017
Facilities and improvements $ 8,488,610 $ - $ 510,770 $ (2,625) $ 8,996,755 Work in progress 1,086,124 418,267 (590,285) - 914,106 Equipment(b) 2,179,617 153,429 1,256 (31,483) 2,302,819 Information systems 1,331,861 24,391 17,754 (11,350) 1,362,656 Building service equipment 567,261 - 43,815 (55) 611,021 Land(c) 110,069 687 - (167) 110,589 Leased facilities and improvements 219,937 247 4,784 - 224,968
Land improvements 70,919 - 11,906 (61) 82,764 $ 14,054,398 $ 597,021 $ - $ (45,741) $ 14,605,678
Accumulated Amortization 2016 Amortization Expense
Effect of Transfers Disposals 2017
Facilities and improvements $ 3,179,295 $ 236,203 $ - $ (2,626) $ 3,412,872 Work in progress - - - - - Equipment(b) 1,678,226 155,393 - (31,084) 1,802,535 Information systems 1,081,472 110,696 - (11,350) 1,180,818 Building service equipment 332,616 32,449 - (49) 365,016 Land(c) - - - - - Leased facilities and improvements 149,431 12,891 - - 162,322
Land improvements 60,287 2,812 - (61) 63,038 $ 6,481,327 $ 550,444 $ - $ (45,170) $ 6,986,601
Net Book Value 2017 2016
Facilities and improvements $ 5,583,883 $ 5,309,315 Work in progress 914,106 1,086,124 Equipment 500,284 501,391 Information systems 181,838 250,389 Building service equipment 246,005 234,645 Land 110,589 110,069 Leased facilities and improvements 62,646 70,506 Land improvements 19,726 10,632
$ 7,619,077 $ 7,573,071

2016-17 | Alberta Health Services Annual Report
NOTES TO THE CONSOLIDATED FINANCIAL STATEMENTS
(thousands of dollars)
100
Note 18 Tangible Capital Assets (continued)
Cost 2015 Additions(a) Transfers out of
Work in Progress
Disposals 2016
Facilities and improvements $ 8,287,500 $ - $ 201,923 $ (813) $ 8,488,610 Work in progress 834,328 524,033 (272,237) - 1,086,124 Equipment(b) 2,185,995 104,390 4,985 (115,753) 2,179,617 Information systems 1,349,427 4,420 25,595 (47,581) 1,331,861 Building service equipment 539,452 - 27,834 (25) 567,261 Land(c) 110,069 - - - 110,069 Leased facilities and improvements 191,866 17,942 10,129 - 219,937
Land improvements 69,148 - 1,771 - 70,919 $ 13,567,785 $ 650,785 $ - $ (164,172) $ 14,054,398
Accumulated Amortization 2015 Amortization Expense
Effect of Transfers Disposals 2016
Facilities and improvements $ 2,955,848 $ 224,212 $ - $ (765) $ 3,179,295 Work in progress - - - - - Equipment(b) 1,602,510 191,046 - (115,330) 1,678,226 Information systems 1,000,609 128,444 - (47,581) 1,081,472 Building service equipment 304,910 27,731 - (25) 332,616 Land(c) - - - - - Leased facilities and improvements 134,819 14,612 - - 149,431
Land improvements 57,952 2,335 - - 60,287 $ 6,056,648 $ 588,380 $ - $ (163,701) $ 6,481,327
Net Book Value 2016 2015
Facilities and improvements $ 5,309,315 $ 5,331,652 Work in progress 1,086,124 834,328 Equipment 501,391 583,485 Information systems 250,389 348,818 Building service equipment 234,645 234,542 Land 110,069 110,069 Leased facilities and improvements 70,506 57,047 Land improvements 10,632 11,196
$ 7,573,071 $ 7,511,137
(a) Transferred Tangible Capital Assets
Additions include total transferred tangible capital assets of $215,933 (2016 – $399,992) consisting of $215,933 from AI (2016 – $399,927) and $nil from other sources (2016 – $65).
(b) Leased Equipment
Equipment includes tangible capital assets acquired through capital leases at a cost of $13,417 (2016 – $15,694) with accumulated amortization of $11,266 (March 31, 2016 – $11,859). For the year ended March 31, 2017, leased equipment included a net decrease of $1,137 related to vehicles under capital leases (2016 – net decrease of $362).
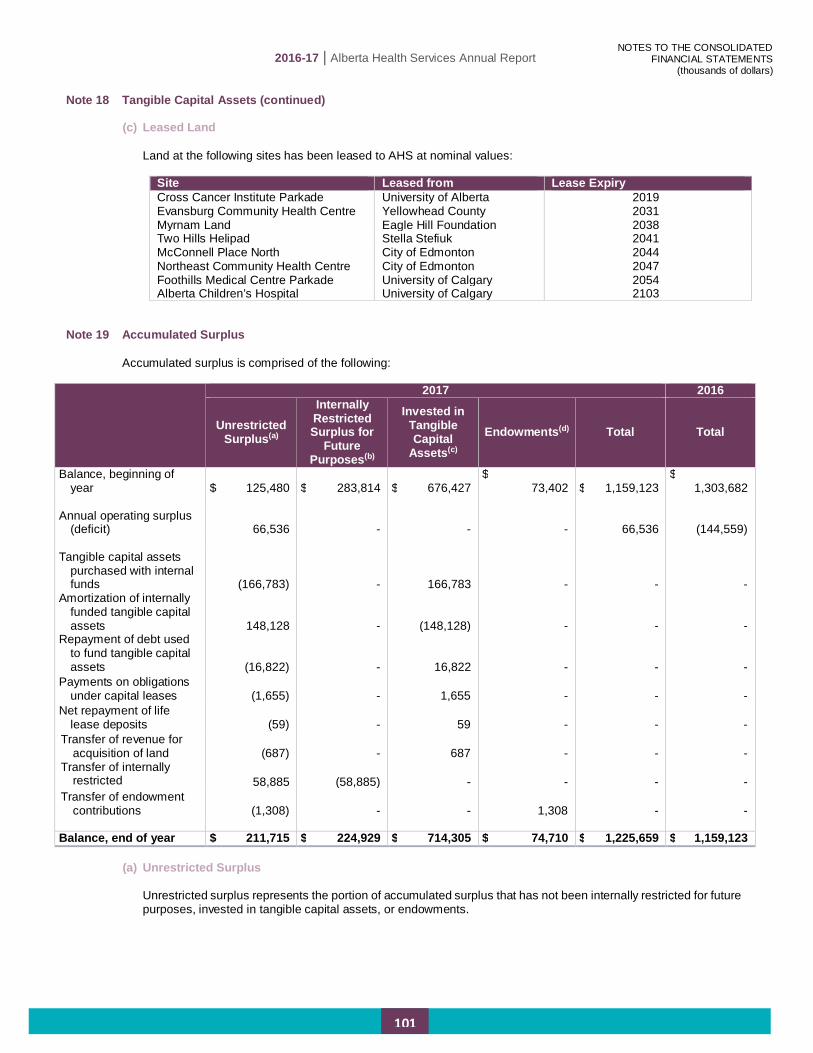
2016-17 | Alberta Health Services Annual Report
NOTES TO THE CONSOLIDATED FINANCIAL STATEMENTS
(thousands of dollars)
101
Note 18 Tangible Capital Assets (continued)
(c) Leased Land
Land at the following sites has been leased to AHS at nominal values:
Site Leased from Lease Expiry Cross Cancer Institute Parkade University of Alberta 2019 Evansburg Community Health Centre Yellowhead County 2031 Myrnam Land Eagle Hill Foundation 2038 Two Hills Helipad Stella Stefiuk 2041 McConnell Place North City of Edmonton 2044 Northeast Community Health Centre City of Edmonton 2047 Foothills Medical Centre Parkade University of Calgary 2054 Alberta Children’s Hospital University of Calgary 2103
Note 19 Accumulated Surplus Accumulated surplus is comprised of the following:
2017 2016
Unrestricted Surplus(a)
Internally Restricted Surplus for
Future Purposes(b)
Invested in Tangible Capital
Assets(c)
Endowments(d) Total Total
Balance, beginning of year $ 125,480 $ 283,814 $ 676,427
$ 73,402 $ 1,159,123
$ 1,303,682
Annual operating surplus
(deficit) 66,536 - - - 66,536 (144,559) Tangible capital assets
purchased with internal funds (166,783) - 166,783 - - -
Amortization of internally funded tangible capital assets 148,128 - (148,128) - - -
Repayment of debt used to fund tangible capital assets (16,822) - 16,822 - - -
Payments on obligations under capital leases (1,655) - 1,655 - - -
Net repayment of life lease deposits (59) - 59 - - -
Transfer of revenue for acquisition of land (687) - 687 - - -
Transfer of internally restricted
58,885 (58,885) - - - - Transfer of endowment
contributions (1,308) - - 1,308 - - Balance, end of year $ 211,715 $ 224,929 $ 714,305 $ 74,710 $ 1,225,659 $ 1,159,123
(a) Unrestricted Surplus
Unrestricted surplus represents the portion of accumulated surplus that has not been internally restricted for future purposes, invested in tangible capital assets, or endowments.

2016-17 | Alberta Health Services Annual Report
NOTES TO THE CONSOLIDATED FINANCIAL STATEMENTS
(thousands of dollars)
102
Note 19 Accumulated Surplus (continued)
(b) Internally Restricted Surplus for Future Purposes The Board has approved the restriction of accumulated surplus for future purposes as follows:
2017 2016
Ancillary services (i) $ 112,718 $ 92,842 Insurance equity requirements (ii) 42,224 41,431 Foundations (iii) 39,987 34,545 Other (iv) 30,000 114,996 Internally restricted surplus for future purposes $ 224,929 $ 283,814
(i) Restriction of ancillary operation surpluses from parking, retail food services, and controlled entities’ (2015-16
Restriction of ancillary operation surpluses for parking and retail food services). (ii) Restriction of surplus related to equity of the LPIP (2015-16 Restriction of surplus related to equity of the LPIP). (iii) Restriction of surplus related to AHS Controlled Foundations (2015-16 Restriction of surplus for specific local
initiatives as a result of local fundraising, and to fund cancer research). (iv) Restriction of surplus to address funding of expenses for certain initiatives spanning multiple fiscal years (2015-
16 Restriction of surplus related to future capital purposes and the Provincial Clinical Information Systems Initiative (CIS)).
(c) Invested in Tangible Capital Assets
The restriction of accumulated surplus is equal to the net book value of internally funded tangible capital assets as these amounts are only available to AHS for its health care mandate.
(d) Endowments Endowments represent the portion of accumulated surplus that is restricted and must be maintained in perpetuity.
Note 20 Contractual Obligations and Contingent Liabilities
Contractual obligations are AHS’ obligations to others that will become liabilities in the future when the terms of current or existing contracts or agreements are met. (a) Leases
AHS is contractually committed to future operating lease payments as follows:
Year ended March 31 Total Lease Payments 2018 $ 53,243 2019 45,999 2020 38,259 2021 32,055 2022 29,679
Thereafter 69,215 $ 268,450

2016-17 | Alberta Health Services Annual Report
NOTES TO THE CONSOLIDATED FINANCIAL STATEMENTS
(thousands of dollars)
103
Note 20 Contractual Obligations and Contingent Liabilities (continued)
(b) Contingent Liabilities AHS is subject to legal claims during its normal course of business. AHS records a liability when the assessment of a claim indicates that a future event is likely to confirm that an asset had been impaired or a liability incurred at the date of the financial statements and the amount of the contingent loss can be reasonably estimated. Accruals have been made in specific instances where it is likely that losses will be incurred based on a reasonable estimate. As at March 31, 2017, accruals have been recorded as part of the provision for unpaid claims and other liabilities (Note 12). Included in this accrual are claims in which AHS has been jointly named with the Minister. The accrual provided for these claims under the provision for unpaid claims represents AHS’ portion of the liability.
AHS has been named in 186 legal claims (2016 – 176 claims) related to conditions in existence at March 31, 2017 where the likelihood of the occurrence of a future event confirming a contingent loss is not reasonably determinable. Of these, 179 claims have $310,941 in specified amounts and 7 have no specified amounts (2016 – 162 claims with $240,665 of specified claims and 14 claims with no specified amounts). The resolution of indeterminable claims may result in a liability, if any, that is different than the claimed amount. AHS has been named as a co-defendant, along with the GOA, in a certified Class Action (the Claim) arising from increases to long-term accommodation charges implemented by Alberta Government regulations enacted on and after August 1, 2003, and paid by residents of long-term care facilities. The likelihood of the Claim is considered by AHS to be indeterminable, and the amount of the Claim has not yet been specified.
Note 21 Related Parties
Transactions with the following related parties are considered to be undertaken on similar terms and conditions to those adopted if the entities were dealing at arm’s length. Amounts due to or from the related parties and the recorded amounts of the transactions are included within these consolidated financial statements, unless otherwise stated. AH appoints all members of the AHS Board. The viability of AHS’ operations depends on transfers from AH. Transactions between AHS and AH are reported and disclosed in the Consolidated Statement of Operations, the Consolidated Statement of Financial Position, and the Notes to the Consolidated Financial Statements, and are therefore excluded from the table below. Related parties also include key management personnel of AHS. Related party transactions with key management personnel primarily consist of compensation related payments to employees and senior management and are considered to be undertaken on similar terms and conditions to those adopted if the entities were dealing at arm’s length. AHS is considered to be a related party with those entities consolidated or included on a modified equity basis in the GOA consolidated financial statements. Transactions between AHS and the other ministries that are undertaken on similar terms and conditions to those adopted if the entities were dealing at arm’s length are recorded at their exchange amount as follows:

2016-17 | Alberta Health Services Annual Report
NOTES TO THE CONSOLIDATED FINANCIAL STATEMENTS
(thousands of dollars)
104
Note 21 Related Parties (continued)
Revenues(a) Expenses
2017 2016 2017 2016 Ministry of Advanced Education(b) $ 52,621 $ 52,564 $ 122,527 $ 120,194 Ministry of Infrastructure(c) 373,253 340,028 24,538 24,796 Other ministries(d) 60,865 49,096 29,341 29,814 Total for the year $ 486,739 $ 441,688 $ 176,406 $ 174,804
Receivable from Payable to
2017 2016 2017 2016 Ministry of Advanced Education (b) $ 5,536 $ 5,131 $ 26,449 $ 19,009 Ministry of Infrastructure (c) 23,623 49,688 - - Other ministries (d) 30,412 11,318 322,157 329,757 Balance, end of year $ 59,571 $ 66,137 $ 348,606 $ 348,766
(a) Revenues with GOA ministries include other government transfers of $449,067 (2016 – $409,882), (Note 4), other
income of $37,422 (2016 – $31,118), (Note 6), and fees and charges of $250 (2016 – $688). (b) Most of AHS transactions with the Ministry of Advanced Education relate to initiatives with the University of Alberta
and the University of Calgary. These initiatives include teaching, research, and program delivery. A number of physicians are employed by either AHS or the universities but perform services for both. Due to proximity of locations, some initiatives result in sharing physical space and support services. The revenue and expense transactions are a result of grants provided from one to the other and recoveries of shared costs.
(c) The transactions with the Ministry of Infrastructure relate to the construction and funding of tangible capital assets. These transactions include operating transfers of $71,225 (2016 – $47,634) and recognition of expended deferred capital revenue of $277,660 (2016 – $268,090) relating to tangible capital assets with stipulations or external restrictions to utilize over their remaining useful lives. AHS has also recorded an in-kind transfer and expense of $24,368 (2016 – $24,304) for space that is provided by AI rent free. Not included in the table above but included in total amounts disclosed in Note 18(a) is the transfer of tangible capital assets from AI of $215,933 (2016 – $399,927).
(d) The payable transactions with other ministries include the debt payable to ACFA (Note 17(a)).
At March 31, 2017, AHS has recorded deferred revenue from other ministries within the GOA, excluding AH, of $45,104 (March 31, 2016 – $24,506) related to unexpended deferred operating revenue (Note 14), $15,958 (March 31, 2016 – $9,176) related to unexpended deferred capital revenue (Note 15) and $6,111,310 (March 31, 2016 – $6,056,411) related to expended deferred capital revenue (Note 16). Contingent liabilities in which AHS has been jointly named with other government entities within the GOA are disclosed in Note 20.

2016-17 | Alberta Health Services Annual Report
NOTES TO THE CONSOLIDATED FINANCIAL STATEMENTS
(thousands of dollars)
105
Note 22 Government Partnerships
The following is 100% of the financial position and results of operations for AHS’ government partnerships.
2017 2016 Financial assets $ 57,950 $ 122,784 Liabilities 57,950 122,784 Accumulated surplus $ - $ - Total revenues $ 231,097 $ 229,955 Total expenses 231,097 229,955 Annual surplus $ - $ -
AHS has proportionately consolidated 50% of the results of the PCNs and NACTRC.
Note 23 Trusts under Administration
(a) Health Benefit Trust of Alberta (HBTA) AHS is one of more than 30 participants in the HBTA and has a majority of representation on the HBTA governance board. The HBTA is a formal health and welfare trust established under a Trust Agreement effective January 1, 2000. The HBTA provides health and other related employee benefits pursuant to the authorizing Trust Agreement.
The HBTA maintains various reserves to adequately provide for all current obligations and reported fund balances of $78,183 as at December 31, 2016 (December 31, 2015 – $97,502). AHS has included in prepaid expenses $64,317 (March 31, 2016 – $71,664) as a share of the HBTA’s fund balances representing in substance a prepayment of future premiums. These consolidated financial statements do not include the HBTA other than the premiums paid by AHS. For the fiscal year ended March 31, 2017, AHS paid premiums of $340,947 (2016 – $315,103).
(b) Other Trust Funds
AHS receives funds in trust for research and development, education, and other programs. These amounts are held and administered on behalf of others in accordance with the terms and conditions embodied in the relevant agreements with no unilateral power to change the conditions set out in the trust indenture (or agreement) and therefore are not reported in these consolidated financial statements. As at March 31, 2017, the balance of funds held in trust by AHS for research and development is $514 (March 31, 2016 – $3,762). AHS receives funds in trust from continuing care residents for personal expenses. As at March 31, 2017, the balance of these funds is $1,717 (March 31, 2016 – $1,780). These amounts are not included in the consolidated financial statements.
Note 24 Corresponding Amounts
Certain amounts have been reclassified to conform to 2017 presentation.
Note 25 Approval of Consolidated Financial Statements
The consolidated financial statements were approved by the AHS Board on June 1, 2017.

2016-17 | Alberta Health Services Annual Report
SCHEDULES TO THE CONSOLIDATED FINANCIAL STATEMENTS
(thousands of dollars)
106
SCHEDULE 1 – CONSOLIDATED SCHEDULE OF EXPENSES BY OBJECT
YEAR ENDED MARCH 31
2017 2016 Budget (Note 3)
Actual Actual
Salaries and benefits (Schedule 2) $ 7,760,000 $ 7,983,182 $ 7,741,667 Contracts with health service providers 2,635,000 2,539,854 2,451,216 Contracts under the Health Care Protection Act 18,000 20,198 19,300 Drugs and gases 425,000 449,620 417,110 Medical and surgical supplies 390,000 385,213 414,053 Other contracted services 1,173,000 1,106,722 1,134,353 Other(a) 1,330,000 1,367,628 1,333,313 Amortization and disposals of tangible capital assets (Note 18) 587,000 551,015 588,851
$ 14,318,000 $ 14,403,432 $ 14,099,863 (a) Significant amounts included in Other are: Equipment expense $ 223,364 $ 208,119 Other clinical supplies 152,312 149,183 Building rent 132,080 126,825 Building and ground expenses 121,044 107,011 Utilities 105,159 107,608 Housekeeping, laundry and linen, plant
maintenance and biomedical engineering supplies 90,259 87,497
Food and dietary supplies 81,985 80,078 Office supplies 54,040 58,506 Fundraising and grants awarded 50,859 54,426 Insurance and liability claims 49,639 24,199 Minor equipment purchases 45,831 69,436 Travel 41,734 39,462 Telecommunications 39,397 42,070 Licenses, fees and memberships 28,477 24,803 Education 12,107 13,628 Other 139,341 140,462 $ 1,367,628 $ 1,333,313

2016-17 | Alberta Health Services Annual Report
SCHEDULES TO THE CONSOLIDATED FINANCIAL STATEMENTS
(thousands of dollars)
107
SCHEDULE 2 - CONSOLIDATED SCHEDULE OF SALARIES AND BENEFITS
FOR THE YEAR ENDED MARCH 31, 2017
2017 2016
FTE(a) Base Salary (b)
Other Cash
Benefits (c)
Other Non-Cash
Benefits (d) Subtotal
Severance (e)
Total FTE (a) Total Number of Individuals Amount
Total Board (Sub-Schedule 2A) 9.21 $ - $ 310 $ - $ 310 - $ - $ 310 4.42 $ 147 Total Former Official Administrator / Former Advisory Committees - - - - - - - - 4.62 248 Total Executive (Sub-Schedule 2B) 13.86 4,927 34 961 5,922 1 219 6,141 14.38 6,566 Management Reporting to CEO Direct Reports 66.06 15,176 364 2,937 18,477 2 214 18,691 54.81 15,598 Other Management 2,985.79 355,981 3,893 85,522 445,396 18 1,314 446,710 2,971.65 440,242 Medical Doctors not included above(f) 150.06 46,937 380 3,672 50,989 - - 50,989 156.89 53,126 Regulated nurses not included above: RNs, Reg. Psych. Nurses, Grad Nurses 18,966.63 1,807,350 248,976 405,990 2,462,316 2 88 2,462,404 18,773.62 2,386,246 LPNs 4,836.11 315,465 34,991 72,503 422,959 - - 422,959 4,691.76 417,040 Other Health Technical & Professional 16,307.58 1,458,289 83,499 338,966 1,880,754 7 60 1,880,814 15,964.01 1,824,007 Unregulated Health Service Providers 8,716.34 442,343 43,373 107,204 592,920 3 35 592,955 8,542.13 585,336 Other Staff 26,382.57 1,667,727 55,831 376,998 2,100,556 37 653 2,101,209 25,829.17 2,013,111
Total 78,434.21 $ 6,114,195 $ 471,651 $ 1,394,753 $ 7,980,599 70 $ 2,583 $ 7,983,182 77,007.46 $ 7,741,667 The accompanying footnotes and sub-schedules are part of this schedule.

2016-17 | Alberta Health Services Annual Report
SCHEDULES TO THE CONSOLIDATED FINANCIAL STATEMENTS
(thousands of dollars)
108
SUB-SCHEDULE 2A – BOARD REMUNERATION FOR THE YEAR ENDED MARCH 31, 2017
Term 2017 Committees 2017
Remuneration 2016
Remuneration
Board Chair Linda Hughes(g) Since Nov 27, 2015 ARC, CEC, FC, GC, HRC, QSC $ 71 $ 26
Board Members Dr. Brenda Hemmelgarn (Vice Chair) Since Nov 27, 2015 CEC (Chair), QSC 51 19 David Carpenter Since Nov 27, 2015 ARC (Chair), CEC, FC (Chair) 38 14 Richard Dicerni(h) Since Nov 27, 2015 FC, HRC (Chair) 30 - Heather Hirsch Since Nov 3, 2016 CEC, QSC 9 - Hugh Sommerville Since Nov 27, 2015 ARC, GC (Chair) 37 13 Marliss Taylor Since Nov 27, 2015 CEC, GC, HRC 36 12 Glenda Yeates Since Nov 27, 2015 ARC, FC, QSC (Chair) 33 13
Board Committee Participants(i) Barbara Burton Nov 27, 2015 to Mar 31, 2016 - - 12 Dr. Thomas Feasby Nov 27, 2015 to Jan 18, 2017 QSC 2 2 Martin Harvey Nov 27, 2015 to Mar 31, 2016 - - 1 Don Sieben Nov 27, 2015 to Mar 31, 2016 - - 17 Doug Tupper Nov 27, 2015 to Mar 31, 2016 - - 17 Gord Winkel Since Nov 27, 2015 QSC 3 1
Total Board $ 310 $ 147
Board members were remunerated with monthly honoraria. In addition, they receive remuneration for attendance at Board and committee meetings. Board committees were established by the Board to assist in governing AHS and overseeing the management of AHS’ business and affairs. Board committee participants are eligible to receive remuneration for meetings attended, and in addition Board committee chairs also receive a monthly honorarium. Committee legend: ARC = Audit and Risk Committee, CEC = Community Engagement Committee, FC = Finance Committee, GC = Governance Committee, HRC = Human Resources Committee, QSC = Quality and Safety Committee

2016-17 | Alberta Health Services Annual Report
SCHEDULES TO THE CONSOLIDATED FINANCIAL STATEMENTS
(thousands of dollars)
109
SUB-SCHEDULE 2B - EXECUTIVE SALARIES AND BENEFITS FOR THE YEAR ENDED MARCH 31, 2017
2017
For the Current Fiscal Year FTE (a) Base Salary (b)
Other Cash Benefits (c)
Other Non-Cash
Benefits (d) Subtotal Severance (e) Total
Board Direct Reports Dr. Verna Yiu – President and Chief Executive Officer(j,u) 1.00 $ 565 $ 16 $ 163 $ 744 $ - $ 744 Ronda White – Chief Audit Executive (v) 1.00 240 - 39 279 - 279
CEO Direct Reports Brenda Huband – VP and Chief Health Operations Officer, Central and Southern Alberta(k,w) 1.00 370 - 44 414 - 414 Dr. Ted Braun – VP and Medical Director, Central and Southern Alberta(l, w) 1.00 383 5 69 457 - 457 Deb Gordon – VP and Chief Health Operations Officer, Northern Alberta(w) 1.00 370 - 104 474 - 474 Dr. David Mador – VP and Medical Director, Northern Alberta(x) 1.00 450 - 104 554 - 554 Sean Chilton – VP, Collaborative Practice, Nursing and Health Professions(m, w) 0.27 89 - 14 103 - 103 Dave Bilan – Interim VP, Collaborative Practice, Nursing and Health Professions(n) 0.77 130 - 2 132 - 132 Dr. Francois Belanger – VP, Quality and Chief Medical Officer(o, w) 1.00 456 - 93 549 - 549 Karen Horon – Acting VP, Clinical Support Services(p, w) 0.02 5 - 1 6 - 6 Mauro Chies – VP, Clinical Support Services(q, w) 0.80 245 - 40 285 - 285 Dr. Kathryn Todd – VP, Research, Innovation and Analytics(r,y) 1.00 264 13 32 309 - 309 Todd Gilchrist – VP, People, Legal and Privacy(w) 1.00 450 - 78 528 - 528 Colleen Turner – VP, Community Engagement and Communications(s, w) 1.00 314 - 81 395 - 395 Deborah Rhodes – VP, Corporate Services and Chief Financial Officer(w) 1.00 370 - 65 435 - 435 Noela Inions – Chief Ethics and Compliance Officer(t) 1.00 226 - 32 258 219 477
Total Executive 13.86 $ 4,927 $ 34 $ 961 $ 5,922 $ 219 $ 6,141

2016-17 | Alberta Health Services Annual Report
SCHEDULES TO THE CONSOLIDATED FINANCIAL STATEMENTS
(thousands of dollars)
110
SUB-SCHEDULE 2B - EXECUTIVE SALARIES AND BENEFITS FOR THE YEAR ENDED MARCH 31, 2017 (CONTINUED)
2016
For the Prior Fiscal Year FTE (a) Base Salary (b)
Other Cash Benefits (c)
Other Non-Cash
Benefits (d) Subtotal Severance (e) Total
Board / Official Administrator Direct Reports Dr. Verna Yiu – Interim President and Chief Executive Officer 0.23 $ 120 $ 22 $ 8 $ 150 $ - $ 150 Vickie Kaminski – President and Chief Executive Officer 0.85 462 31 32 525 - 525 Ronda White – Chief Audit Executive 1.00 241 - 36 277 - 277
CEO Direct Reports Brenda Huband – VP and Chief Health Operations Officer, Central and Southern Alberta 1.00 372 - 50 422 - 422 Dr. Ted Braun – Acting VP and Medical Director, Central and Southern Alberta 0.23 88 1 13 102 - 102 Dr. Francois Belanger – VP and Medical Director, Central and Southern Alberta 0.77 348 - 66 414 - 414 Deb Gordon – VP and Chief Health Operations Officer, Northern Alberta 1.00 372 - 32 404 - 404 Dr. David Mador – VP and Medical Director, Northern Alberta 1.00 452 - 70 522 - 522 Dave Bilan – Interim VP Collaborative Practice, Nursing and Health Professions 0.34 57 - 9 66 - 66 Linda Dempster – VP Collaborative Practice, Nursing and Health Professions 0.66 172 - 23 195 - 195 Dr. Francois Belanger – Interim VP, Quality and Chief Medical Officer 0.23 104 - 20 124 - 124 Dr. Verna Yiu – VP, Quality and Chief Medical Officer 0.77 402 36 26 464 - 464 Dr. Kathryn Todd – VP, Research, Innovation and Analytics 1.00 264 15 29 308 - 308 Todd Gilchrist – VP, Human Resources 0.91 406 - 123 529 - 529 Robert Armstrong – Acting VP, Human Resources 0.09 22 3 6 31 - 31 Colleen Turner – Interim VP, Community Engagement and Communications 0.23 61 - 13 74 - 74 Carmel Turpin – VP, Community Engagement and Communications 0.78 237 - 30 267 293 560 Deborah Rhodes – VP, Corporate Services and Chief Financial Officer 1.00 372 - 48 420 - 420 Noela Inions – Chief Ethics and Compliance Officer 1.00 227 - 45 272 - 272 Vivian Simpkin – Interim General Counsel, Legal and Privacy 0.22 48 5 9 62 - 62 Salimah Walji-Shivji – General Counsel, Legal and Privacy 0.46 111 - 21 132 266 398 Sharon Lehr – Chief Program Officer, Operational Benchmarking and Efficiency 0.61 188 - 59 247 - 247
Total Executive 14.38 $ 5,126 $ 113 $ 768 $ 6,007 $ 559 $ 6,566

2016-17 | Alberta Health Services Annual Report
SCHEDULES TO THE CONSOLIDATED FINANCIAL STATEMENTS
(thousands of dollars)
111
SUB-SCHEDULE 2C - EXECUTIVE SUPPLEMENTAL PENSION PLAN AND SUPPLEMENTAL EXECUTIVE RETIREMENT PLAN
Certain employees will receive retirement benefits that supplement the benefits limited under the registered plans for service. The Supplemental Pension Plan (SPP) is a defined contribution plan and the Supplemental Executive Retirement Plan (SERP) is a defined benefit plan. The SERP is disclosed in Note 2(h)(iii). The amounts in this table represent the total SPP and SERP benefits earned by the individual during the fiscal year. The current period benefit costs for SPP and the other costs for SERP included in other non-cash benefits disclosed in Sub-Schedule 2B are prorated for the period of time the individual was in their position directly reporting to the Board or directly reporting to the President and Chief Executive Officer. Only individuals holding a position directly reporting to the Board or President and Chief Executive Officer during the current fiscal year are disclosed.
2017 2016 SPP SERP
Current period benefit costs(1)
Other Costs(2) Total Total
Account Balance(3) or Accrued Benefit
Obligation March 31, 2016
Change During the
Year(4)
Account Balance(3) or Accrued Benefit
Obligation March 31, 2017
Dr. Verna Yiu - President and Chief Executive Officer $ 41 $ - $ 41 $ - $ - $ 41 $ 41 Ronda White - Chief Audit Executive 9 - 9 10 51 12 63 Brenda Huband - VP and Chief Health Operations Officer, Central and Southern Alberta
SERP - 23 23 (8) 422 (42) 380 SPP 25 - 25 25 95 30 125
Dr. Ted Braun - VP and Medical Director, Central and Southern Alberta
SERP - 12 12 (4) 217 (8) 209 SPP 27 - 27 16 58 27 85
Deb Gordon - VP and Chief Health Operations Officer, Northern Alberta
SERP - 35 35 (11) 626 23 649 SPP 25 - 25 25 85 31 116
Dr. David Mador - VP and Medical Director, Northern Alberta 35 - 35 35 106 38 144 Sean Chilton - VP, Collaborative Practice, Nursing and Health Professions 18 - 18 18 94 21 115 Dr. Francois Belanger - VP, Quality and Chief Medical Officer 35 - 35 35 127 45 172 Karen Horon - Acting VP, Clinical Support Services 4 - 4 4 12 4 16 Mauro Chies - VP, Clinical Support Services 16 - 16 12 49 18 67 Dr. Kathryn Todd - VP, Research, Innovation and Analytics (r) - - - - - - - Todd Gilchrist - VP, People, Legal and Privacy 35 - 35 31 31 36 67 Colleen Turner - VP, Community Engagement and Communications 18 - 18 10 48 22 70

2016-17 | Alberta Health Services Annual Report
SCHEDULES TO THE CONSOLIDATED FINANCIAL STATEMENTS
(thousands of dollars)
112
SUB-SCHEDULE 2C - EXECUTIVE SUPPLEMENTAL PENSION PLAN AND SUPPLEMENTAL EXECUTIVE RETIREMENT PLAN
(CONTINUED)
2017 2016 SPP SERP
Current period benefit costs(1)
Other Costs(2) Total Total
Account Balance(3) or Accrued Benefit
Obligation March 31, 2016
Change During the
Year(4)
Account Balance(3) or Accrued Benefit
Obligation March 31, 2017
Deborah Rhodes - VP, Corporate Services and Chief Financial Officer $ 25 $ - $ 25 $ 25 $ 138 $ 32 $ 170
Noela Inions - Chief Ethics and Compliance Officer 8 - 8 8 64 12 76
(1) The SPP current period benefit costs are AHS contributions earned in the period. (2) Other SERP costs include retirement benefits, interest expense on the obligations, and amortization of actuarial gains and losses, offset by the expected
return on the plans’ assets. AHS uses the straight line method to amortize actuarial gains and losses over the expected average remaining service life of the plan members.
(3) The account balance represents the total cumulative earned contributions to the SPP as well as cumulative investment gains or losses on the contributions. (4) Changes in the accrued benefit obligation include current period benefit cost, interest accruing on the obligations and the amortization of any actuarial gains
or losses in the period. Changes in the account balance include the current benefit costs and investment gains or losses related to the account.

2016-17 | Alberta Health Services Annual Report
SCHEDULES TO THE CONSOLIDATED FINANCIAL STATEMENTS
(thousands of dollars)
113
FOOTNOTES TO THE CONSOLIDATED SCHEDULE OF SALARIES AND BENEFITS FOR THE YEAR ENDED MARCH 31, 2017
Definitions
a. For this schedule, full time equivalents (FTE) are determined by actual hours earned divided by 2,022.75 annual base hours. FTE for the Board
and Board committee members are prorated using the number of days in the fiscal year between either the date of appointment and the end of the year, the date of appointment and the termination date, or the beginning of the year and the termination date.
b. Base salary is regular salary and includes all payments earned related to actual hours earned other than those reported as other cash benefits.
Vacation accruals are included in base salary except for direct reports of the Board or President and Chief Executive Officer whose vacation accruals are included in other non-cash benefits.
c. Other cash benefits include, as applicable, honoraria, overtime, acting pay, travel and automobile allowances, lump sum payments and an allowance for professional development. Relocation expenses are excluded from compensation disclosure as they are considered to be recruiting costs to AHS and not part of compensation unless related to severance. Expense reimbursements are also excluded from compensation disclosure except where the expenses meet the definition of the other cash benefits listed above.
d. Other non-cash benefits include: • Employer’s current period benefit costs and other costs of supplemental pension plan and supplemental executive retirement plans as
defined in Sub-Schedule 2C • Employer’s share of employee benefit contributions and payments made on behalf of employees including pension, health care, dental and
vision coverage, out-of-country medical benefits, group life insurance, accidental disability and dismemberment insurance, and long and short-term disability plans, and
• Employer’s share of the cost of additional benefits including sabbaticals or other special leave with pay.
e. Severance includes direct or indirect payments to individuals upon termination which are not included in other cash benefits or other non-cash benefits.
f. Compensation provided by AHS for medical doctors included in salaries and benefits expense includes medical doctors paid through AHS payroll. The compensation provided by AHS for the remaining medical doctors is included in other contracted services.
Board and Board Committee Participants
g. The Board Chair is an Ex-Officio member on all committees.
h. This individual started claiming honoraria on April 16, 2016.
i. These individuals were participants of Board committees, but are not Board members or AHS employees.
Executive
j. The incumbent held the position of Interim President and Chief Executive Officer and received acting pay until June 3, 2016 when the incumbent
was appointed to President and Chief Executive Officer. The incumbent received an increase in compensation for the new position. The contract term ends June 2, 2021. The incumbent was on secondment from the University of Alberta until June 3, 2016. During this time, the incumbent’s total remuneration was comprised of salary amounts from both AHS and the University of Alberta, and AHS reimbursed the University for the incumbent’s base salary and benefits. In lieu of enrollment into the AHS SPP, the incumbent received an annual lump sum supplemental payment equivalent to the amount the incumbent would have received as a member of the SPP and payable from AHS. The lump sum has been included in Other Cash Benefits. Effective June 3, 2016, the incumbent began a leave of absence from the University of Alberta and entered into an employment relationship with AHS.
k. The incumbent received a vacation payout of $29 during the year for unused accrued vacation earned in prior periods; accrued vacation has been recorded in their compensation as a non-cash benefit in the period it was earned.
l. The incumbent held the position of Acting Vice President and Medical Director, Central and Southern Alberta and received an increase in base salary until February 13, 2017 at which time the incumbent was appointed to Vice President and Medical Director, Central and Southern Alberta. The incumbent received an increase in compensation for the new position.
m. The incumbent held the position of Chief Zone Officer, South Zone until December 26, 2016 at which time the incumbent was appointed to Vice
President, Collaborative Practice, Nursing and Health Professions and became a direct report to the President and Chief Executive Officer. The incumbent received an increase in compensation for the new position.
n. The incumbent held the position of Interim Vice President, Collaborative Practice, Nursing and Health Professions and received an increase in
base salary until January 9, 2017 at which time the incumbent resumed the role of Executive Director, Health Professions – Strategy and Practice and is no longer a direct report to the President and Chief Executive Officer.
o. The incumbent held the position of Interim Vice President, Quality and Chief Medical Officer until November 1, 2016 when the incumbent was appointed to Vice President, Quality and Chief Medical Officer. The incumbent received an increase in compensation for the new position.

2016-17 | Alberta Health Services Annual Report
SCHEDULES TO THE CONSOLIDATED FINANCIAL STATEMENTS
(thousands of dollars)
114
FOOTNOTES TO THE CONSOLIDATED SCHEDULE OF SALARIES AND BENEFITS FOR THE YEAR ENDED MARCH 31, 2017 (CONTINUED)
p. The incumbent held the position of Senior Operating Officer, Pharmacy Services until March 28, 2017 at which time the incumbent was appointed
to Acting Vice President, Clinical Support Services and became a direct report to the President and Chief Executive Officer. The incumbent received an increase in base salary for the Acting Vice President, Clinical Support Services position.
q. The incumbent held the position of Chief Program Officer, Clinical Support Services until June 13, 2016 at which time the incumbent was appointed to Vice President, Clinical Support Services and became a direct report to the President and Chief Executive Officer. The incumbent received an increase in compensation for the new position. In addition, the incumbent received a vacation payout of $6 during the year for unused accrued vacation earned in prior periods; accrued vacation has been recorded in their compensation as a non-cash benefit in the period it was earned. The incumbent began a leave of absence on March 28, 2017.
r. The incumbent is on secondment from the University of Alberta. The incumbent’s total remuneration is comprised of salary amounts from both
AHS and the University of Alberta, and AHS reimburses the University for the incumbent’s base salary and benefits. In lieu of enrollment into the AHS SPP, the incumbent will receive an annual lump sum supplemental payment equivalent to the amount the incumbent would have received as a member of the SPP and payable from AHS. The lump sum has been included in Other Cash Benefits.
s. The incumbent held the position of Interim Vice President, Community Engagement and Communications and received an increase in base salary
until July 4, 2016 when the incumbent was appointed to Vice President, Community Engagement and Communications. The incumbent received an increase in compensation for the new position.
t. The incumbent held the position until April 21, 2017, at which time the accountability and scope of the position was expanded. The employer and
employee negotiated a separation agreement which resulted in the incumbent resigning her position in exchange for a severance payment. The employer allowed this resignation to be communicated as a retirement. The incumbent received salary and other accrued entitlements to the date of resignation. The reported severance included 44 weeks of base salary at the rate in effect at the date of retirement and an additional 15% of the severance in lieu of benefits. This severance was expensed in the current year.
Termination Obligations
u. In the case of termination without just cause by AHS, the incumbent shall receive severance pay equal to one month base salary for each completed
month of service during the first year of the term or, after completion of one year of service of the term, 12 months base salary.
v. In the case of termination without just cause by AHS, the incumbent shall receive severance pay equal to 12 months base salary. The severance payment will be reduced by any employment earnings received from a new employer within the 12 month period.
w. The incumbent’s termination benefits have not been predetermined.
x. In the case of termination without just cause by AHS, the incumbent shall receive severance pay to a maximum of 12 months base salary plus market supplement. Such severance will be paid in 12 equal monthly instalments. The severance payment will be reduced by any employment earnings received from a new employer within the 12 month period.
y. There is no severance associated with the secondment agreement. Upon termination of the secondment agreement, the incumbent would return to the incumbent’s regular position at the University of Alberta.

2016-17 | Alberta Health Services Annual Report
115
Compensation Analysis and Discussion (Non-Union/Exempt Employees) A total compensation strategy is the blueprint for an organization’s total compensation program. It includes the mix of direct and indirect compensation to be provided to employees and the means through which it will be provided in order to support an organization’s goals. It is important that total compensation in a publicly-funded organization such as AHS has a governance-approved strategy or “blueprint” that is properly aligned with its direction, goals and values. Total Compensation Philosophy AHS reinforces outstanding patient care for all Albertans by attracting, retaining and engaging talented and committed employees. We do this with competitive and fair total compensation that motivates and rewards performance while demonstrating sound fiscal management and sustainability. Principles set out in the total compensation policy guided by AHS’ total compensation philosophy reflect:
• Competitive market positioning • Internal equity • Performance orientation • Affordability • Individual flexibility • Shared employee/employer responsibility
Total Compensation Strategy AHS ensures the process used to set total compensation, establish and maintain good governance, and incorporate best practices is transparent. The job rates for Executive and Senior Leadership salary ranges are representative of the median of the national healthcare and Alberta public sector market. To ensure total compensation remains market competitive, AHS reviews its market positioning on a regular basis and, in any event, no less than once every second year. Salary ranges are published on the AHS website. AHS is currently under a salary freeze that applies to all government agencies, boards and commissions until March 31, 2018 and consequently has not conducted a regular review of its market positioning. AHS’ Total Compensation programs and practices encourage behaviours that will promote a patient-focused, quality health system that is accessible and sustainable for all Albertans. Total Compensation Plan Structure AHS is committed to providing a comprehensive total compensation package including salary, benefits, pension and other programs and services that support attracting, retaining and engaging talented and committed employees. AHS’ total compensation is comprised of direct and indirect compensation. Elements within direct and indirect compensation fit the overall total compensation strategy by driving accountability and performance, demonstrating sound fiscal management, and promoting a sense of integrity and equity. Direct Compensation includes pay received as wages and salaries. It integrates with the AHS Performance Management Program. AHS has no incentive, variable pay or pay at risk of any kind. Base salary ranges are intended to be competitive compared to the median (50th percentile) of the national healthcare market and the Alberta public sector market. An employee’s individual base salary is set based on individual performance and salary range adjustments within AHS market comparators. Indirect Compensation includes benefits and pension (including supplemental pension plan), terms and conditions, and employee appreciation. AHS’ benefits and pension plans support the health and well-being of our employees and financial security upon retirement. AHS provides a competitive benefits program that includes pension, health and dental-care benefits, life insurance, illness and long-term disability coverage and professional memberships. All AHS employees are eligible to participate in the Local Authorities Pension Plan (LAPP). This is a defined benefit pension plan. It provides for a pension of 1.4% for each year of pensionable service based on the average salary of the highest five consecutive years up to the Year’s Maximum Pensionable Earnings under the Canada Pension Plan and 2.0% on the excess. Benefits under this plan are capped at the maximum pension benefit limit allowed under the federal Income Tax Act, a salary of $162,312 in 2017.

2016-17 | Alberta Health Services Annual Report
116
As pensionable earnings are limited under LAPP, AHS provides a Supplemental Pension Plan (SPP). Unlike the Local Authorities Pension, the SPP is a Defined Contribution plan that provides annual notional contributions that are allocated to and invested as directed by each member. The SPP allows AHS to maintain a competitive position, but at less cost and risk to the organization. AHS does not provide car allowances or perquisite allowances to its executives or employees. Total Compensation Governance The Human Resources Committee of the Board monitors, oversees and advises the Board on total compensation matters related to AHS including:
• Determining the overall strategic approach to compensation. • Reviewing substantive changes to total compensation programs to ensure they support the organization’s
mission, strategic directions and values. • Reviewing the compensation of the President and Chief Executive Officer (CEO) and Vice Presidents. • Reviewing the compensation philosophy recommended by the President and CEO for non-executive staff
of AHS. Total Compensation Reporting The Schedule 2 – Consolidated Schedule of Salaries and Benefits in the annual audited consolidated financial statements for the year ended March 31, 2017, provides complete disclosure of salary, benefits, and all other compensation earned for years ended March 31, 2017 and March 31, 2016 by the direct reports to the Board and direct reports to the President & CEO. The Board’s compensation is disclosed in Schedule 2 – Consolidated Schedule of Salaries and Benefits in the annual audited consolidated financial statements for the year ended March 31, 2017. The Schedule 2 Information on total compensation philosophy and practices can be found on the AHS website. Total Compensation 2016-17 Information Updates The Public Service Compensation Transparency Act increased transparency by requiring compensation disclosure from Alberta agencies, boards and commissions including AHS. AHS was required to disclose the names and compensation of employees whose earnings were over $125,000 per year. The first AHS disclosure under the Act was required by June 24, 2016, and was posted on AHS’ external website. For 2016-17, AHS will be disclosing the names and compensation of employees whose earnings are over $126,375. The Alberta government has frozen salaries for all non-union and exempt employees at provincial agencies, boards and commissions as part of the province’s ongoing restraint measures to reduce government operating costs. AHS is among the organizations affected by the freeze. The freeze will be in effect for two years, beginning April 1, 2016 and expiring March 31, 2018. A compensation regulation under the Reform of Agencies, Boards, and Commissions Act (RABCA) established total compensation, including salary and benefits, for Chief Executive Officers or equivalent in 23 provincial agencies that are part of the Alberta Public Agencies Governance Act (APAGA). This regulation came into effect on March 16, 2017 and applied to 23 provincial agencies identified in APAGA. AHS is exempt from this regulation and the executive compensation structure developed by the Government. Alternatively, AHS will be submitting an executive compensation plan annually to Government. This compensation plan will demonstrate how AHS aligns to the key compensation principles outlined in the Regulation and help ensure scrutiny of its compensation practices. Transparency will continue to be provided through mandated salary disclosure.

2016-17 | Alberta Health Services Annual Report
117
APPENDIX
Public Interest Disclosure (Whistleblower Protection) Act Non-Hospital Surgical Facility Contracts Under the Health Care
Protection Act (Alberta)
AHS-Funded Facilities
Zone Overview of Beds and Spaces

2016-17 | Alberta Health Services Annual Report
118
PUBLIC INTEREST DISCLOSURE (WHISTLEBLOWER PROTECTION) ACT On June 1, 2013, the provincial government enacted legislation surrounding the Public Interest Disclosure (Whistleblower Protection) Act (PIDA) and Regulations (the Act). The Act protects employees when making disclosures of certain kinds of wrongdoing they observe in the AHS workplace. The purpose of the Act includes:
• Facilitating the disclosure of wrongdoing. • Protecting those who make a disclosure from reprisal. • Implementing recommendations arising from investigations. • Promoting confidence in the public sector.
In 2009, AHS established a solid foundation for leading this work across the organization by approving the AHS Safe Disclosure/Whistleblower Policy and appointing a Chief Ethics & Compliance Officer who, under the Act, is also the AHS Designated Officer for PIDA. Over the past year, AHS has:
• Implemented the internal processes and procedures to manage reports of wrongdoing in the new Ethical Conduct Governance Documents Policy Suite (as in the PIDA Procedures and the Safe Disclosure/ Whistleblower Policy Frequently Asked Questions).
• Updated additional resources and ongoing training to managers and staff about PIDA and the internal disclosure process.
• Monitored the legislative review of PIDA. In compliance with legislated reporting requirements, from April 1, 2016 to March 31, 2017, there have been no disclosures under PIDA to the AHS Designated Officer; as such, no AHS investigations are underway and no actions have been taken. Of note: the AHS Designated Officer co-ordinates all PIDA disclosures pertaining to AHS, including those that may originate externally via the provincial PIDA Commissioner/Office of the Ombudsman.

2016-17 | Alberta Health Services Annual Report
119
NON-HOSPITAL SURGICAL FACILITY CONTRACTS UNDER THE HEALTH CARE PROTECTION ACT (ALBERTA) AHS contracts services with multiple Non-Hospital Surgical Facilities (NHSF) to provide insured surgical services for dermatology, ophthalmology, oral maxillofacial, otolaryngology, plastic surgery and pregnancy terminations. The use of NHSFs enables AHS to obtain quality services to enhance surgical access and alleviate capacity pressures within AHS main operating rooms. AHS works with Alberta Health and the College of Physicians and Surgeons of Alberta to coordinate activities addressing quality, safety and compliance with the Health Care Protection Act and regulations. A provincial framework was developed including governance, quality measurement, incident reporting, and monitoring. Contracts with non-hospital surgical facilities provide increased choice of service provider for patients and supplement the resources available in hospitals, while providing good value for public dollars. In 2016-17, there was a 1.8% increase in the total number of procedures performed compared to 2015-16. The following table summarizes surgical contracts by service area for 2016-17:
Non-Hospital Surgical Facilities Activity
Contracted Service Area Number of Contracted Operators
Number of Contracted Procedures Performed
Dermatology - Edmonton Zone 1 23 Ophthalmology - Calgary Zone 5 16,997* Ophthalmology - Edmonton Zone 6 4,090* Ophthalmology - North Zone 1 895 Oral and Maxillofacial Surgery - Calgary Zone 8 854 Oral and Maxillofacial Surgery - Edmonton Zone 9 2,516 Otolaryngology (ENT) - Edmonton Zone 2 193 Plastic Surgery - Edmonton Zone 3 355 Pregnancy Termination - Calgary 1 5,004 Pregnancy Termination - Edmonton 1 6,159 There are no surgical contracts with Non-Hospital Surgical Facilities in the South and Central Zones that fall under the Health Care Protection Act (Alberta).
*Calgary Zone contracts more ophthalmology procedures outside AHS hospitals compared to Edmonton Zone where more ophthalmology procedures are performed within AHS hospitals.

2016-17 | Alberta Health Services Annual Report
120
AHS FUNDED FACILITIES Facility Definitions
Facility Definition
Addiction Addiction treatment facilities with beds and mats for clients with substance use and gambling problems. Includes detoxification, nursing care, assessment, counselling and treatment. Direct services provided by AHS as well as funded and contracted services. This also includes beds for Protection of Children Abusing Drugs (PChAD) program clients and residential beds funded through the Safe Communities Initiative.
Comm. MH Community Mental Health support home programs, Canadian Mental Health Association community beds and other mental health community beds/spaces.
Standalone Psych
Standalone psychiatric facilities: Alberta Hospital Edmonton (Edmonton), Southern Alberta Forensic Psychiatric Centre (Calgary), Centennial Centre for Mental Health and Brain Injury (CCMHBI) (Ponoka), Claresholm Centre for Mental Health and Addictions (Claresholm) and Villa Caritas (Edmonton)
Hospital
Acute Care Hospitals are where active treatment is provided. They include medical, surgery, obstetrics, pediatrics, acute care psychiatric, NICU (neonatal intensive care level II and III), ICU (includes intensive care unit, coronary care unit, special care unit, etc.), sub-acute, restorative and palliative beds located in the hospital.
Urban hospitals are located in large, densely populated cities and may provide access to tertiary and secondary level care. Some examples of tertiary level care include head and neck oncology, high risk perinatology and neonatology, organ transplantation, trauma surgery, high dose (cancer) radiation and chemotherapy, growth and puberty disorders, advanced diagnostics (i.e., MRI, PET, CT, Nuclear Medicine, Interventional Radiology) and tertiary level specialty clinic services. Regional hospitals provide access to secondary level care medical specialists who do not have first contact with patients, for example, cardiologists, urologists, and orthopedic surgeons. In addition to providing general surgery services, these facilities provide specialist surgical services (e.g. orthopedics, otolaryngology, plastic surgery, gynecology) and advanced diagnostics (i.e., MRI, CT). Community hospitals provide access to rural clinical services – ambulatory, emergency, inpatient medicine, obstetrics and surgery (includes endoscopy). Standalone Emergency Departments (ED) reflect facilities with an ED and access to lab, diagnostic imaging, outpatient and specialty clinics. They do not have acute care beds or inpatient services. Ambulatory Endoscopy / Surgical Centre Hospitals (OP) reflect facilities providing ambulatory services including endoscopy and outpatient specialty clinics.
Sub-acute Care (SAC)
Sub-acute care is provided in an auxiliary hospital for the purpose of receiving convalescent and/or rehabilitation services, where it is anticipated that the patient will achieve functional potential to enable them to improve their health status and to successfully return to the community.
Restorative Care (RC)
Restorative Care is a multi-disciplinary, client-centred rehabilitation service that supports frail, complex, or at-risk individuals to retain their independence following debilitating effects of illness or injury. RC aims to promote independence and keeps individuals in the community (home) and to reduce the need for higher levels of care (long-term care).
Palliative (PEOLC)
Palliative and End-of-Life Care (PEOLC) facilities are where a designated program or bed for the purpose of receiving palliative care services, including end-of-life and symptom alleviation, but are not located in an acute care facility. This includes community hospice beds.
Long-Term Care (LTC)
Long-term care is provided in nursing homes and auxiliary hospitals. It is reserved for those with unpredictable and complex health needs, usually multiple chronic and/or unstable medical conditions. Long-term care includes health and personal care services, such as 24-hour nursing care provided by registered nurses or licensed practical nurses.
Supportive Living (SL)
Supportive living includes comprehensive services, such as the availability of 24-hour nursing care (levels 3 or 4). Supportive Living 4-Dementia and Supportive Living Mental Health is also available for those individuals living with moderate to severe dementia or cognitive impairment. Albertans accessing supportive living services generally reside in lodges, retirement communities, or supportive living centres.
Cancer (Ca) Cancer Care Services include assessments and examinations, supportive care, pain management, prescription of cancer- related medications, education, resource and support counselling and referrals to other cancer centres.
Ambulatory
Urgent Care Centre (UCC) is a community-based service delivery site (non-hospital setting) where higher level assessment, diagnostic and treatment services are provided for unscheduled clients who require immediate medical attention for injuries /illnesses that require human and technical resources more intensive than what is available in a physicians’ office or AACC unit. Advanced Ambulatory Care Centre (AACC) is a community-based service delivery site (non-hospital setting) where assessment, diagnostic and treatment services are provided for unscheduled patients seeking immediate medical attention for non-life threatening illnesses, typically patients of lower acuity than those treated in a UCC or ED. Community Ambulatory Care Centre (CACC) is a community-based service delivery site (non-hospital setting) primarily engaged in the provision of ambulatory care diagnostic and treatment services. This includes typically scheduled primary care for clients who do not require hospital outpatient emergency care or inpatient treatment. Family Care Clinic (FCC) provides primary healthcare to people and their families in under-serviced areas of Alberta. Public Health Centres include community health centres, community health clinics, district offices, public health, and public health centres. They provide services that are offered by public health nurses, including immunization, health education/counselling/support for parents, health assessment and screening to identify health concerns, and referral to appropriate healthcare providers such as physicians, and community resources.

2016-17 | Alberta Health Services Annual Report
121
Facility by Zone This section contains an overview of facilities that support healthcare throughout the province and the beds or spaces within them, broken down provincially and/or by zone.
Number of Facilities South Zone
Calgary Zone
Central Zone
Edmonton Zone
North Zone Provincial
Community Ambulatory Care
Urgent Care Centres 5 1 6
Ambulatory Care Centres 2 1 2 2 7
Family Care Clinics 1 1 1 3
Primary Care Networks 2 7 12 9 12 42
Public Health Centres 17 22 34 21 45 139
Addiction and Mental Health Addiction 5 13 5 9 7 39
Community Mental Health 3 10 2 10 1 26
Standalone Psychiatric 2 1 2 5
Acute Care Urban 5 5 10
Regional 2 1 2 5
Community 10 8 29 7 31 85
Standalone Emergency Departments 1 2 1 4 Ambulatory Endoscopy or Surgical Centre Hospital 1 1 2
TOTAL DESIGNATED HOSPITALS 14 14 30 14 34 106
Cancer Care Cancer Centres 2 3 5 1 6 17
Community-Based Care
Long-Term Care & Supportive Living (3, 4, Dementia, Mental Health and Restorative Care)
47 68 76 85 55 331
Additional contracted care sites not included in above number reflect the number of personal care, special care and family care homes
53 55 108
Community Hospice, Palliative & End-of-Life Care 2 8 1 5 4 20
Refer to definition and explanation of facilities on previous page.

2016-17 | Alberta Health Services Annual Report
122
Provincial Overview of Community-Based Capacity Seniors and other Albertans living with disability and chronic conditions deserve the best care and support possible, and to live with dignity and respect. Since March 2010, 5,623 net new continuing care beds have been added to the system. Continued growth in community and home care capacity is the key to efficient system flow in emergency departments, acute care and community; it also allows patients to receive the most appropriate care in the most appropriate setting by the most appropriate care provider.
As of… Long-Term Care (LTC)
Supportive Living (SL)
Total Continuing
Care
Net New LTC & SL
Beds
Net New Palliative
Beds
Total Net New Continuing Care
Beds
March 2010 14,429 5,089 19,518
March 2011 14,569 6,104 20,673 1,155 1,155
March 2012 14,734 6,941 21,675 1,002 1,002
March 2013 14,553 7,979 22,532 857 20 877
March 2014 14,370 8,497 22,867 335 335
March 2015 14,523 9,219 23,742 875 6 881
March 2016 14,768 9,936 24,704 962 35 997
March 2017 14,745 10,335 25,080 376 376
Total Net New Beds 316 5,246 5,562 5,562 61 5,623
Number of Continuing Care Facilities by Provider As of March 31, 2017, there were 25,080 Designated Long Term Care (LTC) and Designated Supportive Living (SL) spaces staffed and in operation in the province in over 300 facilities. These facilities encompass AHS, AHS subsidiaries (Carewest and CapitalCare), voluntary (non-profit includes Covenant, Good Samaritan, etc.), private (Extendicare, Agecare, etc.) and Regional Health Authority (RHA) ownership. AHS will continue to improve the system and access to care and supports in the community. Collaboration with our valued service providers is integral to this effort.
Continuing Care Facilities by Operator
Number of Facilities as of March 31, 2017
LTC (Facilities)
LTC (Spaces)
SL (Facilities)
SL (Spaces)
Campus of Care
(Facilities)
Campus of Care
(LTC Spaces)
Campus of Care
(SL Spaces)
Total Facilities
Total Spaces
AHS Operated / Subsidiaries
81 4,386 11 397 3 236 87 95 5,106
Private 38 4,803 80 4,721 9 584 907 127 11,015 Voluntary (non-profit) 31 3,787 65 3,745 11 839 478 107 8,849
Prairie North RHA - Lloydminster
2 110 0 0 0 0 0 2 110
Total 152 13,086 156 8,863 23 1,659 1,472 331 25,080

2016-17 | Alberta Health Services Annual Report
123
ZONE OVERVIEW OF BED NUMBERS Summary of Bed Numbers by Zone
Number of Beds/Spaces as of March 31, 2017
South Zone
Calgary Zone
Central Zone
Edmonton Zone
North Zone Provincial
Hospital & Sub-Acute Care Hospital Acute Care 543 2,156 935 2,396 835 6,865
Psychiatric in Acute Care 72 277 50 212 34 645 Neonatal Intensive Care (NICU Level II and III) 23 126 17 130 10 306
Intensive Care (includes ICU, SCU, CCU, CVICU and PICU) 24 136 21 189 14 384
Sub-acute in Acute Care 9 32 32 22 0 95
Palliative beds in acute care 10 29 49 23 24 135
HOSPITAL ACUTE CARE SUBTOTAL 681 2,756 1,104 2,972 917 8,430 Sub-acute in Auxiliary Hospital (includes transition, rehab, community support beds, etc.)*
24 280 0 168 38 510
TOTAL HOSPITAL ACUTE AND SUB-ACUTE CARE 705 3,036 1,104 3,140 955 8,940
Continuing Care Auxiliary Hospital 248 1,072 1,413 2,234 639 5,606
Nursing Home 601 4,286 891 2,747 614 9,139
Long-Term Care (LTC) Subtotal 849 5,358 2,304 4,981 1,253 14,745
Supportive Living Level 4 - Dementia 513 678 401 1,118 194 2,904
Supportive Living Level 4 1,023 1,555 811 2,131 394 5,914
Supportive Living Level 3 299 233 395 392 198 1,517
Supportive Living (SL) Subtotal 1,835 2,466 1,607 3,641 786 10,335
LONG-TERM CARE & SUPPORTIVE LIVING SUBTOTAL 2,684 7,824 3,911 8,622 2,039 25,080
Community Palliative and Hospice (out of hospital) PEOLC 20 121 10 79 13 243
TOTAL CONTINUING CARE (includes LTC, SL and PEOLC) 2,704 7,945 3,921 8,701 2,052 25,323
Addiction and Mental Health Psychiatric (standalone facilities) 0 141 330 484 0 955
Addiction Treatment 74 296 66 389 143 968
Community Mental Health 37 418 31 245 5 736
TOTAL ADDICTION & MENTAL HEALTH 111 855 427 1,118 148 2,659
Alberta Total 3,520 11,836 5,452 12,959 3,155 36,922 * This includes restorative beds located in long-term care. Restorative beds are reported where they are located (auxiliary hospital, nursing home and supportive living).

2016-17 | Alberta Health Services Annual Report
124
SOUTH ZONE: Beds by Facility (refer to definitions page)
Facility Name
Op
erat
ed b
y AHS
Location
Ad
dict
ion
Co
mm
. MH
Stan
dalo
ne P
sych
Ho
spita
l
Su
bacu
te
Pa
lliat
ive
LT
C
SL
To
tal
Ca
ncer
Am
bulat
ory
Bassano Health Centre X Bassano 4
8 12
Crowsnest Pass Health Centre X Blairmore 16 58 74
York Creek Lodge Blairmore 20 20
Bow Island Health Centre X Bow Island 10 20 30
Pleasant View Lodge Bow Island 20 20
Brooks Health Centre X Brooks 37 15 52
Orchard Manor Brooks 25 25
Sunrise Gardens Brooks 84 84
Cardston Health Centre X Cardston 19 12 31
Chinook Lodge Cardston 20 20
Good Samaritan Lee Crest Cardston 95 95
Coaldale Health Centre X Coaldale OP 44 44
Sunny South Lodge Coaldale 45 45
Extendicare Fort Macleod Fort Macleod 50 50
Foothills Detox Centre Fort Macleod 14 14
Fort Macleod Health Centre X Fort Macleod 4 4
Chinook Regional Hospital X Lethbridge 288 288
Jack Ady Cancer Centre X Lethbridge Co-located on same campus as Chinook Regional Hospital Ca
CMHA Crisis Beds Lethbridge 5 5
CMHA Laura House Lethbridge 7 7
Columbia Assisted Living Lethbridge 50 50
Edith Cavell Care Centre Lethbridge 120 120
Extendicare Fairmont Park Lethbridge 140 140
Golden Acres Lodge Lethbridge 45 45
Good Samaritan Park Meadows Village Lethbridge 121 121
Good Samaritan West Highlands Lethbridge 100 100
Legacy Lodge Lethbridge 104 104
SASHA Group Homes Lethbridge 25 25
South Country Treatment Centre Lethbridge 21 21
Southern Alcare Manor Lethbridge 13 13
St Michael's Health Centre Lethbridge 24 10 72 72
178
St. Therese Villa
Lethbridge 200 200
Youth Residential Services X Lethbridge 8 8

2016-17 | Alberta Health Services Annual Report
125
South Zone: Beds by Facility (refer to definitions page)
Facility Name
Op
erat
ed b
y AHS
Location
Ad
dict
ion
Co
mm
. MH
Stan
dalo
ne P
sych
Ho
spita
l
Su
bacu
te
Pa
lliat
ive
LT
C
SL
To
tal
Ca
ncer
Am
bulat
ory
Good Samaritan Garden Vista Magrath 35 35
Magrath Health Centre X Magrath CACC
Club Sierra Medicine Hat 50 36 86
Cypress View Medicine Hat 45 45
Good Samaritan South Ridge Village Medicine Hat 80 48 128
Leisure Way Medicine Hat 17 17
Meadow Lands Medicine Hat 10 10
Meadow Ridge Seniors Village Medicine Hat 84 84
Medicine Hat Recovery Centre X Medicine Hat 18 1
Medicine Hat Regional Hospital X Medicine Hat 246 246
Margery E. Yuill Cancer Centre X Medicine Hat Co-located same campus Medicine Hat Regional Hospital Ca
Riverview Care Centre Medicine Hat 118 118
St. Joseph's Home
Medicine Hat 10 10 20
Sunnyside Care Centre Medicine Hat 100 24 124
The Wellington Retirement Residence Medicine Hat 50 50
Valleyview Medicine Hat 30 5 35
Milk River Health Centre X Milk River ED 24 24
Prairie Rose Lodge Milk River 10 10
Big Country Hospital X Oyen 10 30 40
Piyami Health Centre X Picture Butte CACC
Piyami Lodge Picture Butte 20 20
Piyami Place Picture Butte 15 15
Good Samaritan Vista Village Pincher Creek 75 75
Pincher Creek Health Centre X Pincher Creek 16 3 19
Good Samaritan Prairie Ridge Raymond 85 85
Raymond Health Centre X Raymond 12 5 17
Clearview Lodge Taber 20 20
Good Samaritan Linden View Taber 105 105
Taber Health Centre X Taber 19 10 29
Total South Zone
74
37
0
681
24
20
849
1,835
3,520
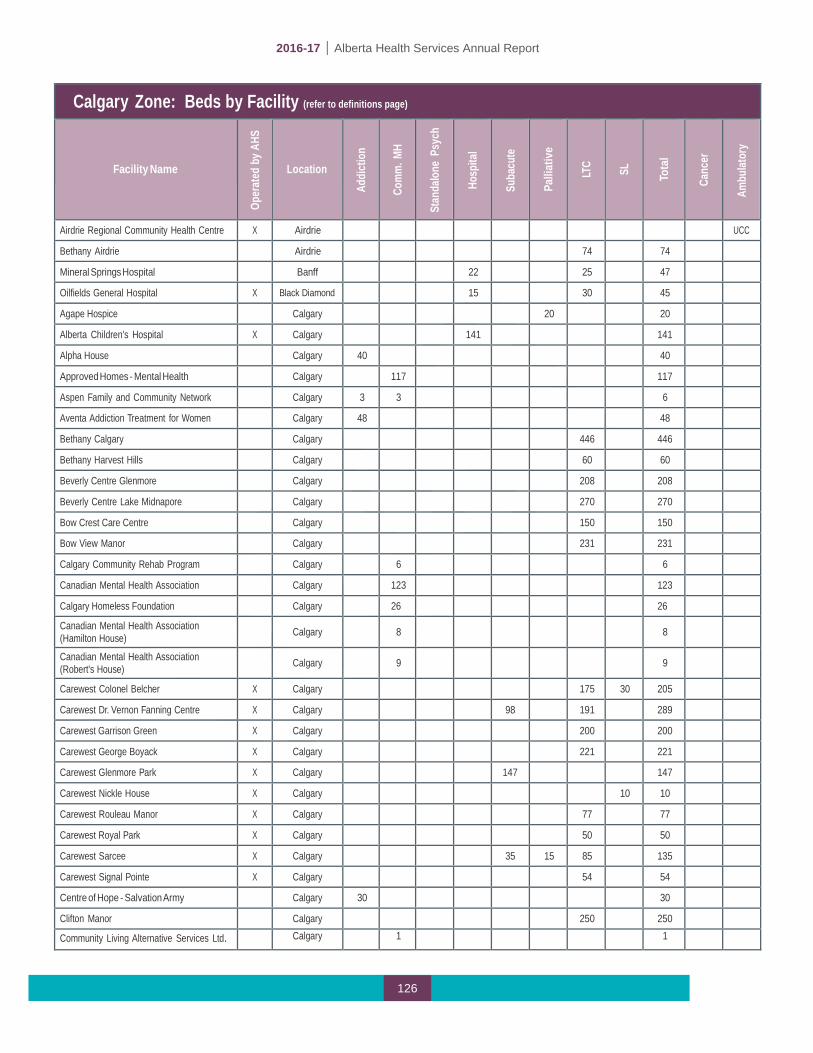
2016-17 | Alberta Health Services Annual Report
126
Calgary Zone: Beds by Facility (refer to definitions page)
Facility Name
Op
erat
ed b
y AHS
Location
Ad
dict
ion
Co
mm
. MH
Stan
dalo
ne P
sych
Ho
spita
l
Su
bacu
te
Pa
lliat
ive
LT
C
SL
To
tal
Ca
ncer
Am
bulat
ory
Airdrie Regional Community Health Centre X Airdrie UCC
Bethany Airdrie Airdrie 74 74
Mineral Springs Hospital Banff 22 25 47
Oilfields General Hospital X Black Diamond 15 30 45
Agape Hospice Calgary 20 20
Alberta Children's Hospital X Calgary 141 141
Alpha House Calgary 40 40
Approved Homes - Mental Health Calgary 117 117
Aspen Family and Community Network Calgary 3 3 6
Aventa Addiction Treatment for Women Calgary 48 48
Bethany Calgary Calgary 446 446
Bethany Harvest Hills Calgary 60 60
Beverly Centre Glenmore Calgary 208 208
Beverly Centre Lake Midnapore Calgary 270 270
Bow Crest Care Centre Calgary 150 150
Bow View Manor Calgary 231 231
Calgary Community Rehab Program Calgary 6 6
Canadian Mental Health Association Calgary 123 123
Calgary Homeless Foundation Calgary 26
26
Canadian Mental Health Association (Hamilton House)
Calgary
8
8
Canadian Mental Health Association (Robert's House)
Calgary
9
9
Carewest Colonel Belcher X Calgary 175 30 205
Carewest Dr. Vernon Fanning Centre X Calgary 98 191 289
Carewest Garrison Green X Calgary 200 200
Carewest George Boyack X Calgary 221 221
Carewest Glenmore Park X Calgary 147 147
Carewest Nickle House X Calgary 10 10
Carewest Rouleau Manor X Calgary 77 77
Carewest Royal Park X Calgary 50 50
Carewest Sarcee X Calgary 35 15 85 135
Carewest Signal Pointe X Calgary 54 54
Centre of Hope - Salvation Army Calgary 30 30
Clifton Manor Calgary 250 250
Community Living Alternative Services Ltd. Calgary 1 1

2016-17 | Alberta Health Services Annual Report
127
Calgary Zone: Beds by Facility (refer to definitions page)
Facility Name
Op
erat
ed b
y AHS
Location
Ad
dict
ion
Co
mm
. MH
Stan
dalo
ne P
sych
Ho
spita
l
Su
bacu
te
Pa
lliat
ive
LT
C
SL
To
tal
Ca
ncer
Am
bulat
ory
Community Living Alternatives for the Mentally Disabled Association (Community LAMDA)
Calgary
62
62
East Calgary Health Centre X Calgary FCC
Eau Claire Retirement Residence Calgary 73 73
Edgemont Retirement Residence Calgary 31 31
Enviros Wilderness School Association Calgary 10 10
Evanston Grand Village Calgary 102 102
Extendicare Cedars Villa Calgary 248 248
Extendicare Hillcrest Calgary 112 112
Father Lacombe Care Centre Calgary 114 114
Foothills Medical Centre X Calgary 1081
1081
Fresh Start Recovery Centre Calgary 1 1
Glamorgan Care Centre Calgary 52 52
Holy Cross Manor Calgary 100 100
Hull Homes Detox/PChaD Calgary 15 15
Retirement Concepts Millrise Calgary 51 51
Intercare Brentwood Care Centre Calgary 224 224
Intercare Chinook Care Centre Calgary 14 220 234
Intercare Southwood Care Centre Calgary 24 231 255
Kerby Centre Calgary 10 10
Kingsland Terrace Calgary 24 24
Mayfair Care Centre Calgary 142 142
McKenzie Towne Continuing Care Centre Calgary 150 150
McKenzie Towne Retirement Residence Calgary 42 42
Millrise Place Calgary 40 40
Monterey Place Calgary 107 107
Mount Royal Care Centre Calgary 93 93
Newport Harbour Care Centre Calgary 127 127
Oxford House Calgary 23 23
Personal Care Homes - Continuing Care Calgary 223 223
Peter Lougheed Centre X Calgary 509 509
Prince of Peace Harbour Calgary 32 32
Prince of Peace Manor Calgary 30 30
Providence Care Centre Calgary 94 56 150
Recovery Acres Calgary 13 13

2016-17 | Alberta Health Services Annual Report
128
Calgary Zone: Beds by Facility (refer to definitions page)
Facility Name
Op
erat
ed b
y AHS
Location
Ad
dict
ion
Co
mm
. MH
Stan
dalo
ne P
sych
Ho
spita
l
Su
bacu
te
Pa
lliat
ive
LT
C
SL
To
tal
Ca
ncer
Am
bulat
ory
Renfrew Recovery Centre X Calgary 40 40
Richmond Road Diagnostic & Treatment Centre
X
Calgary
OP
Rocky Ridge Retirement Community Calgary 29 29
Rockyview General Hospital X Calgary 605 605
Rosedale Hospice Calgary 7 7
Rotary Flames House X Calgary 7 7
Sage Hill Retirement Residence Calgary 72 72
Scenic Acres Retirement Residence Calgary 26 26
SCOPE Hunterview House Calgary 1 1
Seton Seniors Community Calgary 59 252 311
Sheldon M. Chumir Health Centre X Calgary UCC
South Calgary Health Centre X Calgary UCC
South Health Campus X Calgary 272 272
Southern Alberta Foresenic Psychiatric Centre
X
Calgary
33
33
St. Marguerite Manor Calgary 26 102 128
Sunridge Medical Gallery X Calgary CACC
Sunrise Native Addiction Services Society Calgary 24 24
Swan Evergreen Calgary 48 48
Trinity Foundation Calgary 30 30
Tom Baker Cancer Centre X Calgary Ca
Walden Heights Seniors Community Calgary 58 234 292
Wentworth Manor/The Residence and The Court
Calgary
73
57
130
Whitehorn Village Calgary 53 53
Wing Kei Care Centre Calgary 145 145
Wing Kei Greenview Calgary 95 95
Woods Homes Calgary 22 22
Youville Women's Residence Calgary 1 1
Canmore General Hospital X Canmore 21 23 44
Bow Valley Community Cancer Centre X Canmore Co-located on same campus as Canmore General Hospital Ca
Claresholm Centre for Mental Health and Addictions
X
Claresholm
108
108
Claresholm General Hospital X Claresholm 16 16
Lander Treatment Centre X Claresholm 48 48
Willow Creek Continuing Care Centre X Claresholm 100 100
Bethany Cochrane Cochrane 78 78
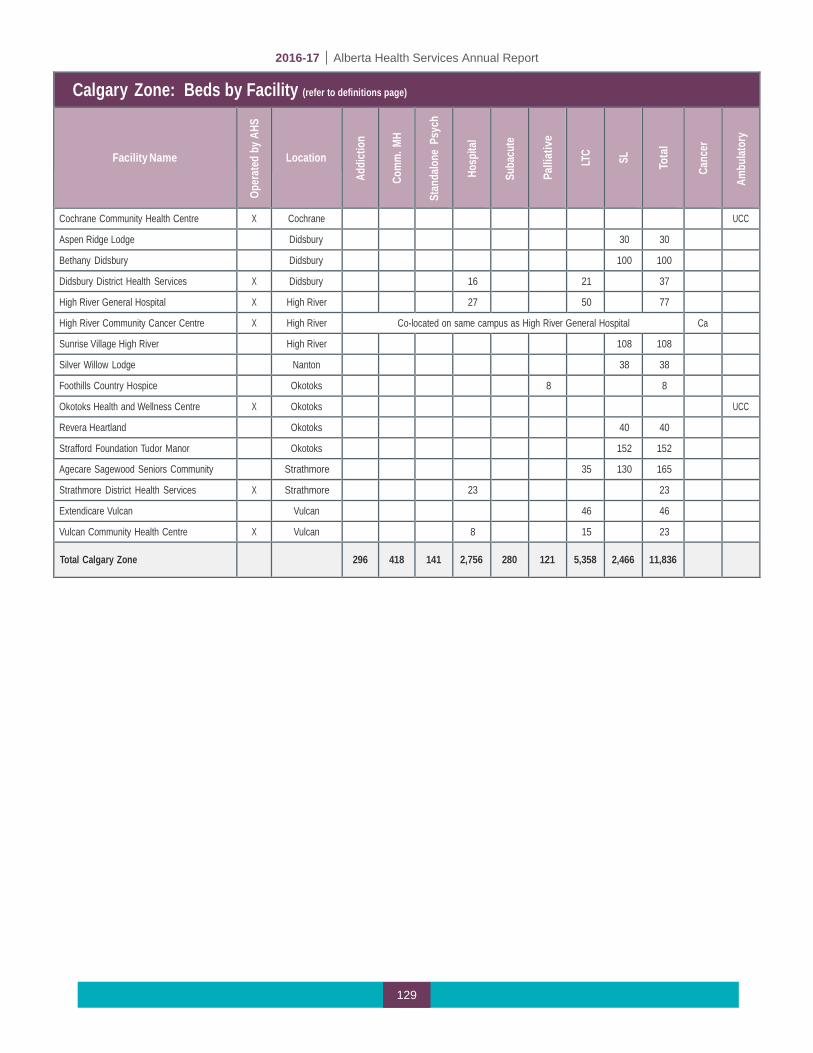
2016-17 | Alberta Health Services Annual Report
129
Calgary Zone: Beds by Facility (refer to definitions page)
Facility Name
Op
erat
ed b
y AHS
Location
Ad
dict
ion
Co
mm
. MH
Stan
dalo
ne P
sych
Ho
spita
l
Su
bacu
te
Pa
lliat
ive
LT
C
SL
To
tal
Ca
ncer
Am
bulat
ory
Cochrane Community Health Centre X Cochrane UCC
Aspen Ridge Lodge Didsbury 30 30
Bethany Didsbury Didsbury 100 100
Didsbury District Health Services X Didsbury 16 21 37
High River General Hospital X High River 27 50 77
High River Community Cancer Centre X High River Co-located on same campus as High River General Hospital Ca
Sunrise Village High River High River 108 108
Silver Willow Lodge Nanton 38 38
Foothills Country Hospice Okotoks 8 8
Okotoks Health and Wellness Centre X Okotoks UCC
Revera Heartland Okotoks 40 40
Strafford Foundation Tudor Manor Okotoks 152 152
Agecare Sagewood Seniors Community Strathmore 35 130 165
Strathmore District Health Services X Strathmore 23 23
Extendicare Vulcan Vulcan 46 46
Vulcan Community Health Centre X Vulcan 8 15 23
Total Calgary Zone
296
418
141
2,756
280
121
5,358
2,466
11,836

2016-17 | Alberta Health Services Annual Report
130
Central Zone: Beds by Facility (refer to definitions page)
Facility Name
Op
erat
ed b
y AHS
Location
Ad
dict
ion
Co
mm
. MH
Stan
dalo
ne P
sych
Ho
spita
l
Su
bacu
te
Pa
lliat
ive
LT
C
SL
To
tal
Ca
ncer
Am
bulat
ory
Bashaw Care Centre X Bashaw CACC
Bashaw Meadows Bashaw 30 30
Bentley Care Centre X Bentley 16 16
Slim Thorpe Recovery Centre Blackfoot 6 6
Breton Health Centre X Breton 23 23
Bethany Meadows Camrose 65 30 95
Faith House Camrose 20 20
Louise Jensen Care Centre Camrose 65 65
Memory Lane Camrose 25 25
Rosehaven Care Centre Camrose 75 75
St Mary's Hospital Camrose 76 76
St Mary's Hospital Camrose Co-located on same campus as St. Mary's Hospital Ca
Sunrise Village Camrose Camrose 82 82
Viewpoint Camrose 20 20
Our Lady of the Rosary Hospital Castor 5 22 27
Consort Hospital and Care Centre X Consort 5 15 20
Coronation Hospital and Care Centre X Coronation 10 23 19 52
Daysland Health Centre X Daysland 26 26
Providence Place Daysland 16 16
Drayton Valley Hospital and Care Centre X Drayton Valley 36 50 86
Drayton Valley Community Cancer Centre X Drayton Valley Co-located on same campus as Drayton Valley Hospital and Care Centre Ca
Serenity House X Drayton Valley 12 12
Sunrise Village Drayton Valley Drayton Valley 16 16
Drumheller Health Centre X Drumheller 37 96 133
Drumheller Community Cancer Centre X Drumheller Co-located on same campus as Drumheller Health Centre Ca
Grace House Drumheller 5 5
Hillview Lodge Drumheller 36 36
Eckville Manor House Eckville 15 15
Galahad Care Centre X Galahad 20 20
Hanna Health Centre X Hanna 17 61 78
Hardisty Health Centre X Hardisty 5 15 20
Innisfail Health Centre X Innisfail 28 78 106
Sunset Manor Innisfail 102 102
Islay Assisted Living X Islay 20 20

2016-17 | Alberta Health Services Annual Report
131
Central Zone: Beds by Facility (refer to definitions page)
Facility Name
Op
erat
ed b
y AHS
Location
Ad
dict
ion
Co
mm
. MH
Stan
dalo
ne P
sych
Ho
spita
l
Su
bacu
te
Pa
lliat
ive
LT
C
SL
To
tal
Ca
ncer
Am
bulat
ory
Killam Health Care Centre Killam 5 45 50
Royal Oak Manor Lacombe 111 111
Lacombe Hospital and Care Centre X Lacombe 35 75 110
Lamont Health Care Centre Lamont 15 105 120
Westview Care Community Linden 37 37
Points West Living Lloydminster Lloydminster 60 60
Dr Cooke Extended Care Centre Lloydminster 50 50
Lloydminster Continuing Care Centre Lloydminster 60 60 Lloydminster Hospital
Lloydminster (Sask)
39
39
Lloydminster Hospital
Lloydminster (Sask)
Co-located on same campus as Lloydminster Hospital
Ca
Mannville Care Centre X Mannville 23 23
Mary Immaculate Hospital Mundare 30 30
Eagle View Lodge Myrnam 9 9
Enviros Wilderness School (Shunda Creek) Nordegg 10 10
Olds Hospital and Care Centre X Olds 33 50 83
Sunrise Encore Olds Olds 60 60
Sunrise Village Olds Olds 20 20
Centennial Centre for Mental Health & Brain Injury
X
Ponoka
330
330
Northcott Care Centre (Ponoka) Ponoka 73 73
Ponoka Hospital and Care Centre X Ponoka 29 28 57
Sunrise Village Ponoka Ponoka 20 20
Provost Health Centre X Provost 15 47 62
Addiction Counselling & Prevention Services
X
Red Deer
5
5
Bethany CollegeSide (Red Deer) Red Deer 112 112
Extendicare Michener Hill Red Deer 220 60 280
Kentwood Place X Red Deer 25 25
Pines Lodge Red Deer 20 20
Points West Living Red Deer Red Deer 114 114
Red Deer Hospice Red Deer 10 10
Red Deer Regional Hospital Centre X Red Deer 370 370
Central Alberta Cancer Centre X Red Deer Co-located on same campus as Red Deer Regional Hospital Ca
Safe Harbour Society Red Deer 40 40
Villa Marie Red Deer 100 100

2016-17 | Alberta Health Services Annual Report
132
Central Zone: Beds by Facility (refer to definitions page)
Facility Name
Op
erat
ed b
y AHS
Location
Ad
dict
ion
Co
mm
. MH
Stan
dalo
ne P
sych
Ho
spita
l
Su
bacu
te
Pa
lliat
ive
LT
C
SL
To
tal
Ca
ncer
Am
bulat
ory
West Park Lodge Red Deer 36 36
Rimbey Hospital and Care Centre X Rimbey 23 84 107
Clearwater Centre Rocky Mtn House 40 39 79
Park Avenue at Creekside Rocky Mtn House 40 40 Rocky Mountain House Health Centre X Rocky Mtn House 31 31 Stettler Hospital and Care Centre X Stettler 26 50 76
Points West Living Stettler Stettler 88 88
Sundre Hospital and Care Centre X Sundre 14 9 23
Sundre Seniors Supportive Living Sundre 40 40
Bethany Sylvan Lake Sylvan Lake 40 21 61
Sylvan Lake Community Health Centre X Sylvan Lake CACC
Chateau Three Hills Three Hills 15 15
Three Hills Health Centre X Three Hills 21 24 45
Tofield Health Centre X Tofield 16 50 66
St. Mary's Health Care Centre Trochu 28 28
Two Hills Health Centre X Two Hills 27 56 83
Heritage House Vegreville 42 42
Points West Living Century Park Vegreville 40 40
St Joseph's General Hospital Vegreville 25 25
Vegreville Care Centre X Vegreville 60 60
Vegreville Manor Vegreville 15 15
Vermilion Health Centre X Vermilion 25 48 73
Vermilion Valley Lodge Vermilion 40 40
Extendicare Viking Viking 60 60
Viking Health Centre X Viking 16 16
Points West Living Wainwright Wainwright 59 59
Wainwright Health Centre X Wainwright 25 69 94
Good Samaritan Good Shepherd Lutheran Home
Wetaskiwin
69
69
Sunrise Village Wetaskiwin Wetaskiwin 20 20
Wetaskiwin Hospital and Care Centre X Wetaskiwin 69 107 176
Wetaskiwin Meadows Wetaskiwin 26 26
Wetaskiwin Serenity House (Bosco) Wetaskiwin 6 6
Total Central Zone
66
31 330
1,104
0
10
2,304
1,607
5,452

2016-17 | Alberta Health Services Annual Report
133
EDMONTON ZONE: Beds by Facility (refer to definitions page)
Facility Name
Oper
ated
by
AHS Location
Addi
ctio
n
Com
m. M
H
Stan
dalo
ne
Psyc
h
Hosp
ital
Suba
cute
Palli
ativ
e
LTC SL
Tota
l Canc
er
Ambu
lator
y
Kipohtakawmik Elders Lodge
Alexander Reserve
13
13
Chateau Vitaline Beaumont 46 46
Devon General Hospital X Devon 10 14 24
Addiction Recovery Centre X Edmonton 42 42
Alberta Hospital Edmonton X Edmonton 334 334
Allen Gray Continuing Care Centre Edmonton 156 156
Allendale House Edmonton 10 10
Ambrose Place Edmonton 42 42
Anderson Hall X Edmonton 16 16
Aspire Homes X Edmonton 10 10
Balwin Villa (Excel Society) Edmonton 104 104
CapitalCare Dickinsfield X Edmonton 275 275
CapitalCare Dickinsfield Duplexes X Edmonton 14 14
CapitalCare Grandview X Edmonton 34 147 181
CapitalCare Kipnes Centre for Veterans X Edmonton 120 120
CapitalCare Laurier House Lynnwood X Edmonton 80 80
CapitalCare Lynnwood X Edmonton 284 284
CapitalCare McConnell Place North X Edmonton 36 36
CapitalCare McConnell Place West X Edmonton 36 36
CapitalCare Norwood X Edmonton 114
23 68 205
Churchill Retirement Community Edmonton 35 35
Cross Cancer Institute X Edmonton 55 55 Ca
Devonshire Care Centre Edmonton 132 132
Devonshire Manor Edmonton 59 59
Donnelly House Edmonton 8 8
Diverse City Housing Edmonton 15 15
E4C Meadows Place Edmonton 16 16
E4C Inner Ways Edmonton 10 10
E4C Our Place Edmonton 10 10
East Edmonton Health Centre X Edmonton FCC
Edmonton Chinatown Care Centre Edmonton 80 15 95
Edmonton General Continuing Care Centre Edmonton 20 26 449 495
Edmonton People in Need #2 (SCH) Edmonton 34 34
Edmonton People In Need Batoma House Edmonton 85 85
Emmanuel Home Edmonton 15 15
Extendicare Eaux Claires Edmonton 180 180

2016-17 | Alberta Health Services Annual Report
134
Edmonton Zone: Beds by Facility (refer to definitions page)
Facility Name
Op
erat
ed b
y AHS
Location
Ad
dict
ion
Co
mm
. MH
Stan
dalo
ne P
sych
Ho
spita
l
Su
bacu
te
Pa
lliat
ive
LT
C
SL
To
tal
Ca
ncer
Am
bulat
ory
Extendicare Holyrood Edmonton 74 74
Garneau Hall Edmonton 37 37
George Spady Centre Society Edmonton 73 73
Glastonbury Village Edmonton 49 49
Glenrose Rehabilitation Hospital X Edmonton 244 244
Good Sam. Dr. Gerald Zetter Care Centre Edmonton 200 200
Good Samaritan Millwoods Care Centre Edmonton 60 60
Good Samaritan Southgate Care Centre Edmonton 226 226
Good Samaritan Wedman House Edmonton 30 30
Good Samaritan Wedman Village Homes Edmonton 30 30
Grand Manor Edmonton 102 102
Grey Nuns Community Hospital Edmonton 354 354
Hardisty Care Centre Edmonton 175 175
Health First Strathcona X Edmonton UCC
Henwood Treatment Centre X Edmonton 72 72
House Next Door #1, 2, 3 Edmonton 24 24
Innovative Housing – Spucewood Place Edmonton 93 93
Innovative Housing - Villa Marguerite Edmonton 242 242
Jasper Place Continuing Care Centre Edmonton 100 100
Jellinek House Edmonton 15 15
Jubilee Lodge Nursing Home Edmonton 154 154
Laurel Heights Edmonton 70 70
Lewis Estates Retirement Residence Edmonton 87 87
Lifestyle Options Riverbend Edmonton 18 18
Lifestyle Options Terra Losa Edmonton 77 77
Lifestyle Options Whitemud Edmonton 77 77
McDougall House Edmonton 11 11
Miller Crossing Care Centre Edmonton 155 155
Misericordia Community Hospital Edmonton 309 309
Northeast Community Health Centre X Edmonton ED
Ottewell Lodge Edmonton 38 38
Our House Edmonton 70 70
Our Parents' Home Edmonton 50 50
Recovery Acres Edmonton Edmonton 34 34
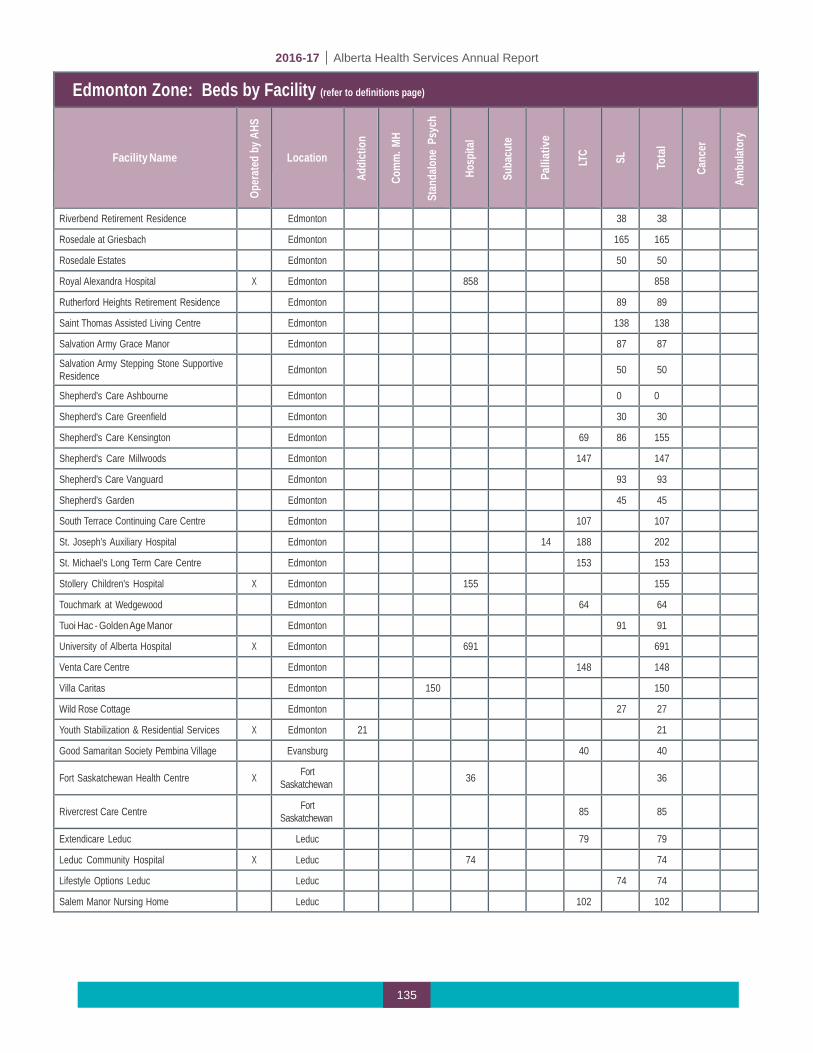
2016-17 | Alberta Health Services Annual Report
135
Edmonton Zone: Beds by Facility (refer to definitions page)
Facility Name
Op
erat
ed b
y AHS
Location
Ad
dict
ion
Co
mm
. MH
Stan
dalo
ne P
sych
Ho
spita
l
Su
bacu
te
Pa
lliat
ive
LT
C
SL
To
tal
Ca
ncer
Am
bulat
ory
Riverbend Retirement Residence Edmonton 38 38
Rosedale at Griesbach Edmonton 165 165
Rosedale Estates Edmonton 50 50
Royal Alexandra Hospital X Edmonton 858 858
Rutherford Heights Retirement Residence Edmonton 89 89
Saint Thomas Assisted Living Centre Edmonton 138 138
Salvation Army Grace Manor Edmonton 87 87
Salvation Army Stepping Stone Supportive Residence
Edmonton
50
50
Shepherd's Care Ashbourne Edmonton 0 0
Shepherd's Care Greenfield Edmonton 30 30
Shepherd's Care Kensington Edmonton 69 86 155
Shepherd's Care Millwoods Edmonton 147 147
Shepherd's Care Vanguard Edmonton 93 93
Shepherd's Garden Edmonton 45 45
South Terrace Continuing Care Centre Edmonton 107 107
St. Joseph's Auxiliary Hospital Edmonton 14 188 202
St. Michael's Long Term Care Centre Edmonton 153 153
Stollery Children's Hospital X Edmonton 155 155
Touchmark at Wedgewood Edmonton 64 64
Tuoi Hac - Golden Age Manor Edmonton 91 91
University of Alberta Hospital X Edmonton 691 691
Venta Care Centre Edmonton 148 148
Villa Caritas Edmonton 150 150
Wild Rose Cottage Edmonton 27 27
Youth Stabilization & Residential Services X Edmonton 21 21
Good Samaritan Society Pembina Village Evansburg 40 40 Fort Saskatchewan Health Centre
X Fort
Saskatchewan
36
36
Rivercrest Care Centre
Fort Saskatchewan
85
85
Extendicare Leduc Leduc 79 79
Leduc Community Hospital X Leduc 74 74
Lifestyle Options Leduc Leduc 74 74
Salem Manor Nursing Home Leduc 102 102
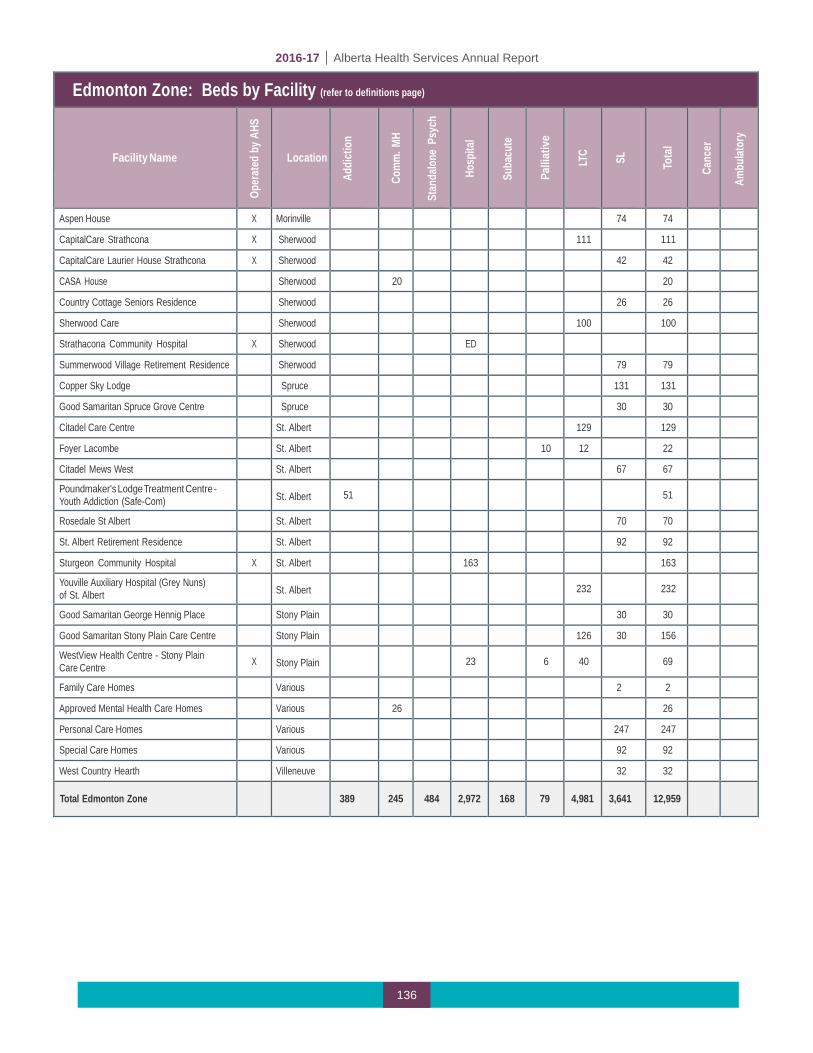
2016-17 | Alberta Health Services Annual Report
136
Edmonton Zone: Beds by Facility (refer to definitions page)
Facility Name
Op
erat
ed b
y AHS
Location
Ad
dict
ion
Co
mm
. MH
Stan
dalo
ne P
sych
Ho
spita
l
Su
bacu
te
Pa
lliat
ive
LT
C
SL
To
tal
Ca
ncer
Ambu
lator
y
Aspen House X Morinville 74 74
CapitalCare Strathcona X Sherwood
111 111
CapitalCare Laurier House Strathcona X Sherwood
42 42
CASA House Sherwood
20 20
Country Cottage Seniors Residence Sherwood
26 26
Sherwood Care Sherwood
100 100
Strathacona Community Hospital X Sherwood
ED
Summerwood Village Retirement Residence Sherwood
79 79
Copper Sky Lodge Spruce
131 131
Good Samaritan Spruce Grove Centre Spruce
30 30
Citadel Care Centre St. Albert 129 129
Foyer Lacombe St. Albert 10 12 22
Citadel Mews West St. Albert 67 67
Poundmaker's Lodge Treatment Centre - Youth Addiction (Safe-Com)
St. Albert
51
51
Rosedale St Albert St. Albert 70 70
St. Albert Retirement Residence St. Albert 92 92
Sturgeon Community Hospital X St. Albert 163 163
Youville Auxiliary Hospital (Grey Nuns) of St. Albert
St. Albert
232
232
Good Samaritan George Hennig Place Stony Plain 30 30
Good Samaritan Stony Plain Care Centre Stony Plain 126 30 156
WestView Health Centre - Stony Plain Care Centre
X
Stony Plain
23
6
40
69
Family Care Homes Various 2 2
Approved Mental Health Care Homes Various 26 26
Personal Care Homes Various 247 247
Special Care Homes Various 92 92
West Country Hearth Villeneuve 32 32
Total Edmonton Zone
389
245
484
2,972
168
79
4,981
3,641
12,959

2016-17 | Alberta Health Services Annual Report
137
North Zone: Beds by Facility (refer to definitions page)
Facility Name
Op
erat
ed b
y AHS
Location
Ad
dict
ion
Co
mm
. MH
Stan
dalo
ne P
sych
Ho
spita
l
Su
bacu
te
Pa
lliat
ive
LT
C
SL
To
tal
Ca
ncer
Am
bulat
ory
Athabasca Healthcare Centre X Athabasca 27 23 50
Extendicare Athabasca Athabasca 50 50
Barrhead Healthcare Centre X Barrhead 34 34
Barrhead Community Cancer Centre X Barrhead Co-located on same campus as Barrhead Healthcare Centre Ca
Dr. W.R. Keir - Barrhead Continuing Care Centre
X
Barrhead
100
100
Mental Health Spaces Barrhead
Shepherd's Care Barrhead Barrhead 42 42
Beaverlodge Municipal Hospital X Beaverlodge 18 18
Bonnyville Healthcare Centre Bonnyville 33 30 63
Bonnyville Community Cancer Centre Bonnyville Co-located same campus as Bonnyville Healthcare Centre Ca
Bonnyville Indian Metis Rehab Centre Bonnyville 20 20
Extendicare Bonnyville Bonnyville 50 50
Boyle Healthcare Centre X Boyle 20 20
Cold Lake Healthcare Centre X Cold Lake 24 31 55
Points West Living Cold Lake Cold Lake 42 42
Ridgevalley Seniors Home Crooked Creek 15 15
Wabasca/Desmarais Healthcare Centre X Desmarais 10 10
Edson Healthcare Centre X Edson 22 38 38 98
Parkland Lodge Edson 10 10
Elk Point Healthcare Centre X Elk Point 12 30 42
Elk Point Heritage Lodge Elk Point 10 10
Fairview Health Complex X Fairview 25 1 66 92
Fort McMurray Recovery Centre X Fort McMurray 16 16
Northern Lights Regional Health Centre X Fort McMurray 105 31 136 Ca
Pastew Place Detox Centre Fort McMurray 11 11
St. Theresa General Hospital X Fort Vermilion 26 8 34
Fox Creek Healthcare Centre X Fox Creek 4 4
Grande Cache Community Health Complex X Grande Cache 12 12
Whispering Pines Seniors Lodge Grande Cache 15 15
Grande Prairie Care Centre Grande Prairie 60 60 120
Northern Addiction Centre X Grande Prairie 63 63
Points West Living Grand Prairie Grande Prairie 10 50 95 155
Queen Elizabeth II Hospital X Grande Prairie 161 30 27 218
Grande Prairie Care Centre X Grande Prairie Co located same campus as QEII Hospital Ca
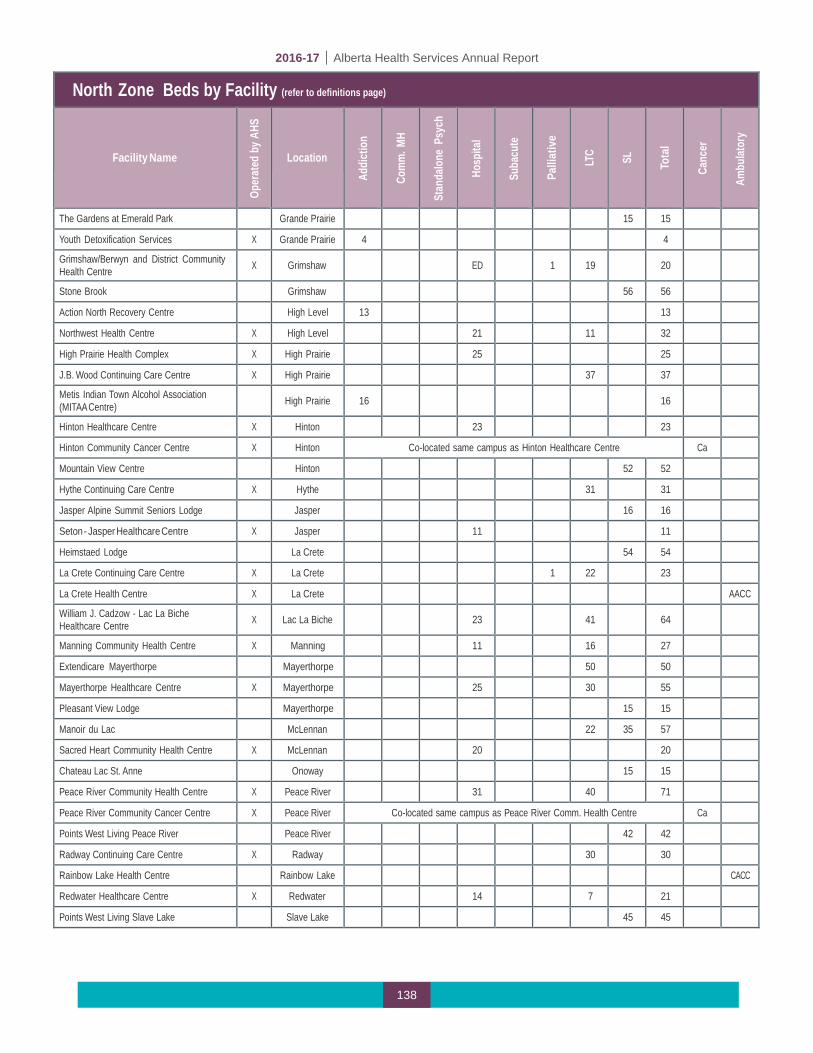
2016-17 | Alberta Health Services Annual Report
138
North Zone Beds by Facility (refer to definitions page)
Facility Name
Op
erat
ed b
y AHS
Location
Ad
dict
ion
Co
mm
. MH
Stan
dalo
ne P
sych
Ho
spita
l
Su
bacu
te
Pa
lliat
ive
LT
C
SL
To
tal
Ca
ncer
Am
bulat
ory
The Gardens at Emerald Park Grande Prairie 15 15
Youth Detoxification Services X Grande Prairie 4 4
Grimshaw/Berwyn and District Community Health Centre
X
Grimshaw
ED
1
19
20
Stone Brook Grimshaw 56 56
Action North Recovery Centre High Level 13 13
Northwest Health Centre X High Level 21 11 32
High Prairie Health Complex X High Prairie 25 25
J.B. Wood Continuing Care Centre X High Prairie 37 37
Metis Indian Town Alcohol Association (MITAA Centre)
High Prairie
16
16
Hinton Healthcare Centre X Hinton 23 23
Hinton Community Cancer Centre X Hinton Co-located same campus as Hinton Healthcare Centre Ca
Mountain View Centre Hinton 52 52
Hythe Continuing Care Centre X Hythe 31 31
Jasper Alpine Summit Seniors Lodge Jasper 16 16
Seton - Jasper Healthcare Centre X Jasper 11 11
Heimstaed Lodge La Crete 54 54
La Crete Continuing Care Centre X La Crete 1 22 23
La Crete Health Centre X La Crete AACC
William J. Cadzow - Lac La Biche Healthcare Centre
X
Lac La Biche
23
41
64
Manning Community Health Centre X Manning 11 16 27
Extendicare Mayerthorpe Mayerthorpe 50 50
Mayerthorpe Healthcare Centre X Mayerthorpe 25 30 55
Pleasant View Lodge Mayerthorpe 15 15
Manoir du Lac McLennan 22 35 57
Sacred Heart Community Health Centre X McLennan 20 20
Chateau Lac St. Anne Onoway 15 15
Peace River Community Health Centre X Peace River 31 40 71
Peace River Community Cancer Centre X Peace River Co-located same campus as Peace River Comm. Health Centre Ca
Points West Living Peace River Peace River 42 42
Radway Continuing Care Centre X Radway 30 30
Rainbow Lake Health Centre Rainbow Lake CACC
Redwater Healthcare Centre X Redwater 14 7 21
Points West Living Slave Lake Slave Lake 45 45

2016-17 | Alberta Health Services Annual Report
139
North Zone: Beds by Facility (refer to definitions page)
Facility Name
Op
erat
ed b
y AHS
Location
Ad
dict
ion
Co
mm
. MH
Stan
dalo
ne P
sych
Ho
spita
l
Su
bacu
te
Pa
lliat
ive
LT
C
SL
To
tal
Ca
ncer
Am
bulat
ory
Slave Lake Family Care Clinic X Slave Lake FCC
Slave Lake Healthcare Centre X Slave Lake 24 20 44
Vanderwell Lodge Slave Lake 8 8
George McDougall - Smoky Lake Healthcare Centre
X
Smoky Lake
12
23
35
Smoky Lake Continuing Care Centre X Smoky Lake 28 28
Central Peace Health Complex X Spirit River 12 16 28
Extendicare St. Paul St Paul 76 76
St. Therese - St. Paul Healthcare Centre X St Paul 40 30 70
St. Paul Abilities Network St. Paul 5 6 11
Swan Hills Healthcare Centre X Swan Hills 4 4
Valleyview Health Centre X Valleyview 20 25 45
Vilna Villa Vilna 12 12
Smithfield Lodge X Westlock 46 46
Westlock Healthcare Centre X Westlock 46 8 112 166
Spruce View Lodge Whitecourt 15 15
Whitecourt Healthcare Centre X Whitecourt 22 22
Total North Zone
143
5
0
917
38
13
1,253
786
3,155

2016-17 | Alberta Health Services Annual Report
140
Change in Bed Numbers by Zone from 2015-16 to 2016-17
ALB
ERTA
HEA
LTH
SER
VIC
ESU
pdat
ed a
s of
May
16
2017
REP
OR
TED
BED
S ST
AFFE
D &
IN O
PER
ATIO
N S
UM
MAR
Y AS
OF
Mar
ch 3
1, 2
017
Addi
ctio
nCo
mm
unity
M
enta
l Hea
lth
Psyc
hiat
ric
(Sta
ndal
one
Faci
lity)
Acut
e Ca
reSu
b-Ac
ute
(Non
Acu
te
Care
Fac
ility
)
Com
mun
ity
Palli
ativ
e &
En
d of
Life
Ca
re
(PEO
LC)
Auxi
liary
Ho
spita
l Nu
rsin
g Ho
me
LONG
TER
M
CARE
SU
BTO
TAL
(aux
iliar
y +
nurs
ing
hom
e)
Leve
l 3
(incl
udes
m
enta
l he
alth
)
Leve
l 4
(incl
udes
m
enta
l he
alth
)
Leve
l 4
Dem
entia
SUPP
ORT
IVE
LIVI
NG
SUBT
OTA
L (S
L 3
+ SL
4 +
SL
4D)
Sout
h Zo
ne74
370
681
2420
248
601
849
29
91,
023
513
1,83
5
2,68
4
2,70
4
3,52
0
Calg
ary
Zone
296
418
141
2,75
628
012
11,
072
4,28
65,
358
233
1,55
567
82,
466
7,
824
7,
945
11
,836
Cent
ral Z
one
6631
330
1,10
40
101,
413
891
2,30
4
39
581
140
11,
607
3,
911
3,
921
5,
452
Edm
onto
n Zo
ne38
924
548
42,
972
168
792,
234
2,74
74,
981
392
2,13
11,
118
3,64
1
8,62
2
8,70
1
12,9
59
North
Zon
e14
35
091
738
1363
961
41,
253
198
394
194
786
2,03
9
2,05
2
3,15
5
968
736
955
8,43
0
51
0
243
5,
606
9,
139
14,7
45
1,
517
5,91
4
2,
904
10
,335
25
,080
25
,323
36
,922
REP
OR
TED
BED
S ST
AFFE
D &
IN O
PER
ATIO
N S
UM
MAR
Y AS
OF
Mar
ch 3
1, 2
016
Addi
ctio
nCo
mm
unity
M
enta
l Hea
lth
Psyc
hiat
ric
(Sta
ndal
one
Faci
lity)
Acut
e Ca
re
Sub-
Acut
e (N
on A
cute
Ca
re F
acili
ty)
Com
mun
ity
Palli
ativ
e &
En
d of
Life
Ca
re
(PEO
LC)
Auxi
liary
Ho
spita
l Nu
rsin
g Ho
me
LONG
TER
M
CARE
SU
BTO
TAL
(aux
iliar
y +
nurs
ing
hom
e)
Leve
l 3
(incl
udes
m
enta
l he
alth
)
Leve
l 4
Leve
l 4
Dem
entia
*
SUPP
ORT
IVE
LIVI
NG
SUBT
OTA
L (S
L 3
+ SL
4 +
SL
4D)
Sout
h Zo
ne64
370
675
2420
248
601
849
309
1,00
9
513
1,
831
2,
680
2,
700
3,
500
Calg
ary
Zone
293
352
141
2,79
828
012
11,
072
4,28
65,
358
233
1,48
7
626
2,
346
7,
704
7,
825
11
,689
Cent
ral Z
one
6631
330
1,10
50
101,
419
891
2,31
039
6
74
8
26
8
1,41
2
3,72
2
3,73
2
5,26
4
Ed
mon
ton
Zone
389
200
484
2,98
416
879
2,23
22,
754
4,98
640
2
2,
111
1,
086
3,59
9
8,58
5
8,66
4
12,8
89
No
rth Z
one
143
50
917
1813
639
626
1,26
519
8
38
4
16
6
748
2,01
3
2,02
6
3,10
9
955
625
955
8,47
9
49
0
243
5,
610
9,
158
14,7
68
1,
538
5,73
9
2,
659
9,
936
24,7
04
24,9
47
36,4
51
Cha
nge
from
Mar
ch 3
1, 2
016
to M
arch
31,
201
7
Addi
ctio
nCo
mm
unity
M
enta
l Hea
lth
Psyc
hiat
ric
(Sta
ndal
one
Faci
lity)
Acut
e Ca
reSu
b-Ac
ute
(Non
Acu
te
Care
Fac
ility
)
Com
mun
ity
Palli
ativ
e &
En
d of
Life
Ca
re
(PEO
LC)
Auxi
liary
Ho
spita
lNu
rsin
g Ho
me
LONG
TER
M
CARE
SU
BTO
TAL
Leve
l 3
(incl
udes
m
enta
l he
alth
)
Leve
l 4Le
vel 4
De
men
tia
SUPP
ORT
IVE
LIVI
NG
SUBT
OTA
L (S
L 3
+ SL
4 +
SL
4D)
Tota
l Bed
s
Sout
h Zo
ne10
00
60
00
00
-10
140
4
4
4
20
Ca
lgar
y Zo
ne3
660
-42
00
00
00
6852
120
120
120
147
Ce
ntra
l Zon
e0
00
-10
0-6
0-6
-163
133
195
189
189
188
Ed
mon
ton
Zone
045
0-1
20
02
-7-5
-10
2032
42
37
37
70
North
Zon
e0
00
020
00
-12
-12
010
2838
26
26
46
13
111
-
(4
9)
20
-
(4
)
(1
9)
(23)
(2
1)
175
24
5
399
37
6
376
47
1
Addi
ctio
n an
d M
enta
l Hea
lthAc
ute
Care
Cont
inui
ng C
are
- Fac
ility
Liv
ing
Supp
ortiv
e Li
ving
ALB
ERTA
HEA
LTH
SE
RVI
CES
TO
TAL:
TOTA
L CO
NTIN
UING
CA
RE (L
TC +
SL)
TOTA
L CO
MM
UNIT
Y BA
SED
CARE
(in
clud
es
PEO
LC)
Tota
l Bed
sZo
ne
ALB
ERTA
HEA
LTH
SE
RVI
CES
TO
TAL:
Addi
ctio
n an
d M
enta
l Hea
lthAc
ute
Care
Cont
inui
ng C
are
- Fac
ility
Liv
ing
Supp
ortiv
e Li
ving
TOTA
L CO
NTIN
UING
CA
RE (L
TC +
SL)
TOTA
L CO
MM
UNIT
Y BA
SED
CARE
(in
clud
es
PEO
LC)
Tota
l Bed
sZo
ne
TOTA
L CO
NTIN
UING
CA
RE (L
TC +
SL)
TOTA
L CO
MM
UNIT
Y BA
SED
CARE
(in
clud
es
PEO
LC)
Zone
ALB
ERTA
HEA
LTH
SE
RVI
CES
TO
TAL:
Addi
ctio
n an
d M
enta
l Hea
lthAc
ute
Care
Cont
inui
ng C
are
- Fac
ility
Liv
ing
Supp
ortiv
e Li
ving

Our many thanks to the hundreds of people who contributed to the completion of AHS’
2016-17 Annual Report.