Embed Size (px)
Citation preview
1
2015 Reports and Financial Statements

3
Table of Contents
Corporate offices as of 22 March 2016 ............................................................................................... 5
Calling of the Shareholders’ Meeting ................................................................................................ 7
2015 REPORTS AND CONSOLIDATED FINANCIAL STATEMENTS ..................... 9
Board of Directors’ Report on Banking Group Operations ..................................................13
Consolidated financial statements as of 31 December 2015 .................................................38
Consolidated Explanatory Notes .......................................................................................................55
Report of the Auditing Company ................................................................................................... 202
2015 REPORTS AND FINANCIAL STATEMENTS
OF THE PARENT COMPANY ....................................................................................................... 205
Board of Directors’ Report on Operations .................................................................................. 207
Financial statements of the year as of 31 December 2015 ................................................... 219
Explanatory Notes .................................................................................................................................. 239
Report of the Board of Statutory Auditors ................................................................................. 365
Report of the Auditing Company ................................................................................................... 375
Financial statements of the Companies of the Group .......................................................... 379
Shareholders’ Meeting resolutions ................................................................................................. 387
Company Boards at 27 april 2016 ................................................................................................... 389
Shareholders’ list ..................................................................................................................................... 391


5
Corporate offices asof 22 March 2016
BOARD OF DIRECTORS
Chairman: Giovanni De Censi
Deputy Chairman: Franco Bernabè
Managing Director: Giuseppe Capponcelli
Directors: Luca Bassi James Gerald Arthur Brocklebank Riccardo Bruno Francesco Casiraghi Michaela Castelli Simone Cucchetti Stuart James Ashley Gent Larry Allan Klane Robin Marshall Jeffrey David Paduch Ottavio Rigodanza
BOARD OF STATUTORY AUDITORS
Chairman: Alessandro Grange
Standing auditors: Lorenzo Banfi Paolo Francesco Maria Lazzati
Alternate auditors: Alberto Balestreri Marco Giuseppe Zanobio
GENERAL MANAGEMENT
General Manager: Giuseppe Capponcelli
Deputy General Manager: Pier Paolo Cellerino

7
Calling of the shareholders’ meeting
The Shareholders are convened within the ordinary Shareholders’ Meeting in Milan, Corso Sempione no. 55, on 27 April 2016 (at 2.30 pm) in first call and, if required, on 28 April 2016 in second call, same place and time,in order to discuss the following
AGENDA
1. Financial statements as of 31 December 2015; Report on Operations of the Board of Directors; reports of the Board of Statutory Auditors and the Auditing Company; related resolutions.
2. Remuneration policies of the ICBPI Group; related resolutions.

9
2015 Reports and Consolidated Financial Statements

11
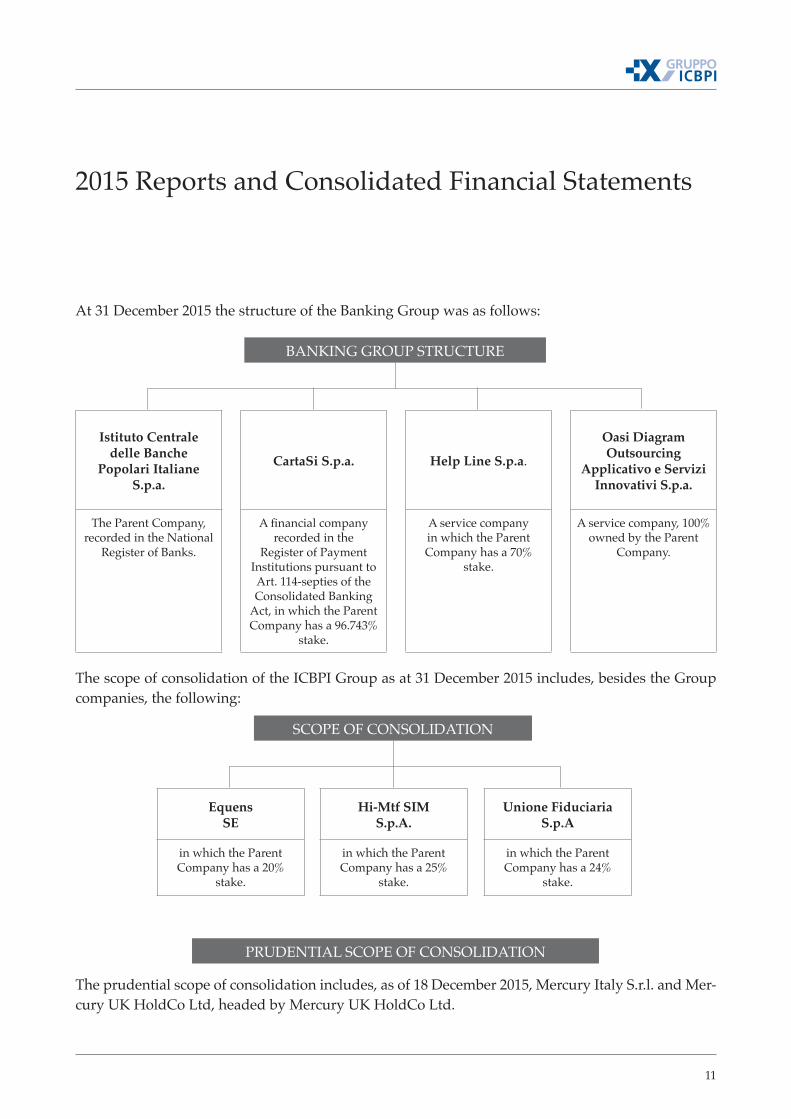
At 31 December 2015 the structure of the Banking Group was as follows:
BANKING GROUP STRUCTURE
SCOPE OF CONSOLIDATION
Istituto Centrale delle Banche
Popolari Italiane S.p.a.
CartaSi S.p.a. Help Line S.p.a.
Oasi Diagram Outsourcing
Applicativo e Servizi Innovativi S.p.a.
The Parent Company, recorded in the National
Register of Banks.
A financial company recorded in the
Register of Payment Institutions pursuant to Art. 114-septies of the Consolidated Banking
Act, in which the Parent Company has a 96.743%
stake.
A service company in which the Parent Company has a 70%
stake.
A service company, 100% owned by the Parent
Company.
EquensSE
Hi-Mtf SIMS.p.A.
Unione Fiduciaria S.p.A
in which the Parent Company has a 20%
stake.
in which the Parent Company has a 25%
stake.
in which the Parent Company has a 24%
stake.
The scope of consolidation of the ICBPI Group as at 31 December 2015 includes, besides the Group companies, the following:
The prudential scope of consolidation includes, as of 18 December 2015, Mercury Italy S.r.l. and Mer-cury UK HoldCo Ltd, headed by Mercury UK HoldCo Ltd.
2015 Reports and Consolidated Financial Statements
PRUDENTIAL SCOPE OF CONSOLIDATION


13
Dear Shareholders,
in 2015, the recovery of the economy overall improved in developed countries but the growth rate of global GDP slowed to 2.6% (from 2.8% in 2014) due to the slowdown of emerging countries. In particular, GDP grew by 2.4% in the United States (as in the previous year), 0.6% in Japan (from -0.1%) and 1.5% in the Eurozone (from 0.9%). The increased growth resulted in a decrease in unem-ployment, respectively 5.0% in the USA (from 5.6%), 3.3% in Japan (3.4%) and 10.5% in the Eurozone (11.4%).
Inflation fell from 2.6% to 2.1% on a global level, remaining at relatively high levels in emerging countries, but falling in developed countries due to a strong decrease in the prices of raw materials. More specifically, the change in consu-mer prices fell to 0.1% in the United States (from 1.6% in 2014), 0.7% in Japan (2.7%) and 0.0% in the Eurozone (0.4%)
Central Banks have collectively maintained an expansionary monetary policy. The ECB - in the light of the decrease in inflation and continuing double-digit unemployment - has launched a plan for injection of liquidity into the economy, primarily through the purchase of government bonds and with the objective of increasing inflation to about 2% as well as encourage bank lending to com-panies and households. In Japan, the Central Bank has continued its program of purchases of financial assets while maintaining stable the total amount at 80 trillion Yen. In the US, on the other hand, the Federal Reserve raised interest rates on federal funds in December by 0.25% - in a range between 0.25% and 0.50% - after having maintained them close to zero even for seven years.
For the Italian economy, 2015 was a positive year given that it finally emerged from a long recession. In fact, after three years of decreases, GDP has begun growing again - although only by 0.7% - driven by exports (4.0%) and suppor-ted by consumption (0.8%) as well as gross fixed investments (0.7%) and public
Board of Directors’ Report on Banking Group Operations
GLOBAL ECONOMY
THE ITALIAN ECONOMY
14
spending (0.3%). The economic recovery has resulted in a reversal of the labor market with the unemployment rate falling by more than one percentage point to 11.3% (from 12.4%). The renewed business confidence and the record levels achieved by household confidence - ever so optimistic due to reduced mortgage costs, the absence of inflation and the increase in employment – has created the conditions for a strengthening of the recovery in 2016.
Inflation remained flat, reaching 0.1% (from 0.2%), and depressed due to the drop in raw material prices and the persistence of large margins of unused pro-ductive capacity.
Public finances have improved slightly, with the net debt which fell by about 3 billion to 42 billion Euro, in line with the decision of the Government to pursue a gradual budget adjustment that focuses on supporting economic recovery ra-ther than rigorous fiscal policy. In relation to GDP, the budget deficit fell to 2.6% (from 3.0% the previous three years), due to the decline in interest expenditure and a slight increase in the primary surplus (which increased to 1.7 %, from 1.6% in 2014). On the other hand, public debt continued to increase and reached 132.8% of GDP (from 132.3%); its reversal is expected to start this year.
Italian credit activity in 2015 showed some initial, timid signs of recovery.
Loans to households and businesses have reported a positive increase trend of 0.5% in late December. Total loans to the economy (including the government) grew by 0.1% on an annual basis. The general stability of stocks is in contrast with more substantial growth in the flows of newly issued loans: new loans to businesses - made from a sample of banks which contains 80% of the market - rose by 13% on an annual basis (figures for the end of November). Subrogations accounted for 32.4% of new loans.
The new issues of loans for the purchase of real estate properties reported an annual increase of 97.4% (again at the end of November). The trend of stocks, however, reported a stagnating trend (+ 0.5% on an annual basis) even within this sector of loans after a minimum value was reached in late June (-1.24% on an annual basis).
Customer deposits reported opposite trends for short and medium / long-term components. Deposits grew by 3.7% year on an annual basis (+47.3 billion from the end of 2014). The bonds were down by 13% compared to the end of 2014 (-57.5 billion Euro). Overall the aggregate figure reported a decrease of 0.6% on an annual basis.
The persistence of highly expansionary monetary policies by the ECB has main-tained negative interbank rates while putting pressure on the interest margin
ITALIAN BANKING ENVIRONMENT
15
2015 Reports and Financial Statements
of banks. Even medium / long term market yields remained at low levels (pea-king between the end of June and early July, at 2.38%), reflecting the low effec-tive growth rate of the economy as well as low inflation and influenced by the depressed trend in raw material prices, particularly oil: the ten-year benchmark for 10-year Italian government bonds was on average equal to 1.69% in 2015 (1.59% at end of December).
The spread between the average lending rate and the average rate on deposits from households and non-financial companies was, on average, equal to 212 basis points in 2015; this was in line with the average for 2014 (210 basis points) and the value at the end of December 2015 (207 basis points).
The risk level of the loan portfolio of Italian banks remained very high even in 2015 due to the long cyclical downturn of the real Italian economy and its effects on credit quality. In late November, national gross NPL’s reached 201 billion Euro, an increase of 1% compared to the end of October. The ratio with respect to total loans was equal to 4.9% for net non-performing loans and 10.4% for tho-se gross of specific value adjustments. The aggregate gross amount accounted for 17.3% of loans to small businesses.
The issue of highly significant levels of NPL’s accumulated within the assets of Italian banks in the post financial crisis phase and the need to find a systemic solution to lighten their incidence on total loans and on regulatory capital has led to lengthy negotiations between the Ministry of the Economy and the EU Commission. The negotiations lasted almost twelve months and did not result in the creation of an actual “bad bank” (whose launch was hindered by new European regulations which prevent aid by governments in order to avoid di-stortions of competition). Individual banks may transfer impaired loans to a vehicle through securitization. And the government can provide a guarantee (Gacs - Warranty on the securitization of NPL’s) on senior tranches of securities issued to finance the purchase of such loan portfolios.
The Economic Bulletin published in January by the Bank of Italy has reported a recovery in profitability of the five largest banking groups of the country, while highlighting the fact that current returns on capital remain low, both in absolute terms as well as in relation to the cost of equity. With reference to this sample and the first nine months of the year, the return on capital and reserves, expres-sed on an annual basis, totaled 5.5 percent (from 2.5 percent for the same period of the last year).
The improvement was due mainly to the growth in revenues from commissions (+7.5 percent) driven by the component generated from asset management as well as the decrease in value adjustments to loans (-24.0 percent). The earnings margin increased slightly (+1.8 percent) while operating expenses remained
16
essentially stable; the cost/income ratio (ratio of operating costs to earnings margin) was reduced accordingly (from 63.0 to 62.2 percent). Operating profit grew by 4.1 percent.
The capital strengthening of Italian banks continued. In late September, the best quality capital (Common Equity Tier 1, CET1) and the total capital of the Ita-lian banking system averaged, respectively, 12.3 and 15.1 percent of the risk-weighted assets, a slight increase from the end of June.
The year 2015 was a very important year for the cooperative banking sector as well.
In the month of March, in fact, the legislative process for reform of regulations pertaining to cooperative banks was completed.
One of the primary novelties introduced by the reform – contained in Law De-cree no. 3 of 24 January 2015, converted by law no. 33 of 24 March 2015, which modified certain provisions of the Consolidated Banking Act – was the possibi-lity of applying the cooperative banking model only for banking intermediaries whose assets do not exceed 8 billion Euro. Ten banking groups interested in becoming corporations were identified: Banco Popolare, Unione di Banche Ita-liane, Banca Popolare dell’Emilia Romagna, Banca Popolare di Milano, Banca Popolare di Vicenza, Veneto Banca, Banca Popolare di Sondrio, Credito Valtelli-nese, Banca Popolare di Bari and Banca Popolare dell’Etruria e del Lazio.
This reform will result in significant changes in the governance of the primary cooperative institutions (abandonment of the pro-capita vote) despite a tempo-rary statutory limit to the exercising of voting rights (5% of the share capital for 24 months). The transformation must be implemented within 18 months from the date of the implementational provisions of the Bank of Italy issued on 18 June 2015. The cooperative banks affected by the reform have already provided indicative periods during which they expect to submit the transformation into corporations to their General shareholders meetings.
On 22 November 2015, the government and the Bank of Italy have reached a solution for the crisis of the four banks of small to medium size (Banca Marche, Banca Popolare dell’Etruria e del Lazio, Cassa di Risparmio di Ferrara, Cari-Chieti) under extraordinary administration, and whose overall share of the do-mestic market was 1 per cent in terms of deposits. The adopted measures have ensured business continuity and a recovery of the four banks as well as the maintenance of labor relations in the interest of the economy of the territories in which these institutions operate, thereby protecting the savings of households
COOPERATIVE BANKS
BAIL-OUT OF FOUR BANKS
17
2015 Reports and Financial Statements
and businesses held in the form of deposits and ordinary bonds. The losses ac-cumulated over time by these banks have been initially absorbed by the shares and subordinated bonds, as required by European norms as a precondition for the orderly resolution of banking crises; these norms were incorporated into Italian law by Legislative Decree no. 180 of 16 November 2015.
In order to promote a solution which is compatible with European norms per-taining to “government aid”, the methodology was structured into a series of steps:
▪ separation of the “good” part of each bank from the “bad”; the latter was merged into a single “bad bank”;
▪ the “good” part (“bridge bank”) was conferred all assets other than non-performing loans, against which there were deposits, bank accounts and ordinary bonds. The capital was reconstituted at a value of about 9 per cent of the risk weighted assets through contributions made by the “Resolution Fund” that utilized the contributions from all system banking institutions.
▪ The bad bank collected all the loans of the rescued banks – written down to 1.5 billion euro - compared with an original value of 8.5 billion Euro and pending their sale to specialist companies. The bad bank capital endowment was always provided by the Resolution Fund.
▪ The financial commitment of the Fund amounted to circa 3.6 billion euro, of which 1.7 billion to cover the losses of the original banks, 1.8 billion for the recapitalization of the good banks and 140 million for equipping the bad bank with a minimum amount of capital to begin operating.
▪ The liquidity required for the Resolution Fund to immediately start opera-ting was advanced by Intesa Sanpaolo, UniCredit and UBI Banca at market rates, with a maximum expiration of 18 months.
▪ No expense has been charged to the government.
As of 1 January 2016, the European regulations on banking resolutions entered into force following the incorporation of the Bank Recovery and Resolution Di-rective (“BRRD”) into the Italian legislative system (with the previously cited Legislative Decree no. 180 of 16/11/2015).
The resolution consists of a restructuring process managed by independent au-thorities – the “resolution authorities” – which, by means of the use of techni-ques and powers that are authorized by the BRRD, aims to prevent interrup-tions in the supply of the essential services offered by the bank (e.g., deposits and payment services) in addition to restoring conditions of economic sustai-
BAIL-IN REGULATIONS

18
nability for the healthy portion of the bank and liquidating the remaining parts. The alternative to the resolution is liquidation.
The relevant authorities can subject a bank to a resolution if the following con-ditions are applicable:
a) the bank is in distress or at risk of distress (for example, when - due to losses - the intermediary has zeroed or significantly reduced its capital; the legislation has moreover not defined specific thresholds - for example, a level of capital ratios - below which the bank can be considered in the distress phase);
b) it is not deemed likely that alternative measures of private nature (such as share capital increases) or supervisory actions can ensure the avoidance of the state of distress of the intermediary within a reasonable time period;
c) applying an ordinary liquidation to the bank would not allow for the protec-tion of systemic stability nor protect depositors and customers and ensure the continuity of essential financial services; as a result, the resolution in necessary for the public interest.
The tools which are available to the resolution authorities are as follows:
▪ sell a part of the assets to a private buyer;
▪ temporarily transfer the assets and liabilities to a bridge bank that is created and managed by the authorities in order to continue the most important functions in light of a subsequent sale on the market;
▪ transfer the impaired assets to a bad bank which manages the liquidation in a reasonable time period.
▪ apply a bail-in, i.e. write-down the shares and receivables in addition to con-verting them into shares in order to absorb losses and recapitalize the bank in distress or a new entity which continues its essential functions.
Public intervention is not excluded but only applied in extraordinary cir-cumstances in order to prevent that the crisis of an intermediary has serious repercussions on the functioning of the overall financial system. A public inter-vention, such as a temporary nationalization, however, requires that the costs of the crisis are subdivided amongst the shareholders and creditors through the application of a bail-in that is at least equal to 8% of total liabilities.
The following liability instruments may not be written down or converted into capital: deposits protected by the deposits guarantee system, that’s to say those with amounts up to € 100,000; guaranteed liabilities, including covered bonds; liabilities relative to the holding of assets by clientele (such as safety deposit boxes and stock purchase accounts); interbank liabilities (excluding intercom-pany transactions) with an original maturity of less than seven days; liabilities
19
2015 Reports and Financial Statements
deriving from participation in payment systems with a duration of less than seven days; payables to employees as well as trade payables and tax payables (if granted preference by bankruptcy laws).
Some information about the markets in which the ICBPI Group operates is gi-ven below.
Cash still plays a dominant role in the Italian Monetics market. In 2014, 80 tran-sactions pro capita were performed using non-cash instruments, compared to 202.3 in the Euro Area.
The payment card sector is growing, but is oriented towards debit and prepaid products and not credit ones.
During 2014 (source: Bank of Italy) the POS enabled debit card market grew: in terms of both number of cards (+6.4%) and use (volumes +12.2%, transac-tions +13.4%). Prepaid products continued expanding strongly as in recent years (cards +13.9%, volumes +14.8%, transactions +19.4%), while credit cards dropped in number (-3.0%) and increased in use (volumes +6.0%, transactions +9.6%).
CartaSi market estimates for 2015 see overall volumes (VISA + Mastercard) growing +9.6%, with a significant contribution from prepaid and international debit cards (volumes POS: +17.1% against credit +9.1%). Amongst credit cards, company card POS volumes are up +8.9% against 2014. Amongst Consumer cards, Classic ones are growing +6.7%, Premium +1.2%).
The revolving segment records (source: Assofin) a +13.7% in volumes financed by cards in the first eleven months 2015.
The European context Payments System is evolving with different guidelines which can be summed up in:
▪ new Authority regulations, like approval of Directive (EU) 2015/2366 by the European Parliament and Council of 25 November 2015 related to inter-nal market payment services (so-called PSD 2). This new Directive, opera-tional by the end of 2017, could lead to discontinuity in the pan-European payments sector, with the possibility of third, non-banking parties (TPP - Third Part Payment) arriving on the market, qualified to perform services accessing payment accounts (XS2A Access-to-Account) of bank customers.
▪ actions of the ERPB (Euro Retails Payment Board) and the EPC to imple-ment new infrastructures at a competitive, co-operative pan-European level
REFERENCE MARKETS
MONETICS
PAYMENT SYSTEMS
20
to manage retail payments in the “instant” mode exploiting existing SEPA schemes as much as possible. Those new systems must guarantee full rea-chability and interoperability between operators / PSPs, and by using the new infrastructures can enable new “mobile” payment methods in models P2P, P2B, P2G, etc. Besides ERPB and EPC, other European bodies and Au-thorities like the Committee on Payments and Market Infrastructures of Bank for International Settlements are also focussed on these issues.
▪ Competitive ICBPI actions to implement, collaborating with other European ACHs belonging to EACHA, a central, clearing co-operation system at Eu-ropean level (CENT). The new system will overcome the current ACH con-nectivity model based on bilateral ‘Interlinks’ moving towards a centralised model.
In the domestic context, developmental efforts within the interbank Payments System are concentrated on the cheque digitalisation and dematerialisation project (Check Image Truncation) of which ICBPI is one of the most interested, proactive stakeholders. Other development areas concern creation of new VAS compared to products that have already migrated from the domestic to the SEPA sphere.
At the end of 2015, total assets being managed (AuM) in the Italian Managed Savings sector reached 2,117 billion euro.
Development scenarios for the next few years foresee continuing growth possi-bly reaching 2,600 billion euro of AuM by 2018, with an average annual growth of 7%.
The main driver behind the Asset Management growth hypothesis in Italy co-mes from the expected growth in wealth investment levels in savings products managed so as to align Italy with the European average. In 2013, the Italian sector AuM value was 54% of GDP, against a European average of 114%. The percentage of Italian family financial wealth invested in managed savings was 26% in 2014, up considerably compared to 17% in 2008, but still decidedly be-low the European level of 40%.
Italian indicators getting progressively closer to the averages of other Europe-an countries will lead to industrial growth, despite cyclical factors such as the stock exchange indicator trend.
Amongst savings products, Asset Management and Pension Funds will get a considerable boost. They are expected to grow no less than 8% per annum, more than the market average. Asset Management has a favourable regulatory situa-tion, thus safeguarding distributors against any direct or indirect restrictions of
MANAGED SAVINGS

21
2015 Reports and Financial Statements
inducements caused by MiFID II. Open Pension Funds will be boosted by both the specific tax regime and uncertainties related to public pension schemes.
Mutual investment funds are progressively increasing the market share of Fo-reign Registered and Roundtrip Funds. In 2018, these products could represent 71% of the Italian funds market, against 66% in 2015. Growth drivers definitely include the ETFs, currently only present on the market as foreign registered funds.
22
Dear Shareholders,
2015 ended with a consolidated net profit of Euro 90.5 million, compared to a net profit of Euro 96.4 million in 2014. Net profit suffers from the impact of the bank crisis resolution Fund and devaluation of the subordinate bonds of 2 banks bailed-out. Shareholders’ equity reached Euro 1,144.6 million, compared to Euro 927.8 million as at 31 December 2014.
These are positive economic results, both overall as well as with respect to the previous year, and were attained in a macroeconomic scenario of recovery that was very slow.
Operating revenue amounts to € 677.5 million, up € 7.9 million (+1.2%) despite the € 13.8 million drop in the overall interest margin.
Consolidated EBITDA is equal to Euro 200.2 million, up 2.4% against € 195.5 million in 2014.
Following the acquisition of total control of Unicard SpA - towards the end of 2014 through its subsidiary CartaSi – the process for corporate and industrial integration of the company within the ICBPI Group was initiated, in accordan-ce with the relative organizational model which led to the merger of Unicard into CartaSi. The operation was completed with effectiveness on 31 July 2015 (accounting effectiveness as of 1 January 2015).
On 18 December 2015, Mercury Italy Srl (a special purpose vehicle indirectly owned by the funds Advent International, Bain Capital and Clessidra SGR) ac-quired control of Istituto Centrale delle Banche Popolari Italiane S.p.A., with a share of 88.95% of the share capital.
The operation was completed in execution of the agreement stipulated in June 2015 by Mercury Italy with the main shareholders of ICBPI (Credito Valtelline-se S.c., Banco Popolare S.c., Banca Popolare di Vicenza S.c.p.a., Veneto Banca S.c.p.a., Banca popolare dell’Emilia Romagna S.c., Iccrea Holding S.p.A., Ban-ca Popolare di Cividale S.c.p.a., UBI Banca S.c.p.a., Banca Popolare di Milano S.C.a.r.l., Banca Sella Holding S.p.A. and Banca Carige S.p.A., overall owners – as of the date of the Agreement - of 93.7% of the share capital of ICBPI) con-cerning the transfer of 85.3% of the share capital of ICBPI.
The undersigning of the agreement followed the completion of a structured
DEVELOPMENT OF THE GROUP
DEVELOPMENTS IN THE SHAREHOLDING STRUCTURE OF THE PARENT COMPANY
23
2015 Reports and Financial Statements
process of selection that was initiated at the start of 2015, conducted by the sel-ling shareholders and affecting multiple entities of primary standing within the private equity sector.
This process heavily involved all the corporate departments of ICBPI as well as all the companies of the Group which were called upon – due to strict time sche-dules – to provide support for due diligence activities (through the preparation of the data room and participation in meetings with potential buyers) as well as for the activities pertaining to the preparation of legal documentation.
Following the undersigning of the agreement, the companies of the ICBPI Group also collaborated with the buyer for the structuring and placement of the high yield financing of the purchasing operation.
The completion of the purchase and sale occurred after the authorizations of the competent authorities (European Commission, ECB, Bank of Italy and De Nederlandsche Bank).
In execution of the agreement, the following things were implemented in addi-tion to the transfer of 85.3% of the share capital:
▪ modification of the Articles of Association of ICBPI in order to adjust the latter to the change in shareholding structure;
▪ the undersigning of a shareholders’ agreement between Mercury Italy S.r.l. and Credito Valtellinese S.c., Banco Popolare S.c., Banca popolare dell’Emi-lia Romagna S.c., Banca Popolare di Cividale S.c.p.a., UBI Banca S.c.p.a., Banca Popolare di Milano S.C.a.r.l., Iccrea Holding S.p.A. and Banca Sella Holding S.p.A. (which jointly retain an overall shareholding amounting to 8.4% of the share capital of ICBPI) containing the rules of governance regu-lating the circulation of ICBPI shares;
▪ the exiting - from the shareholding structure of ICBPI - of Banca Popolare di Vicenza S.c.p.a., Veneto Banca S.c.p.a., Banca Carige S.p.A;
▪ the renewal of the corporate bodies (Board of Directors and Board of Statu-tory Auditors) of ICBPI and its subsidiaries CartaSi and Oasi.
▪ The remaining 3.6% was purchased by Mercury Italy based on share pur-chasing agreements signed with a further 23 minority shareholders of ICBPI between October and November 2015.
The change in control led to the change in the prudential consolidation perime-ter, including the companies Mercury Italy S.r.l. and Mercury UK HoldCo Ltd, with Mercury UK HoldCo Ltd at the top.
24
In a press release issued on 2 November last, Visa Incorporated (USA) an-nounced that it had reached an agreement for the acquisition of Visa Europe Limited, a transaction potentially worth 21.22 billion euro.
The transaction will be completed in the third quarter of the 2015/16 fiscal year and will be in two steps foreseeing an initial payment of 16.5 billion, partly in cash (11.5b) and partly in shares (5b), accompanied by an additional payment (earn out) of up to 4.7 billion euro after the fourth year from when the transac-tion is closed.
It should be noted that the audits of the Bank of Italy on the ICBPI Group – which aim to analyse the systems for governance, management and control of the Group’s operational risks, conducted from February to May 2015 - were concluded with a “partially favorable” assessment and without initiation of pe-nalty procedures.
In the light of the result of the inspections mentioned and considering results of audits performed as part of the prudential auditing and assessment process (SREP), in September Bank of Italy removed, as of the notifications of 30 Sep-tember 2015, the additional asset requirement (add-on) equalling to 100% of the requirement for operating risks, at single and consolidated level.
In 2015, the projects aimed at the development of the Group’s Internal Audit System continued, in line with the changes in the applicable regulations.
The Auditing Department of the Group realized additional interventions for evolution pertaining to reporting to regulators as well as methodological refine-ment of the evaluation of the Internal Audit System. In this area, a new metho-dological approach was developed which requires an evaluation that is more integrated with other players in the system and which complies more with the new analysis methods utilized by the supervisory authorities for assessing in-termediaries. The new model was made operational as of the evaluation of the Audit System for the current year.
The Compliance Department – which oversees norms pertaining to all com-pany activities on the basis of a risk-based approach – expanded its area of competence over the year, particularly with reference to regulations pertaining to the IT system.
With regard to Audits, it should also be noted that, in compliance with the Me-morandum of the Bank of Italy 285/2013, an internal system was adopted to allow reporting – on the part of the personnel of the ICBPI Group – of actions/
VISA TRANSACTION
AUDIT BY THE BANK OF ITALY
INTERNAL AUDIT SYSTEM OF THE GROUP
25
2015 Reports and Financial Statements
events that could constitute a violation of norms that have an impact (for e.g. in terms of penalties, financial and image effects) on the companies of the Group. For this purpose, specific internal regulations of the Group were issued, “Re-porting of norm violations (whistleblowing).”
The activities for refinement of the Risk Appetite Framework (RAF) – aiming to identify and monitor the level and type of risk that the Group is willing to support in order to pursue its strategic objectives – continued; in addition to the updating of existing parameters, new parameters relative to liquidity risk and IT risk were introduced. In addition, a new model for the evaluation and con-trol of reputational risk was defined, in compliance with the provisions of the Memorandum of the Bank of Italy no. 285/2103. The process concerning Highly Significant Operations (HSO) was finalized (time schedules and affected units, in accordance with applicable organisational changes).
In 2015, the process of adjusting to regulatory requirements as well as the ratio-nalization and simplification activities continued. It should be noted, in parti-cular, that the organizational structure of the Business Continuity Management Team was defined in greater detail. This team is composed of individuals from each of the departments affected by vital or critical processes, both in relation to the business of the company and its role in the financial system; the team’s re-sponsibility is to assist the Business Continuity Manager in the management of actions and activities identified in the case of an anomalous and invasive event.
Within CartaSi, the primary interventions were those realized within the “Payment Cards Administration” as well as the “Fraud and Credit Manage-ment”, “Operations” and “Dispute Management” departments for the purpose of continuing the process of operational integration of different business mo-dels (licensing, associates and services) as well as strengthening risk oversight, particularly by improving the focus on activities relating to the analysis and evaluation of fraud and credit risks.
On 29 October 2015, the CEO, Ms Laura Cioli, handed in her notice coming into effect immediately. On the following 4 November, the Board of Directors appointed Mr Giuseppe Capponcelli as CEO pro tempore of CartaSi.
The top level structure of the subsidiary OASI was simplified and now only includes a General Deputy Director in addition to the CEO. In general, the com-pany was subject to an organizational restructuring which aimed for greater operational efficiency and increased focus on activities implemented in the areas of anti-money laundering, security, internal controls, and software deve-
RISK GOVERNANCE
ORGANISATIONAL STRUCTURE OF THE ICBPI GROUP
26
lopment services as well as the management of complex projects.
During the year, the planned measures in support of the Group business and government functions continued. Said projects were aimed at developing pro-ducts and services, optimizing the operating model, improving relations with customers, as well as complying with the requirements that arose as a result of changes in the reference regulations.
ICT Services and Solutions for Payment Systems
In the sector of payment systems, and in relation to SEPA procedures, several project initiatives were initiated to streamline technological infrastructure as well as improve the daily monitoring of applications used to deliver services to customers of ICBPI in addition to developing new functionalities to offer to all client banks (e.g. night cycles). Three major banks became customers of ICBPI by using the service “Domestic Application Centre” as well as ACH ICBPI SEPA for SEPA Credit Transfer, SEPA Direct Debit and SEDA.
In terms of the development of new services, the “P2P” service (Person to Per-son payment) was issued to three major banking groups that were already ICBPI customers.
The feasibility study for the realization of ACH Real Time – utilized to manage Instant Payments – was initiated.
ICT Services and Solutions for the Securities Services
With regard to Fund Administration services, activities pertaining to the mer-gers of certain funds also continued in the second half of the year. In the mutual funds Transfer Agent sector, the migrations forecasted for the end of 2015 for dealers with respect to ISO 20022 standards were completed. With regard to the project for unification of the environments of an important customer of ICBPI, the preparatory testing for the go-live, expected in January 2016, were comple-ted.
The activities pertaining to the adjustment of the ICBPI systems to the new Eu-ropean Target 2 Securities platform – which allowed ICBPI to successfully ap-ply the new modalities for settlement management (go live date wave of 1 to 31 August 2015) – were completed. The project activities pertaining to waves 2 and 3 – set by the ECB for 29 March and 12 September 2016, respectively – are underway.
With regard to “Info Providers”, the first phase of a project for optimization of costs relative to the sector of database information for stocks was completed (during the course of 2016, the bond sector will be examined).
GROUP INFORMATION SYSTEM
27
2015 Reports and Financial Statements
ICT Services and Solutions for e-Money
The following operations of regulatory, technological, developmental and in-novative nature were implemented with respect to the IT systems of CartasSi:
Regulatory Environment:
▪ completion of implementations for EBA regulations in the sector for online purchases.
Technological sector:
▪ initiation of the process of technological adjustment of the primary CartaSi portal (Owners Portal) according to the new architectural paradigm which must be extended to most of the managed application solutions. The new paradigm provides for the shift of business operations from the front end (portal) to the SOA and the realization of a Multicompany and Multiproces-sor database;
▪ activities for the technological adjustments of the core databases of CartaSi with respect to the most recent market versions are underway;
▪ initiation of activities for adjustment to circuit regulations (i.e. PCI).
Progress Environment:
▪ completion of the unification of procedures for mergers of the companies C-card and Unicard into CartaSi and of the products they manage;
▪ ongoing developments for the realization of the products CartaSi direct li-cense debit and CartaSi Prepaid Business;
Innovation Environment:
▪ developments are underway for the realization of a new service for mana-ging usable virtual cards through smartphones (HCE);
▪ developments are underway for the management of PagoBancomat cards on the web (online purchases).
Infrastructures
As of 1 January 2015, the outsourced service for managing the Data Centers of the ICBPI Group was initiated. The systems in the Data Centers of ICBPI in Milan-Sempione and Rome-Chianesi were transferred to the target Data Cen-ters of Equens in Pero and Settimo Milanese with the consequent supply of the service by Equens. From June to September 2015, the structural changes of a part of the former Data Center areas in Corso Sempione were initiated for the preparation of the infrastructure needed to supply the new ACS and HCE ser-vices required by the Visa circuit.
28
The project for digitalization of the work stations of the Group has continued - after having completed, in 2014, both Help Line and CartaSi – with the comple-tion of the migration for ICBPI and through initiation of the part falling under the competence of OASI. The project provides a technical solution that gua-rantees the standardization of the infrastructure by improving availability and operational continuity.
IT security
It should be noted that, in this area, activities have continued for the further im-provement of security methods acting against cybercrime and to prevent poten-tial security incidents; the Cybersecurity Framework issued by NIST (National Institute of Standards and Technology) was used as a reference.
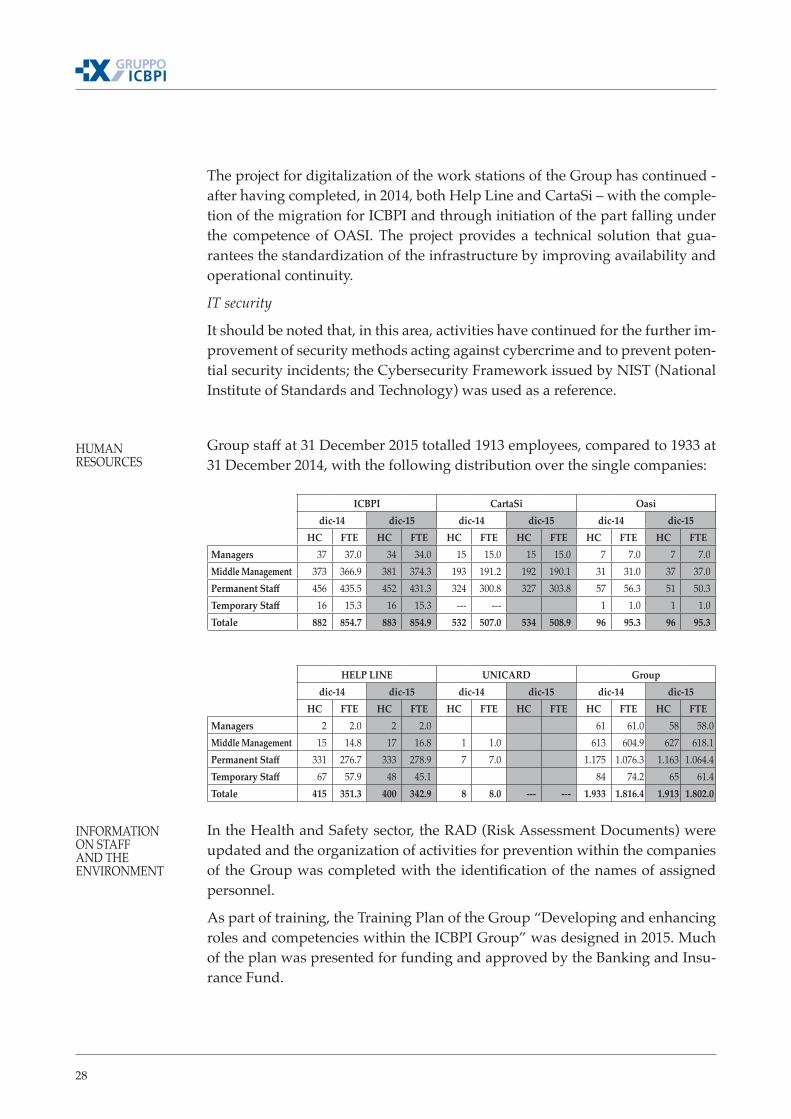
Group staff at 31 December 2015 totalled 1913 employees, compared to 1933 at 31 December 2014, with the following distribution over the single companies:
ICBPI CartaSi Oasidic-14 dic-15 dic-14 dic-15 dic-14 dic-15
HC FTE HC FTE HC FTE HC FTE HC FTE HC FTEManagers 37 37.0 34 34.0 15 15.0 15 15.0 7 7.0 7 7.0Middle Management 373 366.9 381 374.3 193 191.2 192 190.1 31 31.0 37 37.0Permanent Staff 456 435.5 452 431.3 324 300.8 327 303.8 57 56.3 51 50.3Temporary Staff 16 15.3 16 15.3 --- --- 1 1.0 1 1.0Totale 882 854.7 883 854.9 532 507.0 534 508.9 96 95.3 96 95.3
HELP LINE UNICARD Groupdic-14 dic-15 dic-14 dic-15 dic-14 dic-15
HC FTE HC FTE HC FTE HC FTE HC FTE HC FTEManagers 2 2.0 2 2.0 61 61.0 58 58.0Middle Management 15 14.8 17 16.8 1 1.0 613 604.9 627 618.1Permanent Staff 331 276.7 333 278.9 7 7.0 1.175 1.076.3 1.163 1.064.4Temporary Staff 67 57.9 48 45.1 84 74.2 65 61.4Totale 415 351.3 400 342.9 8 8.0 --- --- 1.933 1.816.4 1.913 1.802.0
In the Health and Safety sector, the RAD (Risk Assessment Documents) were updated and the organization of activities for prevention within the companies of the Group was completed with the identification of the names of assigned personnel.
As part of training, the Training Plan of the Group “Developing and enhancing roles and competencies within the ICBPI Group” was designed in 2015. Much of the plan was presented for funding and approved by the Banking and Insu-rance Fund.
HUMAN RESOURCES
INFORMATION ON STAFF AND THE ENVIRONMENT
29
2015 Reports and Financial Statements
The Training Plan in 2015 capitalized and provided continuity to the training supplied in previous years and its guidelines, objectives and content continued to be rooted in the business development of the ICBPI Group.
The objective was to develop and valorize the distinctive competencies of the ICBPI Group by consolidating the existing knowledge base as well as by prepa-ring for professional activities after the release from/change in activities, deve-loping competencies for future skills and preparing for new roles and respon-sibilities.
In this respect, the Programme has been aimed to:
▪ ensure development of human resources, giving the opportunity to obtain the necessary skills required for improving operational, decision-making and relationship efficiency;
▪ develop training methods which aim to provide individuals with the tools that are needed to manage work complexities, in particular stress manage-ment;
▪ support the role of middle management through dedicated training efforts;
▪ respond to requests on demand with “dedicated projects” in order to attain business objectives;
▪ comply with the provisions of the law that are applicable to banks and inter-mediaries.
In 2015, training activities involved a total of 1,845 employees with 77,332 hours of training, of which 34% for compulsory training, 45% for specialist training and 21% for manager training, with an average of about 5.5 man-days on total employees.
Communication events include the following:
▪ the organization of the Payments Conference “Banking Revolution”, held in Milan on 22 April 2015, and which involved the participation of top-level representatives of the Bank of Italy, the Ministry of Economic Development, the banks and the Italian Banking Association;
▪ attendance at events promoted by other Institutions (ABI, Swift, EBA Clea-ring, Confindustria) dedicated to providing an in-depth analysis and dialo-gue on the regulatory, technological and framework developments seen in the core business areas (Payments, Securities Services and e-Money);
▪ Media Relations which aimed to promote the main institutional and busi-ness initiatives of the Parent Company and its subsidiaries;
COMMUNICATION, INSTITUTIONAL EVENTS AND MEDIA RELATIONS
30
▪ publishing initiatives (print and online periodicals) intended for the public, both internal (House Organ - Open) and external (Magazine - Mind The Gap and Mind The Step).
The results of the Financial Statements and the initiatives of the Parent Company and the Subsidiary companies (CartaSi, Help Line, Oasi, subject to management and coordination by ICBPI) and of the main investee companies (Hi-Mtf Sim, Equens SE and Unione Fiduciaria, included within the scope of consolidation) follow below.
ICBPI recorded a net profit for the year of Euro 62.246 million, lower than the Euro 77.904 million of 2014. Net profit suffers from the impact of the bank crisis resolution Fund and devaluation of the subordinate bonds of 2 banks bailed out. EBITDA is Euro 105.077 million, compared to Euro 107.912 million in the previous year. Shareholders’ equity totalled Euro 810.0 million compared to Euro 772.0 million in 2014 (+4.9%), as detailed below.
The Company, of which ICBPI holds 96.7% of the share capital as of 31 Decem-ber 2015 closed the year with an EBITDA of 127.1 million Euro (+7% against 2014) and a net profit of Euro 71.3 million; last year the Net Profit was Euro 57.1 million
The marked increase in net profit (+24.6%) is also due to the fact that 2014 in-come taxes included amounts referred to previous periods for € 7.8 million following agreements with the Financial Administration.
As part of the external line growth activities, on 31 July 2015 the merger through incorporation of Unicard into CartaSi was finalised effective as of 1st January 2015.
The 2015 business performance involved the management of approximately 15.6 million cards and over 2.4 billion transactions.
Business performances are summarised below in relation to the three main bu-siness lines of the Company:
▪ issuing and acquiring activities licensed directly and on behalf of Banks;
▪ servicing activities;
▪ management of POSs and ATMs.
PERFORMANCE OF THE PARENT COMPANY AND THE GROUP COMPANIES
ICBPI S.P.A.
CARTASI S.P.A.
31
2015 Reports and Financial Statements
Issuing and acquiring activities licensed directly and on behalf of Banks
▪ The company’s card business increased by +7.0% compared to 2014, closing the year with almost 9.4 million cards, thanks to the issue of new cards (about 1.8 million) and to the volumes from the acquisition of Unicard which more than offset the ongoing outflows towards products owned by those Banking Groups that were previously company shareholders;
▪ the composition of the new emissions of the year by product (1.8 million cards) reported an increase in prepaid cards that was primarily derived from the issue of co-branded cards;
▪ total cardholder expenditure amounted to approximately Euro 28.0 billion, an increase of 7.7% compared to 2014;
▪ average use of directly-licensed credit cards remains among the highest in the reference market and increased despite the adverse economic fra-mework, also due to the promotional and spending stimulation initiatives implemented during 2015;
▪ the volumes of acquiring transactions were equal to circa 50.3 billion Euro, an increase (+3.5%) with respect to 2014;
▪ On the whole the number of managed issuing and acquiring transactions showed an increase of 7.6%.
Servicing activities
▪ The stock of cards managed on behalf of third-party licensees totalled ap-proximately 6.2 million cards, a 6.7%;
▪ the number of functionalities linked to national debit cards (30.6 million) is growing compared to 2014 (+4.1%);
▪ the overall number of managed transactions (1,528 million) rose with re-spect to the previous year (+10.0%).
Management of POSs and ATMs
▪ the number of e-commerce (over 13 thousand units) and physical (approxi-mately 551 thousand units) POS grew, this also being due to the Italian De-cree-Law no. 150 dated 30 December 2013, which established the obligation to accept payment cards for the purchase of goods, services and professional services for amounts higher than Euro 30, from 30 June 2014;
▪ specifically, the number of virtual POSs continued to grow at a good rate (+7.3%) compared to 2014, as a result of the expansion of the sector and the commercial initiatives that were carried out;
32
▪ managed ATMs reached 9.4 thousand units, a decrease compared to the fi-gure of the previous year (-2.7%) due to the rationalisation of the branch network by certain client Banking Groups.
The main economic indicators of 2015, compared to those of 2014, highlight the following:
▪ the profit and loss account as of 31 December 2015 presents a result for the period of 71.3 million Euro, 24.8% higher than the previous year,
▪ commissions and revenues from net services amount to 443.2 million Euro, up 2.7%,
▪ the interest margin is -5.4 million Euro with a 23.0% improvement,
▪ personnel expenses amount to 38.5 million Euro (+3.7% against 2014),
▪ other administrative expenses (260.4 million Euro) have grown compared to the previous year (+2.2%),
▪ income taxes, 32.3 million Euro, are lower than those entered in the previous period, which included taxes referred to previous periods for 7.8 million fol-lowing an agreement with the Financial Administration, besides the benefit of IRAP deductibility for personnel expenses for 2015.
Compared to 2014, the Balance Sheet reflects the merger through incorporation of Unicard performed in the period.
In particular, please note that:
▪ Receivables (2,369.0 million Euro) are lower than 2014, related to the drop in Direct Licence expenses (net of Licence for Banks volumes),
▪ Shareholdings were zeroed with the merger through incorporation of Uni-card performed in the period,
▪ Tangible Assets increased because of the POS base,
▪ Non current assets and asset groups being disposed of (186.2 million Euro) are due to the revaluation of the share in Visa Europe,
▪ Payables (1,906.0 million Euro) mainly include the funding for card mana-gement activities mirroring the Receivables trend,
▪ Provisions for risks and charges (15.8 million Euro) have dropped as a who-le following releases for alignment with relative residual risks.
In collaboration with Partner Banks, commercial activities to increase the diffu-sion and use of monetics products, both issuing and acquiring, were implemen-ted during the year. In particular, new commercial bonus plans for Banks were implemented, to increase the card base, sustain issuing greater value added
33
2015 Reports and Financial Statements
products, growth of trading and acquisition/retention of large customers.
CartaSi also relaunched its commercial proposal for the issuing and acquiring activities of third party licensees, extending the contents of offer for the licence model and innovative products (HCE, international debt, fraud prevention) to customers in servicing and POS and ATM management
Territorial meetings with Banks (roadshows) were organised to proactively acknowledge the needs of the Banks themselves and were accompanied by Net-work training sessions to share the value of the monetics offer.
CartaSi, in collaboration with Partner Banks, implemented all the activities to enact Ministerial Decree 51/2014 MEF of 14 February 2014 (Regulations on commissions applied to transactions made using payment cards).
In 2015, the Company continued along the innovation and digitalisation path started in previous years:
▪ progressive diffusion of the MySi wallet, integrated in the new MySi App release and the certification and publication of the wallet itself amongst the e-wallets adherent to the MasterPass service offered by MasterCard,
▪ industrialisation of the payment solution via Smartphone based on HCE (Host Card Emulation) technology in the mobile MySi wallet, to cover the entire card base managed,
▪ implementation of the “Cashless city ” project in Bergamo, promoted by CartaSi – involving local institutions, public administration, Banks payment circuits (Consorzio Bancomat, MasterCard, Visa), private companies and technological enablers to valorise electronic payment services at the service of citizens,
▪ revitalisation of the Club IoSi, completely renewed and digitalised, also thanks to the new virtual catalogue.
2015 saw operating structures involved in the usual implementation and con-trol of ordinary activities.
The continual monitoring and observation of the main indicators, and of the most significant drivers, enabled actions to minimise the impacts from the in-crease in volumes and start of new service areas.
Maximum attention paid to service quality and achieving process effectiveness and efficiency improvement targets, ensuring transversal use of the solutions introduced.
During 2015, communication activities to increase the knowledge and diffusion of CartaSi services continued and to develop customer relations by creating

34
and implementing activities (online and offline) to sustain the new projects and generate greater product awareness.
Social channel and social care management activities continued, for CartaSi.it and related websites (updating content, content optimisation activities for se-arch motor positioning purposes) and the monthly, multi-channel communica-tion plan aimed at Holders, Shops, Banks through the different communication channels (Website, Social Networks, Direct E-mail and Bank Statement).
The Company sponsored several conventions and events including territorial meetings with Banks (so-called Roadshows) and the “Bergamo - cashless city” format organising communication.
During 2015, the “Osservatorio Acquisti CartaSi” (CartaSi Spending Monitor) has maintained its position as a reliable source of information on the purchasing behaviour of Italian consumer, thanks also to its continuous presence on Italian media.
The subsidiary Help Line S.p.A., of which ICBPI holds 70% of share capital, recorded an EBITDA of Euro 2.6 million compared to Euro 2.2 million as at 31 December 2014.
Income taxes totalled Euro 1.2 million and net profit thus totalled Euro 2.4 mil-lion.
The Company conducts business primarily for CartaSi, but also works for cer-tain primary Italian banks, supporting their customers 24 hours a day and 365 days a year.
In 2015, the innovation of technological systems to allow improved operational efficiency continued.
The subsidiary Oasi S.p.A., of which ICBPI holds 100% of the share capital, recorded an EBITDA totalling Euro 7.9 million, against Euro 7.2 million in the previous year.
Operating income totalled Euro 29.2 million, up 9.5% on the previous year; whi-le operating costs amounted to Euro 21.3 million.
Current and prepaid taxes of Euro 1.4 million lead to a net profit of Euro 3.0 million, higher than in 2014 (+32 %).
The Company has updated its traditional products and services in line with the new regulatory changes and has launched important new initiatives. In parti-cular:
HELP LINE S.P.A.
OASI S.P.A.
35
2015 Reports and Financial Statements
OTHER COMPANIES INCLUDEDWITHIN THE SCOPE OF CONSOLIDATION EQUENS SE
▪ for the purposes of supervisory reporting, the project for the new service Data Point Model EBA - dedicated to highly significant banks – has been initiated in order to prepare for the requests of the ECB in relation to AQR, stress testing and data collection; the project activities of the Common Re-porting Standard – for the purposes of the Know Your Customer CRS effec-tive as of 1 January 2016 – were completed;
▪ within the anti-money laundering sector, the AML outsourcing service for a banking group was activated; the first version of GIANOS® 3D – designed for a foreign bank - was installed in Luxemburg and the version for controls on payment cards was completed (GIANOS®MONETICA);
▪ with regard to ICT security, the first issue of the IT Risk Manager was prepa-red; a specialized consulting service was organized to oversee cybersecurity and whistleblowing in relation to ECB recommendations pertaining to onli-ne payment security and the regulations issued by the Bank of Italy.
Financial Statement highlights for the other investee companies included within the scope of consolidation follow below.
In 2016 the company is expected to show results consistent with the forecast, despite the extraordinary costs related to the so-called “Tulipe Project”, i.e. the operation for integration between Worldline (a company which is part of the Atos Group) and Equens itself.
In early November, the shareholders of Equens and Worldline signed an Exclu-sive Memorandum of Understanding (MoU) for the operation. In addition, the following documents have been undersigned:
a. Business Combination Agreement: the legal framework for the implemen-tation of the transaction which includes the conferral of the payments com-pany branch of Worldline to Equens;
b. Shareholders Agreement: the agreement regulating the governance of the Equens Worldline Company (the entity resulting from the operation) and the relationships amongst shareholders;
c. Port SPA: the agreement governing the sale of 100% of the shares of Pay-square from Equens to West.
Following the completion of the operation (in June 2016) Equens will therefore exit from the scope of consolidation of the ICBPI Group.
36
The operating result, gross of taxes (EBIT), amounts to € 136 thousand down compared to € 607.7 thousand in 2014 and the net period result is € 87.5 thou-sand, against € 369.7 thousand in the previous year. Total assets amount to € 6,665.5 million
Those results were obtained in a general context of bond markets dropping de-cidedly in volumes exchanged (-16% compared to 2014); however, in which the company continued its process to increase the number of market participants and there was an increase in market makers and direct members.
In 2016 the company is expected to show revenues amounting to €34.9 million up 15% compared to 30.3 million in 2015.
HI-MTF SIM
UNIONE FIDUCIARIA
37
2015 Reports and Financial Statements
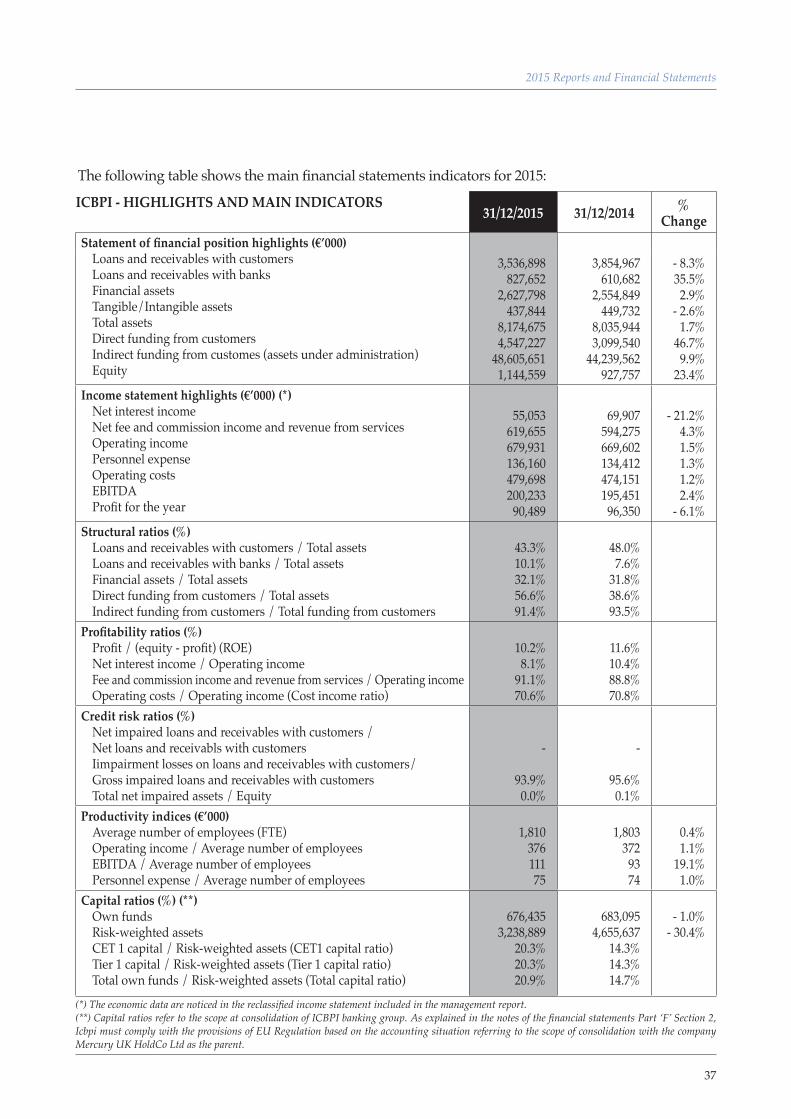
The following table shows the main financial statements indicators for 2015:
(*) The economic data are noticed in the reclassified income statement included in the management report.(**) Capital ratios refer to the scope at consolidation of ICBPI banking group. As explained in the notes of the financial statements Part ‘F’ Section 2, Icbpi must comply with the provisions of EU Regulation based on the accounting situation referring to the scope of consolidation with the company Mercury UK HoldCo Ltd as the parent.
ICBPI - HIGHLIGHTS AND MAIN INDICATORS31/12/2015 31/12/2014 %
ChangeStatement of financial position highlights (€’000)
Loans and receivables with customersLoans and receivables with banksFinancial assetsTangible/Intangible assets Total assetsDirect funding from customersIndirect funding from customes (assets under administration)Equity
3,536,898 827,652
2,627,798 437,844
8,174,675 4,547,227
48,605,651 1,144,559
3,854,967 610,682
2,554,849 449,732
8,035,944 3,099,540
44,239,562 927,757
- 8.3% 35.5% 2.9%
- 2.6% 1.7%
46.7% 9.9%
23.4% Income statement highlights (€’000) (*)
Net interest incomeNet fee and commission income and revenue from servicesOperating incomePersonnel expenseOperating costsEBITDAProfit for the year
55,053 619,655 679,931 136,160 479,698 200,233 90,489
69,907 594,275 669,602 134,412 474,151 195,451 96,350
- 21.2% 4.3% 1.5% 1.3% 1.2% 2.4%
- 6.1% Structural ratios (%)
Loans and receivables with customers / Total assetsLoans and receivables with banks / Total assetsFinancial assets / Total assetsDirect funding from customers / Total assetsIndirect funding from customers / Total funding from customers
43.3% 10.1% 32.1% 56.6% 91.4%
48.0% 7.6%
31.8% 38.6% 93.5%
Profitability ratios (%)Profit / (equity - profit) (ROE)Net interest income / Operating income Fee and commission income and revenue from services / Operating income Operating costs / Operating income (Cost income ratio)
10.2% 8.1%
91.1% 70.6%
11.6% 10.4% 88.8% 70.8%
Credit risk ratios (%)Net impaired loans and receivables with customers / Net loans and receivabls with customersIimpairment losses on loans and receivables with customers/Gross impaired loans and receivables with customersTotal net impaired assets / Equity
-
93.9% 0.0%
-
95.6% 0.1%
Productivity indices (€’000)Average number of employees (FTE)Operating income / Average number of employeesEBITDA / Average number of employeesPersonnel expense / Average number of employees
1,810 376 111 75
1,803 372 93 74
0.4% 1.1%
19.1% 1.0%
Capital ratios (%) (**)Own fundsRisk-weighted assetsCET 1 capital / Risk-weighted assets (CET1 capital ratio)Tier 1 capital / Risk-weighted assets (Tier 1 capital ratio)Total own funds / Risk-weighted assets (Total capital ratio)
676,435 3,238,889
20.3%20.3%20.9%
683,095 4,655,637
14.3% 14.3% 14.7%
- 1.0% - 30.4%
38
FINANCIAL STATEMENT HIGHLIGHTS
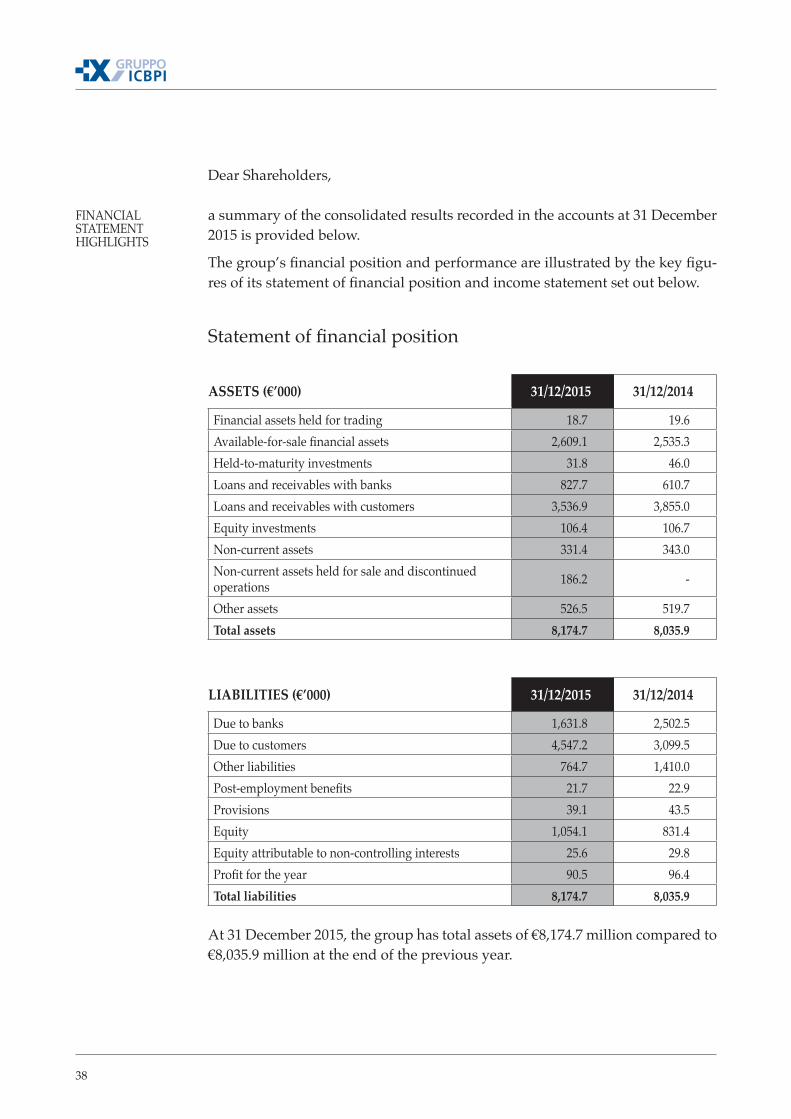
Dear Shareholders,
a summary of the consolidated results recorded in the accounts at 31 December 2015 is provided below.
The group’s financial position and performance are illustrated by the key figu-res of its statement of financial position and income statement set out below.
Statement of financial position
ASSETS (€’000) 31/12/2015 31/12/2014
Financial assets held for trading 18.7 19.6Available-for-sale financial assets 2,609.1 2,535.3Held-to-maturity investments 31.8 46.0Loans and receivables with banks 827.7 610.7Loans and receivables with customers 3,536.9 3,855.0Equity investments 106.4 106.7Non-current assets 331.4 343.0Non-current assets held for sale and discontinued operations 186.2 -
Other assets 526.5 519.7Total assets 8,174.7 8,035.9
LIABILITIES (€’000) 31/12/2015 31/12/2014
Due to banks 1,631.8 2,502.5Due to customers 4,547.2 3,099.5Other liabilities 764.7 1,410.0Post-employment benefits 21.7 22.9Provisions 39.1 43.5Equity 1,054.1 831.4Equity attributable to non-controlling interests 25.6 29.8Profit for the year 90.5 96.4Total liabilities 8,174.7 8,035.9
At 31 December 2015, the group has total assets of €8,174.7 million compared to €8,035.9 million at the end of the previous year.
39
2015 Reports and Financial Statements
A glance at the various asset captions shows that:
▪ Financial assets held for trading amount to €18.7 million against €19.6 mil-lion at 31 December 2014;
▪ Available-for-sale financial assets come to € 2,609.1 million compared to €2,535.3 million at the end of 2014, mainly consisting of government bonds. The increase is a result of the fair value measurement of the Visa Europe shares;
▪ Held-to-maturity investments amount to €31.8 million and comprise bank bonds (31 December 2014: €46.0 million). The reduction is mainly a result of redemption of certain bonds that reached maturity and the impairment of two securities held by the group;
▪ Loans and receivables with banks amount to €827.7 million compared to €610.7 million at the previous reporting date. The increase is principally due to the larger deposits and joint accounts with banks and reverse repos in place at year end;
▪ Loans and receivables with customers decreased from €3,885.0 million at 31 December 2014 to €3,536.9 million at the reporting date. The reduction is mainly attributable to the smaller number of reverse repos in place at year end compared to 31 December 2014 and a decrease in other financing, mo-stly consisting of guarantee deposits provided to carry out business activi-ties;
▪ Equity investments come to €106.4 million compared to €106.7 million at the end of 2014;
▪ Non-current assets amount to €331.4 million against €343.0 million at 31 December 2014. The reduction is mostly a result of amortisation and depre-ciation recognised during the year;
▪ Non-current assets held for sale and discontinued operations amount to € 186.2 million related to the fair value of the investment in Visa Europe;
▪ Other assets of €526.5 million (31 December 2014: €519.7 million) include cash and cash equivalents of €22.4 million, tax assets of €63.5 million, inclu-ding deferred tax assets of €53.1 million and other assets of €440.6 million. The increase mainly refers to the greater liquidity deposited with central banks.
With respect to liabilities:
▪ Due to banks amounts to €1,631.8 million compared to €2,502.5 million at 31 December 2014. The decrease is principally attributable to the smaller deposits and a smaller number of repos in place at the reporting date;
40
▪ Due to customers comes to €4,547.2 million against €3,099.5 million at the previous year end. The increase is mostly due to the higher volume of fun-ding from customers compared to 31 December 2014 and the repos in place at the reporting date;
▪ Other liabilities amount to €764.7 million compared to €1,410.0 million at 31 December 2014 and include financial liabilities held for trading of €4.9 million, deferred tax liabilities of €52.2 million and other liabilities of €707.6 million. The decrease is a result of the smaller balances in suspense accounts on the reporting date related to the execution of payment orders that took place in the following few days;
▪ Post-employment benefits total €21.7 million compared to €22.9 million at the end of 2014;
▪ Provisions amount to €39.1 million against €43.5 million at 31 December 2014;
▪ Equity attributable to the owners of the parent comes to €1,054.1 million compared to €831.4 million at the previous reporting date. The increase is a result of the allocation of the profit for 2014 and the larger fair value reserve;
▪ Equity attributable to non-controlling interests decreased from €29.8 mil-lion at 31 December 2014 to €25.6 million, due to the acquisition of another 1.64% of CartaSi by the parent.
41
2015 Reports and Financial Statements
INCOME STATEMENTThe 2015 figures are compared to the previous year in the following table.
YTD Dec, 31 (€/000) 2015 Year 2014 Year (*) % change
Net fee and commission incomeNet interest incomeNet trading/hedging incomeDividends from equity investments and AFS
619,655 55,053 4,738
485
594,275 69,907 5,004
416
4.3% - 21.2% - 5.3% 16.5%
Operating revenue 679,931 669,602 1.5% Payroll and related costsProduction costsICT costsGeneral expenses
- 136,160 - 97,940
- 191,836 - 46,551
- 134,412 - 102,064 - 178,167 - 49,464
1.3% - 4.0%
7.7% - 5.9%
Administrative expenses - 472,486 - 464,106 1.8% Other net operating expenses/incomeNet accruals for risk and charge
6,153 - 13,365
5,257 - 15,302
17.0% - 12.7%
Operating costs - 479,698 - 474,151 1.2% EBITDA 200,233 195,451 2.4% Depreciation and amortization - 32,322 - 27,890 15.9% Operating profit 167,911 167,561 0.2% Depr.&Amort. (customer contract)Share of gains/losses of investeesNon recurring/extraordinary items
- 10,523 - 4,974
- 10,801
- 8,627 221
- 1,933
22.0% - 2.346.5%
458.7%
Pre-tax profit for the year 141,613 157,222 - 9.9% Income taxesProfit to non-controlling interests
- 46,407 - 4,717
- 57,615 - 3,257
- 19.5% 44.8%
Net profit 90,489 96,350 - 6.1% (*) Due to the allocation of non deductible VAT costs to expenditure items the figures at December 31, 2014 have been reclassified according to figures at December 31, 2015
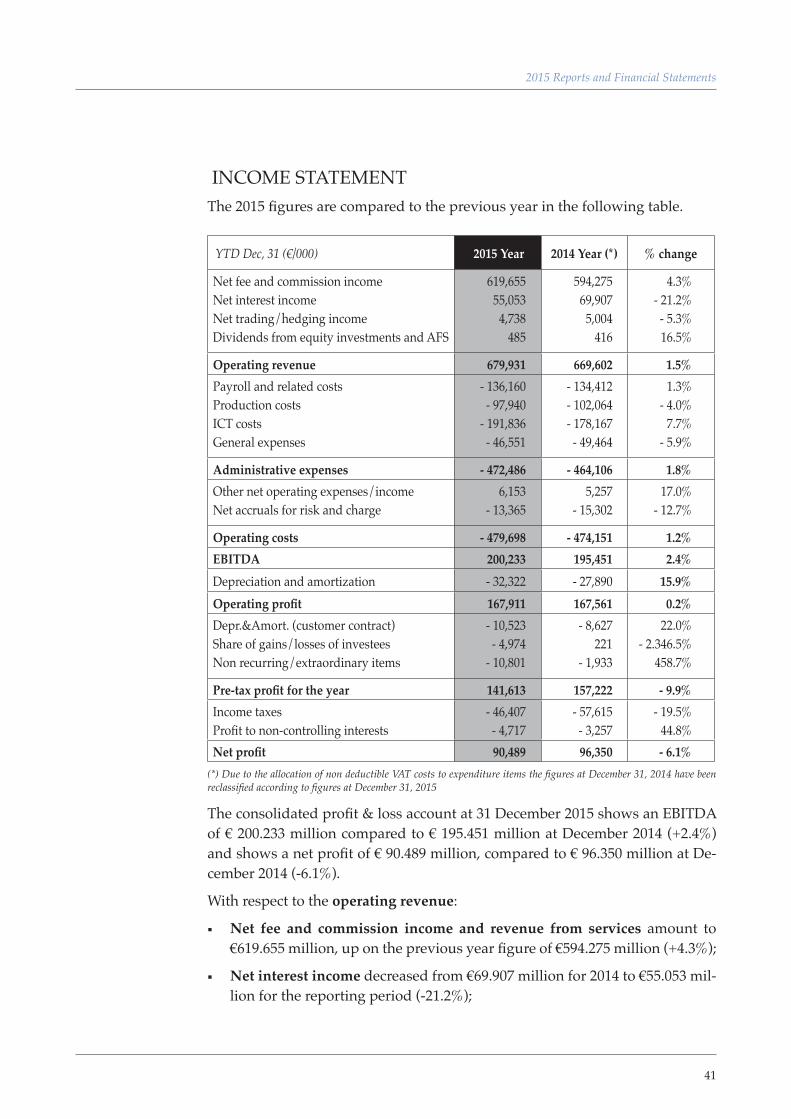
The consolidated profit & loss account at 31 December 2015 shows an EBITDA of € 200.233 million compared to € 195.451 million at December 2014 (+2.4%) and shows a net profit of € 90.489 million, compared to € 96.350 million at De-cember 2014 (-6.1%).
With respect to the operating revenue:
▪ Net fee and commission income and revenue from services amount to €619.655 million, up on the previous year figure of €594.275 million (+4.3%);
▪ Net interest income decreased from €69.907 million for 2014 to €55.053 mil-lion for the reporting period (-21.2%);
42
▪ Gains on securities and exchange rate gains amounts to €4.738 million compared to €5.004 million for the previous year (-5.3%);
▪ Dividends and other income increased to €0.485 million from €0.416 mil-lion for 2014 (+16.5%).
The result of these captions is an operating profit of €679.931 million compared to €669.602 million for 2014 (+1.5%).
Moreover:
▪ Administrative expenses amount to €472.486 million compared to €464.106 million for 2014 (+1.8%).
In detail:
▪ Payroll and related costs amounts to €136.160 million compared to €134.412 million for 2014 (+1.3%);
▪ Production costs come to €97.940 million against €102.064 million for 2014 (-4.0%);
▪ ICT costs increased to €191.836 million from €178.167 million for the previous year (+7.7%);
▪ General expenses amount to €46.551 million compared to €49.464 mil-lion for 2014 (-5.9%);
▪ Other net operating expenses/income increased to €6.153 million from €5.257 million for 2014 (+17.0%);
▪ Net accruals for risk and charge amount to €13.365 million compared to €15.302 million for 2014 (-12.7%).
These captions gave rise to operating costs of €479.698 million against €474.151 million for 2014 (+1.2%).
EBTIDA thus come to €200.233 million compared to €196.451 million for the previous year (+2.4%).
Depreciation and amortization increased from €32.322 million for 2014 to €27.890 million (+32.7%).
Operating profit thus come to €167.911 million compared to €167.561 million for the previous year (+0.2%).
The following captions are summed to the operating profit:
▪ Depreciation and amortisation of the customer contract of €10.523 million;
▪ Share of losses of investees of €4.974 million, comprising:
▪ impairment losses of €4.478 million recognised on non-current securities
43
2015 Reports and Financial Statements
of Banca delle Marche and Banca dell’Etruria and of €0.227 million on two funds classified in the AFS portfolio;
▪ the associates’ contribution to the group’s results (Equens SE: -€0.800 million, Hi-mtf and Unione Fiduciaria: +€0.531 million);
▪ Non recurring/extraordinary items of €10.801 million, including:
▪ cost for National Resolution Fund €5.639 million,
▪ cost for closing of Project Bolt €1.569 million;
▪ cost for the Group’s transformation/evolution €6.541 million;
▪ reimbursement of the INPS contribution €1.296 million;
▪ release of provisions €1.700 million;
▪ costs to settle labour disputes €0.620 million;
▪ other positive items € 0.572 million.
These components led to a pre-tax profit of €141.613 million compared to €157.222 million for 2014.
After income tax expense of €46.407 million and the profit attributable to non-controlling interests of €4.717 million, net profit mounts to €90,489 million com-pared to €96.350 million for the previous year (-6.1%).
During the course of 2016, the Group should benefit from the macroeconomic recovery expectations.
Priority will be given to maintaining the sustainability of the results to be achie-ved and to strengthen the market position. Profitability targets will continue to be pursued along with great attention to the risk profile and the rationalization of costs.
It should be noted that the Explanatory Notes report the information requested by the joint document of the Bank of Italy/Consob/Isvap no. 2 of 6 February 2009 and no. 4 of 3 March 2010 in relation to the process of evaluation of the assets subject to a potential impairment (impairment test) and relative to base assumptions, methodologies and utilized parameters.
In addition, and in relation to disclosure, the Explanatory Notes again report fundamental information on the following elements:
▪ definition of cash generating units (CGU);
▪ allocation of goodwill to each CGU;
FORECAST DEVELOPMENT OF MANAGEMENT
IMPAIRMENT OF ASSETS
44
▪ illustration of the criterion used to estimate the recoverable value when the latter is based on value in use;
▪ illustration of the criterion used to estimate the recoverable value when the latter is based on the fair value;
▪ description of the sensitivity analysis of the impairment test results with respect to changes in the underlying assumptions;
▪ commentary on the potential presence of external indicators of impairment and in the absence of write-downs of assets following the impairment pro-cedure.
Information on the nature and extent of financial risks to which the Group is exposed is provided below.
For more information of the exposure of the parent company ICBPI to this risk as a “second level bank”, refer to the relative section of the individual financial statements.
CartaSI, on the other hand, is exclusively exposed to credit risk in relation to the issue of cards with the “Direct Issuing” modality and in connection to which there is an actual lending process and continual oversight over credit risk. The other types of credit originate from operational anomalies in the following ac-tivities:
▪ Bank issuing where there may be debits on blocked cards and for which the bank, following the reporting of the blockage, is no longer exposed to the relative credit risk;
▪ Acquiring, e.g. re-debiting to merchants following disputes or the failure to pay commissions on the part of the merchants themselves.
Given that this risk is exclusively applicable to the parent company, the expo-sure to this risk is illustrated in the relative section of the individual financial statements.
Liquidity is managed in a centralized manner by ICBPI for all companies of the Group; as a result, exposure to liquidity risk is illustrated in the relative section of the individual financial statements.
INFORMATION ON FINANCIAL RISKS
CREDIT RISK
MARKET RISK
LIQUIDITY RISK
45
2015 Reports and Financial Statements
Interest rate risk is managed in a centralized manner by ICBPI for the entire banking group; as a result, exposure to this risk is illustrated in the relative sec-tion of the individual financial statements.
Given the following indicators pertaining to the parent company and the com-panies of the Group:
Financial indicators
▪ there was no situation involving a capital deficit or net negative working capital;
▪ there were no loans with fixed or upcoming expiration dates without positi-ve prospects of renewal or reimbursement; there is not an excessive depen-dency on short-term loans to finance long-term activities;
▪ there are no indications of cessation of financial support from financing en-tities and other creditors;
▪ there are no past or pro-forma financial statements reporting negative cash flows;
▪ the primary economic-financial indices are not negative;
▪ there were no significant operational losses or significant impairments of assets generating cash flows;
▪ there was no lack or discontinuity in the distribution of dividends;
▪ the capacity to pay debts on expiration dates exists;
▪ the capacity to comply with the contractual clauses of loans exists;
Managerial indicators
▪ there was no situation involving a capital deficit or net negative working capital;
▪ there were no loans with fixed or upcoming expiration dates without positi-ve prospects of renewal or reimbursement; there is not an excessive depen-dency on short-term loans to finance long-term activities;
Other indicators
▪ there were no share capital decreases below legal limits or which were not in compliance with other legal norms;
▪ there were no legal and fiscal disputes which, in the case of a loss, could result in obligations of reimbursement that the companies of the Group are not capable of respecting;
INTEREST RATE RISK
GOING CONCERN
46
▪ there were no legislative changes or government policies which could result in unfavorable effects to the companies of the Group.
The Directors confirm the reasonable expectation that the Group will continue its operations in the near future and that, as a result, the financial statements for the year 2015 have been drafted from the perspective of a going concern. As a result, they have not noticed symptoms within the assets and financial structure of the group and in operational trends which could constitute cause for uncer-tainty in terms of the assumption of a going concern.
On 10 December 2015, the rating Agency Moody’s, assigned a Ba2 CFR “Cor-porate Family Rating” with stable outlook to ICBPI and a B3 rating to Mercury. That assessment reflects: the increase in the lever calculated on the debt issued by Mercury and the EBITDA generated by ICBPI; the structural subordination of the acquisition debt; and the relatively high client concentration due to the wholesale nature of most of the services offered by ICBPI.
On 22 December 2015 the rating agency Standard & Poor’s, in view of the completion of the acquisition of the Institute by the Private Equity Funds Bain Capital, Advent International, and Clessidra, lowered the rating of ICBPI and CartaSi from BB + to BB- while at the same time removing the negative “Cre-ditWatch” condition and assigning a stable outlook.
In early 2016, the Board of the Parent Company approved the launching of the merger operation of Mercury Italy Srl into ICBPI; its completion is expected by the end of the year. The transaction was recommended by the Supervisory Au-thority in order to shorten the chain of shareholdings within the banking group.
During the period, additional company acquisition operations were also initia-ted in order to realize industrial projects which aim to improve and complete the offer of products to clientele.
In early 2016, the Parent Company has launched new initiatives for the deve-lopment of the business and to streamline activities within the Group. The 2016 Transformation Plan was approved with the aim of strengthening the mana-gement team as well as accelerate growth, increase operational efficiency and create the foundations for further development of the Group.
In February, the Group’s Chief Information Officer (CIO) was appointed.
Milan, 22 March 2016
THE BOARD OF DIRECTORS
RATING
SIGNIFICANT EVENTS AFTER THE REPORTING PERIOD
47
2015 Reports and Financial Statements
Statement of Financial positionat 31 december 2015

48
STATEMENT OF FINANCIAL POSITION
ASSETS 31/12/2015 31/12/2014
10. Cash and cash equivalents 22,389 536
20. Financial assets held for trading 18,739 19,582
40. Available-for-sale financial assets 2,609,059 2,535,267
50. Held-to-maturity investments 31,784 46,013
60. Loans and receivables with banks 827,652 610,682
70. Loans and receivables with customers 3,536,898 3,854,967
100. Equity investments 106,417 106,686
120. Property, equipment and investment property 170,444 173,120
130. Intangible assets 160,983 169,926
including goodwill 77,727 77,727
140. Tax assets 63,502 54,233
a) current 10,386 1,793
b) deferred 53,116 52,440
including convertible into tax assets (Law no. 214/2011) 40,560 39,161
150. Non-current assets held for sale and discontinued operations 186,206 -
160. Other assets 440,602 464,932
Total assets 8,174,675 8,035,944
(€’000)
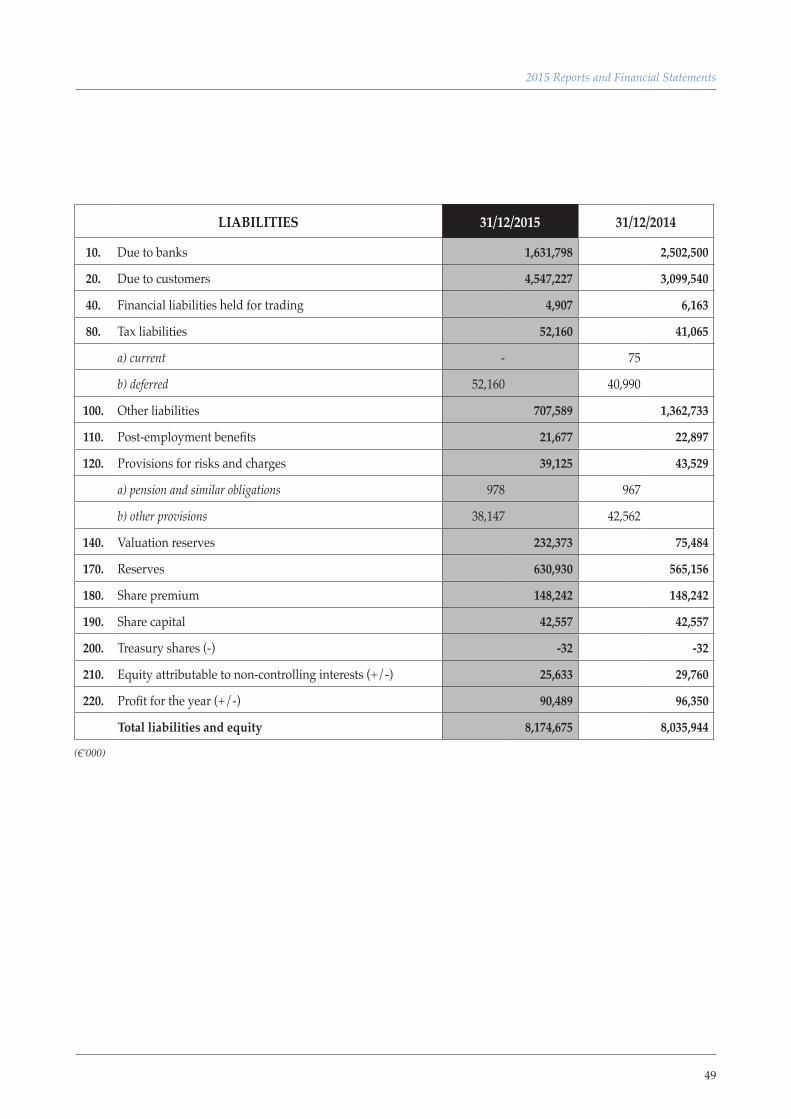
49
2015 Reports and Financial Statements
LIABILITIES 31/12/2015 31/12/2014
10. Due to banks 1,631,798 2,502,500
20. Due to customers 4,547,227 3,099,540
40. Financial liabilities held for trading 4,907 6,163
80. Tax liabilities 52,160 41,065
a) current - 75
b) deferred 52,160 40,990
100. Other liabilities 707,589 1,362,733
110. Post-employment benefits 21,677 22,897
120. Provisions for risks and charges 39,125 43,529
a) pension and similar obligations 978 967
b) other provisions 38,147 42,562
140. Valuation reserves 232,373 75,484
170. Reserves 630,930 565,156
180. Share premium 148,242 148,242
190. Share capital 42,557 42,557
200. Treasury shares (-) -32 -32
210. Equity attributable to non-controlling interests (+/-) 25,633 29,760
220. Profit for the year (+/-) 90,489 96,350
Total liabilities and equity 8,174,675 8,035,944
(€’000)
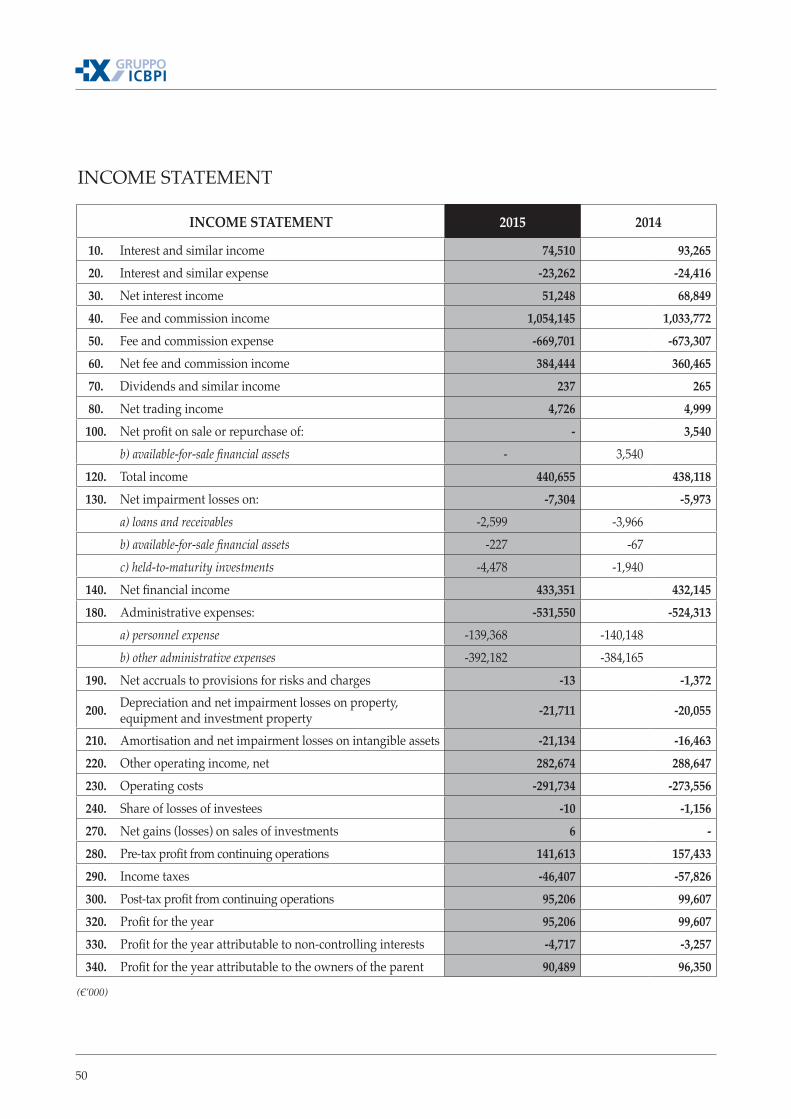
50
INCOME STATEMENT 2015 2014
10. Interest and similar income 74,510 93,265 20. Interest and similar expense -23,262 -24,416 30. Net interest income 51,248 68,849 40. Fee and commission income 1,054,145 1,033,772 50. Fee and commission expense -669,701 -673,307 60. Net fee and commission income 384,444 360,465 70. Dividends and similar income 237 265 80. Net trading income 4,726 4,999 100. Net profit on sale or repurchase of: - 3,540
b) available-for-sale financial assets - 3,540 120. Total income 440,655 438,118 130. Net impairment losses on: -7,304 -5,973
a) loans and receivables -2,599 -3,966 b) available-for-sale financial assets -227 -67 c) held-to-maturity investments -4,478 -1,940
140. Net financial income 433,351 432,145 180. Administrative expenses: -531,550 -524,313
a) personnel expense -139,368 -140,148 b) other administrative expenses -392,182 -384,165
190. Net accruals to provisions for risks and charges -13 -1,372
200. Depreciation and net impairment losses on property, equipment and investment property -21,711 -20,055
210. Amortisation and net impairment losses on intangible assets -21,134 -16,463 220. Other operating income, net 282,674 288,647 230. Operating costs -291,734 -273,556 240. Share of losses of investees -10 -1,156 270. Net gains (losses) on sales of investments 6 - 280. Pre-tax profit from continuing operations 141,613 157,433 290. Income taxes -46,407 -57,826 300. Post-tax profit from continuing operations 95,206 99,607 320. Profit for the year 95,206 99,607 330. Profit for the year attributable to non-controlling interests -4,717 -3,257 340. Profit for the year attributable to the owners of the parent 90,489 96,350
(€’000)
INCOME STATEMENT
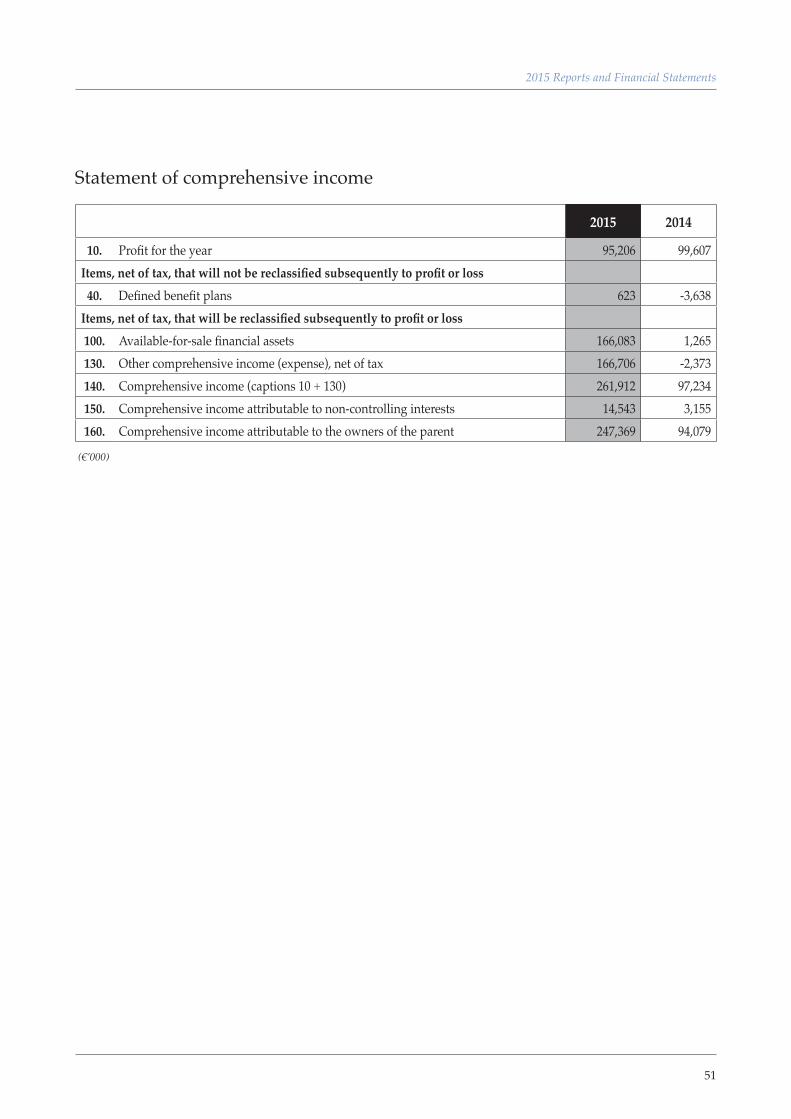
51
2015 Reports and Financial Statements
2015 2014
10. Profit for the year 95,206 99,607 Items, net of tax, that will not be reclassified subsequently to profit or loss
40. Defined benefit plans 623 -3,638 Items, net of tax, that will be reclassified subsequently to profit or loss 100. Available-for-sale financial assets 166,083 1,265 130. Other comprehensive income (expense), net of tax 166,706 -2,373 140. Comprehensive income (captions 10 + 130) 261,912 97,234 150. Comprehensive income attributable to non-controlling interests 14,543 3,155 160. Comprehensive income attributable to the owners of the parent 247,369 94,079
(€’000)
Statement of comprehensive income
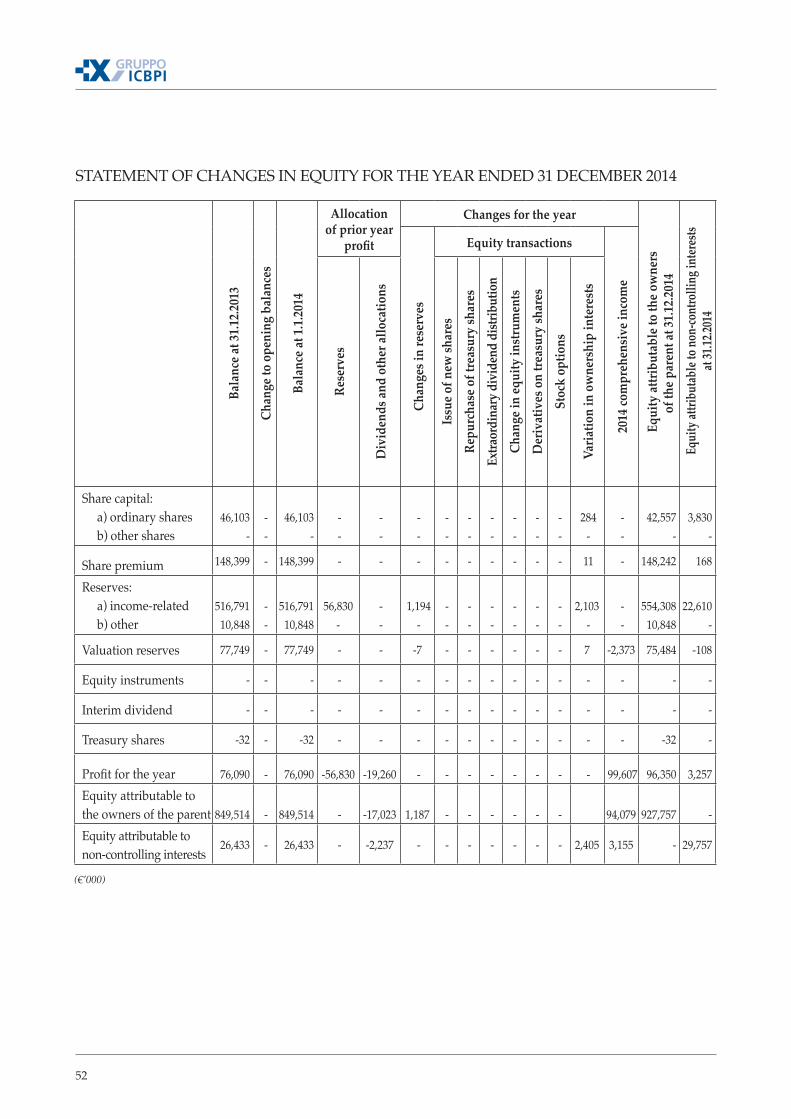
52
STATEMENT OF CHANGES IN EQUITY FOR THE YEAR ENDED 31 DECEMBER 2014
Bala
nce a
t 31.1
2.201
3
Chan
ge to
ope
ning
bal
ance
s
Bala
nce a
t 1.1.
2014
Allocation of prior year
profit
Changes for the year
Equ
ity at
tribu
tabl
e to
the o
wne
rs
of th
e par
ent a
t 31.1
2.201
4 Eq
uity
attri
butab
le to
non
-cont
rolli
ng in
teres
ts at
31.12
.2014
Chan
ges i
n re
serv
es
Equity transactions
2014
com
preh
ensi
ve in
com
e
Rese
rves
Div
iden
ds an
d ot
her a
lloca
tions
Issu
e of n
ew sh
ares
Repu
rcha
se o
f tre
asur
y sh
ares
Ex
traor
dina
ry d
ivid
end
distr
ibut
ion
Chan
ge in
equi
ty in
stru
men
ts
Der
ivat
ives
on
treas
ury
shar
esSt
ock
optio
ns
Varia
tion
in o
wne
rshi
p in
tere
sts
Share capital: a) ordinary shares b) other shares
46,103 -
- -
46,103 -
- -
- -
- -
- -
- -
- -
- -
- -
- -
284 -
- -
42,557 -
3,830-
Share premium 148,399 - 148,399 - - - - - - - - - 11 - 148,242 168
Reserves: a) income-related b) other
516,79110,848
- -
516,79110,848
56,830-
- -
1,194 -
- -
- -
- -
- -
- -
- -
2,103 -
- -
554,30810,848
22,610 -
Valuation reserves 77,749 - 77,749 - - -7 - - - - - - 7 -2,373 75,484 -108
Equity instruments - - - - - - - - - - - - - - - -
Interim dividend - - - - - - - - - - - - - - - -
Treasury shares -32 - -32 - - - - - - - - - - - -32 -
Profit for the year 76,090 - 76,090 -56,830 -19,260 - - - - - - - - 99,607 96,350 3,257
Equity attributable to the owners of the parent 849,514 - 849,514 - -17,023 1,187 - - - - - - 94,079 927,757 -
Equity attributable to non-controlling interests
26,433 - 26,433 - -2,237 - - - - - - - 2,405 3,155 - 29,757
(€’000)
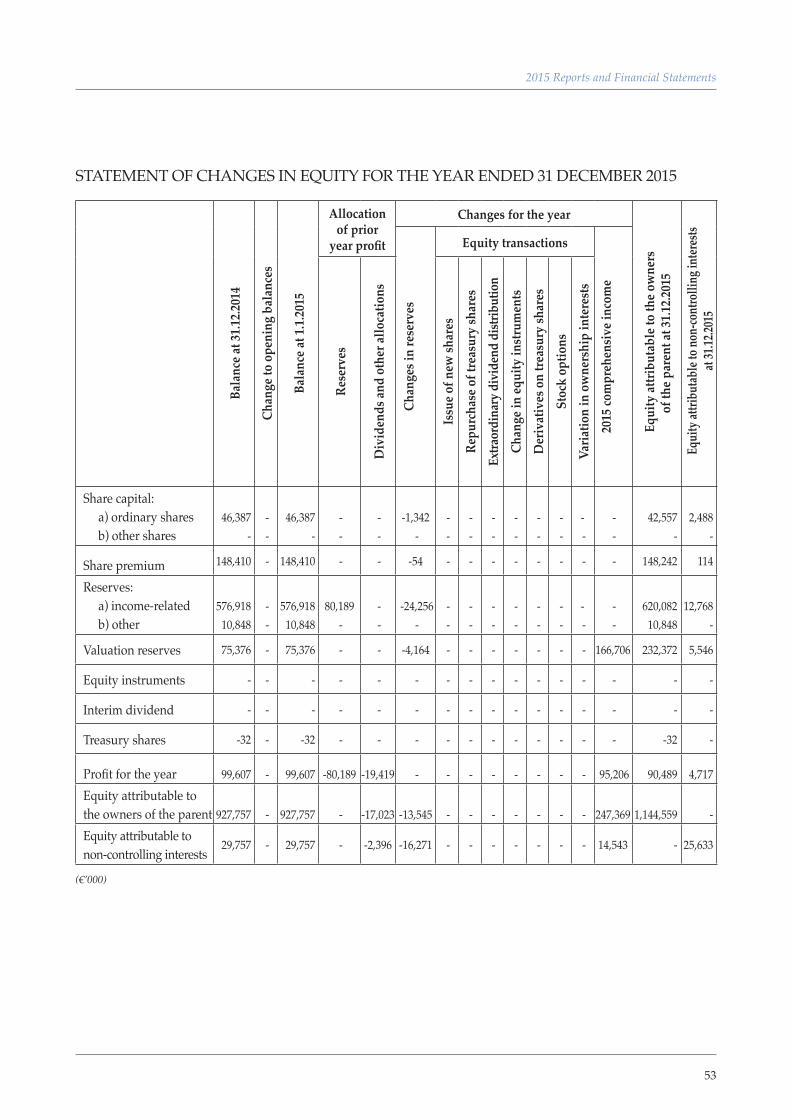
53
2015 Reports and Financial Statements
Bala
nce a
t 31.1
2.201
4
Chan
ge to
ope
ning
bal
ance
s
Bala
nce a
t 1.1.
2015
Allocation of prior
year profit
Changes for the year
Equ
ity at
tribu
tabl
e to
the o
wne
rs
of th
e par
ent a
t 31.1
2.201
5
Equi
ty at
tribu
table
to n
on-co
ntro
lling
inter
ests
at 31
.12.20
15
Chan
ges i
n re
serv
es
Equity transactions
2015
com
preh
ensi
ve in
com
e
Rese
rves
Div
iden
ds an
d ot
her a
lloca
tions
Issu
e of n
ew sh
ares
Repu
rcha
se o
f tre
asur
y sh
ares
Ex
traor
dina
ry d
ivid
end
distr
ibut
ion
Chan
ge in
equi
ty in
stru
men
ts
Der
ivat
ives
on
treas
ury
shar
esSt
ock
optio
ns
Varia
tion
in o
wne
rshi
p in
tere
sts
Share capital: a) ordinary shares b) other shares
46,387 -
- -
46,387 -
- -
- -
-1,342 -
- -
- -
- -
- -
- -
- -
- -
- -
42,557 -
2,488 -
Share premium 148,410 - 148,410 - - -54 - - - - - - - - 148,242 114
Reserves: a) income-related b) other
576,91810,848
- -
576,91810,848
80,189 -
- -
-24,256 -
- -
- -
- -
- -
- -
- -
- -
- -
620,08210,848
12,768 -
Valuation reserves 75,376 - 75,376 - - -4,164 - - - - - - - 166,706 232,372 5,546
Equity instruments - - - - - - - - - - - - - - - -
Interim dividend - - - - - - - - - - - - - - - -
Treasury shares -32 - -32 - - - - - - - - - - - -32 -
Profit for the year 99,607 - 99,607 -80,189 -19,419 - - - - - - - - 95,206 90,489 4,717
Equity attributable to the owners of the parent 927,757 - 927,757 - -17,023 -13,545 - - - - - - - 247,369 1,144,559 -
Equity attributable to non-controlling interests
29,757 - 29,757 - -2,396 -16,271 - - - - - - - 14,543 - 25,633
(€’000)
STATEMENT OF CHANGES IN EQUITY FOR THE YEAR ENDED 31 DECEMBER 2015
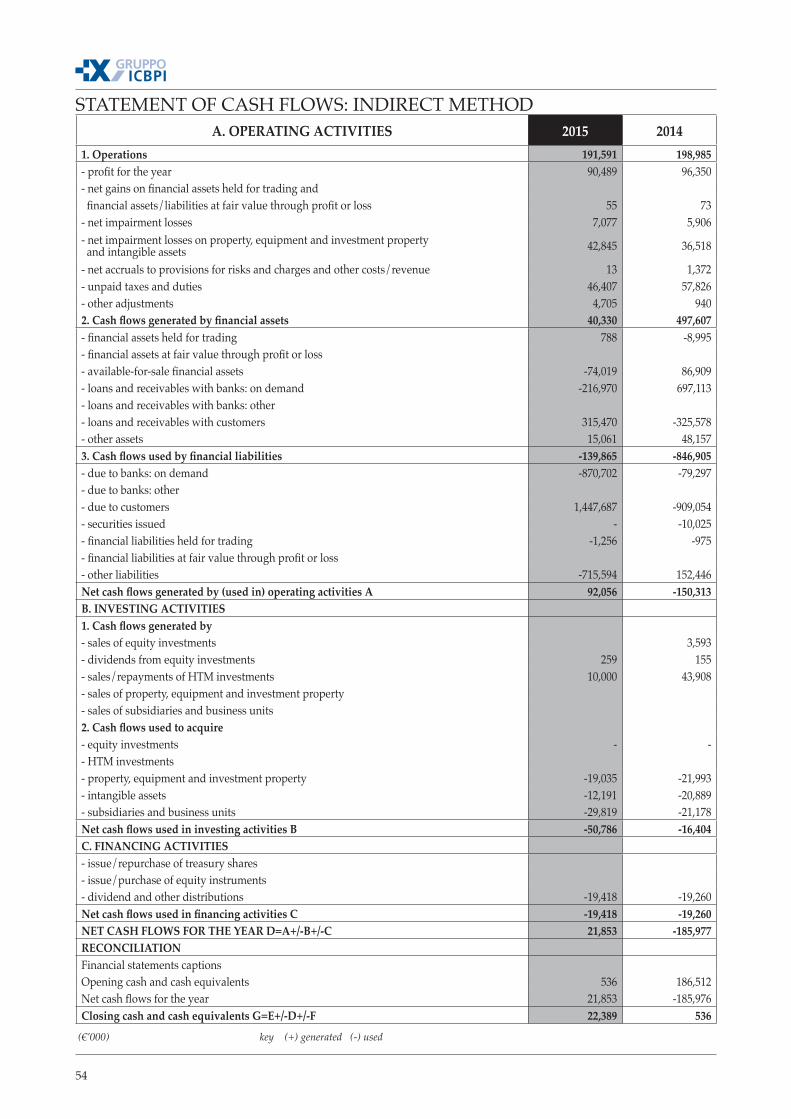
54
STATEMENT OF CASH FLOWS: INDIRECT METHOD A. OPERATING ACTIVITIES 2015 2014
1. Operations 191,591 198,985 - profit for the year 90,489 96,350 - net gains on financial assets held for trading and financial assets/liabilities at fair value through profit or loss 55 73 - net impairment losses 7,077 5,906 - net impairment losses on property, equipment and investment property and intangible assets 42,845 36,518
- net accruals to provisions for risks and charges and other costs/revenue 13 1,372 - unpaid taxes and duties 46,407 57,826 - other adjustments 4,705 940 2. Cash flows generated by financial assets 40,330 497,607 - financial assets held for trading 788 -8,995 - financial assets at fair value through profit or loss- available-for-sale financial assets -74,019 86,909 - loans and receivables with banks: on demand -216,970 697,113 - loans and receivables with banks: other- loans and receivables with customers 315,470 -325,578 - other assets 15,061 48,157 3. Cash flows used by financial liabilities -139,865 -846,905 - due to banks: on demand -870,702 -79,297 - due to banks: other- due to customers 1,447,687 -909,054 - securities issued - -10,025 - financial liabilities held for trading -1,256 -975 - financial liabilities at fair value through profit or loss- other liabilities -715,594 152,446 Net cash flows generated by (used in) operating activities A 92,056 -150,313 B. INVESTING ACTIVITIES1. Cash flows generated by- sales of equity investments 3,593 - dividends from equity investments 259 155 - sales/repayments of HTM investments 10,000 43,908 - sales of property, equipment and investment property- sales of subsidiaries and business units2. Cash flows used to acquire- equity investments - - - HTM investments- property, equipment and investment property -19,035 -21,993 - intangible assets -12,191 -20,889 - subsidiaries and business units -29,819 -21,178 Net cash flows used in investing activities B -50,786 -16,404 C. FINANCING ACTIVITIES- issue/repurchase of treasury shares- issue/purchase of equity instruments- dividend and other distributions -19,418 -19,260 Net cash flows used in financing activities C -19,418 -19,260 NET CASH FLOWS FOR THE YEAR D=A+/-B+/-C 21,853 -185,977 RECONCILIATIONFinancial statements captionsOpening cash and cash equivalents 536 186,512 Net cash flows for the year 21,853 -185,976 Closing cash and cash equivalents G=E+/-D+/-F 22,389 536
(€’000) key (+) generated (-) used
55
2015 Reports and Financial Statements
Part A – Accounting policies
Part B – Notes of the statement of financial position
Part C – Notes to the income statement
Part D – Breakdown of comprehensive income
Part E – Risks and related hedging policies
Part F – Equity
Part G – Business combinations
Part H – Related partytransactions
Part I – Share-based payments
Part L – Segment reporting
Notes to the Consolidated financial statements

57
CONSOLIDATED FINANCIAL STATEMENTS
NOTES TO THE CONSOLIDATED FINANCIAL STATEMENTSPart A - Accounting policiesA.1 - GENERAL PART
Section 1 – Statement of compliance
Pursuant to Regulation (EC) no. 1606 of 19 July 2002, the Istituto Centrale delle Banche Popolari Italiane Group (ICBPI group) has prepared these consolidated financial statements as at and for the year ended 31 December 2015 in compliance with the International Financial Reporting Standards (IFRS) issued by the International Accounting Standards Board (IASB) and endorsed by the Europe-an Commission. They were introduced into Italian law with Legislative decree no. 38/2005.
The group applied the IFRS enacted at 31 December 2015 and Bank of Italy’s instructions about financial statements issued in its Measure of 22 December 2005, the related Circular no. 262 and subsequent amendments.
It did not make any departures from the IFRS.
Section 2 – Basis of presentation
The consolidated financial statements at 31 December 2015 comprise a statement of financial posi-tion, an income statement, a statement of comprehensive income, a statement of changes in equity, a statement of cash flows and these notes. They are accompanied by a directors’ report which com-ments on the group’s performance, its results of operations and financial position.
The group’s presentation currency is the Euro and the amounts shown in the consolidated financial statements and these notes are in thousands of Euros.
The group has applied the recognition and measurement criteria established by the IFRS endorsed by the European Commission and the general assumptions in the Framework for the preparation and presentation of financial statements issued by the IASB.
Application of the measures set out in Regulations (EU) 634/2014 and 1361/2014 became mandato-ry on 1 January 2015 enacting:
▪ IFRIC 21, which provides guidance on when to recognise a liability for a levy imposed by a go-vernment other than income taxes (covered by IAS 12). Specifically, it identifies the obligating event for the recognition of a liability;
▪ the Annual improvements to IFRSs 2011-2013 cycle, which introduced certain immaterial amendments to IFRS 3, IFRS 13 and IAS 40, designed to clarify certain inconsistencies and/or provide guidance about methods.
Their application did not significantly affect the group’s consolidated financial statements.
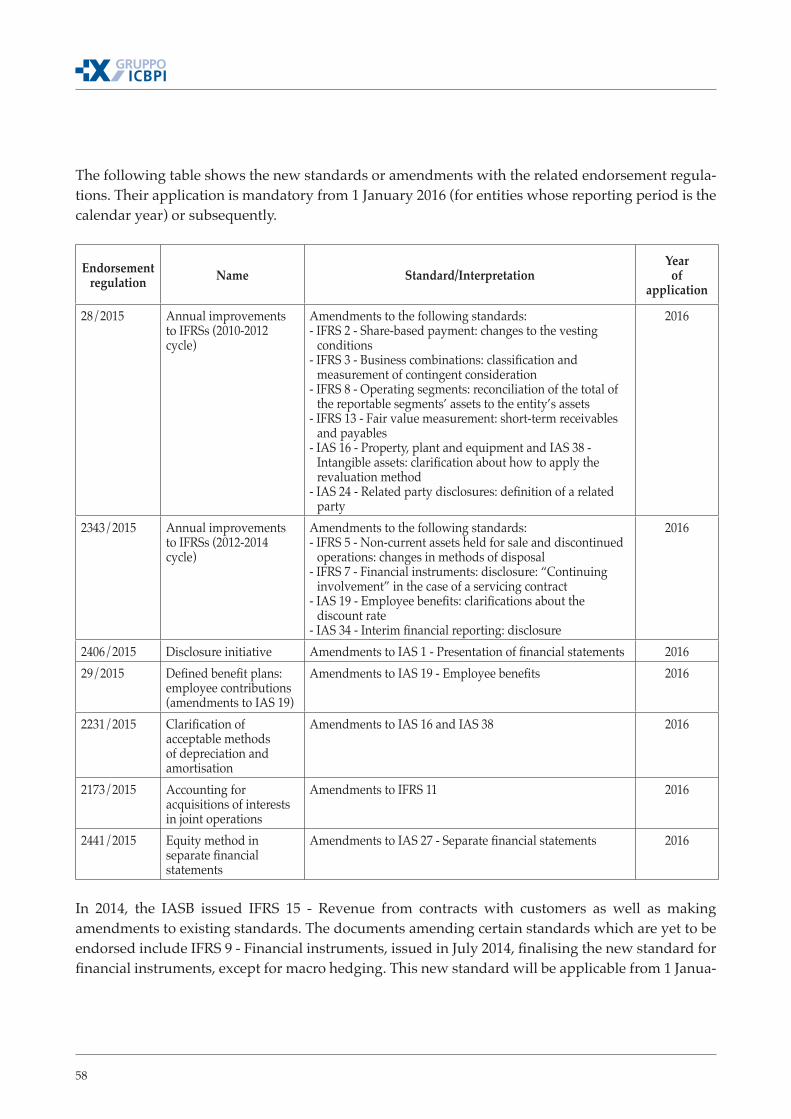
58
The following table shows the new standards or amendments with the related endorsement regula-tions. Their application is mandatory from 1 January 2016 (for entities whose reporting period is the calendar year) or subsequently.
Endorsement regulation Name Standard/Interpretation
Year of
application
28/2015 Annual improvements to IFRSs (2010-2012 cycle)
Amendments to the following standards:- IFRS 2 - Share-based payment: changes to the vesting
conditions- IFRS 3 - Business combinations: classification and
measurement of contingent consideration- IFRS 8 - Operating segments: reconciliation of the total of
the reportable segments’ assets to the entity’s assets- IFRS 13 - Fair value measurement: short-term receivables
and payables- IAS 16 - Property, plant and equipment and IAS 38 -
Intangible assets: clarification about how to apply the revaluation method
- IAS 24 - Related party disclosures: definition of a related party
2016
2343/2015 Annual improvements to IFRSs (2012-2014 cycle)
Amendments to the following standards:- IFRS 5 - Non-current assets held for sale and discontinued
operations: changes in methods of disposal- IFRS 7 - Financial instruments: disclosure: “Continuing
involvement” in the case of a servicing contract- IAS 19 - Employee benefits: clarifications about the
discount rate- IAS 34 - Interim financial reporting: disclosure
2016
2406/2015 Disclosure initiative Amendments to IAS 1 - Presentation of financial statements 201629/2015 Defined benefit plans:
employee contributions (amendments to IAS 19)
Amendments to IAS 19 - Employee benefits 2016
2231/2015 Clarification of acceptable methods of depreciation and amortisation
Amendments to IAS 16 and IAS 38 2016
2173/2015 Accounting for acquisitions of interests in joint operations
Amendments to IFRS 11 2016
2441/2015 Equity method in separate financial statements
Amendments to IAS 27 - Separate financial statements 2016
In 2014, the IASB issued IFRS 15 - Revenue from contracts with customers as well as making amendments to existing standards. The documents amending certain standards which are yet to be endorsed include IFRS 9 - Financial instruments, issued in July 2014, finalising the new standard for financial instruments, except for macro hedging. This new standard will be applicable from 1 Janua-
59
2015 Reports and Financial Statements
ry 2018 after its endorsement by the European Commission.
The next table shows the standards for which amendments were issued, specifying the scope of or reason for such amendments.
Standard Name Publication date
IFRS 9 Financial instruments 24/07/14IFRS 14 Regulatory deferral accounts 30/01/14IFRS 15 Revenue from contracts with customers (including the amendment
published on 11 September 2015 about the date of application of IFRS 15)28/05/14
IFRS 16 Leases 13/01/16Amendments to IFRS 10, IFRS 12 and IAS 28
Investment entities - Applying the consolidation exception 18/12/14
Amendments to IFRS 10 and IAS 28
Sale or contribution of assets between an investor and its associate or joint venture
11/09/14
As none of them have been endorsed by the European Commission, they did not affect the group’s 2015 consolidated financial statements.
The group applies the measurement criteria assuming that it will continue as a going concern and in accordance with the principles of accruals, materiality and significance of the financial data and the principle of substance over form.
The consolidated financial statements and the notes present corresponding prior year figures.
The directors’ report and these notes include all the information required by the IFRS, the law and Bank of Italy, as well as additional disclosures which are not mandatory but are deemed useful to give a true and fair view of the group’s financial position and results of operations.
Basis of presentation of the consolidated financial statements
Statement of financial position, income statement and statement of comprehensive income
They comprise captions, subcaptions and additional information. Revenue is shown without a plus sign while costs are shown with a minus sign in the income statement.
Statement of changes in equity
This statement shows changes in equity during the year split between share capital, equity-related reserves, income-related reserves, valuation reserves and the profit (loss) for the year. Treasury sha-res are offset against equity. The parent has not issued equity instruments other than ordinary shares.
Statement of cash flows
60
The statement of cash flows for the year and the previous year has been prepared using the indirect method, whereby cash flows from operations are the profit for the period adjusted by the effects of non-monetary transactions.
Cash flows are split between those from operating, investing and financing activities.
Cash flows generated during the reporting period are indicated without a plus sign while those used during the reporting period are shown with a minus sign.
Basis of presentation of the notes
These notes include the information required by Bank of Italy’s Circular no. 262/2005 and the addi-tional information required by the IFRS.
The accounting policies described below have been adopted to disclose all the information in the consolidated financial statements.
Section 3 – Basis of consolidation
The group has established the consolidation scope in accordance with IFRS 10 - Consolidated finan-cial statements. Accordingly, the concept of control is fundamental to consolidation of all types of entities. It exists when the investor concurrently:
▪ has power over the investee
▪ is exposed, or has rights, to variable returns from its involvement with the investee;
▪ has the ability to affect those returns through its power over the investee.
Therefore, the group consolidates all types of entities when all three control elements exist.
When an entity is directed mainly through exercise of voting rights, control exists when the investor holds more than half the voting rights.
In other cases, the assessment of control is more complex and requires the greater use of judgement as it is necessary to consider all the factors and circumstances that give control over the investee (de facto control).
In the case of the ICBPI Group, all the consolidated entities are directed mainly through voting rights. Accordingly, the group did not have to exercise special judgements or make significant as-sumptions in order to establish the existence of control over subsidiaries and significant influence over associates.
The financial statements at 31 December 2015 of the parent and consolidated companies were used for consolidation purposes, after being reclassified and adjusted to comply with the consolidation requirements and the IFRS.
Investments in subsidiaries are consolidated by combining the captions of the statement of financial
61
2015 Reports and Financial Statements
position and income statement on a line-by-line basis, making the following adjustments:
(a) the carrying amount of the parent’s investment in each subsidiary and the parent’s portion of equity of each subsidiary are eliminated;
(b) the equity and profit or loss attributable to non-controlling interests are recognised separately.
Positive differences arising from the above adjustments are recognised as goodwill in caption “130 Intangible assets” at the date of first consolidation after allocation to the subsidiary’s assets and lia-bilities. Any negative differences are recognised in profit or loss.
Intragroup assets and liabilities, off-statement of financial position transactions, income and expense and profits and losses among the consolidated companies are eliminated.
The income and expenses of a subsidiary are included in the consolidated financial statements from the acquisition date. The income and expense of a subsidiary that is sold are included in the income statement up to the sales date, i.e., until the date when the parent ceases to control the subsidiary.
Pursuant to IAS 28, the consolidated financial statements also include the results of associates, i.e., entities over which the group has significant influence and the power to participate in directing its financial and operating policies without having control or joint control. These investments are mea-sured using the equity method which entails the initial recognition of the investment at cost and its subsequent measurement using the equity method. The group’s share of the associate’s profit or loss is recognised separately in the income statement.
The difference between the investment’s carrying amount and the group’s share of its equity is in-cluded in the investment’s carrying amount.
If there is indication of impairment, the group estimates the investment’s recoverable amount, con-sidering the discounted future cash flows that the investee may generate, including the investment’s costs to sell. When the recoverable amount is less than the investment’s carrying amount, the diffe-rence is recognised in profit or loss.
At present, the group is not a party to joint arrangements as defined by IFRS 11 in the form of joint ventures (the venturers have rights to the arrangement’s net assets).
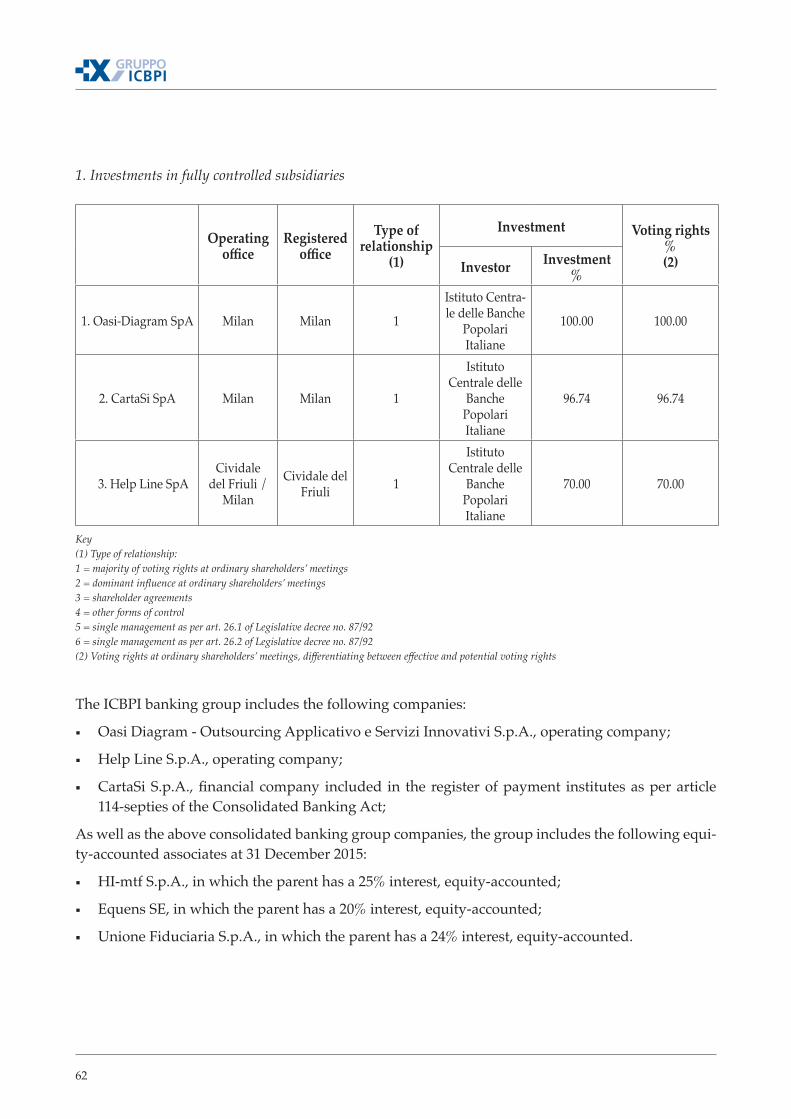
62
1. Investments in fully controlled subsidiaries
Operating office
Registered office
Type of relationship
(1)
Investment Voting rights %(2)Investor Investment
%
1. Oasi-Diagram SpA Milan Milan 1
Istituto Centra-le delle Banche
Popolari Italiane
100.00 100.00
2. CartaSi SpA Milan Milan 1
Istituto Centrale delle
Banche Popolari Italiane
96.74 96.74
3. Help Line SpACividale
del Friuli /Milan
Cividale del Friuli 1
Istituto Centrale delle
Banche Popolari Italiane
70.00 70.00
Key (1) Type of relationship: 1 = majority of voting rights at ordinary shareholders’ meetings2 = dominant influence at ordinary shareholders’ meetings3 = shareholder agreements4 = other forms of control5 = single management as per art. 26.1 of Legislative decree no. 87/926 = single management as per art. 26.2 of Legislative decree no. 87/92 (2) Voting rights at ordinary shareholders’ meetings, differentiating between effective and potential voting rights
The ICBPI banking group includes the following companies:
▪ Oasi Diagram - Outsourcing Applicativo e Servizi Innovativi S.p.A., operating company;
▪ Help Line S.p.A., operating company;
▪ CartaSi S.p.A., financial company included in the register of payment institutes as per article 114-septies of the Consolidated Banking Act;
As well as the above consolidated banking group companies, the group includes the following equi-ty-accounted associates at 31 December 2015:
▪ HI-mtf S.p.A., in which the parent has a 25% interest, equity-accounted;
▪ Equens SE, in which the parent has a 20% interest, equity-accounted;
▪ Unione Fiduciaria S.p.A., in which the parent has a 24% interest, equity-accounted.
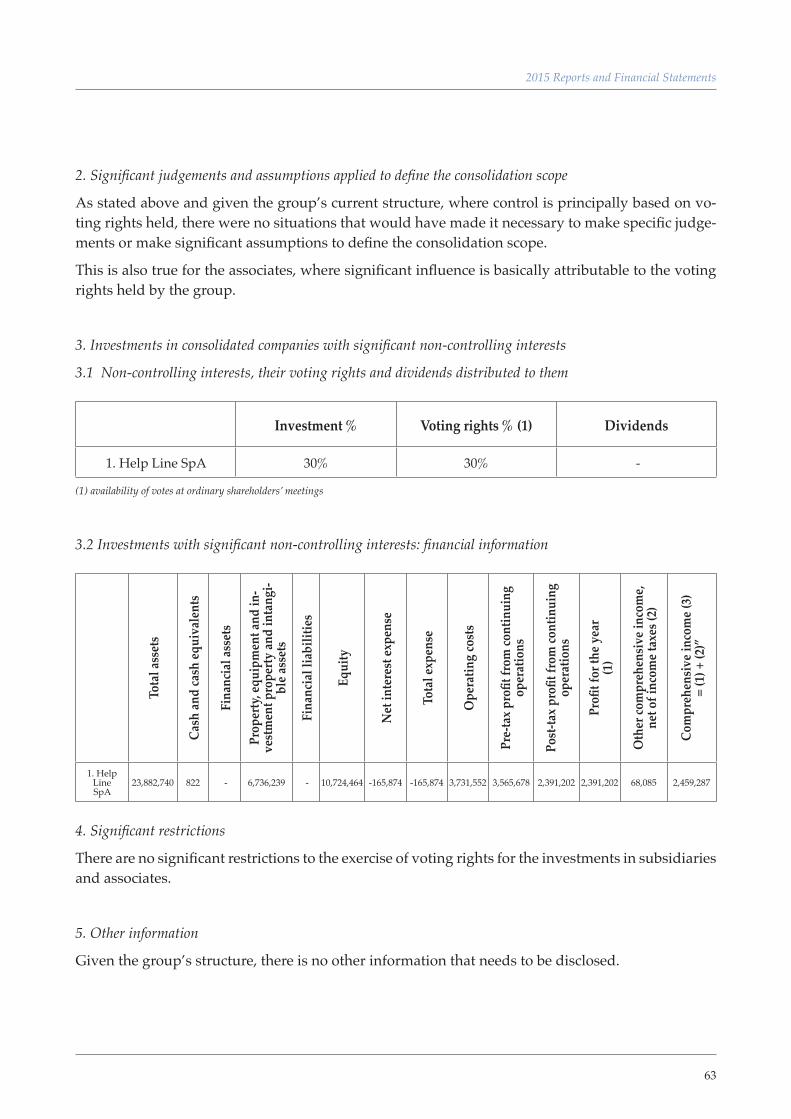
63
2015 Reports and Financial Statements
2. Significant judgements and assumptions applied to define the consolidation scope
As stated above and given the group’s current structure, where control is principally based on vo-ting rights held, there were no situations that would have made it necessary to make specific judge-ments or make significant assumptions to define the consolidation scope.
This is also true for the associates, where significant influence is basically attributable to the voting rights held by the group.
3. Investments in consolidated companies with significant non-controlling interests
3.1 Non-controlling interests, their voting rights and dividends distributed to them
Investment % Voting rights % (1) Dividends
1. Help Line SpA 30% 30% -
(1) availability of votes at ordinary shareholders’ meetings
3.2 Investments with significant non-controlling interests: financial information
Tota
l ass
ets
Cash
and
cash
equi
vale
nts
Fina
ncia
l ass
ets
Prop
erty
, equ
ipm
ent a
nd in
-ve
stm
ent p
rope
rty an
d in
tang
i-bl
e ass
ets
Fina
ncia
l lia
bilit
ies
Equi
ty
Net
inte
rest
expe
nse
Tota
l exp
ense
Ope
ratin
g co
sts
Pre-
tax p
rofit
from
cont
inui
ng
oper
atio
ns
Post
-tax p
rofit
from
cont
inui
ng
oper
atio
ns
Profi
t for
the y
ear
(1)
Oth
er co
mpr
ehen
sive
inco
me,
net o
f inc
ome t
axes
(2)
Com
preh
ensi
ve in
com
e (3)
=
(1) +
(2)”
1. Help Line SpA
23,882,740 822 - 6,736,239 - 10,724,464 -165,874 -165,874 3,731,552 3,565,678 2,391,202 2,391,202 68,085 2,459,287
4. Significant restrictions
There are no significant restrictions to the exercise of voting rights for the investments in subsidiaries and associates.
5. Other information
Given the group’s structure, there is no other information that needs to be disclosed.
64
Section 4 – Events after the reporting period
No events took place after the reporting date that would have had a significant effect on the group’s financial position, results of operations or cash flows or that would have required adjustments to the financial statements captions.
Section 5 – Other aspects
There is no other information that needs to be disclosed, including with respect to the Bank of Italy/Consob/IVASS document no. 6 of 8 March 2013.
The Board of Directors of 22 march 2016 authorized the publication of Financial Statements that will be available after the approval of Shareholders Meeting of 27 april 2016.
A.2 - KEY FINANCIAL STATEMENTS CAPTIONS AT 31 DECEMBER 2015
Accounting policies
1 - Financial assets held for trading
ClassificationA financial asset is classified as held for trading if it is:
▪ acquired principally for the purpose of selling it in the near term;
▪ part of a portfolio of identified financial instruments that are managed together and for which there is evidence of a recent actual pattern of short-term profit-taking;
▪ a derivative (except for a derivative that is an effective hedging instrument).
Derivatives are recognised under assets when they have a positive fair value and under liabilities when they have a negative fair value.
RecognitionDebt and equity instruments are recognised at their settlement date while derivatives are recognised at their trading date.
Financial assets held for trading are initially recognised at fair value, which is usually the transaction price, net of any directly attributable transaction costs.
Measurement
After initial recognition, financial assets held for trading are measured at fair value. Any resulting fair value gains or losses are recognised in caption 80 “Trading income (expense)” of the income sta-tement. Interest accrued on these assets is recognised in caption 10 of the income statement “Interest
65
2015 Reports and Financial Statements
and similar income”, although interest and/or other income and expense on trading derivatives are recognised in caption 80 “Trading income (expense)” of the income statement.
Section 17 - Other information provides information on the calculation of fair value of listed financial instruments. Equity instruments and derivatives hedging equity instruments are maintained at cost when it is not possible to calculate their fair value reliably.
DerecognitionFinancial assets or parts of financial assets are decognised when the contractual rights to cash flows expire or are transferred, transferring substantially all the related risks and rewards.
2 - Available-for-sale financial assets
ClassificationThis category includes non-derivative financial assets that are not classified as loans and receivables, financial assets held for trading, held-to-maturity investments or financial assets at fair value throu-gh profit or loss.
RecognitionThey are initially recognised at the settlement date and measured at fair value, which includes the directly related transaction costs.
Measurement AFS financial assets are subsequently measured at fair value with recognition of amortised cost in profit or loss and the fair value gains or losses in a specific equity reserve until the asset is dereco-gnised or an impairment loss is recognised. Gains or losses recognised in equity are reclassified to profit or loss when the asset is sold.
Realised gains or losses are recognised in caption 100 “Net profit (loss) on sale or repurchase” of the income statement.
Fair value is calculated using the same criteria applied to financial assets held for trading.
Equity instruments included in this category and derivatives hedging equity instruments are main-tained at cost when it is not possible to calculate their fair value reliably.
The group tests its assets for impairment at each reporting date. When there is a significant or pro-longed decline in fair value, the group recognises it in profit or loss as the difference between the asset’s carrying amount (acquisition cost net of impairment losses already recognised in profit or loss) and fair value. Fair value losses are significant when they exceed 20% of the cost and prolonged if they have existed for over nine months.
If the fair value of a debt instrument increases in a subsequent period and this increase is objectively due to an event that took place in a period after that in which the impairment loss was recognised
66
in profit or loss, the impairment loss is reversed and the related amount is recognised in the same income statement caption. The reversal may not generate a carrying amount higher than that which would have been obtained by measuring that asset at amortised cost had the loss not been recogni-sed. Impairment losses on shares, recognised in profit or loss, cannot be reversed through profit or loss but only directly through equity.
DerecognitionFinancial assets or parts of financial assets are decognised when the contractual rights to cash flows expire or are transferred, transferring substantially all the related risks and rewards.
3 - Held-to-maturity investments
ClassificationThis category includes debt instruments with fixed or determinable payments and fixed maturities that the group has the ability and intention to hold to maturity. If it is no longer appropriate to main-tain an asset as classified as held to maturity following a change in the group’s intentions or ability, it is reclassified to “AFS financial assets”.
RecognitionHTM investments are initially recognised at cost, being the fair value of the amount traded, inclu-ding any directly related costs and income.
Measurement After initial recognition, HTM investments are measured at amortised cost using the effective in-terest method. Fair value gains or losses are recognised in profit or loss when the investments are derecognised.
At each reporting date, the group tests the HTM investments for impairment. The impairment loss, if any, is the difference between the asset’s carrying amount and the present value of estimated futu-re cash flows, discounted using the original effective interest rate.
Impairment losses are recognised in profit or loss. When the reasons for impairment are no longer valid as a result of an event that took place subsequent to recognition of the impairment loss, it is reversed through profit or loss.
DerecognitionFinancial assets or parts of financial assets are decognised when the contractual rights to cash flows expire or are transferred, transferring substantially all the related risks and rewards.
67
2015 Reports and Financial Statements
4 - Loans and receivables
ClassificationLoans and receivables are non-derivative financial assets with fixed or determinable payments that are not quoted in an active market.
RecognitionLoans and receivables are initially recognised at the agreement signing date, which is usually the disbursement date, based on the financial instrument’s fair value, which usually equals the amount disbursed including transaction costs or revenue attributable to the individual loan or receivable and determinable from the transaction start date, even when they are disbursed subsequently. The initially recognised amount does not include costs that, despite having the above characteristics, are to be reimbursed by the counterparty or that are administrative costs.
Measurement After initial recognition, loans and receivables are measured at amortised cost using the effective interest method.
Interest is recognised in caption 10 “Interest and similar income” of the income statement.
Loans and receivables are tested for impairment at each reporting date to determine whether there is objective evidence of impairment due to events subsequent to initial recognition. Indication of impairment is based on one or more events that took place after initial recognition that have an im-pact on the estimate of future cash flows of a financial asset or a group of financial assets that can be measured reliably.
Loans and receivables tested individually for impairment include positions classified as non-perfor-ming, doubtful or restructured as per the Bank of Italy regulations. Assets not tested individually or for which impairment has not been identified are tested collectively.
The individual impairment test measures the difference between the carrying amount and present value of estimated future cash flows discounted at the position’s original effective interest rate.
Estimated cash flows include guarantees securing the debtor’s exposure and their probable enfor-cement. When enforcement of the guarantees is unlikely, the group uses their present value, while if it is probable that they will be enforced, the group considers their realisable value net of the costs to be incurred for enforcement.
Impairment losses are recognised in caption 130 “Net impairment losses” in the income statement.
Loans and receivables are reinstated to their original value in subsequent periods when the reasons for impairment are no longer valid, as long as this assessment is objectively linked to an event that took place after recognition of the impairment loss. Reversals of impairment losses are recognised in the income statement and may not exceed the position’s amortised cost had the impairment loss not been recognised.
68
Loans and receivables that are not tested individually for impairment are tested collectively. They are grouped into categories based on their risk and the related impairment loss percentages are esti-mated considering historical data, based on elements observable at their measurement date, so as to estimate each category’s unrealised loss. The impairment test considers the counterparty’s country risk. Collective impairment losses are recognised in profit or loss. DerecognitionFinancial assets or parts of financial assets are decognised when the contractual rights to cash flows expire or are transferred, transferring substantially all the related risks and rewards.
7 - Equity investments
This caption includes equity-accounted investees as described in section 3 – Basis of consolidation.Investments in entities other than subsidiaries and associates are classified as AFS financial assets and treated accordingly (see point 2).
8 - Property, equipment and investment property
ClassificationThis caption includes land, owner-occupied property, investment property, furniture and fittings and all equipment. It also comprises assets under finance lease.
RecognitionAssets acquired on the market are recognised as assets when the main risks and rewards of title are transferred. Initial recognition is at cost, which includes all directly related charges.
Land is recognised separately, including when it is purchased together with the building, using the component approach. It is separated from the building based on third party appraisals.
The cost of extraordinary maintenance that increases the item’s future economic benefits is capitali-sed while other ordinary maintenance costs are expensed.
Measurement Property, equipment and investment property are subsequently measured at cost adjusted by accu-mulated depreciation and any impairment losses/reversals of impairment losses.
The depreciable value of property and equipment equals their cost as the residual value after depre-ciation is not deemed significant. Depreciation is charged systematically on a straight-line basis over the assets’ estimated useful life to reflect their technical-economic life and residual use.
The useful life of the main categories of property, equipment and investment property is as follows:
▪ furniture and fittings: 8 years;
▪ owner-occupied buildings: 33 years;
69
2015 Reports and Financial Statements
▪ investment property: 33 years;
▪ POS and ATM, classified as electronic equipment, are depreciated over three and seven years, respectively, as these periods are held to reflect their useful lives.
Land is not depreciated as it has an indefinite life nor are works of art as their useful lives cannot be estimated and their value usually increases over time.
The group tests the assets for impairment at every reporting date. If there is indication of impai-rment, it compares the asset’s carrying amount to its recoverable amount being the higher of fair value and value in use.
DerecognitionProperty, equipment and investment property are derecognised when sold or when no future econo-mic benefits are expected from their continued use or sale.
9 - Intangible assets
ClassificationAn intangible asset is an identifiable non-monetary asset without physical substance able to genera-te future economic benefits controllable by the entity.
RecognitionIntangible assets are recognised at cost when the principal risks and rewards are transferred, only when it is probable that the related future economic benefits will materialise and cost can be measu-red reliably. Otherwise, cost is expensed in the period in which it is incurred.
Measurement All intangible assets other than goodwill are considered to have finite useful lives and are amortised in line with their cost and related useful lives.
The useful life of the group’s intangible assets is three years, except for those assets related to the depositary services, which have an estimated useful life of ten years depending on the contractual terms.
Their residual value is taken to be nil.
The group tests the assets for impairment at every reporting date. If there is indication of impai-rment, it compares the asset’s carrying amount to its recoverable amount being the higher of fair value and value in use.
DerecognitionThe group derecognises intangible assets when they are sold or when it does not expect to receive future economic benefits from their continued use or sale.

70
GoodwillGoodwill arising on business combinations is the difference between the consideration paid, inclu-ding related costs, and fair value of the assets acquired and the liabilities assumed at the transaction date. If the difference is positive, it is recognised as an asset (goodwill), being a payment by the ac-quiree for future economic benefits to be generated by assets that cannot be identified individually or recognised separately. If the difference is negative, it is recognised directly in profit or loss (excess cost).
Goodwill is recognised at cost, net of accumulated impairment losses. It is not amortised.
It is tested annually for impairment even if there are no indicators of impairment.
Impairment losses on goodwill are recognised in caption 260 “Impairment losses on goodwill” of the income statement. They are not reversed in subsequent periods.
10 - Non-current assets held for sale and discontinued operations
Non- current assets included in this category are represented by investment instruments for which a divestment process was defined . For more information, see Part B section 14.
11 - Current and deferred taxes
The group estimates current and deferred taxes.
Current taxes not yet paid in whole or in part at the reporting date are recognised as tax liabilities in the statement of financial position. If payments on account in the current or previous reporting period exceed the related tax expense, the difference is recognised as a tax asset.
Current and deferred taxes are recognised in caption 290 “Income taxes” of the income statement unless they relate to gains or losses on AFS financial assets and actuarial gains and losses, which are recognised directly in the valuation reserves, net of tax.
Deferred tax assets and liabilities are recognised in the statement of financial position without offset-ting as “Tax assets” and “Tax liabilities”, respectively.
The income tax expense is calculated on the basis of an estimate of the current and deferred tax expense and income. Specifically, deferred tax assets and liabilities are calculated on the temporary differences between the carrying amounts of assets and liabilities and their tax bases. The group re-cognises deferred tax assets (in caption 140.b) for deductible temporary differences and carryfoward tax losses that will reverse in subsequent periods when it is probable that it will make a taxable profit in the same period, according to its business plans, against which it can offset the deferred tax asset.
Deferred tax liabilities are calculated on all taxable temporary differences, excluding only reserves taxed upon distribution as, given the amount of the taxed available reserves, the group does not expect to undertake transactions that would require their taxation.
71
2015 Reports and Financial Statements
Deferred tax assets and liabilities are calculated using the tax rates expected to be enacted in the period in which the deferred tax asset will be recovered or the deferred tax liability extinguished, based on the ruling tax laws.
They are remeasured regularly to reflect any changes in the tax laws or rates or any subjective situa-tions in which the group may find itself. 12 - Provisions for risks and charges Pension and similar provisions Internal pension plans are considered to be defined benefit plans. The group calculates the related liabilities and current service cost using actuarial assumptions and the projected unit credit method. This method projects future payments using historical figures and the demographic curve and di-scounts these flows using a market interest rate. The discount rate is the average market rate at the measurement date. The present value of the group’s liability at the reporting date is also adjusted by the fair value of any plan assets.
Other provisionsThe group recognises provisions for risks and charges when:
▪ it has a present legal or constructive obligation as a result of a past event;
▪ it is probable that an outflow of resources will be necessary to settle the obligation;
and
▪ the liability can be reliably estimated.
When the effect of the time value of money is material, the provision is discounted using the cur-rent market rates at the closing date. Accruals and increases due to the time factor are recognised in profit or loss. Where discounting is used, the increase in the provision due to the passage of time is recognised as interest expense.
Provisions and contingent liabilities are reviewed at the end of each reporting period and adjusted to reflect the current best estimate. If it is no longer probable that an outflow of resources embodying economic benefits will be required to settle the obligation, the provision is reversed.
13 - Liabilities and Securities issued
ClassificationAn issued financial instrument is classified as a liability when, based on the substance of the con-tractual agreement, the group has a contractual obligation to deliver cash or another financial asset to another party.
Due to banks and customers include funding obtained on the interbank market and from customers, including through repurchase agreements and the placing of bonds and certificates of deposit.
72
They also include finance lease liabilities.
RecognitionAmounts due to banks are recognised at the contract agreement date, which is usually when the bank receives the funds and issues the debt instruments.Financial liabilities are initially recognised at fair value, which is normally the amount received or the issue price, plus the directly related costs/income. Internal administrative costs are excluded.
Measurement After initial recognition, financial liabilities are measured at amortised cost using the effective inte-rest method.
Interest is recognised in caption 20 “Interest and similar expense” of the income statement.
DerecognitionFinancial liabilities, or parts thereof, are derecognised when they are extinguished, i.e., when the obligation is complied with, cancelled or has expired.
They are also derecognised when previously issued securities are repurchased. The difference betwe-en their carrying amount and the amount paid to repurchase them is recognised in profit or loss.
If the repurchased security is subsequently placed on the market again, this is treated as a new issue and is recognised at the new placement price.
14 - Financial liabilities held for trading
This caption includes derivatives held for trading with negative fair values.
All financial liabilities held for trading are measured at fair value and the fair value gains or losses are recognised in profit or loss.
The measurement and recognition criteria are identical to those used for financial assets held for trading.
16 - Foreign currency transactions
Initial recognitionUpon initial recognition, a foreign currency transaction is translated into the functional currency using the spot exchange rate ruling at the transaction date.
Subsequent measurementForeign currency assets and liabilities are retranslated into Euros at each subsequent reporting date using the following criteria:
73
2015 Reports and Financial Statements
▪ monetary items are retranslated using the closing rates;
▪ non-monetary items measured at historical cost are retranslated using the transaction-date exchange rates;
▪ non-monetary items measured at fair value are retranslated using the closing rates.
Exchange rate differences arising from the settlement of monetary items are recognised in profit or loss in the period in which they arise; exchange rate differences on non-monetary items are recogni-sed in equity or in profit or loss in line with the method used to recognise the gains or losses that include this component.
Foreign currency costs and revenue are translated at the exchange rate ruling on their recognition date or, if they have not been realised, at the closing spot rate.
18 - Other information
Post-employment benefits The Italian post-employment benefits (TFR) are a form of deferred remuneration paid to employees when they leave the group. They accrue over the employment term and are recognised under per-sonnel expense.
Following the Italian supplementary pension reform introduced with Legislative decree no. 252 of 5 December 2005, benefits accruing from 1 January 2007 are calculated without using an actuarial ap-proach as the group’s liability is limited to its contribution defined by the Italian Civil Code (defined contribution plan as per IAS 19).
Post-employment benefits vested up to 31 December 2006 continue to be considered defined benefit plans under IAS 19. Accordingly, the related obligation is subject to actuarial valuation using the projected unit credit method. This method projects future payments using historical statistics and the demographic curve and discounts these flows using a market interest rate.
The rate used to discount the post-employment benefit obligation (both funded and unfunded) vari-es from country to country. It is determined by reference to market yields at the end of the reporting period on high quality corporate bonds. The term of the corporate bonds is consistent with the esti-mated term of the post-employment benefit obligations.
Specifically, the amount recognised as a liability in caption 120.a) equals the net balance of the obli-gation’s present value at the reporting date, the sum of any actuarial gains or losses, less any pension costs for past service not yet recognised and the current value of plan assets, if any, at the reporting date that will be used to directly extinguish the obligation.
Starting from the 2013 consolidated financial statements, the group has recognised actuarial gains and losses in the statement of comprehensive income as required by the revised IAS 19.
Before that, they had been recognised immediately in profit or loss.
Interest accrued on the net liability continues to be recognised.
74
Treasury sharesRepurchased treasury shares are directly offset against equity. No gain or loss on the repurchase, sale, issue or extinguishment of these shares can be recognised in profit or loss. Any amounts paid or received for these shares are recognised directly in equity.The group has set up the specific reserve as per article 2357-ter of the Italian Civil Code.
Measurement of the fair value of financial instruments The fair value of financial instruments is measured using the financial market prices in the case of instruments listed on active markets or by using internal measurement models for other financial instruments.
An active market is a market in which transactions for the asset or liability take place with sufficient frequency and volume to provide pricing information on an ongoing basis.
The closing date bid price and ask price are used for financial assets and financial liabilities respec-tively.
The fair value of financial instruments not quoted on active markets is determined using prices of recent market transactions of instruments with similar characteristics or by using valuation techni-ques based mainly on discounting cash flows. These techniques include all the factors that the mar-ket considers to set the price. Accordingly, the models consider the time value of money measured using the risk-free interest rate, default risks, the prepayment risk and the volatility of the financial instrument price, as well as, if applicable, foreign currency exchange rates.
The valuation model adopted for a financial instrument is the same over time, adjusted only in the case of significant changes in market conditions or subjective changes affecting the issuer.
Valuation models based on market parameters are used for bonds and derivatives. The calculation method also considers the need to include the credit risk of both counterparties.
Specifically, bonds are measured by discounting the expected future cash flows of the contractual plan, adjusted for the issuer credit risk.
This method is also used for derivatives, being interest rate swaps (IRS), overnight interest rate swaps (OIS) and options.
A fair value hierarchy has been developed for shares and an application order for the measurement methods which considers any significant transactions involving the share in a sufficiently short time period compared to the measurement period, comparable transactions carried out by companies operating in the same sector and the application of financial, income and equity analytical valuation methods.
The fair value of financial assets and liabilities carried at cost or amortised cost is disclosed in the notes and is determined as follows:
- for non-current financial assets and liabilities, the discounted cash flow method is mainly used;
- for on demand assets and liabilities, with a short term or undetermined maturity, the carrying
75
2015 Reports and Financial Statements
amount net of a collective/individual impairment loss is deemed to reasonably reflect fair value as it reflects changes in interest rates and the issuer credit risk;
- for floating-rate and current fixed-rate securities issued, the carrying amount is deemed to ade-quately reflect fair value, for the reasons set out above;
- for non-current fixed-rate liabilities, the discounted cash flow method, without considering changes in its credit spread, given its immateriality, is used.
Measurement of fair value of non-financial assetsThe fair value of investment property is only calculated for disclosure in the notes. The group uses third party appraisals considering transactions at current prices in an active market for similar real estate assets in the same location and condition and that have the same lease and other contractual terms.
Determination of impairment losses on goodwillImpairment losses on goodwill are determined using the discounted cash flow method.
Guarantees issuedGuarantees issued, credit derivatives and similar instruments as per IAS 39 and subsequent impai-rment losses are recognised in caption 100 “Other liabilities”.
Income statement
Interest income and expenseInterest income and expense and related income and expense relate to cash and cash equivalents, non-derivative financial assets and liabilities held for trading, AFS financial assets, HTM investments, loans and receivables, liabilities and securities issued.
Interest income and expense are recognised in profit or loss on all instruments measured at amorti-sed cost, using the effective interest method.
Fee and commission income and expenseThey are recognised on an accruals basis.
Specifically, trading commissions on securities are recognised when the service is rendered.
Fees and commissions included in amortised cost to calculate the effective interest rate are excluded as they are recognised under interest.
DividendsDividends are recognised in profit or loss when their distribution is approved.
Other income and costsThey are recognised on an accruals basis.
76
Business combinationsAssets and liabilities deriving from business combinations are recognised at their acquisition-date fair value. After allocating the acquisition price to the assets acquired, liabilities assumed and con-tingent liabilities to obtain their fair value, any positive difference is recognised as goodwill. After initial recognition, goodwill is tested for impairment.
If the allocation of the acquisition cost to the assets acquired, liabilities assumed (and contingent liabilities) gives rise to a negative difference, this is taken to profit or loss.
Utilisation of estimates and assumptions in the preparation of the consolidated financial state-ments
The consolidated financial statements captions are measured using the policies set out above.
Application of these policies sometimes involves the adoption of estimates and assumptions that may have a significant effect on the carrying amount of assets and liabilities, income and expenses.
The use of reasonable estimates is an essential part of the preparation of financial statements but must not affect their reliability. The financial statements captions affected to a greater extent by the use of estimates and assumptions are:
▪ measurement of financial assets not listed on active markets;
▪ measurement of intangible assets and equity investments;
▪ quantification of accruals to provisions for risks and charges;
▪ quantification of deferred liabilities.
A change in an accounting estimate may occur due to changes in the circumstances on which the estimate was based or as a result of new information or more experience. The effect of a change in an accounting estimate is recognised prospectively by including it in profit or loss of the period of the change and, if the change affects future periods, also in future periods.
No significant changes to the accounting estimates were made in 2015.
77
2015 Reports and Financial Statements
A.3. Transfers between portfolios of financial assets
A.3.1 Reclassified financial assets: carrying amount, fair value and effects on comprehensive income
Type of financial
instrument
Original portfolio
Portfolio to which transfer
is made
Carrying amount at 31/12/2015
Fair value at
31/12/2015
Income or expense if
transfer had not taken place
Income or expense for the year
(before taxes) (before taxes)Fair value gain/loss Other Fair value
gain/loss Other
(1) (2) (3) (4) (5) (6) (7) (8) (9)
1. Debt instruments
Financial assets held for trading
Available-for-sale financial assets
263,882 263,882 2,623 2,005
A.3.2. Reclassified financial assets: effects on comprehensive income before transfer
No transfers among portfolios took place during the year.
A.3.3. Reclassified financial assets: effects on comprehensive income before transfer
In 2011, as the rare circumstances provided for by IAS 38 arose, the group reclassified Italian treasury credit certificates from the HFT portfolio to the AFS portfolio.These rare circumstances related to the international sovereign debt crisis of June 2011 and the con-tinuously widening spread of the German bund.
A.4 Fair value disclosure
The IFRS require that financial products classified in the HFT or AFS portfolios be measured at fair value.
Fair value is the price that would be received to sell an asset or paid to transfer a liability in an orderly transaction between market participants (i.e., not a forced liquidation or distress sale) on the principal market at the measurement date. Fair value is a market-based measurement, not an entity-specific measurement. An entity shall measure the fair value of an asset or a liability using the assumptions that market participants would use when pricing the asset or liability, assuming that market participants act in their economic best interest.
IFRS 13 establishes a hierarchy for measuring fair value of financial instruments depending on the entity’s use of discretion, prioritising the use of relevant observable inputs that reflect the as-sumptions that market participants would use to price assets/liabilities.
78
The fair value hierarchy has three input levels:
▪ Level 1: quoted prices (unadjusted) in active markets for identical assets or liabilities that the entity can access at the measurement date;
▪ Level 2: inputs other than quoted prices included within Level 1 that are observable for the asset or liability, either directly (prices) or indirectly (derived from prices);
▪ Level 3: unobservable inputs for the asset or liability.
The decision about which level to use is not optional as they are to be applied in hierarchical order. Highest priority is given to official prices available on active markets for the assets or liabilities to be measured (level 1) or assets and liabilities measured using techniques based on parameters observa-ble on the market other than prices (level 2) and the lowest priority is given to assets and liabilities whose fair value is calculated using techniques that are based on unobservable inputs and which are, therefore, more discretional (level 3).
The group uses the reporting date market price for instruments listed on active markets (level 1).
The fair value of financial instruments not listed on active markets is measured using techniques mainly based on discounting cash flows. These techniques consider all the factors that the market uses to set the price which are mainly inputs observable on the market (level 2). Specifically:
▪ bonds are measured by discounting the expected future cash flows of the contractual plan, adju-sted for the issuer credit risk.
▪ derivatives, including IRSs and OISs, and options are measured using the market models that mainly use market rates as their input, adjusted to reflect counterparty risk. This risk includes changes in the counterparty’s credit standing and in the issuer’s credit standing (own credit risk), if material;
▪ a fair value hierarchy has been developed for shares and an application order for the measure-ment methods which considers any significant transactions involving the share in a sufficiently short time period compared to the measurement period, comparable transactions carried out by companies operating in the same sector and the application of financial, income and equity analytical valuation methods.
The valuation model adopted for a financial instrument is the same over time, adjusted only in the case of significant changes in market conditions or subjective changes affecting the issuer.
Qualitative disclosure
A.4.1 Levels 2 and 3: valuation techniques and inputs used
It measured level 2 financial instruments (mainly IRSs, OISs and interest rate and currency options) using market interest rates and volatility. Given the group’s limited operations in the unlisted deriva-tives segment, its transactions with Italian institutional counterparties and its guarantees mitigating risk, the adjustments made to the level 2 instruments to reflect counterparty risk were immaterial.
79
2015 Reports and Financial Statements
A.4.2 Measurement processes and sensitivity
At 31 December 2015 the Group holds Level 3 financial instruments, for which the disposal process has been already defined. For more information, see ‘Section 14’, ‘Part B’.
A.4.3 Fair value hierarchy
Transfers between the fair value levels are made to reflect changes in the instruments or its market.
Transfers from level 1 to level 2 are made when there is an inadequate number of
contributors or a limited number of investors that hold the outstanding float.
Conversely, instruments that are illiquid when issued and have a small number of trades classified in level 2 are transferred to level 1 when an active market exists.
A.4.4 Other disclosures
The group did not avail of the exception under IFRS 13.48 to measure the net positions of groups of assets and liabilities managed on a net basis.
The group does not hold assets, the current use of which differs from their highest and best use.
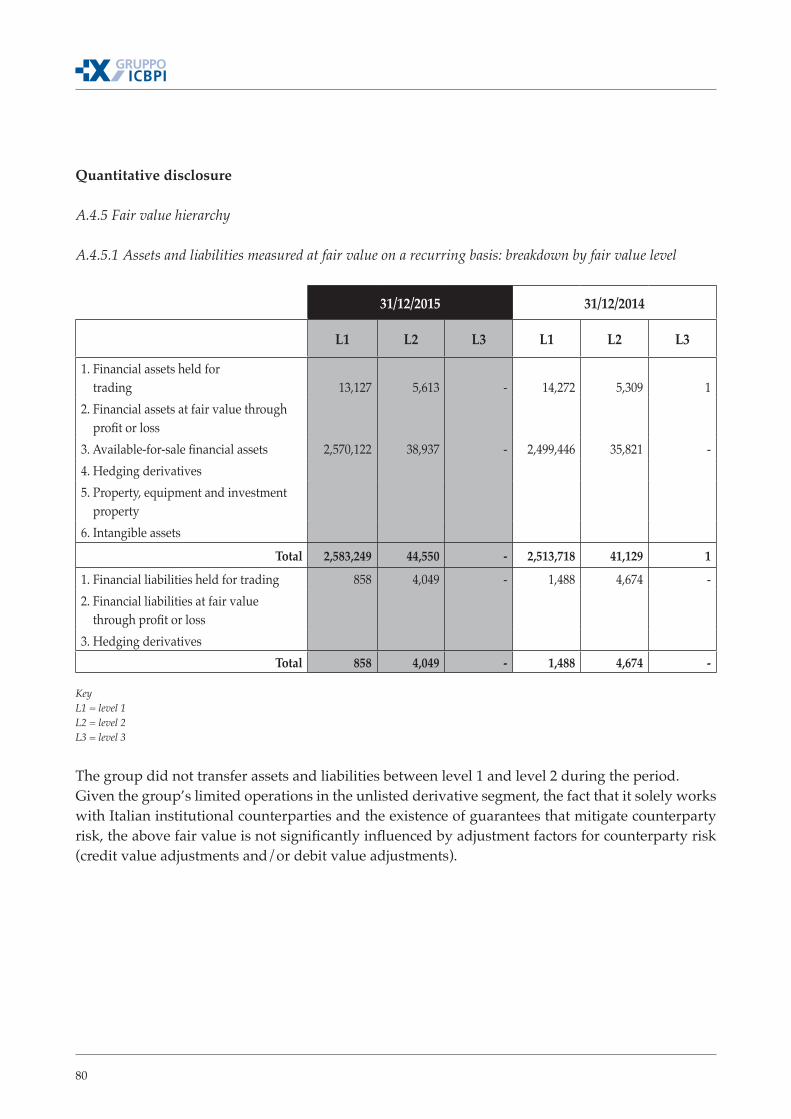
80
Quantitative disclosure
A.4.5 Fair value hierarchy
A.4.5.1 Assets and liabilities measured at fair value on a recurring basis: breakdown by fair value level
31/12/2015 31/12/2014
L1 L2 L3 L1 L2 L3
1. Financial assets held for trading 13,127 5,613 - 14,272 5,309 1 2. Financial assets at fair value through profit or loss3. Available-for-sale financial assets 2,570,122 38,937 - 2,499,446 35,821 - 4. Hedging derivatives5. Property, equipment and investment property6. Intangible assets
Total 2,583,249 44,550 - 2,513,718 41,129 1
1. Financial liabilities held for trading 858 4,049 - 1,488 4,674 - 2. Financial liabilities at fair value through profit or loss3. Hedging derivatives
Total 858 4,049 - 1,488 4,674 -
KeyL1 = level 1L2 = level 2L3 = level 3
The group did not transfer assets and liabilities between level 1 and level 2 during the period. Given the group’s limited operations in the unlisted derivative segment, the fact that it solely works with Italian institutional counterparties and the existence of guarantees that mitigate counterparty risk, the above fair value is not significantly influenced by adjustment factors for counterparty risk (credit value adjustments and/or debit value adjustments).

81
2015 Reports and Financial Statements
A.4.5.2 Changes in assets measured at fair value on a recurring basis (level 3)
Fina
ncia
l ass
ets h
eld
for t
radi
ng
Fina
ncia
l ass
ets a
t fai
r val
ue
thro
ugh
profi
t or l
oss
Avai
labl
e-fo
r-sal
e fin
anci
al as
sets
Hed
ging
der
ivat
ives
Prop
erty
, equ
ipm
ent a
nd in
-ve
stm
ent p
rope
rty
Inta
ngib
le as
sets
1. Opening balance 1 - - - - -2. Increases
2.1. Purchases2.2. Gains recognised in:
2.2.1. Profit or loss - including gains on sales 2.2.2. Equity X X 2.3. Transfers from other levels 2.4. Other increases 3. Decreases 3.1. Sales 3.2. Repayments
3.3. Losses recognised in: 3.3.1. Profit or loss - including losses on sales 3.3.2. Equity X X 3.4. Transfers to other levels 3.5 Other decreasesD. Closing balance 1 - - - - -
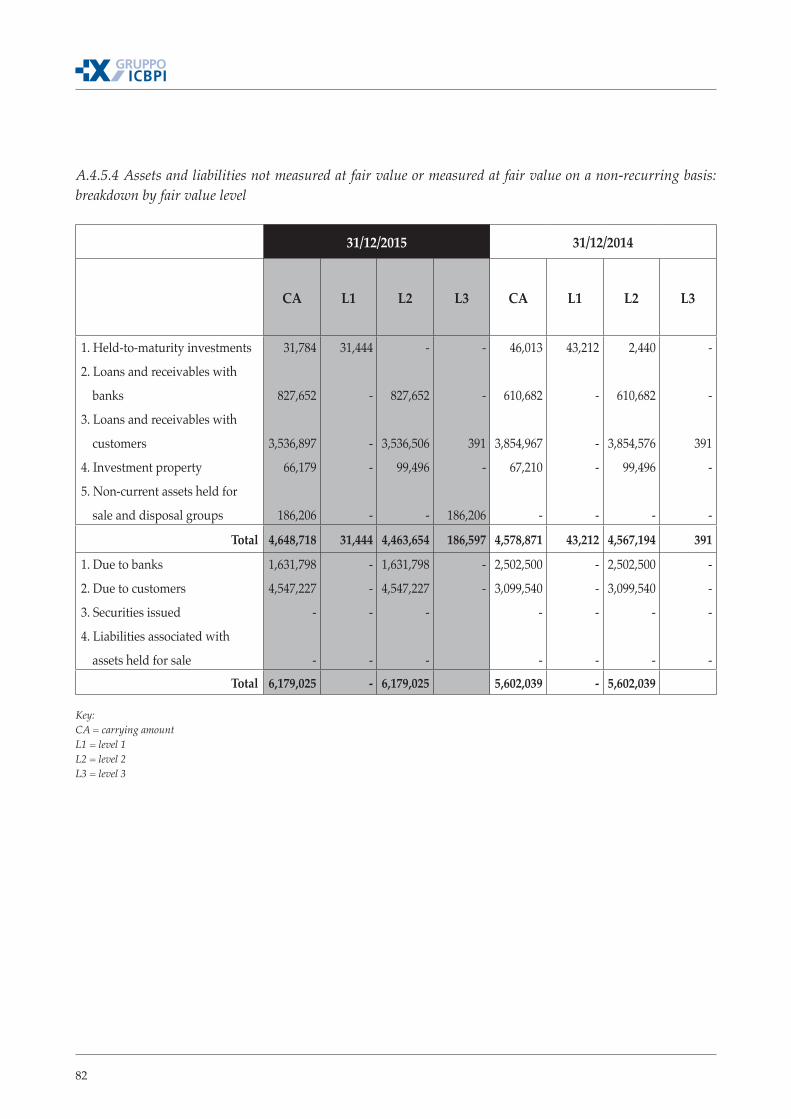
82
A.4.5.4 Assets and liabilities not measured at fair value or measured at fair value on a non-recurring basis: breakdown by fair value level
31/12/2015 31/12/2014
CA L1 L2 L3 CA L1 L2 L3
1. Held-to-maturity investments
2. Loans and receivables with
banks
3. Loans and receivables with
customers
4. Investment property
5. Non-current assets held for
sale and disposal groups
31,784
827,652
3,536,897
66,179
186,206
31,444
-
-
-
-
-
827,652
3,536,506
99,496
-
-
-
391
-
186,206
46,013
610,682
3,854,967
67,210
-
43,212
-
-
-
-
2,440
610,682
3,854,576
99,496
-
-
-
391
-
-
Total 4,648,718 31,444 4,463,654 186,597 4,578,871 43,212 4,567,194 391
1. Due to banks
2. Due to customers
3. Securities issued
4. Liabilities associated with
assets held for sale
1,631,798
4,547,227
-
-
-
-
-
-
1,631,798
4,547,227
-
-
-
-
2,502,500
3,099,540
-
-
-
-
-
-
2,502,500
3,099,540
-
-
-
-
-
-
Total 6,179,025 - 6,179,025 5,602,039 - 5,602,039
Key:CA = carrying amountL1 = level 1L2 = level 2L3 = level 3
83
2015 Reports and Financial Statements
A.5 Information on “day one profit or loss”
Pursuant to IFRS 7.28 and IAS 39.AG.76, a financial instrument shall be initially recognised at an amount that is equal to its fair value, which is generally considered to be the price paid/collected from its trading. In practice, there could be a difference between the two values. In these cases, the standard stipulates that a financial instrument can be recognised at a fair value different from the amount paid/collected only if it is measured:
▪ using prices from observable current market transactions in the same instrument;
▪ using valuation techniques exclusively based on observable market date as the variable factors.
In other words, IAS 39 states that the presumption that the fair value is equal to the price paid/col-lected can be rebutted only if it is determined using objective evidence that the price paid/collected does not represent the real market value of the financial instrument being traded.
The objective evidence shall be obtained using the most objective method available, i.e., reducing valuation discretion to the minimum.
The difference between fair value and the negotiated price, when the above conditions are met, is called the “day one profit or loss” and is immediately taken to profit or loss.
The group did not recognise transactions of this kind in the period.
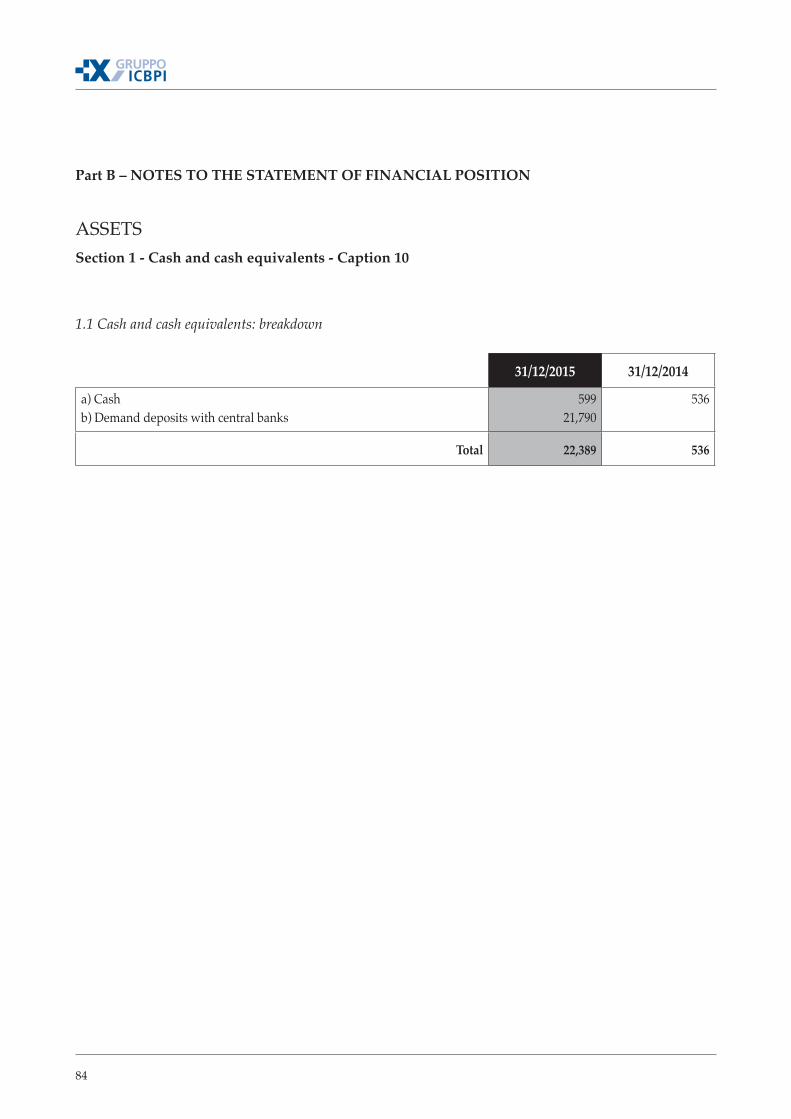
84
Part B – NOTES TO THE STATEMENT OF FINANCIAL POSITION
ASSETS Section 1 - Cash and cash equivalents - Caption 10
1.1 Cash and cash equivalents: breakdown
31/12/2015 31/12/2014
a) Cash b) Demand deposits with central banks
59921,790
536
Total 22,389 536
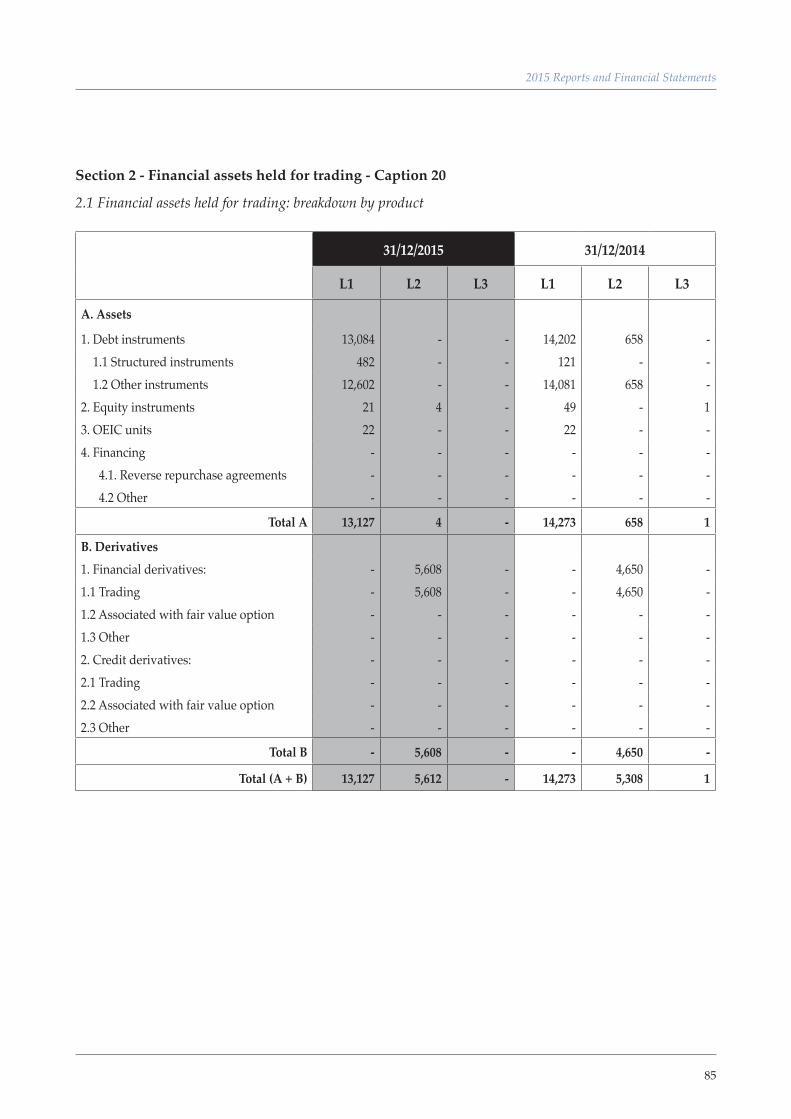
85
2015 Reports and Financial Statements
Section 2 - Financial assets held for trading - Caption 20
2.1 Financial assets held for trading: breakdown by product
31/12/2015 31/12/2014
L1 L2 L3 L1 L2 L3
A. Assets
1. Debt instruments 13,084 - - 14,202 658 - 1.1 Structured instruments 482 - - 121 - - 1.2 Other instruments 12,602 - - 14,081 658 - 2. Equity instruments 21 4 - 49 - 1 3. OEIC units 22 - - 22 - - 4. Financing - - - - - - 4.1. Reverse repurchase agreements - - - - - - 4.2 Other - - - - - -
Total A 13,127 4 - 14,273 658 1
B. Derivatives1. Financial derivatives: - 5,608 - - 4,650 - 1.1 Trading - 5,608 - - 4,650 - 1.2 Associated with fair value option - - - - - - 1.3 Other - - - - - - 2. Credit derivatives: - - - - - - 2.1 Trading - - - - - - 2.2 Associated with fair value option - - - - - - 2.3 Other - - - - - -
Total B - 5,608 - - 4,650 -
Total (A + B) 13,127 5,612 - 14,273 5,308 1
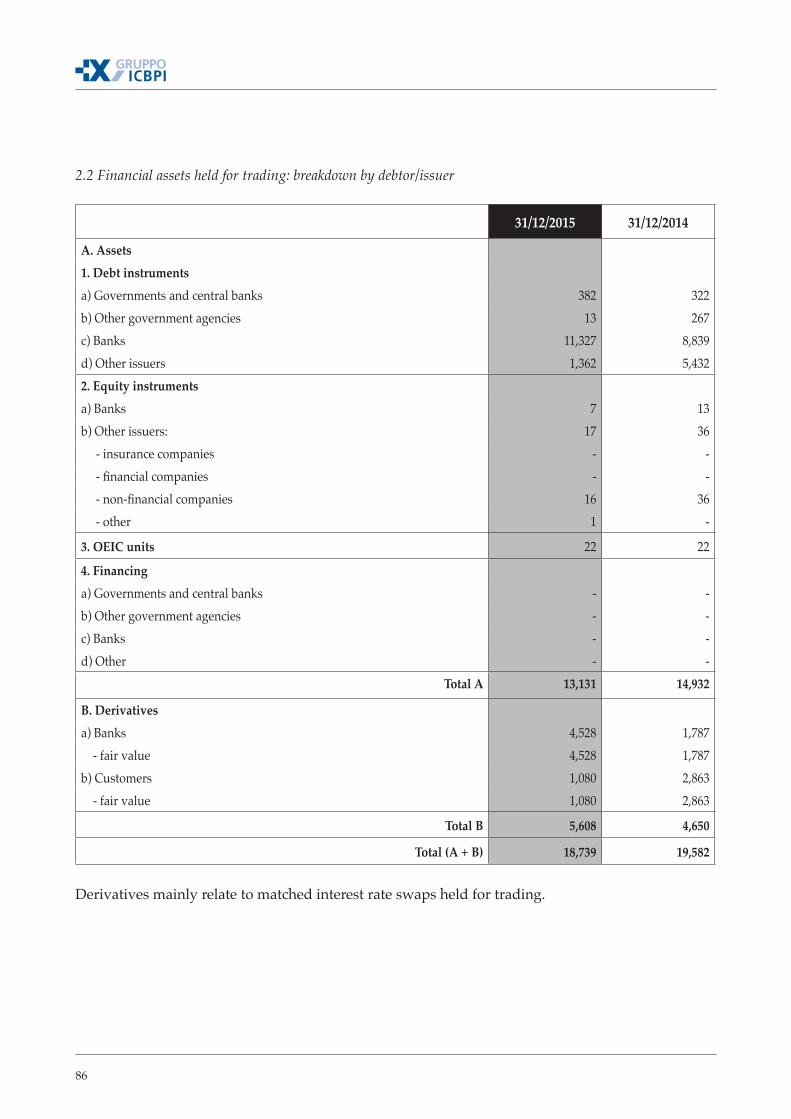
86
2.2 Financial assets held for trading: breakdown by debtor/issuer
31/12/2015 31/12/2014
A. Assets1. Debt instrumentsa) Governments and central banks 382 322 b) Other government agencies 13 267 c) Banks 11,327 8,839 d) Other issuers 1,362 5,432 2. Equity instruments a) Banks 7 13 b) Other issuers: 17 36 - insurance companies - - - financial companies - - - non-financial companies 16 36 - other 1 -
3. OEIC units 22 22
4. Financinga) Governments and central banks - - b) Other government agencies - - c) Banks - - d) Other - -
Total A 13,131 14,932
B. Derivativesa) Banks 4,528 1,787 - fair value 4,528 1,787 b) Customers 1,080 2,863 - fair value 1,080 2,863
Total B 5,608 4,650
Total (A + B) 18,739 19,582
Derivatives mainly relate to matched interest rate swaps held for trading.
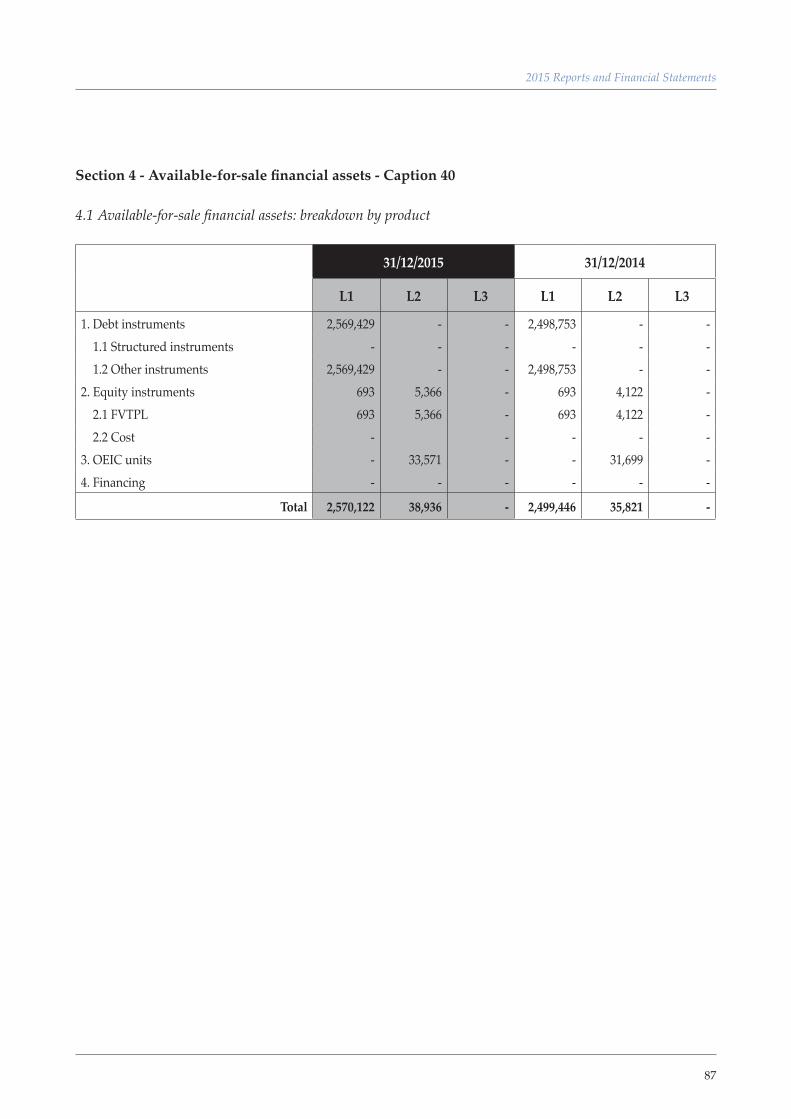
87
2015 Reports and Financial Statements
Section 4 - Available-for-sale financial assets - Caption 40
4.1 Available-for-sale financial assets: breakdown by product
31/12/2015 31/12/2014
L1 L2 L3 L1 L2 L3
1. Debt instruments 2,569,429 - - 2,498,753 - - 1.1 Structured instruments - - - - - - 1.2 Other instruments 2,569,429 - - 2,498,753 - - 2. Equity instruments 693 5,366 - 693 4,122 - 2.1 FVTPL 693 5,366 - 693 4,122 - 2.2 Cost - - - - - 3. OEIC units - 33,571 - - 31,699 - 4. Financing - - - - - -
Total 2,570,122 38,936 - 2,499,446 35,821 -
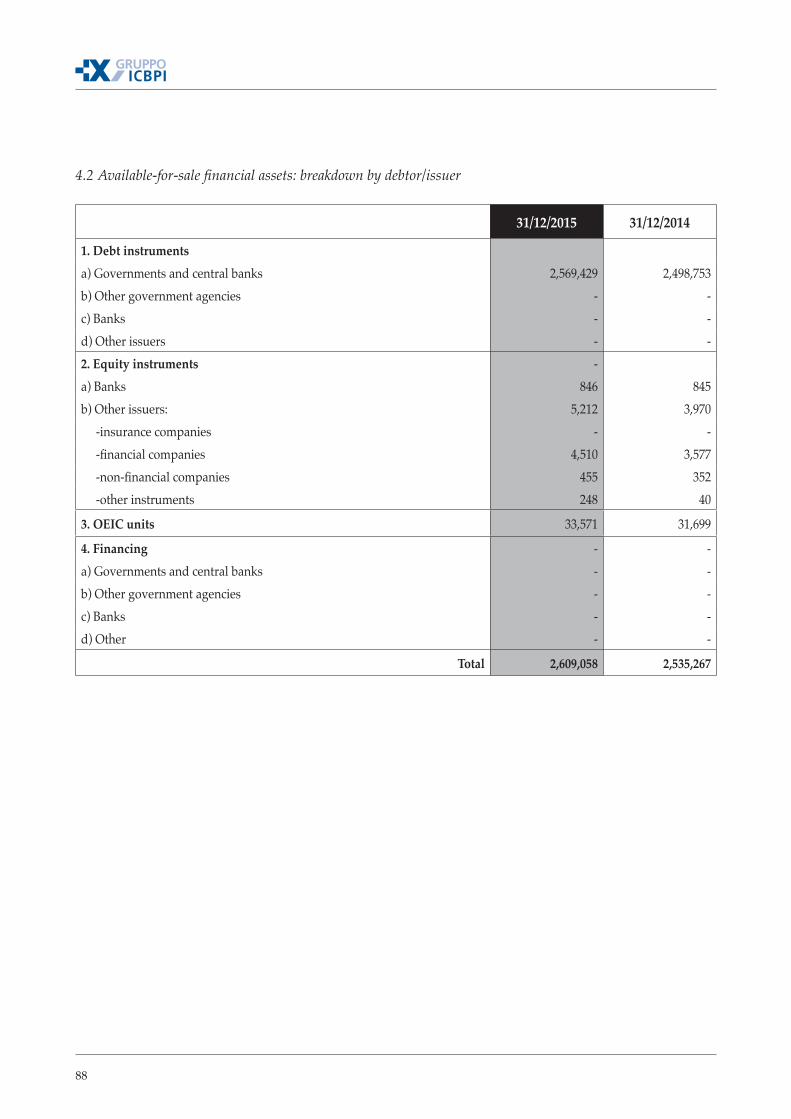
88
4.2 Available-for-sale financial assets: breakdown by debtor/issuer
31/12/2015 31/12/2014
1. Debt instrumentsa) Governments and central banks 2,569,429 2,498,753 b) Other government agencies - - c) Banks - - d) Other issuers - - 2. Equity instruments - a) Banks 846 845 b) Other issuers: 5,212 3,970 -insurance companies - - -financial companies 4,510 3,577 -non-financial companies 455 352 -other instruments 248 40
3. OEIC units 33,571 31,699
4. Financing - - a) Governments and central banks - - b) Other government agencies - - c) Banks - - d) Other - -
Total 2,609,058 2,535,267
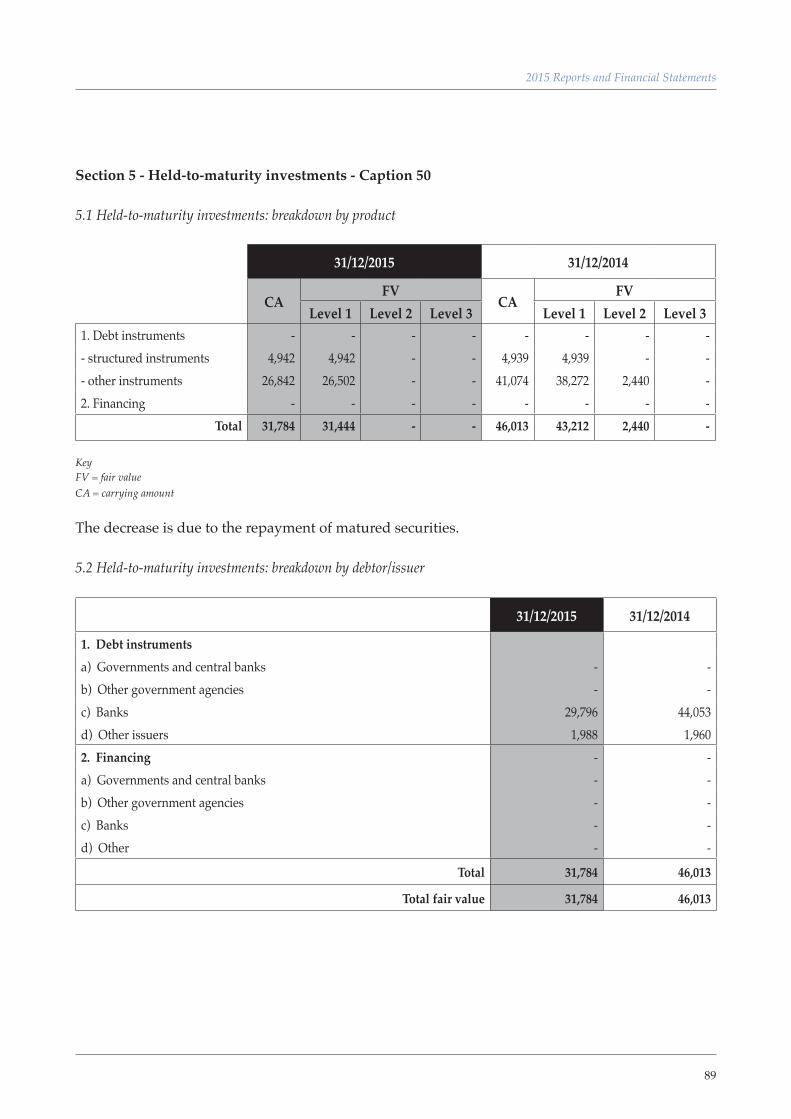
89
2015 Reports and Financial Statements
Section 5 - Held-to-maturity investments - Caption 50
5.1 Held-to-maturity investments: breakdown by product
31/12/2015 31/12/2014
CAFV
CAFV
Level 1 Level 2 Level 3 Level 1 Level 2 Level 31. Debt instruments - - - - - - - - - structured instruments 4,942 4,942 - - 4,939 4,939 - - - other instruments 26,842 26,502 - - 41,074 38,272 2,440 - 2. Financing - - - - - - - -
Total 31,784 31,444 - - 46,013 43,212 2,440 -
KeyFV = fair valueCA = carrying amount
The decrease is due to the repayment of matured securities.
5.2 Held-to-maturity investments: breakdown by debtor/issuer
31/12/2015 31/12/2014
1. Debt instruments a) Governments and central banks - - b) Other government agencies - - c) Banks 29,796 44,053 d) Other issuers 1,988 1,960 2. Financing - - a) Governments and central banks - - b) Other government agencies - - c) Banks - - d) Other - -
Total 31,784 46,013
Total fair value 31,784 46,013
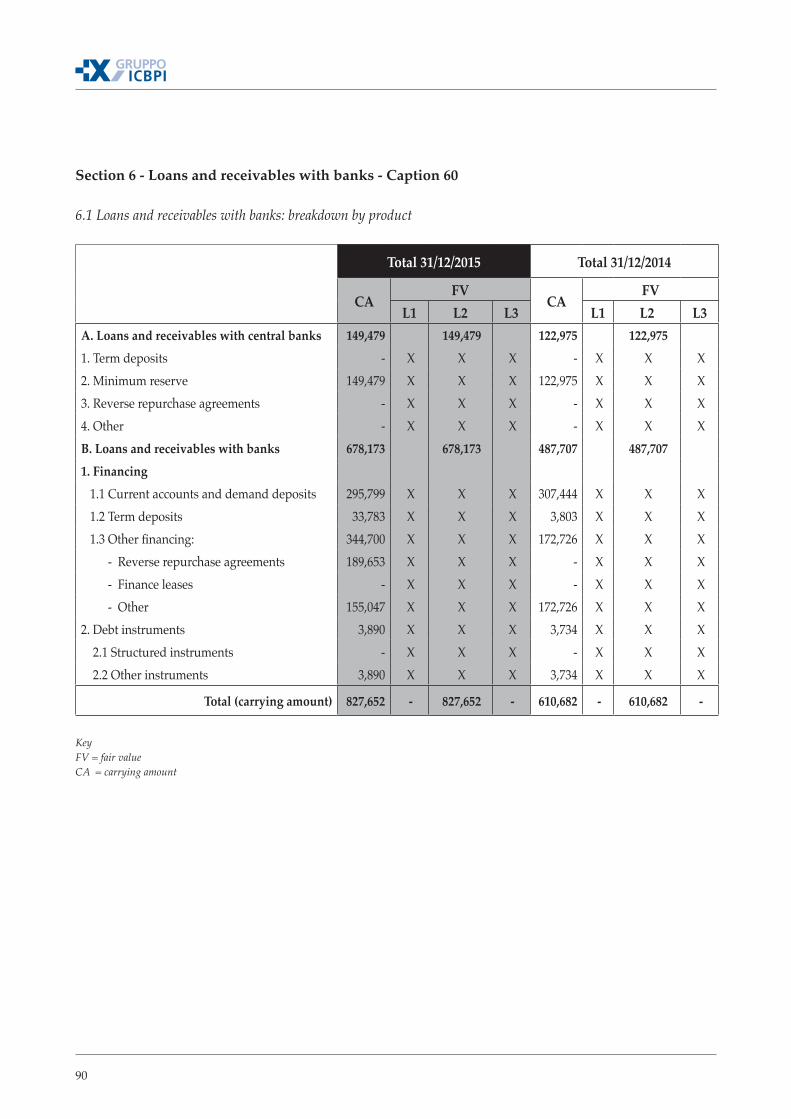
90
Section 6 - Loans and receivables with banks - Caption 60
6.1 Loans and receivables with banks: breakdown by product
Total 31/12/2015 Total 31/12/2014
CAFV
CAFV
L1 L2 L3 L1 L2 L3A. Loans and receivables with central banks 149,479 149,479 122,975 122,975 1. Term deposits - X X X - X X X 2. Minimum reserve 149,479 X X X 122,975 X X X 3. Reverse repurchase agreements - X X X - X X X 4. Other - X X X - X X X B. Loans and receivables with banks 678,173 678,173 487,707 487,707 1. Financing 1.1 Current accounts and demand deposits 295,799 X X X 307,444 X X X 1.2 Term deposits 33,783 X X X 3,803 X X X 1.3 Other financing: 344,700 X X X 172,726 X X X - Reverse repurchase agreements 189,653 X X X - X X X - Finance leases - X X X - X X X - Other 155,047 X X X 172,726 X X X 2. Debt instruments 3,890 X X X 3,734 X X X 2.1 Structured instruments - X X X - X X X 2.2 Other instruments 3,890 X X X 3,734 X X X
Total (carrying amount) 827,652 - 827,652 - 610,682 - 610,682 -
Key FV = fair valueCA = carrying amount
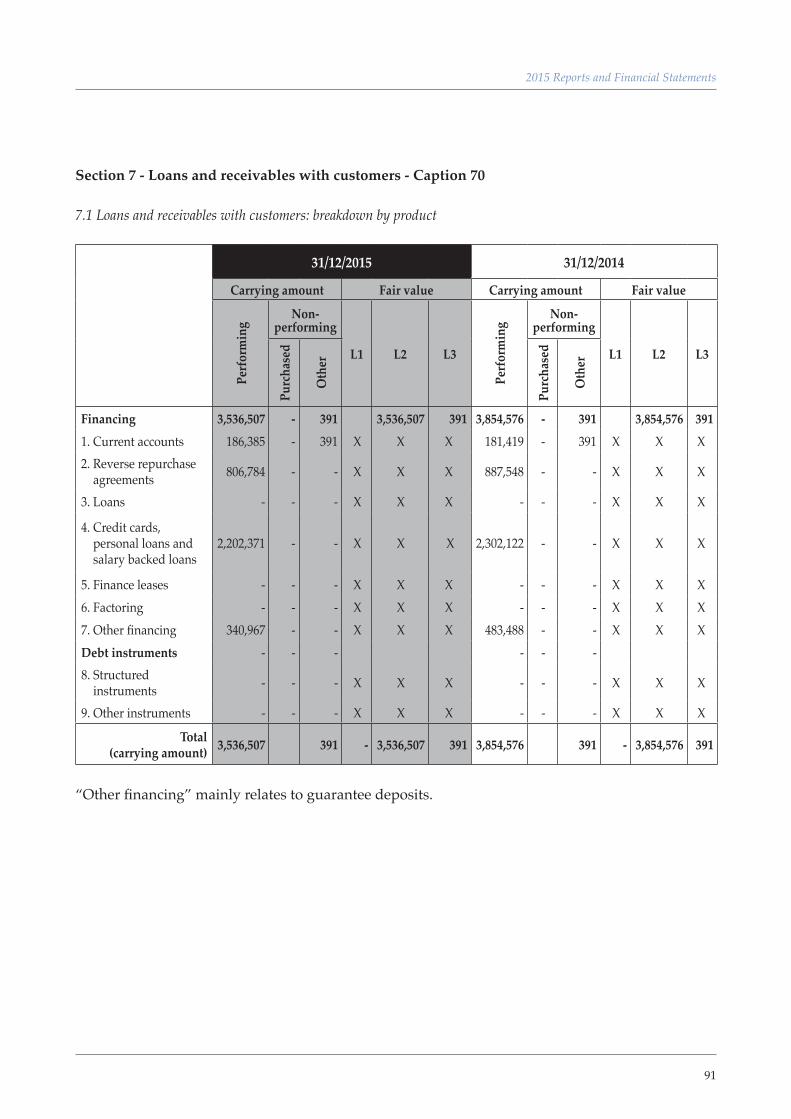
91
2015 Reports and Financial Statements
Section 7 - Loans and receivables with customers - Caption 70
7.1 Loans and receivables with customers: breakdown by product
31/12/2015 31/12/2014
Carrying amount Fair value Carrying amount Fair value
Perf
orm
ing
Non-performing
L1 L2 L3
Perf
orm
ing
Non-performing
L1 L2 L3
Purc
hase
d
Oth
er
Purc
hase
d
Oth
er
Financing 3,536,507 - 391 3,536,507 391 3,854,576 - 391 3,854,576 391 1. Current accounts 186,385 - 391 X X X 181,419 - 391 X X X2. Reverse repurchase agreements 806,784 - - X X X 887,548 - - X X X
3. Loans - - - X X X - - - X X X
4. Credit cards, personal loans and salary backed loans
2,202,371 - - X X X 2,302,122 - - X X X
5. Finance leases - - - X X X - - - X X X6. Factoring - - - X X X - - - X X X7. Other financing 340,967 - - X X X 483,488 - - X X XDebt instruments - - - - - - 8. Structured instruments - - - X X X - - - X X X
9. Other instruments - - - X X X - - - X X X
Total (carrying amount) 3,536,507 391 - 3,536,507 391 3,854,576 391 - 3,854,576 391
“Other financing” mainly relates to guarantee deposits.
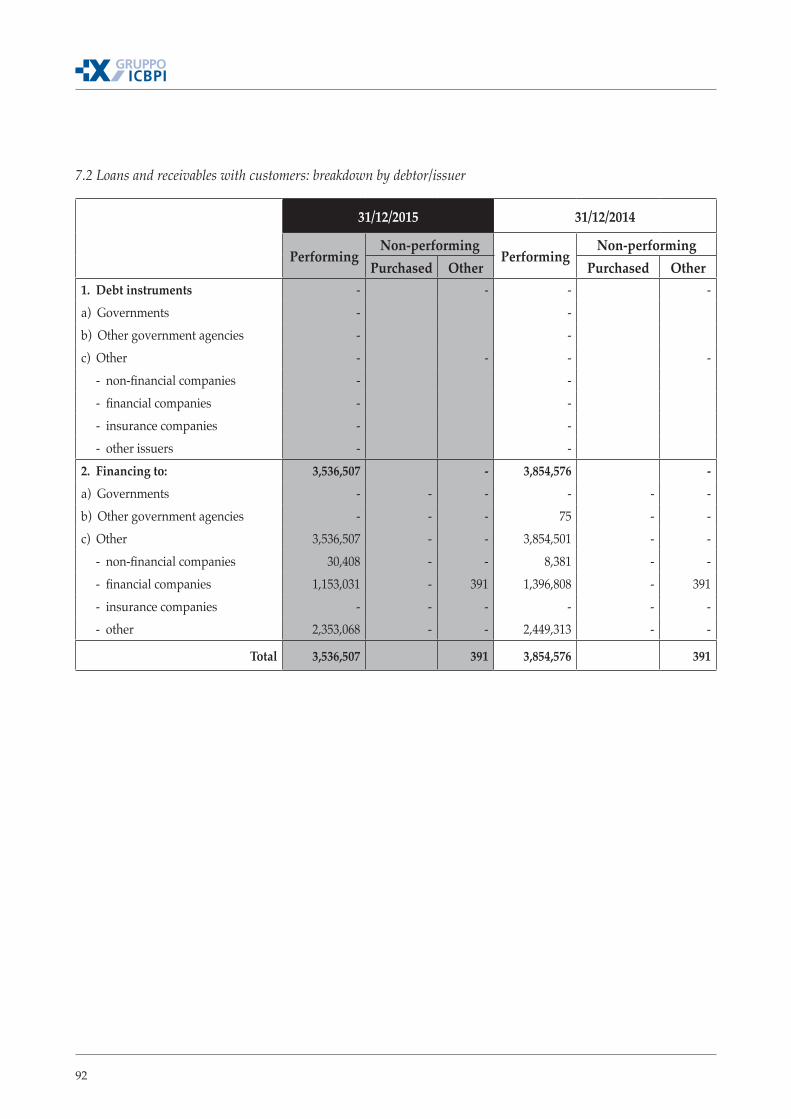
92
31/12/2015 31/12/2014
Performing Non-performing
Performing Non-performing
Purchased Other Purchased Other1. Debt instruments - - - - a) Governments - - b) Other government agencies - - c) Other - - - - - non-financial companies - - - financial companies - - - insurance companies - - - other issuers - - 2. Financing to: 3,536,507 - 3,854,576 - a) Governments - - - - - - b) Other government agencies - - - 75 - - c) Other 3,536,507 - - 3,854,501 - - - non-financial companies 30,408 - - 8,381 - - - financial companies 1,153,031 - 391 1,396,808 - 391 - insurance companies - - - - - - - other 2,353,068 - - 2,449,313 - -
Total 3,536,507 391 3,854,576 391
7.2 Loans and receivables with customers: breakdown by debtor/issuer
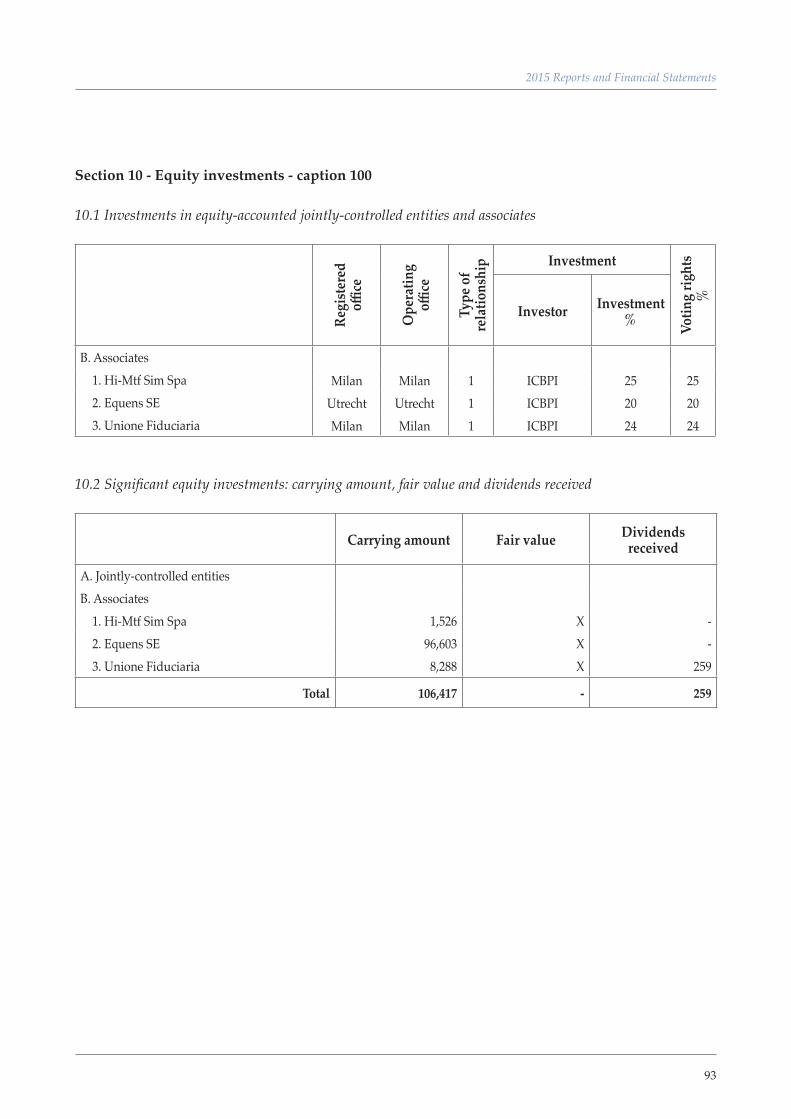
93
2015 Reports and Financial Statements
Section 10 - Equity investments - caption 100
10.1 Investments in equity-accounted jointly-controlled entities and associates
Regi
ster
ed
office
Ope
ratin
g offi
ce
Type
of
rela
tions
hip Investment
Votin
g rig
hts
%
Investor Investment %
B. Associates 1. Hi-Mtf Sim Spa Milan Milan 1 ICBPI 25 25 2. Equens SE Utrecht Utrecht 1 ICBPI 20 20 3. Unione Fiduciaria Milan Milan 1 ICBPI 24 24
10.2 Significant equity investments: carrying amount, fair value and dividends received
Carrying amount Fair value Dividends received
A. Jointly-controlled entitiesB. Associates 1. Hi-Mtf Sim Spa 1,526 X - 2. Equens SE 96,603 X - 3. Unione Fiduciaria 8,288 X 259
Total 106,417 - 259
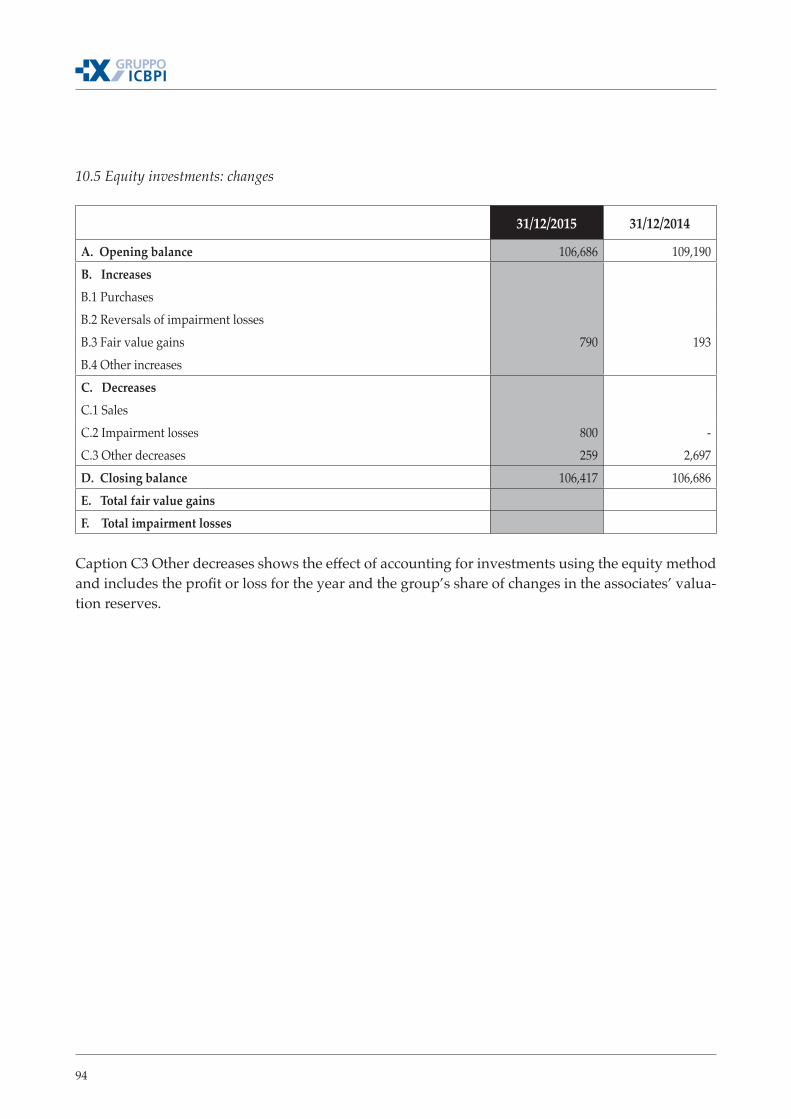
94
10.5 Equity investments: changes
31/12/2015 31/12/2014
A. Opening balance 106,686 109,190 B. IncreasesB.1 PurchasesB.2 Reversals of impairment lossesB.3 Fair value gains 790 193 B.4 Other increasesC. DecreasesC.1 SalesC.2 Impairment losses 800 - C.3 Other decreases 259 2,697 D. Closing balance 106,417 106,686 E. Total fair value gainsF. Total impairment losses
Caption C3 Other decreases shows the effect of accounting for investments using the equity method and includes the profit or loss for the year and the group’s share of changes in the associates’ valua-tion reserves.
95
2015 Reports and Financial Statements
10.6 Significant assumptions used for the assessment of the existence of joint control or significant influence
The ICBPI Group’s consolidated and equity-accounted investments are all direct mainly by holding voting rights. The group holds more than half of the subsidiaries’ voting rights and more than 20% of the associates’.
The group did not have to perform special judgements or make significant assumptions in order to establish the existence of control over subsidiaries and significant influence over associates.
10.7 Commitments for interests in jointly controlled entities
None.
10.8 Commitments for investments in associates
None.
10.9 Significant restrictions
None.
10.10 Other information
None.
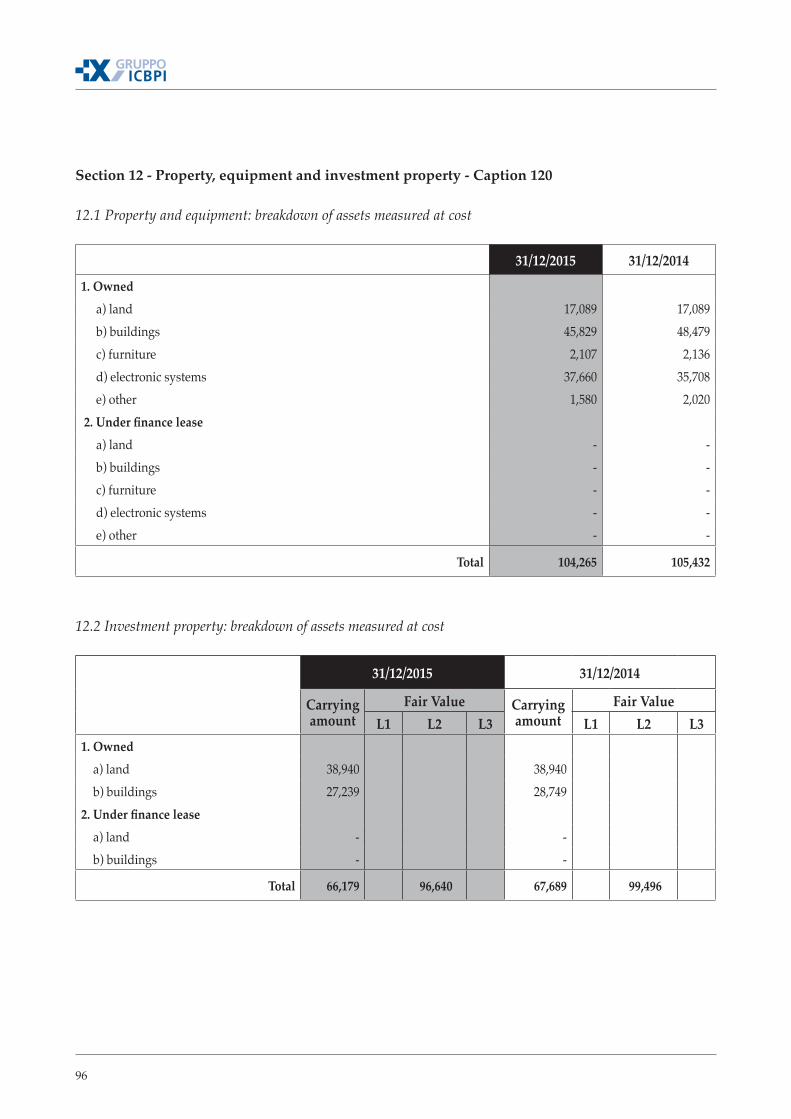
96
Section 12 - Property, equipment and investment property - Caption 120
12.1 Property and equipment: breakdown of assets measured at cost
31/12/2015 31/12/2014
1. Owned a) land 17,089 17,089 b) buildings 45,829 48,479 c) furniture 2,107 2,136 d) electronic systems 37,660 35,708 e) other 1,580 2,020
2. Under finance leasea) land - - b) buildings - - c) furniture - - d) electronic systems - - e) other - -
Total 104,265 105,432
12.2 Investment property: breakdown of assets measured at cost
31/12/2015 31/12/2014
Carrying amount
Fair Value Carrying amount
Fair ValueL1 L2 L3 L1 L2 L3
1. Owned a) land 38,940 38,940 b) buildings 27,239 28,749 2. Under finance lease a) land - - b) buildings - -
Total 66,179 96,640 67,689 99,496
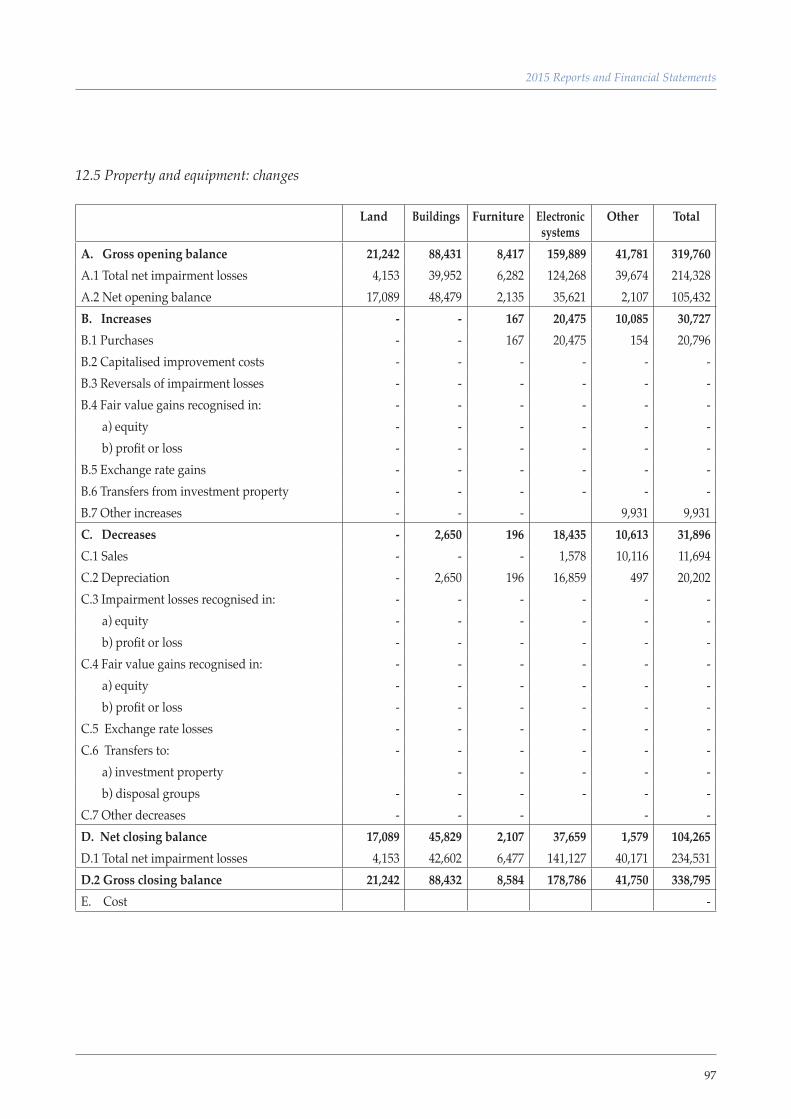
97
2015 Reports and Financial Statements
12.5 Property and equipment: changes
Land Buildings Furniture Electronic systems
Other Total
A. Gross opening balance 21,242 88,431 8,417 159,889 41,781 319,760 A.1 Total net impairment losses 4,153 39,952 6,282 124,268 39,674 214,328 A.2 Net opening balance 17,089 48,479 2,135 35,621 2,107 105,432 B. Increases - - 167 20,475 10,085 30,727 B.1 Purchases - - 167 20,475 154 20,796 B.2 Capitalised improvement costs - - - - - - B.3 Reversals of impairment losses - - - - - - B.4 Fair value gains recognised in: - - - - - - a) equity - - - - - - b) profit or loss - - - - - - B.5 Exchange rate gains - - - - - - B.6 Transfers from investment property - - - - - - B.7 Other increases - - - 9,931 9,931 C. Decreases - 2,650 196 18,435 10,613 31,896 C.1 Sales - - - 1,578 10,116 11,694 C.2 Depreciation - 2,650 196 16,859 497 20,202 C.3 Impairment losses recognised in: - - - - - - a) equity - - - - - - b) profit or loss - - - - - - C.4 Fair value gains recognised in: - - - - - - a) equity - - - - - - b) profit or loss - - - - - - C.5 Exchange rate losses - - - - - - C.6 Transfers to: - - - - - - a) investment property - - - - - b) disposal groups - - - - - - C.7 Other decreases - - - - - D. Net closing balance 17,089 45,829 2,107 37,659 1,579 104,265 D.1 Total net impairment losses 4,153 42,602 6,477 141,127 40,171 234,531 D.2 Gross closing balance 21,242 88,432 8,584 178,786 41,750 338,795 E. Cost -
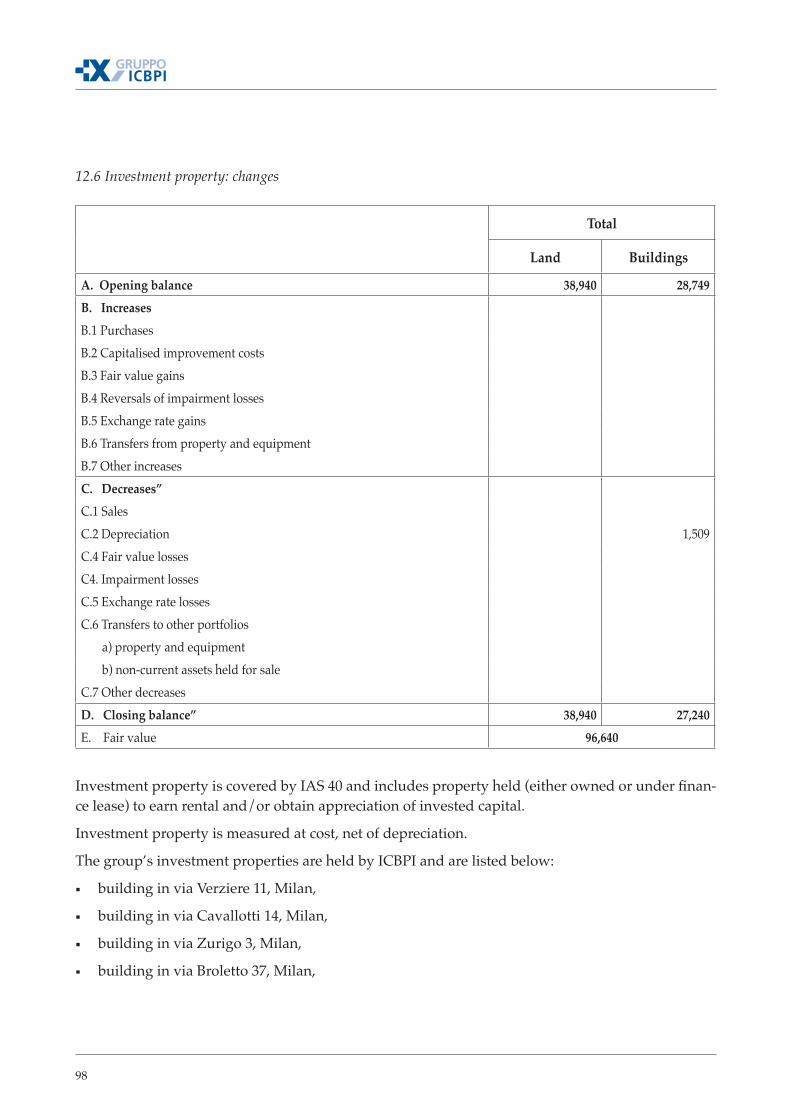
98
12.6 Investment property: changes
Total
Land Buildings
A. Opening balance 38,940 28,749 B. IncreasesB.1 PurchasesB.2 Capitalised improvement costsB.3 Fair value gainsB.4 Reversals of impairment lossesB.5 Exchange rate gainsB.6 Transfers from property and equipmentB.7 Other increasesC. Decreases”C.1 SalesC.2 Depreciation 1,509 C.4 Fair value losses C4. Impairment lossesC.5 Exchange rate lossesC.6 Transfers to other portfolios a) property and equipment b) non-current assets held for sale C.7 Other decreasesD. Closing balance” 38,940 27,240 E. Fair value 96,640
Investment property is covered by IAS 40 and includes property held (either owned or under finan-ce lease) to earn rental and/or obtain appreciation of invested capital.
Investment property is measured at cost, net of depreciation.
The group’s investment properties are held by ICBPI and are listed below:
▪ building in via Verziere 11, Milan,
▪ building in via Cavallotti 14, Milan,
▪ building in via Zurigo 3, Milan,
▪ building in via Broletto 37, Milan,
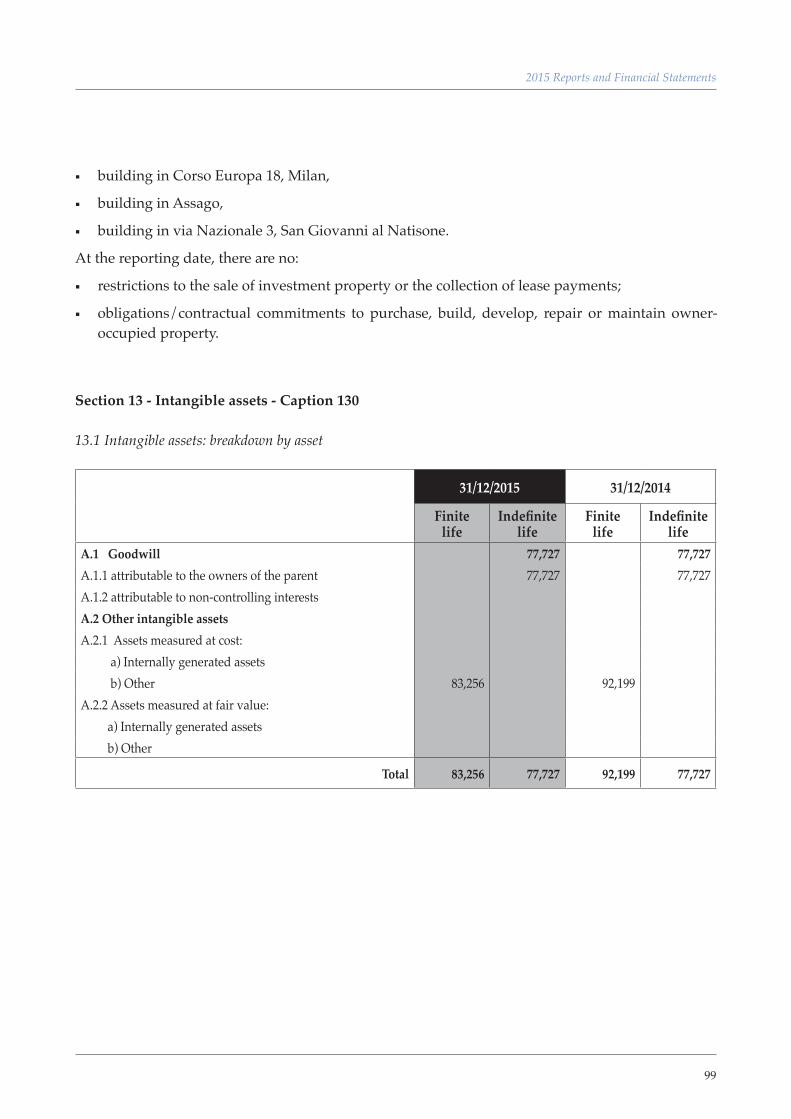
99
2015 Reports and Financial Statements
▪ building in Corso Europa 18, Milan,
▪ building in Assago,
▪ building in via Nazionale 3, San Giovanni al Natisone.
At the reporting date, there are no:
▪ restrictions to the sale of investment property or the collection of lease payments;
▪ obligations/contractual commitments to purchase, build, develop, repair or maintain owner-occupied property.
Section 13 - Intangible assets - Caption 130
13.1 Intangible assets: breakdown by asset
31/12/2015 31/12/2014
Finitelife
Indefinite life
Finitelife
Indefinite life
A.1 Goodwill 77,727 77,727A.1.1 attributable to the owners of the parent 77,727 77,727 A.1.2 attributable to non-controlling interestsA.2 Other intangible assetsA.2.1 Assets measured at cost: a) Internally generated assets b) Other 83,256 92,199 A.2.2 Assets measured at fair value: a) Internally generated assets b) Other
Total 83,256 77,727 92,199 77,727
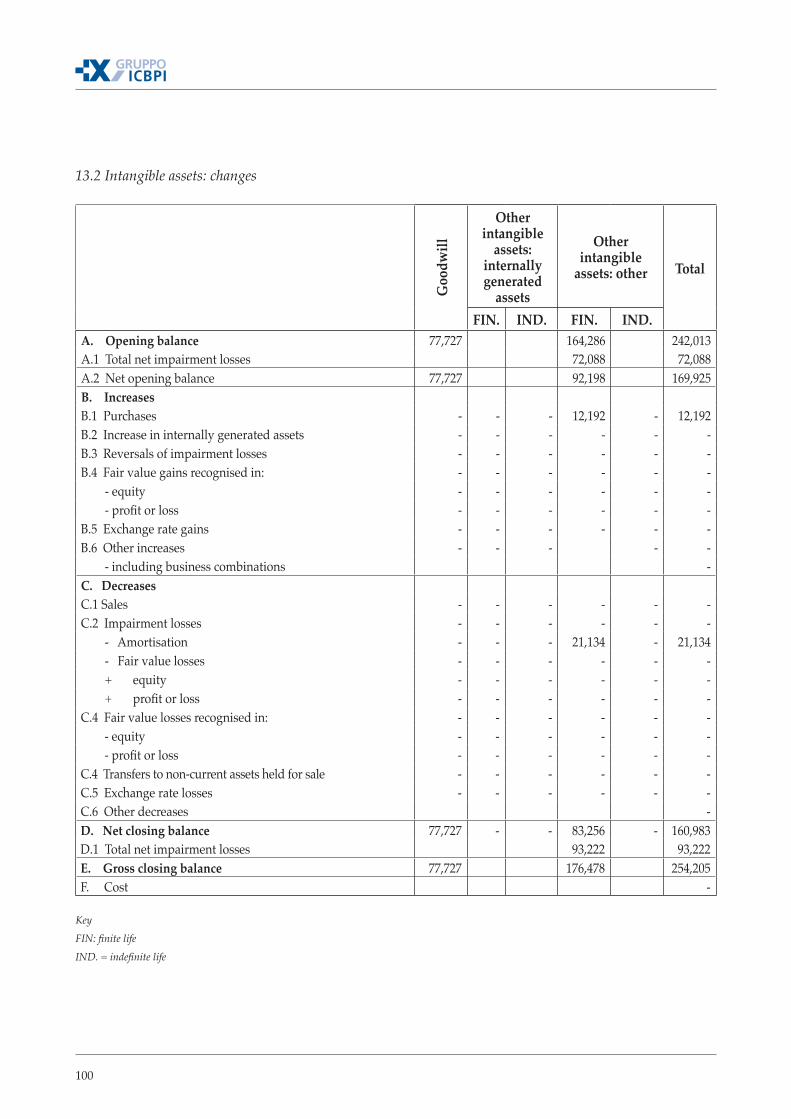
100
13.2 Intangible assets: changes
Goo
dwill
Other intangible
assets: internally generated
assets
Other intangible
assets: other Total
FIN. IND. FIN. IND.A. Opening balance 77,727 164,286 242,013 A.1 Total net impairment losses 72,088 72,088 A.2 Net opening balance 77,727 92,198 169,925 B. IncreasesB.1 Purchases - - - 12,192 - 12,192 B.2 Increase in internally generated assets - - - - - - B.3 Reversals of impairment losses - - - - - - B.4 Fair value gains recognised in: - - - - - - - equity - - - - - - - profit or loss - - - - - - B.5 Exchange rate gains - - - - - - B.6 Other increases - - - - - - including business combinations - C. DecreasesC.1 Sales - - - - - - C.2 Impairment losses - - - - - - - Amortisation - - - 21,134 - 21,134 - Fair value losses - - - - - - + equity - - - - - - + profit or loss - - - - - - C.4 Fair value losses recognised in: - - - - - - - equity - - - - - - - profit or loss - - - - - - C.4 Transfers to non-current assets held for sale - - - - - - C.5 Exchange rate losses - - - - - - C.6 Other decreases - D. Net closing balance 77,727 - - 83,256 - 160,983 D.1 Total net impairment losses 93,222 93,222 E. Gross closing balance 77,727 176,478 254,205 F. Cost -
KeyFIN: finite lifeIND. = indefinite life
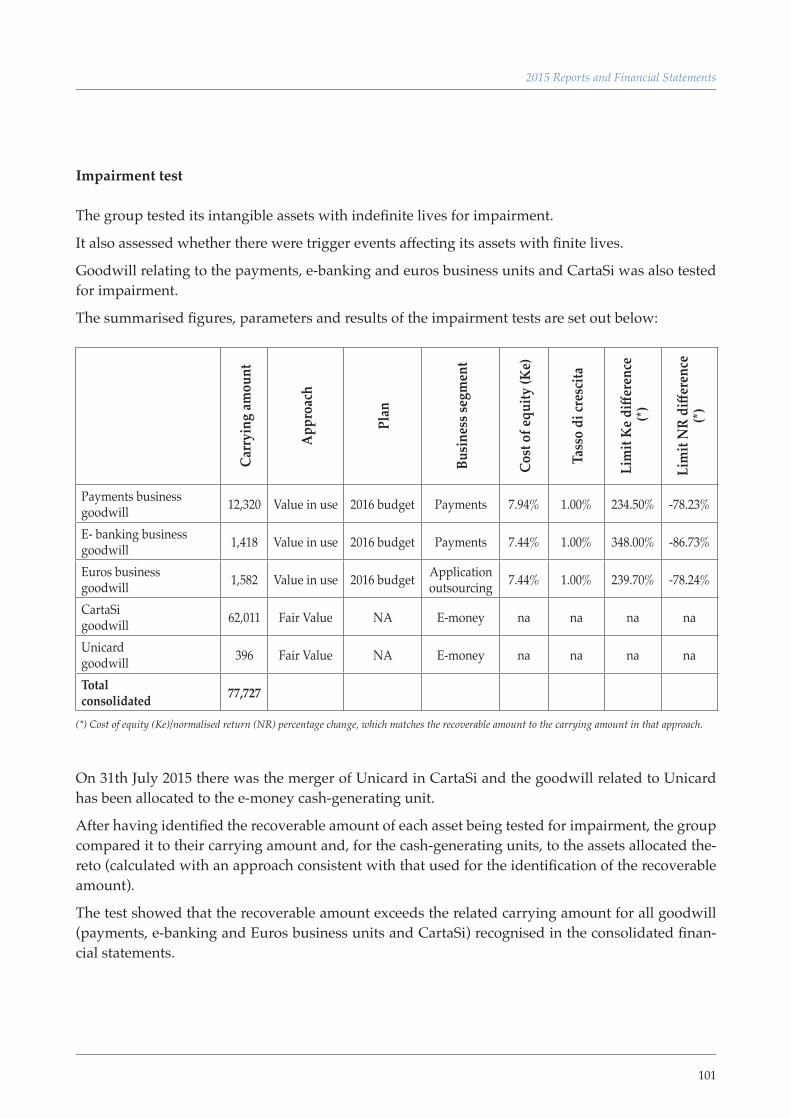
101
2015 Reports and Financial Statements
Impairment test
The group tested its intangible assets with indefinite lives for impairment.
It also assessed whether there were trigger events affecting its assets with finite lives.
Goodwill relating to the payments, e-banking and euros business units and CartaSi was also tested for impairment.
The summarised figures, parameters and results of the impairment tests are set out below:
Carr
ying
amou
nt
App
roac
h
Plan
Busi
ness
segm
ent
Cost
of e
quity
(Ke)
Tass
o di
cres
cita
Lim
it K
e diff
eren
ce (*
)
Lim
it N
R di
ffere
nce
(*)
Payments business goodwill 12,320 Value in use 2016 budget Payments 7.94% 1.00% 234.50% -78.23%
E- banking business goodwill 1,418 Value in use 2016 budget Payments 7.44% 1.00% 348.00% -86.73%
Euros business goodwill 1,582 Value in use 2016 budget Application
outsourcing 7.44% 1.00% 239.70% -78.24%
CartaSi goodwill 62,011 Fair Value NA E-money na na na na
Unicard goodwill 396 Fair Value NA E-money na na na na
Total consolidated 77,727
(*) Cost of equity (Ke)/normalised return (NR) percentage change, which matches the recoverable amount to the carrying amount in that approach.
On 31th July 2015 there was the merger of Unicard in CartaSi and the goodwill related to Unicard has been allocated to the e-money cash-generating unit.
After having identified the recoverable amount of each asset being tested for impairment, the group compared it to their carrying amount and, for the cash-generating units, to the assets allocated the-reto (calculated with an approach consistent with that used for the identification of the recoverable amount).
The test showed that the recoverable amount exceeds the related carrying amount for all goodwill (payments, e-banking and Euros business units and CartaSi) recognised in the consolidated finan-cial statements.
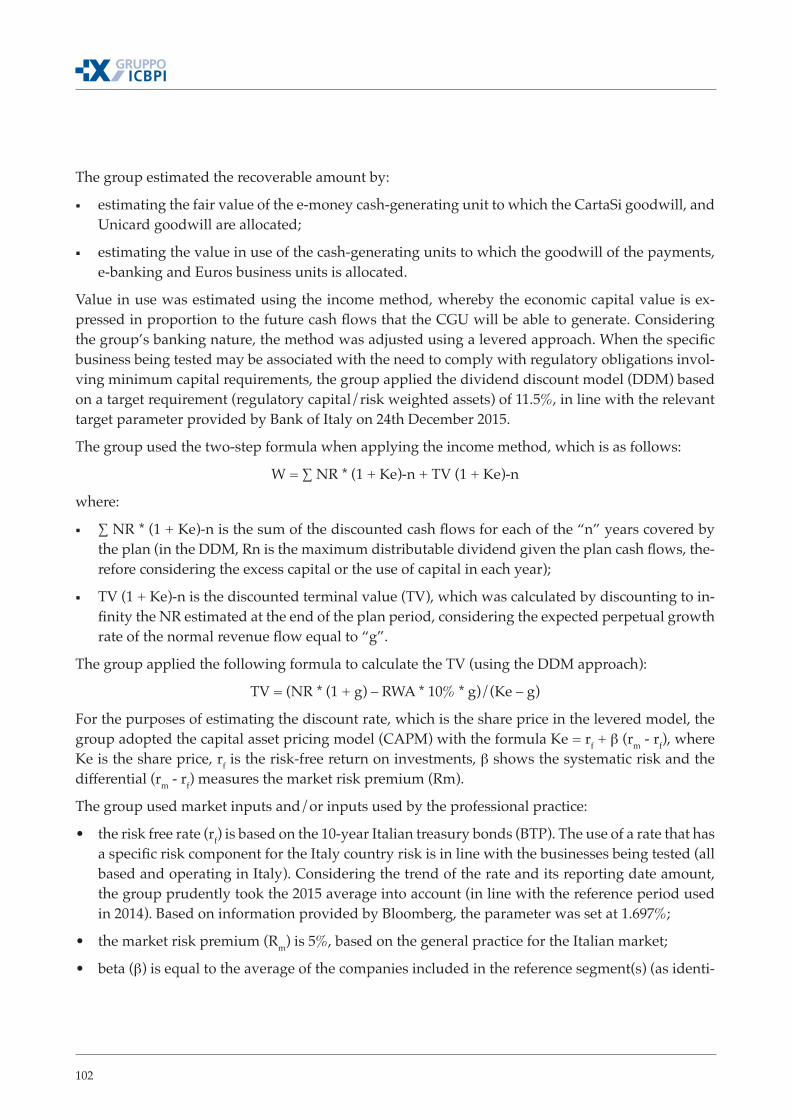
102
The group estimated the recoverable amount by:
▪ estimating the fair value of the e-money cash-generating unit to which the CartaSi goodwill, and Unicard goodwill are allocated;
▪ estimating the value in use of the cash-generating units to which the goodwill of the payments, e-banking and Euros business units is allocated.
Value in use was estimated using the income method, whereby the economic capital value is ex-pressed in proportion to the future cash flows that the CGU will be able to generate. Considering the group’s banking nature, the method was adjusted using a levered approach. When the specific business being tested may be associated with the need to comply with regulatory obligations invol-ving minimum capital requirements, the group applied the dividend discount model (DDM) based on a target requirement (regulatory capital/risk weighted assets) of 11.5%, in line with the relevant target parameter provided by Bank of Italy on 24th December 2015.
The group used the two-step formula when applying the income method, which is as follows:
W = ∑ NR * (1 + Ke)-n + TV (1 + Ke)-n
where:
▪ ∑ NR * (1 + Ke)-n is the sum of the discounted cash flows for each of the “n” years covered by the plan (in the DDM, Rn is the maximum distributable dividend given the plan cash flows, the-refore considering the excess capital or the use of capital in each year);
▪ TV (1 + Ke)-n is the discounted terminal value (TV), which was calculated by discounting to in-finity the NR estimated at the end of the plan period, considering the expected perpetual growth rate of the normal revenue flow equal to “g”.
The group applied the following formula to calculate the TV (using the DDM approach):
TV = (NR * (1 + g) – RWA * 10% * g)/(Ke – g)
For the purposes of estimating the discount rate, which is the share price in the levered model, the group adopted the capital asset pricing model (CAPM) with the formula Ke = rf + β (rm - rf), where Ke is the share price, rf is the risk-free return on investments, β shows the systematic risk and the differential (rm - rf) measures the market risk premium (Rm).
The group used market inputs and/or inputs used by the professional practice:
• the risk free rate (rf) is based on the 10-year Italian treasury bonds (BTP). The use of a rate that has a specific risk component for the Italy country risk is in line with the businesses being tested (all based and operating in Italy). Considering the trend of the rate and its reporting date amount, the group prudently took the 2015 average into account (in line with the reference period used in 2014). Based on information provided by Bloomberg, the parameter was set at 1.697%;
• the market risk premium (Rm) is 5%, based on the general practice for the Italian market;
• beta (β) is equal to the average of the companies included in the reference segment(s) (as identi-

103
2015 Reports and Financial Statements
fied through Bloomberg on 29th January 2016), identified on a case by case basis in relation to the nature of the business being tested.
Moreover, where deemed applicable in relation to the nature of the businesses being tested, as addi-tional elements for the calculation of the cost of equity (Ke), the group considered other specific risks (Rs).
The group calculated the cash flows:
▪ analytically on the basis of the figures included in 2016 budget of ICBPI Group and of its subsi-diaries approved by the board of directors of ICBPI and where applicable by the board of direc-tors of ICBPI subsidiaries;
▪ systematically, in relation to the terminal value calculated in perpetuity.
At the end of each valuation, the group carried out a sensitivity analysis in order to show:
▪ that the CGU’s recoverable amount exceeded its carrying amount;
▪ the value assigned to the underlying assumptions;
▪ the percentage difference between the rate used to discount cash flows, which makes the CGU’s recoverable amount equal to the carrying amount of goodwill, and the rate used to calculate va-lue in use.
The “Limit Ke difference” and “Limit NR difference” columns of the table set out earlier show the re-sults of the sensitivity analysis carried out to check the relationship between the change in the CGU’s value in use and in the discount rate (Ke) and normalised return (NR) that were used as a basis to calculate the terminal value.
The recoverable amount of the e-money CGU, operating through CartaSi and Help Line, was calcu-lated as follows:
▪ the fair value of the CartaSi component was measured by reference to the price of a recent tran-saction between knowledgeable parties in an arm’s length transaction;
▪ considering its relevance for the CGU’s organisation and the lack of recent transactions from which its fair value might be inferred, the Help Line component was prudently considered at the amount of its reported equity.
The resulting amount was reduced to account for the expected disposal costs, calculated on a lump-sum and prudent basis compared to the group’s experience.
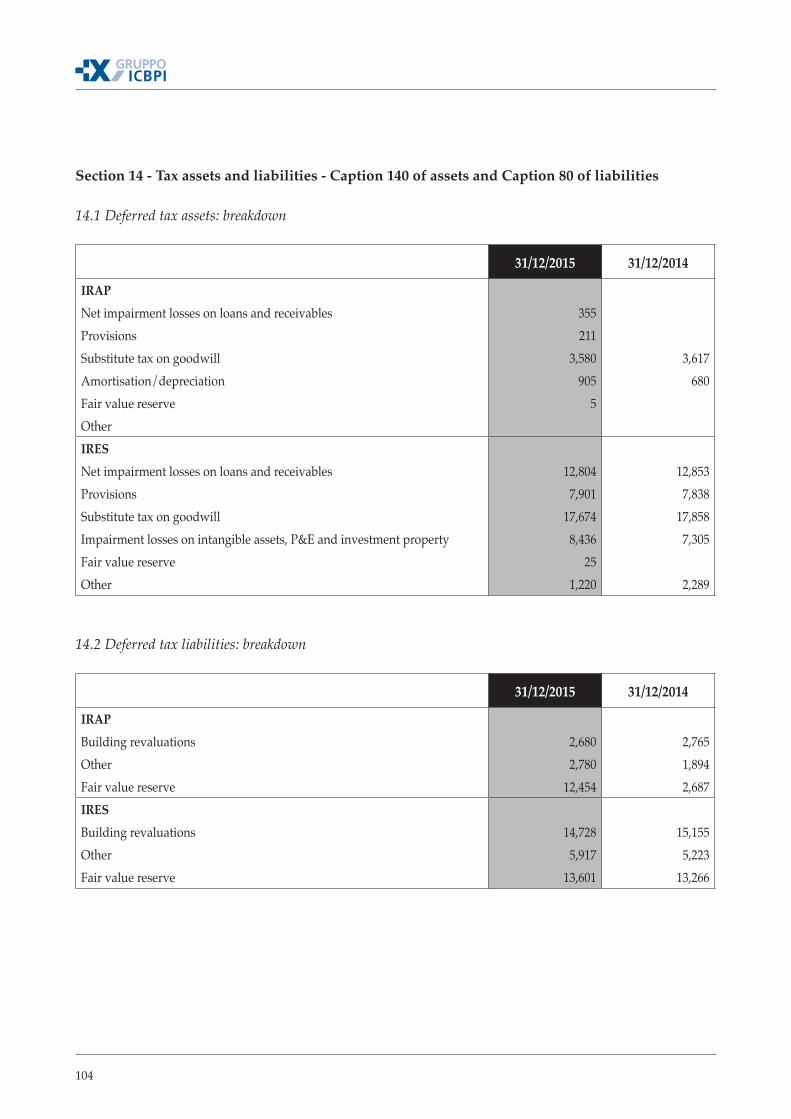
104
Section 14 - Tax assets and liabilities - Caption 140 of assets and Caption 80 of liabilities
14.1 Deferred tax assets: breakdown
31/12/2015 31/12/2014
IRAPNet impairment losses on loans and receivables 355 Provisions 211 Substitute tax on goodwill 3,580 3,617 Amortisation/depreciation 905 680 Fair value reserve 5 OtherIRESNet impairment losses on loans and receivables 12,804 12,853 Provisions 7,901 7,838 Substitute tax on goodwill 17,674 17,858 Impairment losses on intangible assets, P&E and investment property 8,436 7,305 Fair value reserve 25 Other 1,220 2,289
14.2 Deferred tax liabilities: breakdown
31/12/2015 31/12/2014
IRAPBuilding revaluations 2,680 2,765 Other 2,780 1,894 Fair value reserve 12,454 2,687 IRESBuilding revaluations 14,728 15,155 Other 5,917 5,223 Fair value reserve 13,601 13,266
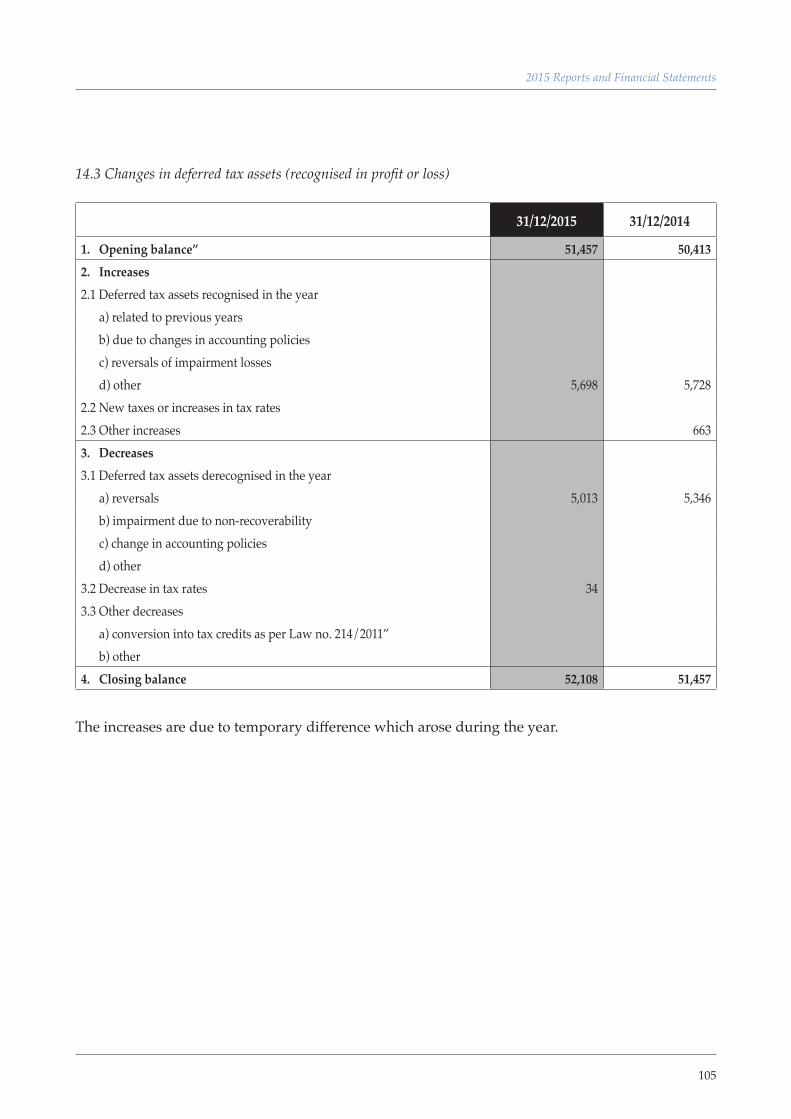
105
2015 Reports and Financial Statements
14.3 Changes in deferred tax assets (recognised in profit or loss)
31/12/2015 31/12/2014
1. Opening balance” 51,457 50,413 2. Increases2.1 Deferred tax assets recognised in the year a) related to previous years b) due to changes in accounting policies c) reversals of impairment losses d) other 5,698 5,728 2.2 New taxes or increases in tax rates2.3 Other increases 6633. Decreases3.1 Deferred tax assets derecognised in the year a) reversals 5,013 5,346 b) impairment due to non-recoverability c) change in accounting policies d) other3.2 Decrease in tax rates 34 3.3 Other decreases a) conversion into tax credits as per Law no. 214/2011” b) other4. Closing balance 52,108 51,457
The increases are due to temporary difference which arose during the year.
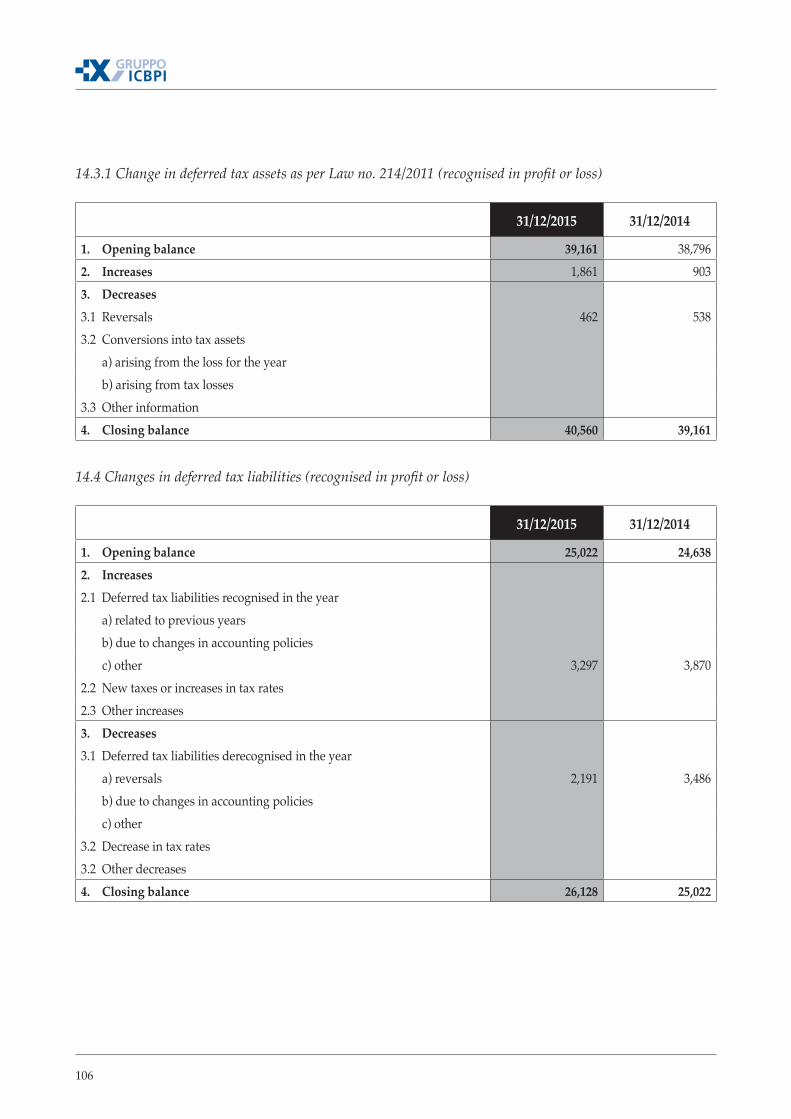
106
14.3.1 Change in deferred tax assets as per Law no. 214/2011 (recognised in profit or loss)
31/12/2015 31/12/2014
1. Opening balance 39,161 38,796 2. Increases 1,861 903 3. Decreases3.1 Reversals 462 5383.2 Conversions into tax assets a) arising from the loss for the year b) arising from tax losses3.3 Other information4. Closing balance 40,560 39,161
14.4 Changes in deferred tax liabilities (recognised in profit or loss)
31/12/2015 31/12/2014
1. Opening balance 25,022 24,638 2. Increases2.1 Deferred tax liabilities recognised in the year a) related to previous years b) due to changes in accounting policies c) other 3,297 3,870 2.2 New taxes or increases in tax rates2.3 Other increases3. Decreases3.1 Deferred tax liabilities derecognised in the year a) reversals 2,191 3,486 b) due to changes in accounting policies c) other3.2 Decrease in tax rates3.2 Other decreases4. Closing balance 26,128 25,022
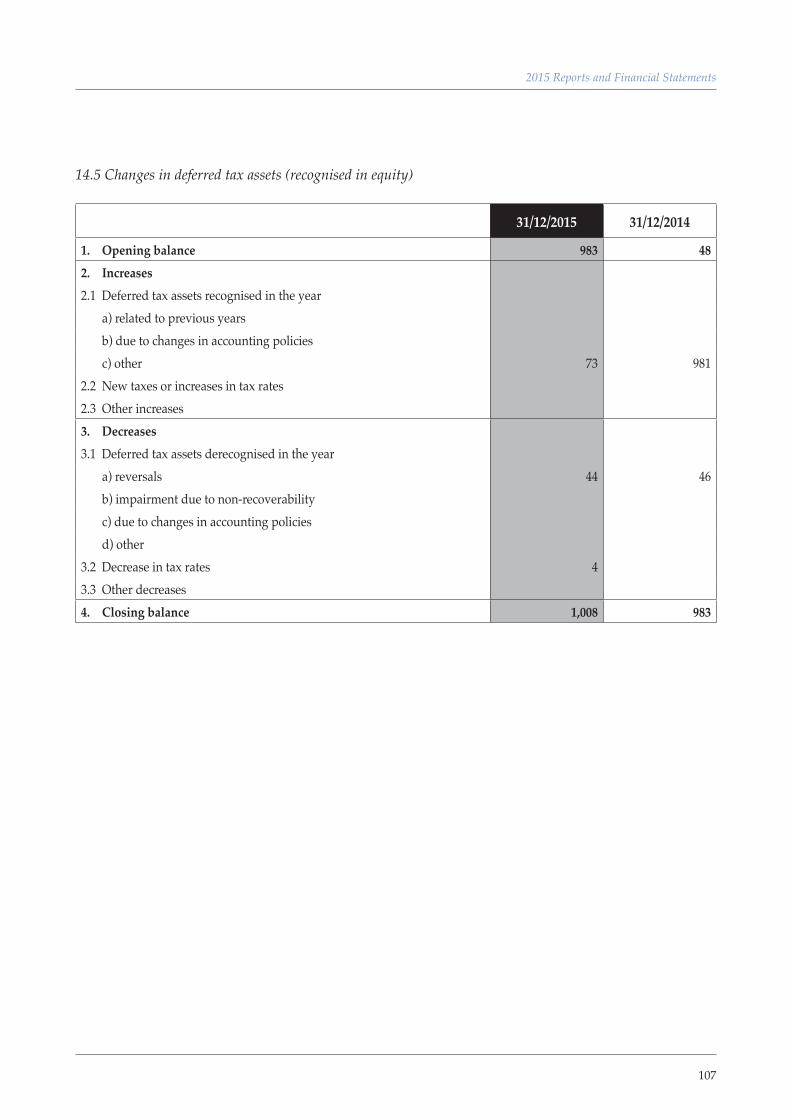
107
2015 Reports and Financial Statements
14.5 Changes in deferred tax assets (recognised in equity)
31/12/2015 31/12/2014
1. Opening balance 983 48 2. Increases2.1 Deferred tax assets recognised in the year a) related to previous years b) due to changes in accounting policies c) other 73 9812.2 New taxes or increases in tax rates2.3 Other increases 3. Decreases3.1 Deferred tax assets derecognised in the year a) reversals 44 46 b) impairment due to non-recoverability c) due to changes in accounting policies d) other3.2 Decrease in tax rates 4 3.3 Other decreases 4. Closing balance 1,008 983
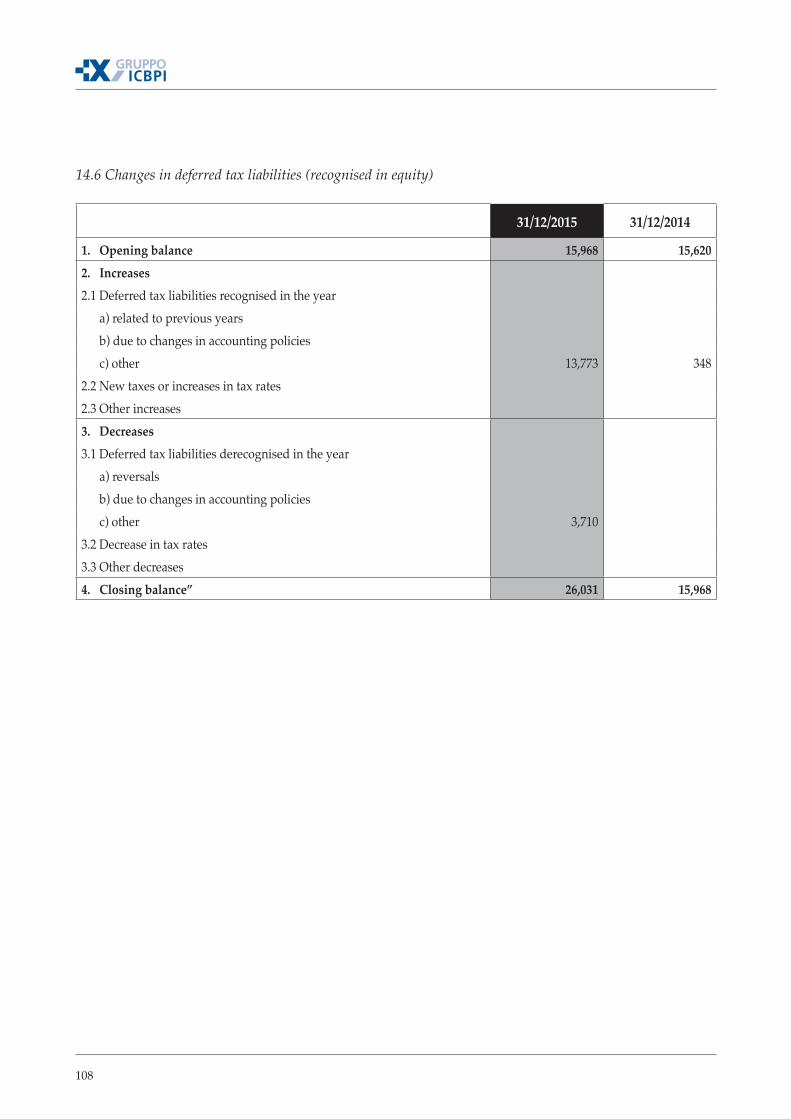
108
14.6 Changes in deferred tax liabilities (recognised in equity)
31/12/2015 31/12/2014
1. Opening balance 15,968 15,620 2. Increases2.1 Deferred tax liabilities recognised in the year a) related to previous years b) due to changes in accounting policies c) other 13,773 348 2.2 New taxes or increases in tax rates2.3 Other increases 3. Decreases3.1 Deferred tax liabilities derecognised in the year a) reversals b) due to changes in accounting policies c) other 3,710 3.2 Decrease in tax rates3.3 Other decreases 4. Closing balance” 26,031 15,968
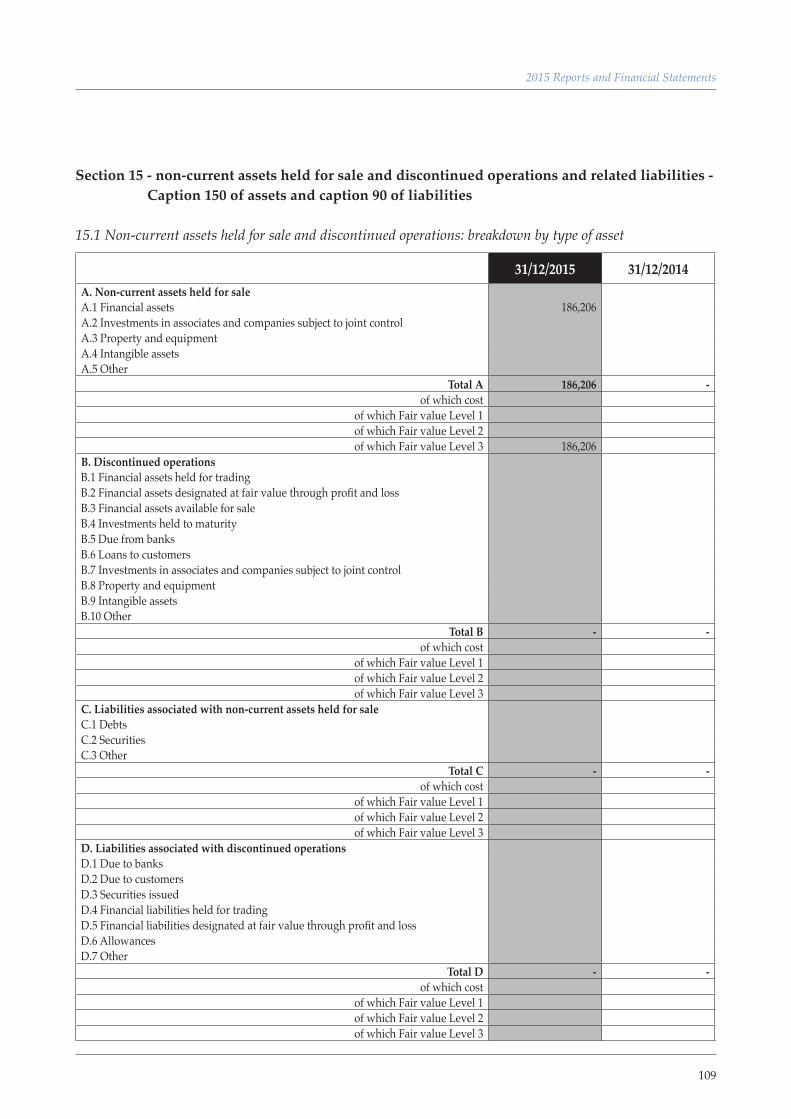
109
2015 Reports and Financial Statements
Section 15 - non-current assets held for sale and discontinued operations and related liabilities - Caption 150 of assets and caption 90 of liabilities
15.1 Non-current assets held for sale and discontinued operations: breakdown by type of asset
31/12/2015 31/12/2014A. Non-current assets held for saleA.1 Financial assets 186,206 A.2 Investments in associates and companies subject to joint controlA.3 Property and equipmentA.4 Intangible assetsA.5 Other
Total A 186,206 - of which cost
of which Fair value Level 1of which Fair value Level 2of which Fair value Level 3 186,206
B. Discontinued operationsB.1 Financial assets held for tradingB.2 Financial assets designated at fair value through profit and lossB.3 Financial assets available for saleB.4 Investments held to maturityB.5 Due from banksB.6 Loans to customersB.7 Investments in associates and companies subject to joint controlB.8 Property and equipmentB.9 Intangible assetsB.10 Other
Total B - - of which cost
of which Fair value Level 1of which Fair value Level 2of which Fair value Level 3
C. Liabilities associated with non-current assets held for saleC.1 DebtsC.2 SecuritiesC.3 Other
Total C - - of which cost
of which Fair value Level 1of which Fair value Level 2of which Fair value Level 3
D. Liabilities associated with discontinued operationsD.1 Due to banksD.2 Due to customersD.3 Securities issuedD.4 Financial liabilities held for tradingD.5 Financial liabilities designated at fair value through profit and lossD.6 AllowancesD.7 Other
Total D - - of which cost
of which Fair value Level 1of which Fair value Level 2of which Fair value Level 3
110
The Icbpi Group has classified in the statement of financial position at 31 December 2015, the mem-bership in Visa Europe Ltd, before issued in available for sale financial assets.
In particular:
▪ the asset is identified by not listed equity in Visa Europe Ltd assigned to CartaSi as a principal member
▪ in consequence of the acquisition of Visa Europe by Visa Inc the membership has been reclassi-fied in the Non current assets held for sale and discontinued operations; Visa Inc has concluded the agreement for the acquisition of Visa Ltd; this merger has been approved by the board of Directors
▪ for the definition of the economic value of the merger, the due diligence phase started. This phase should close the transaction within 30 June 2016.
▪ according to Ifrs 5 the membership in Visa Europe Ltd has been valued at fair value. The parteci-pation and the valuation reserves have been reclassified in Non-current assets held for sale and discontinued operations.
▪ the participation is unlisted and it has been valued at level 3 fair value, considering all the infor-mations available at 31 December 2015.
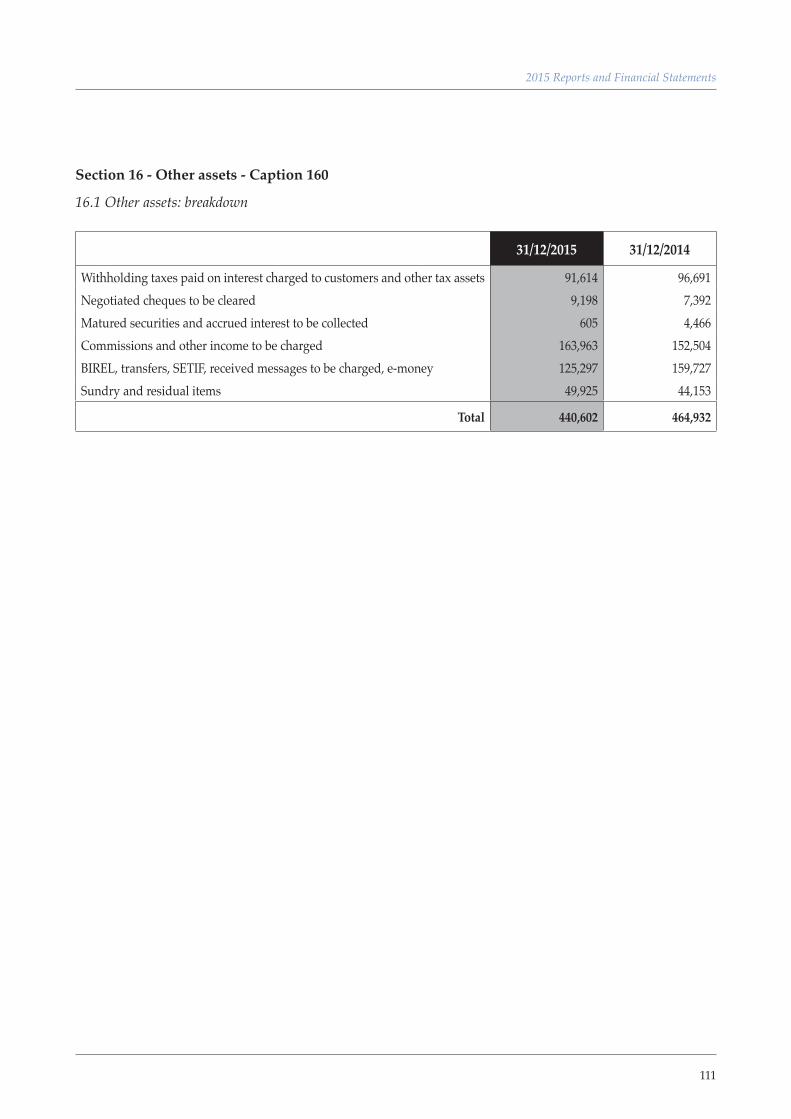
111
2015 Reports and Financial Statements
Section 16 - Other assets - Caption 160
16.1 Other assets: breakdown
31/12/2015 31/12/2014
Withholding taxes paid on interest charged to customers and other tax assets 91,614 96,691 Negotiated cheques to be cleared 9,198 7,392 Matured securities and accrued interest to be collected 605 4,466 Commissions and other income to be charged 163,963 152,504 BIREL, transfers, SETIF, received messages to be charged, e-money 125,297 159,727 Sundry and residual items 49,925 44,153
Total 440,602 464,932
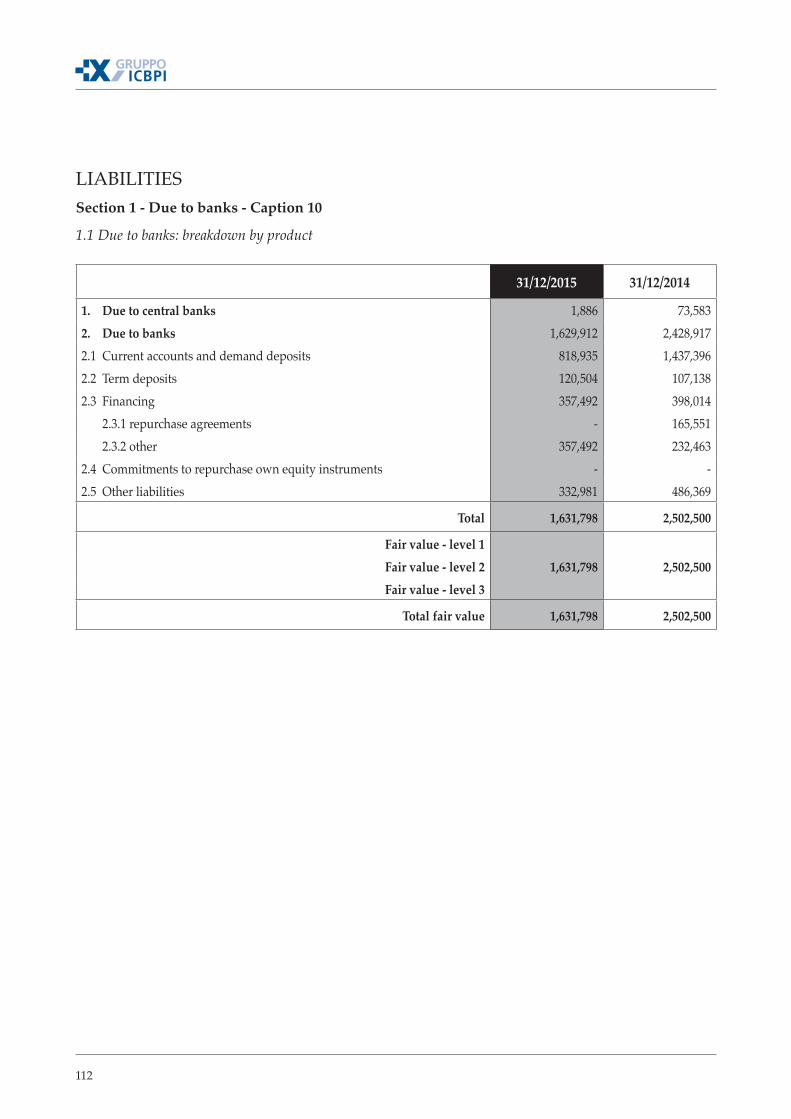
112
LIABILITIESSection 1 - Due to banks - Caption 10
1.1 Due to banks: breakdown by product
31/12/2015 31/12/2014
1. Due to central banks 1,886 73,583 2. Due to banks 1,629,912 2,428,917 2.1 Current accounts and demand deposits 818,935 1,437,396 2.2 Term deposits 120,504 107,138 2.3 Financing 357,492 398,014 2.3.1 repurchase agreements - 165,551 2.3.2 other 357,492 232,463 2.4 Commitments to repurchase own equity instruments - - 2.5 Other liabilities 332,981 486,369
Total 1,631,798 2,502,500
Fair value - level 1Fair value - level 2 1,631,798 2,502,500 Fair value - level 3
Total fair value 1,631,798 2,502,500
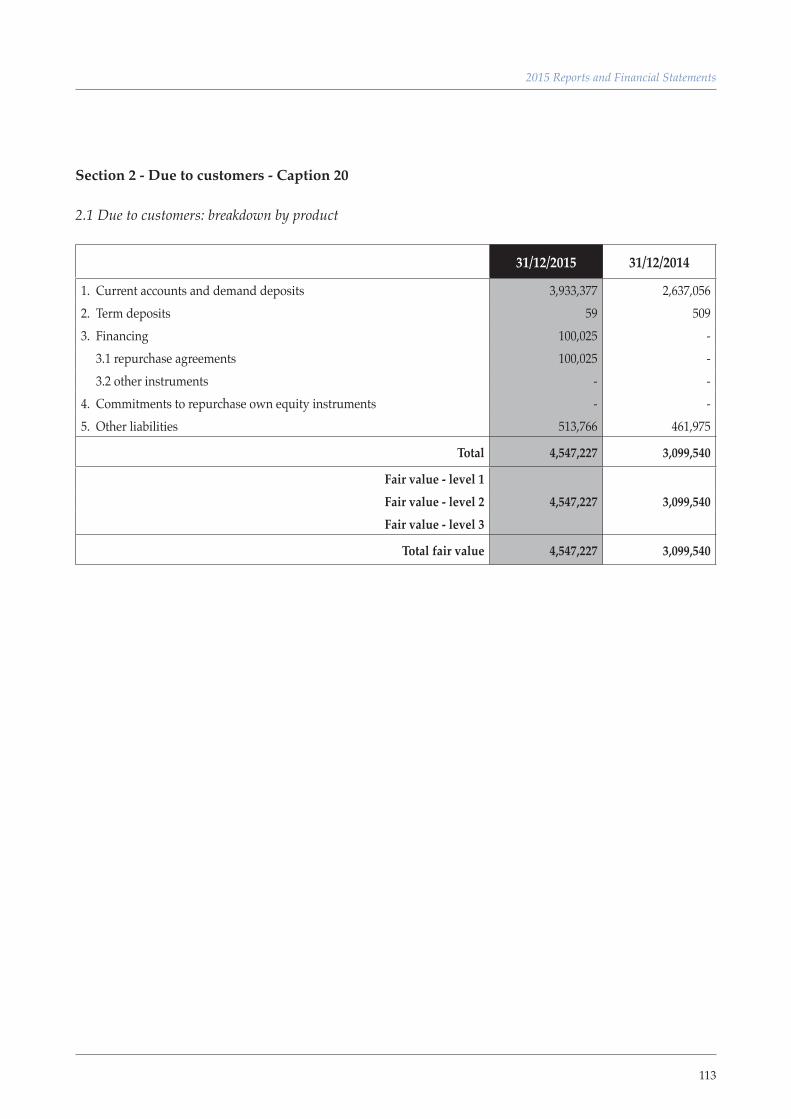
113
2015 Reports and Financial Statements
Section 2 - Due to customers - Caption 20
2.1 Due to customers: breakdown by product
31/12/2015 31/12/2014
1. Current accounts and demand deposits 3,933,377 2,637,056 2. Term deposits 59 509 3. Financing 100,025 - 3.1 repurchase agreements 100,025 - 3.2 other instruments - - 4. Commitments to repurchase own equity instruments - - 5. Other liabilities 513,766 461,975
Total 4,547,227 3,099,540
Fair value - level 1Fair value - level 2 4,547,227 3,099,540 Fair value - level 3
Total fair value 4,547,227 3,099,540
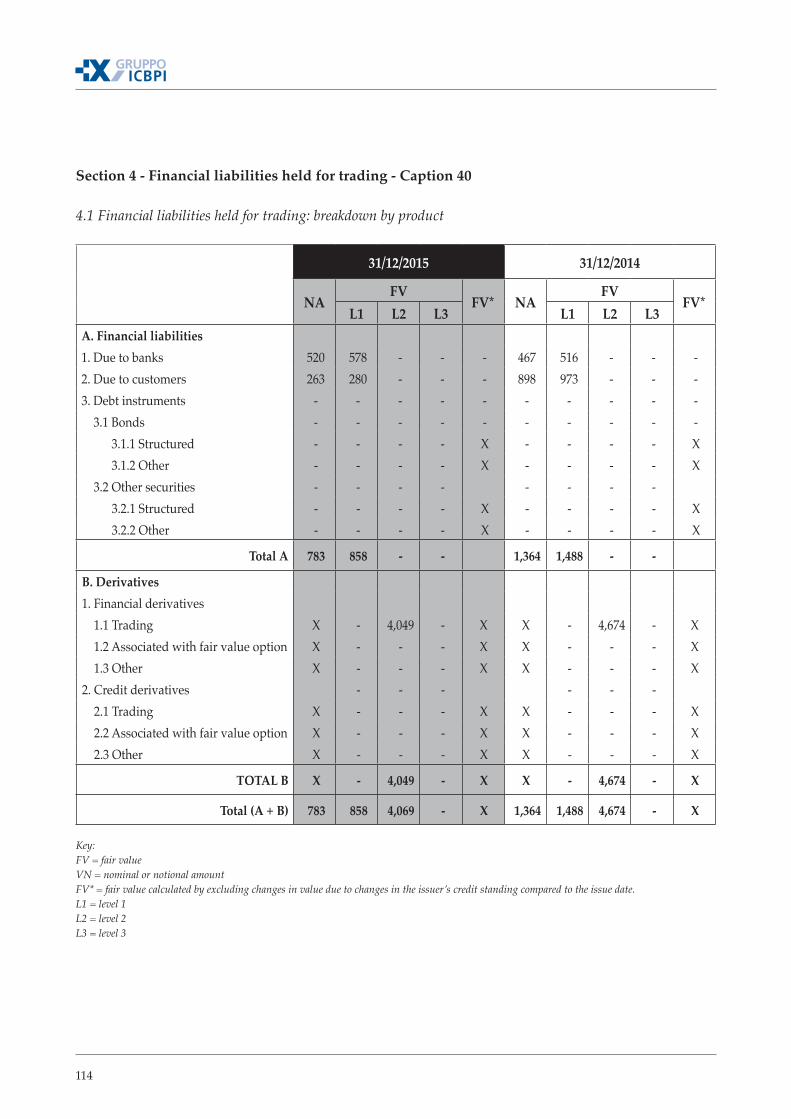
114
Section 4 - Financial liabilities held for trading - Caption 40
4.1 Financial liabilities held for trading: breakdown by product
31/12/2015 31/12/2014
NAFV
FV* NAFV
FV*L1 L2 L3 L1 L2 L3
A. Financial liabilities1. Due to banks 520 578 - - - 467 516 - - - 2. Due to customers 263 280 - - - 898 973 - - - 3. Debt instruments - - - - - - - - - - 3.1 Bonds - - - - - - - - - - 3.1.1 Structured - - - - X - - - - X 3.1.2 Other - - - - X - - - - X 3.2 Other securities - - - - - - - - 3.2.1 Structured - - - - X - - - - X 3.2.2 Other - - - - X - - - - X
Total A 783 858 - - 1,364 1,488 - -
B. Derivatives1. Financial derivatives 1.1 Trading X - 4,049 - X X - 4,674 - X 1.2 Associated with fair value option X - - - X X - - - X 1.3 Other X - - - X X - - - X2. Credit derivatives - - - - - - 2.1 Trading X - - - X X - - - X 2.2 Associated with fair value option X - - - X X - - - X 2.3 Other X - - - X X - - - X
TOTAL B X - 4,049 - X X - 4,674 - X
Total (A + B) 783 858 4,069 - X 1,364 1,488 4,674 - X
Key:FV = fair valueVN = nominal or notional amountFV* = fair value calculated by excluding changes in value due to changes in the issuer’s credit standing compared to the issue date.L1 = level 1L2 = level 2L3 = level 3
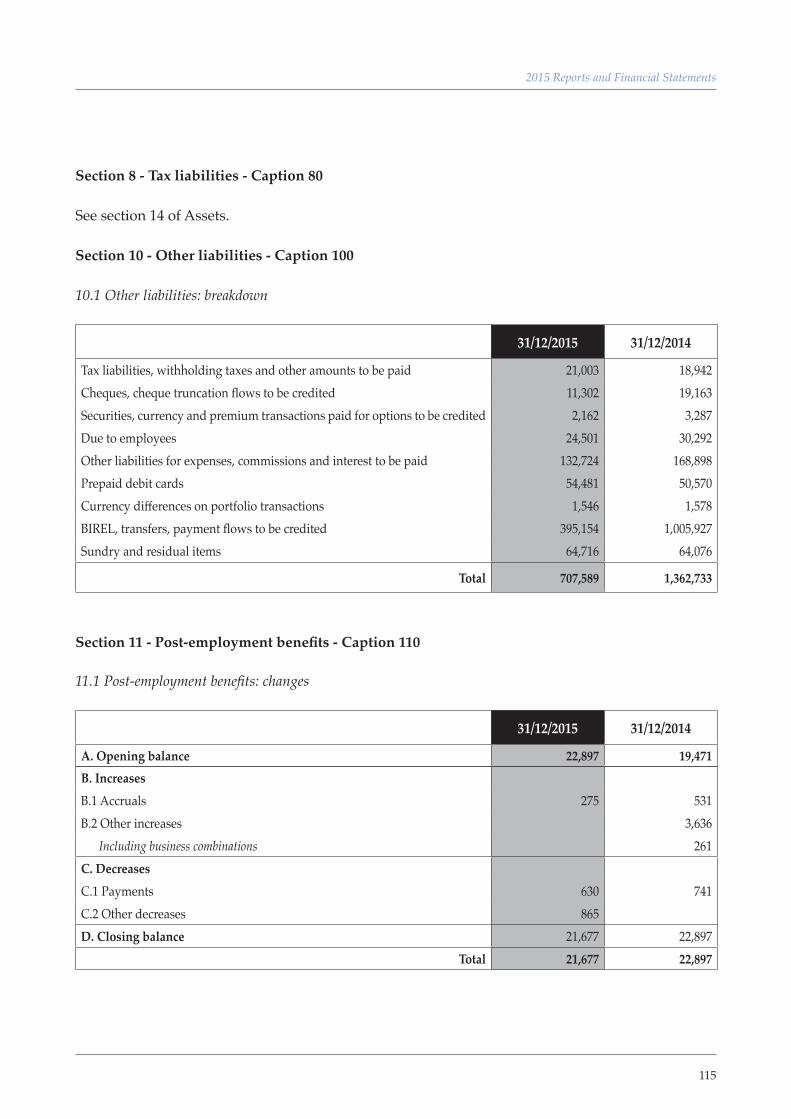
115
2015 Reports and Financial Statements
Section 8 - Tax liabilities - Caption 80
See section 14 of Assets.
Section 10 - Other liabilities - Caption 100
10.1 Other liabilities: breakdown
31/12/2015 31/12/2014
Tax liabilities, withholding taxes and other amounts to be paid 21,003 18,942 Cheques, cheque truncation flows to be credited 11,302 19,163 Securities, currency and premium transactions paid for options to be credited 2,162 3,287 Due to employees 24,501 30,292 Other liabilities for expenses, commissions and interest to be paid 132,724 168,898 Prepaid debit cards 54,481 50,570 Currency differences on portfolio transactions 1,546 1,578 BIREL, transfers, payment flows to be credited 395,154 1,005,927 Sundry and residual items 64,716 64,076
Total 707,589 1,362,733
Section 11 - Post-employment benefits - Caption 110
11.1 Post-employment benefits: changes
31/12/2015 31/12/2014
A. Opening balance 22,897 19,471 B. IncreasesB.1 Accruals 275 531 B.2 Other increases 3,636 Including business combinations 261 C. Decreases C.1 Payments 630 741 C.2 Other decreases 865 D. Closing balance 21,677 22,897
Total 21,677 22,897
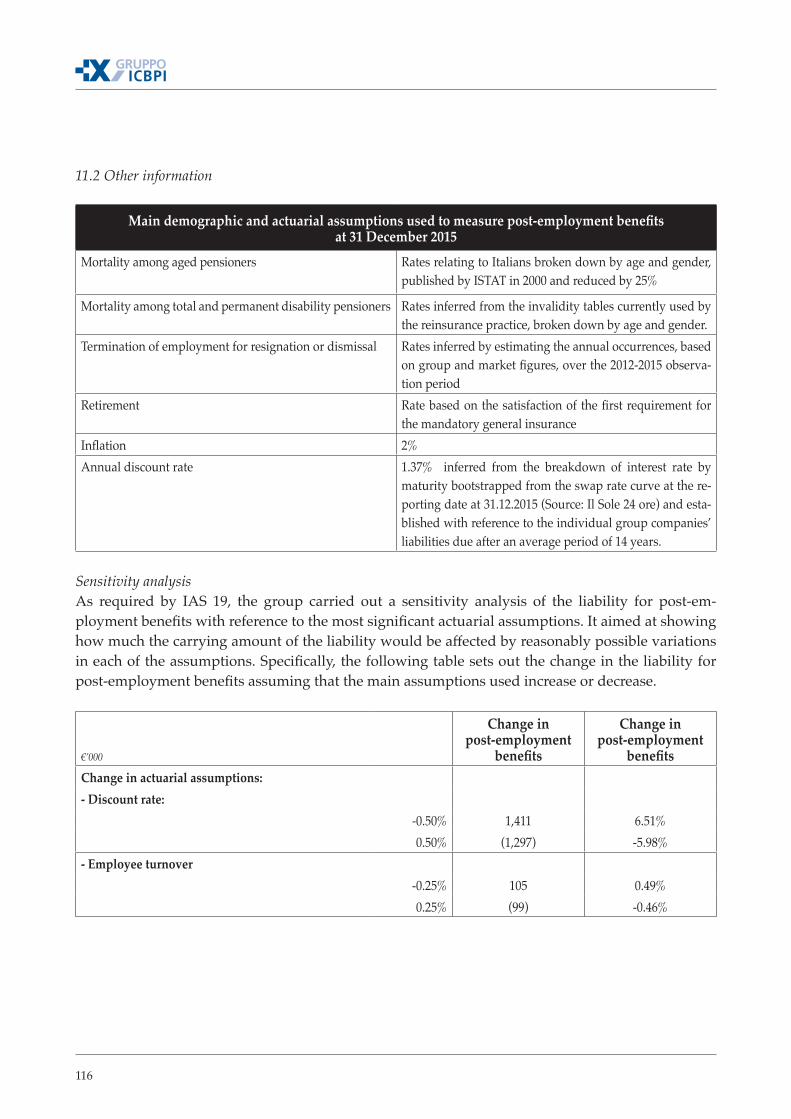
116
11.2 Other information
Main demographic and actuarial assumptions used to measure post-employment benefits at 31 December 2015
Mortality among aged pensioners Rates relating to Italians broken down by age and gender, published by ISTAT in 2000 and reduced by 25%
Mortality among total and permanent disability pensioners Rates inferred from the invalidity tables currently used by the reinsurance practice, broken down by age and gender.
Termination of employment for resignation or dismissal Rates inferred by estimating the annual occurrences, based on group and market figures, over the 2012-2015 observa-tion period
Retirement Rate based on the satisfaction of the first requirement for the mandatory general insurance
Inflation 2%Annual discount rate 1.37% inferred from the breakdown of interest rate by
maturity bootstrapped from the swap rate curve at the re-porting date at 31.12.2015 (Source: Il Sole 24 ore) and esta-blished with reference to the individual group companies’ liabilities due after an average period of 14 years.
Sensitivity analysisAs required by IAS 19, the group carried out a sensitivity analysis of the liability for post-em-ployment benefits with reference to the most significant actuarial assumptions. It aimed at showing how much the carrying amount of the liability would be affected by reasonably possible variations in each of the assumptions. Specifically, the following table sets out the change in the liability for post-employment benefits assuming that the main assumptions used increase or decrease.
€’000
Change in post-employment
benefits
Change in post-employment
benefits Change in actuarial assumptions:- Discount rate:
-0.50% 1,411 6.51% 0.50% (1,297) -5.98%
- Employee turnover-0.25% 105 0.49% 0.25% (99) -0.46%
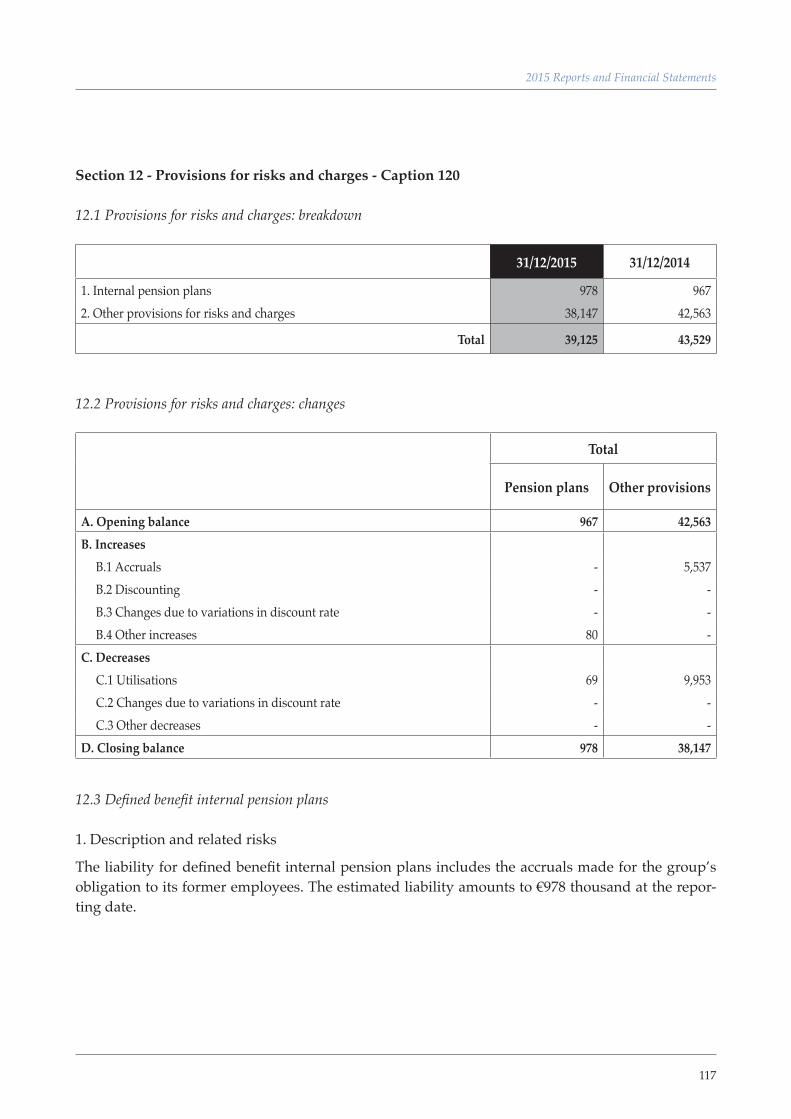
117
2015 Reports and Financial Statements
Section 12 - Provisions for risks and charges - Caption 120
12.1 Provisions for risks and charges: breakdown
31/12/2015 31/12/2014
1. Internal pension plans 978 967 2. Other provisions for risks and charges 38,147 42,563
Total 39,125 43,529
12.2 Provisions for risks and charges: changes
Total
Pension plans Other provisions
A. Opening balance 967 42,563 B. Increases B.1 Accruals - 5,537 B.2 Discounting - - B.3 Changes due to variations in discount rate - - B.4 Other increases 80 - C. Decreases C.1 Utilisations 69 9,953 C.2 Changes due to variations in discount rate - - C.3 Other decreases - - D. Closing balance 978 38,147
12.3 Defined benefit internal pension plans
1. Description and related risks
The liability for defined benefit internal pension plans includes the accruals made for the group’s obligation to its former employees. The estimated liability amounts to €978 thousand at the repor-ting date.
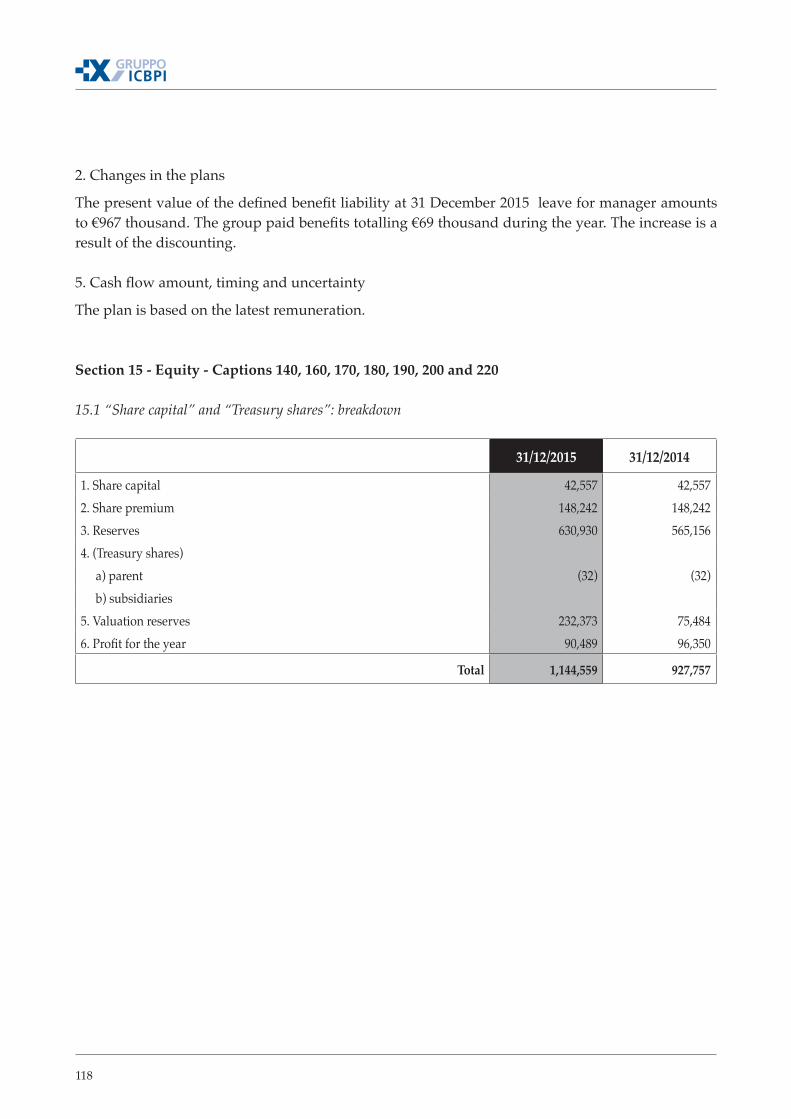
118
2. Changes in the plans
The present value of the defined benefit liability at 31 December 2015 leave for manager amounts to €967 thousand. The group paid benefits totalling €69 thousand during the year. The increase is a result of the discounting.
5. Cash flow amount, timing and uncertainty
The plan is based on the latest remuneration.
Section 15 - Equity - Captions 140, 160, 170, 180, 190, 200 and 220 15.1 “Share capital” and “Treasury shares”: breakdown
31/12/2015 31/12/2014
1. Share capital 42,557 42,557 2. Share premium 148,242 148,242 3. Reserves 630,930 565,156 4. (Treasury shares) a) parent (32) (32) b) subsidiaries5. Valuation reserves 232,373 75,484 6. Profit for the year 90,489 96,350
Total 1,144,559 927,757
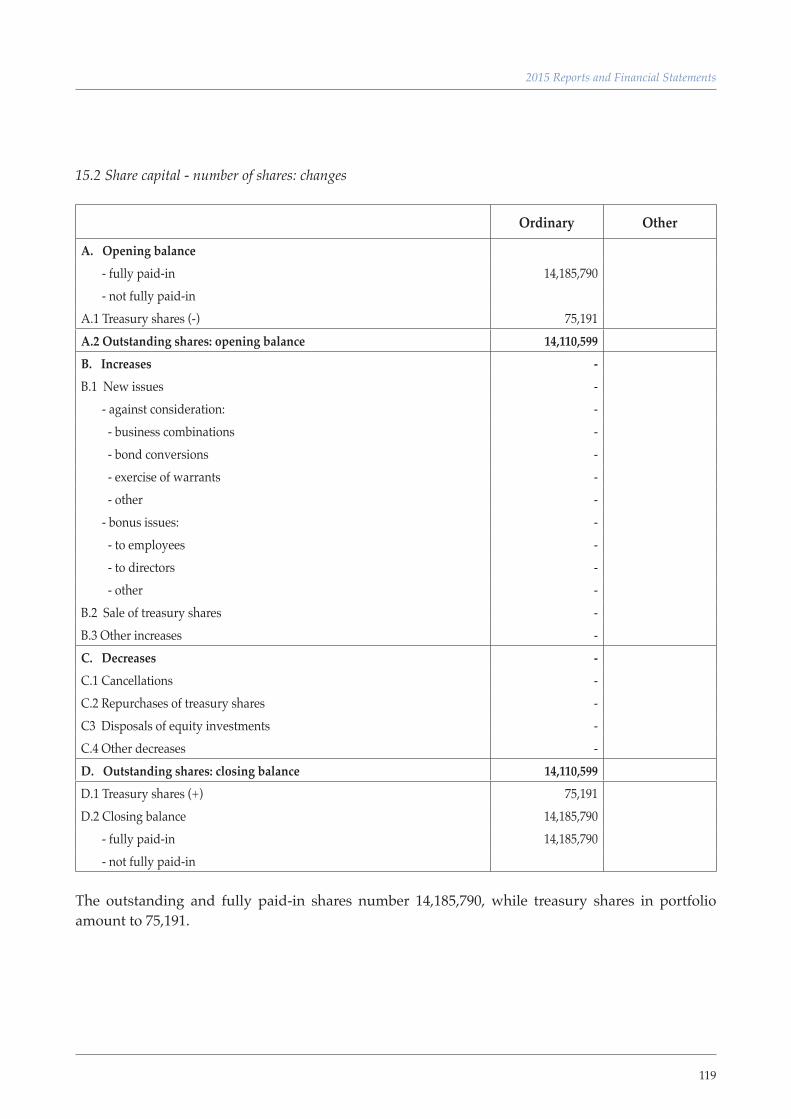
119
2015 Reports and Financial Statements
15.2 Share capital - number of shares: changes
Ordinary Other
A. Opening balance - fully paid-in 14,185,790 - not fully paid-in A.1 Treasury shares (-) 75,191 A.2 Outstanding shares: opening balance 14,110,599 B. Increases - B.1 New issues - - against consideration: - - business combinations - - bond conversions - - exercise of warrants - - other - - bonus issues: - - to employees - - to directors - - other - B.2 Sale of treasury shares - B.3 Other increases - C. Decreases - C.1 Cancellations - C.2 Repurchases of treasury shares - C3 Disposals of equity investments - C.4 Other decreases - D. Outstanding shares: closing balance 14,110,599 D.1 Treasury shares (+) 75,191 D.2 Closing balance 14,185,790 - fully paid-in 14,185,790 - not fully paid-in
The outstanding and fully paid-in shares number 14,185,790, while treasury shares in portfolio amount to 75,191.

120
Section 16 - Equity attributable to non-controlling interests - Caption 210 16.1 Caption 210 “Equity attributable to non-controlling interests”
31/12/2015 31/12/2014
Investments in consolidated companies with significant non-controlling interests:Help Line 3,218 2,480 CartaSi 22,415 27,280
Total 25,633 29,760
16.2 Equity instruments: breakdown and changes
31/12/2015 31/12/2014
1. Share capital 2,488 3,830 2. Share premium 114 168 3. Reserves 12,769 22,614 4. (Treasury shares) - - 5. Valuation reserves 5,545 -108 6. Equity instruments - - 7. Profit for the year attributable to non-controlling interests 4,717 3,257
Total 25,633 29,760
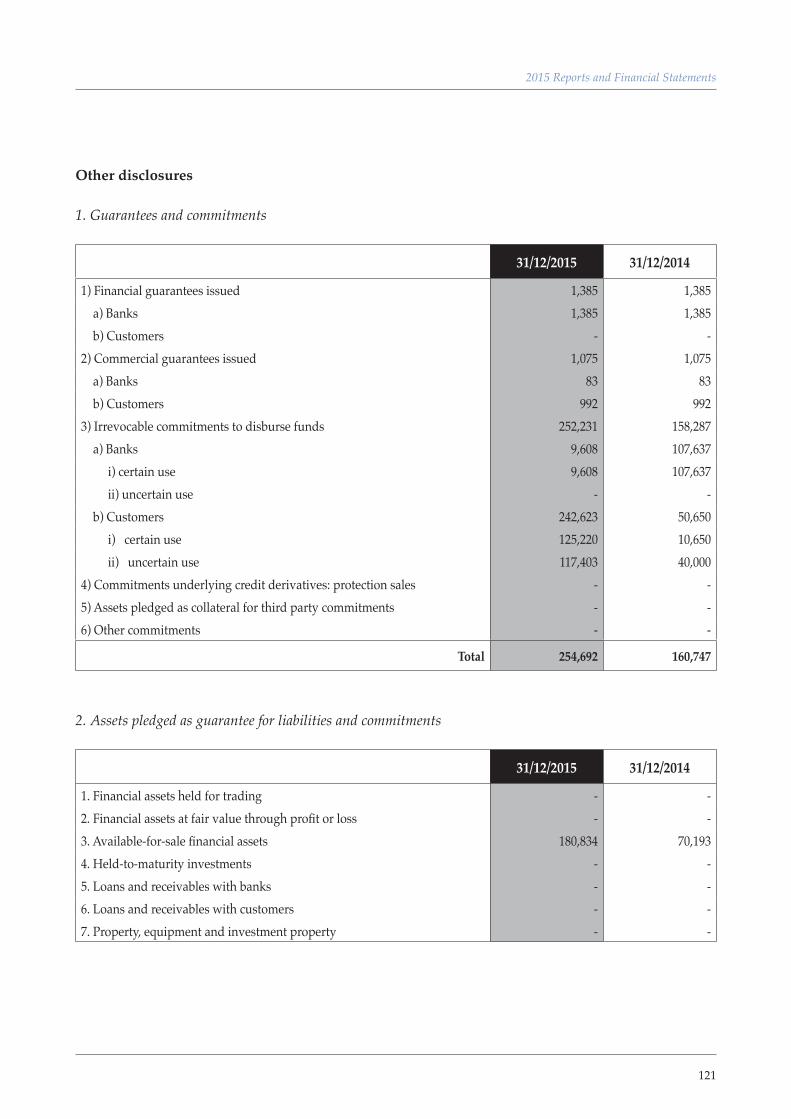
121
2015 Reports and Financial Statements
Other disclosures
1. Guarantees and commitments
31/12/2015 31/12/2014
1) Financial guarantees issued 1,385 1,385 a) Banks 1,385 1,385 b) Customers - - 2) Commercial guarantees issued 1,075 1,075 a) Banks 83 83 b) Customers 992 992 3) Irrevocable commitments to disburse funds 252,231 158,287 a) Banks 9,608 107,637 i) certain use 9,608 107,637 ii) uncertain use - - b) Customers 242,623 50,650 i) certain use 125,220 10,650 ii) uncertain use 117,403 40,000 4) Commitments underlying credit derivatives: protection sales - - 5) Assets pledged as collateral for third party commitments - - 6) Other commitments - -
Total 254,692 160,747
2. Assets pledged as guarantee for liabilities and commitments
31/12/2015 31/12/2014
1. Financial assets held for trading - - 2. Financial assets at fair value through profit or loss - - 3. Available-for-sale financial assets 180,834 70,193 4. Held-to-maturity investments - - 5. Loans and receivables with banks - - 6. Loans and receivables with customers - - 7. Property, equipment and investment property - -
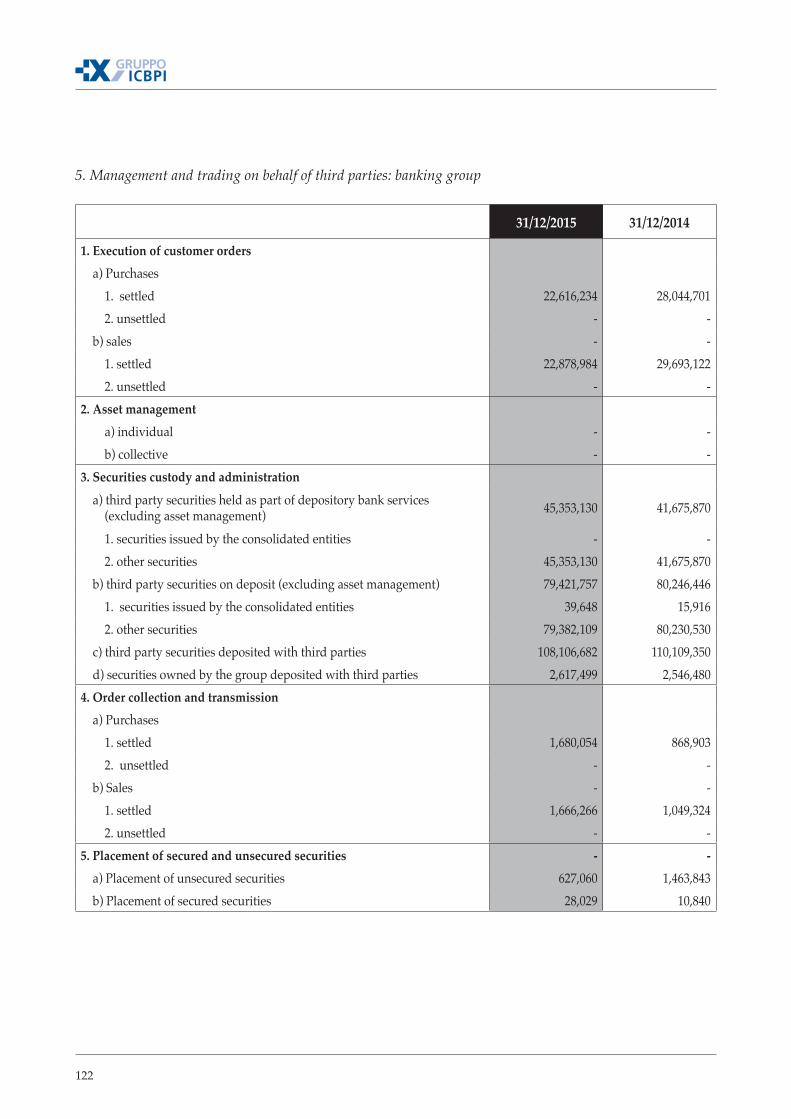
122
5. Management and trading on behalf of third parties: banking group
31/12/2015 31/12/2014
1. Execution of customer orders a) Purchases 1. settled 22,616,234 28,044,701 2. unsettled - - b) sales - - 1. settled 22,878,984 29,693,122 2. unsettled - - 2. Asset management a) individual - - b) collective - - 3. Securities custody and administration
a) third party securities held as part of depository bank services (excluding asset management) 45,353,130 41,675,870
1. securities issued by the consolidated entities - - 2. other securities 45,353,130 41,675,870 b) third party securities on deposit (excluding asset management) 79,421,757 80,246,446 1. securities issued by the consolidated entities 39,648 15,916 2. other securities 79,382,109 80,230,530 c) third party securities deposited with third parties 108,106,682 110,109,350 d) securities owned by the group deposited with third parties 2,617,499 2,546,480 4. Order collection and transmission a) Purchases 1. settled 1,680,054 868,903 2. unsettled - - b) Sales - - 1. settled 1,666,266 1,049,324 2. unsettled - - 5. Placement of secured and unsecured securities - - a) Placement of unsecured securities 627,060 1,463,843 b) Placement of secured securities 28,029 10,840
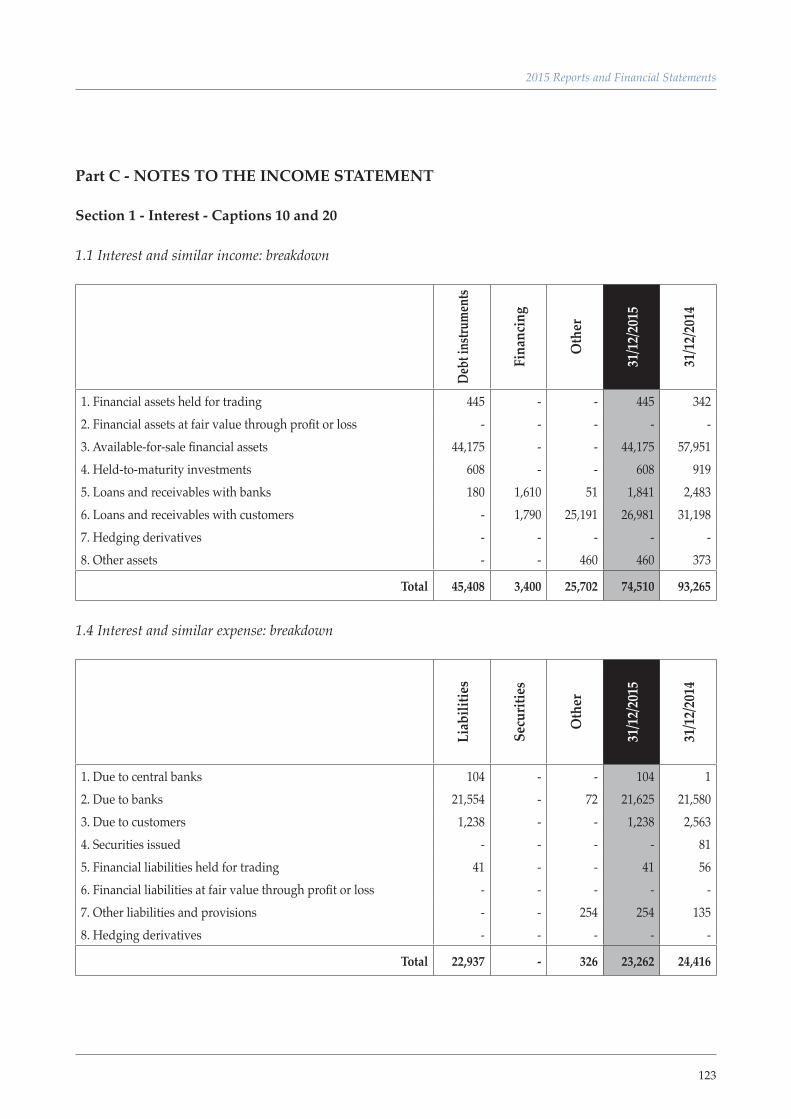
123
2015 Reports and Financial Statements
Part C - NOTES TO THE INCOME STATEMENT
Section 1 - Interest - Captions 10 and 20
1.1 Interest and similar income: breakdown
Debt
instr
umen
ts
Fina
ncin
g
Oth
er
31/1
2/20
15
31/1
2/20
14
1. Financial assets held for trading 445 - - 445 342 2. Financial assets at fair value through profit or loss - - - - - 3. Available-for-sale financial assets 44,175 - - 44,175 57,951 4. Held-to-maturity investments 608 - - 608 919 5. Loans and receivables with banks 180 1,610 51 1,841 2,483 6. Loans and receivables with customers - 1,790 25,191 26,981 31,198 7. Hedging derivatives - - - - - 8. Other assets - - 460 460 373
Total 45,408 3,400 25,702 74,510 93,265
1.4 Interest and similar expense: breakdown
Liab
ilitie
s
Secu
ritie
s
Oth
er
31/1
2/20
15
31/1
2/20
14
1. Due to central banks 104 - - 104 1 2. Due to banks 21,554 - 72 21,625 21,580 3. Due to customers 1,238 - - 1,238 2,563 4. Securities issued - - - - 81 5. Financial liabilities held for trading 41 - - 41 56 6. Financial liabilities at fair value through profit or loss - - - - - 7. Other liabilities and provisions - - 254 254 135 8. Hedging derivatives - - - - -
Total 22,937 - 326 23,262 24,416
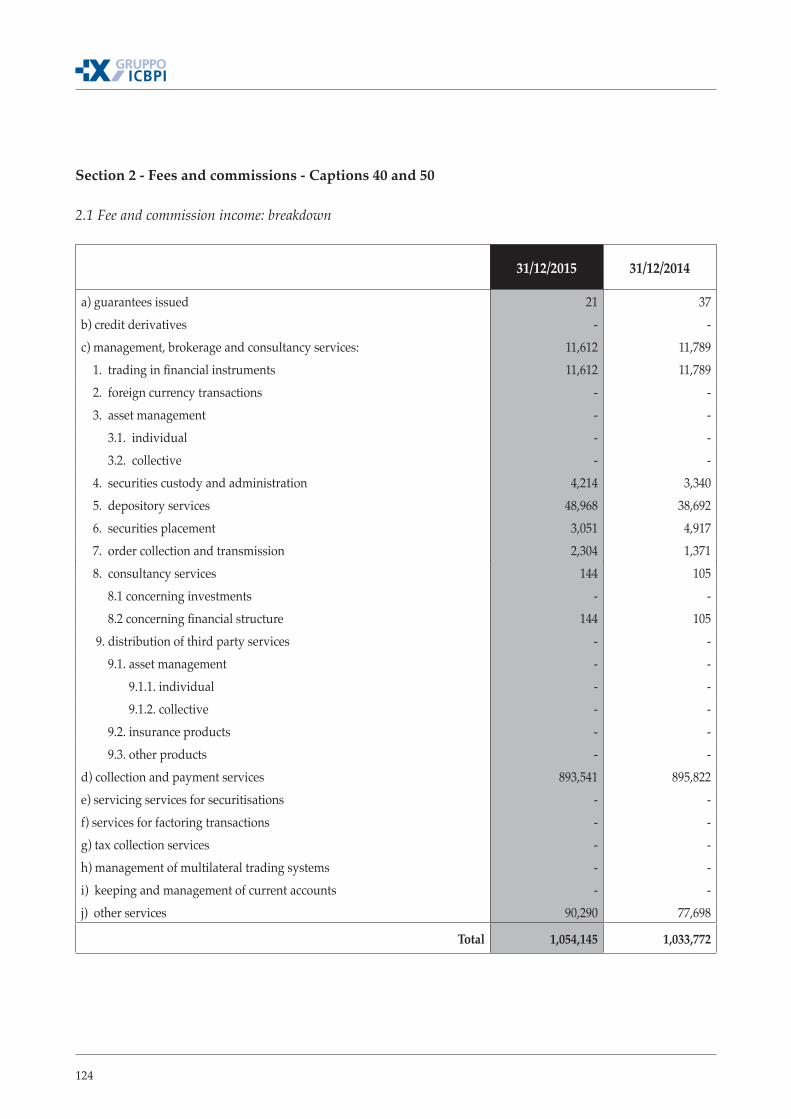
124
Section 2 - Fees and commissions - Captions 40 and 50
2.1 Fee and commission income: breakdown
31/12/2015 31/12/2014
a) guarantees issued 21 37 b) credit derivatives - - c) management, brokerage and consultancy services: 11,612 11,789 1. trading in financial instruments 11,612 11,789 2. foreign currency transactions - - 3. asset management - - 3.1. individual - - 3.2. collective - - 4. securities custody and administration 4,214 3,340 5. depository services 48,968 38,692 6. securities placement 3,051 4,917 7. order collection and transmission 2,304 1,371 8. consultancy services 144 105 8.1 concerning investments - - 8.2 concerning financial structure 144 105 9. distribution of third party services - - 9.1. asset management - - 9.1.1. individual - - 9.1.2. collective - - 9.2. insurance products - - 9.3. other products - - d) collection and payment services 893,541 895,822 e) servicing services for securitisations - - f) services for factoring transactions - - g) tax collection services - - h) management of multilateral trading systems - - i) keeping and management of current accounts - - j) other services 90,290 77,698
Total 1,054,145 1,033,772
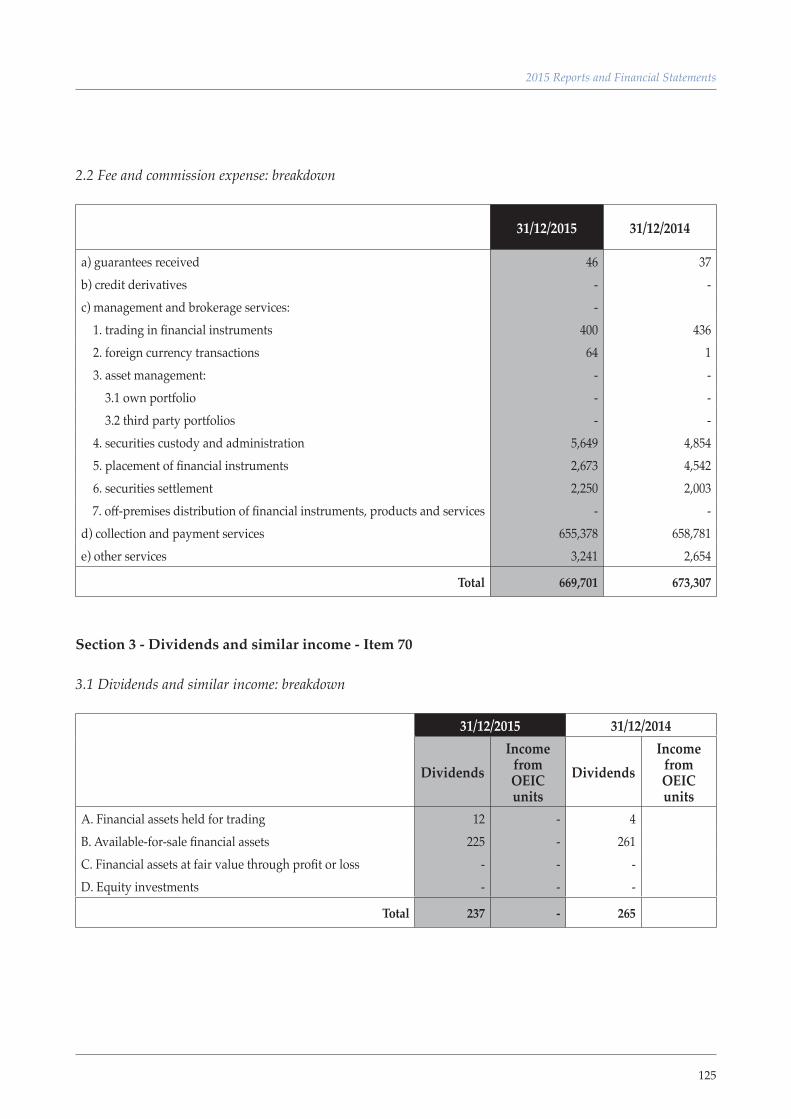
125
2015 Reports and Financial Statements
2.2 Fee and commission expense: breakdown
31/12/2015 31/12/2014
a) guarantees received 46 37 b) credit derivatives - - c) management and brokerage services: - 1. trading in financial instruments 400 436 2. foreign currency transactions 64 1 3. asset management: - - 3.1 own portfolio - - 3.2 third party portfolios - - 4. securities custody and administration 5,649 4,854 5. placement of financial instruments 2,673 4,542 6. securities settlement 2,250 2,003 7. off-premises distribution of financial instruments, products and services - - d) collection and payment services 655,378 658,781 e) other services 3,241 2,654
Total 669,701 673,307
Section 3 - Dividends and similar income - Item 70
3.1 Dividends and similar income: breakdown
31/12/2015 31/12/2014
DividendsIncome
from OEIC units
DividendsIncome
from OEIC units
A. Financial assets held for trading 12 - 4 B. Available-for-sale financial assets 225 - 261 C. Financial assets at fair value through profit or loss - - - D. Equity investments - - -
Total 237 - 265
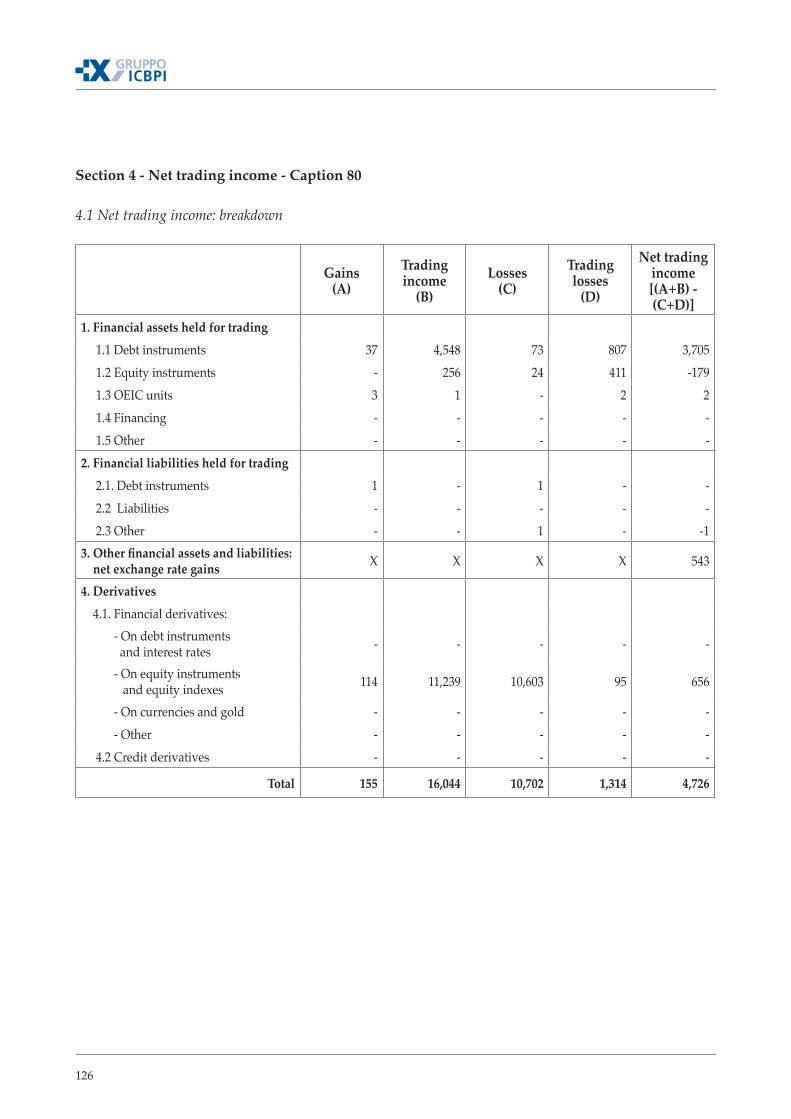
126
Section 4 - Net trading income - Caption 80
4.1 Net trading income: breakdown
Gains(A)
Trading income
(B)Losses
(C)Trading losses
(D)
Net trading income[(A+B) - (C+D)]
1. Financial assets held for trading 1.1 Debt instruments 37 4,548 73 807 3,705 1.2 Equity instruments - 256 24 411 -179 1.3 OEIC units 3 1 - 2 2 1.4 Financing - - - - - 1.5 Other - - - - - 2. Financial liabilities held for trading 2.1. Debt instruments 1 - 1 - - 2.2 Liabilities - - - - - 2.3 Other - - 1 - -1 3. Other financial assets and liabilities: net exchange rate gains X X X X 543
4. Derivatives 4.1. Financial derivatives: - On debt instruments and interest rates - - - - -
- On equity instruments and equity indexes 114 11,239 10,603 95 656
- On currencies and gold - - - - - - Other - - - - - 4.2 Credit derivatives - - - - -
Total 155 16,044 10,702 1,314 4,726

127
2015 Reports and Financial Statements
Section 6 - Gain (loss) from sales/repurchases - Caption 100
6.1 Net gain (loss) from sales or repurchases: breakdown
31/12/2015 31/12/2014
Gai
n
Loss
Net
gai
n (lo
ss)
Gai
n
Loss
Net
gai
n (lo
ss)
Financial assets1. Loans and receivables with banks - - - - - - 2. Loans and receivables with customers - - - - - - 3. Available-for-sale financial assets - - - - - - 3.1 Debt instruments - - - - - - 3.2 Equity instruments - - - 3,540 - 3,540 3.3 OEIC units - - - - - - 3.4 Financing - - - - - - 4. Held-to-maturity investments - - - - - -
Total assets - - - 3,540 - 3,540
Financial liabilities1. Due to banks - - - - - - 2. Due to customers - - - - - - 3. Securities issued - - - - - -
Total liabilities - - - - - -
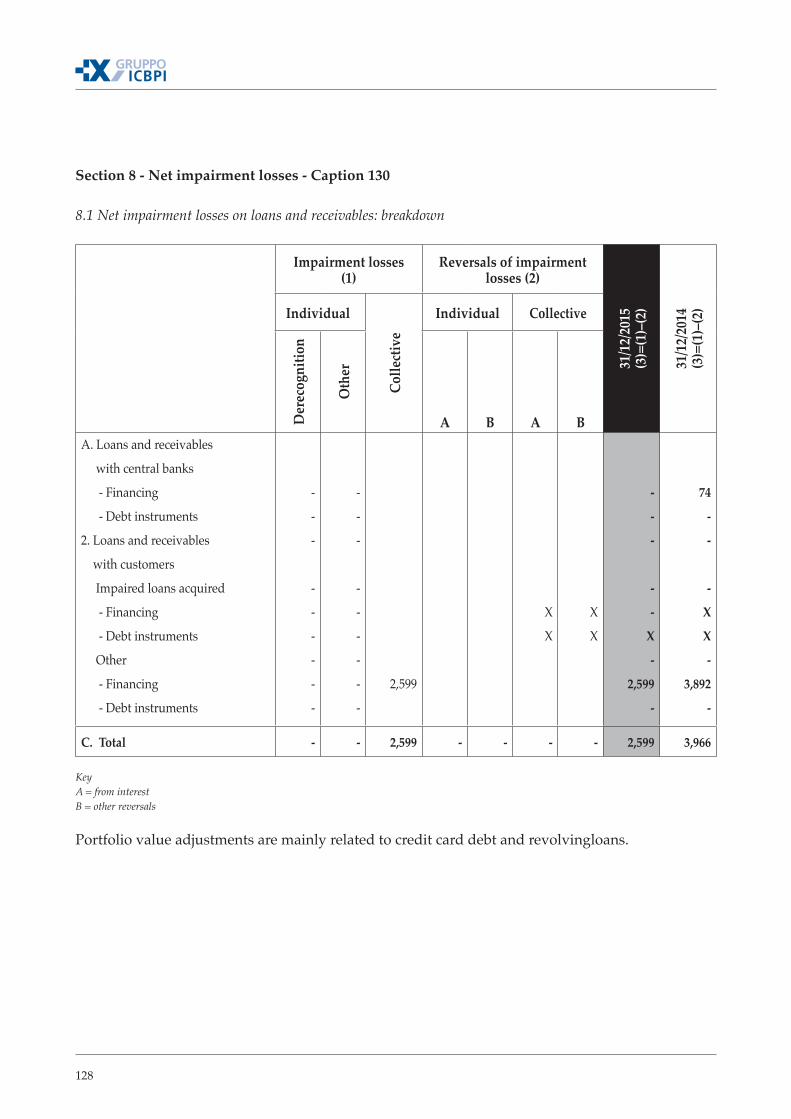
128
Section 8 - Net impairment losses - Caption 130 8.1 Net impairment losses on loans and receivables: breakdown
Impairment losses(1)
Reversals of impairment losses (2)
31/1
2/20
15(3
)=(1
)–(2
)
31/1
2/20
14(3
)=(1
)–(2
)Individual
Colle
ctiv
e
Individual CollectiveD
erec
ogni
tion
Oth
er
A B A BA. Loans and receivables
with central banks
- Financing
- Debt instruments
2. Loans and receivables
with customers
Impaired loans acquired
- Financing
- Debt instruments
Other
- Financing
- Debt instruments
-
-
-
-
-
-
-
-
-
-
-
-
-
-
-
-
-
-
2,599
X
X
X
X
-
-
-
-
-
X
-
2,599
-
74
-
-
-
X
X
-
3,892
-
C. Total - - 2,599 - - - - 2,599 3,966
KeyA = from interestB = other reversals
Portfolio value adjustments are mainly related to credit card debt and revolvingloans.
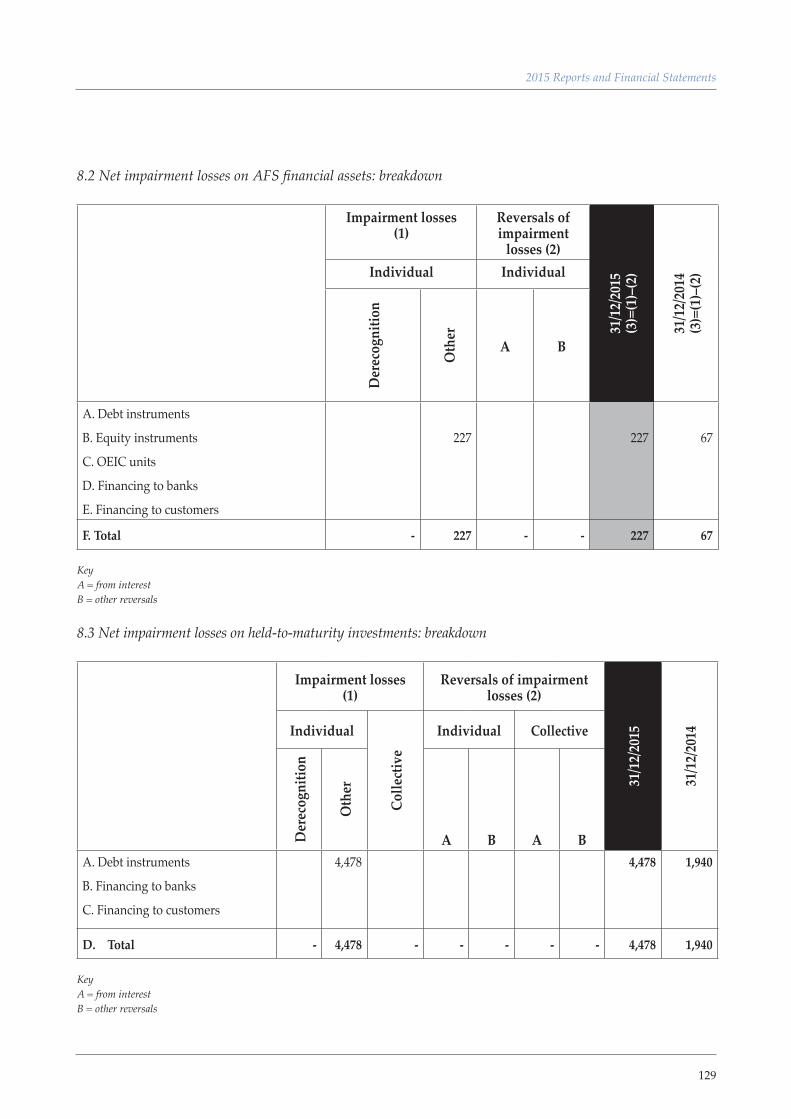
129
2015 Reports and Financial Statements
8.2 Net impairment losses on AFS financial assets: breakdown
Impairment losses(1)
Reversals of impairment
losses (2)
31/1
2/20
15(3
)=(1
)–(2
)
31/1
2/20
14(3
)=(1
)–(2
)Individual Individual
Der
ecog
nitio
n
Oth
er
A B
A. Debt instruments
B. Equity instruments
C. OEIC units
D. Financing to banks
E. Financing to customers
227
227 67
F. Total - 227 - - 227 67
KeyA = from interestB = other reversals
8.3 Net impairment losses on held-to-maturity investments: breakdown
Impairment losses(1)
Reversals of impairment losses (2)
31/1
2/20
15
31/1
2/20
14Individual
Colle
ctiv
e
Individual Collective
Der
ecog
nitio
n
Oth
er
A B A BA. Debt instruments
B. Financing to banks
C. Financing to customers
4,478 4,478 1,940
D. Total - 4,478 - - - - - 4,478 1,940
KeyA = from interestB = other reversals
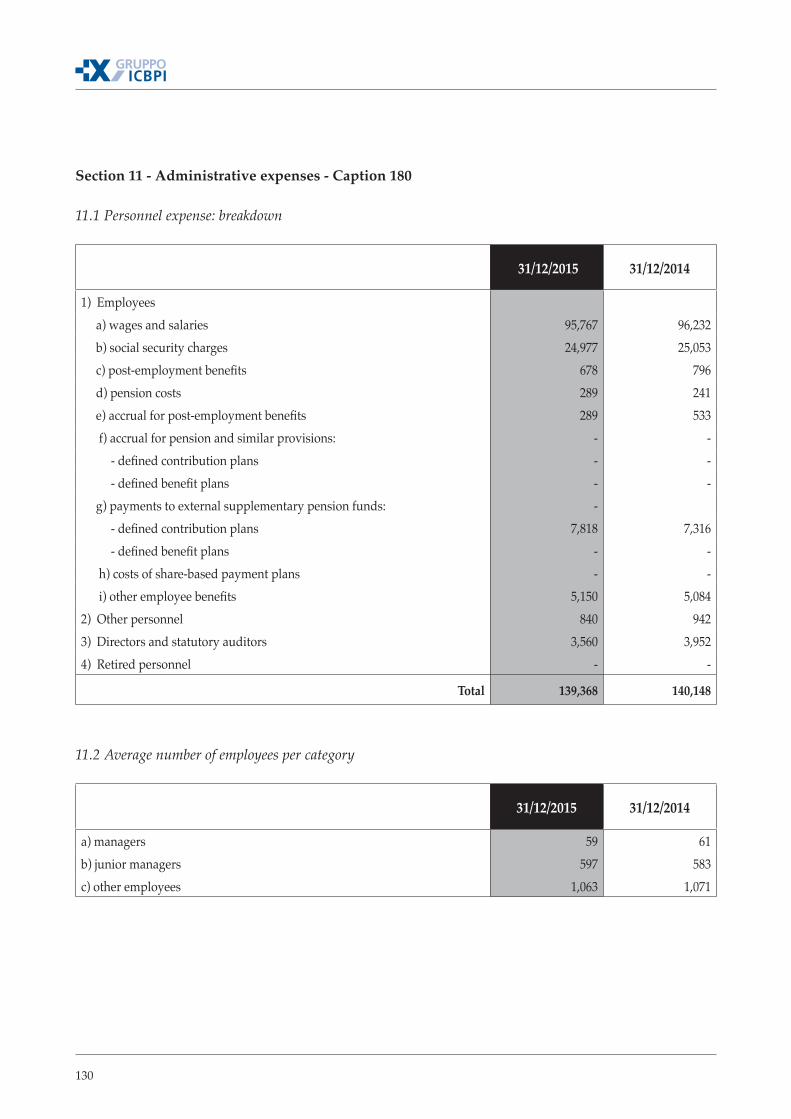
130
Section 11 - Administrative expenses - Caption 180
11.1 Personnel expense: breakdown
31/12/2015 31/12/2014
1) Employees a) wages and salaries 95,767 96,232 b) social security charges 24,977 25,053 c) post-employment benefits 678 796 d) pension costs 289 241 e) accrual for post-employment benefits 289 533 f) accrual for pension and similar provisions: - - - defined contribution plans - - - defined benefit plans - - g) payments to external supplementary pension funds: - - defined contribution plans 7,818 7,316 - defined benefit plans - - h) costs of share-based payment plans - - i) other employee benefits 5,150 5,084 2) Other personnel 840 942 3) Directors and statutory auditors 3,560 3,952 4) Retired personnel - -
Total 139,368 140,148
11.2 Average number of employees per category
31/12/2015 31/12/2014
a) managers 59 61 b) junior managers 597 583 c) other employees 1,063 1,071

131
2015 Reports and Financial Statements
11.5 Other administrative expenses: breakdown
31/12/2015 31/12/2014
- data processing 98,916 90,650 - post office, valuables transportation and couriers 24,749 26,304 - external services 20,060 19,721 - interbank network traffic 12,543 14,822 - IT connections and automation costs 3,920 2,847 - access to markets 2,214 2,322 - professional services 14,718 8,693 - agents' commissions 1,757 1,418 - bank draft books 170 311 - maintenance and lease 35,312 37,227 - building running costs, leases, heating and lighting 6,083 6,257 - stationery and printed matter 519 1,081 - insurance 2,162 2,329 - telegraph, telephone and telex 5,274 5,055 - card processing 37,044 37,662 - membership fees 1,333 1,306 - surveillance and cleaning 965 928 - other 66,137 63,964 - taxes and duties 58,306 61,269
Total 392,182 384,165
The fees paid in 2014 to the independent auditors engaged for the legally required audit pursuant to Legislative decree no. 39 of 27 January 2010 are detailed below:
Service provider €’000
Audit of the parent’s financial statements KPMG S.p.A. 510Audit of the subsidiaries’ financial statements KPMG S.p.A. 278
Total 788 In addition to the audit of the separate and consolidated financial statements and the procedures required of the independent auditors by tax legislation.
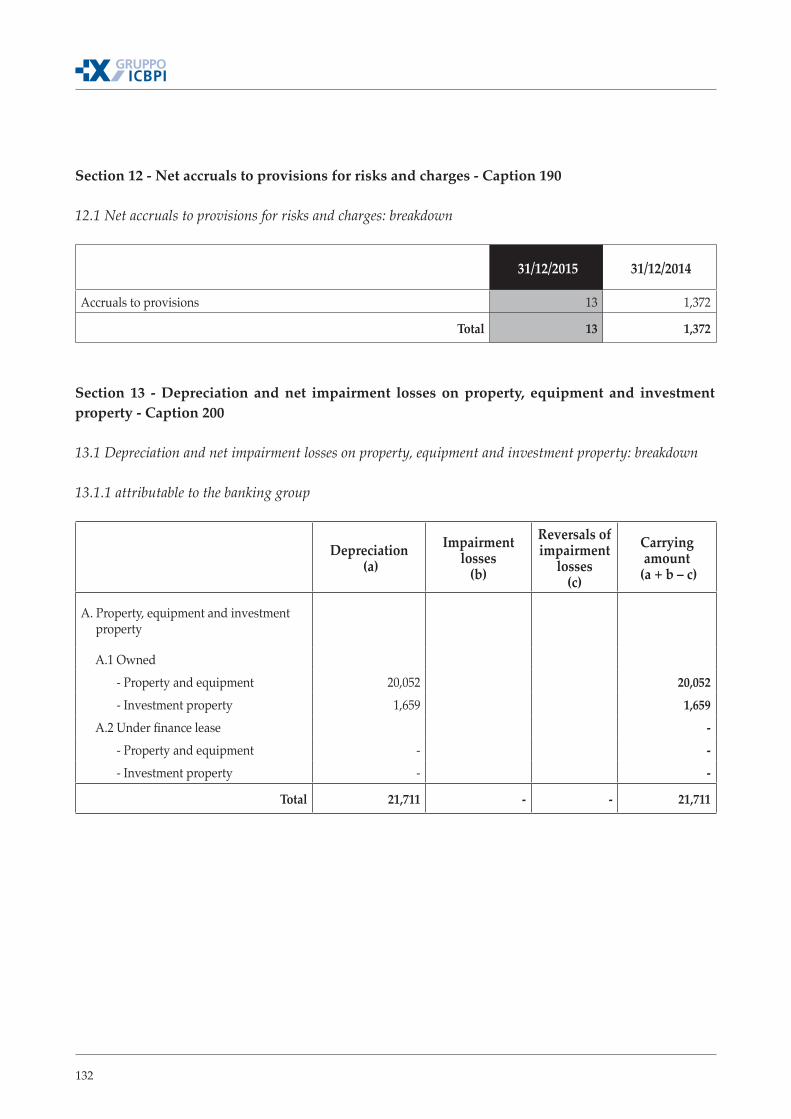
132
Section 12 - Net accruals to provisions for risks and charges - Caption 190
12.1 Net accruals to provisions for risks and charges: breakdown
31/12/2015 31/12/2014
Accruals to provisions 13 1,372
Total 13 1,372
Section 13 - Depreciation and net impairment losses on property, equipment and investment property - Caption 200
13.1 Depreciation and net impairment losses on property, equipment and investment property: breakdown
13.1.1 attributable to the banking group
Depreciation (a)
Impairment losses
(b)
Reversals of impairment
losses (c)
Carrying amount
(a + b – c)
A. Property, equipment and investment property
A.1 Owned - Property and equipment 20,052 20,052 - Investment property 1,659 1,659 A.2 Under finance lease - - Property and equipment - - - Investment property - -
Total 21,711 - - 21,711

133
2015 Reports and Financial Statements
Section 14 - Amortisation and net impairment losses on intangible assets - Caption 210
14.1 Amortisation and net impairment losses on intangible assets: breakdown
Amortisation(a)
Impairment losses
(b)
Reversals of
impairment losses
(c)
Carrying amount
(a + b – c)
A. Intangible assets - A.1 Owned - - Generated internally - - Other 21,134 - - 21,134 A.2 Under finance lease -
Total 21,134 - - 21,134
Section 15 - Other operating expense and income - Caption 220
15.1 Other operating expense: breakdown
31/12/2015 31/12/2014
Transfer of revenue from services 22,881 21,524 Other costs 12,291 22,038
Total 35,172 43,562
15.2 Other operating income: breakdown
31/12/2015 31/12/2014
Lease income 911 1,471 Services 240,552 233,050 Recoveries of stamp duties from customers and post office expenses 71,780 74,699 Other income 4,603 22,990
Total 317,846 332,210
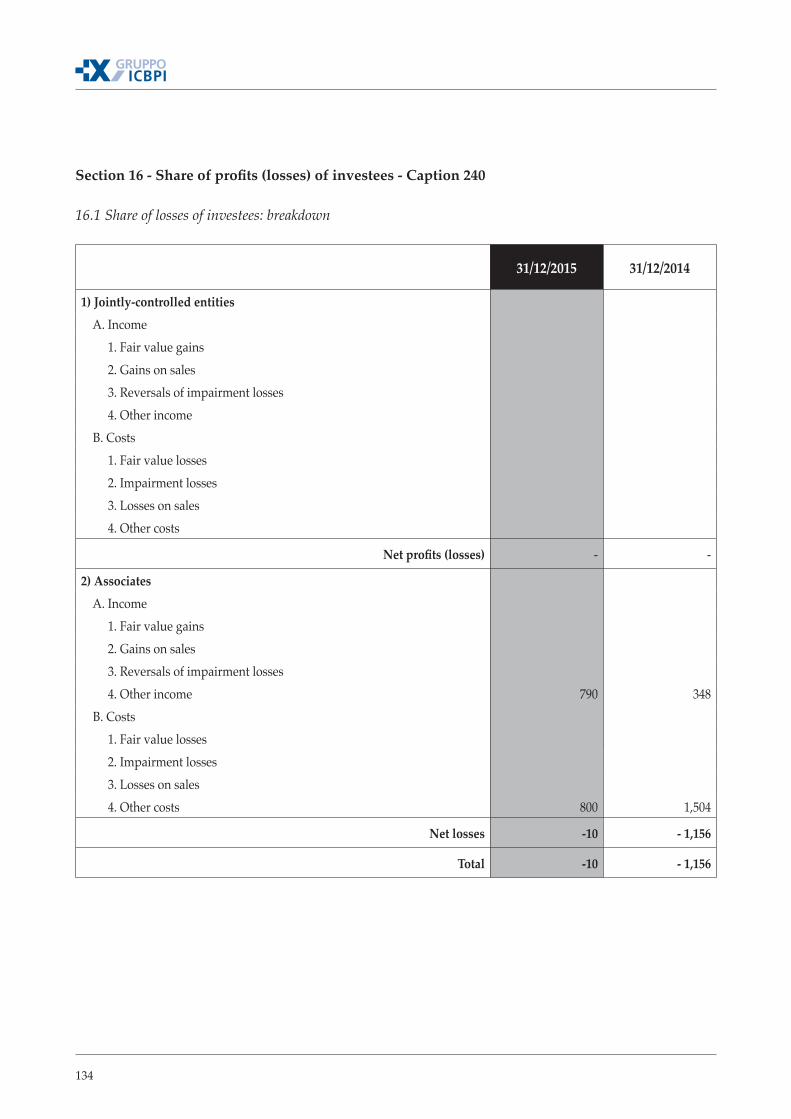
134
Section 16 - Share of profits (losses) of investees - Caption 240
16.1 Share of losses of investees: breakdown
31/12/2015 31/12/2014
1) Jointly-controlled entities A. Income 1. Fair value gains 2. Gains on sales 3. Reversals of impairment losses 4. Other income B. Costs 1. Fair value losses 2. Impairment losses 3. Losses on sales 4. Other costs
Net profits (losses) - -
2) Associates A. Income 1. Fair value gains 2. Gains on sales 3. Reversals of impairment losses 4. Other income 790 348 B. Costs 1. Fair value losses 2. Impairment losses 3. Losses on sales 4. Other costs 800 1,504
Net losses -10 - 1,156
Total -10 - 1,156
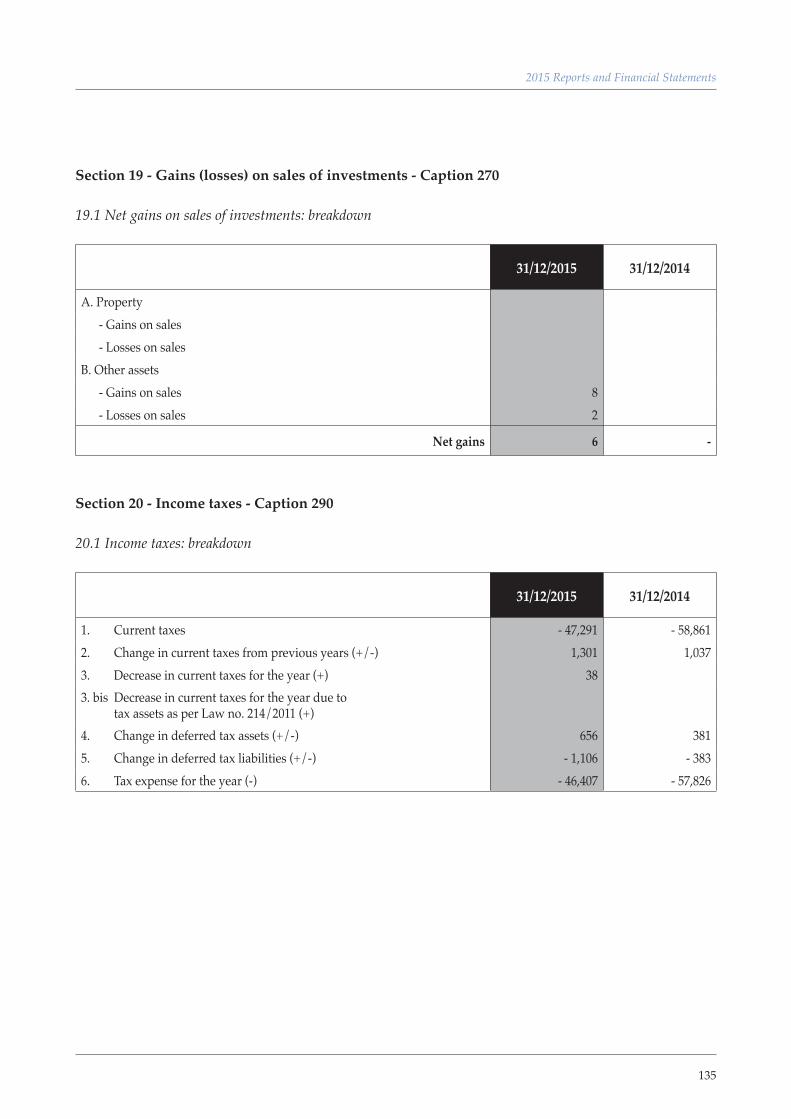
135
2015 Reports and Financial Statements
Section 19 - Gains (losses) on sales of investments - Caption 270
19.1 Net gains on sales of investments: breakdown
31/12/2015 31/12/2014
A. Property - Gains on sales - Losses on sales B. Other assets - Gains on sales 8 - Losses on sales 2
Net gains 6 -
Section 20 - Income taxes - Caption 290
20.1 Income taxes: breakdown
31/12/2015 31/12/2014
1. Current taxes - 47,291 - 58,861 2. Change in current taxes from previous years (+/-) 1,301 1,037 3. Decrease in current taxes for the year (+) 38 3. bis Decrease in current taxes for the year due to tax assets as per Law no. 214/2011 (+)4. Change in deferred tax assets (+/-) 656 381 5. Change in deferred tax liabilities (+/-) - 1,106 - 383 6. Tax expense for the year (-) - 46,407 - 57,826
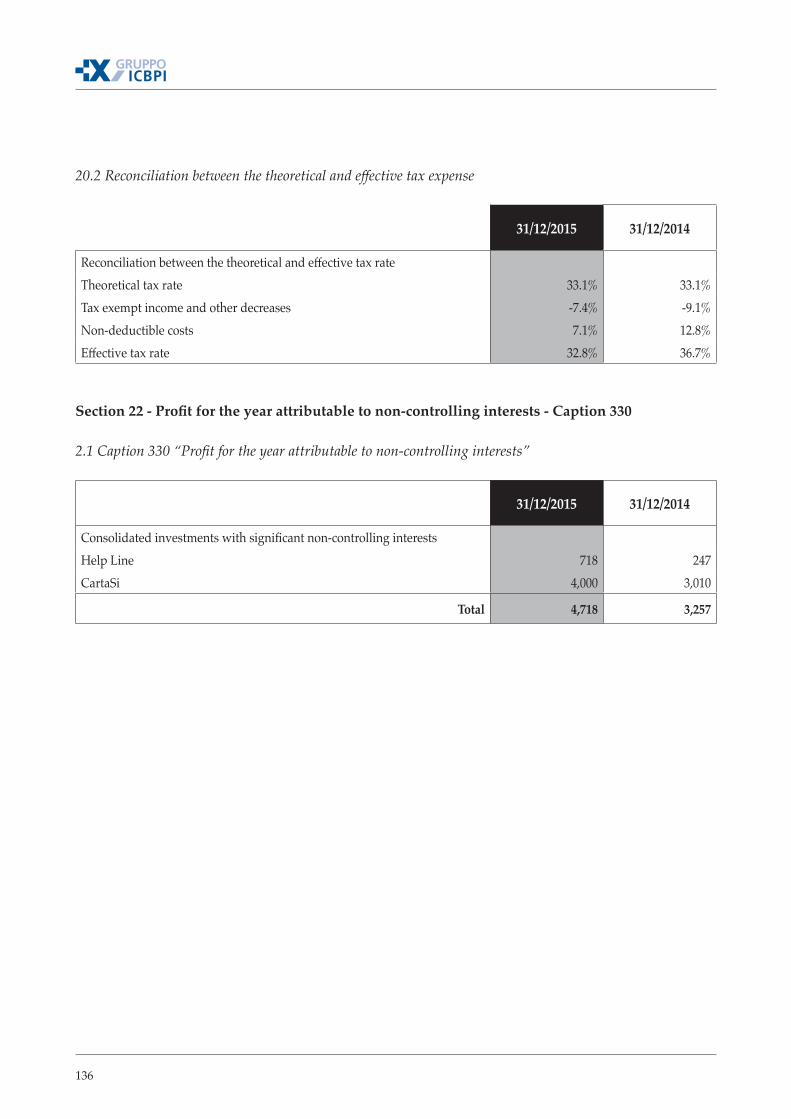
136
20.2 Reconciliation between the theoretical and effective tax expense
31/12/2015 31/12/2014
Reconciliation between the theoretical and effective tax rateTheoretical tax rate 33.1% 33.1%Tax exempt income and other decreases -7.4% -9.1%Non-deductible costs 7.1% 12.8%Effective tax rate 32.8% 36.7%
Section 22 - Profit for the year attributable to non-controlling interests - Caption 330 2.1 Caption 330 “Profit for the year attributable to non-controlling interests”
31/12/2015 31/12/2014
Consolidated investments with significant non-controlling interestsHelp Line 718 247 CartaSi 4,000 3,010
Total 4,718 3,257
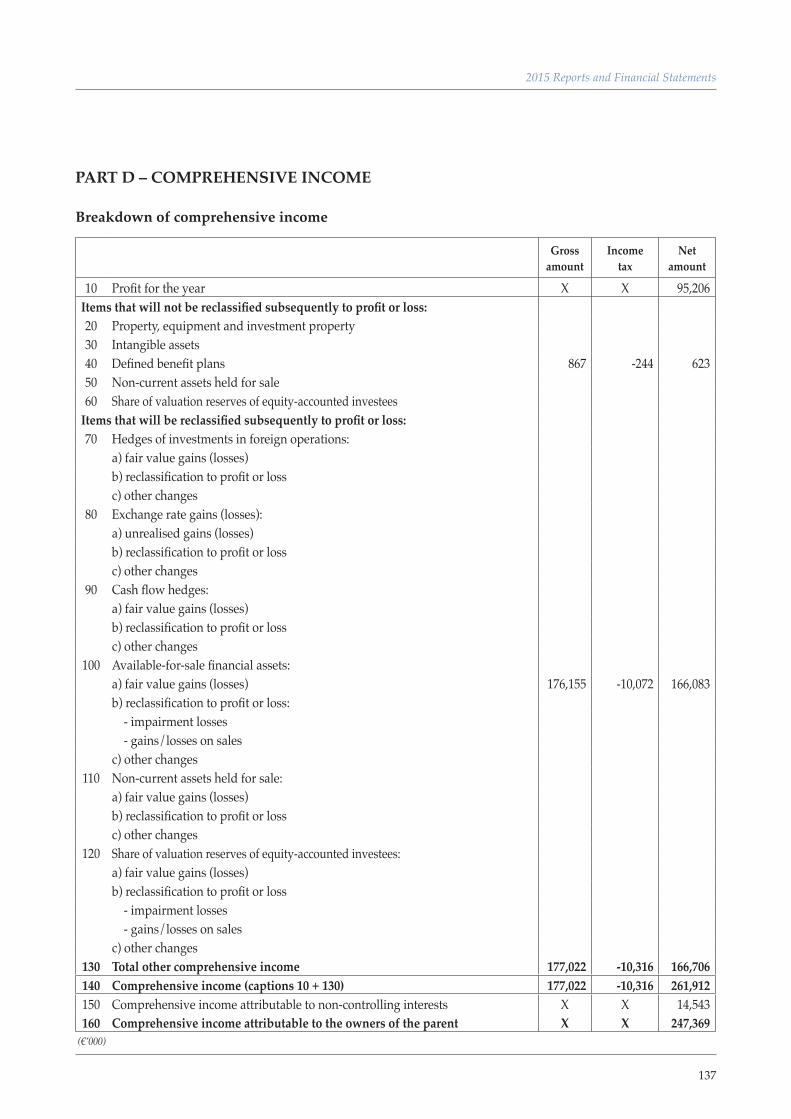
137
2015 Reports and Financial Statements
PART D – COMPREHENSIVE INCOME
Breakdown of comprehensive income
Gross amount
Income tax
Net amount
10 Profit for the year X X 95,206 Items that will not be reclassified subsequently to profit or loss:20 Property, equipment and investment property30 Intangible assets 40 Defined benefit plans 867 -244 623 50 Non-current assets held for sale60 Share of valuation reserves of equity-accounted investees
Items that will be reclassified subsequently to profit or loss:70 Hedges of investments in foreign operations:
a) fair value gains (losses)b) reclassification to profit or lossc) other changes
80 Exchange rate gains (losses):a) unrealised gains (losses)b) reclassification to profit or lossc) other changes
90 Cash flow hedges:a) fair value gains (losses)b) reclassification to profit or lossc) other changes
100 Available-for-sale financial assets:a) fair value gains (losses) 176,155 -10,072 166,083 b) reclassification to profit or loss: - impairment losses - gains/losses on salesc) other changes
110 Non-current assets held for sale:a) fair value gains (losses)b) reclassification to profit or lossc) other changes
120 Share of valuation reserves of equity-accounted investees:a) fair value gains (losses)b) reclassification to profit or loss - impairment losses - gains/losses on salesc) other changes
130 Total other comprehensive income 177,022 -10,316 166,706 140 Comprehensive income (captions 10 + 130) 177,022 -10,316 261,912 150 Comprehensive income attributable to non-controlling interests X X 14,543 160 Comprehensive income attributable to the owners of the parent X X 247,369
(€’000)
138
Part E - Risks and related hedging policies
Introduction
This section includes information related to the ICBPI banking group, which includes:
▪ ICBPI S.p.A. (“ICBPI” or the “bank”), parent (also the “parent”), included in the banks register: as well as management, coordination and control activities, ICBPI provides the group companies with centralised financial, lending and administrative assistance services and the market with payment and securities services;
▪ CartaSi S.p.A., financial company included in the register of payment institutes as per article 114-septies of the Consolidated Banking Act: it provides payment services in accordance with article 1.1.b.3/4/5 of Legislative decree no. 11 of 27 January 2010 and related services;
▪ Oasi Diagram - Outsourcing Applicativo e Servizi Innovativi S.p.A. (“Oasi”), operating com-pany: it performs, inter alia, data security and supervisory reporting activities on an outsourcing basis;
▪ Help Line S.p.A. (“Help Line”), operating company: a contact centre business;
Risk management
The group monitors and manages the risks to which it is exposed using well-defined methods and processes, applicable throughout the economic cycle.
The parent’s risk management unit monitors and controls the group’s risks, working closely with the boards of statutory auditors and general managers of the parent and its subsidiaries, as well as with the risk management unit manager appointed by CartaSi’s board of directors and the operating heads of the risk management units of the other group companies. It reports to the group companies’ boards of statutory auditors and the parent’s risk committee and managing director.
The risk management unit’s activities mainly consist of measuring, monitoring and reporting risks related to the business activities of all the group companies. It also checks the suitability of the pa-rent’s and group’s own funds to cover the various types of risks. It performs the following activities:
▪ proposal of quantitative and qualitative parameters to define the RAF (Risk Appetite Framework) used to establish how to calculate and monitor optimal risk levels, warning thresholds and ma-ximum risk levels that the group intends to comply with in line with the strategic objectives set out in its business plan;
▪ ongoing checks of the suitability of the risk management process and operating limits;
▪ preparation of a concise mapping of risks that affect the parent and group companies and annual check that the group’s risks are updated;
▪ compliance with the regulator’s requirements about risk management. Specifically:
139
2015 Reports and Financial Statements
- it coordinates the entire ICAAP process;
- it is responsible for the development, testing and maintenance of risk measurement and control systems, ensuring that they undergo periodic backtesting, an appropriate number of scenarios are analysed and prudent assumptions about dependencies and correlations are used;
▪ it coordinates the presentation of information to the market and the annual presentation of the “Disclosures to the market” document in accordance with Circular no. 285/2013;
▪ it proposes the utilisation of specific risk identification tools and/or methods to the relevant units to control risks. In particular;
- it defines standard operational risk measurement parameters in line with the RAF;
- it defines reputational risk measurement and control methods;
- it assists the internal bodies to measure strategic risks and monitor significant variables;
▪ it measures and monitors all types of (quantifiable and non-quantifiable) risks and proposes IT, management and operating countermeasures designed to mitigate the risks and adoption of su-itable risk indicators;
▪ it ensures the risk measurement and control systems are consistent with the processes and me-thods used to evaluate the company’s business;
▪ it develops and introduces indicators able to identify irregular situations and inefficiencies in the risk measurement and control systems;
▪ it provides opinions on the consistency of the key transactions with the RAF, together with the other units involved, examining the risk profile of the new services/products in advance and/or significant variations in the internal processes that may generate changes in the risk profile;
▪ it monitors risks regularly and their compliance with the risk objectives and operating limits assigned to the operating units in line with the various risks taken on;
▪ it checks that the individual credit exposures are monitored correctly;
▪ it checks the adequacy and effectiveness of the measures adopted to resolve weaknesses identi-fied in the risk management process;
▪ it prepares reports for the internal bodies (the parent’s board of directors, board of statutory auditors, risk committee, 231 supervisory body and the general manager) on risks as well as specific reports on the results of the monitoring of the more significant risks;
▪ it keeps the managing directors of the parent and the group companies up to date on risk exposu-re (via the identified reference people) and also regularly informs the risk and risk management committees;
▪ it checks the appropriateness of the methods and policies used to enhance financial instruments over time, as part of its checks of the depository services and performs random checks of the correct use of pricing models, the classification of illiquid/unlisted securities and their correct
140
measurement on an ex post basis compared to the definitive measurement of the NAV;
▪ it acts as the group reference unit, via the information security manager who is part of the unit, assisted by the information security officer, for issues about the design, monitoring and supervi-sion of the information security management system. Specifically, the information security ma-nager:
- defines the policies and guidelines for the information security management system together with the IT systems service;
- checks that the measures provided for by the system are in place (including the business con-tinuity plan and the disaster recovery plan) by analysing the related documentation and inter-viewing the personnel in charge of implementing and checking such measures;
▪ performs specific checks, if so requested, on behalf of the board of directors, the risk committee, the related party committee, the board of statutory auditors or senior management.
The unit is specialised in the related regulations and provides assistance with the methods set out in the policy to manage non-compliance risk approved by the board of directors.
141
2015 Reports and Financial Statements
SECTION 1 - BANKING GROUP RISKS
1.1 Credit risk
QUALITATIVE DISCLOSURE
General issues
Credit risk is the risk that an unexpected variation in a counterparty’s credit standing may lead to its default, generating unexpected losses on cash exposures or endorsement credits, or that generates a related unexpected variation in the asset’s market value.
Lending is not the ICBPI Group’s core business but it is an important part of its operations and mainly affects the treasury and finance unit, the securities services department and some business units of the parent, ICBPI, and the subsidiary CartaSi.
In fact, the group’s core business is not to grant financing but it does grant credit facilities, mainly to third parties that, due to the products/services provided to them and the operating/financial rules thereof, require credit facilities in the form of cash (credit facilities) or commitments (endorsement credits).
With respect to the first level controls, the head of the treasury and finance unit and the head of the securities services department check and monitor that the lending transactions performed by the treasury and finance unit comply with the maximum operating limits and/or caps. As part of the second level controls, the risk management unit checks compliance with the operating limits and large exposures. It also calculates the exposure with related parties every day.
The risk management unit also assesses the following elements about the adequacy of the lending process:
▪ the correct monitoring of the individual credit exposures;
▪ the consistency of classifications;
▪ the adequacy of accruals;
▪ the adequacy and tracing of the recovery process;
▪ the correct classification of non-recoverability of impaired positions;
▪ the existence of updated appraisals of the guarantees;
▪ the recording of all the information needed to assess the loans in the automated procedures;
▪ an estimate of the time needed to recover the impaired positions and the discount rates used.
CartaSi has a specific credit risk profile in respect of the direct issue of credit cards, which entails its exposure to its customers.
The issue of credit cards only takes place after suitable investigations of the customers and CartaSi’s
142
fraud and credit management unit continuously monitors credit risk over the period of the credit card’s validity (first level controls).
In order to strengthen controls over credit risk, relevant information about the credit exposure (amount of credit facilities, use of credit facilities, overruns, any non-performing positions) is col-lected in a structured and organic manner by the various IT procedures.
ICBPI does not operate in innovative financial products such as credit derivatives.
Also because of the limited number of exposures normally taken on by the group, its credit risk me-asurement methods and the related controls over credit risk trends are simple and lean; it does not use scoring systems or external and/or internal ratings.
Credit risk management policies
Organisational aspects
The group’s organisational structure ensures the proper monitoring and management of risks. With specific respect to credit risk, the board of directors has the sole powers to make policies that affect the group’s operations. It approves the strategies and risk management policies and the group’s organisational structure for internal controls. The proxy system provided for by an internal policy approved by the board of directors attributes specific powers to some bodies and units for decisions about credit. As required by the internal regulations, credit risk is managed and monitored by the:
▪ board of directors
▪ managing director/general manager
▪ credit committee
▪ credit and branches unit.
Management, measurement and control systems
Credit management
The parent is a “second level” bank, whose core business is the providing of products and services mainly in the sector of payment systems and administrative services for the custody, administration and settlement of securities.
Its lending policies are regulated by a specific regulation and it provides credit to:
▪ banks;
▪ stock brokerage companies;
▪ financial companies included in the lists covered by the Consolidated Banking Act;
▪ large corporate customers;
143
2015 Reports and Financial Statements
▪ OEICs;
▪ fund management companies.
ICBPI only provides credit facilities to retail customers who are group employees and employees of the former ICBPI (Equens) Group in the form of current account overdrafts and personal loans. It does not provide loans.
The credit facilities offered by ICBPI, diversified by type of customer, include:
▪ operating treasury facilities;
▪ intermediation caps in the Target 2 and E-Mid settlement system;
▪ syndicate loans;
▪ endorsement credits and other commitments for guarantees issued (sureties, letters of patrona-ge);
▪ cash credit facilities;
▪ personal loans.
The lending approval procedure starts after receipt of a formal application from the customer by the relevant unit which is sent to the credit office. This stage includes the correct identification of the risk and an assessment of the customer’s reliability, i.e., its ability to meet its financial commitments arising from the receipt and subsequent use of the financing.
During this preliminary investigation stage, the group analyses the following aspects:
▪ formal (e.g., deeds of incorporation and by-laws, powers of the directors and managers, inclu-sion in the company register, etc.);
▪ qualitative (e.g., reports and information from the credit information centre, analysis of existing relationships with ICBPI and other group companies, communications to the interbank alarm centre, etc.);
▪ substantial (e.g., company appraisals, analyses and reclassifications of financial statements, in-cluding by the use of specialist services, such as, for example, Bureau Van Dijk, Cerved, etc.);
▪ merit (e.g., compliance with large exposure limits and limits to activities at risk performed with related parties and parties related to them).
Customers do not have to make specific applications for operating limits and/or intermediation caps. The preliminary investigation is initiated by the treasury and finance unit or the competent internal unit.
In order to monitor counterparties that operate in the retail intermediation services sector, the group has introduced specific operating limits to monitor and check these parties’ operations. In certain cases, it asks for guarantees to mitigate any risks it takes on.
The group grants banks that provide issuing and acquiring services for the ICBPI payment cards
144
with appropriate overdrafts on the accounts held for these activities in order to monitor its exposure to them.
All the applications for credit and allocations of operating limits are reviewed by the credit office, together with the service manager and then approved by the credit committee. If no obstacles are identified, the credit committee expresses its assessment of the application, including about the gua-rantee acquired or to be acquired for the board of directors to take its decision.
A proxies structure, approved by the board of directors, allows the authorised parties to take deci-sions within set limits. Guarantees requested by ICBPI may include:
▪ collateral, including pledged securities (government bonds, Euro bonds, ECB eligible bonds) and/or current account deposits;
▪ contractual guarantees (e.g., financial guarantee contracts);
▪ endorsement guarantees (sureties, letters of patronage, stand-by letters).
After the credit facility is provided, risks are checked and monitored as follows:
▪ periodic assessments of the customers and reviews of their positions;
▪ checks of overruns;
▪ checks of information from Bank of Italy’s credit information centre;
▪ identification of indications that the risk is more serious;
▪ periodic checks of the adequacy of the credit facilities used within the bank and the banking sector compared to equity for the mutual fund sector (to check the legal limit imposed by Bank of Italy’s regulation).
The credit office and the securities services department regularly check at least once a year the quan-titative and qualitative adequacy of the guarantees given by customers. In the case of ascertained total or partial default, they request the customers integrate the guarantees on a timely basis. If this does not take place, they immediately revise the position to comply with the identified risks.
Management of overruns
The credit office checks and analyses any overruns every day and informs the relevant units of all positions with overruns (current accounts in Euro and foreign currency with and without credit faci-lities). The units firstly check the accounting entries and, if necessary, make the relevant adjustments. They analyse the reasons for the overruns and invite the customers to immediately rectify their po-sitions if this is appropriate. They also inform the credit office and the risk management unit of their actions.
Positions with particular difficulties, not covered by the existing ad personam proxies, are commu-nicated to general management so that it can authorise adoption of measures to suspend the facility and/or contract or to commence the procedure to reclassify the position by implementing the pro-
145
2015 Reports and Financial Statements
cess to allow the relevant bodies that granted the credit to take a decision.
All overruns of more than €1,000 are communicated to the board of directors. Positions that are past due or overdue (by more than 90/180) days are communicated to the credit information centre as per the Bank of Italy regulation.
Operating limits
The treasury and finance unit manager supervises and checks that all the financial transactions car-ried out by their unit comply with the operating limits and/or approved caps. The risk management unit monitors compliance with the operating limits granted to the banks on a daily basis as a second level control. These limits are granted on the basis of standard parameters and vary depending on the nature of the instrument and its implicit volatility as well as the duration or residual life of the transaction.
The group has an application which performs the centralised check of the existing operating limits each day and issues general alerts when the threshold is exceeded.
Two counterparties exceeded their operating limits in 2015, the first due to the increase in value of existing OTC options and the second due to transactions involving Euro deposits and spot exchange rates.
Risk concentration limits
The risk management unit monitors compliance with the risk concentration limits (large exposures) on a daily basis, assisted by the level 1 controls already performed by the relevant units.
This monitoring activity covers all the group companies’ exposures and identified one overrun of the limits following a mid overnight transaction.
Limits to exposures with related parties
Regulations covering the limits to risky transactions with related parties and parties related to them introduced exposure limits for ICBPI and the group (considering separate and group regulatory ca-pital) vis-à-vis “Company personnel”, “Investors exercising control or significant influence”, “Other investors” and “Parties subject to control or significant influence”.
Controls over the risky transactions take place daily together with the controls over large exposures, including positions with all the group companies. Any excesses of the regulatory limits generate alerts for the various units involved.
In addition to the controls over exposures to the individual related parties, the group also calculates the overall exposure to all the related parties and the parties related to them each day (this procedure was introduced in 2013) as a percentage of the consolidated regulatory capital. This is part of the RAF.
146
Four counterparties exceeded the limits for exposures with related parties: one due to the increase in the amount of an existing foreign currency deposit, two as a result of Euro deposits and one due to its inability to cover securities settlement transactions.
CartaSi credit management
With respect to CartaSi, which operates in the e-money sector, its credit risk is tied to its operating methods on the market:
1. issuing through banks: the risk of cardholder default is borne by the banks for the period from the transaction date until the transaction’s debit date to the cardholder’s account.
2. direct issuing: the credit risk is borne directly by CartaSi and relates to non-payment on the contractually-agreed dates.
3. acquiring: CartaSi credits the amount due to the merchant’s bank usually on the day after the transaction. The company receives the funds from the circuits (Visa/MasterCard) for transac-tions carried out by the holders of credit cards issued by other banks usually two to three busi-ness days after the transaction date. Therefore, it is exposed to credit risk vis-à-vis the payment circuits in this period of time.
The other receivables are generated by operating irregularities in the activities of:
▪ issuing through banks, when amounts can be debited to blocked cards for which the bank is re-lieved from the related credit risk five days after the block has been communicated;
▪ acquiring, such as:
▪ recharges to merchants after complaints by cardholders or banks for any reason through the charge-back cycle;
▪ non-payment of commissions by the merchants.
These types of risks generated by operating irregularities are operational risks.
Activities provided as part of the Issuing and Acquiring of payment cards services to banks with Visa and MasterCard licences do not generate credit risks, nor do the Issuing and Acquiring activi-ties for national debit cards (Bancomat and Pagobancomat) or services to manage the ATM or POS network.
Settlement with the banks takes place through the parent by offsetting value dates.
The direct issue of credit cards only takes place after suitable investigations of the customers and CartaSi’s fraud and credit management unit continuously monitors credit risk over the period of the credit card’s validity. This unit is part of the payment card department (first level controls).
Credit risk is monitored constantly, checking that the exposures are within the set budget limits at the beginning of each year. CartaSi also carefully rates each new merchant or cardholder in the case of directly issued cards before agreeing new contracts.
147
2015 Reports and Financial Statements
The risk management unit monitors credit risk trends and their effect on the risk policy and set ran-ge. It prepares monthly and quarterly reports on compliance with the specific limits approved by the board of directors and implements suitable escalation measures when these limits are exceeded. These measures are described in the “CartaSi S.p.A. risk quantification limits” document, prepared annually with the first level units and the risk management unit.
The document sets out the reference values and ranges for each first and second level indicator assi-gned to monitor CartaSi’s credit risks, calculated on the basis of analysis of historical series, projec-tions about the company’s future performance and that of the market and indications present in the group’s risk policy.
These values, calculated to contain risk, are approved by the parent’s risk committee and CartaSi’s board of directors.
The risk management unit reports on compliance with these values to the risk committee and iden-tifies any irregularities or critical issues arising from controls of the first and second level limits and CartaSi’s board of directors.
The group has specific maximum gross and net insolvency limits and limits to the related cost to check and measure risk. It monitors these limits constantly as well as expected losses compared to actual losses and losses incurred for business reasons.
This credit risk control consists of preliminary checks by the first level units, starting with the analysis of the credit application. It includes:
▪ internal controls;
▪ consistency controls;
▪ positive and negative information from the credit bureau;
▪ credit scoring algorithms.
Another process relevant for credit risk is the monitoring and recovery of receivables from cardhol-ders and merchants, in order to contain the impact of risk events. The following controls are perfor-med:
▪ daily monitoring of negative events (unpaid direct debits) using a flag to limit the card’s spen-ding limit and possible revoke of the banking counterparties;
▪ daily checks of the use of cash advances in excess of the maximum contractual limits.
Specific processes exist to recover the different types of receivable:
▪ out-of-court collection, including phone collection and/or home visits;
▪ legal proceedings for certain amounts and/or specific reasons.
The credit risk analysis model for directly issued cards uses the historical trends of recorded losses and estimated losses (non-performing positions adjusted by the recovery percentage) normalised by the total exposure for the current month. Its result is VaR.
148
The analysis considers the historical trends starting from May 2010. The operating management me-thods for prior year receivables are not consistent with the currently used one and, therefore, they cannot be used as a comparison.
The results of the historical trends analysis are then used to calculate the annual expected and unex-pected loss.
The expected and unexpected losses, calculated using an annual confidence interval of 99%, are subjected to second level controls described in the Quantitative risk limits document.
With respect to its servicing activities, CartaSi does not have risks related to receivables due directly from retail customers as it provides issuing servicing and acquiring servicing activities. Therefore, the related credit risk falls on the banks that have the issuing and/or acquiring licences.
In the case of servicing, credit risk refers to the customer banks, which are subject to supervision, and the risk disappears within 30 days (the time period between issue of one account statement and the next) with an average exposure of 15 days. This exposure is borne by ICBPI.
Credit risk mitigation techniques
In order to mitigate credit risk, the relevant bodies may decide to tie the granting of credit facilities to the receipt of suitable guarantees, based on the results of the related credit facility application in-vestigation. These guarantees may be collateral, such as securities and/or cash deposits, contractual guarantees or endorsement guarantees.
The credit office and the securities services department regularly check at least once a year the quan-titative and qualitative adequacy of the guarantees given by customers. In the case of ascertained total or partial default, they request the customers integrate the guarantees on a timely basis. If this does not take place, they immediately revise the position to comply with the identified risks.
The acquired guarantees do not have specific limits that could affect their legal validity.
There were no significant changes in the management of guarantees compared to the previous year.
Impaired financial assets
The credit committee regularly reviews all potentially irregular positions and decides on the recove-ry activities to be taken as well as changes in the position’s status, based on the relevant parameters. These decisions are reviewed by the board of directors.
Classification of assets by debtor quality complies with the categories established by Bank of Italy.
With respect to impaired positions, impairment losses are recognised after the individual measure-ment of each position.
With respect to CartaSi, impairment losses are made collectively. Assets are tested for impairment by
149
2015 Reports and Financial Statements
category and the loss percentages are estimated considering historical figures that allow an estimate of possible losses.
Country risk
Country risk is the risk of losses caused by events that take place in countries other than Italy. This concept is wider than that for sovereign risk as it covers all exposures regardless of the type of counterparty involved, be they natural persons, businesses, banks or public administrations.
The group includes country risk as part of credit risk and it is not a significant risk given that:
▪ most of ICBPI’s exposures are with parties that offer settlement and custody services, such as Clearstream and Euroclear, or international banks (e.g., Barclays, BNP Paribas), that can reasona-bly be assumed to be very independent economically of the country where their head office is;
▪ CartaSi’s exposures are solely with international circuits (Mastercard and Visa, both of which have their registered office in the US) as part of the process to settle card transactions. Once again, it is reasonable to assume that they are very independent of the countries where their head office is in economical terms;
▪ the exposures are mostly with parties based in countries with high ratings;
▪ the capital requirement for credit risk is calculated without using the counterparty rating pa-rameter but solely the rating of the counterparty’s country of residence. Therefore, the capital requirement includes the country risk component.
Both for country and issuer risks, the risk management unit checks that the securities in portfolio have the characteristics indicated in the financial regulation once a month and prepares a quarterly report for the manager of the relevant department and the managing director.
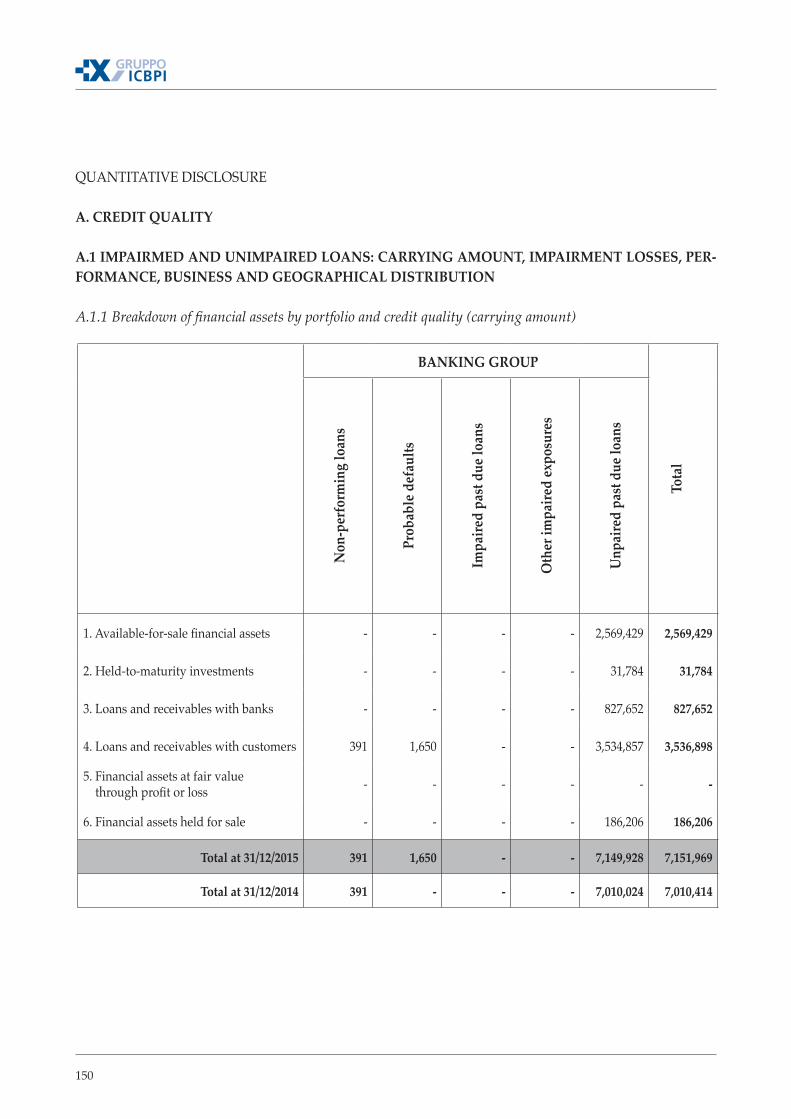
150
QUANTITATIVE DISCLOSURE A. CREDIT QUALITY A.1 IMPAIRMED AND UNIMPAIRED LOANS: CARRYING AMOUNT, IMPAIRMENT LOSSES, PER-FORMANCE, BUSINESS AND GEOGRAPHICAL DISTRIBUTION
A.1.1 Breakdown of financial assets by portfolio and credit quality (carrying amount)
BANKING GROUP
Tota
l
Non
-per
form
ing
loan
s
Prob
able
def
aults
Impa
ired
past
due
loan
s
Oth
er im
paire
d ex
posu
res
Unp
aire
d pa
st d
ue lo
ans
1. Available-for-sale financial assets - - - - 2,569,429 2,569,429
2. Held-to-maturity investments - - - - 31,784 31,784
3. Loans and receivables with banks - - - - 827,652 827,652
4. Loans and receivables with customers 391 1,650 - - 3,534,857 3,536,898
5. Financial assets at fair value through profit or loss - - - - - -
6. Financial assets held for sale - - - - 186,206 186,206
Total at 31/12/2015 391 1,650 - - 7,149,928 7,151,969
Total at 31/12/2014 391 - - - 7,010,024 7,010,414
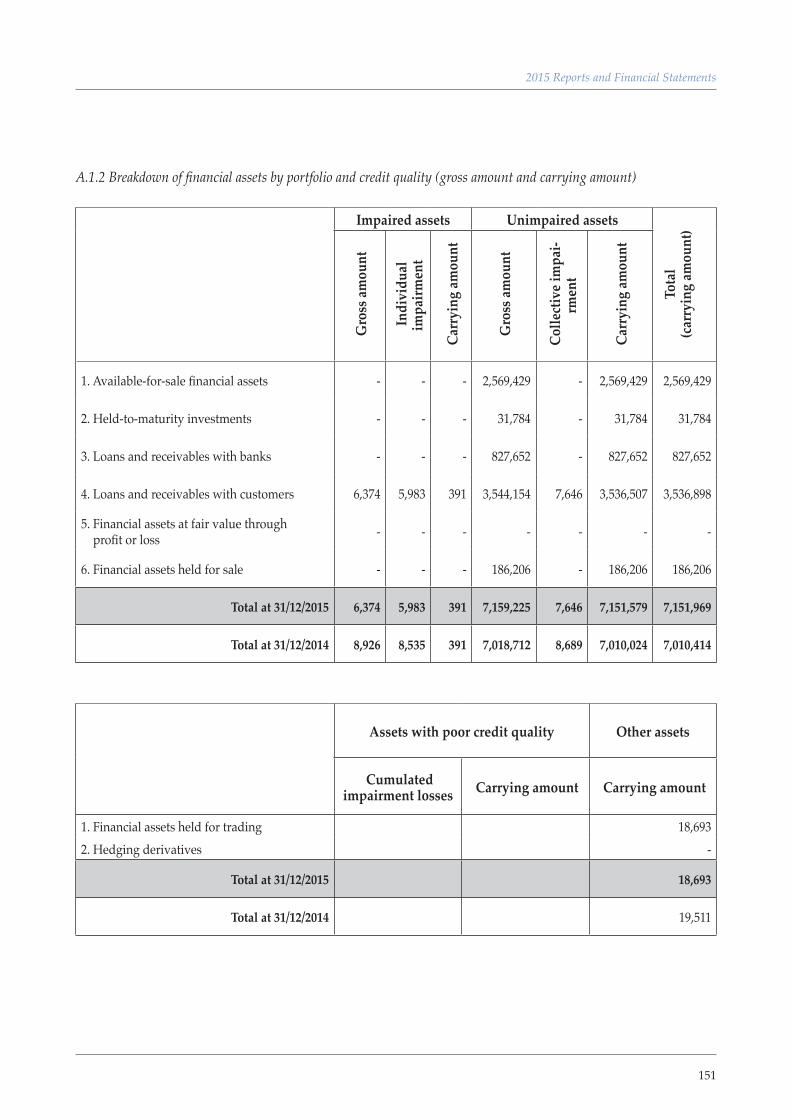
151
2015 Reports and Financial Statements
A.1.2 Breakdown of financial assets by portfolio and credit quality (gross amount and carrying amount)
Impaired assets Unimpaired assets
Tota
l (c
arry
ing
amou
nt)
Gro
ss am
ount
Indi
vidu
al
impa
irmen
t
Car
ryin
g am
ount
Gro
ss am
ount
Col
lect
ive i
mpa
i-rm
ent
Car
ryin
g am
ount
1. Available-for-sale financial assets - - - 2,569,429 - 2,569,429 2,569,429
2. Held-to-maturity investments - - - 31,784 - 31,784 31,784
3. Loans and receivables with banks - - - 827,652 - 827,652 827,652
4. Loans and receivables with customers 6,374 5,983 391 3,544,154 7,646 3,536,507 3,536,898
5. Financial assets at fair value through profit or loss - - - - - - -
6. Financial assets held for sale - - - 186,206 - 186,206 186,206
Total at 31/12/2015 6,374 5,983 391 7,159,225 7,646 7,151,579 7,151,969
Total at 31/12/2014 8,926 8,535 391 7,018,712 8,689 7,010,024 7,010,414
Assets with poor credit quality Other assets
Cumulated impairment losses Carrying amount Carrying amount
1. Financial assets held for trading 18,693 2. Hedging derivatives -
Total at 31/12/2015 18,693
Total at 31/12/2014 19,511
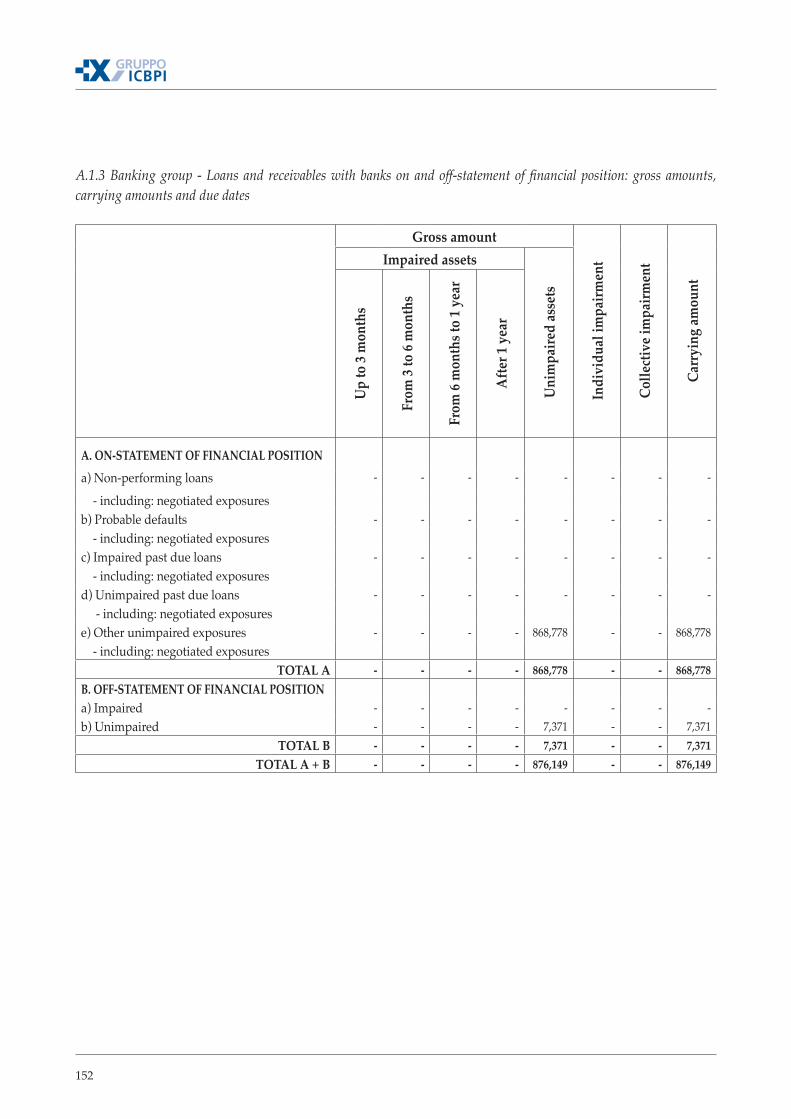
152
A.1.3 Banking group - Loans and receivables with banks on and off-statement of financial position: gross amounts, carrying amounts and due dates
Gross amount
Indi
vidu
al im
pairm
ent
Colle
ctiv
e im
pairm
ent
Carr
ying
amou
nt
Impaired assets
Uni
mpa
ired
asse
ts
Up
to 3
mon
ths
From
3 to
6 m
onth
s
From
6 m
onth
s to
1 yea
r
Afte
r 1 y
ear
A. ON-STATEMENT OF FINANCIAL POSITIONa) Non-performing loans - - - - - - - -
- including: negotiated exposures b) Probable defaults - - - - - - - - - including: negotiated exposures c) Impaired past due loans - - - - - - - - - including: negotiated exposures d) Unimpaired past due loans - - - - - - - - - including: negotiated exposurese) Other unimpaired exposures - - - - 868,778 - - 868,778 - including: negotiated exposures
TOTAL A - - - - 868,778 - - 868,778 B. OFF-STATEMENT OF FINANCIAL POSITIONa) Impaired - - - - - - - - b) Unimpaired - - - - 7,371 - - 7,371
TOTAL B - - - - 7,371 - - 7,371 TOTAL A + B - - - - 876,149 - - 876,149
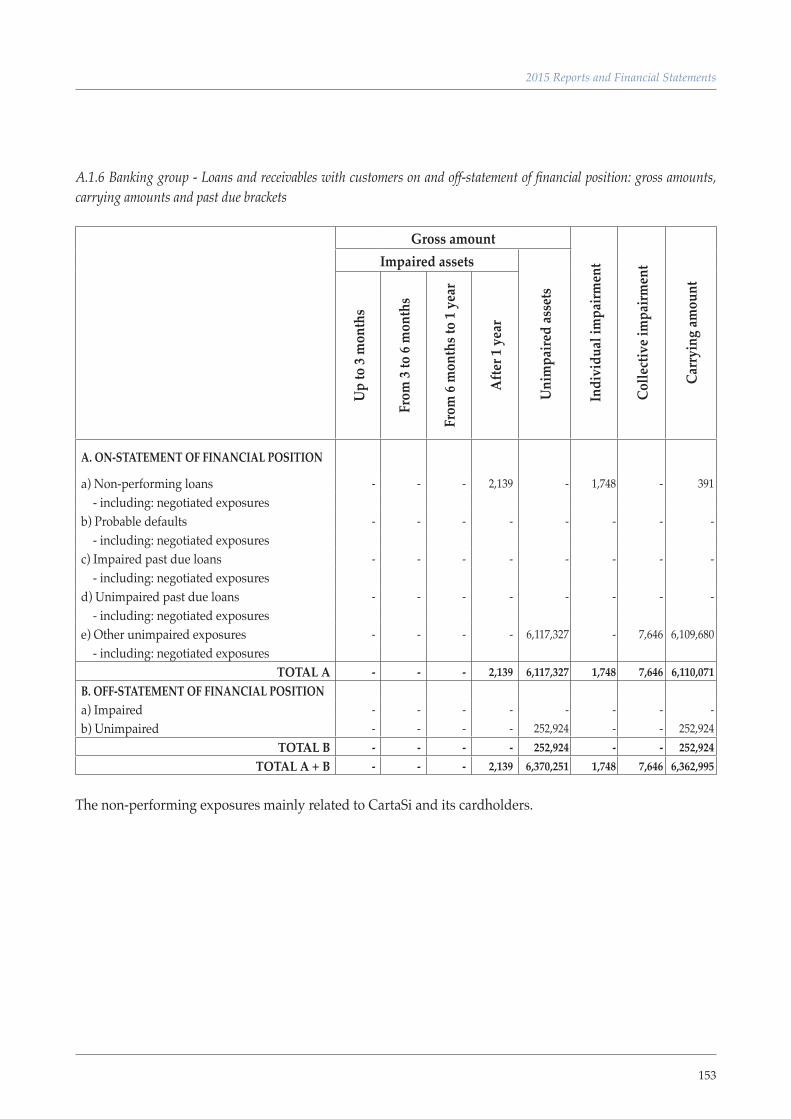
153
2015 Reports and Financial Statements
A.1.6 Banking group - Loans and receivables with customers on and off-statement of financial position: gross amounts, carrying amounts and past due brackets
Gross amount
Indi
vidu
al im
pairm
ent
Colle
ctiv
e im
pairm
ent
Carr
ying
amou
nt
Impaired assets
Uni
mpa
ired
asse
ts
Up
to 3
mon
ths
From
3 to
6 m
onth
s
From
6 m
onth
s to
1 yea
r
Afte
r 1 y
ear
A. ON-STATEMENT OF FINANCIAL POSITION
a) Non-performing loans - - - 2,139 - 1,748 - 391 - including: negotiated exposures b) Probable defaults - - - - - - - - - including: negotiated exposuresc) Impaired past due loans - - - - - - - - - including: negotiated exposures d) Unimpaired past due loans - - - - - - - - - including: negotiated exposurese) Other unimpaired exposures - - - - 6,117,327 - 7,646 6,109,680 - including: negotiated exposures
TOTAL A - - - 2,139 6,117,327 1,748 7,646 6,110,071 B. OFF-STATEMENT OF FINANCIAL POSITIONa) Impaired - - - - - - - - b) Unimpaired - - - - 252,924 - - 252,924
TOTAL B - - - - 252,924 - - 252,924 TOTAL A + B - - - 2,139 6,370,251 1,748 7,646 6,362,995
The non-performing exposures mainly related to CartaSi and its cardholders.
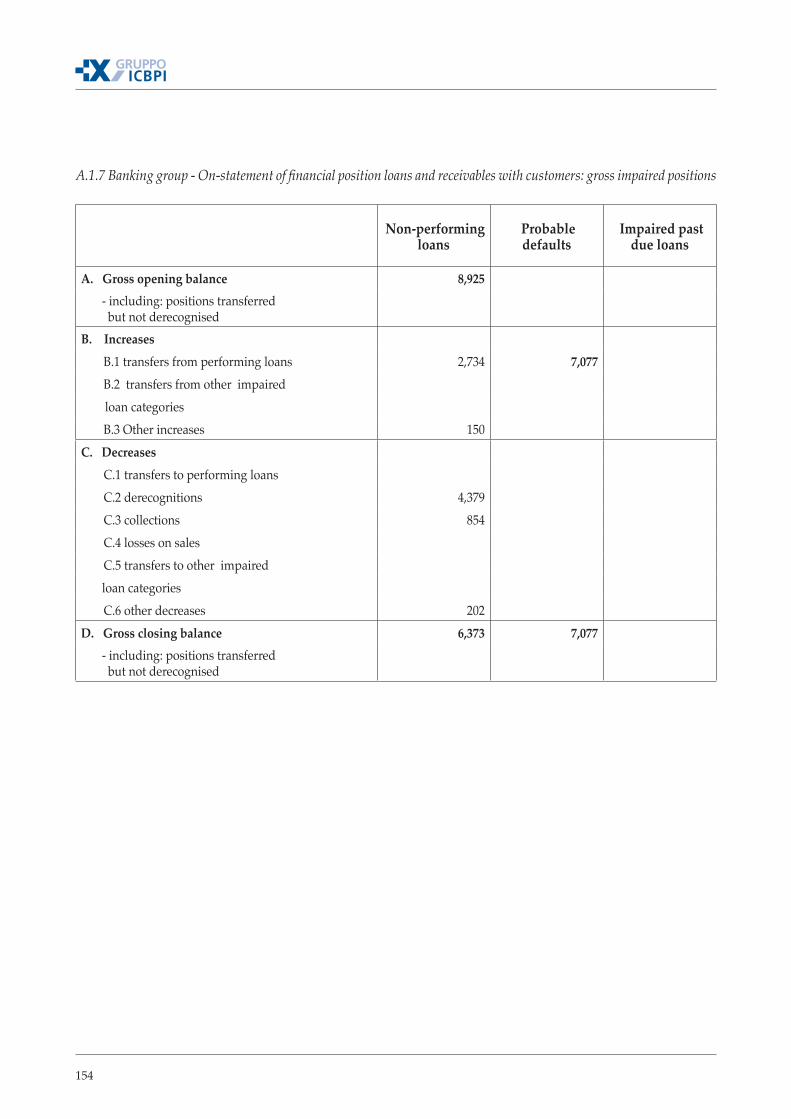
154
A.1.7 Banking group - On-statement of financial position loans and receivables with customers: gross impaired positions
Non-performing loans
Probable defaults
Impaired past due loans
A. Gross opening balance 8,925 - including: positions transferred but not derecognisedB. Increases
B.1 transfers from performing loans 2,734 7,077B.2 transfers from other impaired
loan categoriesB.3 Other increases 150
C. DecreasesC.1 transfers to performing loansC.2 derecognitions 4,379 C.3 collections 854 C.4 losses on salesC.5 transfers to other impaired
loan categoriesC.6 other decreases 202
D. Gross closing balance 6,373 7,077 - including: positions transferred but not derecognised
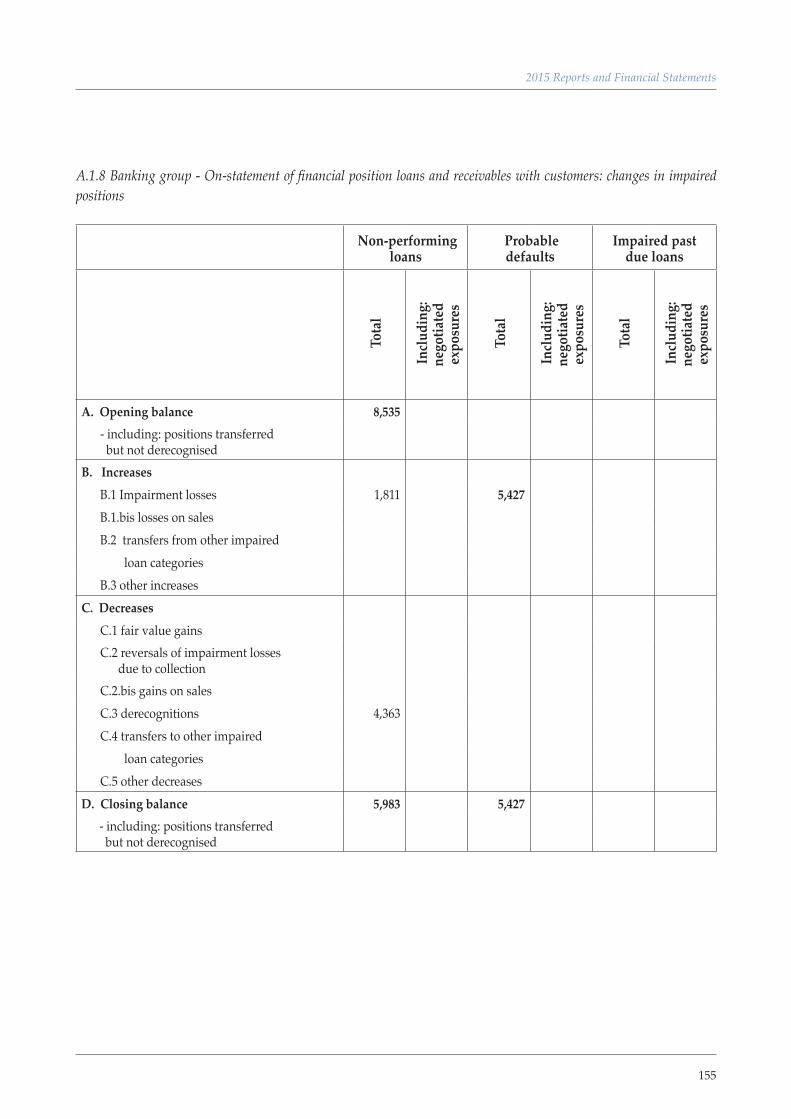
155
2015 Reports and Financial Statements
A.1.8 Banking group - On-statement of financial position loans and receivables with customers: changes in impaired positions
Non-performing loans
Probable defaults
Impaired pastdue loans
Tot
al
Incl
udin
g:
nego
tiate
d ex
posu
res
Tot
al
Incl
udin
g:
nego
tiate
d ex
posu
res
Tot
al
Incl
udin
g:
nego
tiate
d ex
posu
res
A. Opening balance 8,535 - including: positions transferred but not derecognised
B. IncreasesB.1 Impairment losses 1,811 5,427B.1.bis losses on salesB.2 transfers from other impaired loan categoriesB.3 other increases
C. DecreasesC.1 fair value gainsC.2 reversals of impairment losses due to collectionC.2.bis gains on salesC.3 derecognitions 4,363 C.4 transfers to other impaired loan categoriesC.5 other decreases
D. Closing balance 5,983 5,427 - including: positions transferred but not derecognised
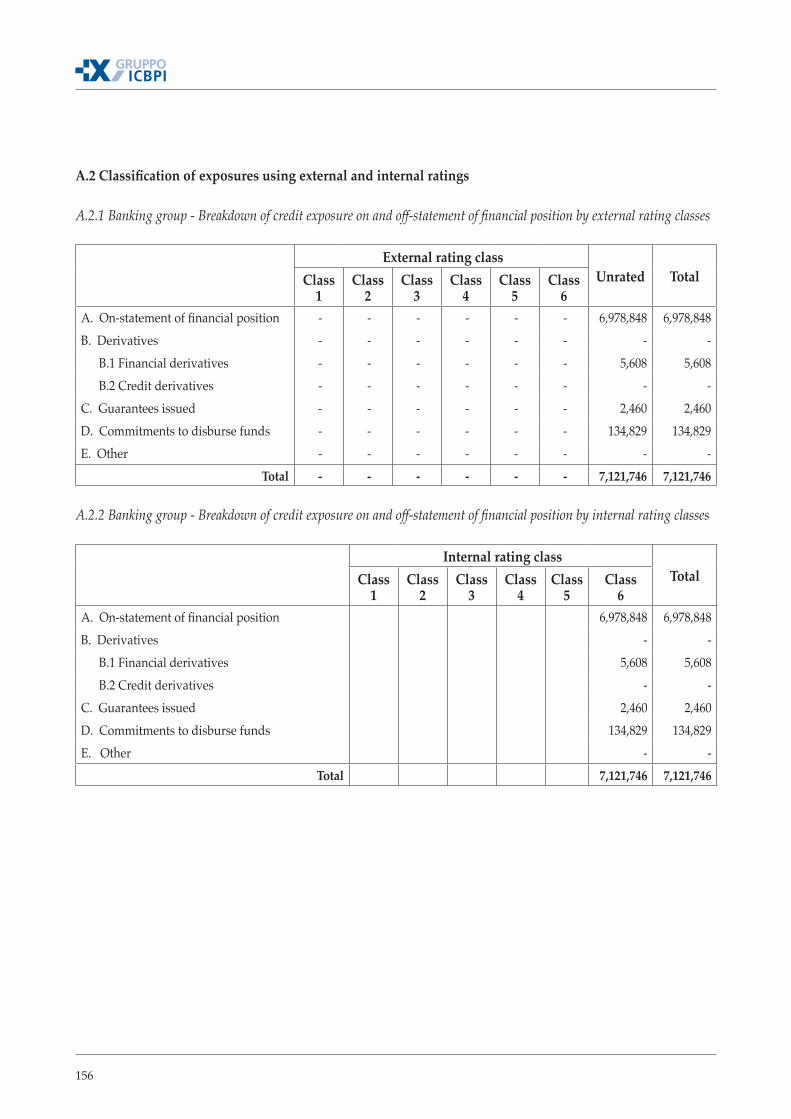
156
A.2 Classification of exposures using external and internal ratings
A.2.1 Banking group - Breakdown of credit exposure on and off-statement of financial position by external rating classes
External rating class Unrated TotalClass
1Class
2Class
3Class
4Class
5Class
6A. On-statement of financial position - - - - - - 6,978,848 6,978,848B. Derivatives - - - - - - - - B.1 Financial derivatives - - - - - - 5,608 5,608 B.2 Credit derivatives - - - - - - - - C. Guarantees issued - - - - - - 2,460 2,460D. Commitments to disburse funds - - - - - - 134,829 134,829 E. Other - - - - - - - -
Total - - - - - - 7,121,746 7,121,746
A.2.2 Banking group - Breakdown of credit exposure on and off-statement of financial position by internal rating classes
Internal rating class TotalClass
1Class
2Class
3Class
4Class
5Class
6A. On-statement of financial position 6,978,848 6,978,848B. Derivatives - - B.1 Financial derivatives 5,608 5,608 B.2 Credit derivatives - - C. Guarantees issued 2,460 2,460D. Commitments to disburse funds 134,829 134,829 E. Other - -
Total 7,121,746 7,121,746
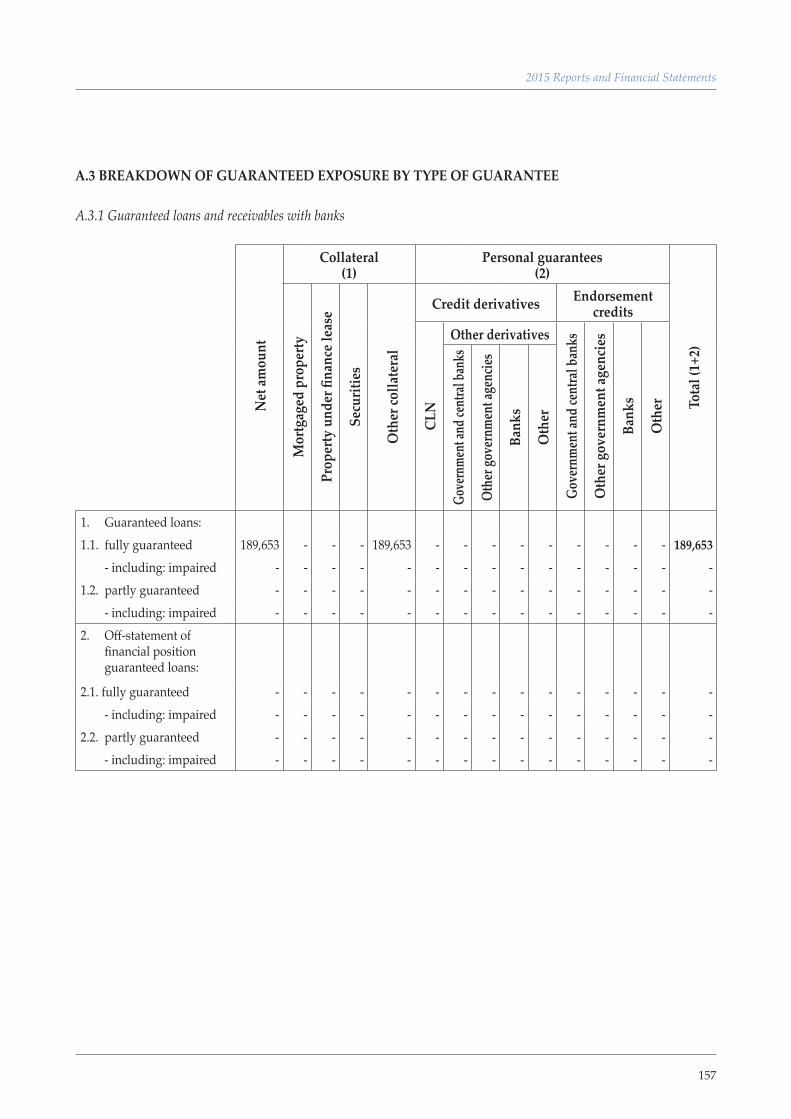
157
2015 Reports and Financial Statements
A.3 BREAKDOWN OF GUARANTEED EXPOSURE BY TYPE OF GUARANTEE
A.3.1 Guaranteed loans and receivables with banks
Net
amou
nt
Collateral(1)
Personal guarantees(2)
Tota
l (1+
2)
Mor
tgag
ed p
rope
rty
Prop
erty
und
er fi
nanc
e lea
se
Secu
ritie
s
Oth
er co
llate
ral
Credit derivatives Endorsement credits
CLN
Other derivatives
Gove
rnm
ent a
nd ce
ntra
l ban
ks
Oth
er g
over
nmen
t age
ncie
s
Bank
s
Oth
er
Gove
rnme
nt an
d cen
tral b
anks
Othe
r gov
ernm
ent a
genc
ies
Bank
s
Oth
er1. Guaranteed loans:1.1. fully guaranteed 189,653 - - - 189,653 - - - - - - - - - 189,653 - including: impaired - - - - - - - - - - - - - - - 1.2. partly guaranteed - - - - - - - - - - - - - - - - including: impaired - - - - - - - - - - - - - - - 2. Off-statement of financial position guaranteed loans:
2.1. fully guaranteed - - - - - - - - - - - - - - - - including: impaired - - - - - - - - - - - - - - - 2.2. partly guaranteed - - - - - - - - - - - - - - - - including: impaired - - - - - - - - - - - - - - -
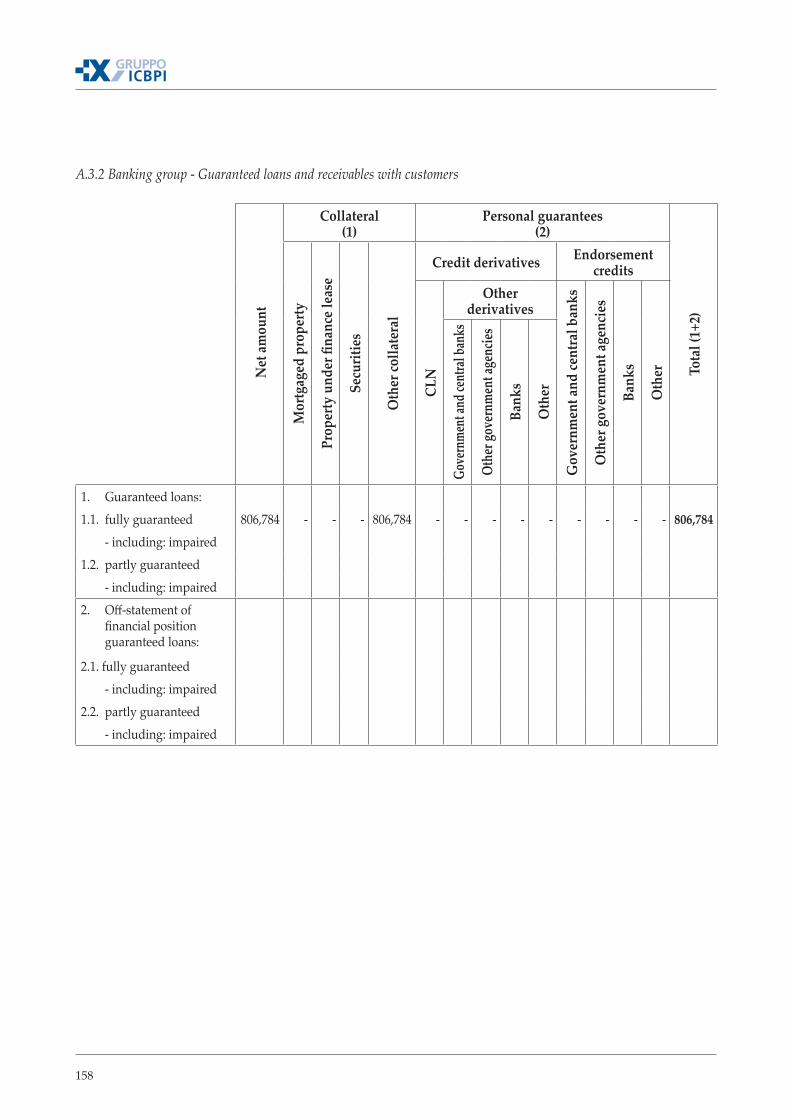
158
A.3.2 Banking group - Guaranteed loans and receivables with customers
Net
amou
nt
Collateral(1)
Personal guarantees (2)
Tota
l (1+
2)
Mor
tgag
ed p
rope
rty
Prop
erty
und
er fi
nanc
e lea
se
Secu
ritie
s
Oth
er co
llate
ral
Credit derivatives Endorsement credits
CLN
Other derivatives
Gov
ernm
ent a
nd ce
ntra
l ban
ks
Oth
er g
over
nmen
t age
ncie
s
Bank
s
Oth
er
Gove
rnme
nt an
d cen
tral b
anks
Othe
r gov
ernm
ent a
genc
ies
Bank
s
Oth
er
1. Guaranteed loans:1.1. fully guaranteed 806,784 - - - 806,784 - - - - - - - - - 806,784 - including: impaired1.2. partly guaranteed - including: impaired2. Off-statement of financial position guaranteed loans:
2.1. fully guaranteed - including: impaired2.2. partly guaranteed - including: impaired
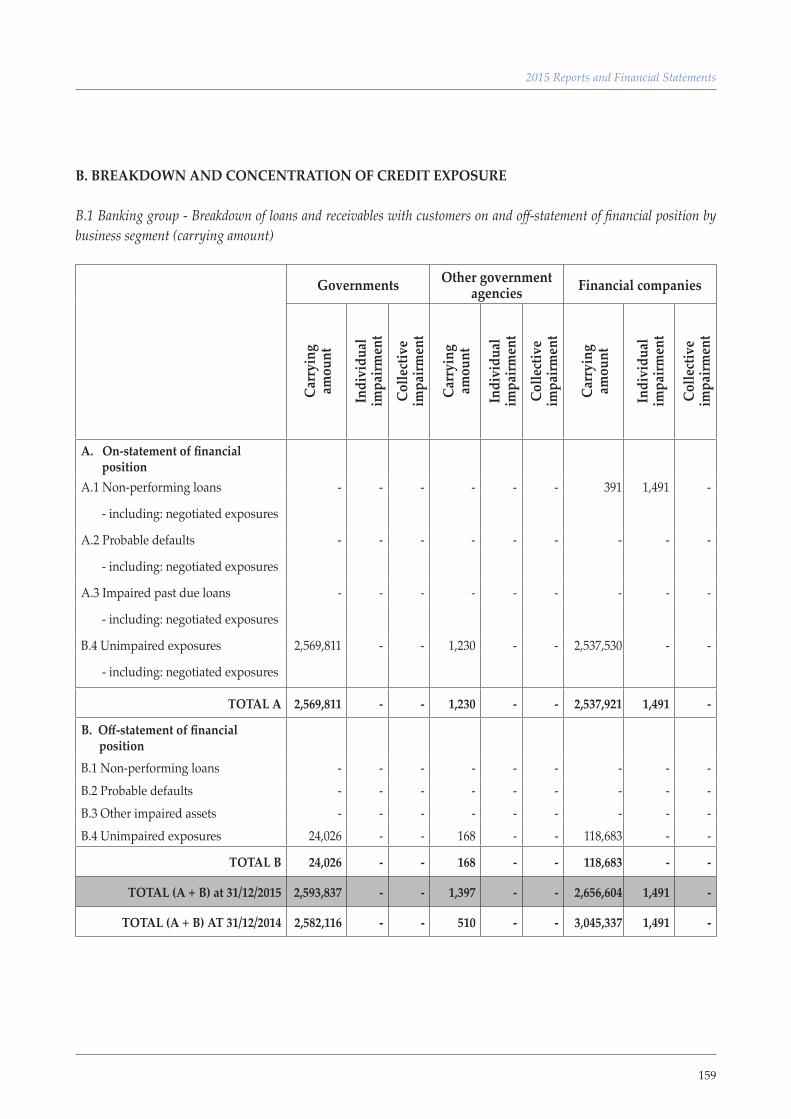
159
2015 Reports and Financial Statements
B. BREAKDOWN AND CONCENTRATION OF CREDIT EXPOSURE
B.1 Banking group - Breakdown of loans and receivables with customers on and off-statement of financial position by business segment (carrying amount)
Governments Other government agencies Financial companies
Carr
ying
am
ount
Indi
vidu
al
impa
irmen
t
Colle
ctiv
e im
pairm
ent
Carr
ying
am
ount
Indi
vidu
al
impa
irmen
t
Colle
ctiv
e im
pairm
ent
Carr
ying
am
ount
Indi
vidu
al
impa
irmen
t
Colle
ctiv
e im
pairm
ent
A. On-statement of financial positionA.1 Non-performing loans - - - - - - 391 1,491 -
- including: negotiated exposures
A.2 Probable defaults - - - - - - - - -
- including: negotiated exposures
A.3 Impaired past due loans - - - - - - - - -
- including: negotiated exposures
B.4 Unimpaired exposures 2,569,811 - - 1,230 - - 2,537,530 - -
- including: negotiated exposures
TOTAL A 2,569,811 - - 1,230 - - 2,537,921 1,491 -
B. Off-statement of financial positionB.1 Non-performing loans - - - - - - - - - B.2 Probable defaults - - - - - - - - - B.3 Other impaired assets - - - - - - - - - B.4 Unimpaired exposures 24,026 - - 168 - - 118,683 - -
TOTAL B 24,026 - - 168 - - 118,683 - -
TOTAL (A + B) at 31/12/2015 2,593,837 - - 1,397 - - 2,656,604 1,491 -
TOTAL (A + B) AT 31/12/2014 2,582,116 - - 510 - - 3,045,337 1,491 -
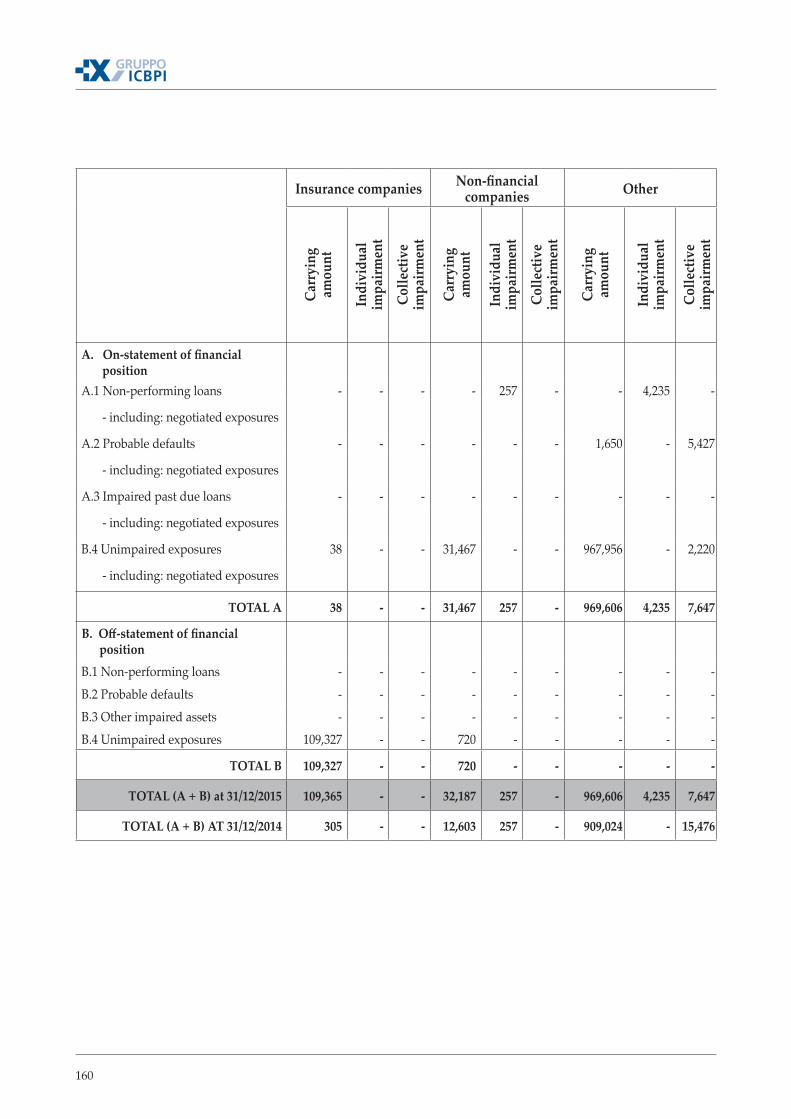
160
Insurance companies Non-financial companies Other
Carr
ying
am
ount
Indi
vidu
al
impa
irmen
t
Colle
ctiv
e im
pairm
ent
Carr
ying
am
ount
Indi
vidu
al
impa
irmen
t
Colle
ctiv
e im
pairm
ent
Carr
ying
am
ount
Indi
vidu
al
impa
irmen
t
Colle
ctiv
e im
pairm
ent
A. On-statement of financial positionA.1 Non-performing loans - - - - 257 - - 4,235 -
- including: negotiated exposures
A.2 Probable defaults - - - - - - 1,650 - 5,427
- including: negotiated exposures
A.3 Impaired past due loans - - - - - - - - -
- including: negotiated exposures
B.4 Unimpaired exposures 38 - - 31,467 - - 967,956 - 2,220
- including: negotiated exposures
TOTAL A 38 - - 31,467 257 - 969,606 4,235 7,647
B. Off-statement of financial positionB.1 Non-performing loans - - - - - - - - - B.2 Probable defaults - - - - - - - - - B.3 Other impaired assets - - - - - - - - - B.4 Unimpaired exposures 109,327 - - 720 - - - - -
TOTAL B 109,327 - - 720 - - - - -
TOTAL (A + B) at 31/12/2015 109,365 - - 32,187 257 - 969,606 4,235 7,647
TOTAL (A + B) AT 31/12/2014 305 - - 12,603 257 - 909,024 - 15,476
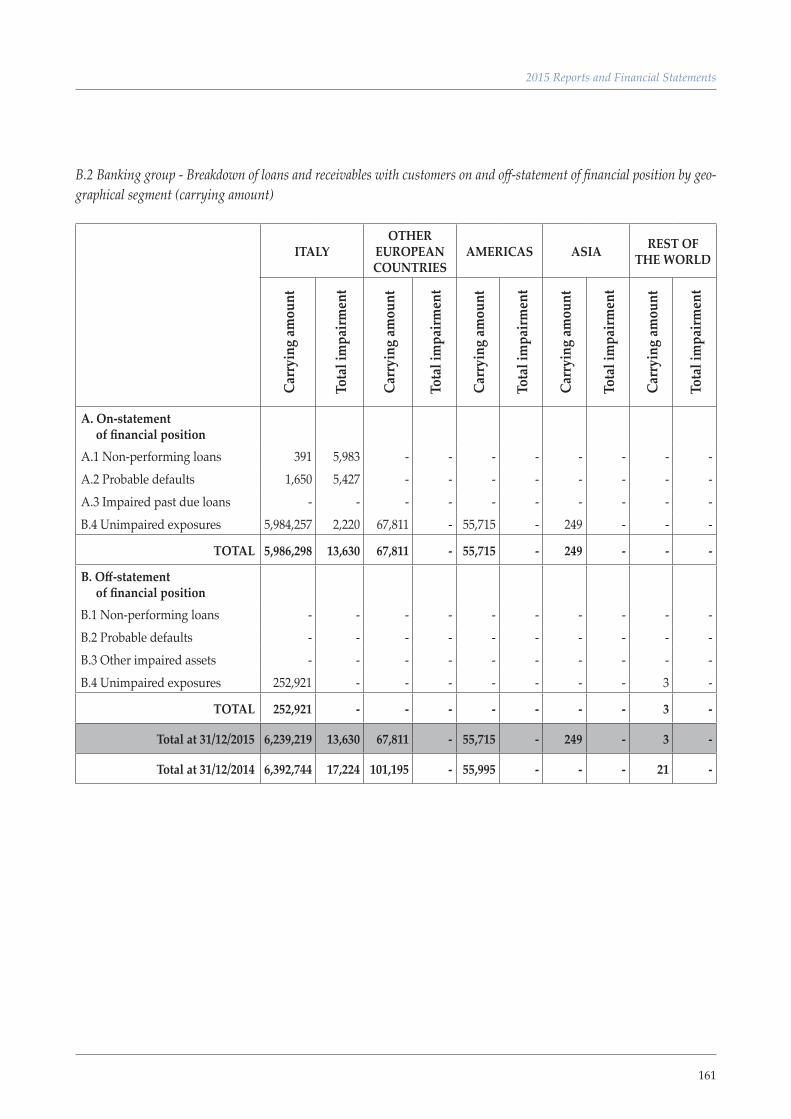
161
2015 Reports and Financial Statements
B.2 Banking group - Breakdown of loans and receivables with customers on and off-statement of financial position by geo-graphical segment (carrying amount)
ITALYOTHER
EUROPEAN COUNTRIES
AMERICAS ASIA REST OF THE WORLD
Carr
ying
amou
nt
Tota
l im
pairm
ent
Carr
ying
amou
nt
Tota
l im
pairm
ent
Carr
ying
amou
nt
Tota
l im
pairm
ent
Carr
ying
amou
nt
Tota
l im
pairm
ent
Carr
ying
amou
nt
Tota
l im
pairm
ent
A. On-statement of financial positionA.1 Non-performing loans 391 5,983 - - - - - - - - A.2 Probable defaults 1,650 5,427 - - - - - - - - A.3 Impaired past due loans - - - - - - - - - - B.4 Unimpaired exposures 5,984,257 2,220 67,811 - 55,715 - 249 - - -
TOTAL 5,986,298 13,630 67,811 - 55,715 - 249 - - -
B. Off-statement of financial positionB.1 Non-performing loans - - - - - - - - - - B.2 Probable defaults - - - - - - - - - - B.3 Other impaired assets - - - - - - - - - - B.4 Unimpaired exposures 252,921 - - - - - - - 3 -
TOTAL 252,921 - - - - - - - 3 -
Total at 31/12/2015 6,239,219 13,630 67,811 - 55,715 - 249 - 3 -
Total at 31/12/2014 6,392,744 17,224 101,195 - 55,995 - - - 21 -
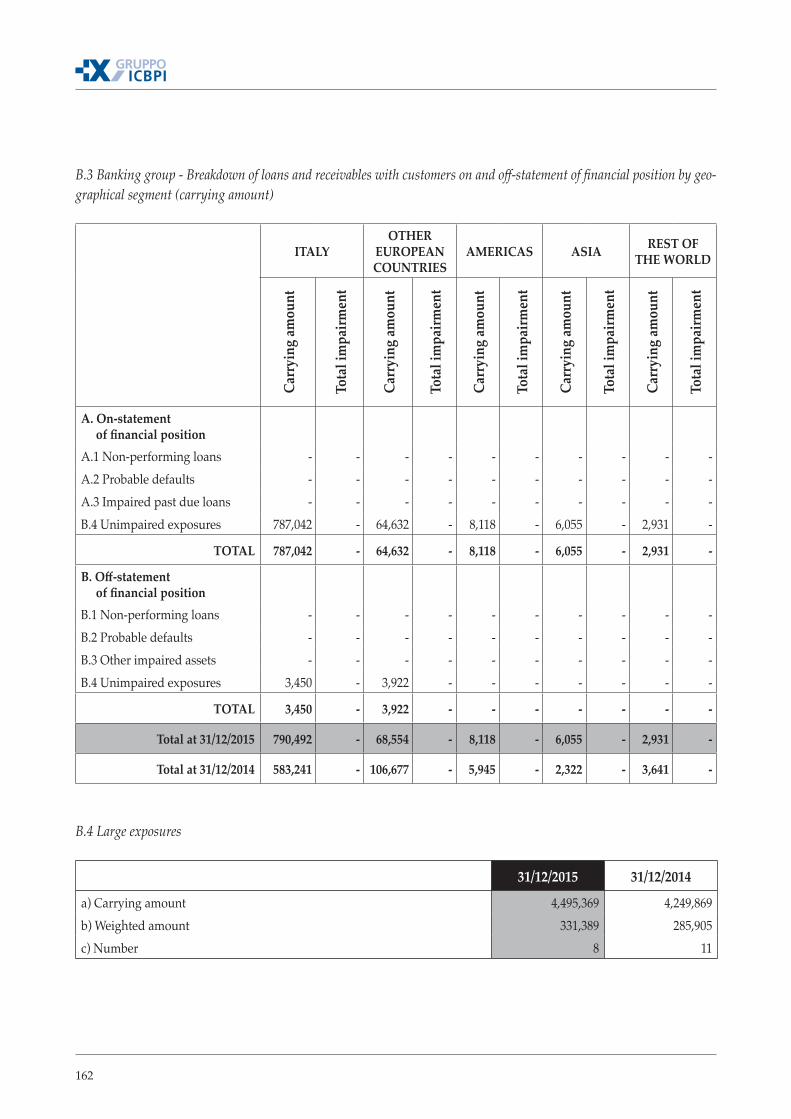
162
B.3 Banking group - Breakdown of loans and receivables with customers on and off-statement of financial position by geo-graphical segment (carrying amount)
ITALYOTHER
EUROPEAN COUNTRIES
AMERICAS ASIA REST OF THE WORLD
Carr
ying
amou
nt
Tota
l im
pairm
ent
Carr
ying
amou
nt
Tota
l im
pairm
ent
Carr
ying
amou
nt
Tota
l im
pairm
ent
Carr
ying
amou
nt
Tota
l im
pairm
ent
Carr
ying
amou
nt
Tota
l im
pairm
ent
A. On-statement of financial positionA.1 Non-performing loans - - - - - - - - - - A.2 Probable defaults - - - - - - - - - - A.3 Impaired past due loans - - - - - - - - - - B.4 Unimpaired exposures 787,042 - 64,632 - 8,118 - 6,055 - 2,931 -
TOTAL 787,042 - 64,632 - 8,118 - 6,055 - 2,931 -
B. Off-statement of financial positionB.1 Non-performing loans - - - - - - - - - - B.2 Probable defaults - - - - - - - - - - B.3 Other impaired assets - - - - - - - - - - B.4 Unimpaired exposures 3,450 - 3,922 - - - - - - -
TOTAL 3,450 - 3,922 - - - - - - -
Total at 31/12/2015 790,492 - 68,554 - 8,118 - 6,055 - 2,931 -
Total at 31/12/2014 583,241 - 106,677 - 5,945 - 2,322 - 3,641 -
B.4 Large exposures
31/12/2015 31/12/2014
a) Carrying amount 4,495,369 4,249,869 b) Weighted amount 331,389 285,905 c) Number 8 11
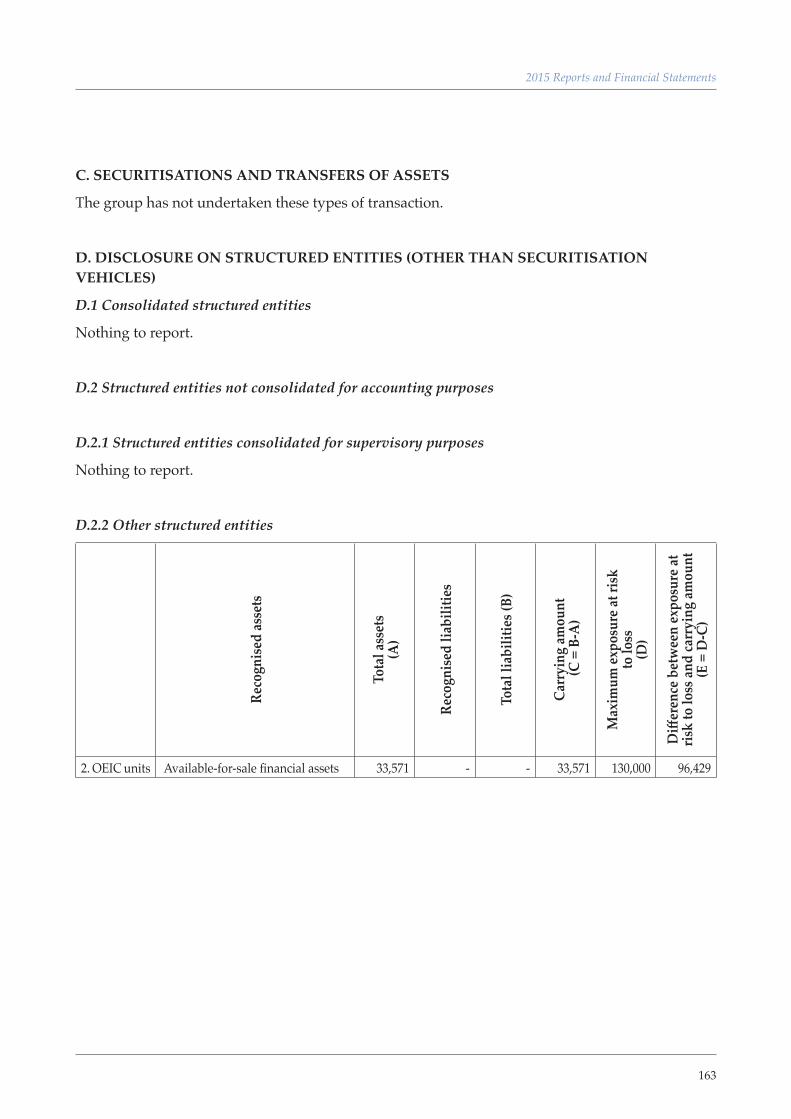
163
2015 Reports and Financial Statements
C. SECURITISATIONS AND TRANSFERS OF ASSETS
The group has not undertaken these types of transaction.
D. DISCLOSURE ON STRUCTURED ENTITIES (OTHER THAN SECURITISATION VEHICLES)
D.1 Consolidated structured entities
Nothing to report.
D.2 Structured entities not consolidated for accounting purposes
D.2.1 Structured entities consolidated for supervisory purposes
Nothing to report.
D.2.2 Other structured entities
Reco
gnis
ed as
sets
Tota
l ass
ets
(A)
Reco
gnis
ed li
abili
ties
Tota
l lia
bilit
ies (
B)
Carr
ying
amou
nt (C
= B
-A)
Max
imum
expo
sure
at ri
sk
to lo
ss
(D)
Diff
eren
ce b
etw
een
expo
sure
at
risk
to lo
ss an
d ca
rryi
ng am
ount
(E
= D
-C)
2. OEIC units Available-for-sale financial assets 33,571 - - 33,571 130,000 96,429
164
E. TRANSFERS
The group has not performed any transfers.
F. BANKING GROUP - CREDIT RISK MEASUREMENT MODELS
The group does not have state-of-the-art tools to measure credit risk given its profile.
1.2 BANKING GROUP - MARKET RISKS
QUALITATIVE DISCLOSURE
Market risk
Market risk is the risk of incurring losses generated by operating on the market for financial instru-ments (regulatory trading book), currencies and commodities, due to fluctuations in market factors or the issuer’s situation. This risk is applicable to ICBPI as it manages financial instruments on the group’s behalf. Activities that generate market risk are performed by the treasury and finance unit and the securities services department. Specifically, the treasury and finance unit performs in-vestment and treasury transactions on EU and non-EU markets, it manages the AFT banking book and also manages day-to-day liquidity. The securities services department acts as a market marker and trades in the financial instruments requested by customers.
The finance regulation governs these activities and defines the operating limits for the subcompo-nents of market risk, such as currency risk, interest rate risk on the trading book, issuer risk and counterparty risk. In addition, the regulation sets operating limits for the various activities for the amounts involved, VaR, the stop loss as well as the criteria and methods to monitor positions.
The governance model in place to manage and monitor risks is based on the segregation between the management processes and the risk control processes on the one hand and, on the other, deve-lopment of processes to manage and monitor risks in line with the group’s hierarchical structure and by assigning proxies.
The treasury and finance unit and the securities services department report to the liquidity and fi-nance committee, which analyses the group’s positions and defines financial policies.
The first level controls are carried out by the treasury and finance unit and the securities services de-partment for the activities related to them, while the second level controls are performed by the risk management unit. This unit monitors market risk on a daily basis using the VaR of the positions in securities and foreign currency. It also performs second level controls on compliance with assigned limits.
The risk management unit also checks and processes ex post the data related to the group’s total risk positions each day and prepares the reports necessary to check the limits set by the finance regula-tion. It also performs specific tests (back testing and stress testing) to check the level of existing risk scenarios or future scenarios for the current portfolio. If the VaR limits are exceeded, the risk mana-
165
2015 Reports and Financial Statements
gement unit manager promptly informs the relevant unit, its manager and the managing director. The risk management unit also informs the treasury and finance service unit and/or the securities services unit manager of situations that are close to exceeding their limits. The unit ensures that suf-ficient information about transactions involving derivatives is provided in its reports.
It monitors positions in securities and foreign currency using VaR with a confidence interval of 99% and a time horizon of 10 days, calculated using a parametric model. This test is performed on the entire portfolio, separating the HFT portfolio from the HTM portfolio and the AFS portfolio, which are monitored directly by the board of directors.
The VaR, defined to obtain a reasonable estimate of potential losses in normal market conditions, is not designed to, nor does it, include an analysis of extreme events. Stress tests are used to check the impact of extreme conditions on the portfolio and violations of the assumptions underlying the model used by identifying the remaining risk and providing information complementary to VaR.
Daily stress tests are performed on the VaR of securities and currencies as well as the daily calcula-tion of VaR.
Basis risk
The basis risk is defined as the risk of losses caused by unmatched variations in the spot and future price that are similar but not identical. This risk is especially pertinent to banks that calculate their capital requirements using standard methods by offsetting positions in one or more equities inclu-ded in an equity index with one or more future positions/other derivatives linked to this index or that offset opposing positions in futures on equity indexes that do not have the same expiry date, composition or both.
The group is not exposed to this risk as it does not use futures/derivatives to hedge positions expo-sed to market risk and, therefore, these instruments are not included in the calculation of the capital requirement for market risk using the standard method. The group’s operations in banking book derivatives is limited to trading in OTC options which, as per its internal regulations, does not ge-nerate positions. The risk positions for other financial instruments are hedged by specular hedges.
1.2.1 INTEREST RATE AND PRICE RISK - REGULATORY TRADING BOOK
QUALITATIVE DISCLOSURE
General aspects about interest rate risk
This risk is inherent in the group’s core banking business as it is part of the process of change over time, space and form of financial resources and in the financial assets trading business.
The objectives and strategies underlying trading activities in place to manage the securities portfolio are designed to maximise profitability and exploit investment opportunities as part of an approach to contain risks. This leads the group to have a bonds portfolio with a short duration.
166
Like in previous years, the interest rate risk is non-negligible given the temporary mismatching of the assets and liabilities arising from ICBPI’s operations.
The trading book includes financial instruments subject to regulatory capital requirements for mar-ket risk, as defined in the supervisory communication regulations.
Interest rate risk management processes and measurement methods
The parent’s risk management unit performs stress tests on the interest rate risk, assuming parallel movements in the interest rate curve and analysing the related effects.
General aspects about price risk
Price risk is the risk of fluctuations in the prices of financial instruments due to variations in market variables or specific factors of the issuers or counterparties. It can be general, due to a change in the price of an equity instrument caused by fluctuations in the reference market, or specific, caused by a change in the price of a specific equity instrument compared to its reference market following chan-ges in expectations about the financial soundness or future profitability of the issuer.
Management and measurement of price risk
Like for the other risks, the group’s strategy adopted to manage price risk is prudent.
This risk is monitored through specific reports and by calculating the VaR (which is performed daily by the risk management unit).
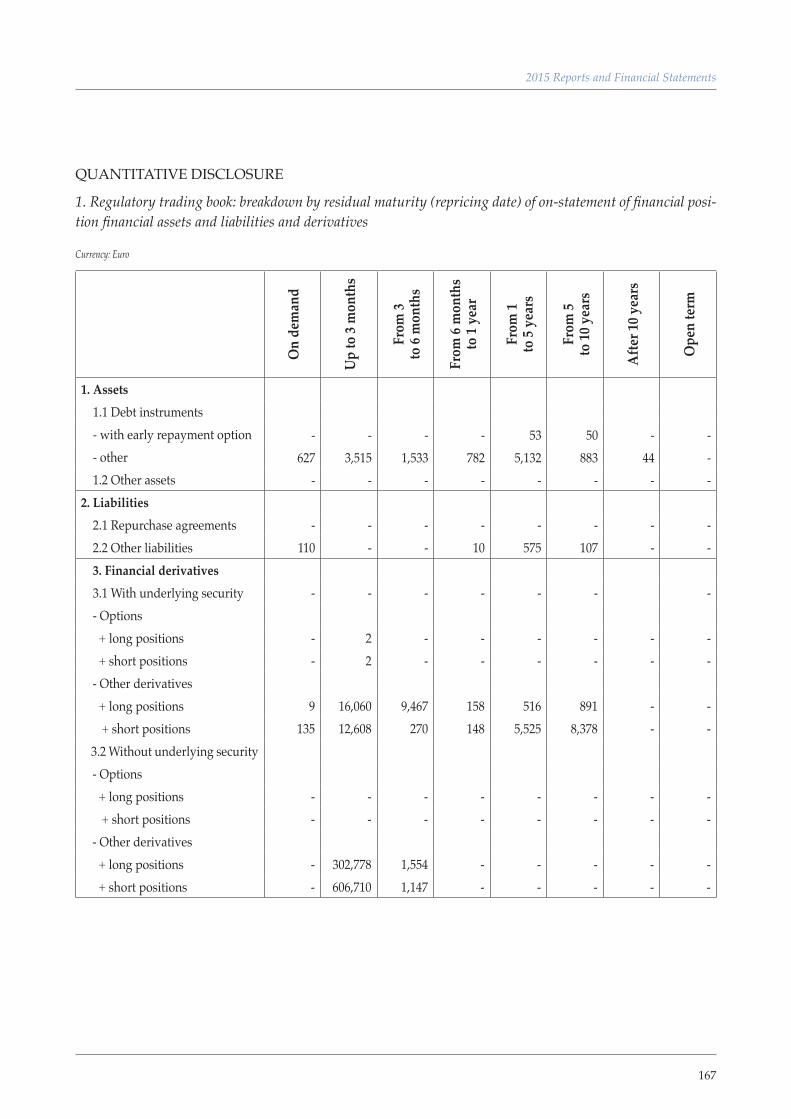
167
2015 Reports and Financial Statements
QUANTITATIVE DISCLOSURE
1. Regulatory trading book: breakdown by residual maturity (repricing date) of on-statement of financial posi-tion financial assets and liabilities and derivatives
Currency: Euro
On
dem
and
Up
to 3
mon
ths
From
3 to
6 m
onth
s
From
6 m
onth
s to
1 ye
ar
From
1 to
5 ye
ars
From
5 to
10 y
ears
Afte
r 10 y
ears
Ope
n te
rm
1. Assets 1.1 Debt instruments - with early repayment option - - - - 53 50 - - - other 627 3,515 1,533 782 5,132 883 44 - 1.2 Other assets - - - - - - - - 2. Liabilities 2.1 Repurchase agreements - - - - - - - - 2.2 Other liabilities 110 - - 10 575 107 - - 3. Financial derivatives 3.1 With underlying security - - - - - - - - Options + long positions - 2 - - - - - - + short positions - 2 - - - - - - - Other derivatives + long positions 9 16,060 9,467 158 516 891 - - + short positions 135 12,608 270 148 5,525 8,378 - - 3.2 Without underlying security - Options + long positions - - - - - - - - + short positions - - - - - - - - - Other derivatives + long positions - 302,778 1,554 - - - - - + short positions - 606,710 1,147 - - - - -
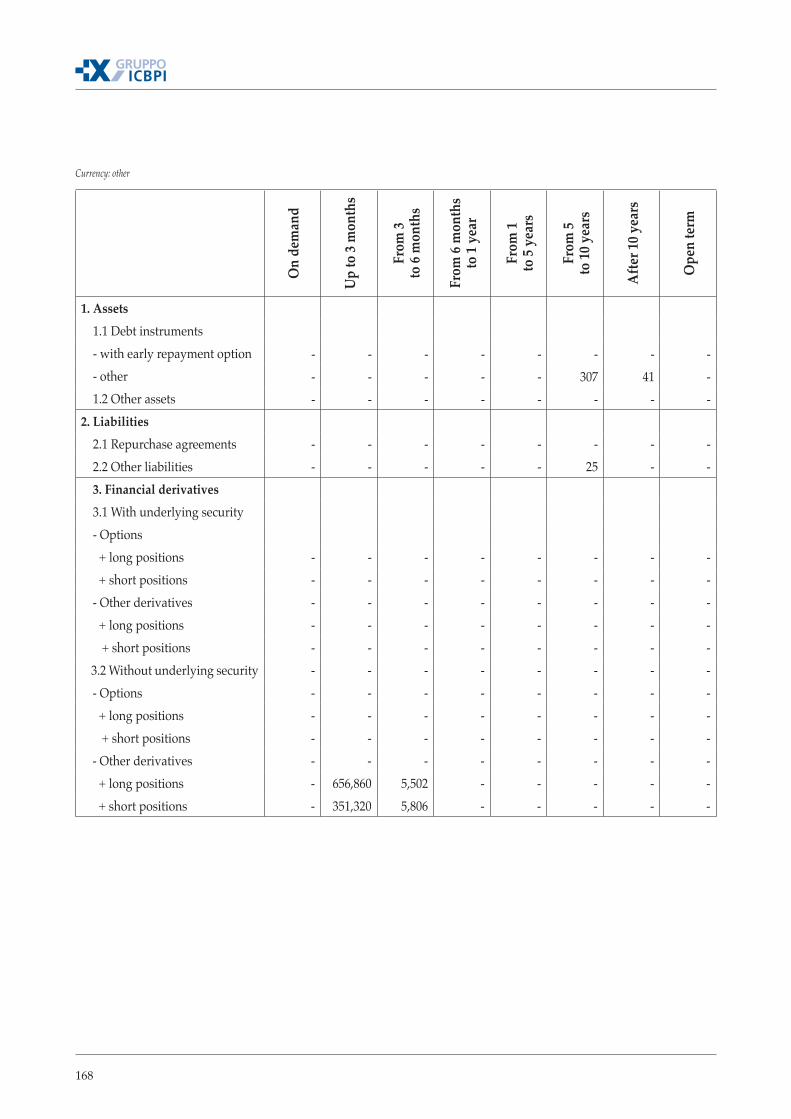
168
Currency: other
On
dem
and
Up
to 3
mon
ths
From
3 to
6 m
onth
s
From
6 m
onth
s to
1 ye
ar
From
1 to
5 ye
ars
From
5 to
10 y
ears
Afte
r 10 y
ears
Ope
n te
rm
1. Assets 1.1 Debt instruments - with early repayment option - - - - - - - - - other - - - - - 307 41 - 1.2 Other assets - - - - - - - - 2. Liabilities 2.1 Repurchase agreements - - - - - - - - 2.2 Other liabilities - - - - - 25 - - 3. Financial derivatives 3.1 With underlying security - Options + long positions - - - - - - - - + short positions - - - - - - - - - Other derivatives - - - - - - - - + long positions - - - - - - - - + short positions - - - - - - - - 3.2 Without underlying security - - - - - - - - - Options - - - - - - - - + long positions - - - - - - - - + short positions - - - - - - - - - Other derivatives - - - - - - - - + long positions - 656,860 5,502 - - - - - + short positions - 351,320 5,806 - - - - -
169
2015 Reports and Financial Statements
1.2.2 INTEREST RATE AND PRICE RISKS - BANKING BOOK
QUALITATIVE DISCLOSURE
A. General aspects, management and measurement of interest rate risk
The banking book’s interest rate risk is the risk of losses in its value due to potential changes in in-terest rates.
The main source of this type of risk is the repricing risk, i.e., the risk arising from the mismatch of maturity dates and repricing of assets and liabilities, the main aspects of which are:
• yield curve risk, the risk arising from the group’s exposure to changes in the slope and shape of the return curve;
• basis risk, the risk arising from the mismatching of changes in interest rates paid and received on different instruments that may have similar repricing characteristics.
This risk relates solely to the parent for its banking book.
The group’s funding and lending have historically mainly being obtained or granted through cur-rent accounts or with short-term maturities (nearly all within three months). As most of the liquidity in current accounts is that in the giro accounts, which are used for operating purposes and not for funding and/or lending transactions, the group’s actual exposure to this risk is rather limited.
The risk management unit monitors this risk daily to assess its impact using a method based on the guidance set out in Annex C of Title III, Chapter 1 of Bank of Italy Circular no. 285, which assesses the absorption in terms of internal capital of a variation of 200 bp on the return curve on the banking book, weighing the various exposures depending on their residual life and adopting an internal method to classify current accounts, as required by the above-mentioned supervisory regulations.
With respect to CartaSi and its business, positions are concentrated in the “within one month” cate-gory with minimum exposure. Moreover, the mismatching due to the issuing and acquiring activi-ties solely relates to the settlement date and not to the value date, which is the same for credit and debit movements.
General aspects, management and measurement of price risk
The banking book’s price risk mainly refers to the equity investments held for the long term and financial instruments, mostly Italian government bonds, which are not included in the trading book as they are also held for investment purposes.
The board of directors is the sole body responsible for the related internal controls for the latter in-struments.

170
B1. Fair value hedges
Not applicable.
C. Cash flow hedges
The group’s hedging strategies are generic and may also refer to the interest rate risk applicable to the on-demand items.
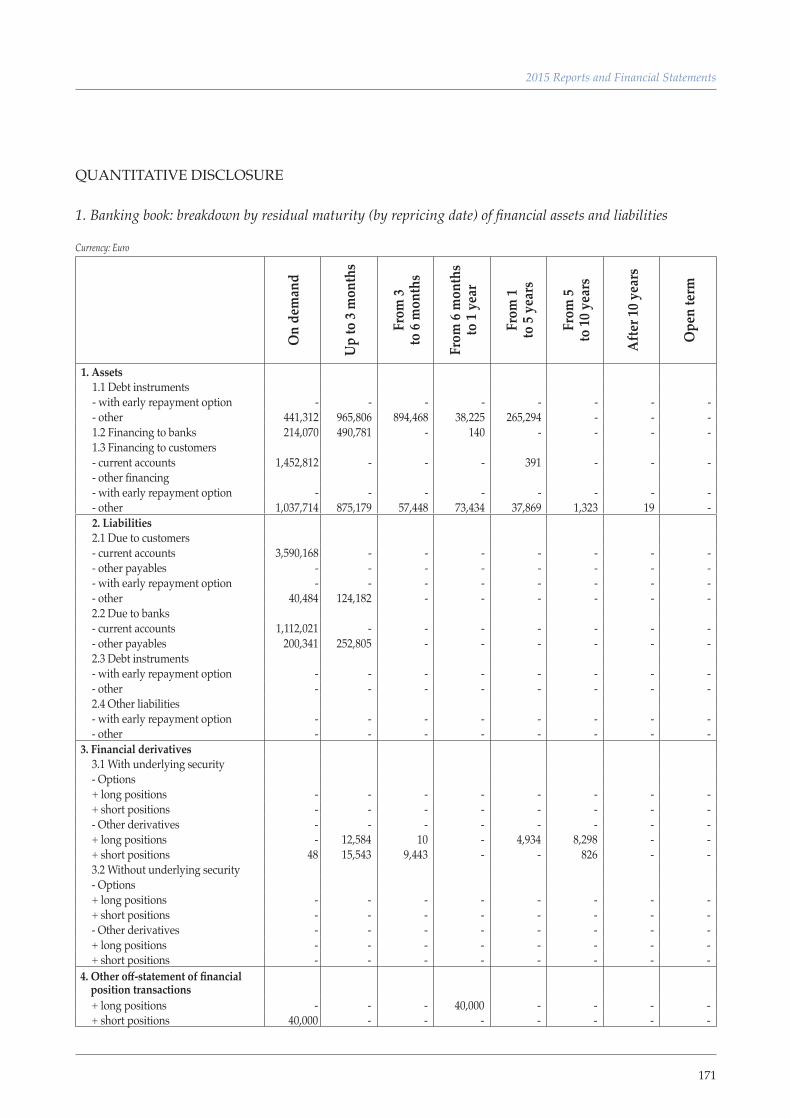
171
2015 Reports and Financial Statements
QUANTITATIVE DISCLOSURE 1. Banking book: breakdown by residual maturity (by repricing date) of financial assets and liabilities
Currency: Euro
On
dem
and
Up
to 3
mon
ths
From
3 to
6 m
onth
s
From
6 m
onth
s to
1 ye
ar
From
1 to
5 ye
ars
From
5 to
10 y
ears
Afte
r 10 y
ears
Ope
n te
rm
1. Assets 1.1 Debt instruments - with early repayment option - - - - - - - - - other 441,312 965,806 894,468 38,225 265,294 - - - 1.2 Financing to banks 214,070 490,781 - 140 - - - - 1.3 Financing to customers - current accounts 1,452,812 - - - 391 - - - - other financing - with early repayment option - - - - - - - - - other 1,037,714 875,179 57,448 73,434 37,869 1,323 19 - 2. Liabilities 2.1 Due to customers - current accounts 3,590,168 - - - - - - - - other payables - - - - - - - - - with early repayment option - - - - - - - - - other 40,484 124,182 - - - - - - 2.2 Due to banks - current accounts 1,112,021 - - - - - - - - other payables 200,341 252,805 - - - - - - 2.3 Debt instruments - with early repayment option - - - - - - - - - other - - - - - - - - 2.4 Other liabilities - with early repayment option - - - - - - - - - other - - - - - - - -
3. Financial derivatives 3.1 With underlying security - Options + long positions - - - - - - - - + short positions - - - - - - - - - Other derivatives - - - - - - - - + long positions - 12,584 10 - 4,934 8,298 - - + short positions 48 15,543 9,443 - - 826 - - 3.2 Without underlying security - Options + long positions - - - - - - - - + short positions - - - - - - - - - Other derivatives - - - - - - - - + long positions - - - - - - - - + short positions - - - - - - - -
4. Other off-statement of financial position transactions
+ long positions - - - 40,000 - - - - + short positions 40,000 - - - - - - -

172
Currency: other
On
dem
and
Up
to 3
mon
ths
From
3 to
6 m
onth
s
From
6 m
onth
s to
1 ye
ar
From
1 to
5 ye
ars
From
5 to
10 y
ears
Afte
r 10 y
ears
Ope
n te
rm
1. Assets 1.1 Debt instruments - with early repayment option - - - - - - - - - other - - - - - - - - 1.2 Financing to banks 84,988 33,721 62 - - - - - 1.3 Financing to customers - - - - - - - - - current accounts 708 - - - - - - - - other financing - with early repayment option - - - - - - - - - other - - - - - - - - 2. Liabilities 2.1 Due to customers - current accounts 347,386 - - - - - - - - other payables - - - - - - - - - with early repayment option - - - - - - - - - other 345 - - - - - - - 2.2 Due to banks - - - - - - - - - current accounts 66,292 - - - - - - - - other payables - 340 - - - - - - 2.3 Debt instruments - - - - - - - - - with early repayment option - - - - - - - - - other - - - - - - - - 2.4 Other liabilities - - - - - - - - - with early repayment option - - - - - - - - - other - - - - - - - -
3. Financial derivatives 3.1 With underlying security - Options + long positions - - - - - - - - + short positions - - - - - - - - - Other derivatives + long positions - - - - - - - - + short positions - - - - - - - - 3.2 Without underlying security - Options + long positions - - - - - - - - + short positions - - - - - - - - - Other derivatives + long positions - - - - - - - - + short positions - - - - - - - -
4. Other off-statement of financial position transactions
+ long positions - - - - - - - - + short positions - - - - - - - -
173
2015 Reports and Financial Statements
1.2.3 CURRENCY RISK
QUALITATIVE DISCLOSURE
General aspects, management and measurement of currency risk
ICurrency risk arises on the mismatch between foreign currency assets and liabilities (cash and forward) for each currency, originating from positions taken on by the centres specialised in market risk, within the assigned limits and proxies.
Currency risk nearly entirely arises on foreign currency trading activities carried out through tra-ding in market instruments. The risk management unit monitors this risk constantly by calculating the VaR.
The group’s exposure to currency risk, calculated using the net foreign currency positions and a me-thod in line with the supervisory regulations, is negligible because every foreign currency transac-tion with institutional counterparties that generates a currency risk is usually hedged on the market with an offsetting transaction.
It only maintains positions exposed to currency risk within very limited ceilings (which are always fully respected) set for the total maximum exposure, for each currency and VaR.
B. Currency hedges
The trading book is completely hedged with spot forex positions.
The risk management unit checks that the VaR on existing positions is always within the limits set by the finance regulation every day.
Transfer risk
The transfer risk is defined as the risk that a bank, exposed to a party that finances itself in a currency different to that in which it earns most of its income, makes losses due to the debtor’s difficulties in converting its currency into the currency of its exposure.
The group is potentially exposed to this risk due to its credit exposures in foreign currencies and Euro credit exposures of parties based in countries with a legal tender that is not the Euro.
In both cases, these exposures mostly relate to the parent, as the other group companies’ exposures are only in Euros and the counterparties (cardholders and merchants) for CartaSi are parties with tax residence in Italy, for which it is presumed that they have liquidity in Euros.
A detailed analysis of these exposures shows that most of them are with operators, such as Eurocle-ar, Clearstream and BNP Paribs that operate as multi-currency settlement houses. Therefore, it can be assumed that they are able to convert currencies except in extreme conditions of their illiquidity.
Therefore, the group’s transfer risk is very modest, especially if compared to the entire credit risk (of which it can be considered to be an additional component). The amount and composition of expo-sures potentially exposed to transfer risk are monitored every six months to identify any changes.
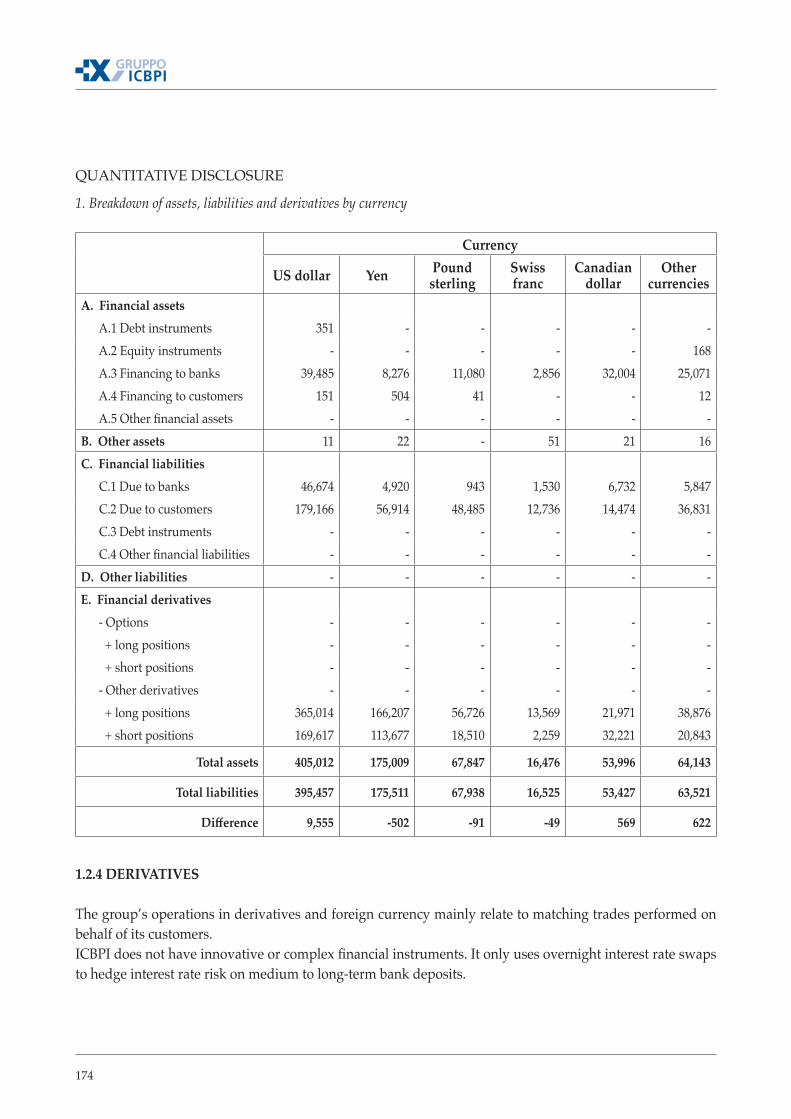
174
QUANTITATIVE DISCLOSURE
1. Breakdown of assets, liabilities and derivatives by currency
Currency
US dollar Yen Pound sterling
Swiss franc
Canadian dollar
Other currencies
A. Financial assets A.1 Debt instruments 351 - - - - - A.2 Equity instruments - - - - - 168 A.3 Financing to banks 39,485 8,276 11,080 2,856 32,004 25,071 A.4 Financing to customers 151 504 41 - - 12 A.5 Other financial assets - - - - - -
B. Other assets 11 22 - 51 21 16 C. Financial liabilities
C.1 Due to banks 46,674 4,920 943 1,530 6,732 5,847 C.2 Due to customers 179,166 56,914 48,485 12,736 14,474 36,831 C.3 Debt instruments - - - - - - C.4 Other financial liabilities - - - - - -
D. Other liabilities - - - - - - E. Financial derivatives - Options - - - - - - + long positions - - - - - - + short positions - - - - - - - Other derivatives - - - - - - + long positions 365,014 166,207 56,726 13,569 21,971 38,876 + short positions 169,617 113,677 18,510 2,259 32,221 20,843
Total assets 405,012 175,009 67,847 16,476 53,996 64,143
Total liabilities 395,457 175,511 67,938 16,525 53,427 63,521
Difference 9,555 -502 -91 -49 569 622
1.2.4 DERIVATIVES
The group’s operations in derivatives and foreign currency mainly relate to matching trades performed on behalf of its customers. ICBPI does not have innovative or complex financial instruments. It only uses overnight interest rate swaps to hedge interest rate risk on medium to long-term bank deposits.
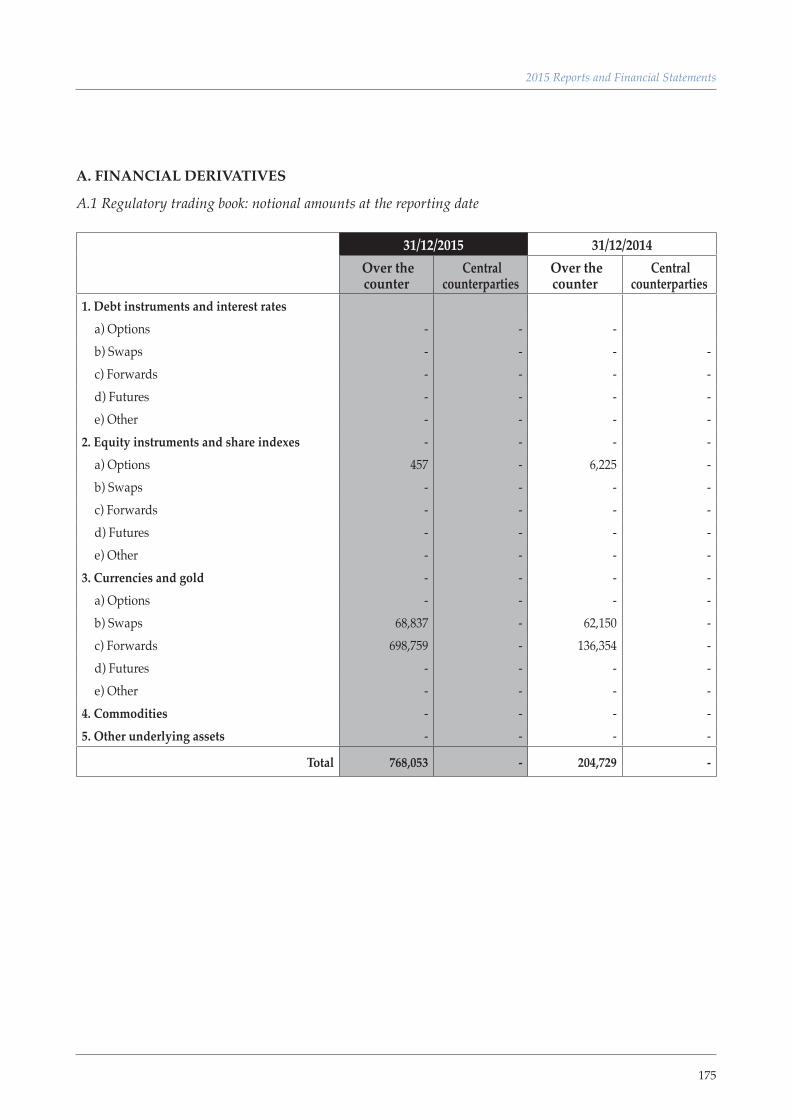
175
2015 Reports and Financial Statements
A. FINANCIAL DERIVATIVES
A.1 Regulatory trading book: notional amounts at the reporting date
31/12/2015 31/12/2014 Over the counter
Central counterparties
Over the counter
Central counterparties
1. Debt instruments and interest rates a) Options - - - b) Swaps - - - - c) Forwards - - - - d) Futures - - - - e) Other - - - -
2. Equity instruments and share indexes - - - - a) Options 457 - 6,225 - b) Swaps - - - - c) Forwards - - - - d) Futures - - - - e) Other - - - -
3. Currencies and gold - - - - a) Options - - - - b) Swaps 68,837 - 62,150 - c) Forwards 698,759 - 136,354 - d) Futures - - - - e) Other - - - -
4. Commodities - - - - 5. Other underlying assets - - - -
Total 768,053 - 204,729 -

176
A.3 Financial derivatives: gross positive fair value - breakdown by product
Positive fair value31/12/2015 31/12/2014
Over the counter
Central counterparties
Over the counter
Central counterparties
A. Regulatory trading book a) Options 229 - 3,112 - b) Interest rate swaps - - - - c) Cross currency swaps - - - - d) Equity swaps - - - - e) Forwards 5,204 - 586 - f) Futures - - - - g) Other 176 - 952 -
B. Banking book - hedging - - - a) Options - - - - b) Interest rate swaps - - - - c) Cross currency swaps - - - - d) Equity swaps - - - - e) Forwards - - - - f) Futures - - - - g) Other - - - -
C. Banking book - other derivatives - - - a) Options - - - - b) Interest rate swaps - - - - c) Cross currency swaps - - - - d) Equity swaps - - - - e) Forwards - - - - f) Futures - - - - g) Other - - - -
Total 5,609 - 4,650 -

177
2015 Reports and Financial Statements
A.4 Financial derivatives: gross negative fair value - breakdown by product
Negative fair value31/12/2015 31/12/2014
Over the counter
Central counterparties
Over the counter
Central counterparties
A. Regulatory trading book a) Options 229 - 3,112 - b) Interest rate swaps - - - - c) Cross currency swaps - - - - d) Equity swaps - - - - e) Forwards 2,724 - 1,376 - f) Futures - - - - g) Other 1,096 - 186 -
B. Banking book - hedging - - - a) Options - - - - b) Interest rate swaps - - - - c) Cross currency swaps - - - - d) Equity swaps - - - - e) Forwards - - - - f) Futures - - - - g) Other - - - -
C. Banking book - other derivatives - - - a) Options - - - - b) Interest rate swaps - - - - c) Cross currency swaps - - - - d) Equity swaps - - - - e) Forwards - - - - f) Futures - - - - g) Other - - - -
Total 4,049 - 4,674 -
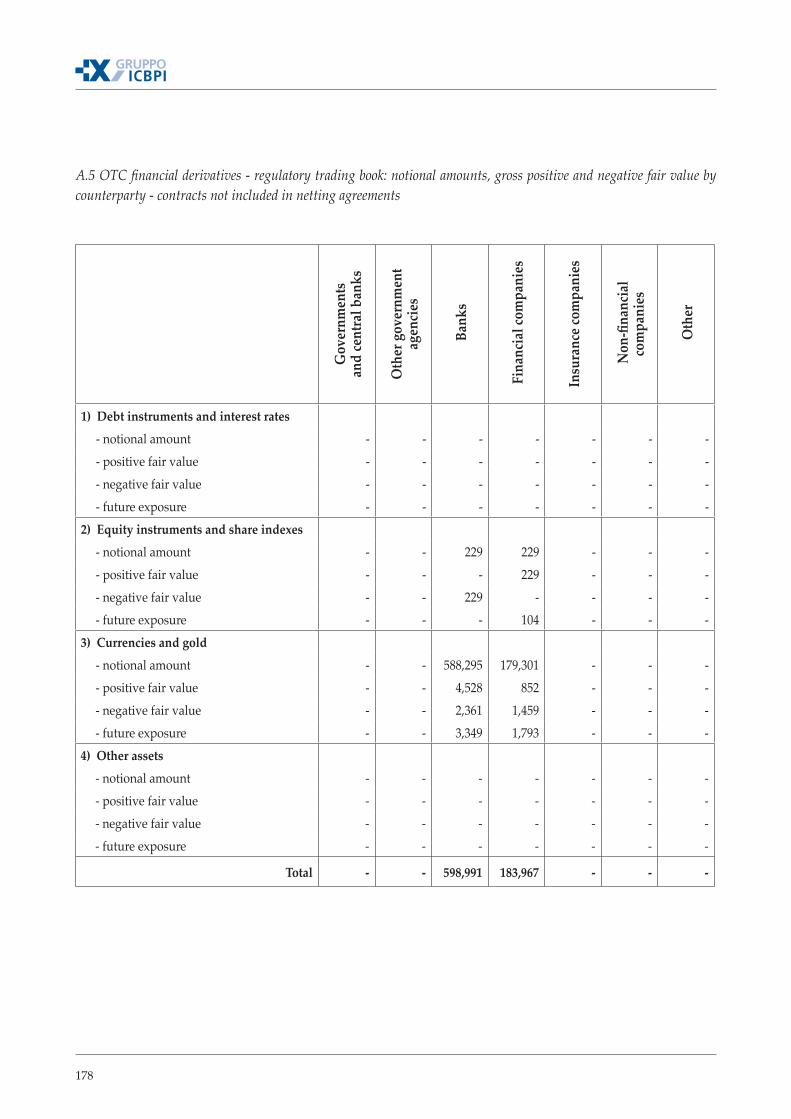
178
A.5 OTC financial derivatives - regulatory trading book: notional amounts, gross positive and negative fair value by counterparty - contracts not included in netting agreements
Gov
ernm
ents
an
d ce
ntra
l ban
ks
Oth
er g
over
nmen
t ag
enci
es
Ban
ks
Fin
anci
al co
mpa
nies
Insu
ranc
e com
pani
es
Non
-fina
ncia
l co
mpa
nies
Oth
er
1) Debt instruments and interest rates - notional amount - - - - - - - - positive fair value - - - - - - - - negative fair value - - - - - - - - future exposure - - - - - - - 2) Equity instruments and share indexes - notional amount - - 229 229 - - - - positive fair value - - - 229 - - - - negative fair value - - 229 - - - - - future exposure - - - 104 - - - 3) Currencies and gold - notional amount - - 588,295 179,301 - - - - positive fair value - - 4,528 852 - - - - negative fair value - - 2,361 1,459 - - - - future exposure - - 3,349 1,793 - - - 4) Other assets - notional amount - - - - - - - - positive fair value - - - - - - - - negative fair value - - - - - - - - future exposure - - - - - - -
Total - - 598,991 183,967 - - -
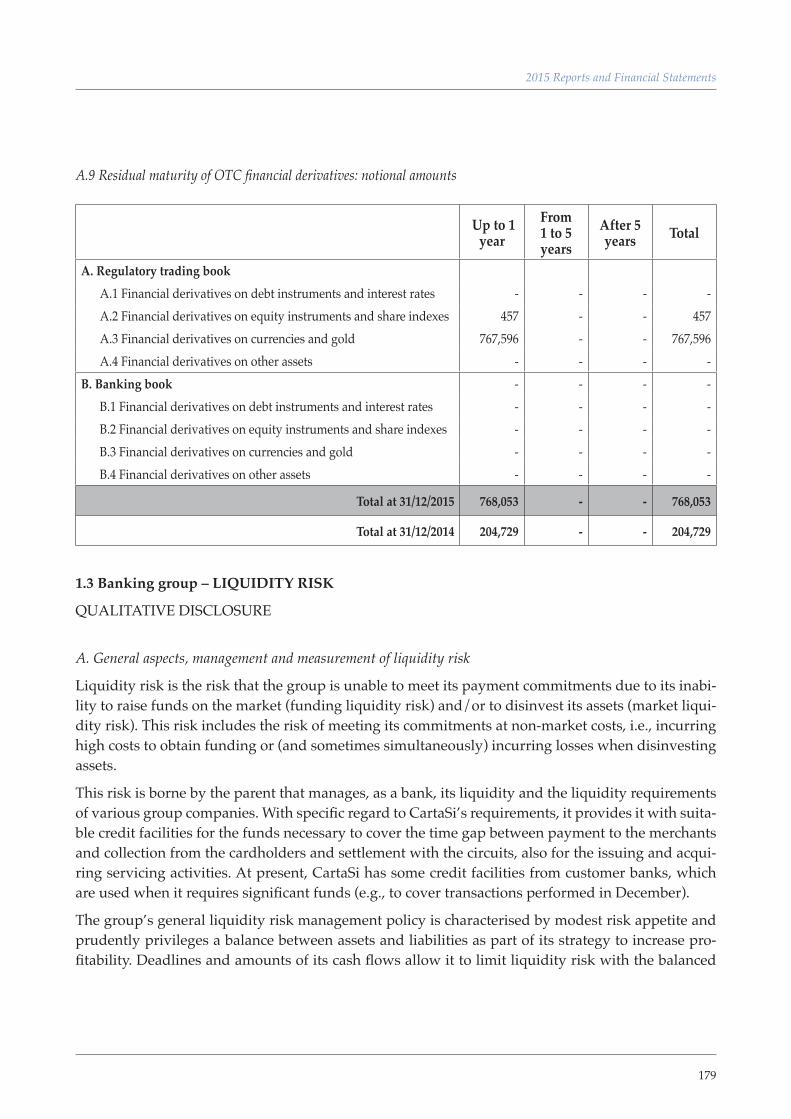
179
2015 Reports and Financial Statements
A.9 Residual maturity of OTC financial derivatives: notional amounts
Up to 1 year
From 1 to 5 years
After 5 years Total
A. Regulatory trading bookA.1 Financial derivatives on debt instruments and interest rates - - - - A.2 Financial derivatives on equity instruments and share indexes 457 - - 457 A.3 Financial derivatives on currencies and gold 767,596 - - 767,596 A.4 Financial derivatives on other assets - - - -
B. Banking book - - - - B.1 Financial derivatives on debt instruments and interest rates - - - - B.2 Financial derivatives on equity instruments and share indexes - - - - B.3 Financial derivatives on currencies and gold - - - - B.4 Financial derivatives on other assets - - - -
Total at 31/12/2015 768,053 - - 768,053
Total at 31/12/2014 204,729 - - 204,729
1.3 Banking group – LIQUIDITY RISK
QUALITATIVE DISCLOSURE
A. General aspects, management and measurement of liquidity risk
Liquidity risk is the risk that the group is unable to meet its payment commitments due to its inabi-lity to raise funds on the market (funding liquidity risk) and/or to disinvest its assets (market liqui-dity risk). This risk includes the risk of meeting its commitments at non-market costs, i.e., incurring high costs to obtain funding or (and sometimes simultaneously) incurring losses when disinvesting assets.
This risk is borne by the parent that manages, as a bank, its liquidity and the liquidity requirements of various group companies. With specific regard to CartaSi’s requirements, it provides it with suita-ble credit facilities for the funds necessary to cover the time gap between payment to the merchants and collection from the cardholders and settlement with the circuits, also for the issuing and acqui-ring servicing activities. At present, CartaSi has some credit facilities from customer banks, which are used when it requires significant funds (e.g., to cover transactions performed in December).
The group’s general liquidity risk management policy is characterised by modest risk appetite and prudently privileges a balance between assets and liabilities as part of its strategy to increase pro-fitability. Deadlines and amounts of its cash flows allow it to limit liquidity risk with the balanced
180
return of funds, notwithstanding the fact that the group is very capable of financing itself in very short periods (one to three days).
The treasury and finance unit manages liquidity to ensure financial balance between deadlines and between assets and liabilities in order to avoid overusing current and potential sources of funds.
The parent, ICBPI, has regular and ongoing access to credit when the market is stable and liquidi-ty flow are normal, as it has banking counterparties that have approved operating credit facilities which it can use.
Therefore, the group is not significantly exposed to liquidity risk. Its liabilities mainly consist of cur-rent accounts with banks or customers set up to be used as part of its core business rather than for funding purposes. An analysis of its due dates does not show any critical issues, given the nature of the underlying transactions. Moreover, with respect to its positions other than current accounts, there are no critical issues relating to acceleration clauses or clauses requiring additional guarantees if the group companies are downgraded.
The related liquidity policy and contingency funding plan, approved by the parent’s board of di-rectors, sets the guidelines for liquidity management (liquidity policy) and the rules to be adopted in a liquidity crisis (contingency funding plan). It incorporates the most recent regulatory updates (Bank of Italy Circular no. 285/2013) and the principles of the group’s risk policy, thus integrating and completing the rules defined in the finance regulation.
The liquidity policy defines the actions to be performed daily to ensure a balance between cash in-flows and outflows by monitoring existing and future financial positions. It also includes a vast ran-ge of indicators to facilitate the monitoring of the bank’s liquidity profile and to promptly identify any deterioration caused by internal factors or systemic factors.
The contingency funding plan (CFP) assesses the actions to be taken if there is a drastic reduction in liquidity and the group has certain lending commitments (e-money service and lending transac-tions that cannot easily be converted into liquidity) caused by either sector-wide liquidity crises or specific liquidity crises. It specifically describes what happens when a normal operating situation deteriorates into an operating stress or crisis situation, based on trends in quantitative and/or quali-tative indicators (internal or sector) that are monitored daily. The plan also presents how to manage stress or crisis situations and specifies how the relevant units are to react and their responsibilities.
Liquidity risk is assessed by monitoring the accumulated balance of the daily situation each day, which is the most critical on the day before the debit of CartaSi transactions (made on the 15th of each month or if the 15th is a holiday, the next business day), considering the group’s typical modus operandi. This process was introduced in May 2012 to allow the timely intervention when a cardhol-der’s liquidity position worsens. The results of this process are included in the weekly preparation of the relevant indicator. Once a day, the risk management unit performs a simulation based on the same stress situations applied to the weekly monitoring. It calculates the run-off ratios for the diffe-rent on demand items related to the “critical” category using the compound interest method and re-calculates the accumulated balance in a stress situation, being the sum of the balance in a non-stress
181
2015 Reports and Financial Statements
situation and outflows required in a stress situation.
Once a week, the risk management unit checks the net accumulated balance of the positions falling due (using the closing positions every Tuesday evening), including the group companies’ expected cash flows, applying the method indicated by Bank of Italy. The net accumulated balance of the po-sitions falling due is calculated considering the inflows and outflows expected during the different “due” categories (11 in total, which go from one day to four months). The schedule also includes data about forecast unrecorded flows or future flows the exact amount of which are not known, such as those related to CartaSi’s issuing and acquiring activities. The risk management unit then sends Bank of Italy a liquidity report once a week.
The treasury and finance unit monitors and checks cash flows and estimates their trends during a business day. The intraday liquidity risk relates to the time mismatch between incoming and out-going payment flows (the latter have different daily cut-offs). In order to mitigate these risks, the regulators require that banks have an appropriate intraday reserve (consisting of eligible, readily convertible into cash securities) to cover their obligations (specific risk) or the sudden illiquidity of markets or bankruptcy of a counterparty in the settlement system (sector risk). Accordingly, the parent has securities (CCT Italian treasury credit certificates and eligible bank bonds) as its intraday reserve for an amount deemed suitable to cover its specific operating needs based on an estimate of the intraday cash outflows.
The treasury and finance unit also closely monitors the group’s liquidity held in an account with the Italian central bank so as to cover its commitments arising from target movements.
The TIT system
The liquidity risk governance and management tools used by the group include the TIT system (in-ternal transfer of funds system), introduced to comply with the provisions of Bank of Italy Circular no. 263 (title V, chapter 2, section IV). As the group’s only bank, ICBPI S.p.A. has used this system since 2012 and revises it annually.
LCR/NSFR
In 2010, the group introduced the assessment and analysis procedures to make its monitoring of liquidity consistent with the requirements of the Basel Committee specified in the “International framework for liquidity risk measurement, standards and monitoring” as well as the additional guidance and regulations issued by the control bodies and authorities (e.g., the CRR Regulation and the CRD IV Directive issued by the European Commission to implement the Basel Committee’s indications at EU level).
These requirements introduced, inter alia, two ratios to measure liquidity, the LCR (liquidity cove-rage ratio) and the NSFR (net stable funding ratio). They are used to monitor short-term liquidity (one month) and structural liquidity (one year), respectively. Starting from 31 December 2011 and as
182
part of the QIS (quantitative impact study) on the impact of Basel 3 regulations, the group has sent Bank of Italy half yearly reports showing the results of its calculation of the LCR using its financial reporting data.
The group’s liquidity position remained within the risk limits set by its current liquidity policy in 2015 and, indeed, the regulatory ratio established by Basel 3 (LCR) was complied with, being better than the established values.
Liquidity and risk appetite framework
Liquidity is one of the factors included in the risk appetite framework (RAF) and is considered to be one of the most important for the group. Its inclusion is justified by the importance in managing li-quidity in the current market situation and given the specific nature of the cash inflows and outflows generated by the group’s business.
The RAF defines the following two liquidity parameters:
▪ Liquidity Coverage Ratio – LCR, i.e., the ratio of liquid assets (HQLA - high quality liquid as-sets) to net cash flows in the 30 days of a very acute stress scenario;
▪ the ratio of the minimum cumulated net balance of the “critical bracket” (minimum daily amount for the quarter) to total assets (most recent figure).
The framework defines parameters for each category that are the maximum risk limit the group in-tends to assume, the best risk limit (risk target) and an early warning level (risk trigger), which when breached, triggers contingency plans and/or mitigation actions to avoid reaching the risk limit.
The liquidity risk tolerance threshold1, defined as the maximum risk exposure possible in a normal business situation (going concern) integrated by a stress scenario, is the risk limit.
The risk limits associated with the two ratios are:
▪ Liquidity Coverage Ratio – LCR: 80%.
This ratio has already been calculated assuming a severe stress scenario (combined idiosyncratic and market shock scenario simulation) with a risk limit above the legal minimum effective since October 20152, of 60%.
The group monitors the indicator using the monthly supervisory report, which requires the risk management unit and the financial risk unit to perform the related checks (consistency and perfor-mance) before the reporting unit sends it to Bank of Italy.
▪ Ratio of the cumulated net minimum balance of the “critical bracket” and total assets: 1%.
The cumulated net minimum balance of the “critical bracket” is the minimum daily amount recor-ded each quarter of the smaller liquidity situation compared to a normal business scenario.
1 See Bank of Italy Circular no. 285 and subsequent amendments.2 The LCR indicator became applicable in October 2015 with a minimum threshold of 60%, which increases to 70% from January 2016, 80% from January 2017 and 100% from January 2018.
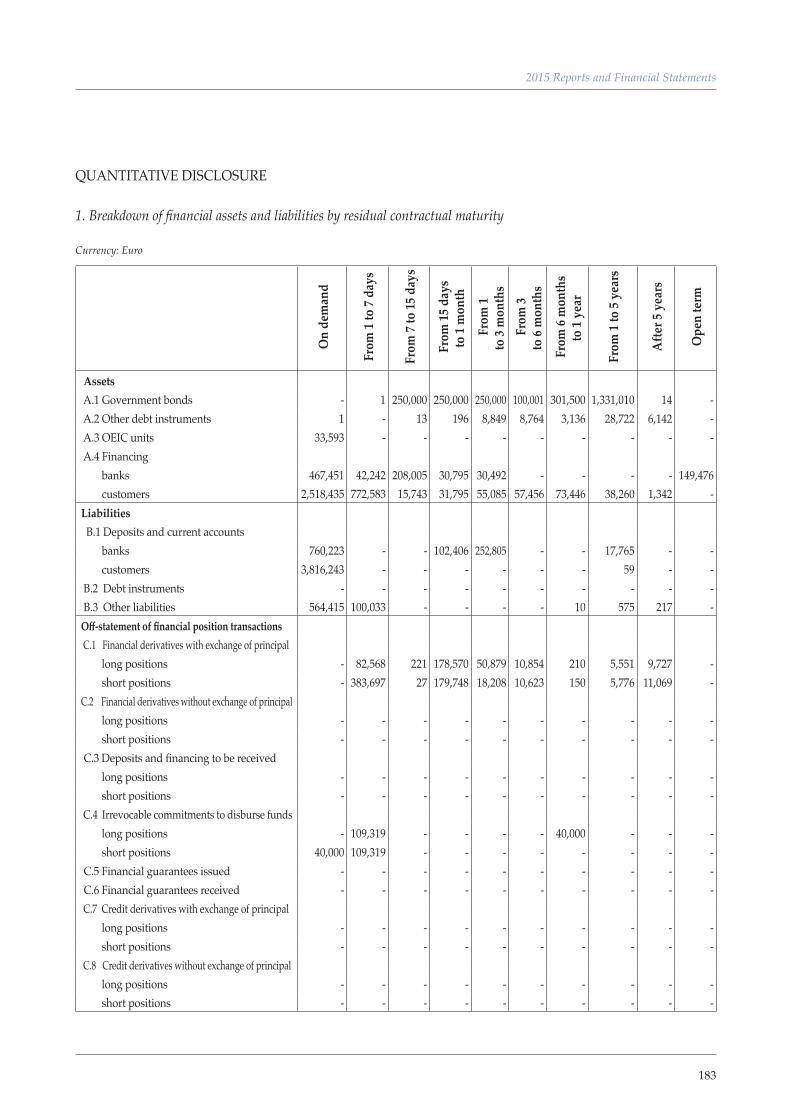
183
2015 Reports and Financial Statements
QUANTITATIVE DISCLOSURE 1. Breakdown of financial assets and liabilities by residual contractual maturity
Currency: Euro
O
n de
man
d
Fro
m 1
to 7
days
Fro
m 7
to 15
day
s
Fro
m 15
day
s to
1 m
onth
Fro
m 1
to 3
mon
ths
Fro
m 3
to 6
mon
ths
Fro
m 6
mon
ths
to 1
year
Fro
m 1
to 5
year
s
Afte
r 5 y
ears
Ope
n te
rm
Assets A.1 Government bonds - 1 250,000 250,000 250,000 100,001 301,500 1,331,010 14 - A.2 Other debt instruments 1 - 13 196 8,849 8,764 3,136 28,722 6,142 - A.3 OEIC units 33,593 - - - - - - - - - A.4 Financing banks 467,451 42,242 208,005 30,795 30,492 - - - - 149,476 customers 2,518,435 772,583 15,743 31,795 55,085 57,456 73,446 38,260 1,342 - Liabilities B.1 Deposits and current accounts banks 760,223 - - 102,406 252,805 - - 17,765 - - customers 3,816,243 - - - - - - 59 - - B.2 Debt instruments - - - - - - - - - - B.3 Other liabilities 564,415 100,033 - - - - 10 575 217 - Off-statement of financial position transactions C.1 Financial derivatives with exchange of principal long positions - 82,568 221 178,570 50,879 10,854 210 5,551 9,727 - short positions - 383,697 27 179,748 18,208 10,623 150 5,776 11,069 - C.2 Financial derivatives without exchange of principal long positions - - - - - - - - - - short positions - - - - - - - - - - C.3 Deposits and financing to be received long positions - - - - - - - - - - short positions - - - - - - - - - - C.4 Irrevocable commitments to disburse funds long positions - 109,319 - - - - 40,000 - - - short positions 40,000 109,319 - - - - - - - - C.5 Financial guarantees issued - - - - - - - - - - C.6 Financial guarantees received - - - - - - - - - - C.7 Credit derivatives with exchange of principal long positions - - - - - - - - - - short positions - - - - - - - - - - C.8 Credit derivatives without exchange of principal long positions - - - - - - - - - - short positions - - - - - - - - - -
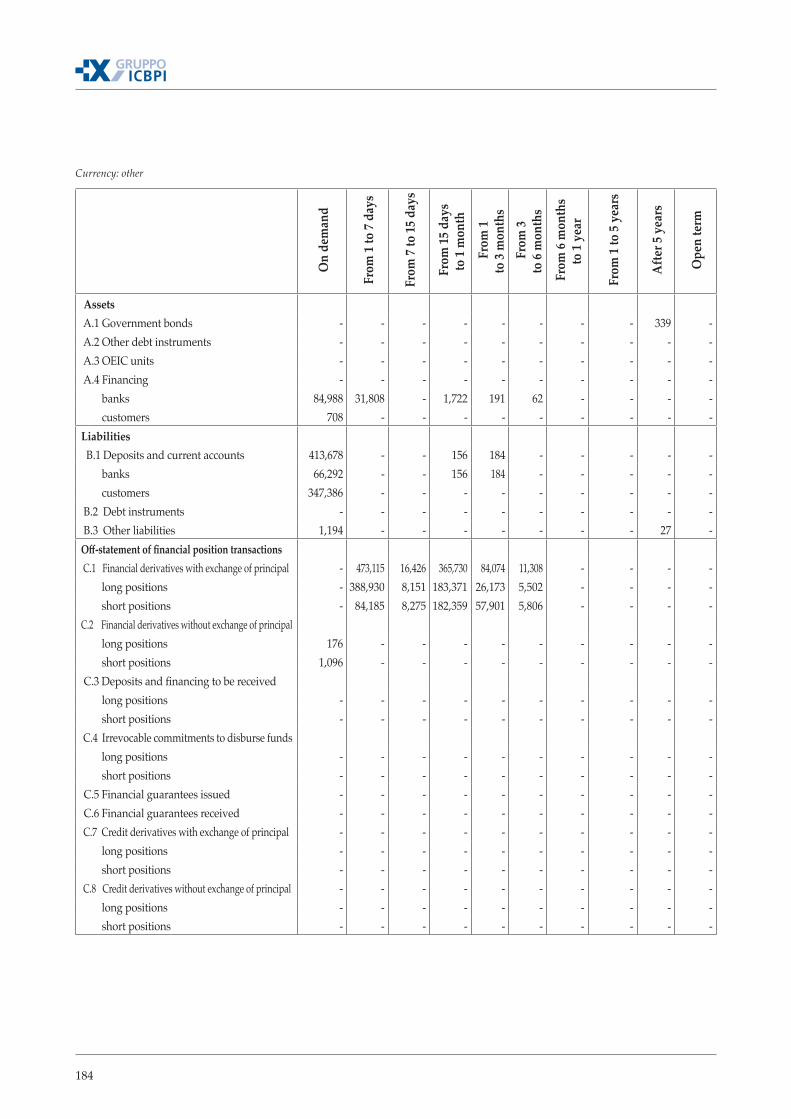
184
Currency: other
On
dem
and
Fro
m 1
to 7
days
Fro
m 7
to 15
day
s
Fro
m 15
day
s to
1 m
onth
Fro
m 1
to 3
mon
ths
Fro
m 3
to 6
mon
ths
Fro
m 6
mon
ths
to 1
year
Fro
m 1
to 5
year
s
Afte
r 5 y
ears
Ope
n te
rm
Assets A.1 Government bonds - - - - - - - - 339 - A.2 Other debt instruments - - - - - - - - - - A.3 OEIC units - - - - - - - - - - A.4 Financing - - - - - - - - - - banks 84,988 31,808 - 1,722 191 62 - - - - customers 708 - - - - - - - - - Liabilities B.1 Deposits and current accounts 413,678 - - 156 184 - - - - - banks 66,292 - - 156 184 - - - - - customers 347,386 - - - - - - - - - B.2 Debt instruments - - - - - - - - - - B.3 Other liabilities 1,194 - - - - - - - 27 - Off-statement of financial position transactions C.1 Financial derivatives with exchange of principal - 473,115 16,426 365,730 84,074 11,308 - - - - long positions - 388,930 8,151 183,371 26,173 5,502 - - - - short positions - 84,185 8,275 182,359 57,901 5,806 - - - - C.2 Financial derivatives without exchange of principal long positions 176 - - - - - - - - - short positions 1,096 - - - - - - - - - C.3 Deposits and financing to be received long positions - - - - - - - - - - short positions - - - - - - - - - - C.4 Irrevocable commitments to disburse funds long positions - - - - - - - - - - short positions - - - - - - - - - - C.5 Financial guarantees issued - - - - - - - - - - C.6 Financial guarantees received - - - - - - - - - - C.7 Credit derivatives with exchange of principal - - - - - - - - - - long positions - - - - - - - - - - short positions - - - - - - - - - - C.8 Credit derivatives without exchange of principal - - - - - - - - - - long positions - - - - - - - - - - short positions - - - - - - - - - -
185
2015 Reports and Financial Statements
1.4 Banking group - OPERATIONAL RISKS
QUALITATIVE DISCLOSURE
A. General aspects, management and measurement of liquidity risk
Operational risk is the risk of losses arising from errors or shortfalls in internal procedures, human resources or systems and external factors, including judicial risk. This risk also comprises legal risk, model risk and the risk related to financial transactions including those related to market risk.
Operational risk is characterised by cause-effect relationships whereby if one or more trigger events occur, this leads to a detrimental event which is directly linked to an economic loss. Therefore, an operating loss is the result of negative economic effects created by operating events, recorded by the bank and that affect its profit or loss.
The main characteristic of operational risks is that they are inherent to the group’s business and are, therefore, unavoidable and omnipresent. This implies that they are inherent in the decision to perform a certain activity and, in general, the bank’s operations rather than, in the case of the other risks, the group intentionally takes credit or financial positions based on its risk appetite to achieve its target risk/return profile. In order to measure the bank’s exposure to operational risks and the effects of any mitigating actions, it has to combine the qualitative and quantitative information.
The group manages its operational risks through specific insurance policies and through:
▪ a suitable internal organisation with defined duties and responsibilities, ensuring the segrega-tion of duties between the control and operating units;
▪ adoption of first level controls for each process to:
- monitor their correct performance;
- promptly identify any irregularities and, if necessary, introduction of timely remedial actions;
- identify technical-organisational defects and ensure their timely analysis and correction;
▪ introduction of a code of ethics for employees;
▪ internal regulations;
▪ a risk control self-assessment (RCSA);
▪ a loss data collection (LDC) process;
▪ specific monitoring tools for CartaSi’s e-money business operational risks;
▪ specific computer risk controls.
The main procedures for ensuring that the operational risk is managed correctly by the risk mana-gement unit are listed below:
• definition and updating of the operational risk management methods;
186
▪ second level controls over operational risk management;
▪ collection and analysis of operating loss data by type of event and business segment;
▪ definition of specific risk indicators and escalation proposals; performance and coordination of the RCSA;
▪ assistance with identification of operational risks inherent in new services/products during the design stage;
▪ appointment of an internal reference person to design and monitor the information safety mana-gement system;
▪ preparation of periodic reports or reports on specific events to general management, the control bodies and the internal audit and compliance units;
▪ annual valuation of the assessment framework for operational risks related to retail payment systems, carried out with the payment unit as per the Italian central bank’s instructions in the relevant regulations.
The group has adopted an operational risk framework, which includes an operational risk policy and the RCSA and loss data collection methods as specified by Bank of Italy with respect to prudent supervisory requirements.
The operational risk policy has the following objectives:
▪ set out the general operational risk governance principles, the aims, methods and tools adopted;
▪ present the roles and responsibilities of the units involved;
▪ describe the operational risk governance framework processes and reference models.
All the group units are required to contribute to the operational risk management (ORM) process to the extent of their duties and to encourage the circulation of a risk management culture at all levels.
The operational risk framework is structured to adopt identification and assessment methods in line with market best practices. Its structure is also in line with the regulations for adoption of the TSA (traditional standardised approach).
As part of this ORM framework, the risk control self-assessment (RCSA) process is used for scenario analysis with the direct involvement of the internal units. It is a useful management tool, especially for the correct understanding of the business processes’ riskiness by the units. As well as the ex-ante identification of operational risks, the assessment is fundamental to disseminate a control cultu-re. The RCSA method also includes the model used to assess the effect of operating events on the group’s reputation.
The RCSA process was formalised in the group’s publication of its regulation, which specify the activities, roles and methods used:
▪ identification of the processes to be assessed;
187
2015 Reports and Financial Statements
▪ identification of adverse events and related causes that could have an economic fallout, within the process, and possibly also damage the group’s reputation;
▪ measurement of the identified risks and the effectiveness of the related mitigation controls;
▪ calculation of the total exposure to operational risk and identification of any additional mitiga-tion requirements to contain the risks.
Planning and development of the controls are subjected to follow-up processes through their in-clusion in a dashboard and are monitored by the control units (risk management, compliance and internal audit), which check all the actions taken to improve the internal controls. The findings of the monitoring process are assembled once a quarter and communicated regularly to the internal bodies to provide a complete picture of the main critical issues the group is exposed to and the status of the remedial actions taken or to be implemented.
The group is fully conscious that, as well as affecting its results, loss-generating events may signifi-cantly damage its reputation and standing. Therefore, it has a management system in place to mini-mise the effects which relies on a method to identify, measure and mitigate them in qualitative and quantitative terms. This system identifies the risk of both actual losses and potential risk.
The loss data collection process is a key part of the operational risks management system because it both guarantees an understanding of the most significant loss factors over time and provides statistics useful to better analyse identified risks. Moreover, the identification and measurement of potentially risky activities allows the bank to monitor and identify over time the most risky factors and to intervene to remove the reasons and/or strengthen its controls.
The LDC process is based on the LDC method approved as part of the operational risk policy and its objective is to estimate the value of an economic effect generated by an operating event, caused by one or more risk factors. The information is the result of a relationship between different factors: the event, the risk factor and the effect. An analysis of this relationship is essential to correctly forecast the losses generated by operational risks and to measure the risks.
Losses used for the loss data collection are those that directly affect the group’s profit or loss and are not due to commercial policies or the offsetting of costs and revenues. The general principles underlying the LDC are:
▪ the range of loss events to be assessed (in terms of processes, business lines and companies);
▪ the accuracy of the information;
▪ the timeliness and continuity of the data collection.
Adverse events are identified by the reference unit manager promptly when they take place. Accor-dingly and in order to allow a complete analysis of the operational risks, the loss data collection also includes negative events that took place but did not lead to actual losses (“near losses”).
The operating details and methods to collect loss data are set out in the Loss data collection - ma-
188
nagement methods and processes for the ICBPI group, which is an integral part of the Operational risk management policy.
A fundamental operational risk mitigation tool is the business continuity and disaster recovery plan, which is revised annually as required by the supervisory instructions about internal controls. Bank of Italy extended the concept of business continuity to all critical “business processes”, not just the technological component but all the factors (human resources, logistics, essential services, etc.) that assist the mitigation of operational risks in new crisis situations.
Business continuity includes all those measures designed to reduce to an acceptable level the da-mage caused by accidents or catastrophes that could directly or indirectly affect the bank while the disaster recovery plan sets out the technical and organisational methods to resolve events that cause the unavailability of data processing centres. It is designed to ensure that the important IT procedu-res can continue to be performed at alternative sites.
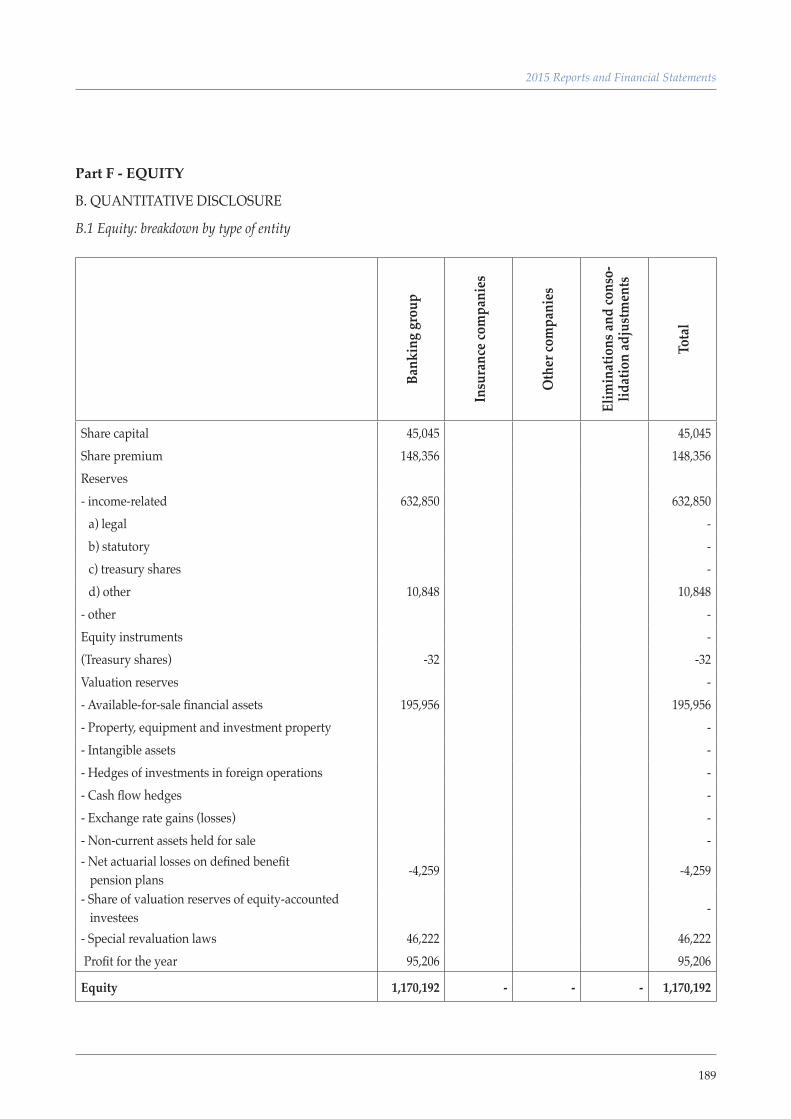
189
2015 Reports and Financial Statements
Part F - EQUITY
B. QUANTITATIVE DISCLOSURE
B.1 Equity: breakdown by type of entity
Bank
ing
grou
p
Insu
ranc
e com
pani
es
Oth
er co
mpa
nies
Elim
inat
ions
and
cons
o-lid
atio
n ad
just
men
ts
Tota
l
Share capital 45,045 45,045Share premium 148,356 148,356 Reserves- income-related 632,850 632,850
a) legal - b) statutory - c) treasury shares - d) other 10,848 10,848
- other - Equity instruments - (Treasury shares) -32 -32 Valuation reserves - - Available-for-sale financial assets 195,956 195,956 - Property, equipment and investment property - - Intangible assets - - Hedges of investments in foreign operations - - Cash flow hedges - - Exchange rate gains (losses) - - Non-current assets held for sale - - Net actuarial losses on defined benefit pension plans
-4,259 -4,259
- Share of valuation reserves of equity-accounted investees
-
- Special revaluation laws 46,222 46,222 Profit for the year 95,206 95,206
Equity 1,170,192 - - - 1,170,192
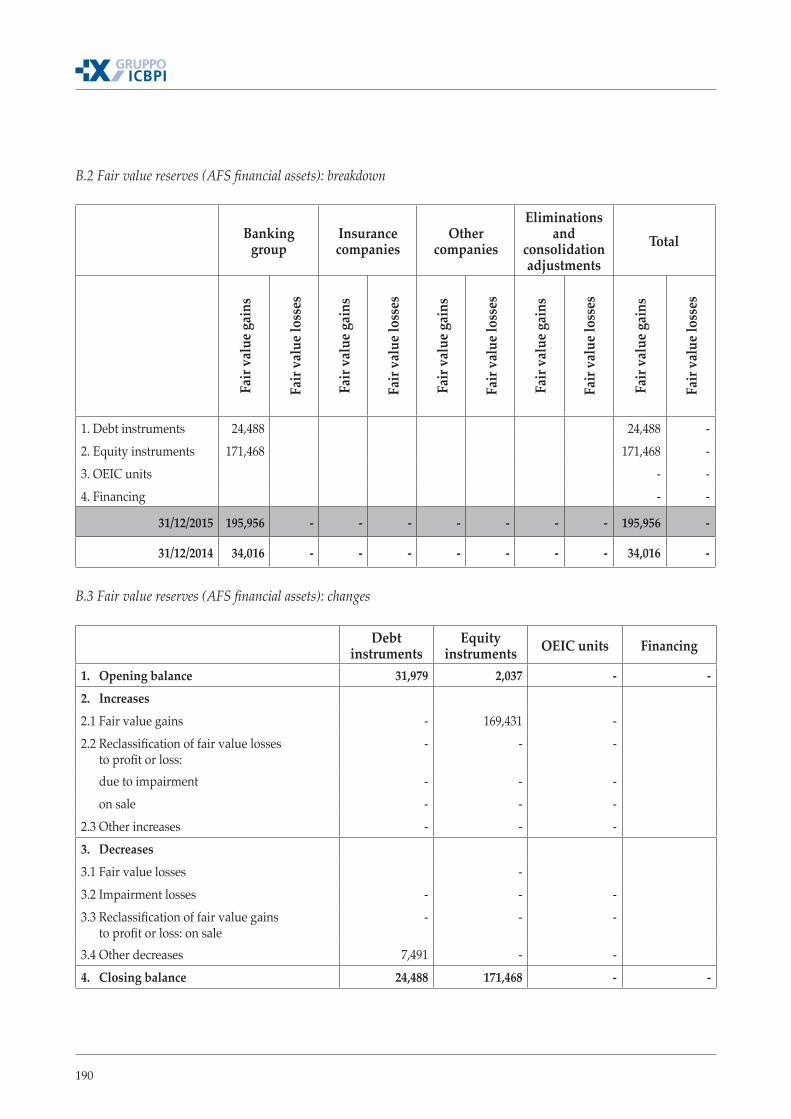
190
B.2 Fair value reserves (AFS financial assets): breakdown
Banking group
Insurance companies
Other companies
Eliminations and
consolidation adjustments
TotalFa
ir va
lue g
ains
Fair
valu
e los
ses
Fair
valu
e gai
ns
Fair
valu
e los
ses
Fair
valu
e gai
ns
Fair
valu
e los
ses
Fair
valu
e gai
ns
Fair
valu
e los
ses
Fair
valu
e gai
ns
Fair
valu
e los
ses
1. Debt instruments 24,488 24,488 - 2. Equity instruments 171,468 171,468 - 3. OEIC units - - 4. Financing - -
31/12/2015 195,956 - - - - - - - 195,956 -
31/12/2014 34,016 - - - - - - - 34,016 -
B.3 Fair value reserves (AFS financial assets): changes
Debt instruments
Equity instruments OEIC units Financing
1. Opening balance 31,979 2,037 - - 2. Increases2.1 Fair value gains - 169,431 - 2.2 Reclassification of fair value losses to profit or loss:
- - -
due to impairment - - - on sale - - - 2.3 Other increases - - - 3. Decreases3.1 Fair value losses - 3.2 Impairment losses - - - 3.3 Reclassification of fair value gains to profit or loss: on sale
- - -
3.4 Other decreases 7,491 - - 4. Closing balance 24,488 171,468 - -
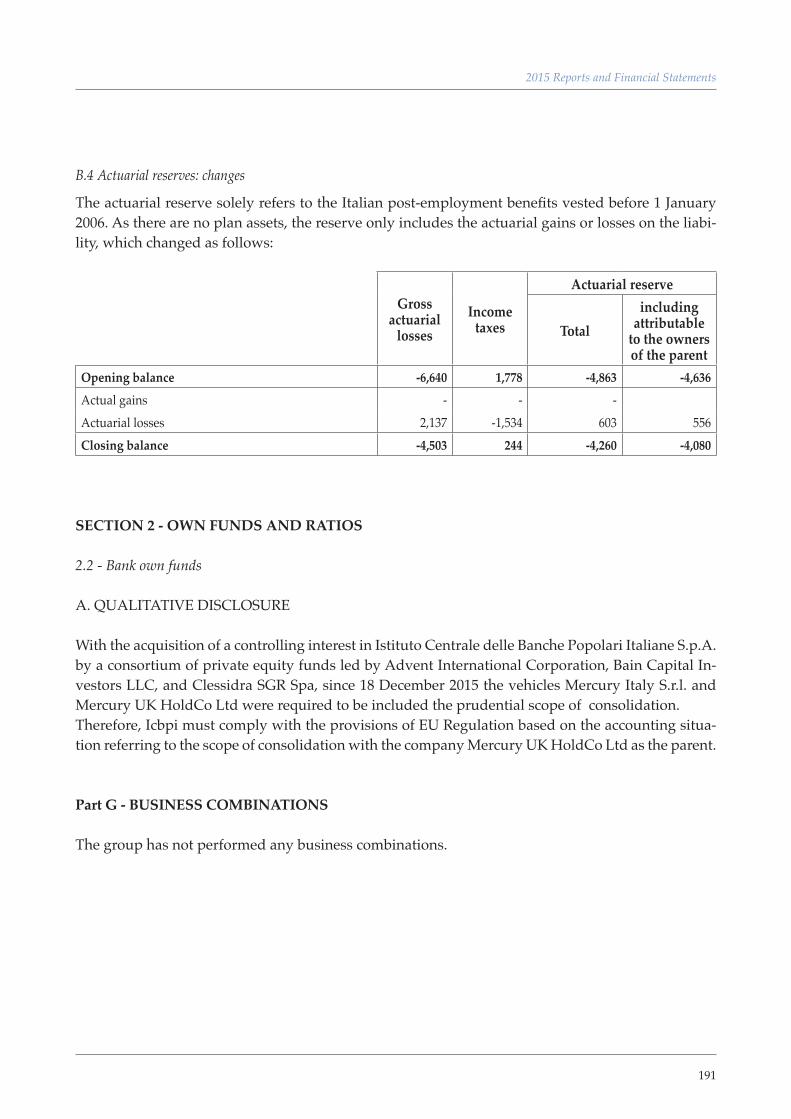
191
2015 Reports and Financial Statements
B.4 Actuarial reserves: changes
The actuarial reserve solely refers to the Italian post-employment benefits vested before 1 January 2006. As there are no plan assets, the reserve only includes the actuarial gains or losses on the liabi-lity, which changed as follows:
Gross actuarial
lossesIncome
taxes
Actuarial reserve
Totalincluding
attributable to the owners of the parent
Opening balance -6,640 1,778 -4,863 -4,636 Actual gains - - - Actuarial losses 2,137 -1,534 603 556 Closing balance -4,503 244 -4,260 -4,080
SECTION 2 - OWN FUNDS AND RATIOS
2.2 - Bank own funds
A. QUALITATIVE DISCLOSURE With the acquisition of a controlling interest in Istituto Centrale delle Banche Popolari Italiane S.p.A. by a consortium of private equity funds led by Advent International Corporation, Bain Capital In-vestors LLC, and Clessidra SGR Spa, since 18 December 2015 the vehicles Mercury Italy S.r.l. and Mercury UK HoldCo Ltd were required to be included the prudential scope of consolidation.Therefore, Icbpi must comply with the provisions of EU Regulation based on the accounting situa-tion referring to the scope of consolidation with the company Mercury UK HoldCo Ltd as the parent.
Part G - BUSINESS COMBINATIONS
The group has not performed any business combinations.
192
Part H - RELATED PARTY TRANSACTIONS
1. Fees of key management personnel
The fees paid by the ICBPI Group to its directors and key management personnel as defined in part 2, are set out below.
31/12/2015
Directors 1,752 Other key management personnel and members of supervisory committees 7,081
Total 8,834
2. Related party transactions
The aim of IAS 24 (Related party transactions) is to ensure that an entity’s financial statements inclu-de the additional disclosures necessary to understand whether its financial position and performan-ce may be altered by related party transactions and balances.
Based on this standard, applied to its organisational and governance structure, the ICBPI Group identified the following related parties:
▪ associates, i.e. those companies over which the parent directly or indirectly exercises significant influence, as defined by IAS 28;
▪ key management personnel and members of supervisory bodies, as well as their close family members and companies over which they exercise control or significant influence;
▪ pension funds for the group employees and their related parties;
▪ companies that exercise significant influence over ICBPI.
The effects of transactions carried out with the related parties identified above are summarised in the following table.
The effects and balances of transactions with subsidiaries are not included as they are eliminated upon consolidation. The other related party transactions are part of the ordinary banking activities and are usually carried out on an arm’s length basis.
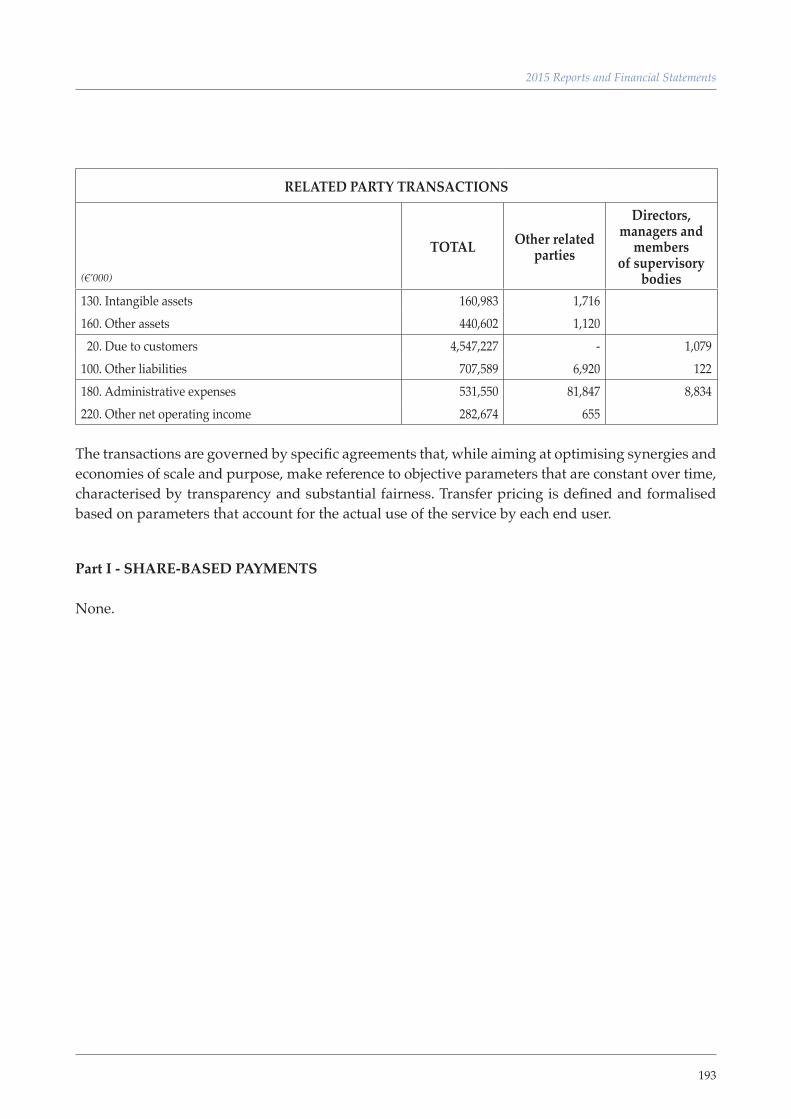
193
2015 Reports and Financial Statements
RELATED PARTY TRANSACTIONS
(€’000)
TOTAL Other related parties
Directors, managers and
members of supervisory
bodies130. Intangible assets 160,983 1,716 160. Other assets 440,602 1,120 20. Due to customers 4,547,227 - 1,079 100. Other liabilities 707,589 6,920 122 180. Administrative expenses 531,550 81,847 8,834 220. Other net operating income 282,674 655
The transactions are governed by specific agreements that, while aiming at optimising synergies and economies of scale and purpose, make reference to objective parameters that are constant over time, characterised by transparency and substantial fairness. Transfer pricing is defined and formalised based on parameters that account for the actual use of the service by each end user.
Part I - SHARE-BASED PAYMENTS
None.
194
Part L - Segment reporting
Segment reporting complies with IFRS 8, which did not lead to substantial changes in the identification of the operating segments and reporting to management when introduced, compared to the previous requirements of IAS 14.
Segment reporting is consistent with the group’s organisational and industrial structure in 2015, in line with its business plan and as required by its regulation.
Reporting by geographical segments is not included as the group operates only in Italy and the bre-akdown of assets, liabilities, revenue and costs by geographical segment was meaningless.
Reporting by business segment includes, in order of importance, the segments that may be identified within the group’s organisation and specifically:
E-money
It comprises CartaSi and Help Line and its integrated activities are as follows:
▪ financial and operating services relating to the issue and acceptance of payment cards and rela-ted management services;
▪ payment card terminal management (POS and ATM).
Payments
It comprises an operating division of the parent, which carries out the following integrated activities:
▪ banking payment services and related back-office services for banks, companies and bodies;
▪ interbank payment systems for companies and bodies and related management services and e-banking;
▪ IT and computer-based services relating to payment systems.
Securities services
It comprises an operating division of the parent, which carries out the following integrated activities:
▪ securities custody and administration services;
▪ fund services;
▪ investment and investment-related services for qualified parties and professional customers.
195
2015 Reports and Financial Statements
Application outsourcing and innovative services
It comprises Oasi, which carries out the following integrated activities:
▪ IT systems for supervisory reporting and management systems;
▪ anti-money laundering, safety and internal control systems;
▪ development and provision of training courses.
Other group activities
This segment manages the activities that are not carried out by the parent’s business units. Specifically:
▪ credit and financial activities for the relevant business segments;
▪ property management;
▪ equity investment management;
▪ group management and coordination;
▪ other activities of the consolidated companies.
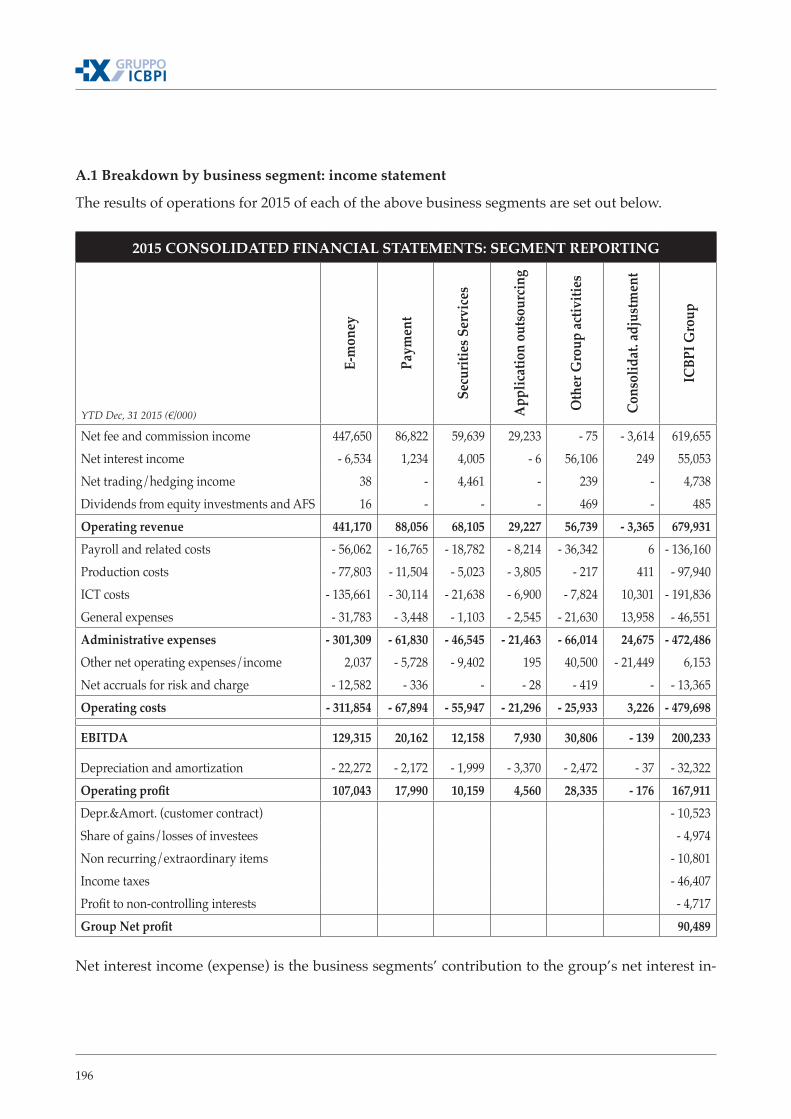
196
A.1 Breakdown by business segment: income statement
The results of operations for 2015 of each of the above business segments are set out below.
2015 CONSOLIDATED FINANCIAL STATEMENTS: SEGMENT REPORTING
YTD Dec, 31 2015 (€/000)
E-m
oney
Paym
ent
Secu
ritie
s Ser
vice
s
App
licat
ion
outs
ourc
ing
Oth
er G
roup
activ
ities
Cons
olid
at. a
djus
tmen
t
ICBP
I Gro
up
Net fee and commission income 447,650 86,822 59,639 29,233 - 75 - 3,614 619,655 Net interest income - 6,534 1,234 4,005 - 6 56,106 249 55,053 Net trading/hedging income 38 - 4,461 - 239 - 4,738 Dividends from equity investments and AFS 16 - - - 469 - 485 Operating revenue 441,170 88,056 68,105 29,227 56,739 - 3,365 679,931 Payroll and related costs - 56,062 - 16,765 - 18,782 - 8,214 - 36,342 6 - 136,160 Production costs - 77,803 - 11,504 - 5,023 - 3,805 - 217 411 - 97,940 ICT costs - 135,661 - 30,114 - 21,638 - 6,900 - 7,824 10,301 - 191,836 General expenses - 31,783 - 3,448 - 1,103 - 2,545 - 21,630 13,958 - 46,551 Administrative expenses - 301,309 - 61,830 - 46,545 - 21,463 - 66,014 24,675 - 472,486 Other net operating expenses/income 2,037 - 5,728 - 9,402 195 40,500 - 21,449 6,153 Net accruals for risk and charge - 12,582 - 336 - - 28 - 419 - - 13,365 Operating costs - 311,854 - 67,894 - 55,947 - 21,296 - 25,933 3,226 - 479,698
EBITDA 129,315 20,162 12,158 7,930 30,806 - 139 200,233
Depreciation and amortization - 22,272 - 2,172 - 1,999 - 3,370 - 2,472 - 37 - 32,322 Operating profit 107,043 17,990 10,159 4,560 28,335 - 176 167,911 Depr.&Amort. (customer contract) - 10,523 Share of gains/losses of investees - 4,974 Non recurring/extraordinary items - 10,801 Income taxes - 46,407 Profit to non-controlling interests - 4,717 Group Net profit 90,489
Net interest income (expense) is the business segments’ contribution to the group’s net interest in-
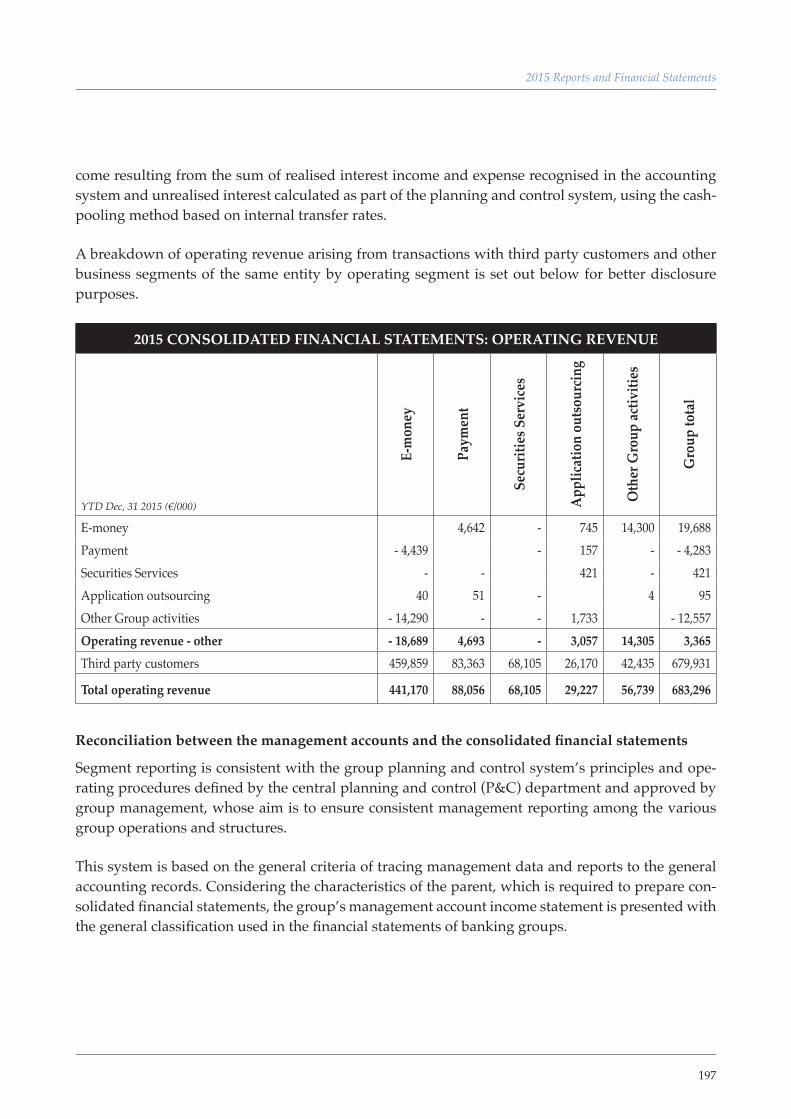
197
2015 Reports and Financial Statements
come resulting from the sum of realised interest income and expense recognised in the accounting system and unrealised interest calculated as part of the planning and control system, using the cash-pooling method based on internal transfer rates.
A breakdown of operating revenue arising from transactions with third party customers and other business segments of the same entity by operating segment is set out below for better disclosure purposes.
2015 CONSOLIDATED FINANCIAL STATEMENTS: OPERATING REVENUE
YTD Dec, 31 2015 (€/000)
E-m
oney
Paym
ent
Secu
ritie
s Ser
vice
s
App
licat
ion
outs
ourc
ing
Oth
er G
roup
activ
ities
Gro
up to
tal
E-money 4,642 - 745 14,300 19,688 Payment - 4,439 - 157 - - 4,283 Securities Services - - 421 - 421 Application outsourcing 40 51 - 4 95 Other Group activities - 14,290 - - 1,733 - 12,557 Operating revenue - other - 18,689 4,693 - 3,057 14,305 3,365 Third party customers 459,859 83,363 68,105 26,170 42,435 679,931
Total operating revenue 441,170 88,056 68,105 29,227 56,739 683,296
Reconciliation between the management accounts and the consolidated financial statements
Segment reporting is consistent with the group planning and control system’s principles and ope-rating procedures defined by the central planning and control (P&C) department and approved by group management, whose aim is to ensure consistent management reporting among the various group operations and structures.
This system is based on the general criteria of tracing management data and reports to the general accounting records. Considering the characteristics of the parent, which is required to prepare con-solidated financial statements, the group’s management account income statement is presented with the general classification used in the financial statements of banking groups.
198
In order to improve management reporting of the group’s operations and performance, as an excep-tion to the above-mentioned general criteria of tracing management figures to those of the separate and consolidated financial statements, the P&C system sets out certain grouping rules for data that are dissimilar from those of the general accounts. The main differences in data grouping relate to the following:
▪ income classified in Other operating income/expense (caption 220 of the consolidated financial statements), relating to the provision of services (non-banking/financial) that are part of the ope-rating segments’ core business, is presented under Net fee and commission income and revenue from services in the management accounts;
▪ expense classified in Other operating income/expense (caption 220 of the consolidated financial statements), relating to royalties and/or selling costs, is presented under Net fee and commission income and revenue from services in the management accounts;
▪ income classified in Other operating income/expense (caption 220 of the consolidated financial statements), relating to the recovery of expenses, is presented in the caption to which the expense refers in the management accounts;
▪ income classified in Fee and commission income (caption 40 of the consolidated financial state-ments), relating to items subject to IFRIC 13, which establishes the accounting treatment to be ap-plied by entities that grant awards under customer loyalty programmes relating to the purchase of goods or services and requires that the consideration for the obligation arising from granting the award be separated from sales revenue and deferred up to when the obligation with the cu-stomers is settled, is presented under Production costs in the management accounts;
▪ gains and losses relating to impairment losses/reversals of impairment losses on the equity por-tion of the AFS and HTM portfolios and classified in Net impairment losses (captions 130b and 130c of the consolidated financial statements) are presented under Gains (losses) on equity in-vestments and AFS financial assets in the management accounts;
▪ profits relating to the bond portion of the AFS portfolio and classified in Profit (loss) on sale or repurchase of AFS financial assets (caption 100b of the consolidated financial statements) are presented under Profit on securities and exchange rate gains in the management accounts;
▪ income and expense relating to prior year items, classified in the caption that generated them in the financial statements of banks and financial companies, are presented under Other operating income (expense) in the management accounts;
▪ dividends collected on equity instruments included in the trading portfolio, classified in Divi-dends and similar income (caption 70 of the consolidated financial statements), are presented under Profits on securities and exchange rate gains in the management accounts;
▪ fees paid to directors and statutory auditors, classified in Personnel expense (caption 180a of the consolidated financial statements), are presented under General expenses in the management accounts;
199
2015 Reports and Financial Statements
▪ gains and losses relating to interest rate hedging derivatives are presented under Net interest income (expense) in the management accounts even when they do not formally meet the requi-rements for recognition as such and are, therefore, classified in Net trading income (expense) in the consolidated financial statements (caption 80);
▪ accruals relating to the remuneration of employees, classified in Net accruals to provisions for risks and charges (caption 190 of the Consolidated financial statements), are presented under Personnel expense in the management accounts;
▪ consolidation entries relating to dividends distributed by non-group companies that are ac-counted for using the equity method, classified in Dividends and similar income (caption 70 of the consolidated financial statements), are presented under Gains (losses) on equity investments and AFS financial assets in the management accounts;
▪ income and expense that, based on supporting evidence, relate to extraordinary and/or non-recurring events for the ICBPI Group are presented under Other items in the management ac-counts, even if they are classified in other captions in the general accounting system;
▪ other administrative expenses (caption 180b of the consolidated financial statements) are clas-sified as expenses relating to the production of offered services, ITC service costs or general ex-penses and presented in the related caption of the management accounts, in order that the group companies present operating costs consistently.
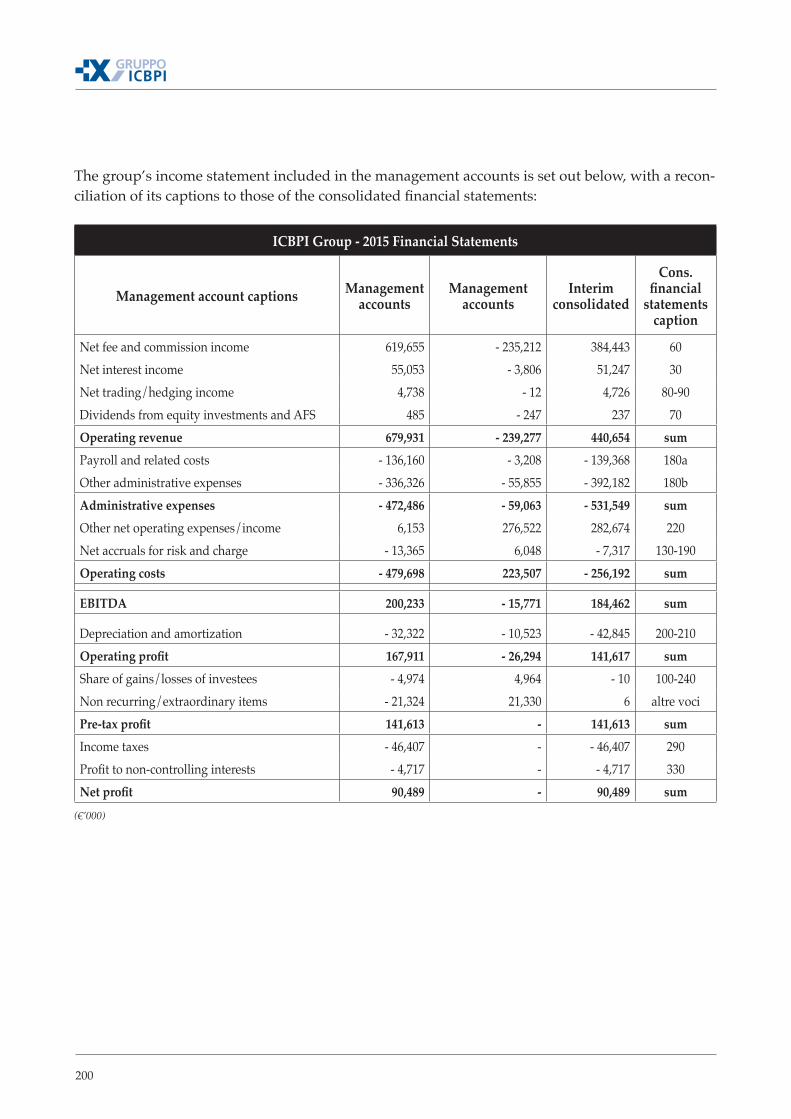
200
The group’s income statement included in the management accounts is set out below, with a recon-ciliation of its captions to those of the consolidated financial statements:
ICBPI Group - 2015 Financial Statements
Management account captions Management accounts
Management accounts
Interim consolidated
Cons. financial
statements caption
Net fee and commission income 619,655 - 235,212 384,443 60 Net interest income 55,053 - 3,806 51,247 30 Net trading/hedging income 4,738 - 12 4,726 80-90 Dividends from equity investments and AFS 485 - 247 237 70 Operating revenue 679,931 - 239,277 440,654 sumPayroll and related costs - 136,160 - 3,208 - 139,368 180a Other administrative expenses - 336,326 - 55,855 - 392,182 180b Administrative expenses - 472,486 - 59,063 - 531,549 sumOther net operating expenses/income 6,153 276,522 282,674 220 Net accruals for risk and charge - 13,365 6,048 - 7,317 130-190 Operating costs - 479,698 223,507 - 256,192 sum
EBITDA 200,233 - 15,771 184,462 sum
Depreciation and amortization - 32,322 - 10,523 - 42,845 200-210 Operating profit 167,911 - 26,294 141,617 sumShare of gains/losses of investees - 4,974 4,964 - 10 100-240 Non recurring/extraordinary items - 21,324 21,330 6 altre vociPre-tax profit 141,613 - 141,613 sumIncome taxes - 46,407 - - 46,407 290 Profit to non-controlling interests - 4,717 - - 4,717 330 Net profit 90,489 - 90,489 sum
(€’000)
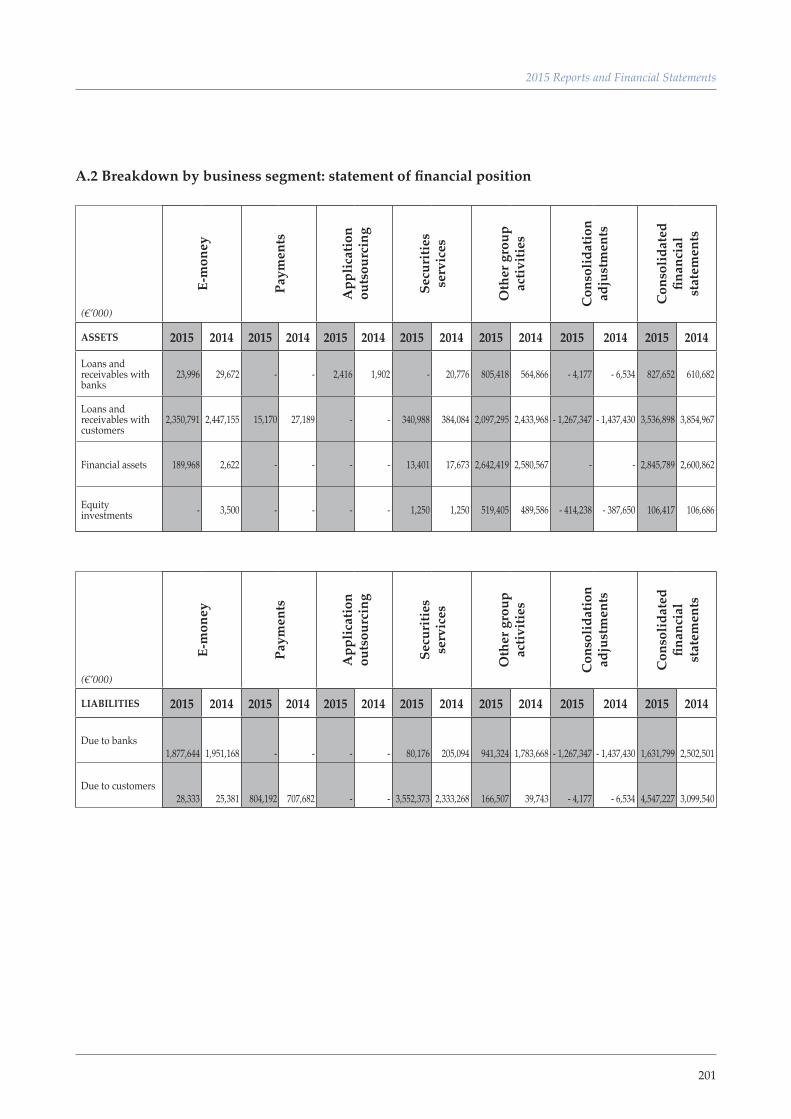
201
2015 Reports and Financial Statements
A.2 Breakdown by business segment: statement of financial position
(€’000)
E-m
oney
Paym
ents
App
licat
ion
outs
ourc
ing
Secu
ritie
s se
rvic
es
Oth
er g
roup
ac
tiviti
es
Con
solid
atio
n ad
just
men
ts
Con
solid
ated
fin
anci
al
stat
emen
ts
ASSETS 2015 2014 2015 2014 2015 2014 2015 2014 2015 2014 2015 2014 2015 2014
Loans and receivables with banks
23,996 29,672 - - 2,416 1,902 - 20,776 805,418 564,866 - 4,177 - 6,534 827,652 610,682
Loans and receivables with customers
2,350,791 2,447,155 15,170 27,189 - - 340,988 384,084 2,097,295 2,433,968 - 1,267,347 - 1,437,430 3,536,898 3,854,967
Financial assets 189,968 2,622 - - - - 13,401 17,673 2,642,419 2,580,567 - - 2,845,789 2,600,862
Equity investments - 3,500 - - - - 1,250 1,250 519,405 489,586 - 414,238 - 387,650 106,417 106,686
(€’000)
E-m
oney
Paym
ents
App
licat
ion
outs
ourc
ing
Secu
ritie
s se
rvic
es
Oth
er g
roup
ac
tiviti
es
Con
solid
atio
n ad
just
men
ts
Con
solid
ated
fin
anci
al
stat
emen
tsLIABILITIES 2015 2014 2015 2014 2015 2014 2015 2014 2015 2014 2015 2014 2015 2014
Due to banks1,877,644 1,951,168 - - - - 80,176 205,094 941,324 1,783,668 - 1,267,347 - 1,437,430 1,631,799 2,502,501
Due to customers28,333 25,381 804,192 707,682 - - 3,552,373 2,333,268 166,507 39,743 - 4,177 - 6,534 4,547,227 3,099,540
202
203
2015 Reports and Financial Statements

205
Reports and financial statements of the Parent Company

207
Dear Shareholders,
Period 2015 closes with a net profit of Euro 62.2 million against profit in 2014 of Euro 77.9 million. That result is mainly due to the negative impact, for an overall € 12 million, of the bank crisis resolution Fund. Equity amounts to Euro 810.0 million against Euro 772.0 million in December 2014.
Operating revenue amounts to a total of € 254.8 million, down by € 12 million (0.5%) compared to 2104 for the combined effect of the drop in interest margin from € 78.2 million to € 61.3 million (-21.6%) and the increase in commission and revenue from services from € 132.8 million to € 146.4 million (+10.2%). EBITDA is € 105 million down 2.6% against the € 107.9 million in 2014
During the course of the year, operations were completed for adjusting the Ar-ticles of Association with supervisory provisions pertaining to corporate gover-nance as well as policies and practices of remuneration and incentives.
On 11 December 2015, the extraordinary shareholders’ meeting approved cer-tain proposals for modification of the Articles of Association in order to render its structure functional to changes in the shareholding structure of the Institute, as illustrated in the relative section of the consolidated financial statements. These changes primarily concerned the following:
▪ the removal of the 22.5% threshold as a maximum limit for share ownership of a shareholder as well as of the specific requirements for becoming a sha-reholder;
▪ raising of the threshold for the submission of lists (and for the appointment of the Board of Statutory Auditors) from 4 to 7%;
▪ regulation of share transfers;
On 18 December 2015, the ordinary shareholders’ meeting deliberated in favor
Board of Directors’ Report on Operations
GOVERNANCE STRUCTURES
208
of the renewal – for the years 2015/2017 – of the company bodies whose compo-sition reflects a degree of diversification - in terms of competencies, experience, age, gender and national/international background – which is adequate for the operational requirements of the bank and the Group.
Giovanni De Censi and Giuseppe Capponcelli were confirmed at the head of the institute as the Chairman and Chief Executive Officer, respectively (in ad-dition to general manager and CEO of the subsidiary CartaSi). Franco Bernabè was appointed as Deputy Chairman as well as Chairman of the subsidiary Car-taSi. This is a profoundly renewed structure – although still marked with con-tinuity – which guarantees the continuation and strengthening of the profitable path which has led the Group to consolidate its leadership in the markets of reference.
In compliance with the best practices of the sector as well as supervisory provi-sions – and in order to favor an efficient system of reporting and consultation which allows the Board of the Parent Company to more effectively evaluate cer-tain topics falling under its competence – the following four committees were created between the end of 2015 and the first months of 2016 with consulting and advisory functions, diversified by sectors of competence: Risk Committee, Committee for Operations with Related Parties, Remuneration Committee, Strategic Committee. The latter is structured into two subcommittees (Indu-strial Steering Group and Financial steering Group).
ICBPI strengthened its commitment to the program for compliance with the specifications of the Bank of Italy (memorandum no. 285 of the Bank of Italy, 11th update of 21 July 2015) in relation to the “Data management system” by creating specific interfunctional workgroup dedicated to continuing the pro-gram for definition and implementation of the Data Governance system. The conceptual model for company information was therefore defined and the re-lative Business Glossary was prepared; the collected information was classified and the plan of operations for 2016 was defined.
The updating of the Organizational Model pursuant to Leg. Decree 231/01 was completed for the purposes of incorporating the provisions pertaining to: en-vironmental crimes (so-called “Eco-crimes Law”, Law 68/2015); crimes against the public administration, mafia-related crimes and false financial reporting (so-called “Anti-corruption Law”, Law 69/2015); self money laundering crime (inserted within Leg. Decree 231/01 by Law 186/2014). This was designed to integrate principles of behavior and strengthen current oversight methods.
The activities pertaining to compliance with the FATCA legislation (Foreign Ac-
REGULATORY COMPLIANCE
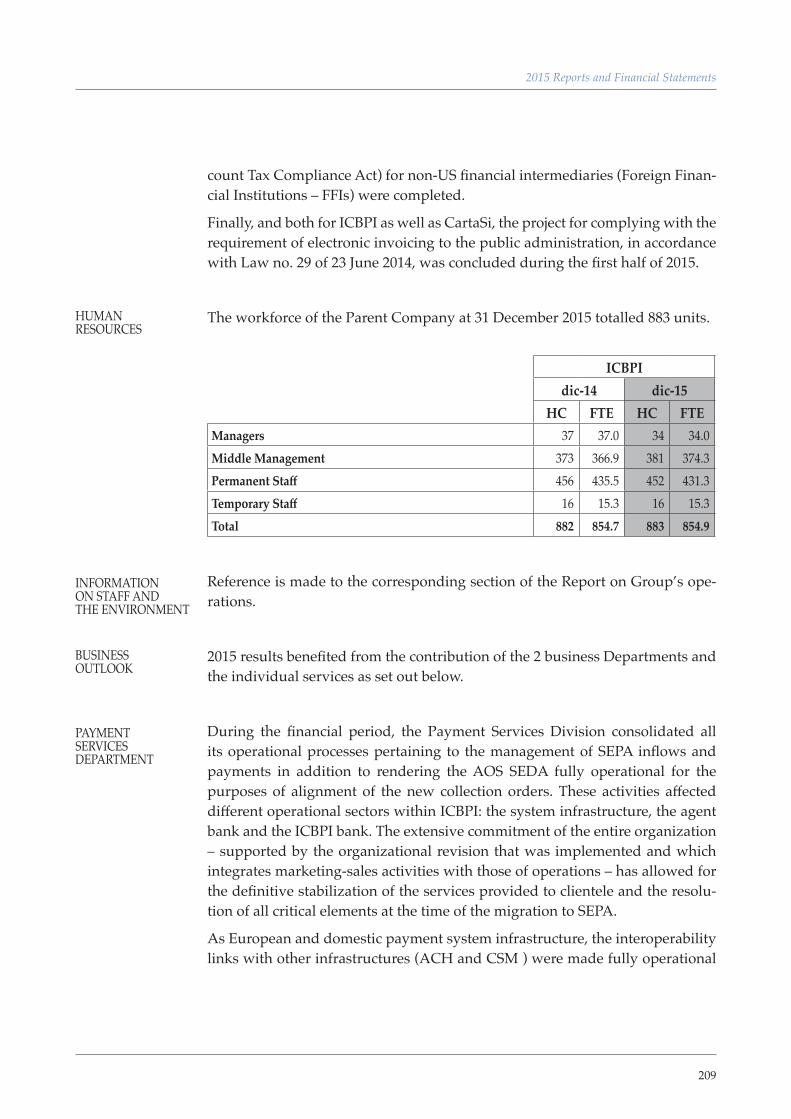
209
2015 Reports and Financial Statements
count Tax Compliance Act) for non-US financial intermediaries (Foreign Finan-cial Institutions – FFIs) were completed.
Finally, and both for ICBPI as well as CartaSi, the project for complying with the requirement of electronic invoicing to the public administration, in accordance with Law no. 29 of 23 June 2014, was concluded during the first half of 2015.
The workforce of the Parent Company at 31 December 2015 totalled 883 units.
ICBPI
dic-14 dic-15HC FTE HC FTE
Managers 37 37.0 34 34.0Middle Management 373 366.9 381 374.3Permanent Staff 456 435.5 452 431.3Temporary Staff 16 15.3 16 15.3Total 882 854.7 883 854.9
Reference is made to the corresponding section of the Report on Group’s ope-rations.
2015 results benefited from the contribution of the 2 business Departments and the individual services as set out below.
During the financial period, the Payment Services Division consolidated all its operational processes pertaining to the management of SEPA inflows and payments in addition to rendering the AOS SEDA fully operational for the purposes of alignment of the new collection orders. These activities affected different operational sectors within ICBPI: the system infrastructure, the agent bank and the ICBPI bank. The extensive commitment of the entire organization – supported by the organizational revision that was implemented and which integrates marketing-sales activities with those of operations – has allowed for the definitive stabilization of the services provided to clientele and the resolu-tion of all critical elements at the time of the migration to SEPA.
As European and domestic payment system infrastructure, the interoperability links with other infrastructures (ACH and CSM ) were made fully operational
HUMAN RESOURCES
INFORMATION ON STAFF AND THE ENVIRONMENT
BUSINESS OUTLOOK
PAYMENT SERVICES DEPARTMENT
210
in close collaboration with the outsourcer Equens, the Bank of Italy and EBA Clearing. As part of the collaboration with the Bank of Italy on CSM ICBPI-BI-Comp, the night cycle has been rendered operational (Cycle 0 of BI-Comp) for the settlement of SCT orders; in addition, a Web Station for real-time tracking and monitoring of all SEPA and SEDA operations has also been issued to PSP customers. It should be noted that such interventions have allowed for a rapid increase in the quality of service provided to customers. In parallel with these initiatives, the main phase of the review and simplification of the architectures associated with the processes of supplying payment services to the PSP custo-mers of ICBPI was completed.
For the purposes of significantly improving the assistance and support servi-ce, a cross-facility structure of Customer Care dedicated to all ICBPI customers and for all supplied services was activated; along with the adoption of an IT and customer service portal named “All4You”, it allows customers to utilize an integrated, effective and efficient interface to interact with ICBPI operations in a structured manner. This new operational dashboard of the ICBPI services – in the payments sector – allows customers to obtain real-time notifications, syn-thetic specifications on the operational status of processes/services as well as integrating support reporting.
In addition, it should be noted that the ACH ICBPI payments infrastructure – which guarantees full access in the SEPA area due to inter-operational agree-ments in the EACHA sector and with EBA Step2 – has been fully managed by ICBPI since 2015, with the latter retaining full intellectual property rights. As of today’s date, 270 PSP members (direct and indirect) participate in ACH ICBPI for connection and clearing services with other ACHs/CSMs; these services al-low circa 4,140 banks in Europe to be reached. With regard to analogous activi-ties pertaining only to domestic products, the banks participating in the ICBPI Application Center are 172.
Activities in support of the CENT European project for the creation of a cen-tralized technological hub have continued in order to facilitate the exchange of cross-border SEPA messaging, in accordance with a federated model which the-reby avoids the limits derived from current point to point connections between ACHs adhering to the EACHA model.
Of the significant projects initiated in the period, the one relative to oversight of adoption of instant payment systems within the Italian market should be noted, in accordance with the specifications that are under discussion by the European authorities and which should favor the development of a system of infrastructures in support of all payment typologies that are IBAN-based: Do-mestic, SEPA and Real Time. The latter includes the possibility of activating
211
2015 Reports and Financial Statements
multi-channel services for a variety of uses such P2P, P2B, B2B and other subse-quent ones.
During the course of 2015, the PCP product named ZAC was initiated for six customer banks on the basis of a transfer of money between two entities owning a bank account or an account card (IBAN-based) within a Bank adhering to the service. This product, as all analogous ones present within the market, must, in any case, be subject to regulatory compliance adjustments according to specifi-cations supplied by the authorities.
As part of the initiative of the Bancomat Consortium for the launch of the Onli-ne Pagobancomat, ICBPI presents itself as a technical facilitator with respect to Issuing and Acquiring companies, providing solutions and services which aim to simply managerial and technological activities in order to participate in the new e-commerce product with the Bancomat card. The offer of the ICBPI Group for Banks also includes the CartaSi components such as the updating of the virtual POS Xpay which is opportunely adjusted in order to allow for an interaction with the Directory Services of Online Pagobancomat.
In 2015, the sector of corporate services reported a positive increase for all seg-ments of the offer: E-Banking workstations, CBI Node Services, CBI network management, electronic invoicing and paperless services, payments for the PA on the AGID node (Agency for Digital Italy).
The adoption of the measures described above - in addition to the expansion of the customer portfolio in all segments of payment services and, in some ca-ses, the simultaneous presence of regulatory requirements – have promoted an overall increase in operating revenues within the segment compared to 2014 of approximately 3.7%, rising from approximately 83.7 million / Euro in 2014 to about 86.8 million / Euro in 2015 The interest margin linked to payment servi-ces dropped 62.2% going from €3.3 million in 2014 to €1.2 million in 2015.
From a managerial perspective, the consolidation of SEPA traffic as well as the close of the domestic interbank procedure for BON wire transfers and the mas-sive migration of the RID (direct debit) product have resulted in a complete re-modulation of the volumes managed by ICBPI within the Clearing segment.
Overall, the ACH and ICBPI Application Center have managed circa 750 mil-lion during the period compared to the circa 800 million of the same period of the previous year; the decrease in revenues was, however, contained and mitigated with the new VASs. It should be noted that a significant quota of the pre-SEPA volume quotas concerned the Interbank Charges domestic procedure which, due to the effect of the transfer to SEPA, significantly decreased at the
PAYMENT SERVICES
212
System level since it was no longer required for the SCT and SDD products. It should be noted that- following the awarding of the BancoPosta tender – the relative migration to the clearing systems managed by ICBPI was successfully completed; the migrations of two other significant PSP customers was comple-ted on the same systems, thereby resulting in a significant increase in clearing volumes for future years.
The standardized and competitive SEPA collection and payment agent services grew in the period by circa 3.5% in terms of volumes and, at the same time, in terms of revenues. The managed operations of PSP transferred by ICBPI were circa 335.7 million compared to the 324.4 million of 2014. The top performances were reported in the interbank collections segment (SEPA and domestic) as well as in the “competitive” and foreign collections and payments segments.
The operational volumes of collection and payment services that were executed with material means (checks, bills, etc.) were equal to circa 94 million, a 19% increase compared to 2014 when circa 80 million parts were handled; this was a strong countertrend compared to the systemic decrease (7%) of these payment methods. The amount of managed Banking Checks was approximately 80 mil-lion compared to 65 million in 2014 (+ 22%) due to the participation of two important customers banks.
The activation of two important operators within the Bills segment generated a significant increase in volumes (+ 7.9%), rising from 10.2 million items handled in 2014 to about 11.1 million in 2015.
The volume of managed bankers’ drafts (Issued and Paid) was about 3.1 mil-lion, a decrease of approximately 10% compared to 2014.
The volumes of the INPS pension payments increased by about 2%, substantial-ly in line with those of 2014. The volume of “INPS Vouchers” grew by 63% in the wake of the government’s provisions in this sector.
The volumes of payments managed by AGEA and ARCEA decreased by about 15% due to the adoption – on the part of the authorities - of new ways of fund disbursement. The profitability of the service reported, on the other hand, a positive increase due to actions taken to lower the costs incurred by ICBPI and the undersigning of the new agreement with AGEA.
SDD collections that were managed on behalf of ICBPI corporate customers in-creased by approximately 30% compared to 2014. This increase was due to the full activation of the inflows generated by CartaSi.
The collection and payments service within the AGiD node has begun to grow, even though it still does not report significant volumes.
213
2015 Reports and Financial Statements
The E-banking workstations managed during the year increased by 22.4% com-pared to 2014, rising from about 203,000 to more than 248,000. The increase is mainly due to the gradual activation, as of May 2014, of the new Corporate Banking platform called “Innovation Banking”, on which more than 100,000 customer bank work stations have been made operational. The path of functio-nal enhancement of the new Corporate Banking platform has continued with high value-added services for banks and their customers (Invoice Advances and Cash Management).
The CBI Node activities reported an increase in handled provisions (executive and informational) of circa 11% compared to 2014, rising from 1,745 million to circa 1,937 million. The increase in volumes is partly ascribable to the operatio-nal start-up of the new services proposed by the CBI Consortium: C-Bills and Credit Certification.
During the course of 2015, services were further developed for the management of “paperless” processes (undersigning of contracts for Unione Fiduciaria) and new solutions were created within the sector for electronic invoicing (agree-ments with MyFoglio and Edoc), thereby allowing us to further increase the amount of digital documents that are managed.
It should be noted that, in 2015, the three-year renewal of the supply of It ser-vices for the new infrastructure of the CBI network was undersigned with CBI (Customer to Business Interaction Consortium). This will allow ICBPI to con-tinue – with the oversight provided by technology architectures – the relative activities for SW development, thereby providing a significant impulse to the innovation of peripheral services.
Revenue from the Digital Corporate Banking services increased 3.4% in 2015 against 2014 going from 23.4 m/Euro to 24.2 m/Euro.
During the year, the Securities Services Department services (custody, admini-stration and settlement of securities, Depositary Bank, Fund Services, Broke-rage & Primary Market, Market Making) provided to Banks, investment firms (SIM), asset management companies (SGR) and Funds continued the positive growth trend of the last years recording an increase in the size of portfolios un-der management and in traded securities. The businesses based on the number of transactions on financial markets (Investment Services, Settlement) benefited from the slight recovery in the European economy, offsetting the decrease in the interest income due to still low rates.
Revenues, net of the interest margin and income from securities, have increa-sed from a total of Euro 49.1 million in 2014 to Euro 59.6 million, a significant increase of 21.4%.
BANK-BUSINESS SERVICES
SECURITIES SERVICES DEPARTMENT (D2S)
214
During the year, the activities of the Securities Services Department focused on strengthening the customer base and implementing the primary business development initiatives that are needed to consolidate the Group as the Italian player of reference in the domestic market. In particular, it proceeded with:
▪ successfully completing, following the go-live in Italy, Greece, Malta, Roma-nia and Switzerland, the first wave of migration to the European settlement platform Target 2 Securities where ICBPI was the direct participant (DCP), in accordance with the objective of becoming a hub even for banks of the territory for services of custody and settlement;
▪ initiating activities for the supply of the new supervisory reports and Covip statistics to retirement funds;
▪ implementing the specialist function for branded securities, both subordi-nated and senior, within the HI-MTF market, in line with the specifications of the new regulations;
▪ developing a new service model in support of “securities lending” activities for retirement funds, in partnership with a primary international institu-tion and for the purposes of valorizing the important assets held in custody whose economic impact is expected to occur next year.
Global Custody services – disbursed to more than 150 Institutional Customers – recorded marginal growth in 2015 in terms of managed portfolio levels and more significant growth in terms of settlement services; they benefited from the first signs of recovery of the primary advanced economies.
At the year end, the portfolio of securities under custody and administration amounted to Euro 127.6 billion, 37% being foreign securities, an increase of 1.7% compared to the 2014 values. Commercial agreements with a big banking group allowed ICBPI to raise the assets under management abroad, further consoli-dating the supply model having an integrated structure (trading, settlement e custody).
Settlement activities reported, in 2015, a sharp increase in both operations in foreign markets (+ 7.8%) as well as in the number of operations with Italian securities settled in Express II (+ 8.0%). Overall, the transaction volumes in this segment amounted to 3.26 million settlements (+ 7.9%) in 2015.
GLOBAL CUSTODY
215
2015 Reports and Financial Statements
The Depositary Bank & Controls sector continued to grow also in 2015, recor-ding an increase in assets under management amounting to about Euro 56.7 billion (+4.9% compared to 2014), thanks to the acquisition of new customers and the positive trend of deposits in the asset management market.
A total of 46 customer pension funds made use of the Service in 2015 (+1 com-pared to 2014), with assets under management totalling about Euro 21.5 billion (+7.5%), confirming ICBPI as a market leader in this segment.
There was also an increase in assets for open-ended mutual funds, now appro-ximately Euro 31.7 billion (+3.5%), and for closed-end mutual funds, with assets under management now totalling about Euro 3.6 billion (+2.2%).
The overall portfolio of funds under management now comprises 135 mutual funds, 19 private equity funds and 42 real estate funds.
The positive trend in customer deposits has also benefited Fund Administration activities, now implemented with a portfolio of more than 42 billion euros (+ 7%), as well as Transfer Agent activities which currently manage more than 2.4 million subscribers (+ 5.5%)
The Brokerage & Primary Market segment has increased its trading activities on behalf of third parties in 2015.
The overall value of securities traded, equal to Euro 46.89 billion, increased by 2.3% compared to 2014. In particular, growth was significant in the domestic stocks segment (+ 21.4%) as well as foreign stocks (+ 61.4%), compared with a decrease in traded volumes in the fixed income segment (-17.2%).
The number of executed transactions exceeded overall 1.75 million orders while the volume of the lots relative to the trading activities on derivatives exceeded 350 thousand units.
The market share in the segments managed by Borsa Italiana (Mta, Mot EftPlus) remained essentially unchanged.
Market Making activities reported revenues of circa 4 million Euro in the year.
During the course of the year, specialist activities were implemented on bran-ded bond securities for a banking group, thereby positively contributing to commission revenues; carry trading activities were strengthened, leading to be-nefits to generated interest margin.
The competitiveness demonstrated with respect to other Market Makers ope-rating within the HI-MTF market remained at positive levels, thereby allowing
OPERATIONS SERVICES AND DEPOSITARY BANK& CONTROLS
BROKERAGE & PRIMARY MARKET
MARKET MAKING
216
the service to maintain its leadership even this year and with a market share that was consolidated at circa 40% despite the entry of a new Market Maker.
The management of liquidity and of the securities portfolio of the parent com-pany ICBPI, as well foreign exchange activities, were constantly centered upon the objective of minimizing operational, credit and market risks, thereby confir-ming the usual activities of support to different entities and Companies opera-ting within the Group.
The presence of overnight rates that were often less than 0% resulted in a decre-ase in exchanged market volumes as well as reported increases in the average deposits within the accounts of clientele of ICBPI, thereby generating a lower use of the market for collection purposes.
The excess liquidity - both in Euro and in other currencies - was managed through investment transactions over a short-term time period. During the year, deposits have been opened in the e-MID and New-MIC market for up to six months or through the use of MMF repurchase agreements in the market.
Within the Available for Sales portfolio of securities - following the investment policy adopted in recent years – there has been a partial renewal of maturi-ties through the purchase of domestic government issues with a residual ma-turity of 3 and 5 years. Following the decisions of the ECB in December, and with a further decline in yields expressed by the curve of Italian government issues, it was deemed opportune to temporarily relocate liquidity through very short-term investments (BOT securities with a residual maturity of less than 3 months).
Within the realm of the Held to Maturity portfolio - with reference to Leg. Decree 183 of 22/11/2015 and following the provision of the Crisis Resolution Authority created within the Bank of Italy – two positions of subordinated secu-rities issued by Italian Banks already under extraordinary administration were completely written down.
Exposure to Credit Risk is characterised by the particular nature of the Parent Company as a so-called “second level Bank”, i.e. a bank whose core business is to offer services to the banking and financial system and to major corporate cu-stomers, basically in the area of payment systems and services for the custody, management and settlement of securities. Consequently, credit supply is closely related to the provision of those types of services and is not a business objective as such.
TREASURY AND FINANCIAL SERVICES
CREDIT
217
2015 Reports and Financial Statements
The methods for measuring credit risk undertaken and the relative control pro-cess have a streamlined and simple character because of the limited amount of credit exposure.
The guidelines for credit management are in any case based on the general pru-dent basis, correct and proper management and compliance with legislative and regulatory provisions currently in force.
Derivative transactions were not used for hedging credit risk.
Positions with credit lines have the following counterparties: 50% supervised institutions, 31% subsidiaries or companies controlled by ICBPI, 17% CIUs and property brokerage companies and only 2% relative to the companies belon-ging to the Corporate segment (these are almost exclusively instrumental lines of credit related to the execution of collection orders).
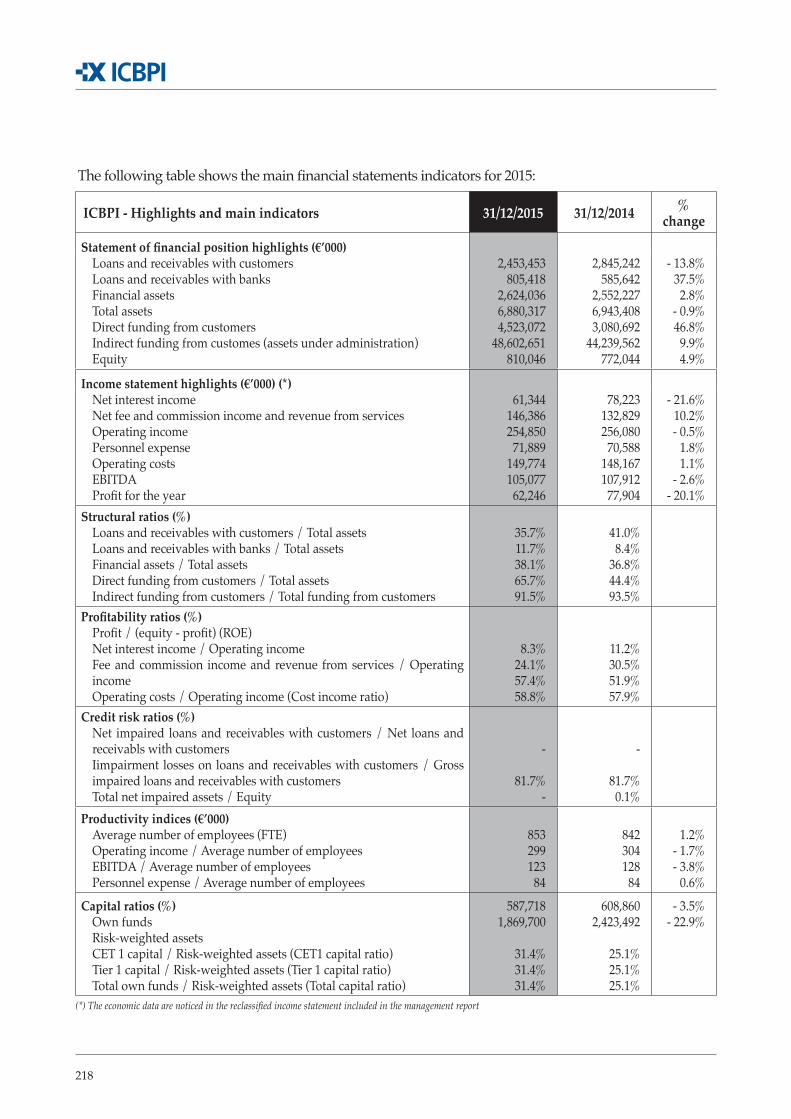
218
The following table shows the main financial statements indicators for 2015:
ICBPI - Highlights and main indicators 31/12/2015 31/12/2014 % change
Statement of financial position highlights (€’000)Loans and receivables with customersLoans and receivables with banksFinancial assetsTotal assetsDirect funding from customersIndirect funding from customes (assets under administration)Equity
2,453,453 805,418
2,624,036 6,880,317 4,523,072
48,602,651 810,046
2,845,242 585,642
2,552,227 6,943,408 3,080,692
44,239,562 772,044
- 13.8% 37.5% 2.8%
- 0.9% 46.8% 9.9% 4.9%
Income statement highlights (€’000) (*)Net interest incomeNet fee and commission income and revenue from servicesOperating incomePersonnel expenseOperating costsEBITDAProfit for the year
61,344 146,386 254,850 71,889
149,774 105,077 62,246
78,223 132,829 256,080 70,588
148,167 107,912 77,904
- 21.6% 10.2% - 0.5%
1.8% 1.1%
- 2.6% - 20.1%
Structural ratios (%)Loans and receivables with customers / Total assetsLoans and receivables with banks / Total assetsFinancial assets / Total assetsDirect funding from customers / Total assetsIndirect funding from customers / Total funding from customers
35.7% 11.7% 38.1% 65.7% 91.5%
41.0% 8.4%
36.8% 44.4% 93.5%
Profitability ratios (%)Profit / (equity - profit) (ROE)Net interest income / Operating income Fee and commission income and revenue from services / Operating income Operating costs / Operating income (Cost income ratio)
8.3% 24.1% 57.4% 58.8%
11.2% 30.5% 51.9% 57.9%
Credit risk ratios (%)Net impaired loans and receivables with customers / Net loans and receivabls with customersIimpairment losses on loans and receivables with customers / Gross impaired loans and receivables with customersTotal net impaired assets / Equity
-
81.7% -
-
81.7% 0.1%
Productivity indices (€’000)Average number of employees (FTE)Operating income / Average number of employeesEBITDA / Average number of employeesPersonnel expense / Average number of employees
85329912384
84230412884
1.2% - 1.7% - 3.8%
0.6%
Capital ratios (%)Own fundsRisk-weighted assetsCET 1 capital / Risk-weighted assets (CET1 capital ratio)Tier 1 capital / Risk-weighted assets (Tier 1 capital ratio)Total own funds / Risk-weighted assets (Total capital ratio)
587,718 1,869,700
31.4%31.4%31.4%
608,860 2,423,492
25.1%25.1%25.1%
- 3.5% - 22.9%
(*) The economic data are noticed in the reclassified income statement included in the management report
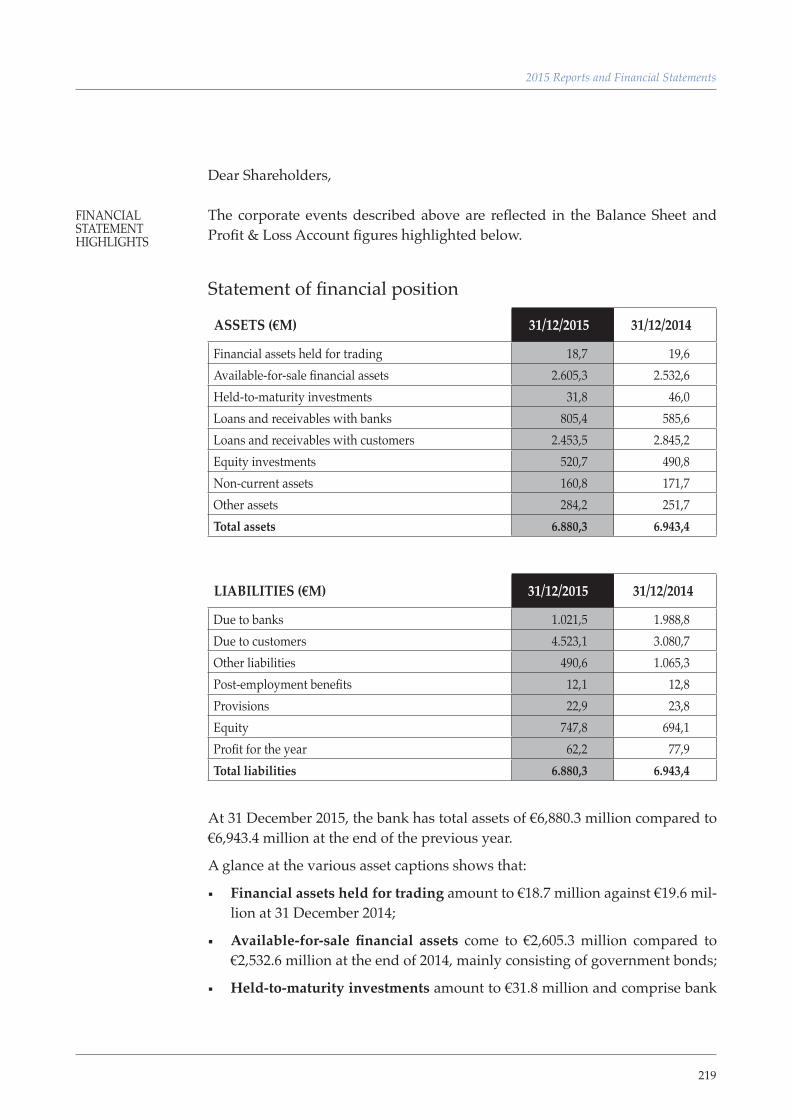
219
2015 Reports and Financial Statements
FINANCIAL STATEMENT HIGHLIGHTS
Dear Shareholders,
The corporate events described above are reflected in the Balance Sheet and Profit & Loss Account figures highlighted below.
Statement of financial position
ASSETS (€M) 31/12/2015 31/12/2014
Financial assets held for trading 18,7 19,6Available-for-sale financial assets 2.605,3 2.532,6Held-to-maturity investments 31,8 46,0Loans and receivables with banks 805,4 585,6Loans and receivables with customers 2.453,5 2.845,2Equity investments 520,7 490,8Non-current assets 160,8 171,7Other assets 284,2 251,7Total assets 6.880,3 6.943,4
LIABILITIES (€M) 31/12/2015 31/12/2014
Due to banks 1.021,5 1.988,8Due to customers 4.523,1 3.080,7Other liabilities 490,6 1.065,3Post-employment benefits 12,1 12,8Provisions 22,9 23,8Equity 747,8 694,1Profit for the year 62,2 77,9Total liabilities 6.880,3 6.943,4
At 31 December 2015, the bank has total assets of €6,880.3 million compared to €6,943.4 million at the end of the previous year.
A glance at the various asset captions shows that:
▪ Financial assets held for trading amount to €18.7 million against €19.6 mil-lion at 31 December 2014;
▪ Available-for-sale financial assets come to €2,605.3 million compared to €2,532.6 million at the end of 2014, mainly consisting of government bonds;
▪ Held-to-maturity investments amount to €31.8 million and comprise bank
220
bonds (31 December 2014: €46.0 million). The reduction is mainly a result of redemption of certain bonds that reached maturity and the impairment of two securities held by the bank;
▪ Loans and receivables with banks amount to €805.4 million compared to €585.6 million at the previous reporting date. The increase is principally due to the larger deposits and joint accounts with banks and reverse repos in place at year end;
▪ Loans and receivables with customers decreased from €2,845.2 million at 31 December 2014 to €2,453.5 million at the reporting date. The variation is mainly attributable to the smaller number of reverse repos in place at year end compared to 31 December 2014 and a reduction in other financing, mo-stly consisting of guarantee deposits provided to carry out business activi-ties;
▪ Equity investments come to €520.7 million compared to €490.8 million at the previous year end. The increase is due to the acquisition of 2.2 million CartaSi shares;
▪ Non-current assets amount to €160.8 million against €171.7 million at 31 December 2014. The reduction is mostly a result of amortisation and depre-ciation recognised during the year;
▪ Other assets of €284.2 million (31 December 2014: €251.7 million) include cash and cash equivalents of €22.4 million, tax assets of €39.9 million, inclu-ding deferred tax assets of €31.3 million and other assets of €221.9 million. The increase mainly refers to the greater liquidity deposited with central banks.
With respect to liabilities:
▪ Due to banks amounts to €1,021.5 million compared to €1,988.8 million at 31 December 2014. The decrease is principally attributable to the smaller deposits and a smaller number of repos in place at the reporting date;
▪ Due to customers comes to €4,523.1 million against €3,080.7 million at the previous year end. The increase is mostly due to the higher volume of fun-ding from customers compared to 31 December 2014 and the repos in place at the reporting date;
▪ Other liabilities amount to €490.6 million compared to €1,065.3 million at 31 December 2014 and include financial liabilities held for trading of €4.9 million, deferred tax liabilities of €29.8 million and other liabilities of €455.9 million. The decrease is attributable to the smaller amounts in suspense ac-counts on 31 December, relating to the execution of payment orders that took place in the following few days;
221
2015 Reports and Financial Statements
▪ Post-employment benefits total €12.1 million compared to €12.8 million at the end of 2014;
▪ Provisions amount to €22.9 million against €23.8 million at 31 December 2014;
▪ Equity totals €747.8 million compared to €694.1 million at the previous year end. The variation is the result of the €60.9 million increase in reserves due to allocation of the 2014 profit, the €7.5 million decrease in the fair value reserve and the €0.3 million increase in the actuarial reserve.
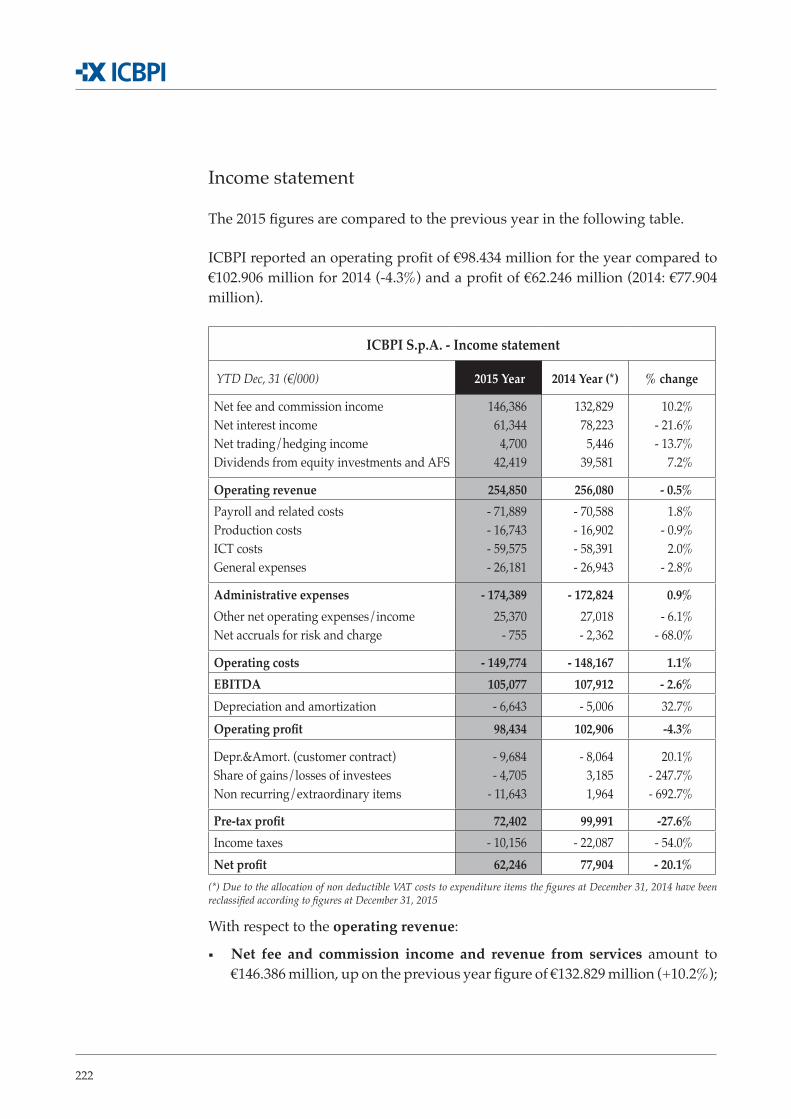
222
Income statement
The 2015 figures are compared to the previous year in the following table.
ICBPI reported an operating profit of €98.434 million for the year compared to €102.906 million for 2014 (-4.3%) and a profit of €62.246 million (2014: €77.904 million).
ICBPI S.p.A. - Income statement
YTD Dec, 31 (€/000) 2015 Year 2014 Year (*) % change
Net fee and commission incomeNet interest incomeNet trading/hedging incomeDividends from equity investments and AFS
146,386 61,344 4,700
42,419
132,829 78,223 5,446
39,581
10.2% - 21.6% - 13.7%
7.2%
Operating revenue 254,850 256,080 - 0.5% Payroll and related costsProduction costsICT costsGeneral expenses
- 71,889 - 16,743 - 59,575 - 26,181
- 70,588 - 16,902 - 58,391 - 26,943
1.8% - 0.9%
2.0% - 2.8%
Administrative expenses - 174,389 - 172,824 0.9% Other net operating expenses/incomeNet accruals for risk and charge
25,370 - 755
27,018 - 2,362
- 6.1% - 68.0%
Operating costs - 149,774 - 148,167 1.1% EBITDA 105,077 107,912 - 2.6% Depreciation and amortization - 6,643 - 5,006 32.7% Operating profit 98,434 102,906 -4.3%
Depr.&Amort. (customer contract)Share of gains/losses of investeesNon recurring/extraordinary items
- 9,684 - 4,705
- 11,643
- 8,064 3,185 1,964
20.1% - 247.7% - 692.7%
Pre-tax profit 72,402 99,991 -27.6%Income taxes - 10,156 - 22,087 - 54.0%Net profit 62,246 77,904 - 20.1%
(*) Due to the allocation of non deductible VAT costs to expenditure items the figures at December 31, 2014 have been reclassified according to figures at December 31, 2015
With respect to the operating revenue:
▪ Net fee and commission income and revenue from services amount to €146.386 million, up on the previous year figure of €132.829 million (+10.2%);
223
2015 Reports and Financial Statements
▪ Net interest income decreased from €78.223 million for 2014 to €61.344 mil-lion for the reporting period (-21.6%);
▪ Gains on securities and net exchange rate gains amounts to €4.700 million compared to €5.446 million for the previous year (-13.7%);
▪ Dividends and other income increased to €42.419 million from €39.581 mil-lion for 2014 (+7.2%).
With respect to the Operating costs:
▪ Payroll and related costs amounts to € 71.889 million compared to €70.588 million for 2014 (+1.8%);
▪ Production costs come to €16.743 million against €16.902 million for 2014 (-0.9%);
▪ ICT costs increased to €59.575 million from €58.391 million for the previous year (+2.0%);
▪ General expenses amount to €26.181 million compared to €26.943 million for 2014 (-2.8%);
▪ Other operating income, net decreased to €25.370 million from €27.018 mil-lion for 2014 (-6.1%);
▪ Operating provisions of €0.775 million mainly include costs incurred du-ring the year for the bank’s intermediation service as well as other net ope-rating provisions.
Operating costs thus come to €149.774 million compared to €148.167 million for the previous year (+1.1%).
EBTIDA thus come to €105.077 million compared to €107.912 million for the previous year (-2.6%).
Depreciation and amortization increased from €6.643 million for 2014 to €5.006 million (+32.7%).
Operating profit thus come to €98.434 million compared to €102.906 million for the previous year (-4.3%).
The following captions are summer to the operating profit:
▪ Depreciation and amortisation of the customer contract of €9.984 million;
▪ Share of losses of investees of €4.705 million, comprising:
▪ Impairment losses of €4.478 million recognised on non-current securities of Banca delle Marche and Banca dell’Etruria of €0.227 million on two funds classified in the AFS portfolio;
224
▪ Non recurring/extraordinary items of €11.643 million, including:
▪ cost for National Resolution Fund €5.639,
▪ cost for the Group’s transformation/evolution € 4.515 million,
▪ costs of €0.620 million to settle labour disputes;
▪ costs of €0.970 million to close Project Bolt;
▪ other income of €0.101 million.
These components led to a pre-tax profit of €72.402 million, which led to a profit of €62.246 million for the year after taxes of €10.156 million.
Information is provided below on the status of going concern of the Parent Company as well as on financial risks, impairment tests of assets and uncer-tainties in the use of estimates.
Given the following indicators pertaining to the Parent Company:
Financial indicators
▪ there was no situation involving a capital deficit or net negative working capital;
▪ there were no loans with fixed or upcoming expiration dates without positi-ve prospects of renewal or reimbursement; there is not an excessive depen-dency on short-term loans to finance long-term activities;
▪ there are no indications of cessation of financial support from financing en-tities and other creditors;
▪ there are no past or pro-forma financial statements reporting negative cash flows;
▪ the primary economic-financial indices are not negative;
▪ there were no significant operational losses or significant impairments of assets generating cash flows;
▪ there was no lack or discontinuity in the distribution of dividends;
▪ the capacity to pay debts on expiration dates exists;
▪ the capacity to comply with the contractual clauses of loans exists;
JOINT DOCUMENT OF BANK OF ITALY/ISVAP NO. 4 OF 3 MARCH 2010 – EN. 2 OF 6 FEBRUARY 2009
GOING CONCERN
225
2015 Reports and Financial Statements
Managerial indicators
▪ there was no situation involving a capital deficit or net negative working capital;
▪ there were no loans with fixed or upcoming expiration dates without positi-ve prospects of renewal or reimbursement;
▪ there is not an excessive dependency on short-term loans to finance long-term activities;
Other indicators
▪ there were no share capital decreases below legal limits or which were not in compliance with other legal norms;
▪ there were no legal and fiscal disputes which, in the case of a loss, could result in obligations of reimbursement that the companies of the Group are not capable of respecting;
▪ there were no legislative changes or government policies which could result in unfavorable effects to the companies of the Group
The Directors confirm the reasonable expectations that the Group will continue its operations in the near future and that, as a result, the financial statements for the year 2015 have been drafted from the perspective of a going concern. As a result, they have not noticed symptoms within the assets and financial structure and in the operational situation trends which could constitute cause for uncer-tainty in terms of the assumption of a going concern.
It should be noted that the Explanatory Notes report the information requested by the joint document in relation to the process of evaluation of the assets subject to a potential impairment (impairment test) and relative to base assumptions, methodologies and utilized parameters.
In addition, and in relation to disclosure, the Explanatory Notes again report fundamental information on the following elements:
▪ definition of cash generating units (CGU);
▪ allocation of goodwill to each CGU;
▪ illustration of the criterion used to estimate the recoverable value when the latter is based on value in use;
▪ illustration of the criterion used to estimate the recoverable value when the latter is based on the fair value;
IMPAIRMENTOF ASSETS
226
▪ description of the sensitivity analysis of the impairment test results with respect to changes in the underlying assumptions;
▪ commentary on the potential presence of external indicators of impairment and in the absence of write-downs of assets following the impairment pro-cedure
Information on the nature and extent of financial risks to which the institution is exposed is provided below.
ICBPI is a so-called “second level” bank; the issue of credit is not the primary business objective but is instrumental and closely connected to the supply of products/services and specific treasury activities (managed through the gran-ting of operational limits) as well as those of the Securities Services department (mostly managed through the granting of overdraft credit lines within bank accounts).
The methods for measuring credit risk undertaken and the relative control pro-cess have a streamlined and simple character because of the limited amount of credit exposure. Specific organizational norms for assigning loans and periodi-cal reviews of the latter have been adopted: these positions are examined by the Credit Committee and authorized by the Board of Directors.
The market risk to which ICBPI is exposed is extremely low given that the secu-rities portfolio is almost entirely related to the “banking book” (AFS and HTM portfolios), and thereby does not generate market risk. The HFT portfolio relati-ve to the “trading book” only contains the securities relative to Market Making services (for which the countervalue limit and VaR remain very low) and Finan-cial Brokerage (for which the end of day position is closed, without prejudice to positions of the error account).
Even exposure to exchange rate risk is very low given that every operation in foreign currency which generates a position exposed to exchange rate risk is typically “hedged” by executing an offsetting operation on the market; the maintenance of positions subject to exchange rate risk is permitted only within certain limits (always extensively complied with) of maximum total exposure for each currency and VaR.
The core activities of ICBPI typically contribute towards generating liquidity on demand. During the course of the year, the liquidity is primarily used to finance
INFORMATION ON FINANCIALRISKS
CREDIT RISK
MARKET RISK
LIQUIDITY RISK AND CASH FLOW FLUCTUATION RISKS
227
2015 Reports and Financial Statements
the requirements of the Companies of the Group which issue e-money services (CartaSi first of all).
Liquidity needs are satisfied by recourse to the interbank deposits market of repurchase agreements and through the use of part of the securities present within the portfolio by using operations with a duration of less than a month.
The Securities Portfolio is characterized by the presence of government secu-rities and (to a residual extent) bank bonds that are primarily utilized as gua-rantees to hold in order to operate on clearing systems and to proceed with the market collection of repurchase agreements.
Any potential liquidity is utilized within interbank deposits or repurchase agre-ements with a duration of not more than three months. The structure of the cash flows used with different maturities and amounts allows for the limitation of liquidity risk with a balanced return of current positions.
Supervisory reports of the liquidity indicator - Basel 3 LCR, provided on a monthly basis – highlighted a constant compliance with the regulatory limit proposed for normal operations (> 100%).
Interest rate risk, managed in a centralized manner by ICBPI for the entire banking Group, is not negligible due to the temporal mismatch between assets and liabilities. In particular, risk-weighted assets – of which the relevant ones include securities present in the banking book (AFS and HTM portfolio), mostly with fixed rates although with rather close maturities (almost all within five ye-ars) – are more prevalent than weighted liabilities amongst which the greatest incidence pertains to balances of negative bank accounts. During the course of the year, risk monitoring reported a slight increase, primarily due to the in-crease in the duration of the securities portfolio as a result of the replacement of expiring securities with fixed rate securities with a duration between three and five years, and despite constant compliance with thresholds established by internal and regulatory norms.
2016 is expected to show economic and financial trends in line with 2015.
Significant events after 2015 year-end have been reported in the relevant section of the Report on Group’s operations.
It is noted that ICBPI is not subject to management and coordination by another company or body, in accordance with the provisions of articles 2497-sexties and 2497-septies of the Italian Civil Code.
INTEREST RATE RISK
SIGNIFICANT EVENTS AFTER THE END OF THE YEAR
OTHERINFORMATION
228
It is noted that ICBPI did not undertake any research and development activi-ties in 2015.
In the respective sections of its website (www.icbpi.it), the Institute has publi-shed, with the 2015 Financial Statements, “State by state information to the pu-blic”, and “Information for the public from entities in compliance with (EU) Re-gulation 575/2013”, as set forth in Circular 285, and subsequent amendments, published by Bank of Italy on 17 December 2013.
It is noted that there was no treasury share trading activity during the period.
Consequently, the ICBPI portfolio currently has 75,191 treasury shares with a par value of Euro 3.00 each, with a non-distributable reserve of Euro 32,196.
TREASURY SHARES
229
2015 Reports and Financial Statements
Dear Shareholders,
The financial statements which we submit for your review and approval show a net profit of Euro 62,246,319.
We propose the allocation to shareholders of an amount up to that of the conso-lidated net profit as at 31 December 2015 equal to Euro 90.489 million.
We therefore propose the allocation to shareholders of a dividend per share of Euro 6.37 for all shares, totalling 14,185,790, broken down among net profit and available reserve as follows:
- Available reserve € 28,117,163
- profit for the year € 62,246,319
Total € 90,363,482
Milan, 22 March 2016
THE BOARD OF DIRECTORS
ALLOCATION OF NET PROFIT

231
Financial Statementsat 31 december 2015
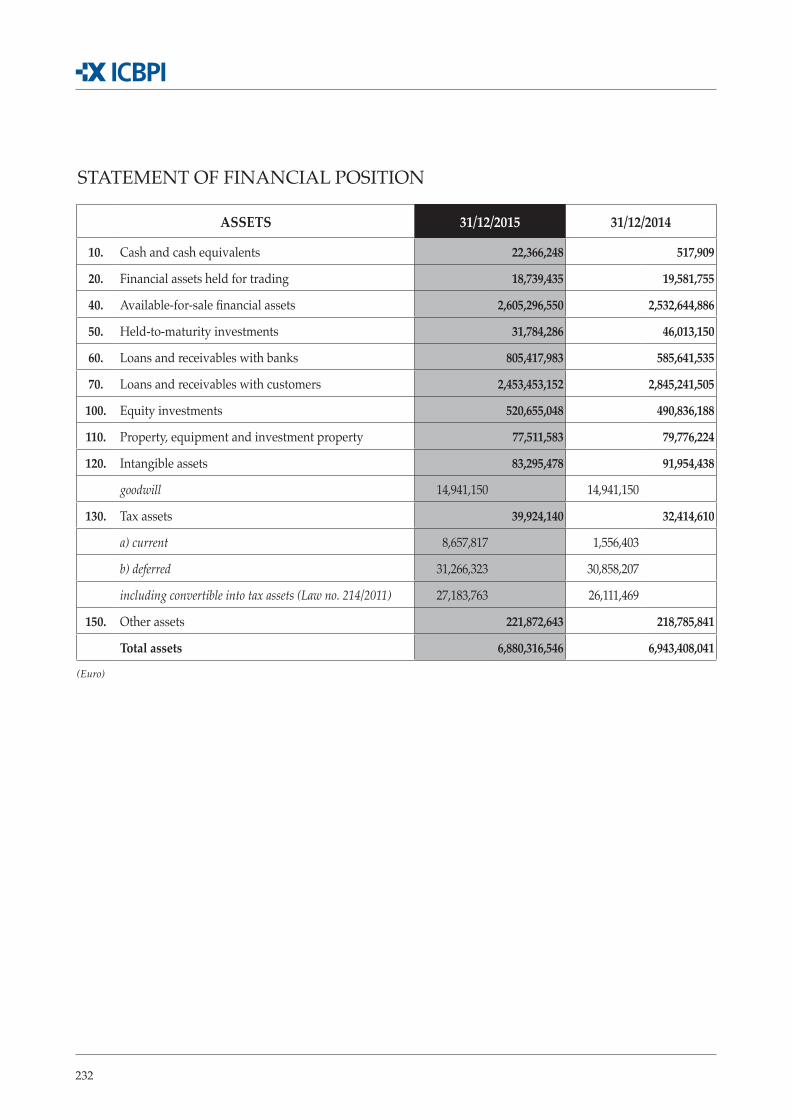
232
STATEMENT OF FINANCIAL POSITION
ASSETS 31/12/2015 31/12/2014
10. Cash and cash equivalents 22,366,248 517,909
20. Financial assets held for trading 18,739,435 19,581,755
40. Available-for-sale financial assets 2,605,296,550 2,532,644,886
50. Held-to-maturity investments 31,784,286 46,013,150
60. Loans and receivables with banks 805,417,983 585,641,535
70. Loans and receivables with customers 2,453,453,152 2,845,241,505
100. Equity investments 520,655,048 490,836,188
110. Property, equipment and investment property 77,511,583 79,776,224
120. Intangible assets 83,295,478 91,954,438
goodwill 14,941,150 14,941,150
130. Tax assets 39,924,140 32,414,610
a) current 8,657,817 1,556,403
b) deferred 31,266,323 30,858,207
including convertible into tax assets (Law no. 214/2011) 27,183,763 26,111,469
150. Other assets 221,872,643 218,785,841
Total assets 6,880,316,546 6,943,408,041
(Euro)
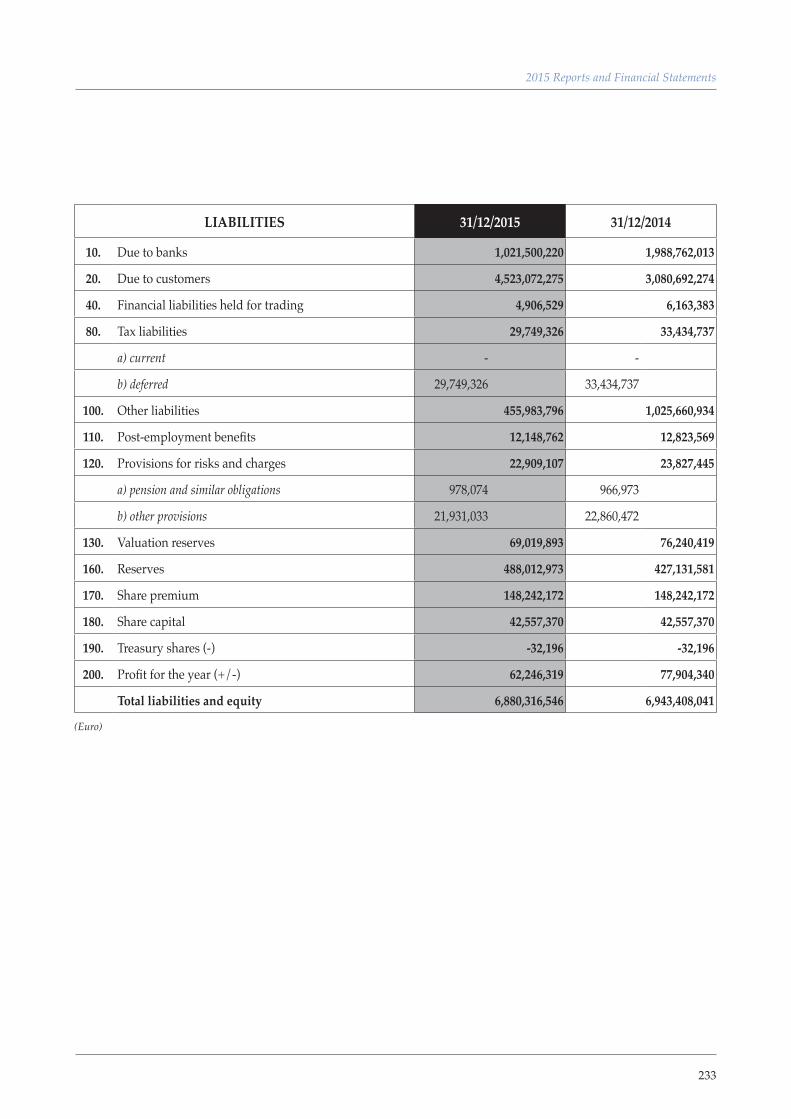
233
2015 Reports and Financial Statements
LIABILITIES 31/12/2015 31/12/2014
10. Due to banks 1,021,500,220 1,988,762,013
20. Due to customers 4,523,072,275 3,080,692,274
40. Financial liabilities held for trading 4,906,529 6,163,383
80. Tax liabilities 29,749,326 33,434,737
a) current - -
b) deferred 29,749,326 33,434,737
100. Other liabilities 455,983,796 1,025,660,934
110. Post-employment benefits 12,148,762 12,823,569
120. Provisions for risks and charges 22,909,107 23,827,445
a) pension and similar obligations 978,074 966,973
b) other provisions 21,931,033 22,860,472
130. Valuation reserves 69,019,893 76,240,419
160. Reserves 488,012,973 427,131,581
170. Share premium 148,242,172 148,242,172
180. Share capital 42,557,370 42,557,370
190. Treasury shares (-) -32,196 -32,196
200. Profit for the year (+/-) 62,246,319 77,904,340
Total liabilities and equity 6,880,316,546 6,943,408,041
(Euro)
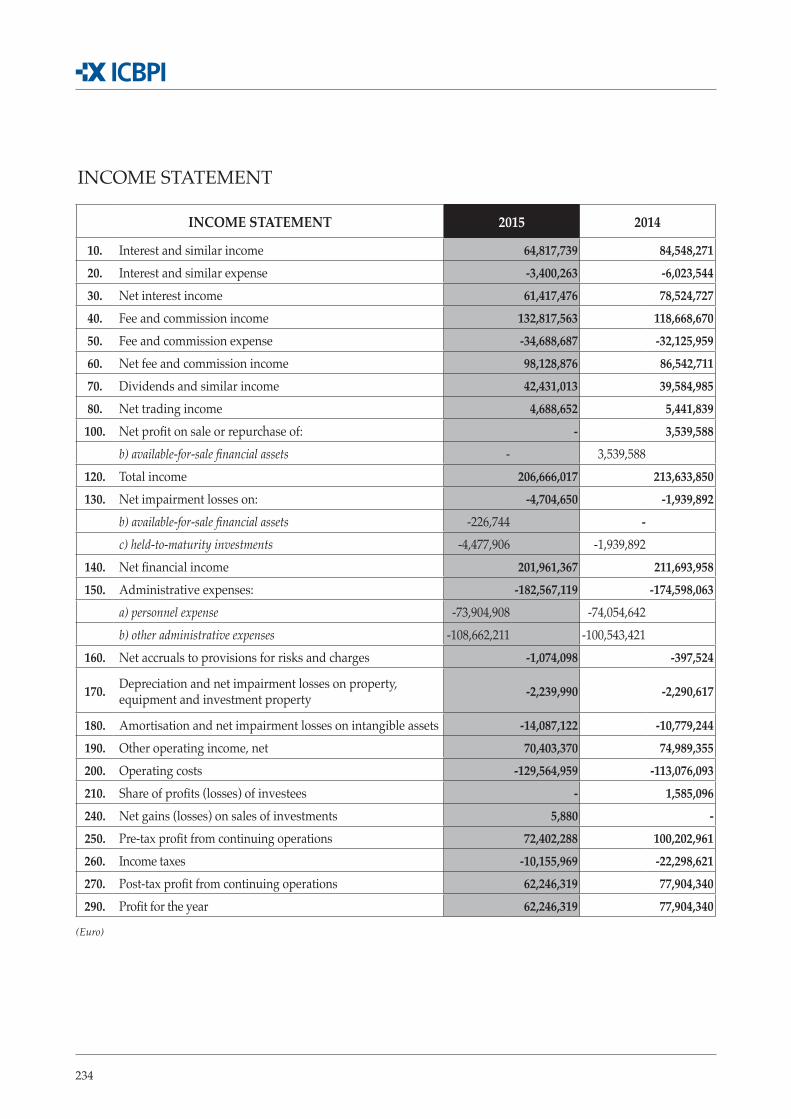
234
INCOME STATEMENT 2015 2014
10. Interest and similar income 64,817,739 84,548,271 20. Interest and similar expense -3,400,263 -6,023,544 30. Net interest income 61,417,476 78,524,727 40. Fee and commission income 132,817,563 118,668,670 50. Fee and commission expense -34,688,687 -32,125,959 60. Net fee and commission income 98,128,876 86,542,711 70. Dividends and similar income 42,431,013 39,584,985 80. Net trading income 4,688,652 5,441,839 100. Net profit on sale or repurchase of: - 3,539,588
b) available-for-sale financial assets - 3,539,588 120. Total income 206,666,017 213,633,850 130. Net impairment losses on: -4,704,650 -1,939,892
b) available-for-sale financial assets -226,744 -c) held-to-maturity investments -4,477,906 -1,939,892
140. Net financial income 201,961,367 211,693,958 150. Administrative expenses: -182,567,119 -174,598,063
a) personnel expense -73,904,908 -74,054,642 b) other administrative expenses -108,662,211 -100,543,421
160. Net accruals to provisions for risks and charges -1,074,098 -397,524
170. Depreciation and net impairment losses on property, equipment and investment property -2,239,990 -2,290,617
180. Amortisation and net impairment losses on intangible assets -14,087,122 -10,779,244 190. Other operating income, net 70,403,370 74,989,355 200. Operating costs -129,564,959 -113,076,093 210. Share of profits (losses) of investees - 1,585,096 240. Net gains (losses) on sales of investments 5,880 - 250. Pre-tax profit from continuing operations 72,402,288 100,202,961 260. Income taxes -10,155,969 -22,298,621 270. Post-tax profit from continuing operations 62,246,319 77,904,340 290. Profit for the year 62,246,319 77,904,340
(Euro)
INCOME STATEMENT
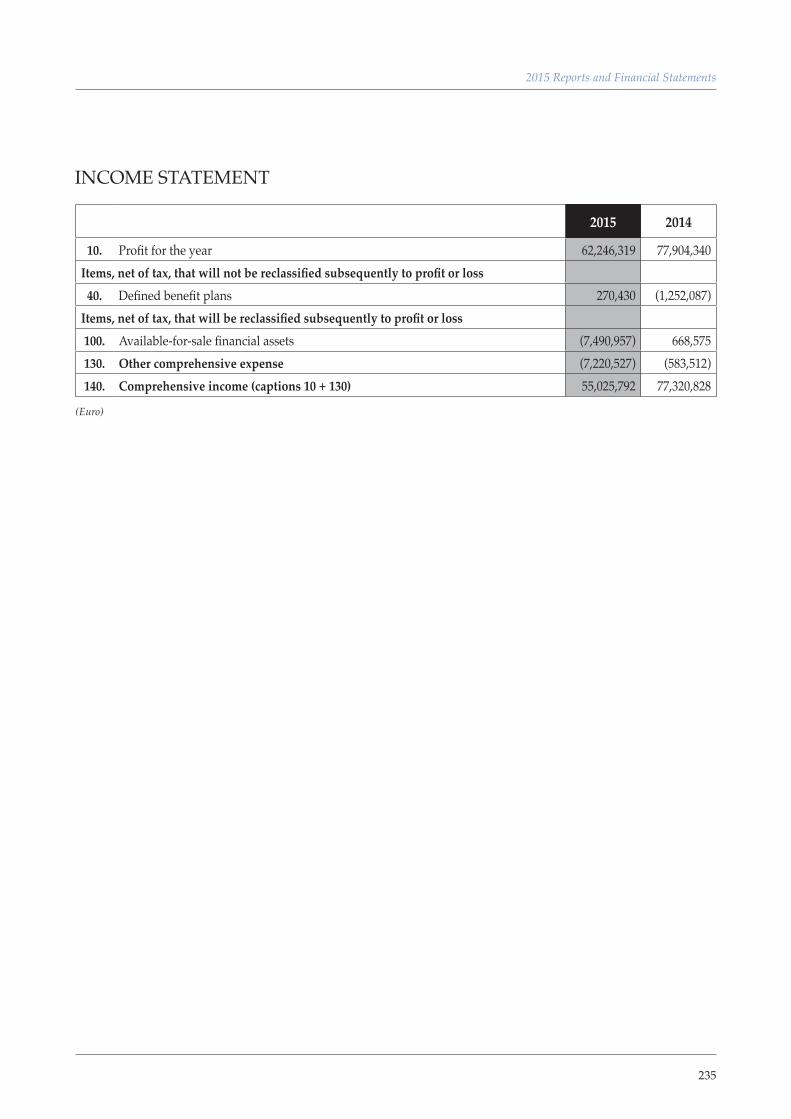
235
2015 Reports and Financial Statements
2015 2014
10. Profit for the year 62,246,319 77,904,340 Items, net of tax, that will not be reclassified subsequently to profit or loss
40. Defined benefit plans 270,430 (1,252,087)Items, net of tax, that will be reclassified subsequently to profit or loss100. Available-for-sale financial assets (7,490,957) 668,575130. Other comprehensive expense (7,220,527) (583,512)140. Comprehensive income (captions 10 + 130) 55,025,792 77,320,828
(Euro)
INCOME STATEMENT
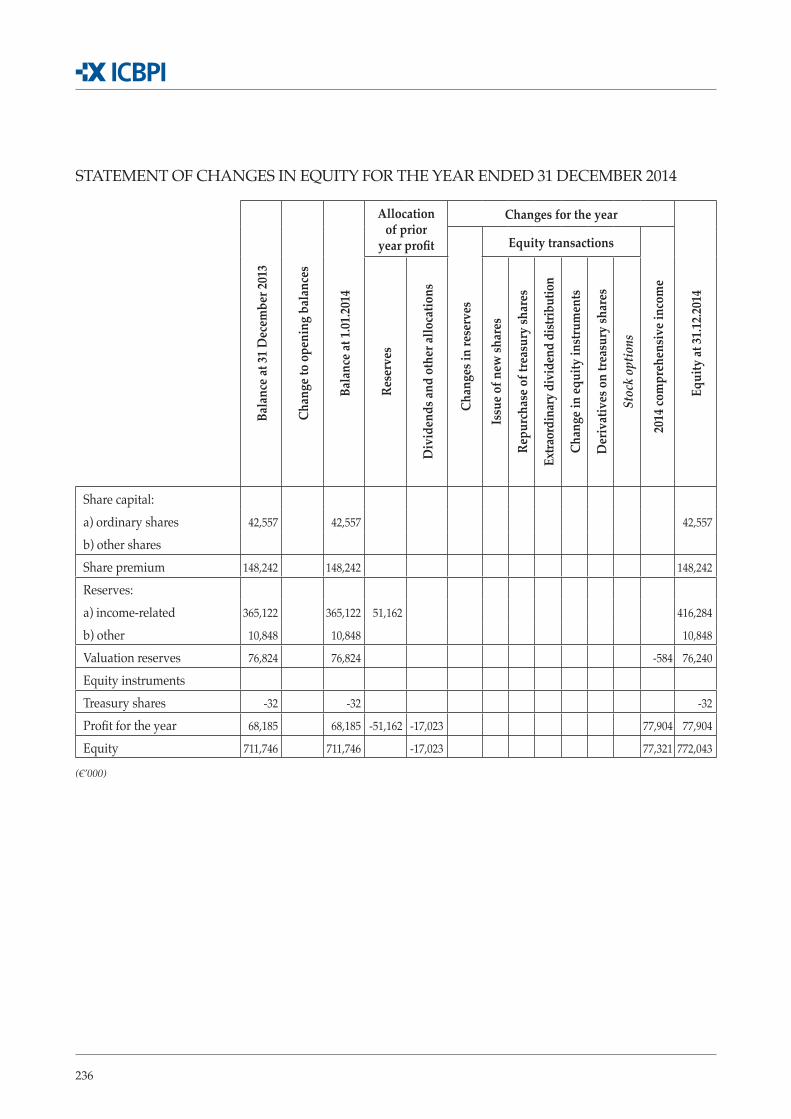
236
Bala
nce a
t 31 D
ecem
ber 2
013
Chan
ge to
ope
ning
bal
ance
s
Bala
nce a
t 1.01
.2014
Allocation of prior
year profit
Changes for the year
Equi
ty at
31.12
.2014
Chan
ges i
n re
serv
es
Equity transactions
2014
com
preh
ensi
ve in
com
e
Rese
rves
Div
iden
ds an
d ot
her a
lloca
tions
Issu
e of n
ew sh
ares
Repu
rcha
se o
f tre
asur
y sh
ares
Extra
ordi
nary
div
iden
d di
strib
utio
n
Chan
ge in
equi
ty in
stru
men
ts
Der
ivat
ives
on
treas
ury
shar
es
Stoc
k op
tions
Share capital:a) ordinary shares 42,557 42,557 42,557
b) other sharesShare premium 148,242 148,242 148,242
Reserves:a) income-related 365,122 365,122 51,162 416,284
b) other 10,848 10,848 10,848
Valuation reserves 76,824 76,824 -584 76,240
Equity instrumentsTreasury shares -32 -32 -32
Profit for the year 68,185 68,185 -51,162 -17,023 77,904 77,904
Equity 711,746 711,746 -17,023 77,321 772,043
(€’000)
STATEMENT OF CHANGES IN EQUITY FOR THE YEAR ENDED 31 DECEMBER 2014
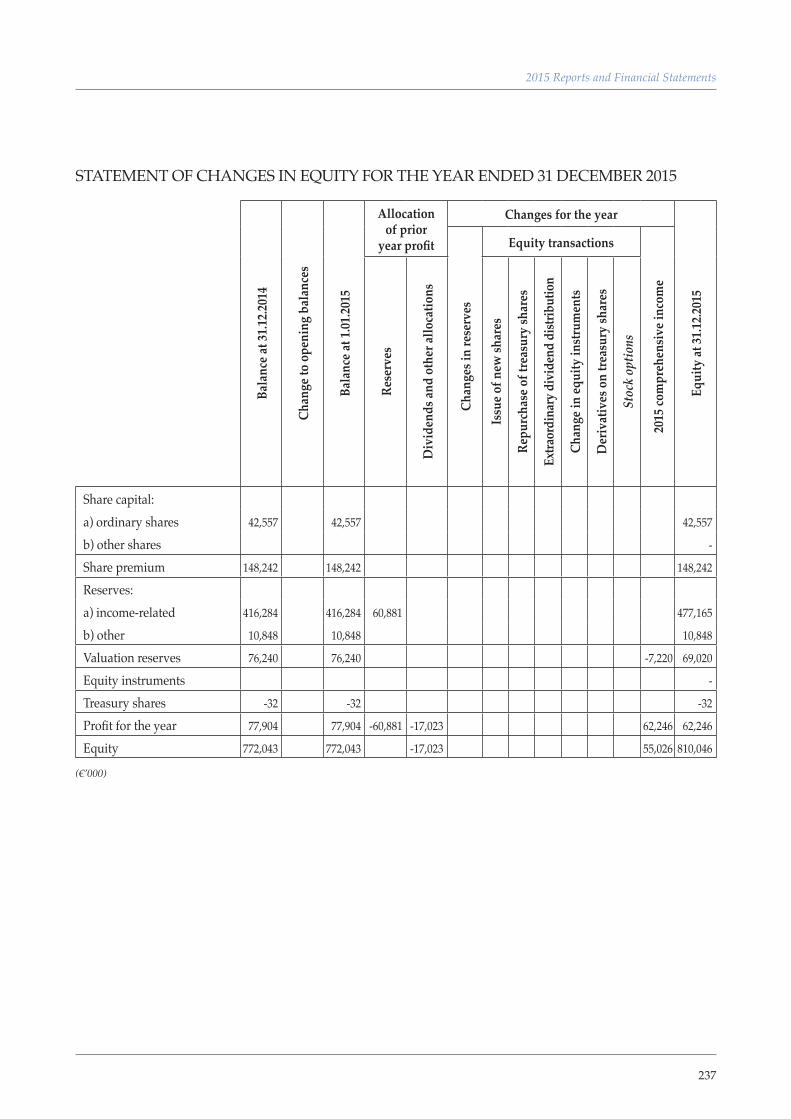
237
2015 Reports and Financial Statements
Bala
nce a
t 31.1
2.201
4
Chan
ge to
ope
ning
bal
ance
s
Bala
nce a
t 1.01
.2015
Allocation of prior
year profit
Changes for the year
Equi
ty at
31.12
.2015
Chan
ges i
n re
serv
es
Equity transactions
2015
com
preh
ensi
ve in
com
e
Rese
rves
Div
iden
ds an
d ot
her a
lloca
tions
Issu
e of n
ew sh
ares
Repu
rcha
se o
f tre
asur
y sh
ares
Extra
ordi
nary
div
iden
d di
strib
utio
n
Chan
ge in
equi
ty in
stru
men
ts
Der
ivat
ives
on
treas
ury
shar
es
Stoc
k op
tions
Share capital:a) ordinary shares 42,557 42,557 42,557
b) other shares -
Share premium 148,242 148,242 148,242
Reserves:a) income-related 416,284 416,284 60,881 477,165
b) other 10,848 10,848 10,848
Valuation reserves 76,240 76,240 -7,220 69,020
Equity instruments -
Treasury shares -32 -32 -32
Profit for the year 77,904 77,904 -60,881 -17,023 62,246 62,246
Equity 772,043 772,043 -17,023 55,026 810,046
(€’000)
STATEMENT OF CHANGES IN EQUITY FOR THE YEAR ENDED 31 DECEMBER 2015
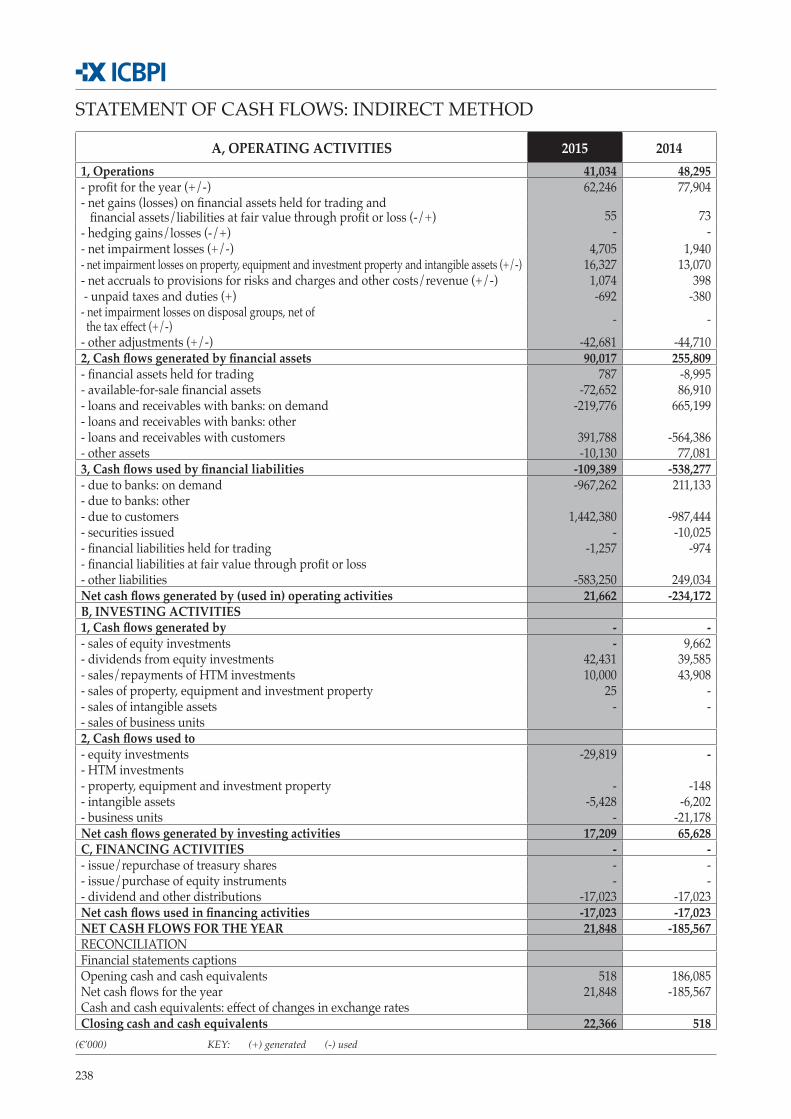
238
STATEMENT OF CASH FLOWS: INDIRECT METHOD
A, OPERATING ACTIVITIES 2015 20141, Operations 41,034 48,295 - profit for the year (+/-) 62,246 77,904 - net gains (losses) on financial assets held for trading and financial assets/liabilities at fair value through profit or loss (-/+) 55 73 - hedging gains/losses (-/+) - - - net impairment losses (+/-) 4,705 1,940 - net impairment losses on property, equipment and investment property and intangible assets (+/-) 16,327 13,070 - net accruals to provisions for risks and charges and other costs/revenue (+/-) 1,074 398 - unpaid taxes and duties (+) -692 -380 - net impairment losses on disposal groups, net of the tax effect (+/-) - - - other adjustments (+/-) -42,681 -44,710 2, Cash flows generated by financial assets 90,017 255,809 - financial assets held for trading 787 -8,995 - available-for-sale financial assets -72,652 86,910 - loans and receivables with banks: on demand -219,776 665,199 - loans and receivables with banks: other- loans and receivables with customers 391,788 -564,386 - other assets -10,130 77,081 3, Cash flows used by financial liabilities -109,389 -538,277 - due to banks: on demand -967,262 211,133 - due to banks: other- due to customers 1,442,380 -987,444 - securities issued - -10,025 - financial liabilities held for trading -1,257 -974 - financial liabilities at fair value through profit or loss- other liabilities -583,250 249,034 Net cash flows generated by (used in) operating activities 21,662 -234,172 B, INVESTING ACTIVITIES1, Cash flows generated by - -- sales of equity investments - 9,662- dividends from equity investments 42,431 39,585- sales/repayments of HTM investments 10,000 43,908 - sales of property, equipment and investment property 25 - - sales of intangible assets - - - sales of business units2, Cash flows used to - equity investments -29,819 - - HTM investments- property, equipment and investment property - -148 - intangible assets -5,428 -6,202 - business units - -21,178 Net cash flows generated by investing activities 17,209 65,628 C, FINANCING ACTIVITIES - - - issue/repurchase of treasury shares - - - issue/purchase of equity instruments - -- dividend and other distributions -17,023 -17,023 Net cash flows used in financing activities -17,023 -17,023 NET CASH FLOWS FOR THE YEAR 21,848 -185,567 RECONCILIATIONFinancial statements captionsOpening cash and cash equivalents 518 186,085 Net cash flows for the year 21,848 -185,567 Cash and cash equivalents: effect of changes in exchange ratesClosing cash and cash equivalents 22,366 518
KEY: (+) generated (-) used(€’000)
239
2015 Reports and Financial Statements
Part A – Accounting policies
Part B – Notes of the statement of financial position
Part C – Notes to the income statement
Part D – Breakdown of comprehensive income
Part E – Risks and related hedging policies
Part F – Equity
Part G – Business combinations
Part H – Related partytransactions
Part I – Share-based payments
Part L – Segment reporting
Notes of the financial statements

241
Part A - ACCOUNTING POLICIES
A.1 - GENERAL PART
Section 1 – Statement of compliance
Pursuant to Regulation (EC) no. 1606 of 19 July 2002, Istituto Centrale delle Banche Popolari Italiane (the bank or ICBPI) has prepared these separate financial statements as at and for the year ended 31 December 2015 in compliance with the International Financial Reporting Standards (IFRS) issued by the International Accounting Standards Board (IASB) and endorsed by the European Commission. They were introduced into Italian law with Legislative decree no. 38/2005.
The bank applied the IFRS enacted at 31 December 2015 and Bank of Italy’s instructions about finan-cial statements issued in its Measure of 22 December 2005, the related Circular no. 262 and subse-quent amendments.
It did not make any departures from the IFRS.
Section 2 – Basis of presentation
The separate financial statements at 31 December 2015 comprise a statement of financial position, an income statement, a statement of comprehensive income, a statement of changes in equity, a state-ment of cash flows and these notes. They are accompanied by a directors’ report which comments on the bank’s performance, its results of operations and financial position.
The bank’s presentation currency is the Euro and the amounts shown in the separate financial state-ments and these notes are in thousands of Euros.
The bank has applied the recognition and measurement criteria established by the IFRS endorsed by the European Commission and the general assumptions in the Framework for the preparation and presentation of financial statements issued by the IASB.
Application of the measures set out in Regulations (EU) 634/2014 and 1361/2014 became mandato-ry on 1 January 2015 enacting:
▪ IFRIC 21, which provides guidance on when to recognise a liability for a levy imposed by a go-vernment other than income taxes (covered by IAS 12). Specifically, it identifies the obligating event for the recognition of a liability;
▪ the Annual improvements to IFRSs 2011-2013 cycle, which introduced some immaterial amendments to IFRS 3, IFRS 13 and IAS 40, designed to clarify certain inconsistencies and/or provide guidance about methods.
Their application did not significantly affect ICBPI’s separate financial statements.
The following table shows the new standards or amendments with the related endorsement regula-
242
tions. Their application is mandatory from 1 January 2016 (for entities whose reporting period is the calendar year) or subsequently.
Endorsement regulation Name Standard/Interpretation Year of
application
28/2015 Annual improvements to IFRS (2010-2012 cycle)
Amendments to the following standards:- IFRS 2 - Share-based payment: changes to the vesting
conditions- IFRS 3 - Business combinations: classification and
measurement of contingent consideration- IFRS 8 - Operating segments: reconciilation of the total of the
reportable segments’ assets to the entity’s assets- IFRS 13 - Fair value measurement: short-term receivables and
payables- IAS 16 - Property, plant and equipment and IAS 38 - Intangible
assets: clarification about how to apply the revaluation method- IAS 24 - Related party disclosures: definition of a related party
2016
2343/2015 Annual improvements to IFRS (2012-2014 cycle)
Amendments to the following standards:- IFRS 5 - Non-current assets held for sale and discontinued
operations: changes to methods of disposal- IFRS 7 - Financial instruments: disclosure: ”Continuing
involvement” in the case of a servicing contract- IAS 19 - Employee benefits: clarifications about the discount
rate- IAS 34 - Interim financial reporting: disclosure
2016
2406/2015 Disclosure initiative Amendments to IAS 1 - Presentation of financial statements 201629/2015 Defined benefit
plans: employee contributions (amendments to IAS 19)
Amendments to IAS 19 - Employee benefits 2016
2231/2015 Clarification of acceptable methods of depreciation and amortisation
Amendments to IAS 16 and IAS 38 2016
2173/2015 Accounting for acquisitions of interests in joint operations
Amendments to IFRS 11 2016
2441/2015 Equity method in separate financial statements
Amendments to IAS 27 - Separate financial statements 2016
In 2014, the IASB issued IFRS 15 - Revenue from contracts with customers as well as making amendments to existing standards. The documents amending certain standards which are yet to be endorsed include IFRS 9 - Financial instruments, issued in July 2014, finalising the new standard for financial instruments, except for macro hedging. This new standard will be applicable from 1 Janua-ry 2018 after its endorsement by the European Commission.
243
2015 Reports and Financial Statements
The next table shows the standards for which amendments were issued, specifying the scope of or object for such amendments.
Standard Name Publication date
IFRS 9 Financial instruments 24/07/14IFRS 14 Regulatory deferral accounts 30/01/14IFRS 15 Revenue from contracts with customers (including the amendment
published on 11 September 2015 about the date of application of IFRS 15)28/05/14
IFRS 16 Leases 13/01/16Amendments to IFRS 10, IFRS 12 and IAS 28
Investment entities - Applying the consolidation exception 18/12/14
Amendments to IFRS 10 and IAS 28
Sale or contribution of assets between an investor and its associate or joint venture
11/09/14
As none of them have been endorsed by the European Commission, they did not affect the bank’s 2015 separate financial statements.
The bank applies the measurement criteria assuming that it will continue as a going concern and in accordance with the principles of accruals, materiality and significance of the financial data and the principle of substance over form.
The separate financial statements and the notes present corresponding prior year figures.
The directors’ report and these notes include all the information required by the IFRS, the law and Bank of Italy, as well as additional disclosures which are not mandatory but are deemed useful to give a true and fair view of the bank’s separate financial statements.
Basis of presentation of the separate financial statementsStatement of financial position, income statement and statement of comprehensive incomeThey comprise captions, subcaptions and additional information. Revenue is shown without a plus sign while costs are shown with a minus sign in the income statement.
Statement of changes in equity This statement shows changes in equity during the year split between share capital, equity-related reserves, income-related reserves, valuation reserves and the profit (loss) for the year. Treasury sha-res are offset against equity. The bank has not issued equity instruments other than ordinary shares.
Statement of cash flowsThe statement of cash flows for the year and the previous year has been prepared using the indirect method, whereby cash flows from operations are the profit for the year adjusted by the effects of non-monetary transactions.
244
Cash flows are split between those from operating, investing and financing activities.
Cash flows generated during the reporting period are indicated without a plus sign while those used during the reporting period are shown with a minus sign.
Basis of presentation of the notesThese notes include the information required by Bank of Italy’s Circular no. 262/2005 and the addi-tional information required by the IFRS.
The accounting policies described below have been adopted to disclose all the information in the separate financial statements.
Section 3 - Events after the reporting period
No events took place after the reporting date that would have had a significant effect on the bank’s financial position, results of operations or cash flows or that would have required adjustments to the financial statements captions.
Section 4 - Other aspects
There is no other information that needs to be disclosed, including with respect to the Bank of Italy/Consob/IVASS document no. 6 of 8 March 2013.
A.2 - KEY FINANCIAL STATEMENTS CAPTIONS AT 31 DECEMBER 2015
1 - Financial assets held for trading
Classification:A financial asset is classified as held for trading if it is:
▪ acquired principally for the purpose of selling it in the near term;
▪ part of a portfolio of identified financial instruments that are managed together and for which there is evidence of a recent actual pattern of short-term profit-taking;
▪ a derivative (except for a derivative that is an effective hedging instrument).
Derivatives are recognised under assets when they have a positive fair value and under liabilities when they have a negative fair value.
RecognitionDebt and equity instruments are recognised at their settlement date while derivatives are recognised at their trading date.
Financial assets held for trading are initially recognised at fair value, which is usually the transaction price, net of any directly attributable transaction costs.
245
2015 Reports and Financial Statements
Measurement After initial recognition, financial assets held for trading are measured at fair value. Any resulting fair value gains or losses are recognised in caption 80 “Trading income (expense)” of the income sta-tement. Interest accrued on these assets is recognised in caption 10 of the income statement “Interest and similar income”, although interest and/or other income and expense on trading derivatives are recognised in caption 80 “Trading income (expense)” of the income statement. Section 17 - Other information provides information on the calculation of fair value of listed financial instruments. Equity instruments and derivatives hedging equity instruments are maintained at cost when it is not possible to calculate their fair value reliably.
DerecognitionFinancial assets or parts of financial assets are decognised when the contractual rights to cash flows expire or are transferred, transferring substantially all the related risks and rewards.
2 - Available-for-sale financial assets
ClassificationThis category includes non-derivative financial assets that are not classified as loans and receivables, financial assets held for trading, held-to-maturity investments or financial assets at fair value throu-gh profit or loss.
RecognitionThey are initially recognised at the settlement date and measured at fair value, which includes the directly related transaction costs.
Measurement AFS financial assets are subsequently measured at fair value with recognition of amortised cost in profit or loss and the fair value gains or losses in a specific equity reserve until the asset is dereco-gnised or an impairment loss is recognised. Gains or losses recognised in equity are reclassified to profit or loss when the asset is sold.
Realised gains or losses are recognised in caption 100 “Net profit (loss) on sale or repurchase” of the income statement.
Fair value is calculated using the same criteria applied to financial assets held for trading.
Equity instruments included in this category and derivatives hedging equity instruments are main-tained at cost when it is not possible to calculate their fair value reliably.
The bank tests its assets for impairment at each reporting date. When there is a significant or pro-longed decline in fair value, ICBPI recognises it in profit or loss as the difference between the asset’s carrying amount (acquisition cost net of impairment losses already recognised in profit or loss) and
246
fair value. Fair value losses are significant when they exceed 20% of the cost and prolonged if they have existed for over nine months.
If the fair value of a debt instrument increases in a subsequent period and this increase is objectively due to an event that took place in a period after that in which the impairment loss was recognised in profit or loss, the impairment loss is reversed and the related amount is recognised in the same income statement caption. The reversal may not generate a carrying amount higher than that which would have been obtained by measuring that asset at amortised cost had the loss not been recogni-sed. Impairment losses on shares, recognised in profit or loss, cannot be reversed through profit or loss but only directly through equity.
DerecognitionFinancial assets or parts of financial assets are decognised when the contractual rights to cash flows expire or are transferred, transferring substantially all the related risks and rewards.
3. Held-to-maturity investments
ClassificationThis category includes debt instruments with fixed or determinable payments and fixed maturities that the bank has the ability and intention to hold to maturity. If it is no longer appropriate to main-tain an asset as classified as held to maturity following a change in the bank’s intentions or ability, it is reclassified to “AFS financial assets”.
RecognitionHTM investments are initially recognised at cost, being the fair value of the amount traded, inclu-ding any directly related costs and income.
Measurement After initial recognition, HTM investments are measured at amortised cost using the effective in-terest method. Fair value gains or losses are recognised in profit or loss when the investments are derecognised.
At each reporting date, the bank tests the HTM investments for impairment. The impairment loss, if any, is the difference between the asset’s carrying amount and the present value of estimated future cash flows, discounted using the original effective interest rate.
Impairment losses are recognised in profit or loss. When the reasons for impairment are no longer valid as a result of an event that took place subsequent to recognition of the impairment loss, it is reversed through profit or loss.
DerecognitionFinancial assets or parts of financial assets are decognised when the contractual rights to cash flows expire or are transferred, transferring substantially all the related risks and rewards.
247
2015 Reports and Financial Statements
4 - Loans and receivables
ClassificationLoans and receivables are non-derivative financial assets with fixed or determinable payments that are not quoted in an active market.
This category includes trade receivables and reverse repurchase agreements.
RecognitionLoans and receivables are initially recognised at the agreement signing date, which is usually the disbursement date, based on the financial instrument’s fair value, which usually equals the amount disbursed including transaction costs or revenue attributable to the individual loan or receivable and determinable from the transaction start date, even when they are disbursed subsequently. The initially recognised amount does not include costs that, despite having the above characteristics, are to be reimbursed by the counterparty or that are administrative costs.
Measurement After initial recognition, loans and receivables are measured at amortised cost using the effective interest method.
Interest is recognised in caption 10 “Interest and similar income” of the income statement.
Loans and receivables are tested for impairment at each reporting date to determine whether there is objective evidence of impairment due to events subsequent to initial recognition. Indication of impairment is based on one or more events that took place after initial recognition that have an im-pact on the estimate of future cash flows of a financial asset or a group of financial assets that can be measured reliably.
Loans and receivables tested individually for impairment include positions classified as non-perfor-ming, doubtful or restructured as per the Bank of Italy regulations. Assets not tested individually or for which impairment has not been identified are tested collectively.
The individual impairment test measures the difference between the carrying amount and present value of estimated future cash flows discounted at the position’s original effective interest rate.
Estimated cash flows include guarantees securing the debtor’s exposure and their probable enforce-ment. When enforcement of the guarantees is unlikely, the bank uses their present value, while if it is probable that they will be enforced, the bank considers their realisable value net of the costs to be incurred for enforcement.
Impairment losses are recognised in caption 130 “Net impairment losses” in the income statement.
Loans and receivables are reinstated to their original value in subsequent periods when the reasons for impairment are no longer valid, as long as this assessment is objectively linked to an event that took place after recognition of the impairment loss. Reversals of impairment losses are recognised in the income statement and may not exceed the position’s amortised cost had the impairment loss not been recognised.
248
Loans and receivables that are not tested individually for impairment are tested collectively. They are grouped into categories based on their risk and the related impairment loss percentages are esti-mated considering historical data, based on elements observable at their measurement date, so as to estimate each category’s unrealised loss. The impairment test considers the counterparty’s country risk. Collective impairment losses are recognised in profit or loss. DerecognitionFinancial assets or parts of financial assets are decognised when the contractual rights to cash flows expire or are transferred, transferring substantially all the related risks and rewards.
7 - Equity investments
Investments in subsidiaries and associates are recognised and measured at cost, which equals the fair value of the consideration paid, less any subsequent impairment losses.
Investments in entities other than subsidiaries, associates and joint ventures are classified as AFS financial assets and treated accordingly.
The bank did not have to perform special judgements or make significant assumptions in order to establish the existence of control over subsidiaries and significant influence over associates.
8 - Property, equipment and investment property
ClassificationThis caption includes land, owner-occupied property, investment property, furniture and fittings and all equipment. It also comprises assets under finance lease.
RecognitionAssets acquired on the market are recognised as assets when the main risks and rewards of title are transferred. Initial recognition is at cost, which includes all directly related charges.
Land is recognised separately, including when it is purchased together with the building, using the component approach. It is separated from the building based on third party appraisals.
The cost of extraordinary maintenance that increases the item’s future economic benefits is capitali-sed while other ordinary maintenance costs are expensed.
Measurement Property, equipment and investment property are subsequently measured at cost adjusted by accu-mulated depreciation and any impairment losses/reversals of impairment losses.
The depreciable value of property and equipment equals their cost as the residual value after depre-ciation is not deemed significant. Depreciation is charged systematically on a straight-line basis over
249
2015 Reports and Financial Statements
the assets’ estimated useful life to reflect their technical-economic life and residual use.
The useful life of the main categories of property, equipment and investment property is as follows:
▪ furniture and fittings: 8 years;
▪ owner-occupied buildings: 33 years;
▪ investment property: 33 years.
Land is not depreciated as it has an indefinite life nor are works of art as their useful lives cannot be estimated and their value usually increases over time.
The bank tests the assets for impairment at every reporting date. If there is indication of impairment, it compares the asset’s carrying amount to its recoverable amount being the higher of fair value and value in use.
DerecognitionProperty, equipment and investment property are derecognised when sold or when no future econo-mic benefits are expected from their continued use or sale.
9 - Intangible assets
ClassificationAn intangible asset is an identifiable non-monetary asset without physical substance able to genera-te future economic benefits controllable by the entity.
RecognitionIntangible assets are recognised at cost when the principal risks and rewards are transferred, only when it is probable that the related future economic benefits will materialise and cost can be measu-red reliably. Otherwise, cost is expensed in the period in which it is incurred.
Measurement All intangible assets other than goodwill are considered to have finite useful lives and are amortised in line with their cost and related useful lives.
The useful life of the bank’s intangible assets is three years, except for those assets related to the depositary services, which have an estimated useful life of ten years depending on the contractual terms.
Their residual value is taken to be nil.The bank tests the assets for impairment at every reporting date. If there is indication of impairment, it compares the asset’s carrying amount to its recoverable amount being the higher of fair value and value in use.
250
DerecognitionThe bank derecognises intangible assets when they are sold or when it does not expect to receive future economic benefits from their continued use or sale.
GoodwillGoodwill arising on business combinations is the difference between the consideration paid, inclu-ding related costs, and fair value of the assets acquired and the liabilities assumed at the transaction date. If the difference is positive, it is recognised as an asset (goodwill), being a payment by the ac-quiree for future economic benefits to be generated by assets that cannot be identified individually or recognised separately. If the difference is negative, it is recognised directly in profit or loss (excess cost).
Goodwill is recognised at cost, net of accumulated impairment losses. It is not amortised.
It is tested annually for impairment even if there are no indicators of impairment.
Impairment losses on goodwill are recognised in caption 230 “Impairment losses on goodwill” of the income statement. They are not reversed in subsequent periods.
11 - Current and deferred taxes
The bank estimates current and deferred taxes, considering the domestic tax consolidation scheme.
Current taxes, calculated considering the domestic tax consolidation scheme, not yet paid in whole or in part at the reporting date are recognised as tax liabilities in the statement of financial position. If payments on account in the current or previous reporting period exceed the related tax expense, the difference is recognised as a tax asset in caption 130 “Tax assets - a) current”.
Current and deferred taxes are recognised in caption 260 “Income taxes” of the income statement unless they relate to gains or losses on AFS financial assets and actuarial gains and losses, which are recognised directly in the valuation reserves, net of tax.
Deferred tax assets and liabilities are recognised in the statement of financial position without offset-ting as “Tax assets” and “Tax liabilities”, respectively.
The income tax expense is calculated on the basis of an estimate of the current and deferred tax expense and income. Specifically, deferred tax assets and liabilities are calculated on the temporary differences between the carrying amounts of assets and liabilities and their tax bases. The bank re-cognises deferred tax assets (in caption 130.b) for deductible temporary differences and carryfoward tax losses that will reverse in subsequent periods when it is probable that it will make a taxable profit in the same period, according to its business plans, against which it can offset the deferred tax asset.
Deferred tax liabilities are calculated on all taxable temporary differences, excluding only reserves taxed upon distribution as, given the amount of the taxed available reserves, the bank does not ex-pect to undertake transactions that would require their taxation.
251
2015 Reports and Financial Statements
Deferred tax assets and liabilities are calculated using the tax rates expected to be enacted in the period in which the deferred tax asset will be recovered or the deferred tax liability extinguished, based on the ruling tax laws.
They are remeasured regularly to reflect any changes in the tax laws or rates or any subjective situa-tions in which the bank may find itself.
12 - Provisions for risks and charges
Pension and similar provisions Internal pension plans are considered to be defined benefit plans. The bank calculates the related liabilities and current service cost using actuarial assumptions and the projected unit credit method. This method projects future payments using historical figures and the demographic curve and di-scounts these flows using a market interest rate. The discount rate is the average market rate at the measurement date. The present value of the bank’s liability at the reporting date is also adjusted by the fair value of any plan assets.
Other provisionsThe bank recognises provisions for risks and charges when:
▪ it has a present legal or constructive obligation as a result of a past event;
▪ it is probable that an outflow of resources will be necessary to settle the obligation;
and
▪ the liability can be reliably estimated.
When the effect of the time value of money is material, the provision is discounted using the cur-rent market rates at the closing date. Accruals and increases due to the time factor are recognised in profit or loss. Where discounting is used, the increase in the provision due to the passage of time is recognised as interest expense.
Provisions and contingent liabilities are reviewed at the end of each reporting period and adjusted to reflect the current best estimate. If it is no longer probable that an outflow of resources embodying economic benefits will be required to settle the obligation, the provision is reversed.
252
13 - Liabilities and Securities issued
ClassificationAn issued financial instrument is classified as a liability when, based on the substance of the con-tractual agreement, the bank has a contractual obligation to deliver cash or another financial asset to another party.
Due to banks and customers include funding obtained on the interbank market and from customers, including through repurchase agreements and the placing of bonds and certificates of deposit.
They also include finance lease liabilities.
RecognitionAmounts due to banks are recognised at the contract agreement date, which is usually when the bank receives the funds and issues the debt instruments.
Financial liabilities are initially recognised at fair value, which is normally the amount received or the issue price, plus the directly related costs/income. Internal administrative costs are excluded.
Measurement After initial recognition, financial liabilities are measured at amortised cost using the effective inte-rest method.
Interest is recognised in caption 20 “Interest and similar expense” of the income statement.
DerecognitionFinancial liabilities, or parts thereof, are derecognised when they are extinguished, i.e., when the obligation is complied with, cancelled or has expired.
14 - Financial liabilities held for trading
This caption includes derivatives held for trading with negative fair values.
All financial liabilities held for trading are measured at fair value and the fair value gains or losses are recognised in profit or loss.
The measurement and recognition criteria are identical to those used for financial assets held for trading.
16 - Foreign currency transactions
Initial recognitionUpon initial recognition, a foreign currency transaction is translated into the functional currency using the spot exchange rate ruling at the transaction date.
253
2015 Reports and Financial Statements
Subsequent measurementForeign currency assets and liabilities are retranslated into Euros at each subsequent reporting date using the following criteria:
▪ monetary items are retranslated using the closing rates;
▪ non-monetary items measured at historical cost are retranslated using the transaction-date exchange rates;
▪ non-monetary items measured at fair value are retranslated using the closing rates.
Exchange rate differences arising from the settlement of monetary items are recognised in profit or loss in the period in which they arise; exchange rate differences on non-monetary items are recogni-sed in equity or in profit or loss in line with the method used to recognise the gains or losses that include this component.
Foreign currency costs and revenue are translated at the exchange rate ruling on their recognition date or, if they have not been realised, at the closing spot rate.
17 - Other information
Post-employment benefits The Italian post-employment benefits (TFR) are a form of deferred remuneration paid to employees when they leave the bank. They accrue over the employment term and are recognised under per-sonnel expense.
Following the Italian supplementary pension reform introduced with Legislative decree no. 252 of 5 December 2005, benefits accruing from 1 January 2007 are calculated without using an actuarial ap-proach as the bank’s liability is limited to its contribution defined by the Italian Civil Code (defined contribution plan as per IAS 19).
Post-employment benefits vested up to 31 December 2006 continue to be considered defined benefit plans under IAS 19. Accordingly, the related obligation is subject to actuarial valuation using the projected unit credit method. This method projects future payments using historical statistics and the demographic curve and discounts these flows using a market interest rate.
The rate used to discount the post-employment benefit obligation (both funded and unfunded) vari-es from country to country. It is determined by reference to market yields at the end of the reporting period on high quality corporate bonds. The term of the corporate bonds is consistent with the esti-mated term of the post-employment benefit obligations.
Specifically, the amount recognised as a liability in caption 120.a) equals the net balance of the obli-gation’s present value at the reporting date, the sum of any actuarial gains or losses, less any pension costs for past service not yet recognised and the current value of plan assets, if any, at the reporting date that will be used to directly extinguish the obligation.
Starting from the 2013 separate financial statements, the bank has recognised actuarial gains and
254
losses in the statement of comprehensive income as required by the revised IAS 19.
Before that, they had been recognised immediately in profit or loss.
Interest accrued on the net liability continues to be recognised.
Treasury sharesRepurchased treasury shares are directly offset against equity. No gain or loss on the repurchase, sale, issue or extinguishment of these shares can be recognised in profit or loss. Any amounts paid or received for these shares are recognised directly in equity.
The bank has set up the specific reserve as per article 2357-ter of the Italian Civil Code.
Measurement of the fair value of financial instruments The fair value of financial instruments is measured using the financial market prices in the case of instruments listed on active markets or by using internal measurement models for other financial instruments.
More information is available in section A.4 Fair value disclosure.
The fair value of financial assets and liabilities carried at cost or amortised cost is disclosed in the notes and is determined as follows:
▪ for non-current financial assets and liabilities, the discounted cash flow method is mainly used;
▪ for on demand assets and liabilities, with a short term or undetermined maturity, the carrying amount net of a collective/individual impairment loss is deemed to reasonably reflect fair value as it reflects changes in interest rates and the issuer credit risk;
▪ for floating-rate and current fixed-rate securities issued, the carrying amount is deemed to ade-quately reflect fair value, for the reasons set out above;
▪ for non-current fixed-rate liabilities, the discounted cash flow method, without considering changes in its credit spread, given its immateriality, is used.
Measurement of fair value of non-financial assetsThe fair value of investment property is only calculated for disclosure in the notes. The bank uses third party appraisals that are usually based on criteria similar to the direct synthetic estimate me-thod, considering transactions at current prices in an active market for similar real estate assets in the same location and condition and that have the same lease and other contractual terms.
Determination of impairment losses on goodwillImpairment losses on goodwill are determined using the discounted cash flow method.
Guarantees issuedGuarantees issued, credit derivatives and similar instruments as per IAS 39 and subsequent impai-rment losses are recognised in caption 100 “Other liabilities”.
255
2015 Reports and Financial Statements
Income statement Interest income and expenseInterest income and expense and related income and expense relate to cash and cash equivalents, non-derivative financial assets and liabilities held for trading, AFS financial assets, HTM investments, loans and receivables, liabilities and securities issued.
Interest income and expense are recognised in profit or loss on all instruments measured at amorti-sed cost, using the effective interest method.
Fee and commission income and expenseThey are recognised on an accruals basis.
Specifically, trading commissions on securities are recognised when the service is rendered.
Fees and commissions included in amortised cost to calculate the effective interest rate are excluded as they are recognised under interest.
DividendsDividends are recognised in profit or loss when their distribution is approved.
Other income and costsThey are recognised on an accruals basis.
Utilisation of estimates and assumptions in the preparation of the separate financial statements
The separate financial statements captions are measured using the policies set out above.
Application of these policies sometimes involves the adoption of estimates and assumptions that may have a significant effect on the carrying amount of assets and liabilities, income and expenses.
The use of reasonable estimates is an essential part of the preparation of financial statements but must not affect their reliability. The financial statements captions affected to a greater extent by the use of estimates and assumptions are:
▪ measurement of financial assets not listed on active markets;
▪ measurement of intangible assets and equity investments;
▪ quantification of accruals to provisions for risks and charges;
▪ quantification of deferred liabilities.
A change in an accounting estimate may occur due to changes in the circumstances on which the estimate was based or as a result of new information or more experience. The effect of a change in an accounting estimate is recognised prospectively by including it in profit or loss of the period of the change and, if the change affects future periods, also in future periods.
No significant changes to the accounting estimates were made in 2015.

256
A.3. Transfers between portfolios of financial assets
A.3.1 Reclassified financial assets: carrying amount, fair value and effects on comprehensive income
Type of financial
instrumentOriginal portfolio
Portfolio to which transfer
is made
Carrying amount at 31/12/2015
Fair value at
31/12/2015
Income or expen-se if transfer had not taken place
Income or expense for the year
(before taxes) (before taxes)Fair value gain/loss Other Fair value
gain/loss Other
(1) (2) (3) (4) (5) (6) (7) (8) (9)
1. Debt instruments
Financial assets held for trading
Available-for-sale financial assets
168,340 168,340 1,799 2,589
A.3.2. Reclassified financial assets: effects on comprehensive income before transfer
No transfers among portfolios took place during the year.
A.3.3. Transfers of financial assets held for trading
In 2011, as the rare circumstances provided for by IAS 39 arose, the bank reclassified Italian treasury credit certificates from the HFT portfolio to the AFS portfolio.
These rare circumstances related to the international sovereign debt crisis of June 2011 and the con-tinuously widening spread of the German bund.
A.4 Fair value disclosure
The IFRS require that financial products classified in the HFT or AFS portfolios be measured at fair value.
Fair value is the price that would be received to sell an asset or paid to transfer a liability in an orderly transaction between market participants on the principal market (i.e., not a forced liquida-tion or distress sale) at the measurement date. Fair value is a market-based measurement, not an entity-specific measurement. An entity shall measure the fair value of an asset or a liability using the assumptions that market participants would use when pricing the asset or liability, assuming that market participants act in their economic best interest.
IFRS 13 establishes a hierarchy for measuring fair value of financial instruments depending on the entity’s use of discretion, prioritising the use of relevant observable inputs that reflect the as-sumptions that market participants would use to price assets/liabilities.
257
2015 Reports and Financial Statements
The fair value hierarchy has three input levels:
▪ Level 1: quoted prices (unadjusted) in active markets for identical assets or liabilities that the entity can access at the measurement date;
▪ Level 2: inputs other than quoted prices included within Level 1 that are observable for the asset or liability, either directly (prices) or indirectly (derived from prices);
▪ Level 3: unobservable inputs for the asset or liability.
The decision about which level to use is not optional as they are to be applied in hierarchical order. Highest priority is given to official prices available on active markets for the assets or liabilities to be measured (level 1) or assets and liabilities measured using techniques based on parameters observa-ble on the market other than prices (level 2) and the lowest priority is given to assets and liabilities whose fair value is calculated using techniques that are based on unobservable inputs and which are, therefore, more discretional (level 3).
The bank uses the reporting date market price for instruments listed on active markets (level 1).
The fair value of financial instruments not listed on active markets is measured using techniques mainly based on discounting cash flows. These techniques consider all the factors that the market uses to set the price which are mainly inputs observable on the market (level 2). Specifically:
▪ bonds are measured by discounting the expected future cash flows of the contractual plan, adju-sted for the issuer credit risk.
▪ derivatives, consisting of OISs, and options are measured using the market models that mainly use market rates as their input, adjusted to reflect counterparty risk. This risk includes changes in the counterparty’s credit standing and in the issuer’s credit standing (own credit risk), if ma-terial;
▪ a fair value hierarchy has been developed for shares and an application order for the measure-ment methods which considers any significant transactions involving the share in a sufficiently short time period compared to the measurement period, comparable transactions carried out by companies operating in the same sector and the application of financial, income and equity analytical valuation methods.
The valuation model adopted for a financial instrument is the same over time, adjusted only in the case of significant changes in market conditions or subjective changes affecting the issuer.
The bank did not have at the reporting date, nor did it trade in during the year, level 3 financial in-struments, except for immaterial amounts.
Qualitative disclosure
A.4.1 Levels 2 and 3: valuation techniques and inputs used
As noted above, the bank does not have nor did it trade in level 3 financial instruments, except for immaterial amounts.
258
It measured level 2 financial instruments (mainly IRSs, OISs and interest rate and currency options) using market interest rates and volatility. Given the bank’s limited operations in the unlisted deriva-tives segment, its transactions with Italian institutional counterparties and its guarantees mitigating risk, the adjustments made to the level 2 instruments to reflect counterparty risk were immaterial.
A.4.2 Measurement processes and sensitivity
As noted above, the bank does not have level 3 financial instruments, except for immaterial amounts.
A.4.3 Fair value hierarchy
Transfers between the fair value levels are made to reflect changes in the instruments or its market.
Transfers from level 1 to level 2 are made when there is an inadequate number of contributors or a limited number of investors that hold the outstanding float.
Conversely, instruments that are illiquid when issued and have a small number of trades classified in level 2 are transferred to level 1 when an active market exists.
A.4.4 Other disclosures
The bank did not avail of the exception under IFRS 13.48 to measure the net positions of groups of assets and liabilities managed on a net basis.
The bank does not hold assets, the current use of which differs from their highest and best use.
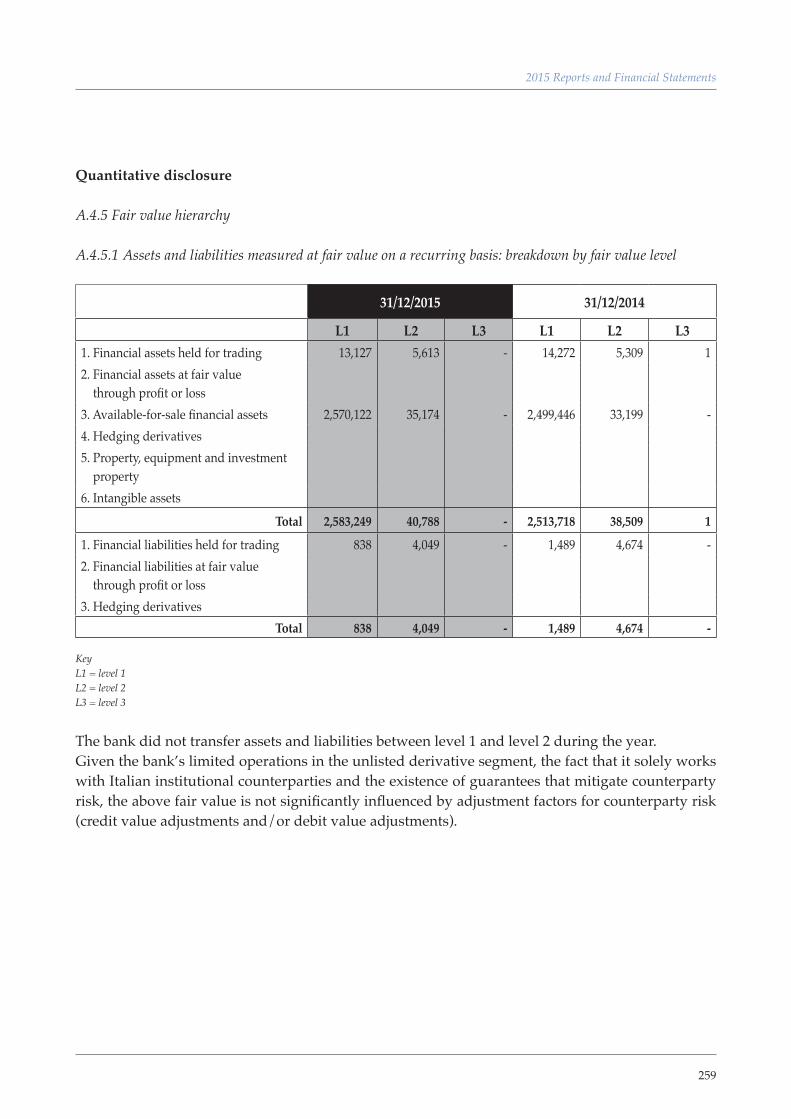
259
2015 Reports and Financial Statements
Quantitative disclosure
A.4.5 Fair value hierarchy
A.4.5.1 Assets and liabilities measured at fair value on a recurring basis: breakdown by fair value level
31/12/2015 31/12/2014
L1 L2 L3 L1 L2 L31. Financial assets held for trading 13,127 5,613 - 14,272 5,309 1 2. Financial assets at fair value through profit or loss3. Available-for-sale financial assets 2,570,122 35,174 - 2,499,446 33,199 - 4. Hedging derivatives5. Property, equipment and investment property6. Intangible assets
Total 2,583,249 40,788 - 2,513,718 38,509 1
1. Financial liabilities held for trading 838 4,049 - 1,489 4,674 - 2. Financial liabilities at fair value through profit or loss3. Hedging derivatives
Total 838 4,049 - 1,489 4,674 -
KeyL1 = level 1L2 = level 2L3 = level 3
The bank did not transfer assets and liabilities between level 1 and level 2 during the year.Given the bank’s limited operations in the unlisted derivative segment, the fact that it solely works with Italian institutional counterparties and the existence of guarantees that mitigate counterparty risk, the above fair value is not significantly influenced by adjustment factors for counterparty risk (credit value adjustments and/or debit value adjustments).
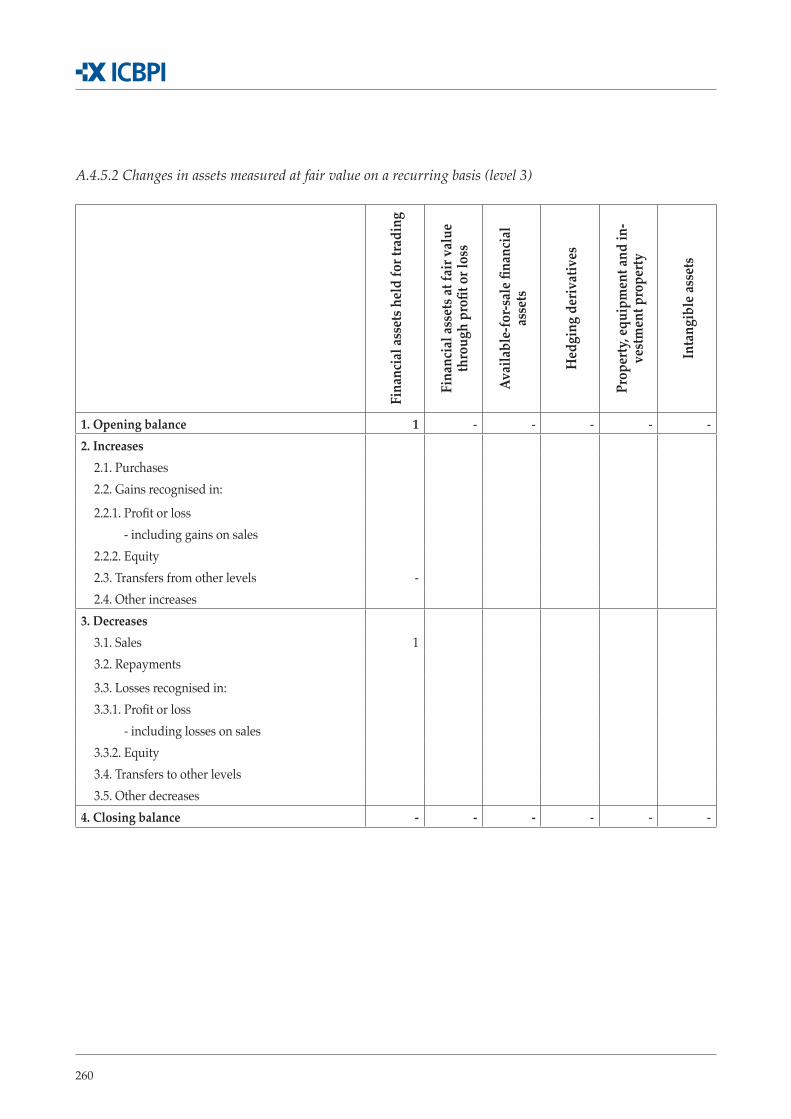
260
A.4.5.2 Changes in assets measured at fair value on a recurring basis (level 3)
Fina
ncia
l ass
ets h
eld
for t
radi
ng
Fina
ncia
l ass
ets a
t fai
r val
ue
thro
ugh
profi
t or l
oss
Avai
labl
e-fo
r-sal
e fina
ncia
l as
sets
Hed
ging
der
ivat
ives
Prop
erty
, equ
ipm
ent a
nd in
-ve
stm
ent p
rope
rty
Inta
ngib
le as
sets
1. Opening balance 1 - - - - -2. Increases
2.1. Purchases2.2. Gains recognised in:
2.2.1. Profit or loss - including gains on sales2.2.2. Equity2.3. Transfers from other levels -2.4. Other increases
3. Decreases3.1. Sales 13.2. Repayments
3.3. Losses recognised in:3.3.1. Profit or loss - including losses on sales3.3.2. Equity3.4. Transfers to other levels3.5. Other decreases
4. Closing balance - - - - - -

261
2015 Reports and Financial Statements
A.4.5.4 Assets and liabilities not measured at fair value or measured at fair value on a non-recurring basis: breakdown by fair value level
31/12/2015 31/12/2014
CA L1 L2 L3 CA L1 L2 L3
1. Held-to-maturity investments 31,784 26,502 - - 46,013 38,272 2,440 2. Loans and receivables with banks 805,418 805,418 585,642 585,642
3. Loans and receivables with customers 2,453,453 2,453,453 2,845,242 2,845,242
4. Investment property 63,766 96,106 65,155 96,106 5. Non-current assets held for sale and disposal groups -
Total 3,354,421 26,502 3,354,977 3,542,051 38,272 3,529,430 1. Due to banks 1,021,500 1,021,500 1,988,762 1,988,762 2. Due to customers 4,523,072 4,523,072 3,080,692 3,080,692 3. Securities issued - - - 4. Liabilities associated with assets held for sale - -
Total 5,544,572 - 5,544,572 - 5,069,454 - 5,069,454 -
Key:CA = carrying amountL1 = level 1L2 = level 2L3 = level 3
262
A.5 Information on “day one profit or loss”
Pursuant to IFRS 7.28 and IAS 39.AG.76, a financial instrument shall be initially recognised at an amount that is equal to its fair value, which is generally considered to be the price paid/collected from its trading. In practice, there could be a difference between the two values. In these cases, the standard stipulates that a financial instrument can be recognised at a fair value different from the amount paid/collected only if it is measured:
▪ using prices from observable current market transactions in the same instrument;
▪ using valuation techniques exclusively based on observable market date as the variable factors.
In other words, IAS 39 states that the presumption that the fair value is equal to the price paid/col-lected can be rebutted only if it is determined using objective evidence that the price paid/collected does not represent the real market value of the financial instrument being traded.
The objective evidence shall be obtained using the most objective method available, i.e., reducing valuation discretion to the minimum.
The difference between fair value and the negotiated price, when the above conditions are met, is called the “day one profit or loss” and is immediately taken to profit or loss.
The bank did not recognise transactions of this kind in the year.
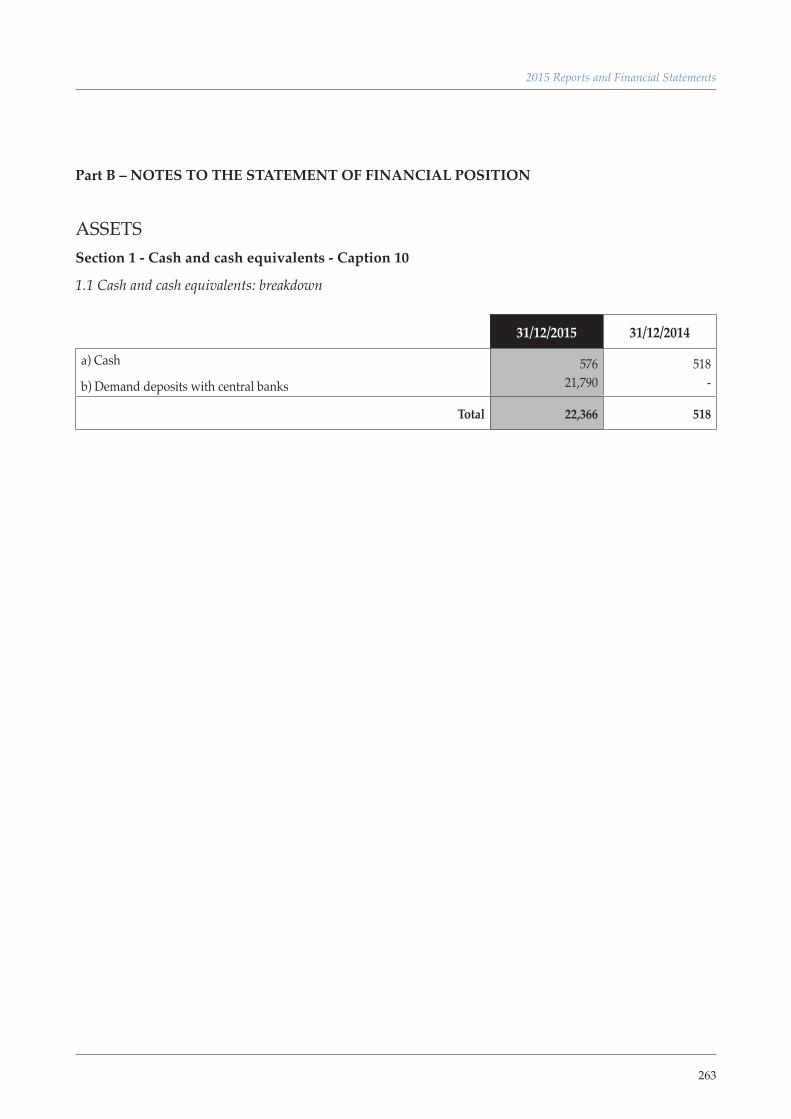
263
2015 Reports and Financial Statements
Part B – NOTES TO THE STATEMENT OF FINANCIAL POSITION
ASSETS Section 1 - Cash and cash equivalents - Caption 10
1.1 Cash and cash equivalents: breakdown
31/12/2015 31/12/2014
a) Cash
b) Demand deposits with central banks 576
21,790518
-
Total 22,366 518
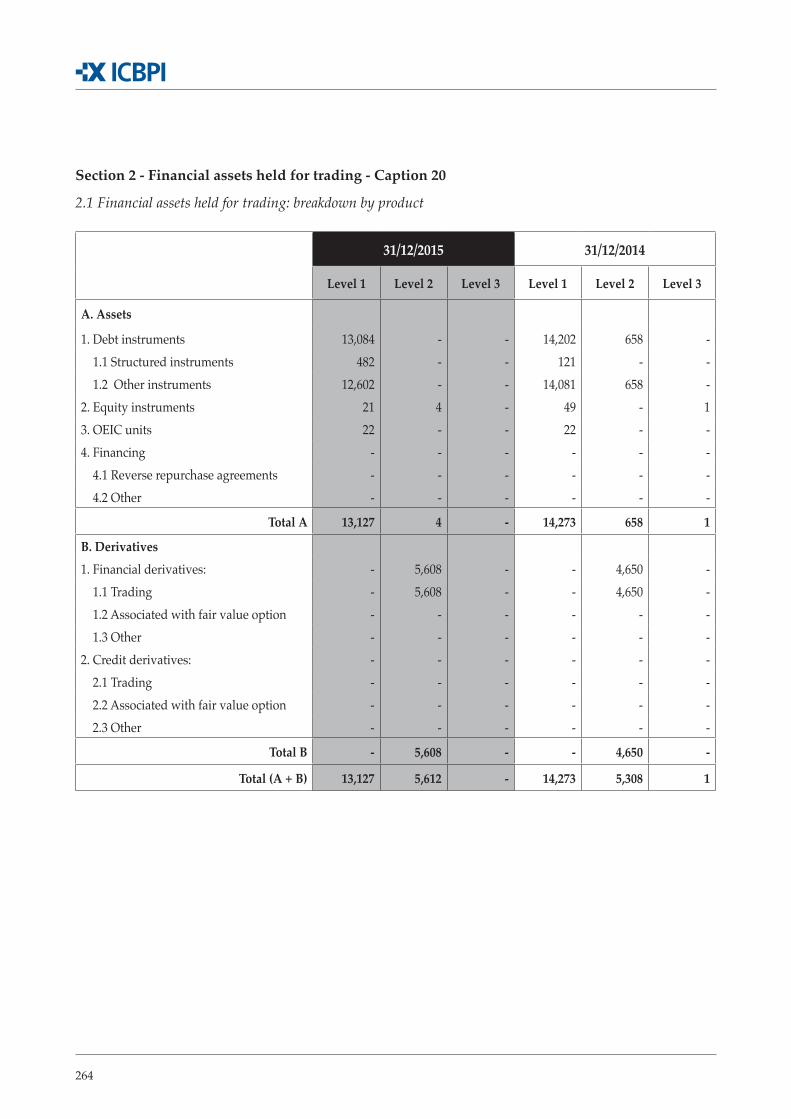
264
Section 2 - Financial assets held for trading - Caption 20
2.1 Financial assets held for trading: breakdown by product
31/12/2015 31/12/2014
Level 1 Level 2 Level 3 Level 1 Level 2 Level 3
A. Assets
1. Debt instruments 13,084 - - 14,202 658 - 1.1 Structured instruments 482 - - 121 - - 1.2 Other instruments 12,602 - - 14,081 658 - 2. Equity instruments 21 4 - 49 - 1 3. OEIC units 22 - - 22 - - 4. Financing - - - - - - 4.1 Reverse repurchase agreements - - - - - - 4.2 Other - - - - - -
Total A 13,127 4 - 14,273 658 1
B. Derivatives1. Financial derivatives: - 5,608 - - 4,650 - 1.1 Trading - 5,608 - - 4,650 - 1.2 Associated with fair value option - - - - - - 1.3 Other - - - - - - 2. Credit derivatives: - - - - - - 2.1 Trading - - - - - - 2.2 Associated with fair value option - - - - - - 2.3 Other - - - - - -
Total B - 5,608 - - 4,650 -
Total (A + B) 13,127 5,612 - 14,273 5,308 1
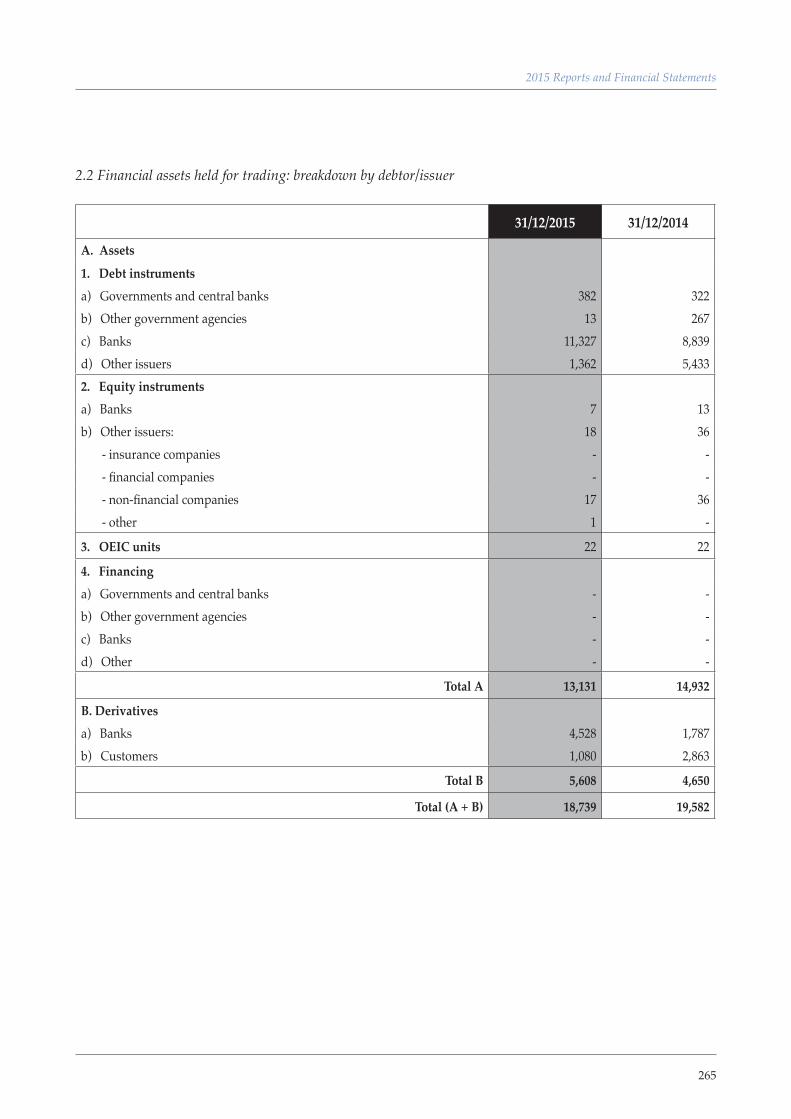
265
2015 Reports and Financial Statements
2.2 Financial assets held for trading: breakdown by debtor/issuer
31/12/2015 31/12/2014
A. Assets
1. Debt instrumentsa) Governments and central banks 382 322 b) Other government agencies 13 267 c) Banks 11,327 8,839 d) Other issuers 1,362 5,433 2. Equity instruments a) Banks 7 13 b) Other issuers: 18 36 - insurance companies - - - financial companies - - - non-financial companies 17 36 - other 1 -
3. OEIC units 22 22
4. Financinga) Governments and central banks - - b) Other government agencies - - c) Banks - - d) Other - -
Total A 13,131 14,932
B. Derivativesa) Banks 4,528 1,787 b) Customers 1,080 2,863
Total B 5,608 4,650
Total (A + B) 18,739 19,582
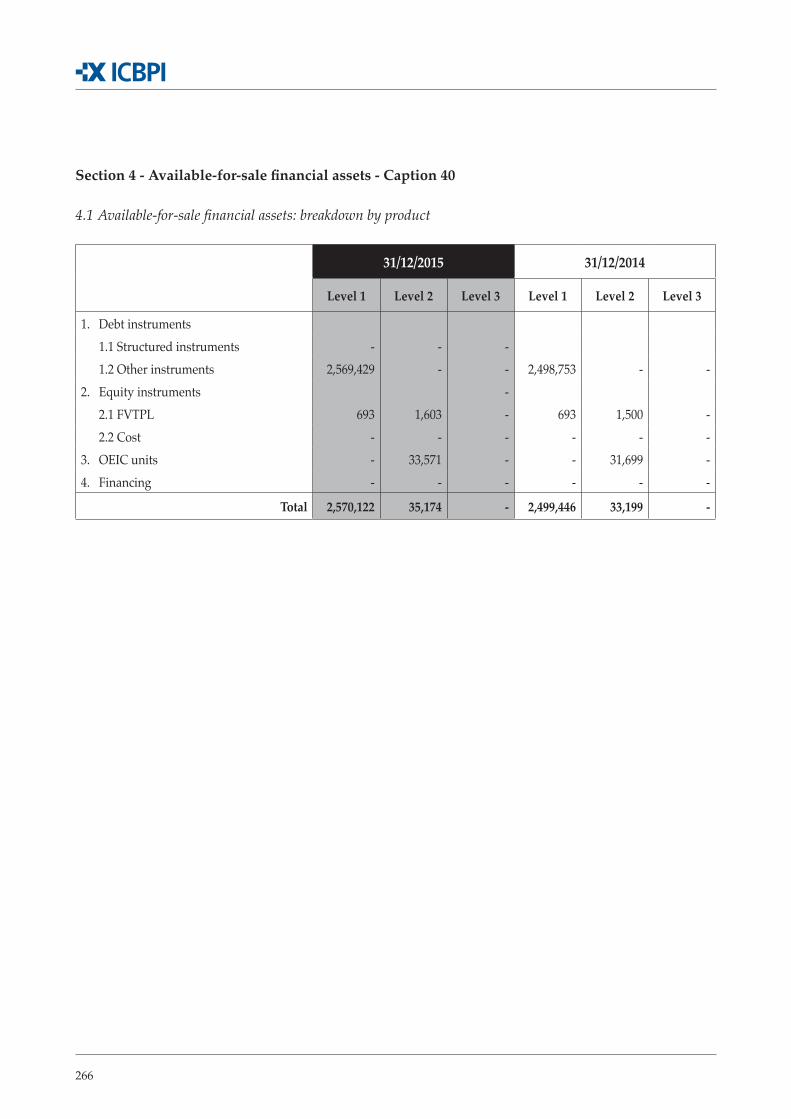
266
Section 4 - Available-for-sale financial assets - Caption 40
4.1 Available-for-sale financial assets: breakdown by product
31/12/2015 31/12/2014
Level 1 Level 2 Level 3 Level 1 Level 2 Level 3
1. Debt instruments 1.1 Structured instruments - - - 1.2 Other instruments 2,569,429 - - 2,498,753 - - 2. Equity instruments - 2.1 FVTPL 693 1,603 - 693 1,500 - 2.2 Cost - - - - - - 3. OEIC units - 33,571 - - 31,699 - 4. Financing - - - - - -
Total 2,570,122 35,174 - 2,499,446 33,199 -
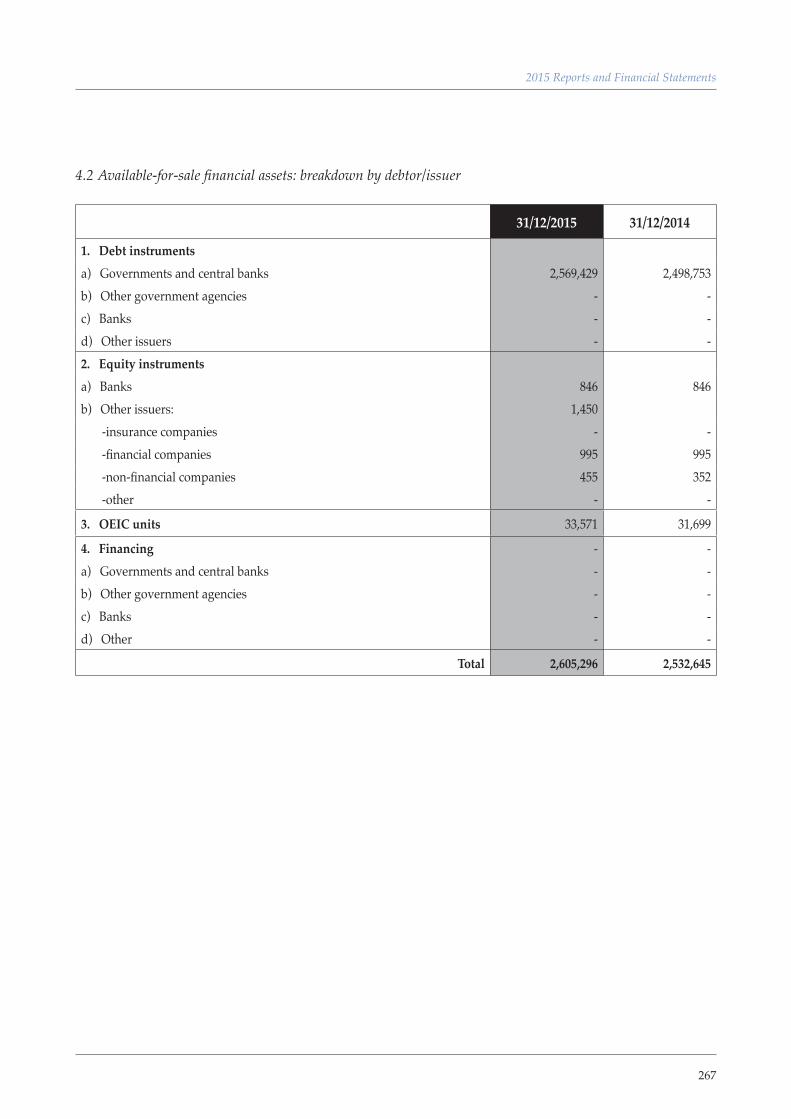
267
2015 Reports and Financial Statements
4.2 Available-for-sale financial assets: breakdown by debtor/issuer
31/12/2015 31/12/2014
1. Debt instrumentsa) Governments and central banks 2,569,429 2,498,753 b) Other government agencies - - c) Banks - - d) Other issuers - - 2. Equity instruments a) Banks 846 846 b) Other issuers: 1,450 -insurance companies - - -financial companies 995 995 -non-financial companies 455 352 -other - -
3. OEIC units 33,571 31,699
4. Financing - - a) Governments and central banks - - b) Other government agencies - - c) Banks - - d) Other - -
Total 2,605,296 2,532,645
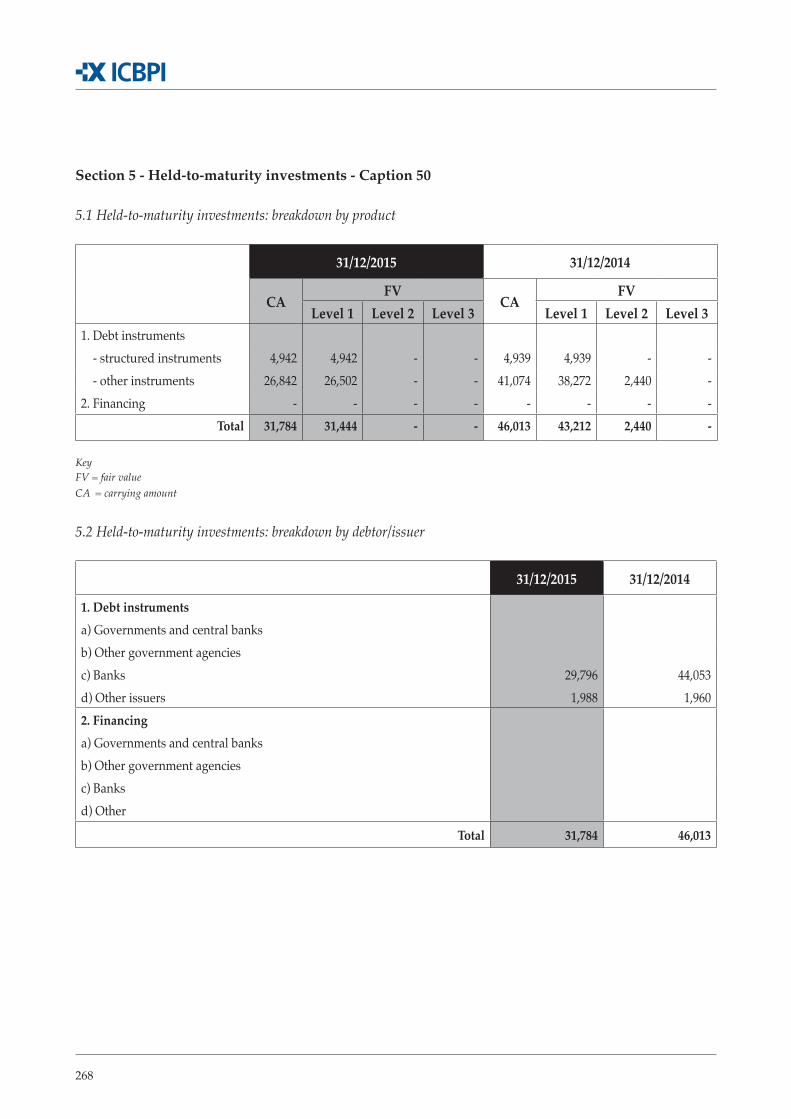
268
Section 5 - Held-to-maturity investments - Caption 50
5.1 Held-to-maturity investments: breakdown by product
31/12/2015 31/12/2014
CAFV
CAFV
Level 1 Level 2 Level 3 Level 1 Level 2 Level 31. Debt instruments - structured instruments 4,942 4,942 - - 4,939 4,939 - - - other instruments 26,842 26,502 - - 41,074 38,272 2,440 - 2. Financing - - - - - - - -
Total 31,784 31,444 - - 46,013 43,212 2,440 -
KeyFV = fair valueCA = carrying amount
5.2 Held-to-maturity investments: breakdown by debtor/issuer
31/12/2015 31/12/2014
1. Debt instruments a) Governments and central banksb) Other government agenciesc) Banks 29,796 44,053d) Other issuers 1,988 1,9602. Financinga) Governments and central banksb) Other government agenciesc) Banksd) Other
Total 31,784 46,013
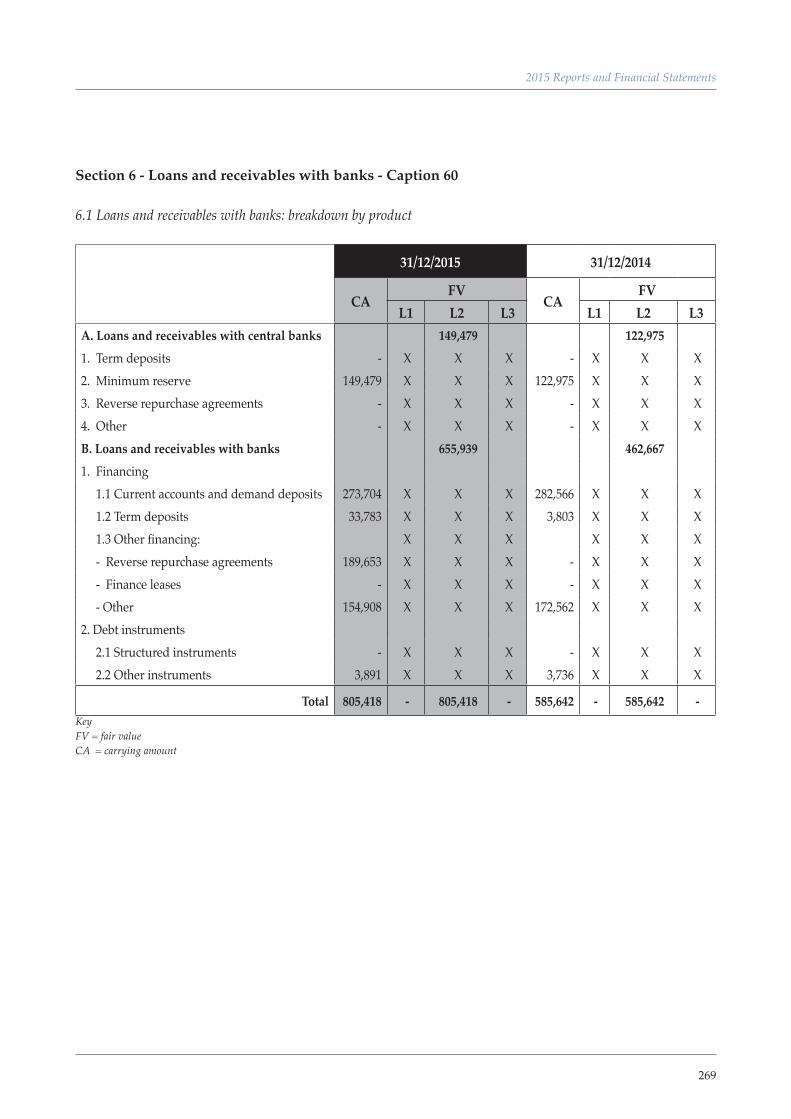
269
2015 Reports and Financial Statements
Section 6 - Loans and receivables with banks - Caption 60
6.1 Loans and receivables with banks: breakdown by product
31/12/2015 31/12/2014
CAFV
CAFV
L1 L2 L3 L1 L2 L3A. Loans and receivables with central banks 149,479 122,975 1. Term deposits - X X X - X X X 2. Minimum reserve 149,479 X X X 122,975 X X X 3. Reverse repurchase agreements - X X X - X X X 4. Other - X X X - X X X B. Loans and receivables with banks 655,939 462,667 1. Financing 1.1 Current accounts and demand deposits 273,704 X X X 282,566 X X X 1.2 Term deposits 33,783 X X X 3,803 X X X 1.3 Other financing: X X X X X X - Reverse repurchase agreements 189,653 X X X - X X X - Finance leases - X X X - X X X - Other 154,908 X X X 172,562 X X X 2. Debt instruments 2.1 Structured instruments - X X X - X X X 2.2 Other instruments 3,891 X X X 3,736 X X X
Total 805,418 - 805,418 - 585,642 - 585,642 - KeyFV = fair valueCA = carrying amount
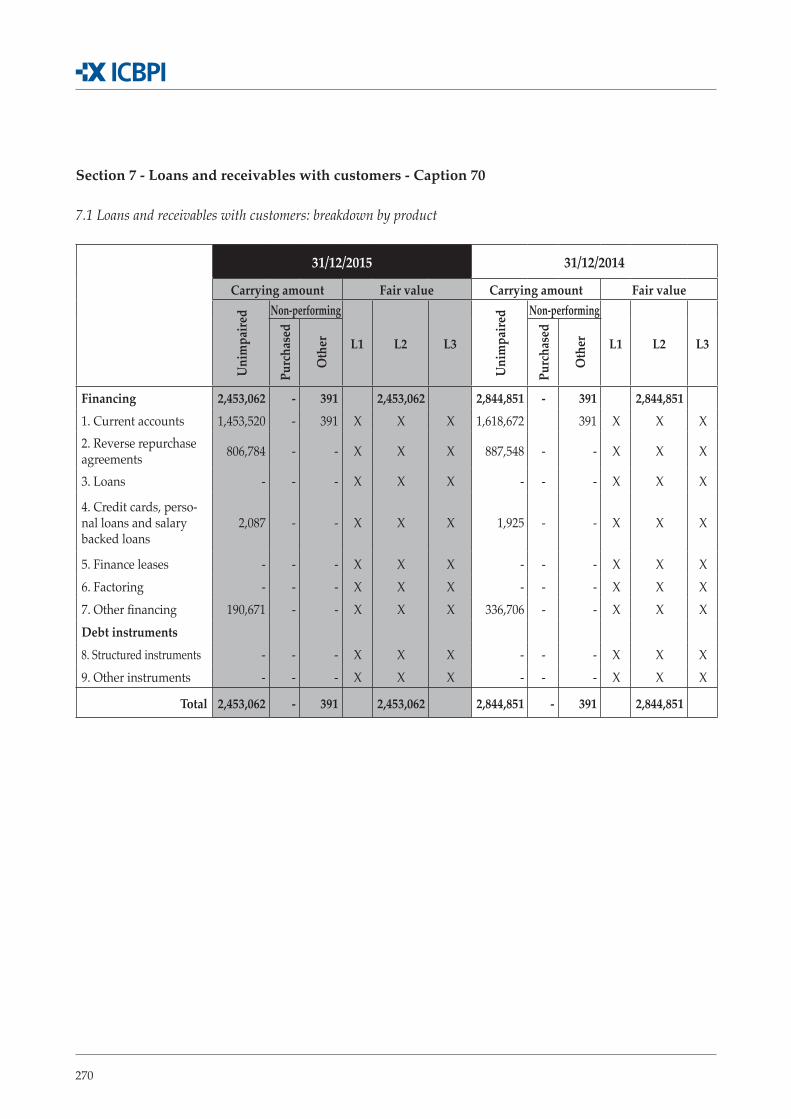
270
Section 7 - Loans and receivables with customers - Caption 70
7.1 Loans and receivables with customers: breakdown by product
31/12/2015 31/12/2014
Carrying amount Fair value Carrying amount Fair value
Uni
mpa
ired Non-performing
L1 L2 L3
Uni
mpa
ired Non-performing
L1 L2 L3
Purc
hase
d
Oth
er
Purc
hase
d
Oth
er
Financing 2,453,062 - 391 2,453,062 2,844,851 - 391 2,844,851 1. Current accounts 1,453,520 - 391 X X X 1,618,672 391 X X X 2. Reverse repurchase agreements 806,784 - - X X X 887,548 - - X X X
3. Loans - - - X X X - - - X X X
4. Credit cards, perso-nal loans and salary backed loans
2,087 - - X X X 1,925 - - X X X
5. Finance leases - - - X X X - - - X X X 6. Factoring - - - X X X - - - X X X 7. Other financing 190,671 - - X X X 336,706 - - X X X Debt instruments 8. Structured instruments - - - X X X - - - X X X 9. Other instruments - - - X X X - - - X X X
Total 2,453,062 - 391 2,453,062 2,844,851 - 391 2,844,851
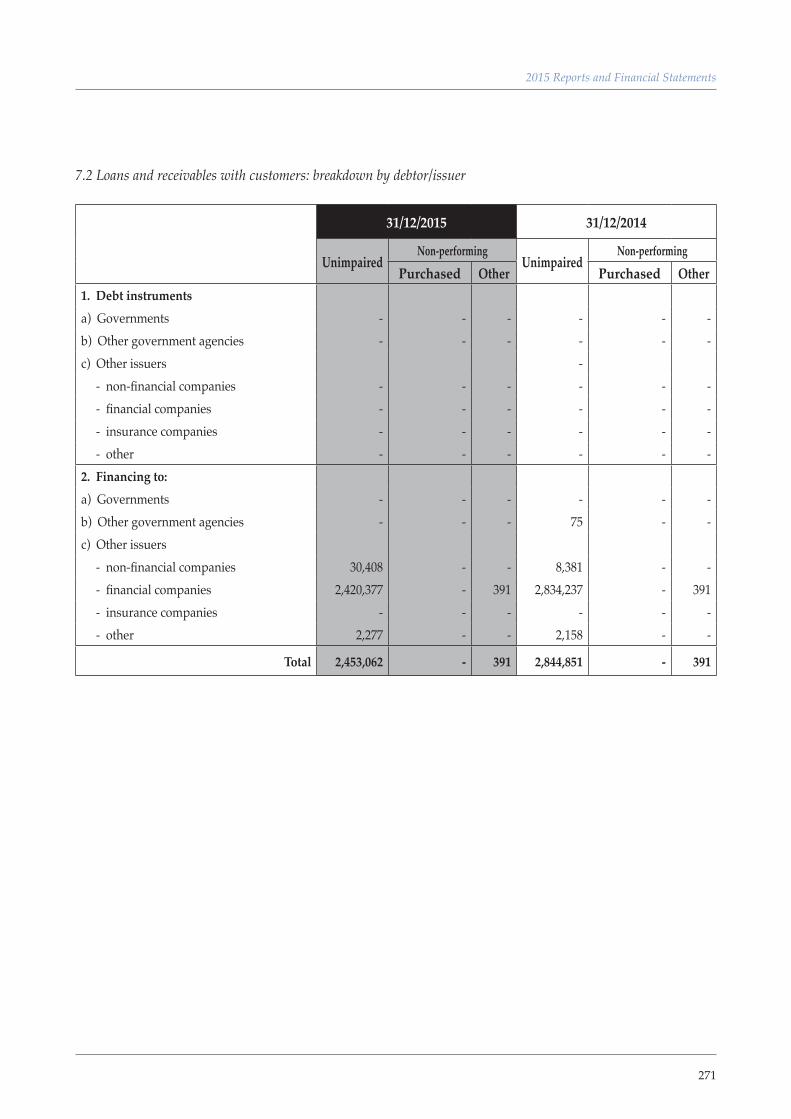
271
2015 Reports and Financial Statements
7.2 Loans and receivables with customers: breakdown by debtor/issuer
31/12/2015 31/12/2014
UnimpairedNon-performing
UnimpairedNon-performing
Purchased Other Purchased Other1. Debt instrumentsa) Governments - - - - - - b) Other government agencies - - - - - - c) Other issuers - - non-financial companies - - - - - - - financial companies - - - - - - - insurance companies - - - - - - - other - - - - - - 2. Financing to:a) Governments - - - - - - b) Other government agencies - - - 75 - - c) Other issuers - non-financial companies 30,408 - - 8,381 - - - financial companies 2,420,377 - 391 2,834,237 - 391 - insurance companies - - - - - - - other 2,277 - - 2,158 - -
Total 2,453,062 - 391 2,844,851 - 391
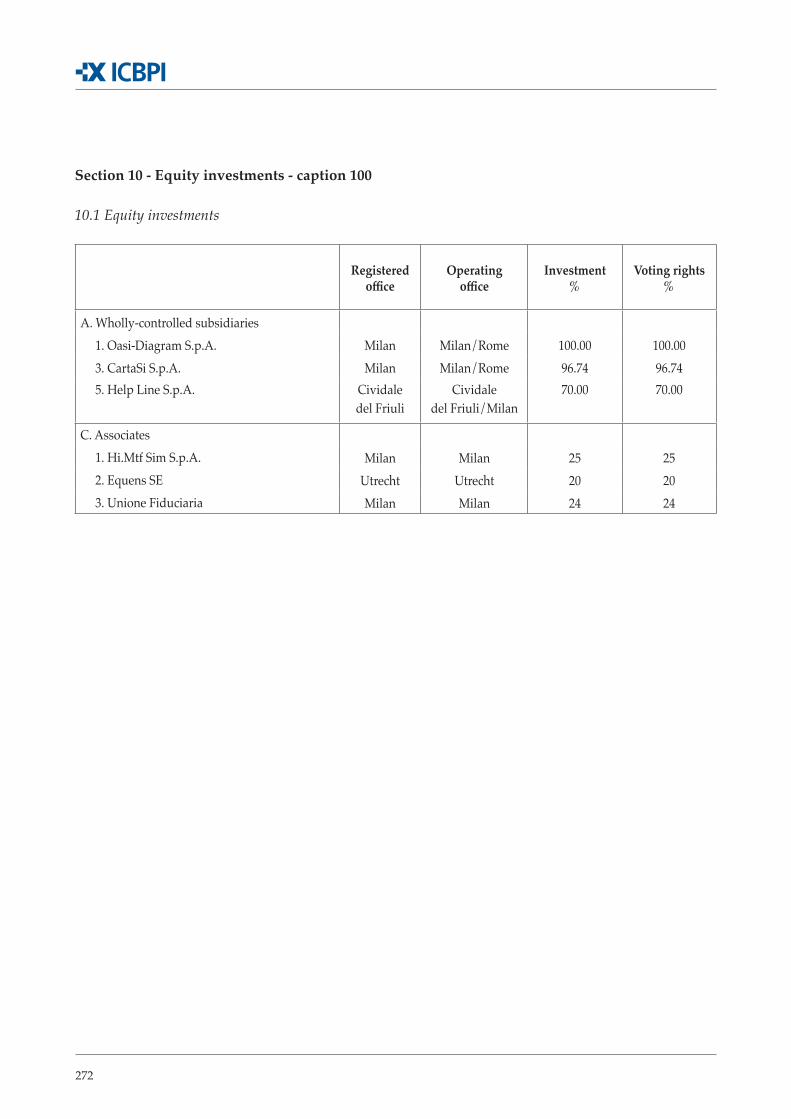
272
Section 10 - Equity investments - caption 100
10.1 Equity investments
Registered office
Operating office
Investment %
Voting rights%
A. Wholly-controlled subsidiaries 1. Oasi-Diagram S.p.A. Milan Milan/Rome 100.00 100.00 3. CartaSi S.p.A. Milan Milan/Rome 96.74 96.74 5. Help Line S.p.A. Cividale
del FriuliCividale
del Friuli/Milan70.00 70.00
C. Associates 1. Hi.Mtf Sim S.p.A. Milan Milan 25 25 2. Equens SE Utrecht Utrecht 20 20 3. Unione Fiduciaria Milan Milan 24 24
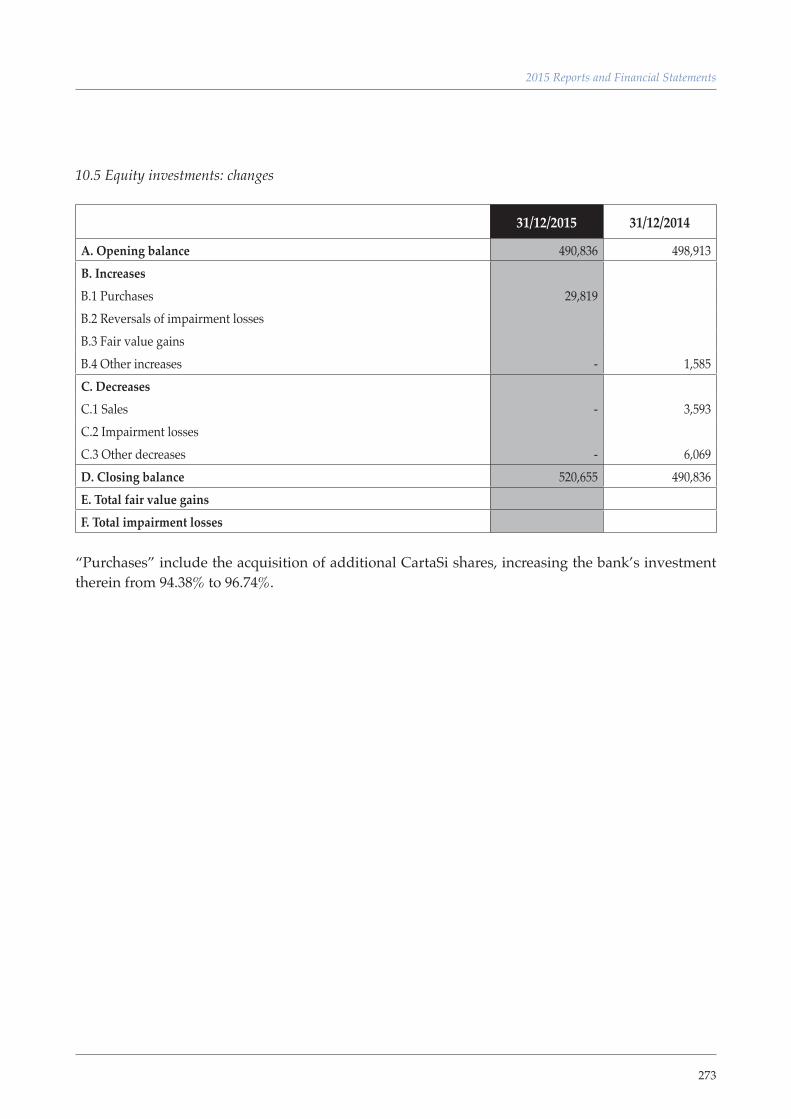
273
2015 Reports and Financial Statements
10.5 Equity investments: changes
31/12/2015 31/12/2014
A. Opening balance 490,836 498,913 B. IncreasesB.1 Purchases 29,819B.2 Reversals of impairment lossesB.3 Fair value gainsB.4 Other increases - 1,585C. DecreasesC.1 Sales - 3,593 C.2 Impairment lossesC.3 Other decreases - 6,069 D. Closing balance 520,655 490,836 E. Total fair value gainsF. Total impairment losses
“Purchases” include the acquisition of additional CartaSi shares, increasing the bank’s investment therein from 94.38% to 96.74%.
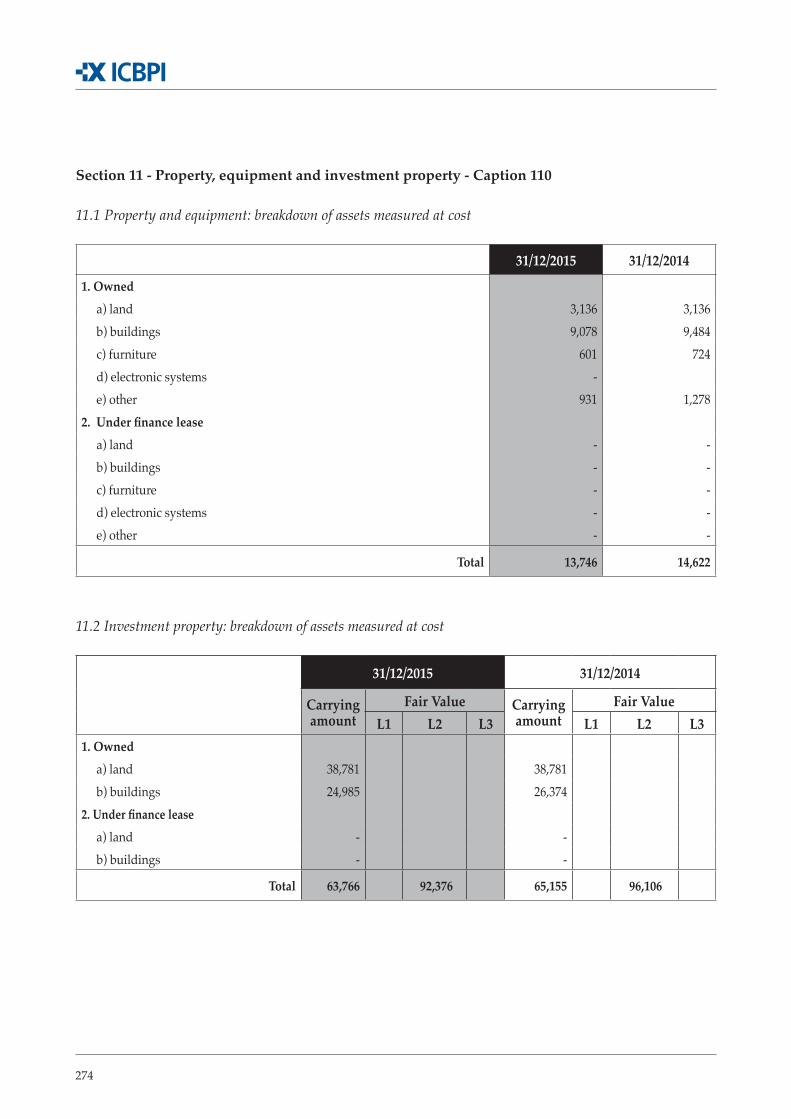
274
Section 11 - Property, equipment and investment property - Caption 110
11.1 Property and equipment: breakdown of assets measured at cost
31/12/2015 31/12/2014
1. Owned a) land 3,136 3,136 b) buildings 9,078 9,484 c) furniture 601 724 d) electronic systems - e) other 931 1,278
2. Under finance leasea) land - - b) buildings - - c) furniture - - d) electronic systems - - e) other - -
Total 13,746 14,622
11.2 Investment property: breakdown of assets measured at cost
31/12/2015 31/12/2014
Carrying amount
Fair Value Carrying amount
Fair ValueL1 L2 L3 L1 L2 L3
1. Owned a) land 38,781 38,781 b) buildings 24,985 26,374 2. Under finance lease a) land - - b) buildings - -
Total 63,766 92,376 65,155 96,106
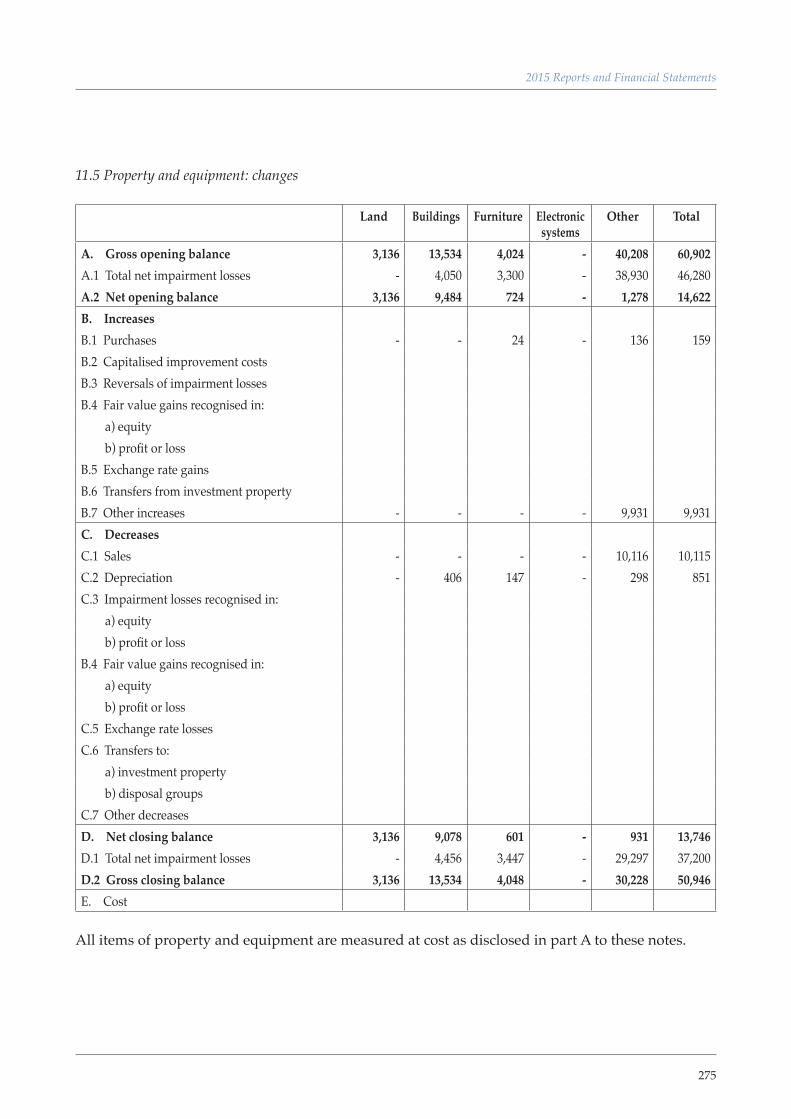
275
2015 Reports and Financial Statements
11.5 Property and equipment: changes
Land Buildings Furniture Electronic systems
Other Total
A. Gross opening balance 3,136 13,534 4,024 - 40,208 60,902 A.1 Total net impairment losses - 4,050 3,300 - 38,930 46,280 A.2 Net opening balance 3,136 9,484 724 - 1,278 14,622 B. IncreasesB.1 Purchases - - 24 - 136 159 B.2 Capitalised improvement costsB.3 Reversals of impairment lossesB.4 Fair value gains recognised in: a) equity b) profit or lossB.5 Exchange rate gainsB.6 Transfers from investment propertyB.7 Other increases - - - - 9,931 9,931 C. DecreasesC.1 Sales - - - - 10,116 10,115 C.2 Depreciation - 406 147 - 298 851 C.3 Impairment losses recognised in: a) equity b) profit or lossB.4 Fair value gains recognised in: a) equity b) profit or lossC.5 Exchange rate losses C.6 Transfers to: a) investment property b) disposal groupsC.7 Other decreases D. Net closing balance 3,136 9,078 601 - 931 13,746 D.1 Total net impairment losses - 4,456 3,447 - 29,297 37,200 D.2 Gross closing balance 3,136 13,534 4,048 - 30,228 50,946 E. Cost
All items of property and equipment are measured at cost as disclosed in part A to these notes.
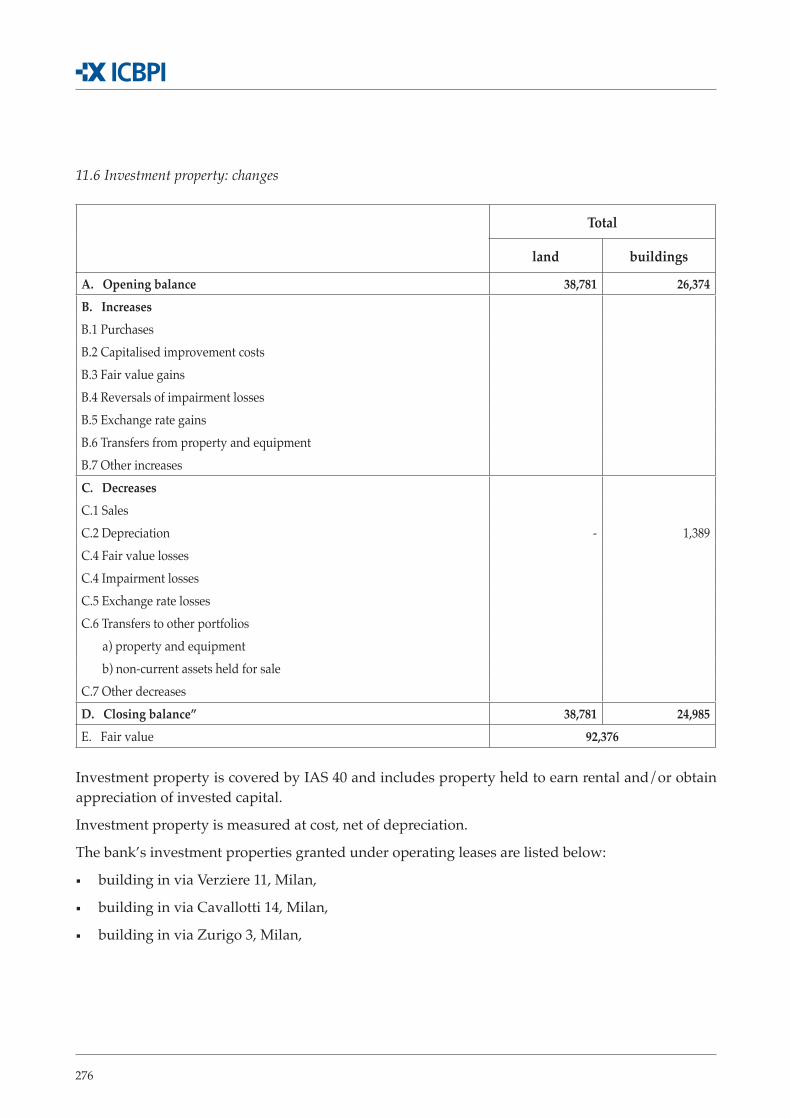
276
11.6 Investment property: changes
Total
land buildings
A. Opening balance 38,781 26,374 B. IncreasesB.1 PurchasesB.2 Capitalised improvement costsB.3 Fair value gainsB.4 Reversals of impairment lossesB.5 Exchange rate gainsB.6 Transfers from property and equipmentB.7 Other increasesC. DecreasesC.1 SalesC.2 Depreciation - 1,389 C.4 Fair value losses C.4 Impairment lossesC.5 Exchange rate lossesC.6 Transfers to other portfolios a) property and equipment b) non-current assets held for sale C.7 Other decreasesD. Closing balance” 38,781 24,985 E. Fair value 92,376
Investment property is covered by IAS 40 and includes property held to earn rental and/or obtain appreciation of invested capital.
Investment property is measured at cost, net of depreciation.
The bank’s investment properties granted under operating leases are listed below:
▪ building in via Verziere 11, Milan,
▪ building in via Cavallotti 14, Milan,
▪ building in via Zurigo 3, Milan,
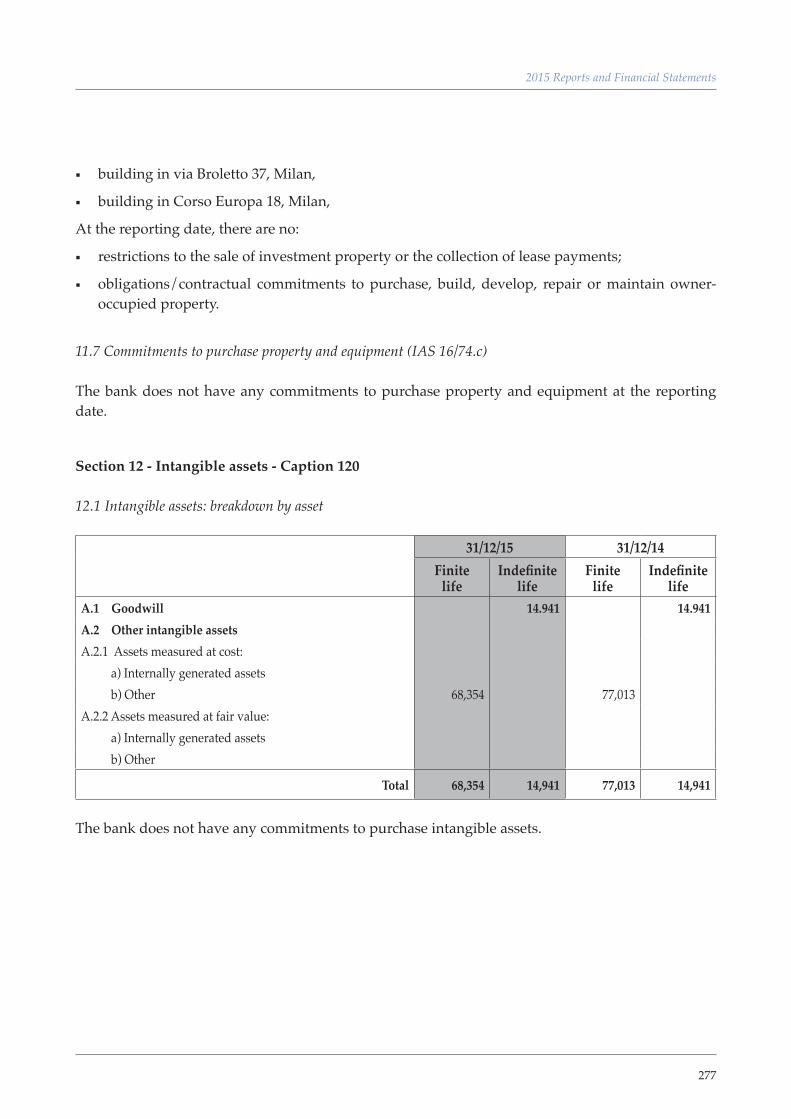
277
2015 Reports and Financial Statements
▪ building in via Broletto 37, Milan,
▪ building in Corso Europa 18, Milan,
At the reporting date, there are no:
▪ restrictions to the sale of investment property or the collection of lease payments;
▪ obligations/contractual commitments to purchase, build, develop, repair or maintain owner-occupied property.
11.7 Commitments to purchase property and equipment (IAS 16/74.c)
The bank does not have any commitments to purchase property and equipment at the reporting date.
Section 12 - Intangible assets - Caption 120
12.1 Intangible assets: breakdown by asset
31/12/15 31/12/14Finite
lifeIndefinite
lifeFinite
lifeIndefinite
lifeA.1 Goodwill 14.941 14.941 A.2 Other intangible assetsA.2.1 Assets measured at cost: a) Internally generated assets b) Other 68,354 77,013 A.2.2 Assets measured at fair value: a) Internally generated assets b) Other
Total 68,354 14,941 77,013 14,941
The bank does not have any commitments to purchase intangible assets.
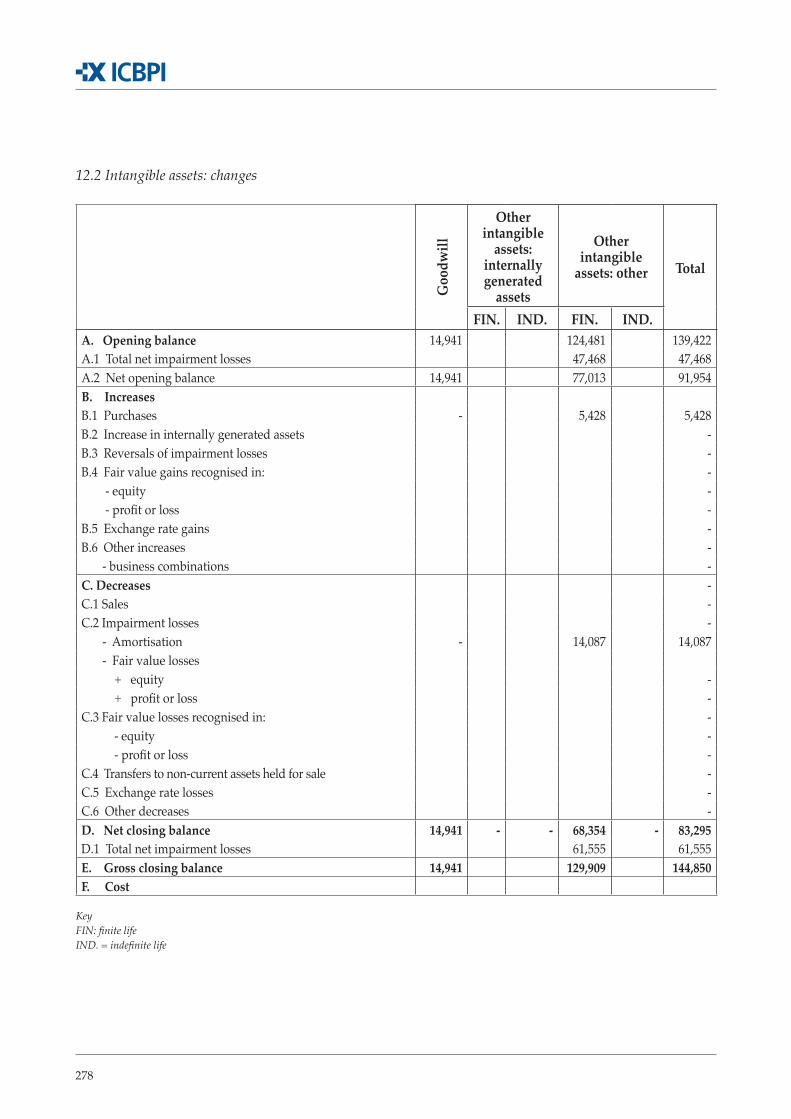
278
12.2 Intangible assets: changes
Goo
dwill
Other intangible
assets: internally generated
assets
Other intangible
assets: other Total
FIN. IND. FIN. IND.A. Opening balance 14,941 124,481 139,422 A.1 Total net impairment losses 47,468 47,468 A.2 Net opening balance 14,941 77,013 91,954 B. IncreasesB.1 Purchases - 5,428 5,428 B.2 Increase in internally generated assets - B.3 Reversals of impairment losses - B.4 Fair value gains recognised in: - - equity - - profit or loss - B.5 Exchange rate gains - B.6 Other increases - - business combinations - C. Decreases - C.1 Sales - C.2 Impairment losses - - Amortisation - 14,087 14,087 - Fair value losses + equity - + profit or loss - C.3 Fair value losses recognised in: - - equity - - profit or loss - C.4 Transfers to non-current assets held for sale - C.5 Exchange rate losses - C.6 Other decreases - D. Net closing balance 14,941 - - 68,354 - 83,295 D.1 Total net impairment losses 61,555 61,555 E. Gross closing balance 14,941 129,909 144,850 F. Cost
KeyFIN: finite lifeIND. = indefinite life
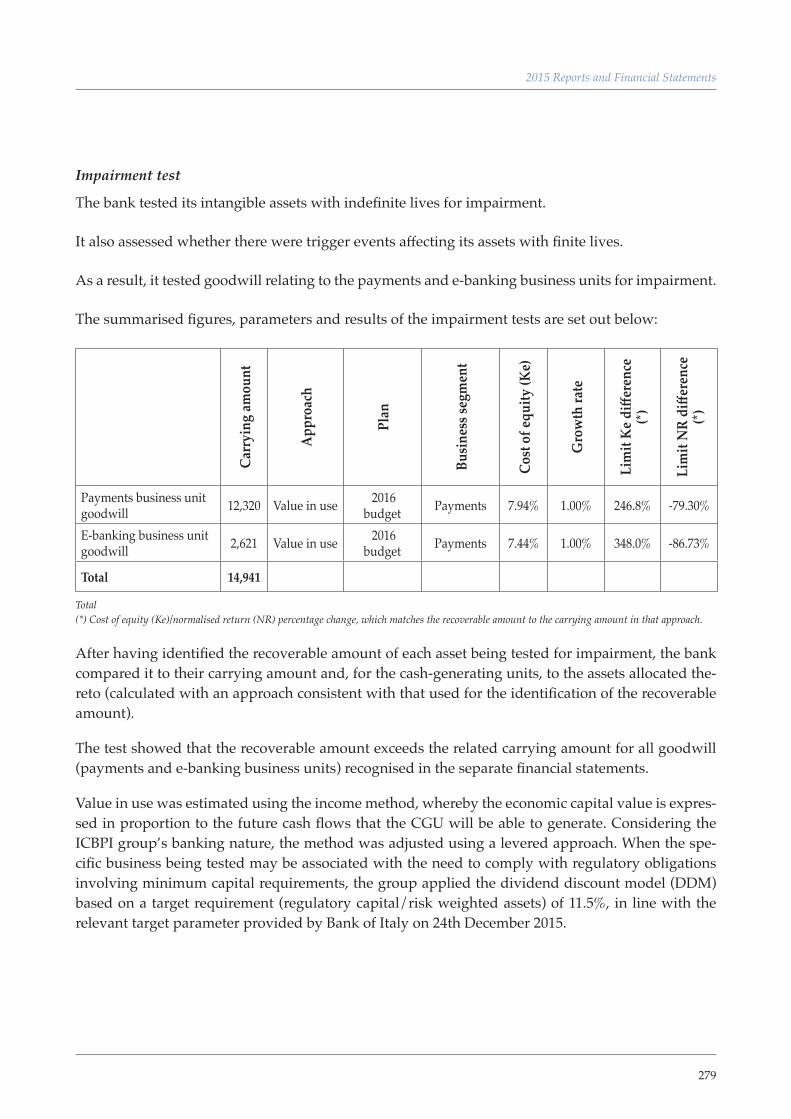
279
2015 Reports and Financial Statements
Impairment test
The bank tested its intangible assets with indefinite lives for impairment.
It also assessed whether there were trigger events affecting its assets with finite lives.
As a result, it tested goodwill relating to the payments and e-banking business units for impairment.
The summarised figures, parameters and results of the impairment tests are set out below:
Carr
ying
amou
nt
App
roac
h
Plan
Busi
ness
segm
ent
Cost
of e
quity
(Ke)
Gro
wth
rate
Lim
it K
e diff
eren
ce
(*)
Lim
it N
R di
ffere
nce
(*)
Payments business unit goodwill 12,320 Value in use 2016
budget Payments 7.94% 1.00% 246.8% -79.30%
E-banking business unit goodwill 2,621 Value in use 2016
budget Payments 7.44% 1.00% 348.0% -86.73%
Total 14,941
Total(*) Cost of equity (Ke)/normalised return (NR) percentage change, which matches the recoverable amount to the carrying amount in that approach.
After having identified the recoverable amount of each asset being tested for impairment, the bank compared it to their carrying amount and, for the cash-generating units, to the assets allocated the-reto (calculated with an approach consistent with that used for the identification of the recoverable amount).
The test showed that the recoverable amount exceeds the related carrying amount for all goodwill (payments and e-banking business units) recognised in the separate financial statements.
Value in use was estimated using the income method, whereby the economic capital value is expres-sed in proportion to the future cash flows that the CGU will be able to generate. Considering the ICBPI group’s banking nature, the method was adjusted using a levered approach. When the spe-cific business being tested may be associated with the need to comply with regulatory obligations involving minimum capital requirements, the group applied the dividend discount model (DDM) based on a target requirement (regulatory capital/risk weighted assets) of 11.5%, in line with the relevant target parameter provided by Bank of Italy on 24th December 2015.
280
The bank used the two-step formula when applying the income method, which is as follows:
W = ∑ NR * (1 + Ke)-n + TV (1 + Ke)-n
where:
▪ ∑ NR * (1 + Ke)-n is the sum of the discounted cash flows for each of the “n” years covered by the plan (in the DDM, Rn is the maximum distributable dividend given the plan cash flows, in line with the supervisory regulatory requirements, therefore considering the excess capital or the use of capital in each year);
▪ TV (1 + Ke)-n is the discounted terminal value (TV), which was calculated by discounting to in-finity the NR estimated at the end of the plan period, considering the expected perpetual growth rate of the normal revenue flow equal to “g”.
The bank applied the following formula to calculate the TV (using the DDM approach):
TV = (NR * (1 + g) – RWA * 10% * g)/(Ke – g)
For the purposes of estimating the discount rate, which is the share price in the levered model, the bank adopted the capital asset pricing model (CAPM) with the formula Ke = rf + β (rm - rf), where Ke is the share price, rf is the risk-free return on investments, β shows the systematic risk and the differential (rm - rf) measures the market risk premium (Rm).
The bank used market inputs and/or inputs used by the professional practice:
▪ the risk free rate (rf) is based on the 10-year Italian treasury bonds (BTP). The use of a rate that has a specific risk component for the Italy country risk is in line with the businesses being tested (all based and operating in Italy). Considering the trend of the rate and its reporting date amount, the bank prudently took the 2015 average into account (in line with the reference period used in 2014). Based on information provided by Bloomberg, the parameter was set at 1.697%;
▪ the market risk premium (Rm) is 5%, based on the general practice for the Italian market;
▪ beta (β) is equal to the average of the companies included in the reference segment(s), (as identify through by Bloomberg on 29th January 2016) identified on a case by case basis in relation to the nature of the business being tested.
Moreover, where deemed applicable in relation to the nature of the businesses being tested, as addi-tional elements for the calculation of the cost of equity (Ke), the bank considered other specific risks (Rs).
The bank calculated the cash flows:
▪ analytically on the basis of the figures included in the 2016 budget approved by the board of directors;
281
2015 Reports and Financial Statements
▪ systematically, in relation to the terminal value calculated in perpetuity.
At the end of each valuation, the bank carried out a sensitivity analysis in order to show:
▪ that the CGU’s recoverable amount exceeded its carrying amount;
▪ the value assigned to the underlying assumptions;
▪ the percentage difference between the rate used to discount cash flows, which makes the CGU’s recoverable amount equal to the carrying amount of goodwill, and the rate used to calculate va-lue in use.
The “Limit Ke difference” and “Limit NR difference” columns of the table set out earlier show the results of the sensitivity analysis carried out to check the relationship between the change in the CGU’s value in use and in the discount rate (Ke) and normalised return (NR) that were used as a basis to calculate the terminal value.
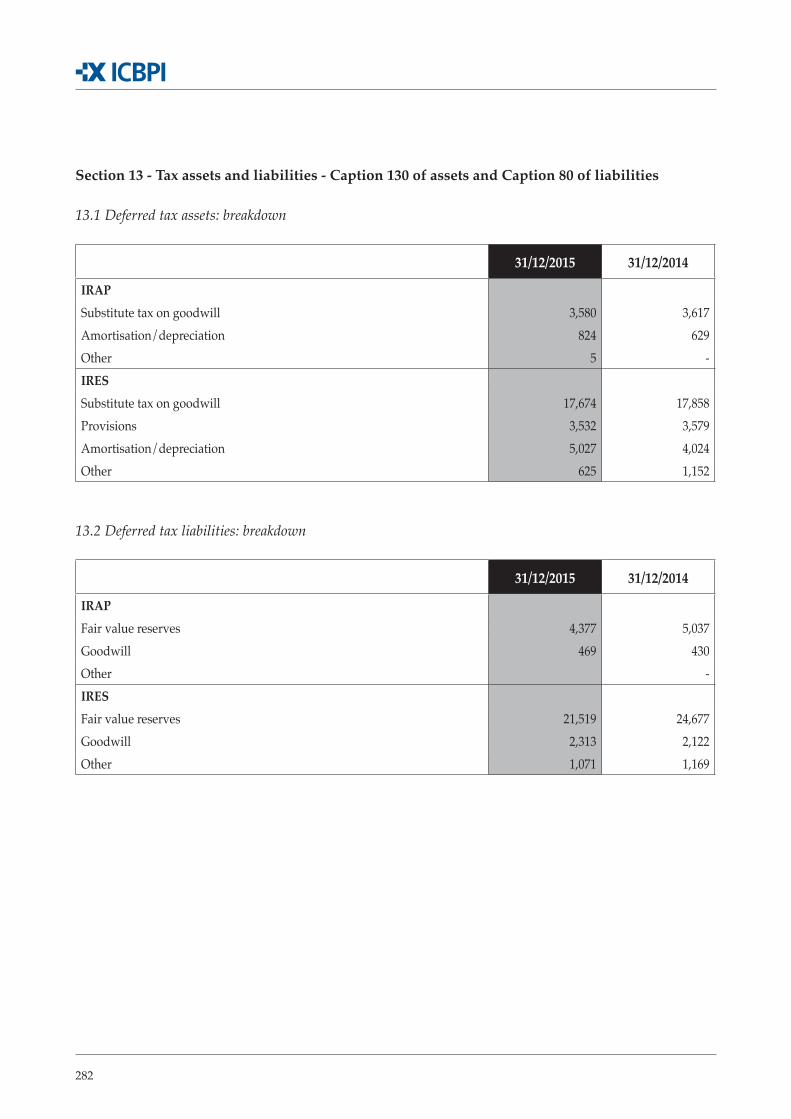
282
Section 13 - Tax assets and liabilities - Caption 130 of assets and Caption 80 of liabilities
13.1 Deferred tax assets: breakdown
31/12/2015 31/12/2014
IRAPSubstitute tax on goodwill 3,580 3,617 Amortisation/depreciation 824 629 Other 5 - IRESSubstitute tax on goodwill 17,674 17,858 Provisions 3,532 3,579 Amortisation/depreciation 5,027 4,024 Other 625 1,152
13.2 Deferred tax liabilities: breakdown
31/12/2015 31/12/2014
IRAPFair value reserves 4,377 5,037 Goodwill 469 430 Other -IRESFair value reserves 21,519 24,677 Goodwill 2,313 2,122 Other 1,071 1,169
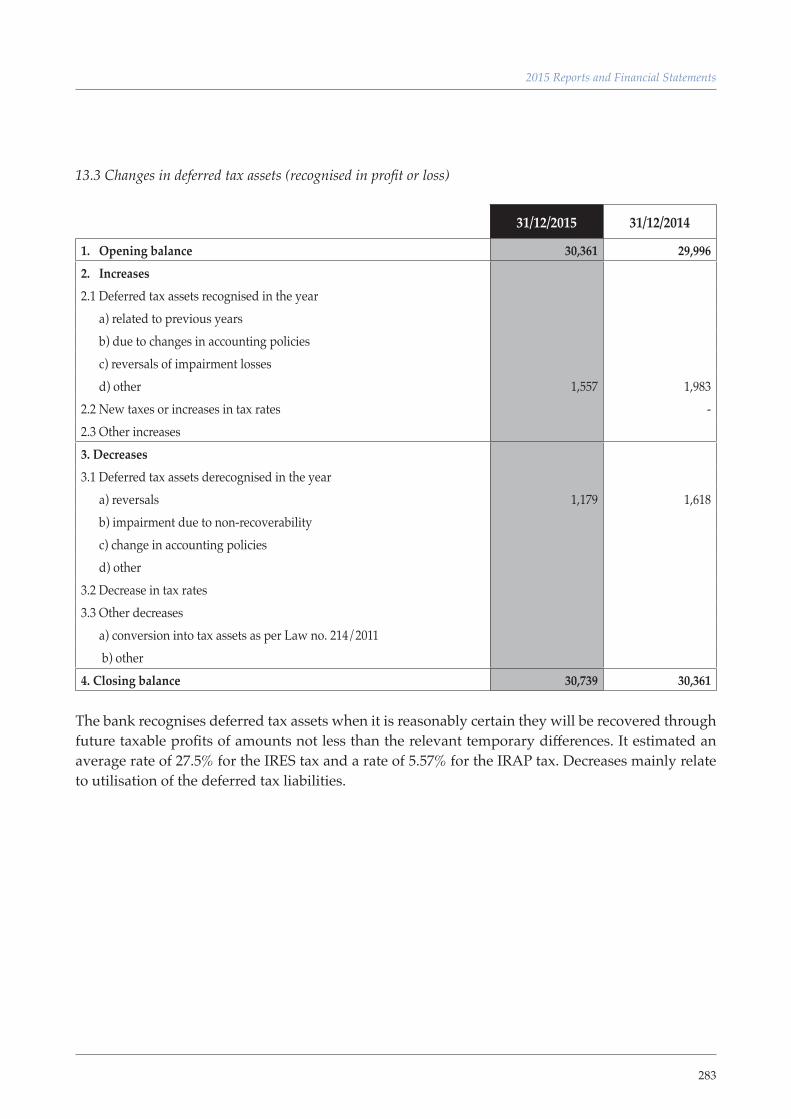
283
2015 Reports and Financial Statements
13.3 Changes in deferred tax assets (recognised in profit or loss)
31/12/2015 31/12/2014
1. Opening balance 30,361 29,996 2. Increases2.1 Deferred tax assets recognised in the year a) related to previous years b) due to changes in accounting policies c) reversals of impairment losses d) other 1,557 1,983 2.2 New taxes or increases in tax rates - 2.3 Other increases3. Decreases3.1 Deferred tax assets derecognised in the year a) reversals 1,179 1,618 b) impairment due to non-recoverability c) change in accounting policies d) other 3.2 Decrease in tax rates3.3 Other decreases a) conversion into tax assets as per Law no. 214/2011 b) other4. Closing balance 30,739 30,361
The bank recognises deferred tax assets when it is reasonably certain they will be recovered through future taxable profits of amounts not less than the relevant temporary differences. It estimated an average rate of 27.5% for the IRES tax and a rate of 5.57% for the IRAP tax. Decreases mainly relate to utilisation of the deferred tax liabilities.
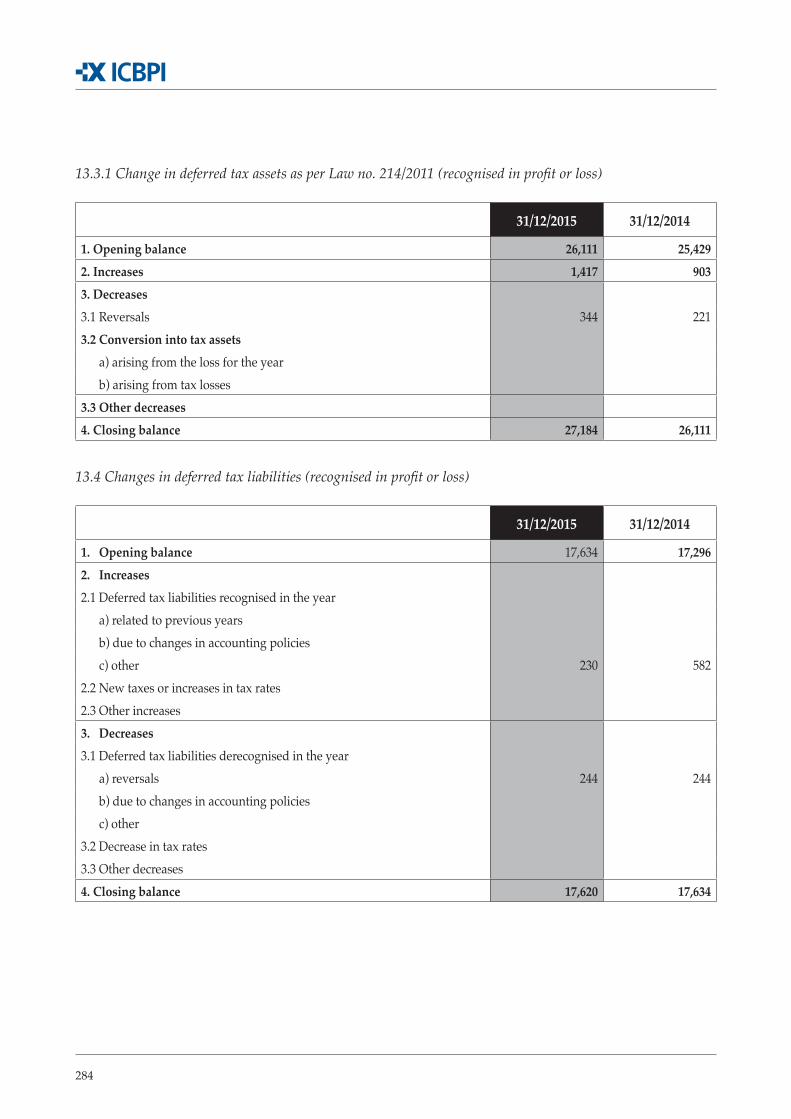
284
13.3.1 Change in deferred tax assets as per Law no. 214/2011 (recognised in profit or loss)
31/12/2015 31/12/2014
1. Opening balance 26,111 25,429 2. Increases 1,417 903 3. Decreases3.1 Reversals 344 221 3.2 Conversion into tax assets a) arising from the loss for the year b) arising from tax losses3.3 Other decreases4. Closing balance 27,184 26,111
13.4 Changes in deferred tax liabilities (recognised in profit or loss)
31/12/2015 31/12/2014
1. Opening balance 17,634 17,296 2. Increases2.1 Deferred tax liabilities recognised in the year a) related to previous years b) due to changes in accounting policies c) other 230 582 2.2 New taxes or increases in tax rates2.3 Other increases3. Decreases3.1 Deferred tax liabilities derecognised in the year a) reversals 244 244 b) due to changes in accounting policies c) other3.2 Decrease in tax rates3.3 Other decreases4. Closing balance 17,620 17,634
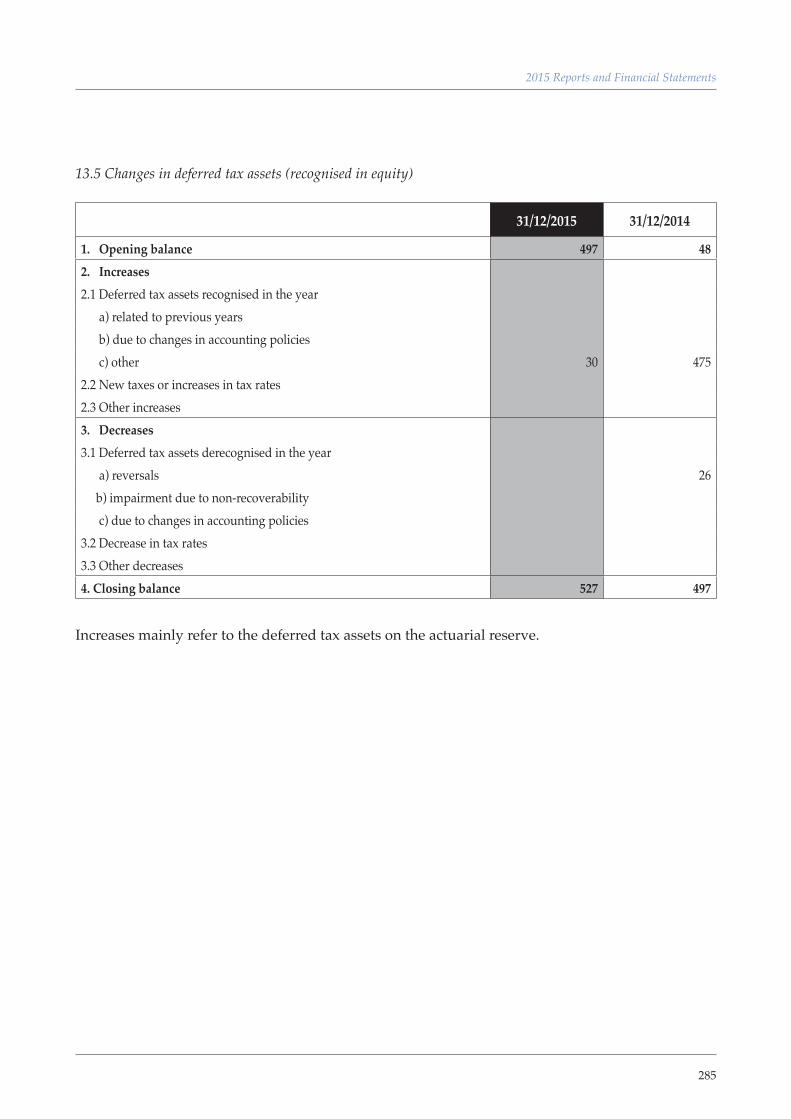
285
2015 Reports and Financial Statements
13.5 Changes in deferred tax assets (recognised in equity)
31/12/2015 31/12/2014
1. Opening balance 497 48 2. Increases2.1 Deferred tax assets recognised in the year a) related to previous years b) due to changes in accounting policies c) other 30 475 2.2 New taxes or increases in tax rates2.3 Other increases 3. Decreases3.1 Deferred tax assets derecognised in the year a) reversals 26 b) impairment due to non-recoverability c) due to changes in accounting policies3.2 Decrease in tax rates3.3 Other decreases 4. Closing balance 527 497
Increases mainly refer to the deferred tax assets on the actuarial reserve.
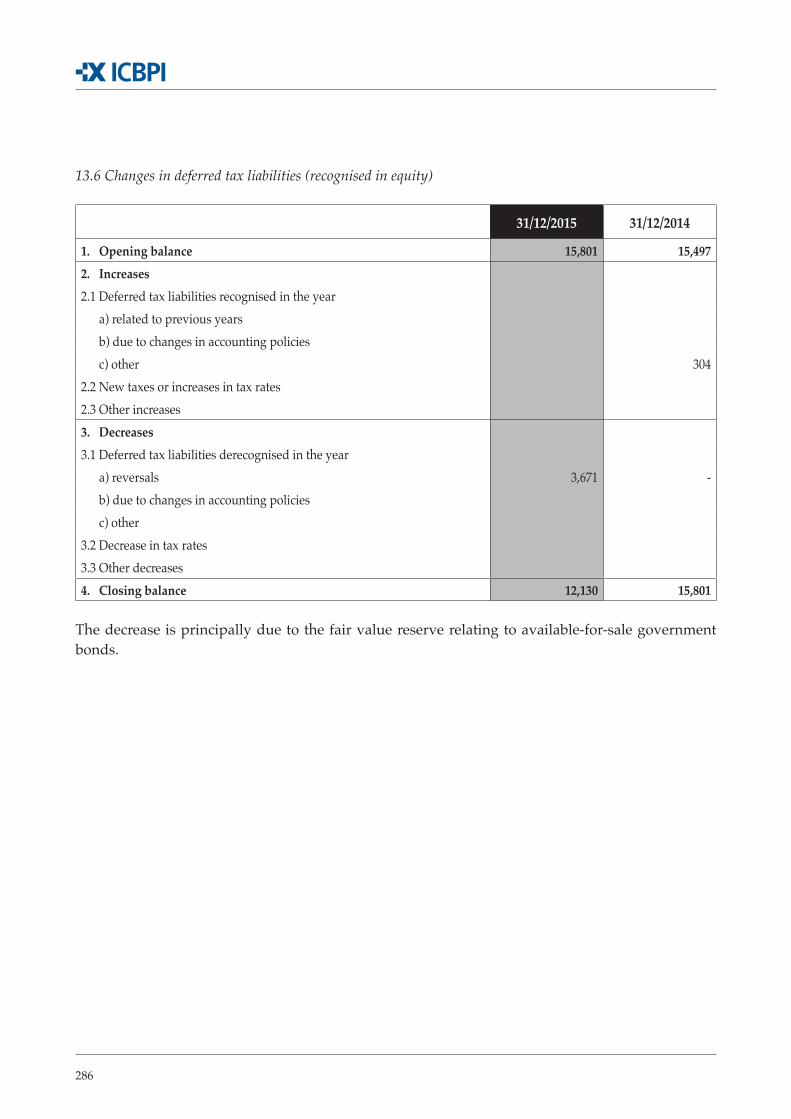
286
13.6 Changes in deferred tax liabilities (recognised in equity)
31/12/2015 31/12/2014
1. Opening balance 15,801 15,497 2. Increases2.1 Deferred tax liabilities recognised in the year a) related to previous years b) due to changes in accounting policies c) other 304 2.2 New taxes or increases in tax rates2.3 Other increases 3. Decreases3.1 Deferred tax liabilities derecognised in the year a) reversals 3,671 - b) due to changes in accounting policies c) other 3.2 Decrease in tax rates3.3 Other decreases 4. Closing balance 12,130 15,801
The decrease is principally due to the fair value reserve relating to available-for-sale government bonds.

287
2015 Reports and Financial Statements
Section 15 - Other assets - Caption 150
15.1 Other assets: breakdown
31/12/2015 31/12/2014
Withholding taxes paid on interest charged to customers and other tax assets 33,743 33,976 Negotiated cheques to be cleared 9,198 7,393 Matured securities and accrued interest to be collected 605 4,466 Commissions and other income to be charged 74,234 72,181
BIREL, transfers, SETIF, received messages to be charged, e-money 70,949 82,436
Sundry and residual items 33,144 18,333
Total 221,873 218,786
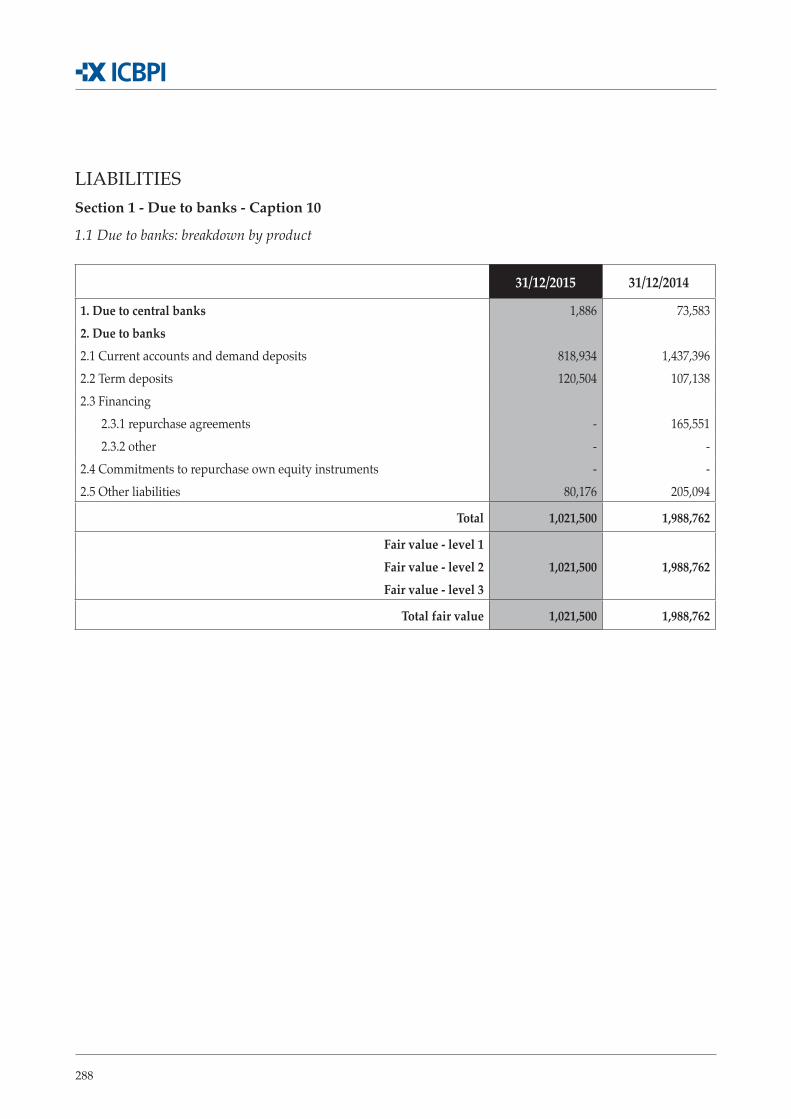
288
LIABILITIESSection 1 - Due to banks - Caption 10
1.1 Due to banks: breakdown by product
31/12/2015 31/12/2014
1. Due to central banks 1,886 73,583 2. Due to banks2.1 Current accounts and demand deposits 818,934 1,437,396 2.2 Term deposits 120,504 107,138 2.3 Financing 2.3.1 repurchase agreements - 165,551 2.3.2 other - - 2.4 Commitments to repurchase own equity instruments - - 2.5 Other liabilities 80,176 205,094
Total 1,021,500 1,988,762
Fair value - level 1Fair value - level 2 1,021,500 1,988,762 Fair value - level 3
Total fair value 1,021,500 1,988,762
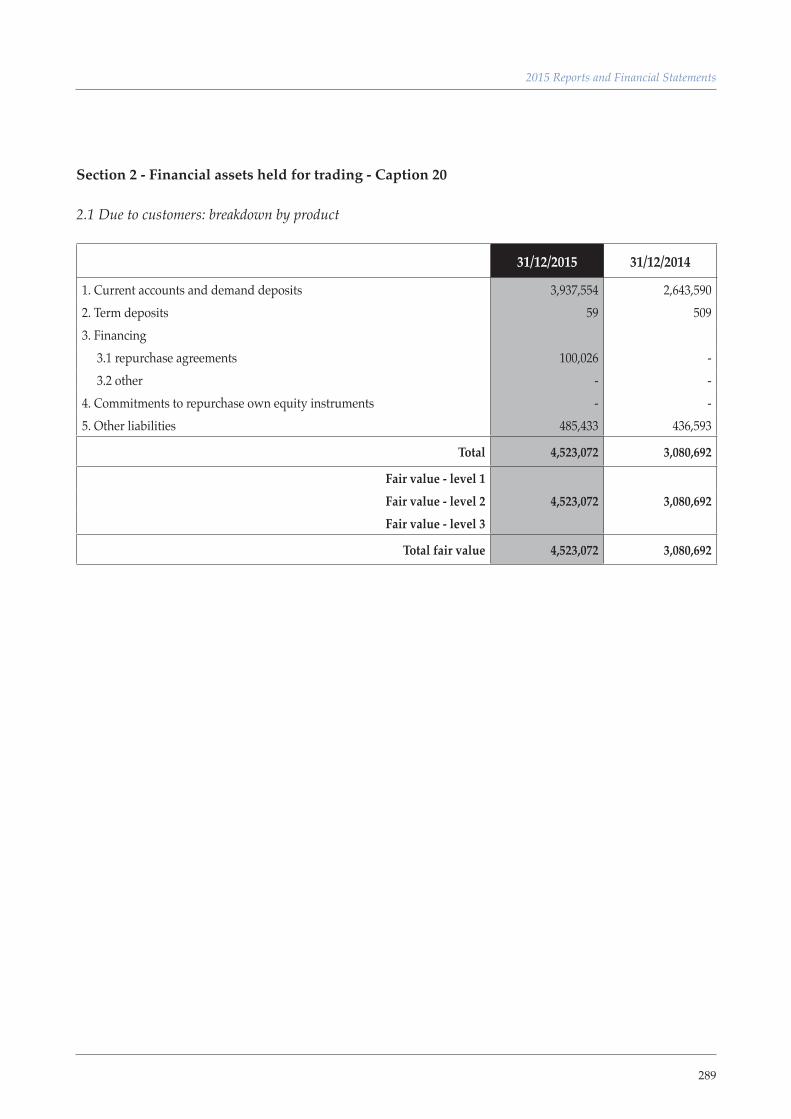
289
2015 Reports and Financial Statements
Section 2 - Financial assets held for trading - Caption 20
2.1 Due to customers: breakdown by product
31/12/2015 31/12/2014
1. Current accounts and demand deposits 3,937,554 2,643,590 2. Term deposits 59 509 3. Financing 3.1 repurchase agreements 100,026 - 3.2 other - - 4. Commitments to repurchase own equity instruments - - 5. Other liabilities 485,433 436,593
Total 4,523,072 3,080,692
Fair value - level 1Fair value - level 2 4,523,072 3,080,692 Fair value - level 3
Total fair value 4,523,072 3,080,692
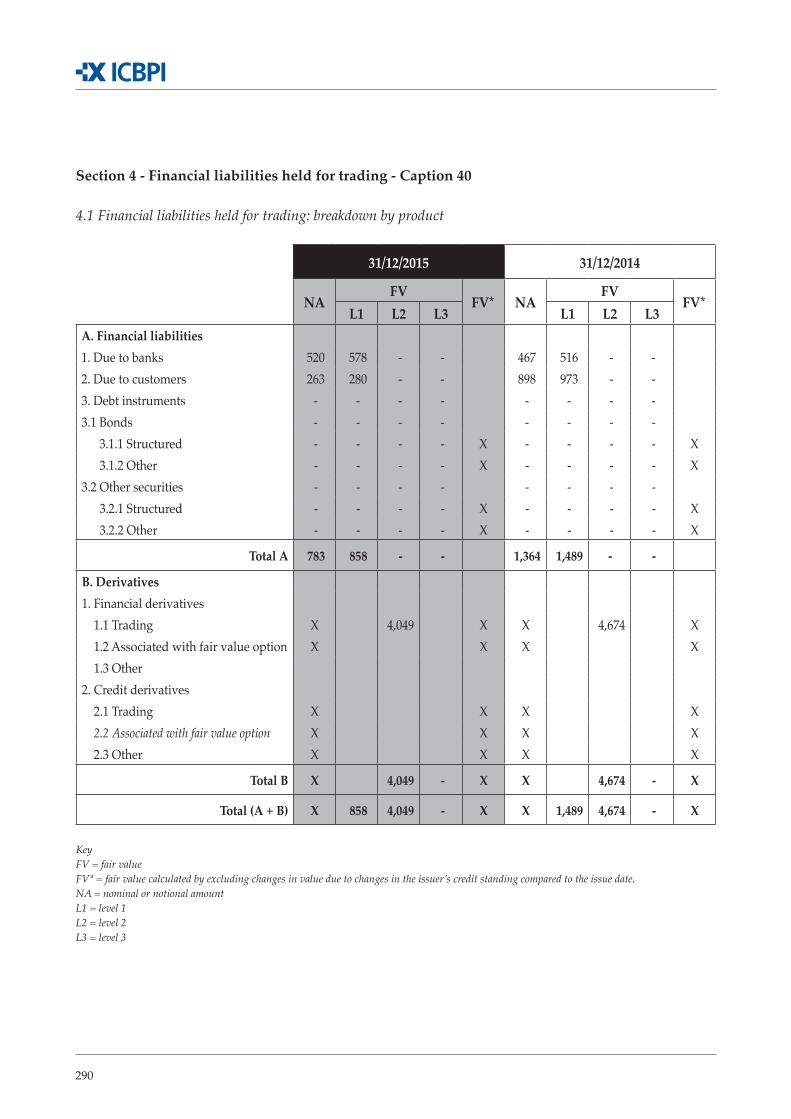
290
Section 4 - Financial liabilities held for trading - Caption 40
4.1 Financial liabilities held for trading: breakdown by product
31/12/2015 31/12/2014
NAFV
FV* NAFV
FV*L1 L2 L3 L1 L2 L3
A. Financial liabilities1. Due to banks 520 578 - - 467 516 - - 2. Due to customers 263 280 - - 898 973 - - 3. Debt instruments - - - - - - - - 3.1 Bonds - - - - - - - - 3.1.1 Structured - - - - X - - - - X 3.1.2 Other - - - - X - - - - X3.2 Other securities - - - - - - - - 3.2.1 Structured - - - - X - - - - X 3.2.2 Other - - - - X - - - - X
Total A 783 858 - - 1,364 1,489 - -
B. Derivatives1. Financial derivatives 1.1 Trading X 4,049 X X 4,674 X 1.2 Associated with fair value option X X X X 1.3 Other 2. Credit derivatives 2.1 Trading X X X X 2.2 Associated with fair value option X X X X 2.3 Other X X X X
Total B X 4,049 - X X 4,674 - X
Total (A + B) X 858 4,049 - X X 1,489 4,674 - X
Key FV = fair value FV* = fair value calculated by excluding changes in value due to changes in the issuer’s credit standing compared to the issue date. NA = nominal or notional amount L1 = level 1 L2 = level 2 L3 = level 3
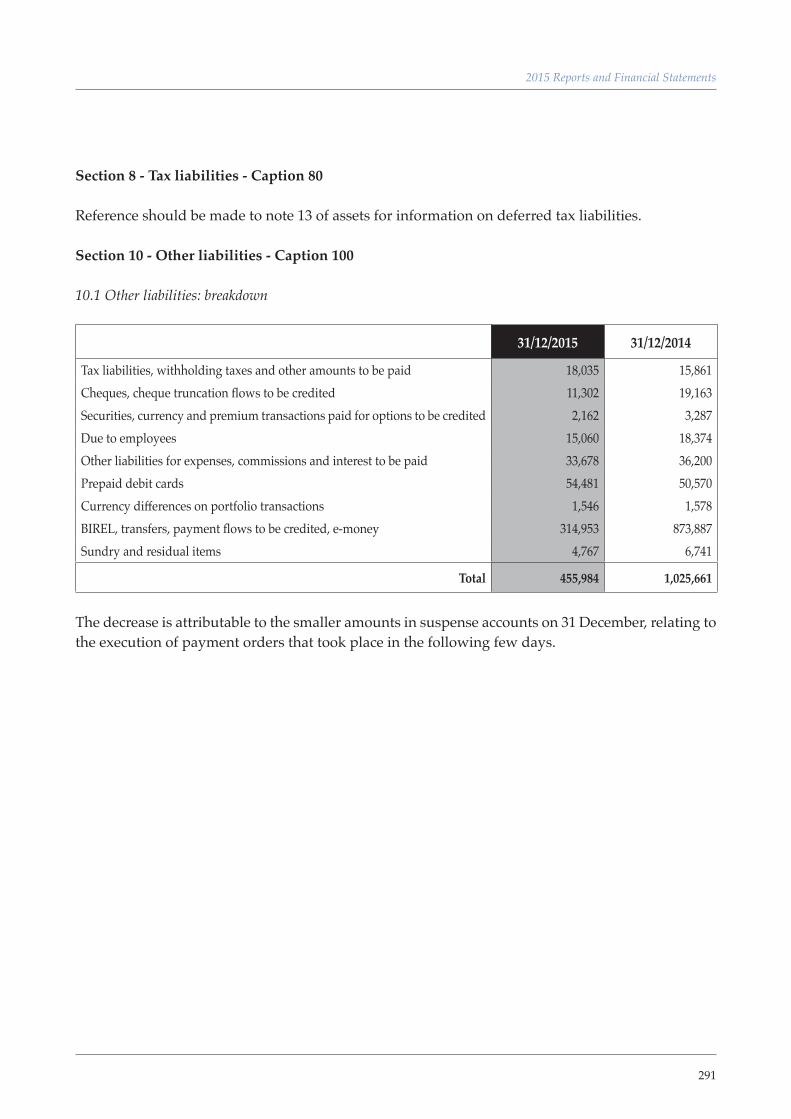
291
2015 Reports and Financial Statements
Section 8 - Tax liabilities - Caption 80
Reference should be made to note 13 of assets for information on deferred tax liabilities.
Section 10 - Other liabilities - Caption 100
10.1 Other liabilities: breakdown
31/12/2015 31/12/2014
Tax liabilities, withholding taxes and other amounts to be paid 18,035 15,861 Cheques, cheque truncation flows to be credited 11,302 19,163 Securities, currency and premium transactions paid for options to be credited 2,162 3,287 Due to employees 15,060 18,374 Other liabilities for expenses, commissions and interest to be paid 33,678 36,200 Prepaid debit cards 54,481 50,570 Currency differences on portfolio transactions 1,546 1,578 BIREL, transfers, payment flows to be credited, e-money 314,953 873,887 Sundry and residual items 4,767 6,741
Total 455,984 1,025,661
The decrease is attributable to the smaller amounts in suspense accounts on 31 December, relating to the execution of payment orders that took place in the following few days.
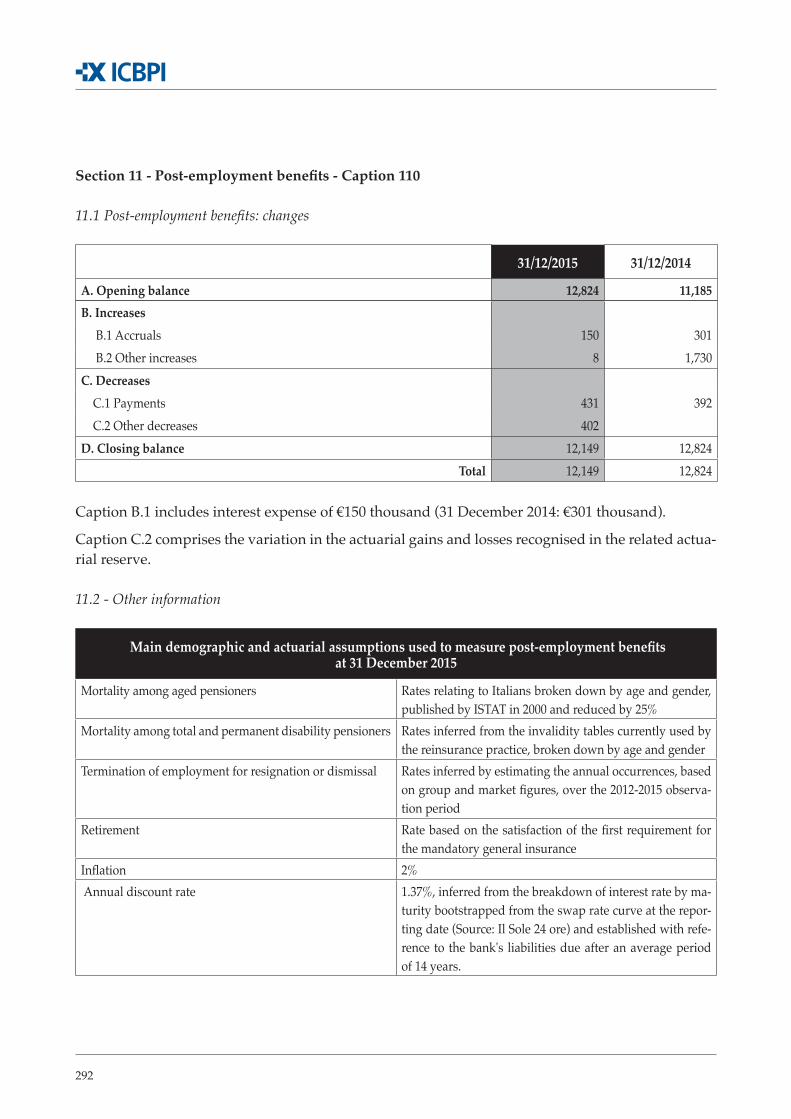
292
Section 11 - Post-employment benefits - Caption 110 11.1 Post-employment benefits: changes
31/12/2015 31/12/2014
A. Opening balance 12,824 11,185 B. Increases B.1 Accruals 150 301 B.2 Other increases 8 1,730 C. Decreases C.1 Payments 431 392 C.2 Other decreases 402 D. Closing balance 12,149 12,824
Total 12,149 12,824
Caption B.1 includes interest expense of €150 thousand (31 December 2014: €301 thousand).
Caption C.2 comprises the variation in the actuarial gains and losses recognised in the related actua-rial reserve.
11.2 - Other information
Main demographic and actuarial assumptions used to measure post-employment benefits at 31 December 2015
Mortality among aged pensioners Rates relating to Italians broken down by age and gender, published by ISTAT in 2000 and reduced by 25%
Mortality among total and permanent disability pensioners Rates inferred from the invalidity tables currently used by the reinsurance practice, broken down by age and gender
Termination of employment for resignation or dismissal Rates inferred by estimating the annual occurrences, based on group and market figures, over the 2012-2015 observa-tion period
Retirement Rate based on the satisfaction of the first requirement for the mandatory general insurance
Inflation 2% Annual discount rate 1.37%, inferred from the breakdown of interest rate by ma-
turity bootstrapped from the swap rate curve at the repor-ting date (Source: Il Sole 24 ore) and established with refe-rence to the bank's liabilities due after an average period of 14 years.
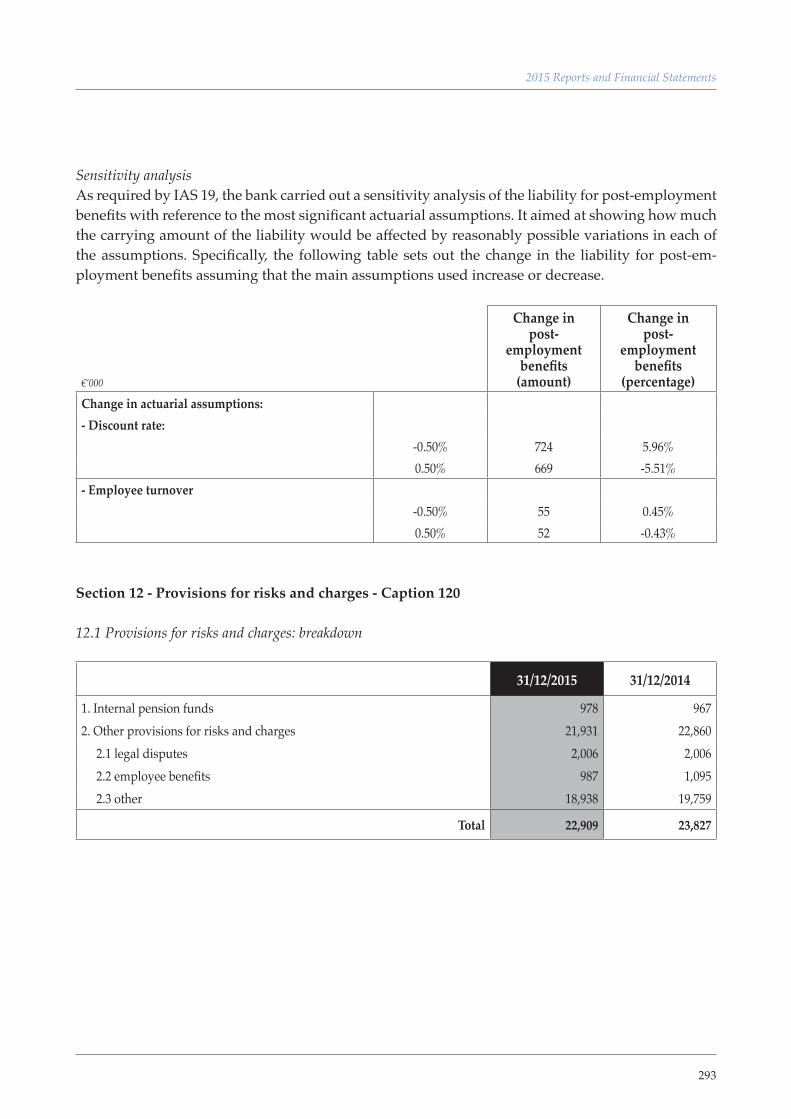
293
2015 Reports and Financial Statements
Sensitivity analysisAs required by IAS 19, the bank carried out a sensitivity analysis of the liability for post-employment benefits with reference to the most significant actuarial assumptions. It aimed at showing how much the carrying amount of the liability would be affected by reasonably possible variations in each of the assumptions. Specifically, the following table sets out the change in the liability for post-em-ployment benefits assuming that the main assumptions used increase or decrease.
€’000
Change in post-
employment benefits
(amount)
Change in post-
employment benefits
(percentage) Change in actuarial assumptions: - Discount rate:
-0.50% 724 5.96%0.50% 669 -5.51%
- Employee turnover -0.50% 55 0.45%0.50% 52 -0.43%
Section 12 - Provisions for risks and charges - Caption 120
12.1 Provisions for risks and charges: breakdown
31/12/2015 31/12/2014
1. Internal pension funds 978 9672. Other provisions for risks and charges 21,931 22,860 2.1 legal disputes 2,006 2,006 2.2 employee benefits 987 1,095 2.3 other 18,938 19,759
Total 22,909 23,827
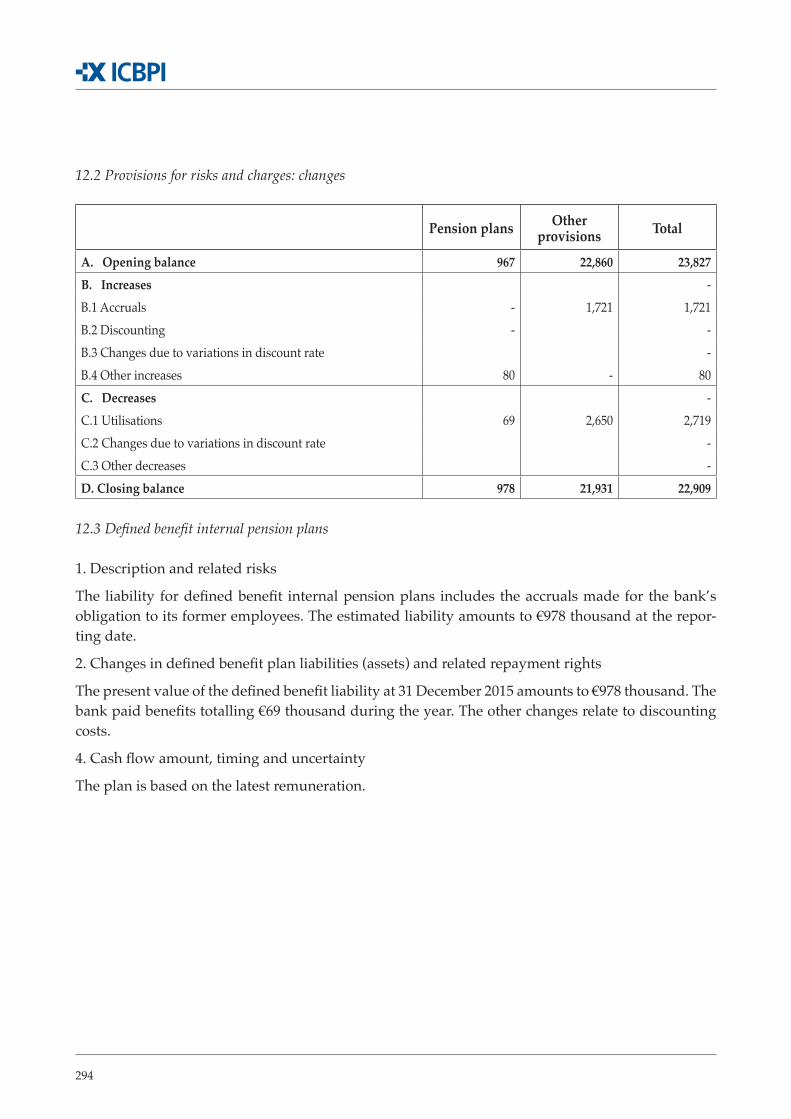
294
12.2 Provisions for risks and charges: changes
Pension plans Other provisions Total
A. Opening balance 967 22,860 23,827B. Increases - B.1 Accruals - 1,721 1,721 B.2 Discounting - - B.3 Changes due to variations in discount rate - B.4 Other increases 80 - 80 C. Decreases - C.1 Utilisations 69 2,650 2,719 C.2 Changes due to variations in discount rate - C.3 Other decreases - D. Closing balance 978 21,931 22,909
12.3 Defined benefit internal pension plans
1. Description and related risks
The liability for defined benefit internal pension plans includes the accruals made for the bank’s obligation to its former employees. The estimated liability amounts to €978 thousand at the repor-ting date.
2. Changes in defined benefit plan liabilities (assets) and related repayment rights
The present value of the defined benefit liability at 31 December 2015 amounts to €978 thousand. The bank paid benefits totalling €69 thousand during the year. The other changes relate to discounting costs.
4. Cash flow amount, timing and uncertainty
The plan is based on the latest remuneration.
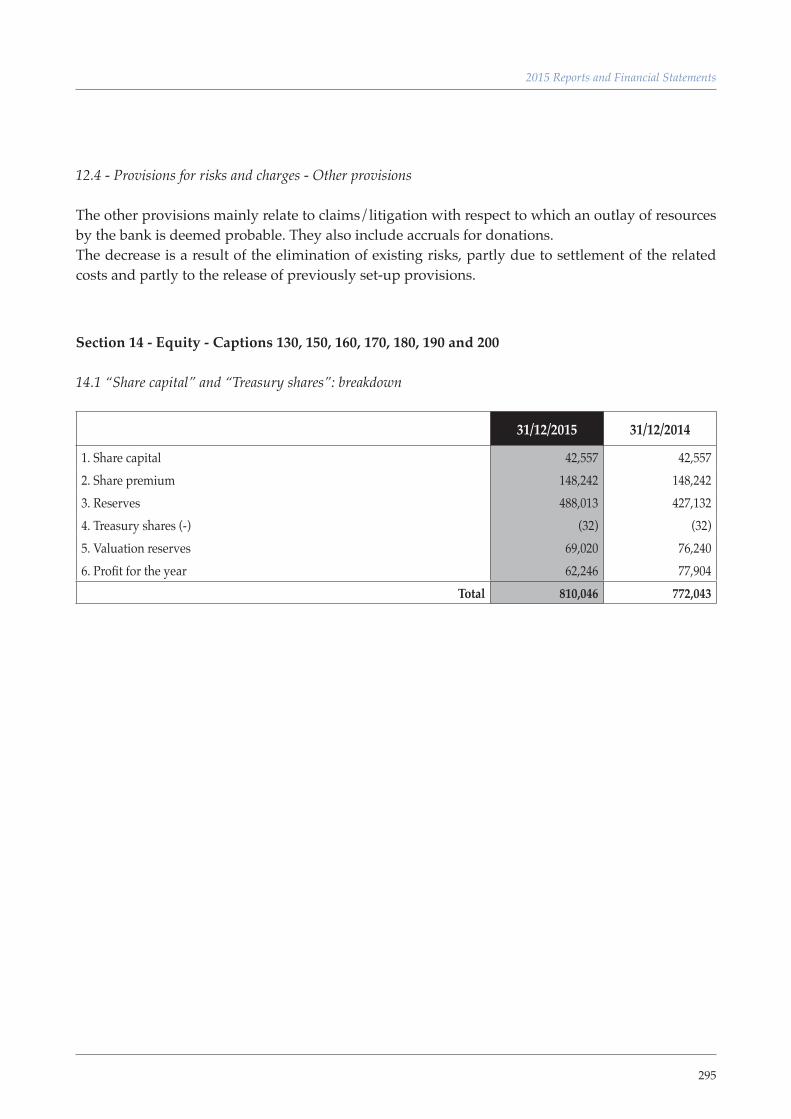
295
2015 Reports and Financial Statements
12.4 - Provisions for risks and charges - Other provisions
The other provisions mainly relate to claims/litigation with respect to which an outlay of resources by the bank is deemed probable. They also include accruals for donations.The decrease is a result of the elimination of existing risks, partly due to settlement of the related costs and partly to the release of previously set-up provisions.
Section 14 - Equity - Captions 130, 150, 160, 170, 180, 190 and 200 14.1 “Share capital” and “Treasury shares”: breakdown
31/12/2015 31/12/2014
1. Share capital 42,557 42,557 2. Share premium 148,242 148,242 3. Reserves 488,013 427,132 4. Treasury shares (-) (32) (32)5. Valuation reserves 69,020 76,240 6. Profit for the year 62,246 77,904
Total 810,046 772,043

296
14.2 Share capital - number of shares: changes
Ordinary Other
A. Opening balance - fully paid-in 14,185,790 - not fully paid-in A.1 Treasury shares (-) 75,191 A.2 Outstanding shares: opening balance 14,110,599 B. Increases B.1 New issues - against consideration: - business combinations - bond conversions - exercise of warrants - other - bonus issues: - to employees - to directors - other B.2 Sale of treasury sharesB.3 Other increases C. Decreases C.1 Cancellations C.2 Repurchases of treasury sharesC3 Disposals of equity investmentsC.4 Other decreases D. Outstanding shares: closing balance 14,110,599 D.1 Treasury shares (+) 75,191 D.2 Closing balance 14,185,790 - fully paid-in 14,185,790 - not fully paid-in
The outstanding and fully paid-in shares number 14,185,790, while treasury shares in portfolio amount to 75,191.
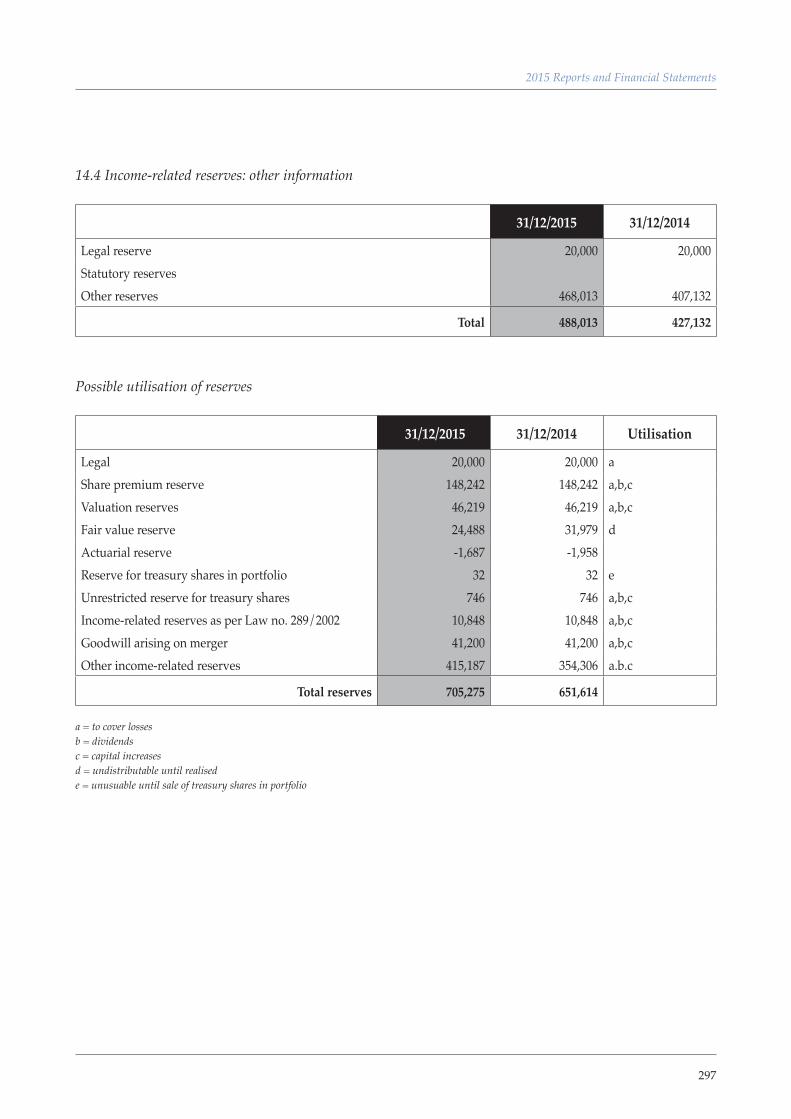
297
2015 Reports and Financial Statements
14.4 Income-related reserves: other information
31/12/2015 31/12/2014
Legal reserve 20,000 20,000 Statutory reservesOther reserves 468,013 407,132
Total 488,013 427,132
Possible utilisation of reserves
31/12/2015 31/12/2014 Utilisation
Legal 20,000 20,000 aShare premium reserve 148,242 148,242 a,b,cValuation reserves 46,219 46,219 a,b,cFair value reserve 24,488 31,979 dActuarial reserve -1,687 -1,958Reserve for treasury shares in portfolio 32 32 eUnrestricted reserve for treasury shares 746 746 a,b,cIncome-related reserves as per Law no. 289/2002 10,848 10,848 a,b,cGoodwill arising on merger 41,200 41,200 a,b,cOther income-related reserves 415,187 354,306 a.b.c
Total reserves 705,275 651,614
a = to cover losses b = dividends c = capital increases d = undistributable until realised e = unusuable until sale of treasury shares in portfolio
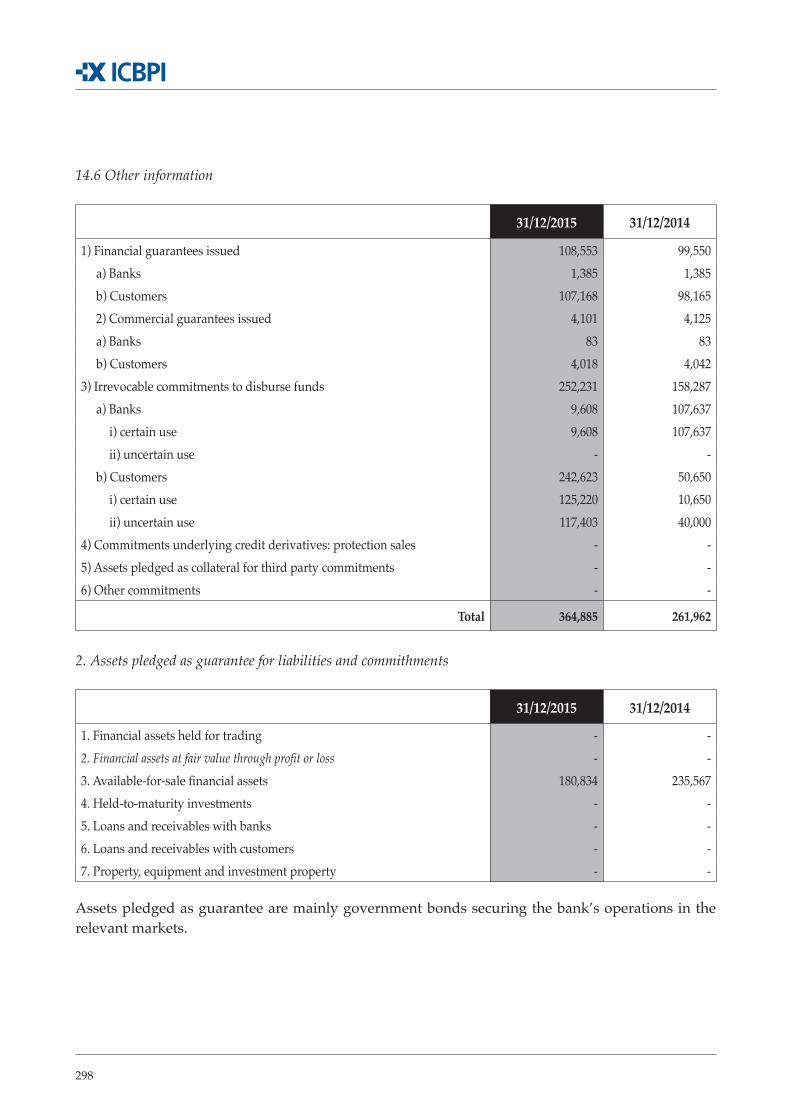
298
14.6 Other information
31/12/2015 31/12/2014
1) Financial guarantees issued 108,553 99,550 a) Banks 1,385 1,385 b) Customers 107,168 98,165 2) Commercial guarantees issued 4,101 4,125 a) Banks 83 83 b) Customers 4,018 4,042
3) Irrevocable commitments to disburse funds 252,231 158,287 a) Banks 9,608 107,637
i) certain use 9,608 107,637 ii) uncertain use - -
b) Customers 242,623 50,650 i) certain use 125,220 10,650 ii) uncertain use 117,403 40,000
4) Commitments underlying credit derivatives: protection sales - - 5) Assets pledged as collateral for third party commitments - - 6) Other commitments - -
Total 364,885 261,962
2. Assets pledged as guarantee for liabilities and commithments
31/12/2015 31/12/2014
1. Financial assets held for trading - - 2. Financial assets at fair value through profit or loss - - 3. Available-for-sale financial assets 180,834 235,567 4. Held-to-maturity investments - - 5. Loans and receivables with banks - - 6. Loans and receivables with customers - - 7. Property, equipment and investment property - -
Assets pledged as guarantee are mainly government bonds securing the bank’s operations in the relevant markets.
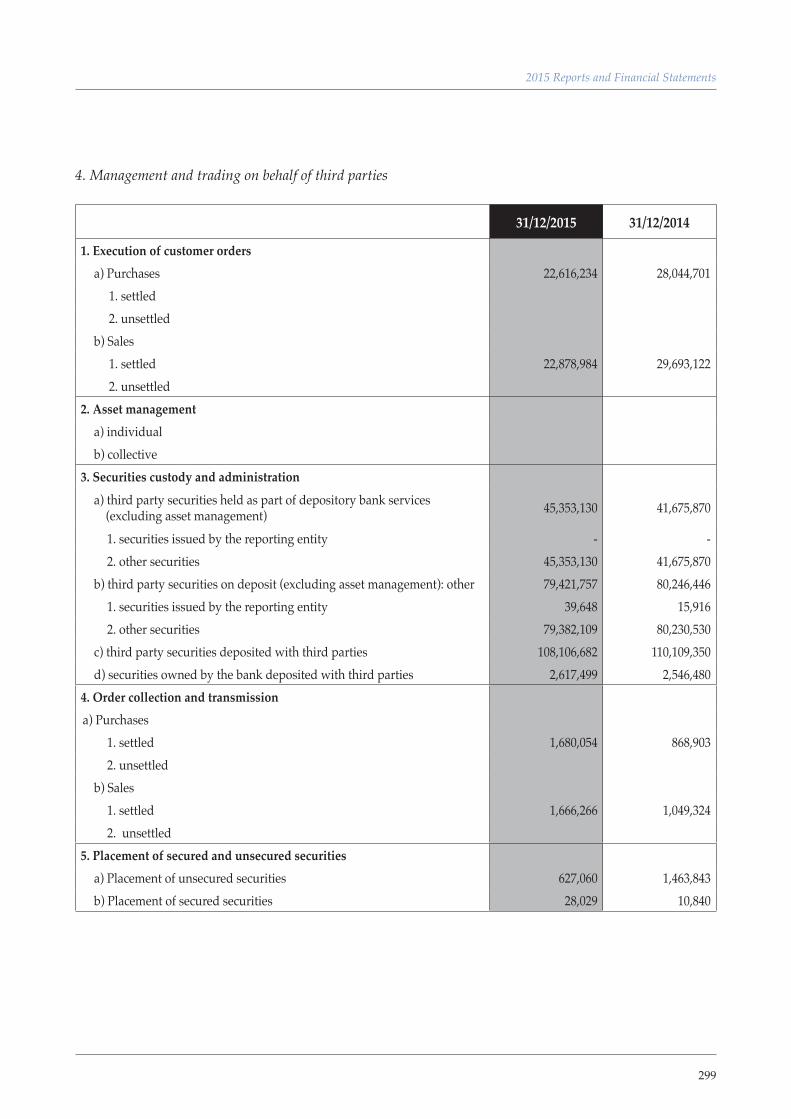
299
2015 Reports and Financial Statements
4. Management and trading on behalf of third parties
31/12/2015 31/12/2014
1. Execution of customer ordersa) Purchases 22,616,234 28,044,701
1. settled2. unsettled
b) Sales1. settled 22,878,984 29,693,122 2. unsettled
2. Asset managementa) individualb) collective
3. Securities custody and administration
a) third party securities held as part of depository bank services (excluding asset management) 45,353,130 41,675,870
1. securities issued by the reporting entity - -2. other securities 45,353,130 41,675,870
b) third party securities on deposit (excluding asset management): other 79,421,757 80,246,446 1. securities issued by the reporting entity 39,648 15,916 2. other securities 79,382,109 80,230,530
c) third party securities deposited with third parties 108,106,682 110,109,350 d) securities owned by the bank deposited with third parties 2,617,499 2,546,480
4. Order collection and transmission a) Purchases
1. settled 1,680,054 868,903 2. unsettled
b) Sales1. settled 1,666,266 1,049,324 2. unsettled
5. Placement of secured and unsecured securities a) Placement of unsecured securities 627,060 1,463,843 b) Placement of secured securities 28,029 10,840
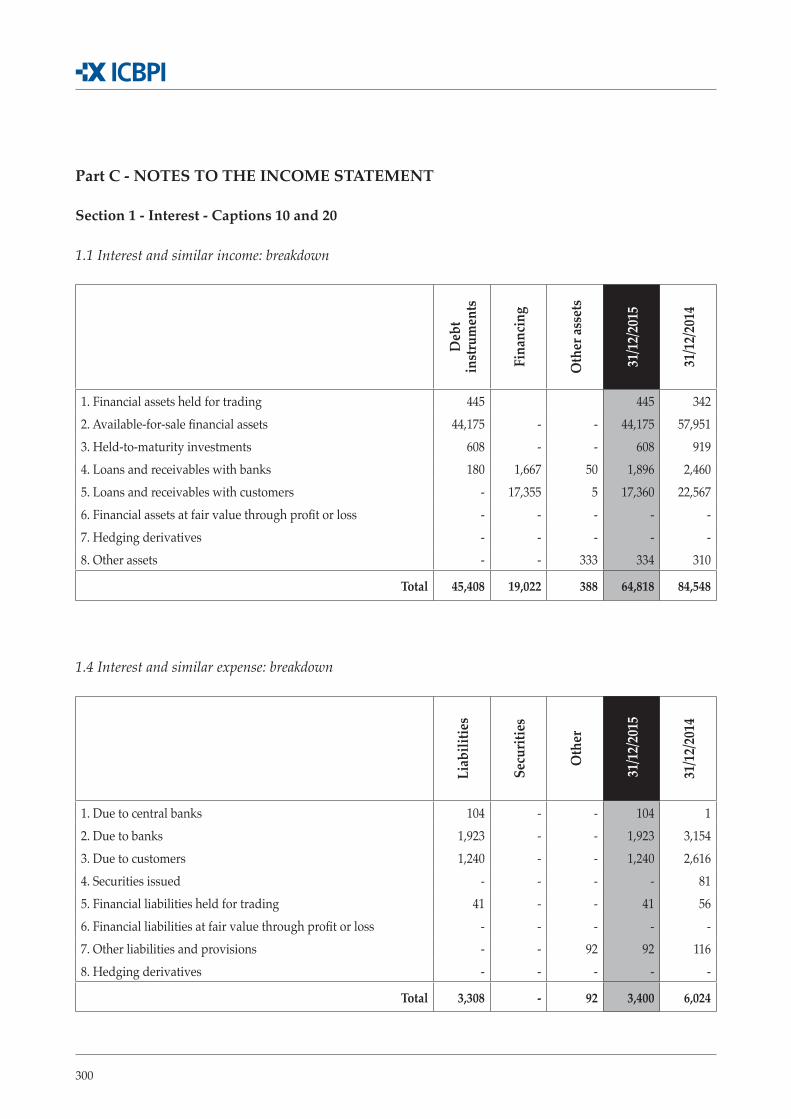
300
Part C - NOTES TO THE INCOME STATEMENT
Section 1 - Interest - Captions 10 and 20
1.1 Interest and similar income: breakdown
Deb
t in
stru
men
ts
Fina
ncin
g
Oth
er as
sets
31/1
2/20
15
31/1
2/20
14
1. Financial assets held for trading 445 445 342 2. Available-for-sale financial assets 44,175 - - 44,175 57,951 3. Held-to-maturity investments 608 - - 608 919 4. Loans and receivables with banks 180 1,667 50 1,896 2,460 5. Loans and receivables with customers - 17,355 5 17,360 22,567 6. Financial assets at fair value through profit or loss - - - - - 7. Hedging derivatives - - - - - 8. Other assets - - 333 334 310
Total 45,408 19,022 388 64,818 84,548
1.4 Interest and similar expense: breakdown
Liab
ilitie
s
Secu
ritie
s
Oth
er
31/1
2/20
15
31/1
2/20
14
1. Due to central banks 104 - - 104 1 2. Due to banks 1,923 - - 1,923 3,154 3. Due to customers 1,240 - - 1,240 2,616 4. Securities issued - - - - 81 5. Financial liabilities held for trading 41 - - 41 56 6. Financial liabilities at fair value through profit or loss - - - - - 7. Other liabilities and provisions - - 92 92 116 8. Hedging derivatives - - - - -
Total 3,308 - 92 3,400 6,024
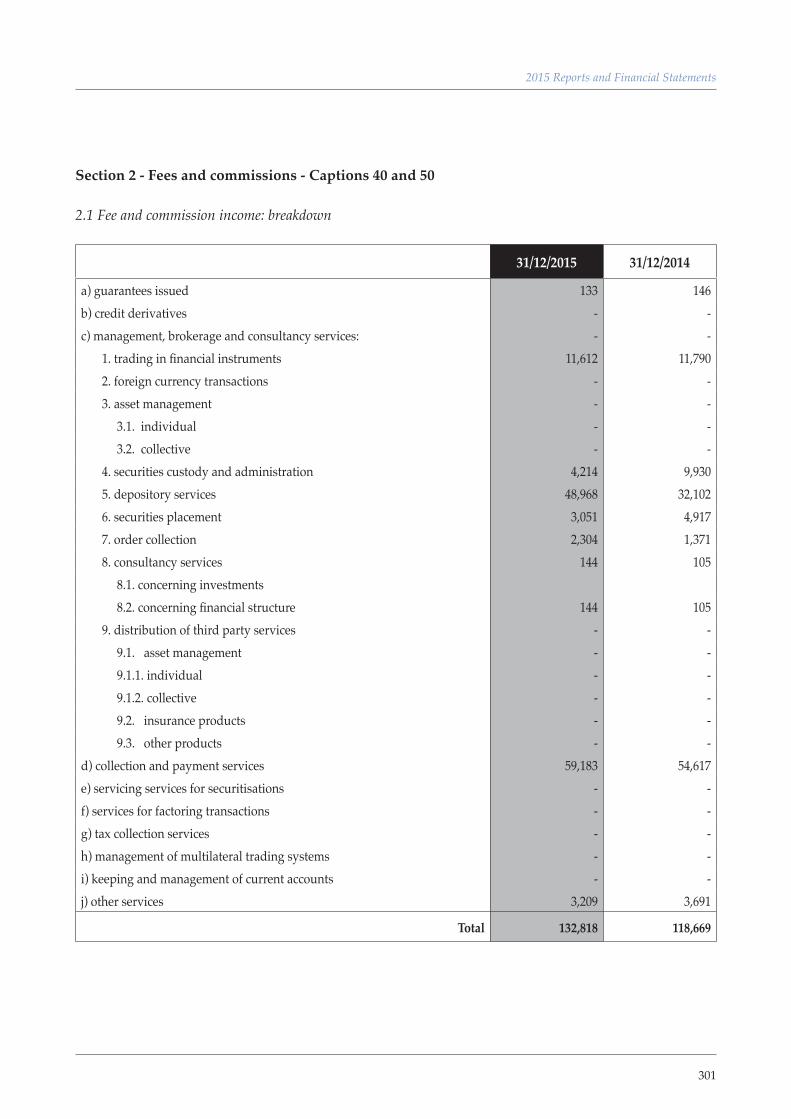
301
2015 Reports and Financial Statements
Section 2 - Fees and commissions - Captions 40 and 50
2.1 Fee and commission income: breakdown
31/12/2015 31/12/2014
a) guarantees issued 133 146 b) credit derivatives - - c) management, brokerage and consultancy services: - - 1. trading in financial instruments 11,612 11,790 2. foreign currency transactions - - 3. asset management - - 3.1. individual - - 3.2. collective - - 4. securities custody and administration 4,214 9,930 5. depository services 48,968 32,102 6. securities placement 3,051 4,917 7. order collection 2,304 1,371 8. consultancy services 144 105 8.1. concerning investments 8.2. concerning financial structure 144 105 9. distribution of third party services - - 9.1. asset management - - 9.1.1. individual - - 9.1.2. collective - - 9.2. insurance products - - 9.3. other products - - d) collection and payment services 59,183 54,617 e) servicing services for securitisations - - f) services for factoring transactions - - g) tax collection services - - h) management of multilateral trading systems - - i) keeping and management of current accounts - - j) other services 3,209 3,691
Total 132,818 118,669
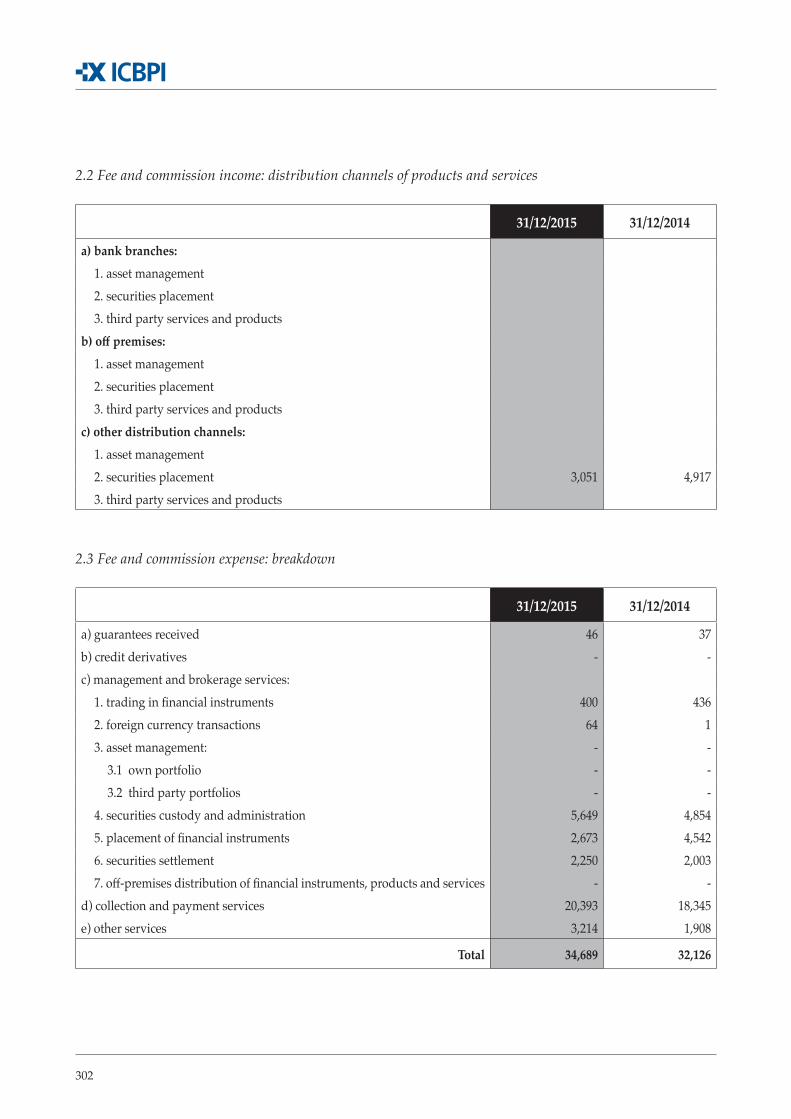
302
2.2 Fee and commission income: distribution channels of products and services
31/12/2015 31/12/2014
a) bank branches:1. asset management2. securities placement3. third party services and products
b) off premises:1. asset management2. securities placement3. third party services and products
c) other distribution channels:1. asset management2. securities placement 3,051 4,9173. third party services and products
2.3 Fee and commission expense: breakdown
31/12/2015 31/12/2014
a) guarantees received 46 37 b) credit derivatives - - c) management and brokerage services:
1. trading in financial instruments 400 436 2. foreign currency transactions 64 1 3. asset management: - -
3.1 own portfolio - - 3.2 third party portfolios - -
4. securities custody and administration 5,649 4,854 5. placement of financial instruments 2,673 4,542 6. securities settlement 2,250 2,003 7. off-premises distribution of financial instruments, products and services - -
d) collection and payment services 20,393 18,345 e) other services 3,214 1,908
Total 34,689 32,126
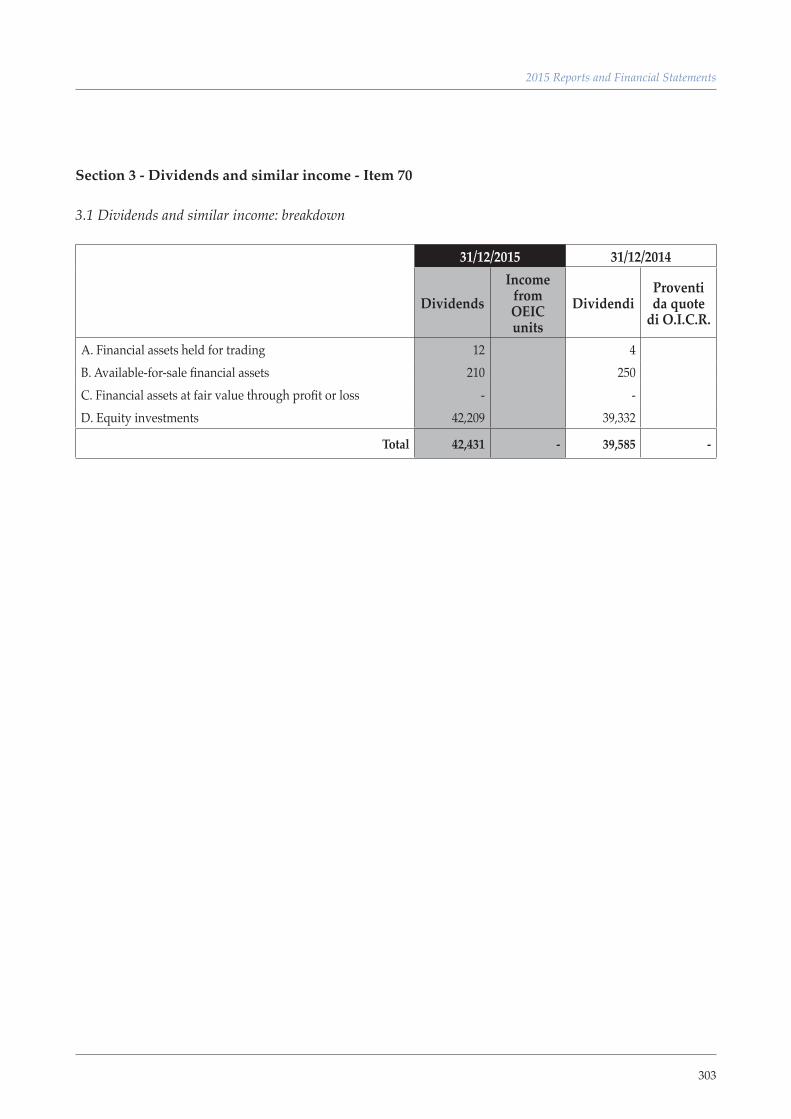
303
2015 Reports and Financial Statements
Section 3 - Dividends and similar income - Item 70
3.1 Dividends and similar income: breakdown
31/12/2015 31/12/2014
DividendsIncome
from OEIC units
DividendiProventi da quote
di O.I.C.R.
A. Financial assets held for trading 12 4 B. Available-for-sale financial assets 210 250 C. Financial assets at fair value through profit or loss - - D. Equity investments 42,209 39,332
Total 42,431 - 39,585 -
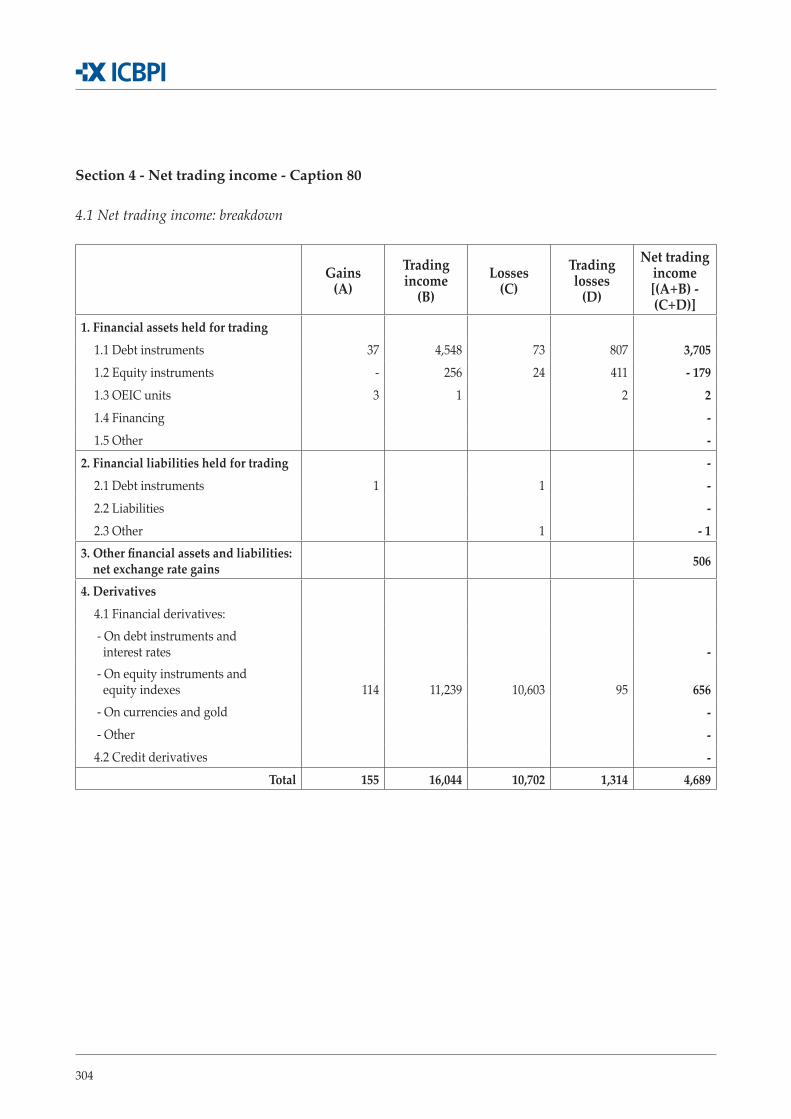
304
Section 4 - Net trading income - Caption 80
4.1 Net trading income: breakdown
Gains(A)
Trading income
(B)Losses
(C)Trading losses
(D)
Net trading income [(A+B) - (C+D)]
1. Financial assets held for trading1.1 Debt instruments 37 4,548 73 807 3,705 1.2 Equity instruments - 256 24 411 - 179 1.3 OEIC units 3 1 2 2 1.4 Financing - 1.5 Other -
2. Financial liabilities held for trading - 2.1 Debt instruments 1 1 - 2.2 Liabilities - 2.3 Other 1 - 1
3. Other financial assets and liabilities: net exchange rate gains 506
4. Derivatives4.1 Financial derivatives: - On debt instruments and interest rates - - On equity instruments and equity indexes 114 11,239 10,603 95 656 - On currencies and gold - - Other - 4.2 Credit derivatives -
Total 155 16,044 10,702 1,314 4,689
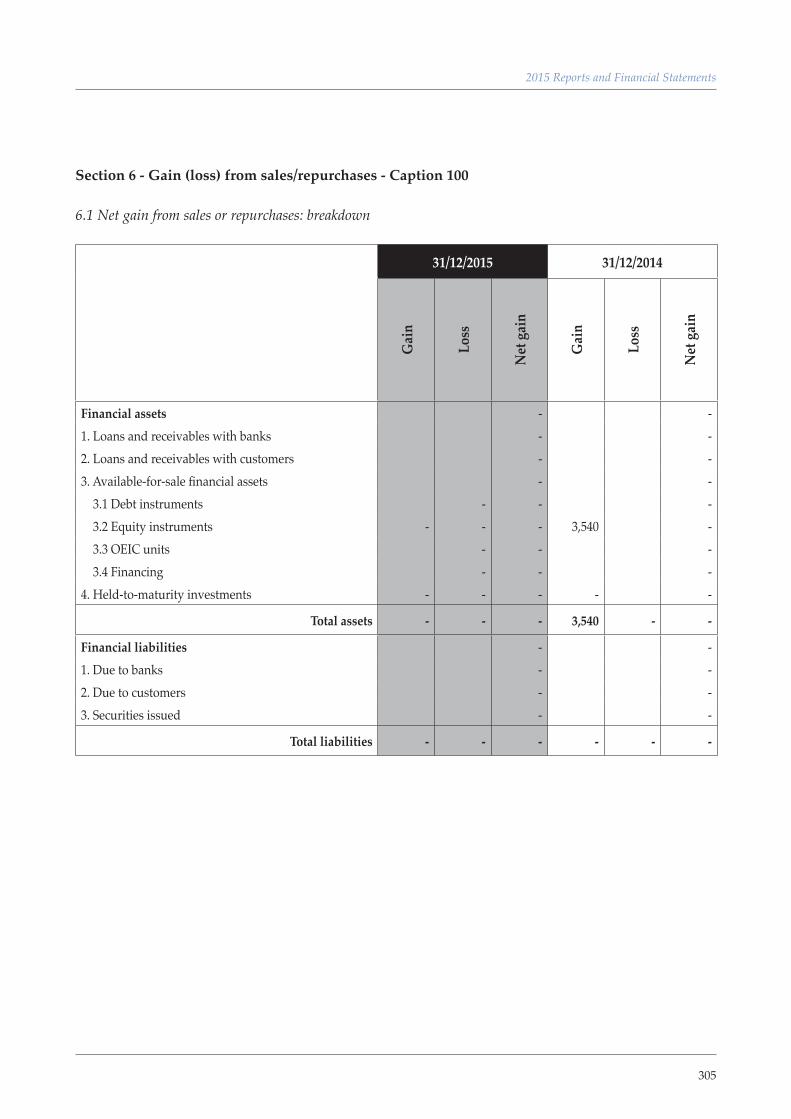
305
2015 Reports and Financial Statements
Section 6 - Gain (loss) from sales/repurchases - Caption 100
6.1 Net gain from sales or repurchases: breakdown
31/12/2015 31/12/2014
Gai
n
Loss
Net
gai
n
Gai
n
Loss
Net
gai
n
Financial assets - - 1. Loans and receivables with banks - - 2. Loans and receivables with customers - - 3. Available-for-sale financial assets - - 3.1 Debt instruments - - - 3.2 Equity instruments - - - 3,540 - 3.3 OEIC units - - - 3.4 Financing - - - 4. Held-to-maturity investments - - - - -
Total assets - - - 3,540 - -
Financial liabilities - - 1. Due to banks - - 2. Due to customers - - 3. Securities issued - -
Total liabilities - - - - - -
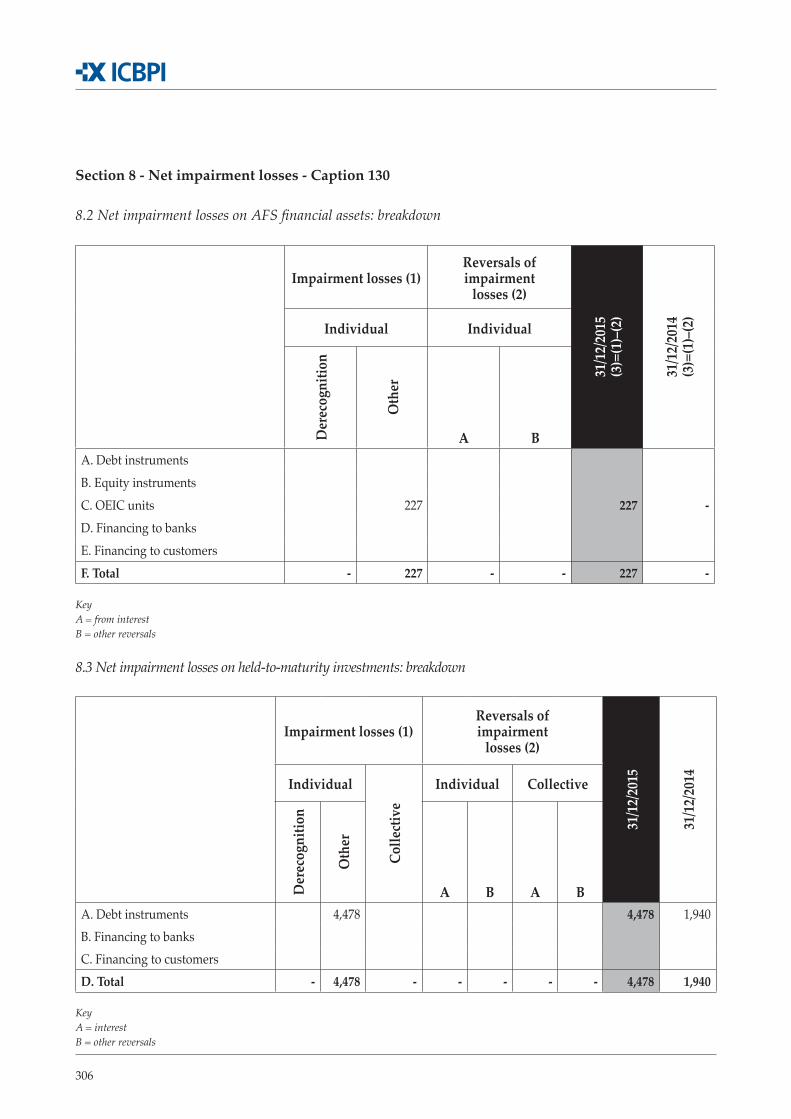
306
Section 8 - Net impairment losses - Caption 130 8.2 Net impairment losses on AFS financial assets: breakdown
Impairment losses (1)Reversals of impairment
losses (2)
31/1
2/20
15(3
)=(1
)–(2
)
31/1
2/20
14(3
)=(1
)–(2
)
Individual IndividualD
erec
ogni
tion
Oth
er
A BA. Debt instrumentsB. Equity instruments C. OEIC units 227 227 -D. Financing to banks E. Financing to customersF. Total - 227 - - 227 -
KeyA = from interestB = other reversals
8.3 Net impairment losses on held-to-maturity investments: breakdown
Impairment losses (1)Reversals of impairment
losses (2)
31/1
2/20
15
31/1
2/20
14Individual
Colle
ctiv
e
Individual Collective
Der
ecog
nitio
n
Oth
er
A B A BA. Debt instruments 4,478 4,478 1,940B. Financing to banks C. Financing to customersD. Total - 4,478 - - - - - 4,478 1,940
KeyA = interestB = other reversals
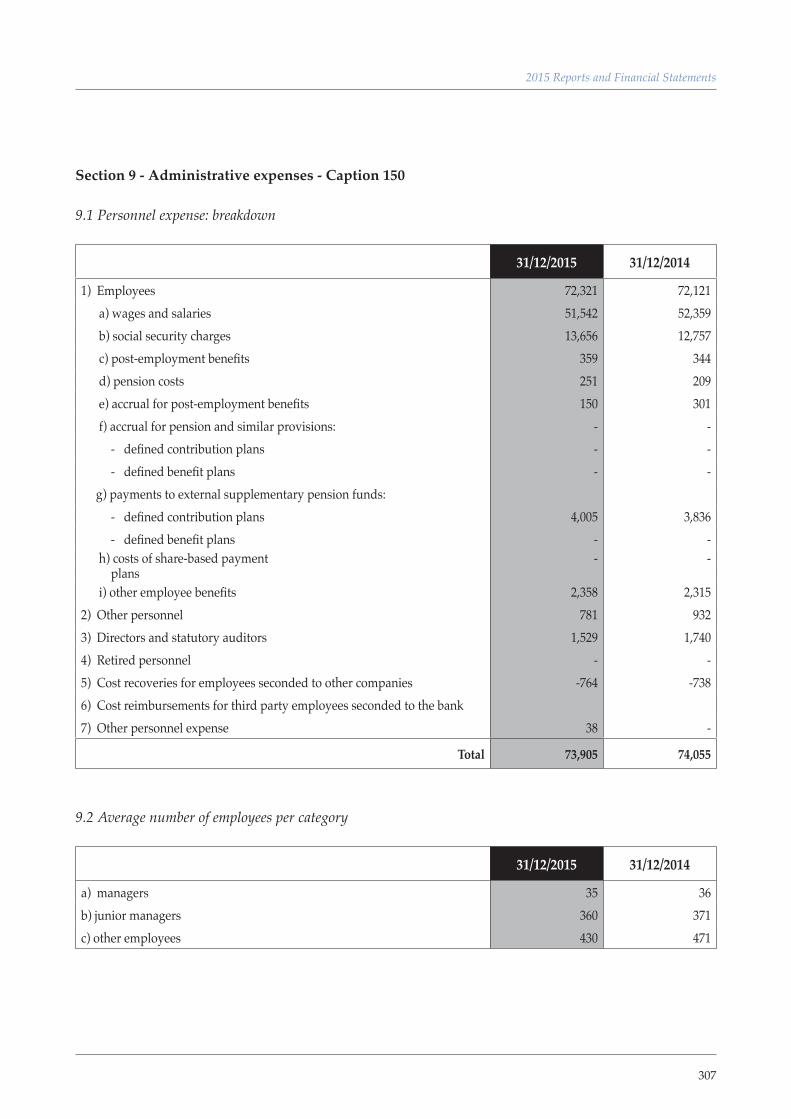
307
2015 Reports and Financial Statements
Section 9 - Administrative expenses - Caption 150
9.1 Personnel expense: breakdown
31/12/2015 31/12/2014
1) Employees 72,321 72,121 a) wages and salaries 51,542 52,359 b) social security charges 13,656 12,757 c) post-employment benefits 359 344 d) pension costs 251 209 e) accrual for post-employment benefits 150 301 f) accrual for pension and similar provisions: - - - defined contribution plans - - - defined benefit plans - - g) payments to external supplementary pension funds: - defined contribution plans 4,005 3,836 - defined benefit plans - - h) costs of share-based payment - - plans i) other employee benefits 2,358 2,315 2) Other personnel 781 932 3) Directors and statutory auditors 1,529 1,740 4) Retired personnel - - 5) Cost recoveries for employees seconded to other companies -764 -738 6) Cost reimbursements for third party employees seconded to the bank7) Other personnel expense 38 -
Total 73,905 74,055
9.2 Average number of employees per category
31/12/2015 31/12/2014
a) managers 35 36 b) junior managers 360 371 c) other employees 430 471
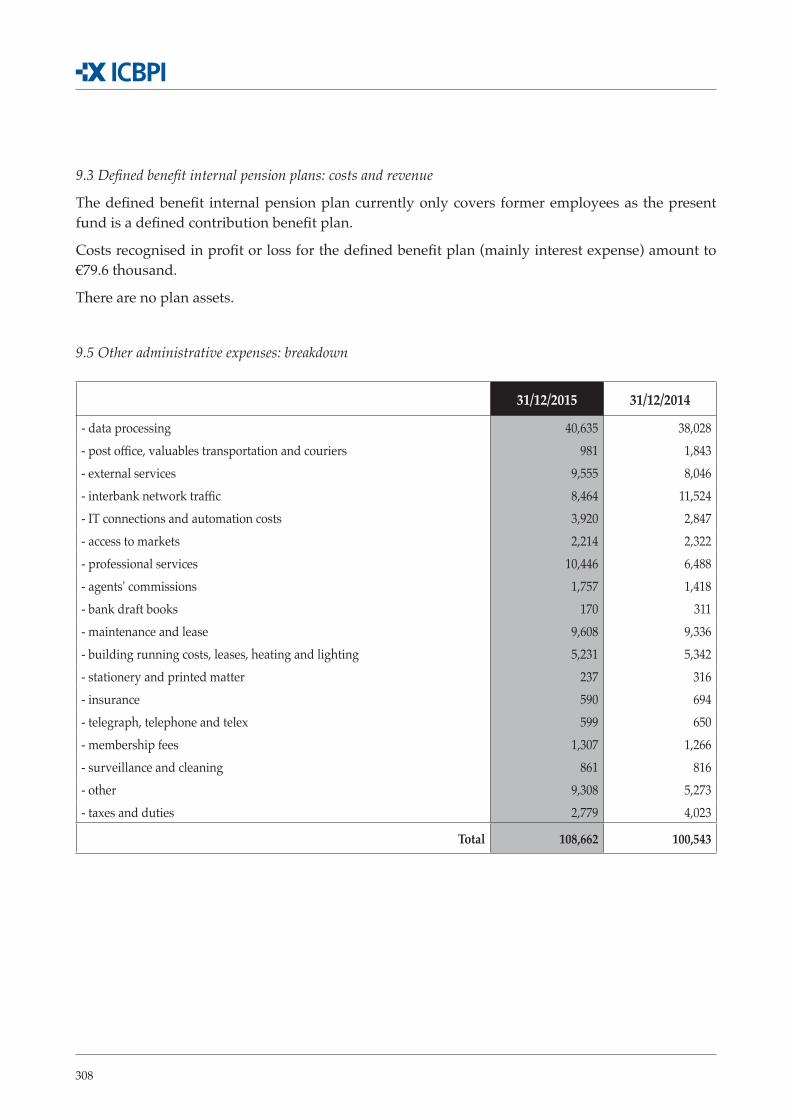
308
9.3 Defined benefit internal pension plans: costs and revenue
The defined benefit internal pension plan currently only covers former employees as the present fund is a defined contribution benefit plan.
Costs recognised in profit or loss for the defined benefit plan (mainly interest expense) amount to €79.6 thousand.
There are no plan assets.
9.5 Other administrative expenses: breakdown
31/12/2015 31/12/2014
- data processing 40,635 38,028 - post office, valuables transportation and couriers 981 1,843 - external services 9,555 8,046 - interbank network traffic 8,464 11,524 - IT connections and automation costs 3,920 2,847 - access to markets 2,214 2,322 - professional services 10,446 6,488 - agents' commissions 1,757 1,418 - bank draft books 170 311 - maintenance and lease 9,608 9,336 - building running costs, leases, heating and lighting 5,231 5,342 - stationery and printed matter 237 316 - insurance 590 694 - telegraph, telephone and telex 599 650 - membership fees 1,307 1,266 - surveillance and cleaning 861 816 - other 9,308 5,273 - taxes and duties 2,779 4,023
Total 108,662 100,543
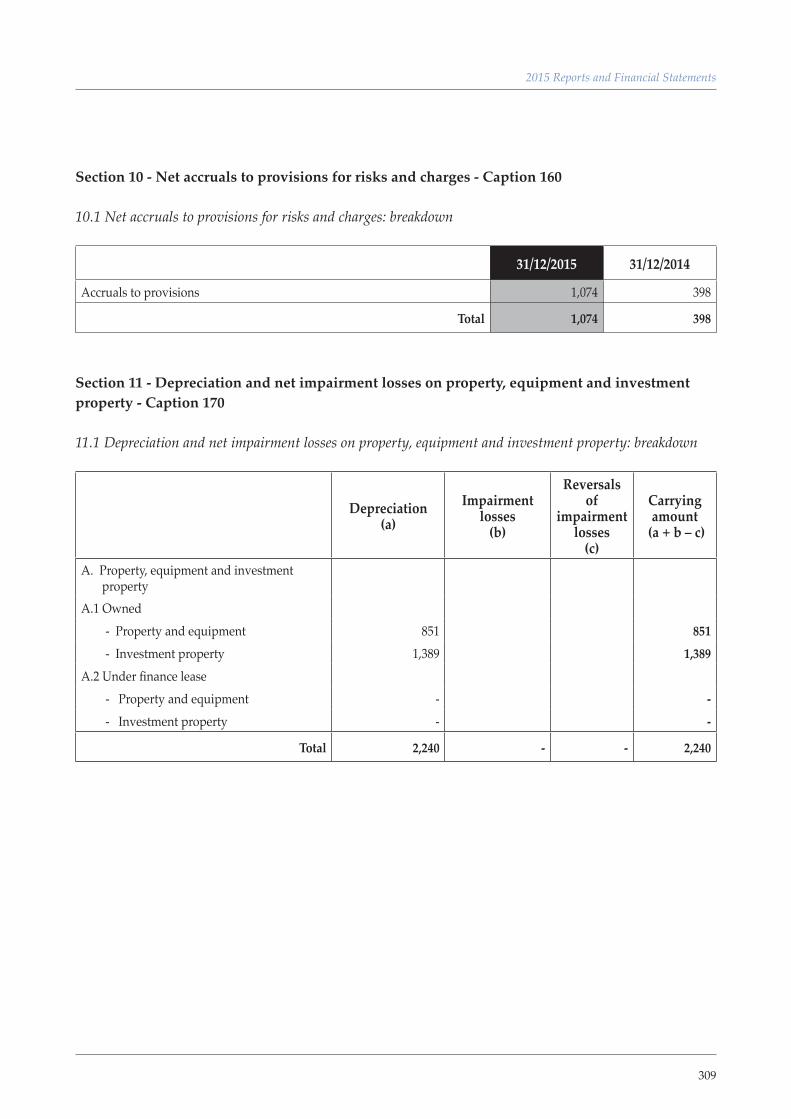
309
2015 Reports and Financial Statements
Section 10 - Net accruals to provisions for risks and charges - Caption 160
10.1 Net accruals to provisions for risks and charges: breakdown
31/12/2015 31/12/2014
Accruals to provisions 1,074 398
Total 1,074 398
Section 11 - Depreciation and net impairment losses on property, equipment and investment property - Caption 170
11.1 Depreciation and net impairment losses on property, equipment and investment property: breakdown
Depreciation(a)
Impairment losses
(b)
Reversals of
impairment losses
(c)
Carrying amount
(a + b – c)
A. Property, equipment and investment propertyA.1 Owned
- Property and equipment 851 851 - Investment property 1,389 1,389
A.2 Under finance lease- Property and equipment - - - Investment property - -
Total 2,240 - - 2,240
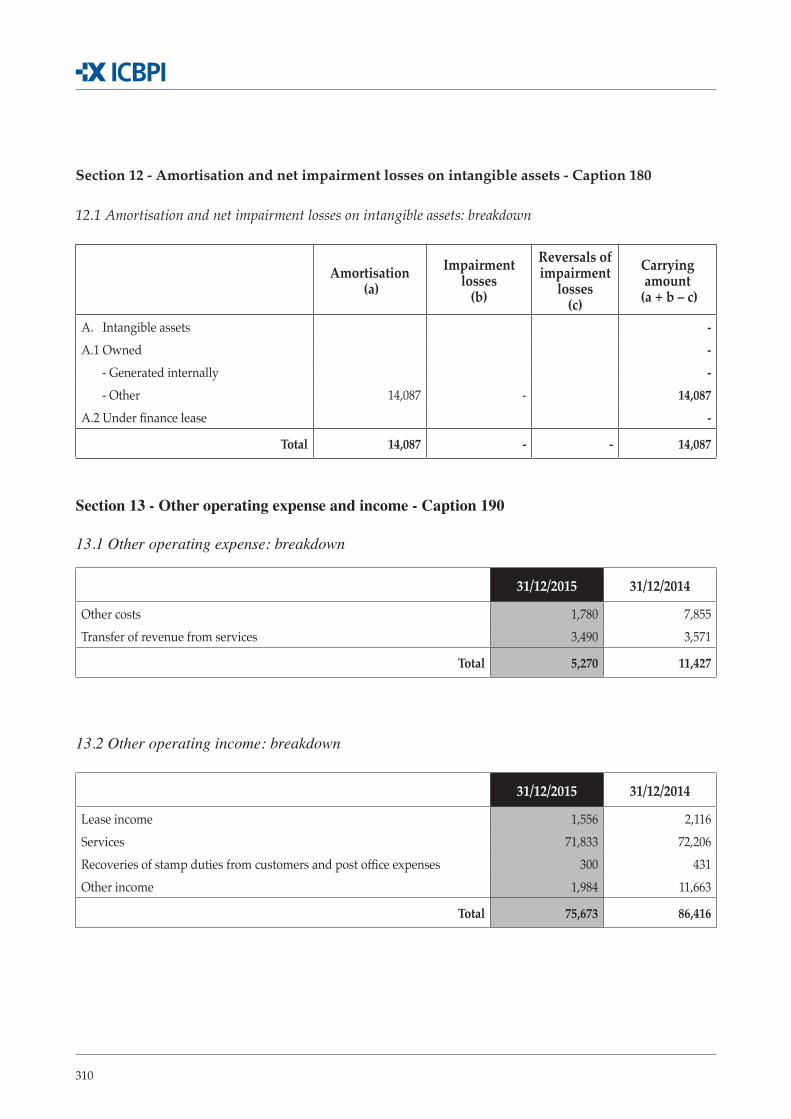
310
Section 12 - Amortisation and net impairment losses on intangible assets - Caption 180
12.1 Amortisation and net impairment losses on intangible assets: breakdown
Amortisation (a)
Impairment losses
(b)
Reversals of impairment
losses(c)
Carrying amount
(a + b – c)
A. Intangible assets - A.1 Owned - - Generated internally - - Other 14,087 - 14,087 A.2 Under finance lease -
Total 14,087 - - 14,087
Section 13 - Other operating expense and income - Caption 190
13.1 Other operating expense: breakdown
31/12/2015 31/12/2014
Other costs 1,780 7,855 Transfer of revenue from services 3,490 3,571
Total 5,270 11,427
13.2 Other operating income: breakdown
31/12/2015 31/12/2014
Lease income 1,556 2,116 Services 71,833 72,206 Recoveries of stamp duties from customers and post office expenses 300 431 Other income 1,984 11,663
Total 75,673 86,416
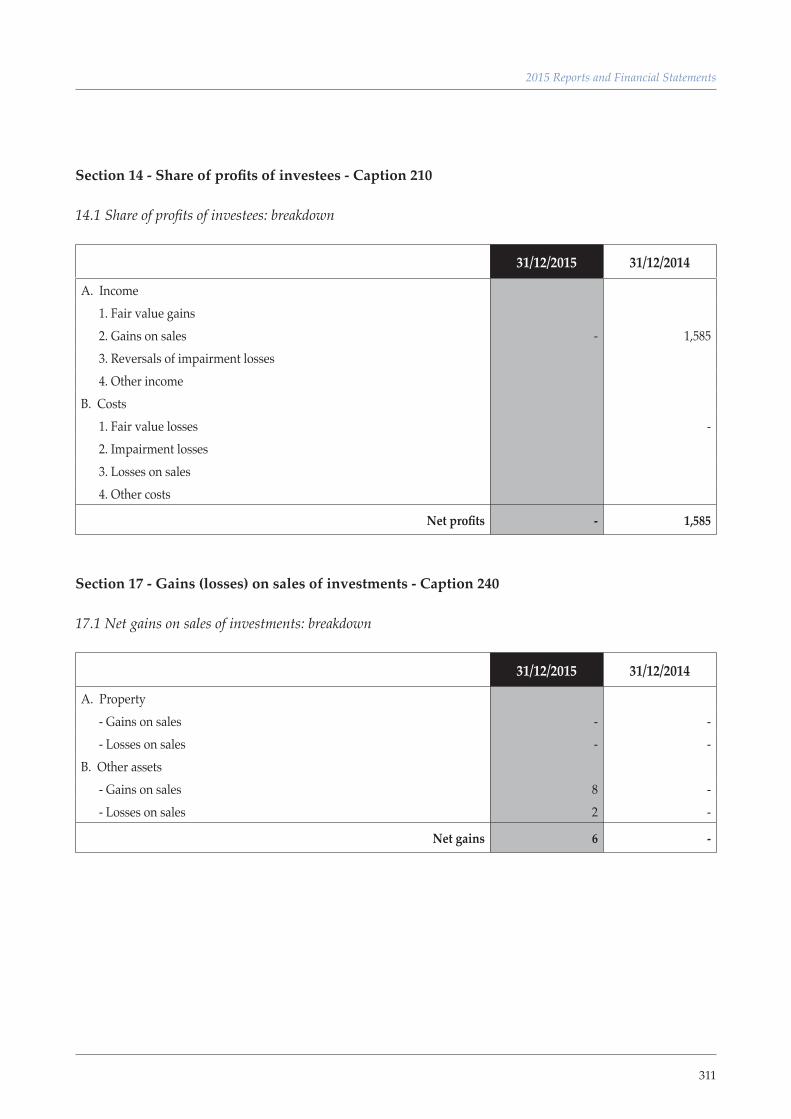
311
2015 Reports and Financial Statements
Section 14 - Share of profits of investees - Caption 210
14.1 Share of profits of investees: breakdown
31/12/2015 31/12/2014
A. Income 1. Fair value gains 2. Gains on sales - 1,585 3. Reversals of impairment losses 4. Other incomeB. Costs 1. Fair value losses - 2. Impairment losses 3. Losses on sales 4. Other costs
Net profits - 1,585
Section 17 - Gains (losses) on sales of investments - Caption 240
17.1 Net gains on sales of investments: breakdown
31/12/2015 31/12/2014
A. Property - Gains on sales - - - Losses on sales - - B. Other assets - Gains on sales 8 - - Losses on sales 2 -
Net gains 6 -
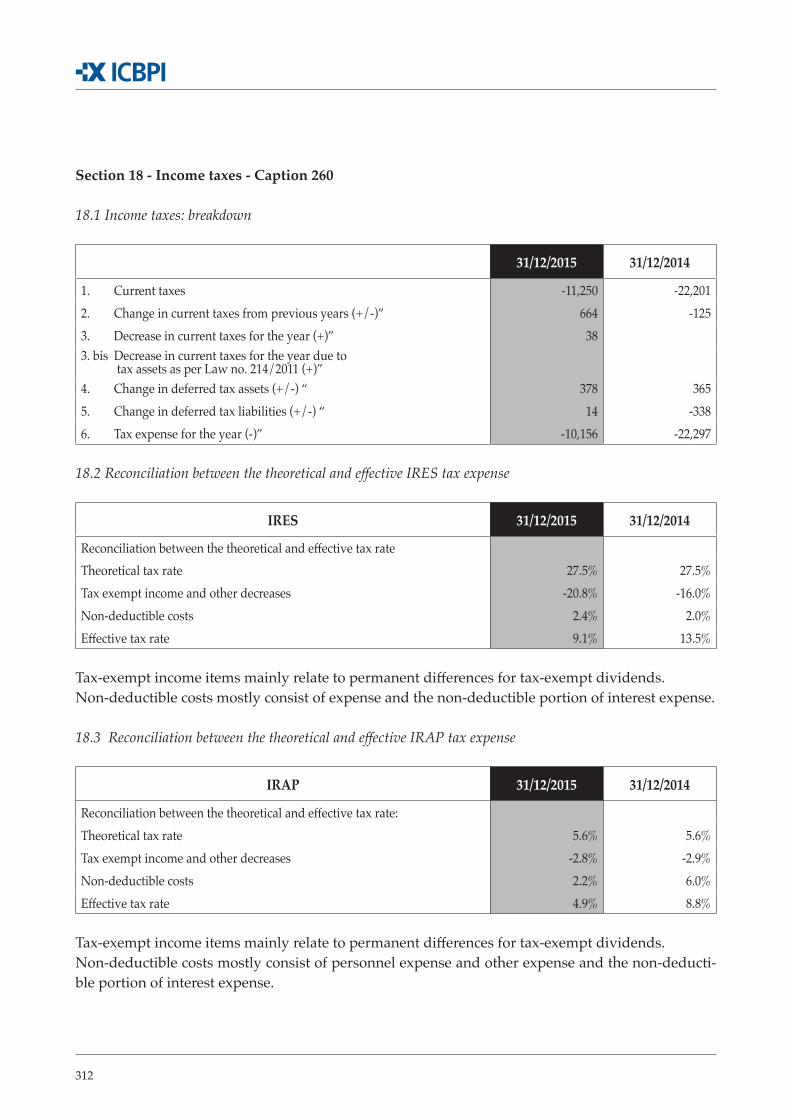
312
Section 18 - Income taxes - Caption 260
18.1 Income taxes: breakdown
31/12/2015 31/12/2014
1. Current taxes -11,250 -22,201 2. Change in current taxes from previous years (+/-)” 664 -125 3. Decrease in current taxes for the year (+)” 38 3. bis Decrease in current taxes for the year due to tax assets as per Law no. 214/2011 (+)”4. Change in deferred tax assets (+/-) “ 378 365 5. Change in deferred tax liabilities (+/-) “ 14 -338 6. Tax expense for the year (-)” -10,156 -22,297
18.2 Reconciliation between the theoretical and effective IRES tax expense
IRES 31/12/2015 31/12/2014
Reconciliation between the theoretical and effective tax rateTheoretical tax rate 27.5% 27.5%Tax exempt income and other decreases -20.8% -16.0%Non-deductible costs 2.4% 2.0%Effective tax rate 9.1% 13.5%
Tax-exempt income items mainly relate to permanent differences for tax-exempt dividends. Non-deductible costs mostly consist of expense and the non-deductible portion of interest expense.
18.3 Reconciliation between the theoretical and effective IRAP tax expense
IRAP 31/12/2015 31/12/2014
Reconciliation between the theoretical and effective tax rate:Theoretical tax rate 5.6% 5.6%Tax exempt income and other decreases -2.8% -2.9%Non-deductible costs 2.2% 6.0%Effective tax rate 4.9% 8.8%
Tax-exempt income items mainly relate to permanent differences for tax-exempt dividends.Non-deductible costs mostly consist of personnel expense and other expense and the non-deducti-ble portion of interest expense.
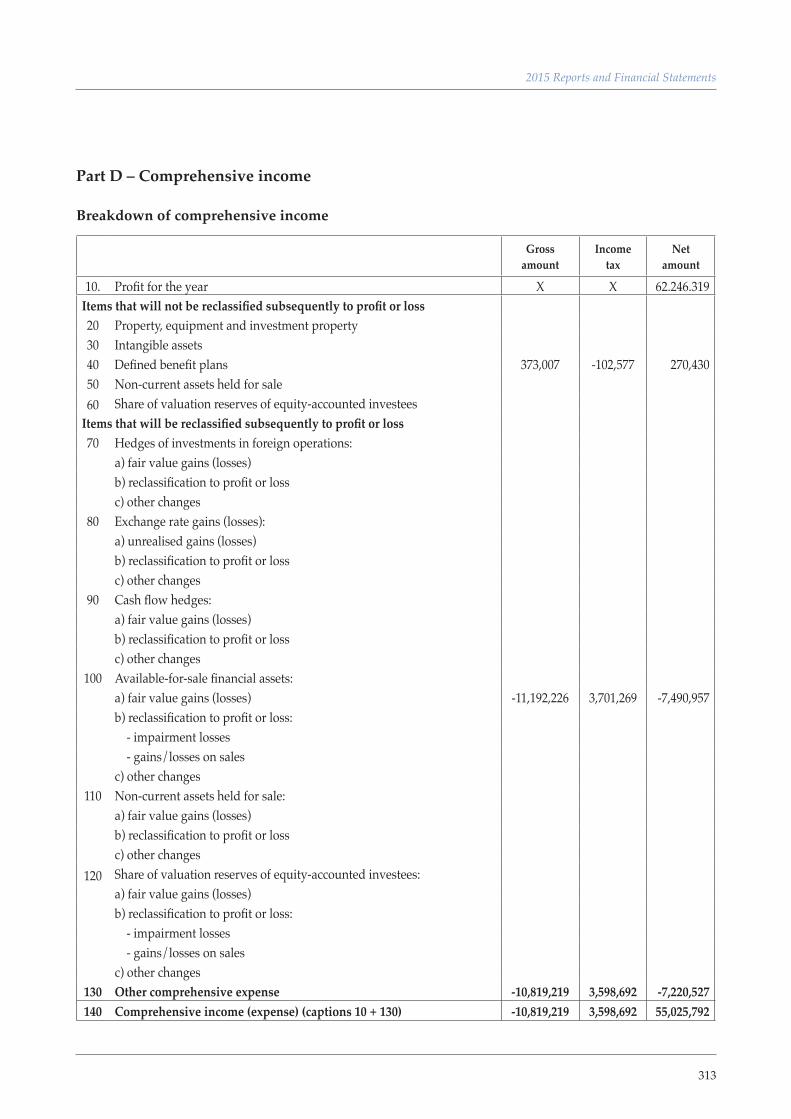
313
2015 Reports and Financial Statements
Part D – Comprehensive income
Breakdown of comprehensive income
Gross amount
Income tax
Net amount
10. Profit for the year X X 62.246.319 Items that will not be reclassified subsequently to profit or loss20 Property, equipment and investment property30 Intangible assets 40 Defined benefit plans 373,007 -102,577 270,430 50 Non-current assets held for sale60 Share of valuation reserves of equity-accounted investees
Items that will be reclassified subsequently to profit or loss70 Hedges of investments in foreign operations:
a) fair value gains (losses)b) reclassification to profit or lossc) other changes
80 Exchange rate gains (losses):a) unrealised gains (losses)b) reclassification to profit or lossc) other changes
90 Cash flow hedges:a) fair value gains (losses)b) reclassification to profit or lossc) other changes
100 Available-for-sale financial assets:a) fair value gains (losses) -11,192,226 3,701,269 -7,490,957 b) reclassification to profit or loss: - impairment losses - gains/losses on salesc) other changes
110 Non-current assets held for sale:a) fair value gains (losses)b) reclassification to profit or lossc) other changes
120 Share of valuation reserves of equity-accounted investees:a) fair value gains (losses)b) reclassification to profit or loss: - impairment losses - gains/losses on salesc) other changes
130 Other comprehensive expense -10,819,219 3,598,692 -7,220,527 140 Comprehensive income (expense) (captions 10 + 130) -10,819,219 3,598,692 55,025,792
314
Part E - Risks and related hedging policies
Introduction
The bank’s internal controls form a system designed to provide reasonable security about attainment of the efficiency and effectiveness objectives for its operations, the reliability of financial statements disclosures and compliance with the ruling laws and regulations. They include organisational, re-gulatory and methodological controls designed to efficiently and economically ensure management and strategic control, operating and technical-operational activities.
The internal controls are organised on different levels:
▪ line controls, aimed at ensuring correct operating practices; these are hierarchical type controls performed by the same production unit which are usually part of the same procedures or perfor-med as back office activities;
▪ risk management controls, designed to define risk measurement methods, check compliance with their assigned limits by the various operating units (second level controls) and check consi-stency of each production unit’s operations with their risk/return objectives;
▪ compliance controls, to monitor risks of non-compliance with external and internal regulations;
▪ internal audit procedures, designed to identify irregularities, violations of procedures, internal and external regulations and to assess the overall working of the internal controls.
Non-operational, independent units carry out the risk management, compliance and internal audit activities.
Responsibility for the internal controls lies with the board of directors that establishes the risk appe-tite and, accordingly, provides for the definition and approval of the risk strategies and management policies. The board of directors is also responsible for ensuring the internal controls are consistent with the risk management policy.
As part of the internal controls, the bank has a risk policy, approved by its board of directors, which sets out the principles, aims and methods to manage (methodology and tools) the main risks to which it is exposed. It also has a risk appetite framework (RAF), which reconciles its strategic plan-ning and risk management as it defines the level and type of risk acceptable to the bank when pur-suing its strategic objectives.
In 2015, the bank fine-tuned and developed its risk appetite framework as follows:
▪ introduction/updating of the parameters for the risks already included in the risk appetite fra-mework;
▪ inclusion of new risk categories, such as IT risk.
The framework defines parameters for each category that are the maximum risk limit the Group in-tends to assume, the best risk limit (risk target) and an early warning level (risk trigger), which when
315
2015 Reports and Financial Statements
breached, triggers contingency plans and/or mitigation actions to avoid reaching the risk limit.
Given the importance of risk management to strategic planning, the bank also defined the operating methods in a specific regulatory folder, which also sets out the roles and responsibilities of the in-ternal units involved in identifying, assessing and monitoring the most important transactions. Risk assessment based on the most important transactions consists of an assessment of the consistency of the most important transactions’ risk profile with the bank’s risk appetite (the RAF). The risk profile of these transactions considers the risk appetite policies approved by the board of directors as well as the rules and regulations issued by the regulators for supervised intermediaries. During 2015, the RM service held another workshop (following that held in 2014) with all the reference people of the internal units involved in identifying the most significant transactions. The aim was to present the identification process and the related excel tool as well as to collect feedback from the attendees to facilitate operations.
The bank also analysed the activities performed, which are mainly related to the providing of pro-ducts and services to banks and major corporate customers, and identified operational risk as the main risk faced by it. In order to handle this risk and comply with the capital requirement, the bank activated an operational risk framework, which is a specific process that identifies risk factors, as-sesses the level of exposure to risks and the effectiveness of the actions taken to control and monitor these risks.
Section 1 - Credit Risk
QUALITATIVE DISCLOSURE
1. General issues
Credit risk is the risk that an unexpected variation in a counterparty’s credit standing may lead to its default, generating unexpected losses on cash exposures or endorsement credits, or that generates a related unexpected variation in the asset’s market value.
Lending is not ICBPI’s core business but it is an important part of its operations and mainly affects the treasury and finance unit, the securities services department and some business units.
In fact, the bank’s core business is not to grant financing but it does grant credit facilities, mainly to third parties that, due to the products/services provided to them and the operating/financial rules thereof, require credit facilities in the form of cash (credit facilities) or commitments (endorsement credits).
With respect to the first level controls, the head of the treasury and finance unit and the head of the securities services department check and monitor that the lending transactions performed by the treasury and finance unit comply with the maximum operating limits and/or caps. As part of the
316
second level controls, the risk management unit checks compliance with the operating limits and large exposures. It also calculates the exposure with related parties every day.
In addition, the risk management unit checks that credit exposures are monitored correctly, espe-cially impaired exposures, and that they are classified consistently, the allowance for impairment is suitable and the recovery process appropriate.
In order to strengthen controls over credit risk, relevant information about the credit exposure (amount of credit facilities, use of credit facilities, overruns, any non-performing positions) is col-lected in a structured and organic manner by the various IT procedures.
ICBPI does not operate in innovative financial products such as credit derivatives.
Also because of the limited number of exposures normally taken on by the bank, its credit risk me-asurement methods and the related controls over credit risk trends are simple and lean; it does not use scoring systems or external and/or internal ratings.
Pursuant to the prudent regulations (Bank of Italy circular no. 285), the bank’s assessment of cre-dit risk includes counterparty risk, that is the risk that a counterparty to a transaction may default before the transaction’s cash flows have been finalised. This latter risk is negligible considering the bank’s total weighted assets as it has always been below 1% of the total credit and counterparty risk.
2. Credit risk management policies
2.1 Organisational aspects
The bank’s organisational structure ensures the proper monitoring and management of risks. With specific respect to credit risk, the board of directors has the sole powers to make policies that affect ICBPI’s operations. It approves the strategies and risk management policies and the bank’s organisa-tional structure for internal controls. The proxy system provided for by an internal policy approved by the board of directors attributes specific powers to some bodies and units for decisions about credit. As required by the internal regulations, credit risk is managed and monitored by the:
▪ board of directors
▪ general manager
▪ credit committee
▪ credit and branches unit.
2.2 Management, measurement and control systems
2.2.1 CREDIT MANAGEMENT
ICBPI is a “second level” bank, whose core business is the providing of products and services mainly
317
2015 Reports and Financial Statements
in the sector of payment systems and administrative services for the custody, administration and settlement of securities.
Its lending policies are regulated by a specific regulation and it provides credit to:
▪ banks;
▪ stock brokerage companies;
▪ financial companies included in the lists covered by the Consolidated Banking Act;
▪ large corporate customers;
▪ OEICs;
▪ fund management companies.
ICBPI only provides credit facilities to retail customers who are group employees and employees of the former ICBPI (Equens) Group in the form of current account overdrafts and personal loans. It does not provide loans.
All the applications for credit and allocations of operating limits are reviewed by the credit office, together with the service manager and then approved by the credit committee. If no obstacles are identified, the credit committee expresses its assessment of the application, including about the gua-rantee acquired or to be acquired for the board of directors to take its decision.
After the credit facility is provided, risks are checked and monitored as follows:
▪ periodic assessments of the customers and reviews of their positions;
▪ checks of overruns;
▪ checks of information from Bank of Italy’s credit information centre;
▪ identification of indications that the risk is more serious;
▪ periodic checks of the adequacy of the credit facilities used within the bank and the banking sector compared to equity for the mutual fund sector (to check the legal limit imposed by Bank of Italy’s regulation).
The credit office and the securities services department regularly check at least once a year the quan-titative and qualitative adequacy of the guarantees given by customers. In the case of ascertained total or partial default, they request the customers integrate the guarantees on a timely basis. If this does not take place, they immediately revise the position to comply with the identified risks.
2.2.2 MANAGEMENT OF OVERRUNS
The credit office checks and analyses any overruns every day and informs the relevant units of all positions with overruns (current accounts in Euro and foreign currency with and without credit faci-
318
lities). The units firstly check the accounting entries and, if necessary, make the relevant adjustments. They analyse the reasons for the overruns and invite the customers to immediately rectify their po-sitions if this is appropriate. They also inform the credit office and the risk management unit of their actions.
All overruns of more than €1,000 are communicated to the board of directors. Positions that are past due or overdue (by more than 90/180) days are communicated to the credit information centre as per the Bank of Italy regulation.
2.2.3 OPERATING LIMITS
The risk management unit monitors compliance with the operating limits granted to the banks on a daily basis as a second level control. These limits are granted on the basis of standard parameters and vary depending on the nature of the instrument and its implicit volatility as well as the duration or residual life of the transaction.
The group has an application which performs the centralised check of the existing operating limits each day and issues general alerts when the threshold is exceeded.
2.2.4 RISK CONCENTRATION LIMITS
The risk management unit monitors compliance with the risk concentration limits (large exposures) on a daily basis, assisted by the level 1 controls already performed by the relevant units.
2.2.5 LIMITS TO EXPOSURES WITH RELATED PARTIES
Regulations covering the limits to risky transactions with related parties and parties related to them introduced exposure limits for ICBPI (considering separate regulatory capital) vis-à-vis “Company personnel”, “Investors exercising control or significant influence”, “Other investors” and “Parties subject to control or significant influence”.
Controls over the risky transactions take place daily together with the controls over large exposures, including exposures to the individual related party and the overall exposure to all the related parties and parties related to them.
2.2.6 RESULTS OF THE LIMITS MONITORING
The daily monitoring of the limits showed compliance with the operating ceilings in 2015 within the risk concentration and related party exposure limits.
Most of the rare cases when the limits were exceeded are due to an increase in the amount of the existing transactions.
319
2015 Reports and Financial Statements
2.3 Credit risk mitigation techniques
In order to mitigate credit risk, the relevant bodies may decide to tie the granting of credit facilities to the receipt of suitable guarantees, based on the results of the related credit facility application in-vestigation. These guarantees may be collateral, such as securities and/or cash deposits, contractual guarantees or endorsement guarantees.
The credit office and the securities services department regularly check at least once a year the quan-titative and qualitative adequacy of the guarantees given by customers. In the case of ascertained total or partial default, they request the customers integrate the guarantees on a timely basis. If this does not take place, they immediately revise the position to comply with the identified risks.
The acquired guarantees do not have specific limits that could affect their legal validity.
There were no significant changes in the management of guarantees compared to the previous year.
2.4 Impaired financial assets
The credit committee regularly reviews all potentially irregular positions and decides on the recove-ry activities to be taken as well as changes in the position’s status, based on the relevant parameters. These decisions are reviewed by the board of directors.
Classification of assets by debtor quality complies with the categories established by Bank of Italy.
With respect to impaired positions, impairment losses are recognised after the individual measure-ment of each position.
Country risk
Country risk is the risk of losses caused by events that take place in countries other than Italy. This concept is wider than that for sovereign risk as it covers all exposures regardless of the type of counterparty involved, be they natural persons, businesses, banks or public administrations.
The bank includes country risk as part of credit risk and it is not a significant risk given that:
▪ most of ICBPI’s exposures are with parties that offer settlement and custody services, such as Clearstream and Euroclear, or international banks (e.g., Barclays, BNP Paribas), that can reasona-bly be assumed to be very independent economically of the country where their head office is;
▪ the exposures are mostly with parties based in countries with high ratings;
▪ the capital requirement for credit risk is calculated without using the counterparty rating pa-rameter but solely the rating of the counterparty’s country of residence. Therefore, the capital requirement includes the country risk component.
Both for country and issuer risks, the risk management unit checks that the securities in portfolio have the characteristics indicated in the financial regulation once a month and prepares a quarterly report for the manager of the relevant department and the managing director.
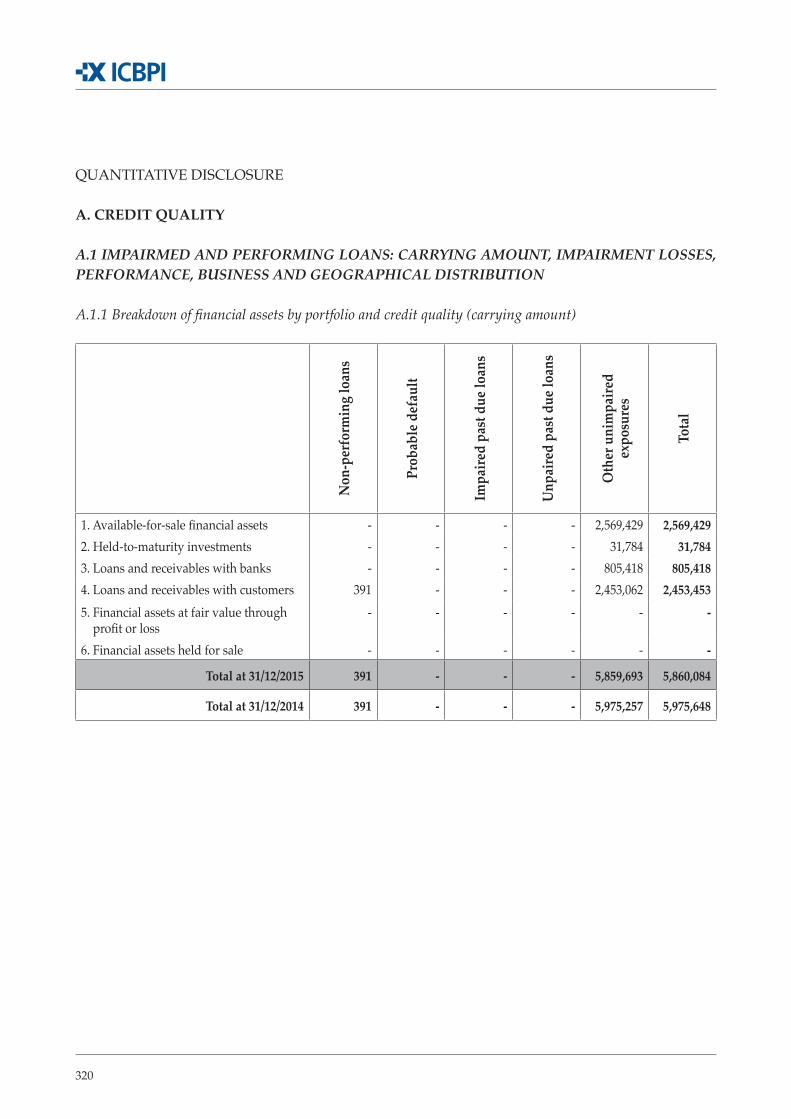
320
QUANTITATIVE DISCLOSURE
A. CREDIT QUALITY
A.1 IMPAIRMED AND PERFORMING LOANS: CARRYING AMOUNT, IMPAIRMENT LOSSES, PERFORMANCE, BUSINESS AND GEOGRAPHICAL DISTRIBUTION
A.1.1 Breakdown of financial assets by portfolio and credit quality (carrying amount)
Non
-per
form
ing
loan
s
Prob
able
def
ault
Impa
ired
past
due
loan
s
Unp
aire
d pa
st d
ue lo
ans
Oth
er u
nim
paire
d ex
posu
res
Tota
l
1. Available-for-sale financial assets - - - - 2,569,429 2,569,429 2. Held-to-maturity investments - - - - 31,784 31,784 3. Loans and receivables with banks - - - - 805,418 805,4184. Loans and receivables with customers 391 - - - 2,453,062 2,453,4535. Financial assets at fair value through profit or loss
- - - - - -
6. Financial assets held for sale - - - - - -
Total at 31/12/2015 391 - - - 5,859,693 5,860,084
Total at 31/12/2014 391 - - - 5,975,257 5,975,648
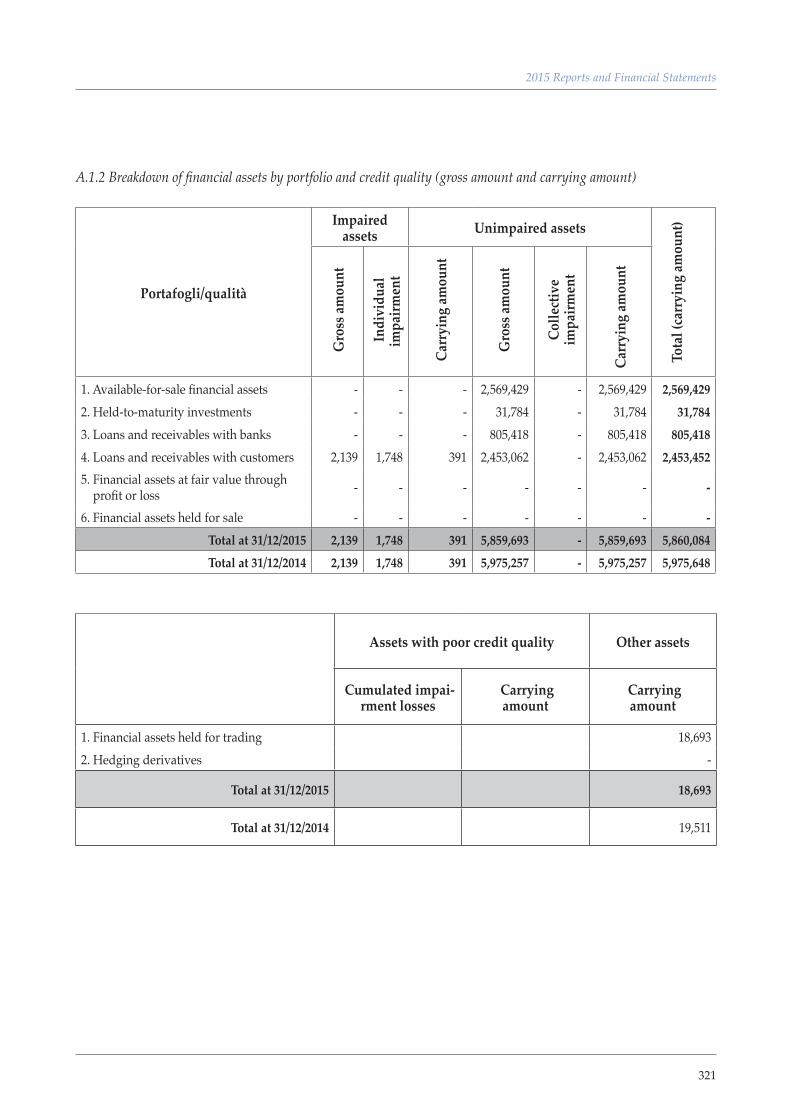
321
2015 Reports and Financial Statements
A.1.2 Breakdown of financial assets by portfolio and credit quality (gross amount and carrying amount)
Portafogli/qualità
Impaired assets Unimpaired assets
Tota
l (ca
rryi
ng am
ount
)
Gro
ss am
ount
Indi
vidu
al
impa
irmen
t
Car
ryin
g am
ount
Gro
ss am
ount
Col
lect
ive
impa
irmen
t
Car
ryin
g am
ount
1. Available-for-sale financial assets - - - 2,569,429 - 2,569,429 2,569,429 2. Held-to-maturity investments - - - 31,784 - 31,784 31,784 3. Loans and receivables with banks - - - 805,418 - 805,418 805,418 4. Loans and receivables with customers 2,139 1,748 391 2,453,062 - 2,453,062 2,453,452 5. Financial assets at fair value through profit or loss - - - - - - -
6. Financial assets held for sale - - - - - - - Total at 31/12/2015 2,139 1,748 391 5,859,693 - 5,859,693 5,860,084 Total at 31/12/2014 2,139 1,748 391 5,975,257 - 5,975,257 5,975,648
Assets with poor credit quality Other assets
Cumulated impai-rment losses
Carrying amount
Carrying amount
1. Financial assets held for trading 18,693 2. Hedging derivatives -
Total at 31/12/2015 18,693
Total at 31/12/2014 19,511
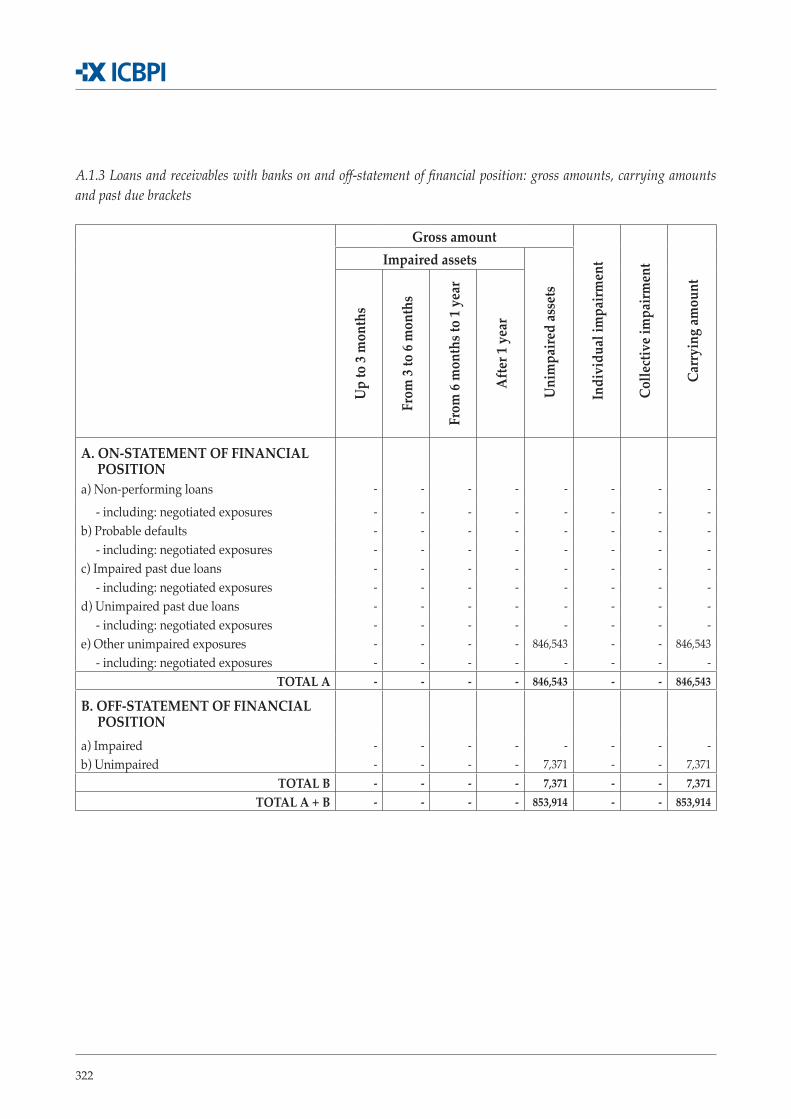
322
A.1.3 Loans and receivables with banks on and off-statement of financial position: gross amounts, carrying amounts and past due brackets
Gross amount
Indi
vidu
al im
pairm
ent
Colle
ctiv
e im
pairm
ent
Carr
ying
amou
nt
Impaired assets
Uni
mpa
ired
asse
ts
Up
to 3
mon
ths
From
3 to
6 m
onth
s
From
6 m
onth
s to
1 yea
r
Afte
r 1 y
ear
A. ON-STATEMENT OF FINANCIAL POSITIONa) Non-performing loans - - - - - - - -
- including: negotiated exposures - - - - - - - - b) Probable defaults - - - - - - - - - including: negotiated exposures - - - - - - - - c) Impaired past due loans - - - - - - - - - including: negotiated exposures - - - - - - - - d) Unimpaired past due loans - - - - - - - - - including: negotiated exposures - - - - - - - - e) Other unimpaired exposures - - - - 846,543 - - 846,543 - including: negotiated exposures - - - - - - - -
TOTAL A - - - - 846,543 - - 846,543
B. OFF-STATEMENT OF FINANCIAL POSITIONa) Impaired - - - - - - - - b) Unimpaired - - - - 7,371 - - 7,371
TOTAL B - - - - 7,371 - - 7,371 TOTAL A + B - - - - 853,914 - - 853,914
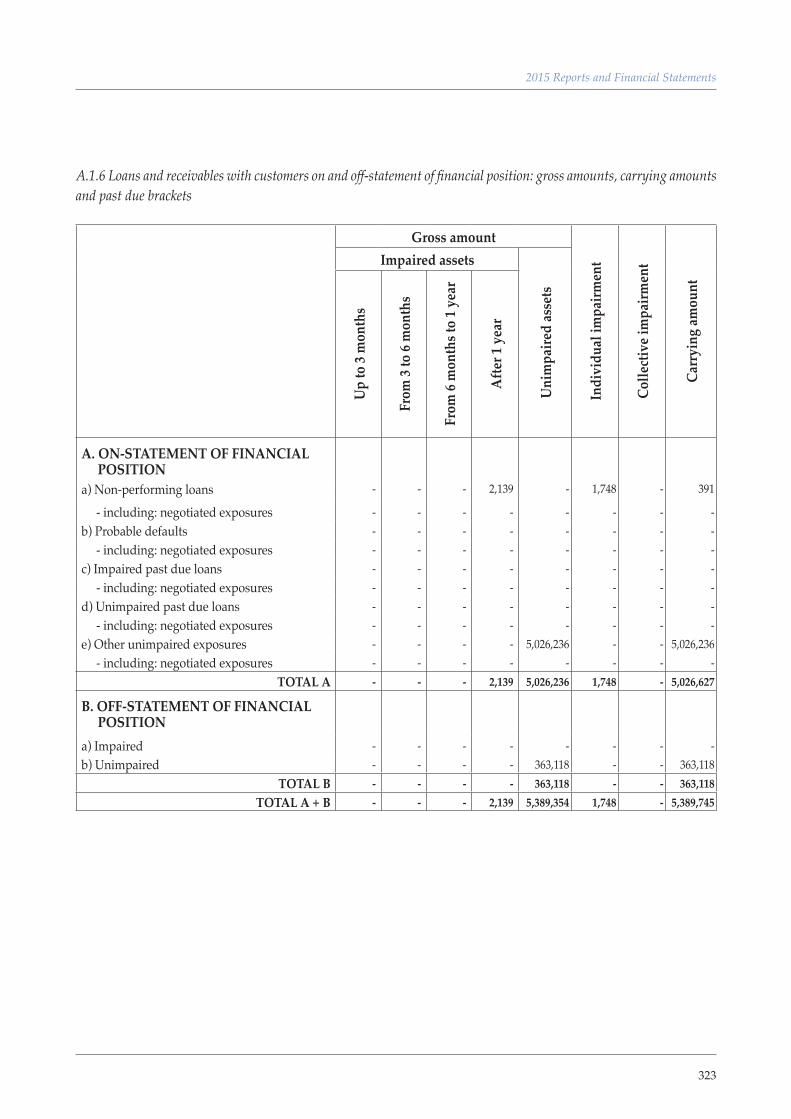
323
2015 Reports and Financial Statements
A.1.6 Loans and receivables with customers on and off-statement of financial position: gross amounts, carrying amounts and past due brackets
Gross amount
Indi
vidu
al im
pairm
ent
Colle
ctiv
e im
pairm
ent
Carr
ying
amou
nt
Impaired assets
Uni
mpa
ired
asse
ts
Up
to 3
mon
ths
From
3 to
6 m
onth
s
From
6 m
onth
s to
1 yea
r
Afte
r 1 y
ear
A. ON-STATEMENT OF FINANCIAL POSITIONa) Non-performing loans - - - 2,139 - 1,748 - 391
- including: negotiated exposures - - - - - - - - b) Probable defaults - - - - - - - - - including: negotiated exposures - - - - - - - - c) Impaired past due loans - - - - - - - - - including: negotiated exposures - - - - - - - - d) Unimpaired past due loans - - - - - - - - - including: negotiated exposures - - - - - - - - e) Other unimpaired exposures - - - - 5,026,236 - - 5,026,236 - including: negotiated exposures - - - - - - - -
TOTAL A - - - 2,139 5,026,236 1,748 - 5,026,627
B. OFF-STATEMENT OF FINANCIAL POSITIONa) Impaired - - - - - - - - b) Unimpaired - - - - 363,118 - - 363,118
TOTAL B - - - - 363,118 - - 363,118 TOTAL A + B - - - 2,139 5,389,354 1,748 - 5,389,745
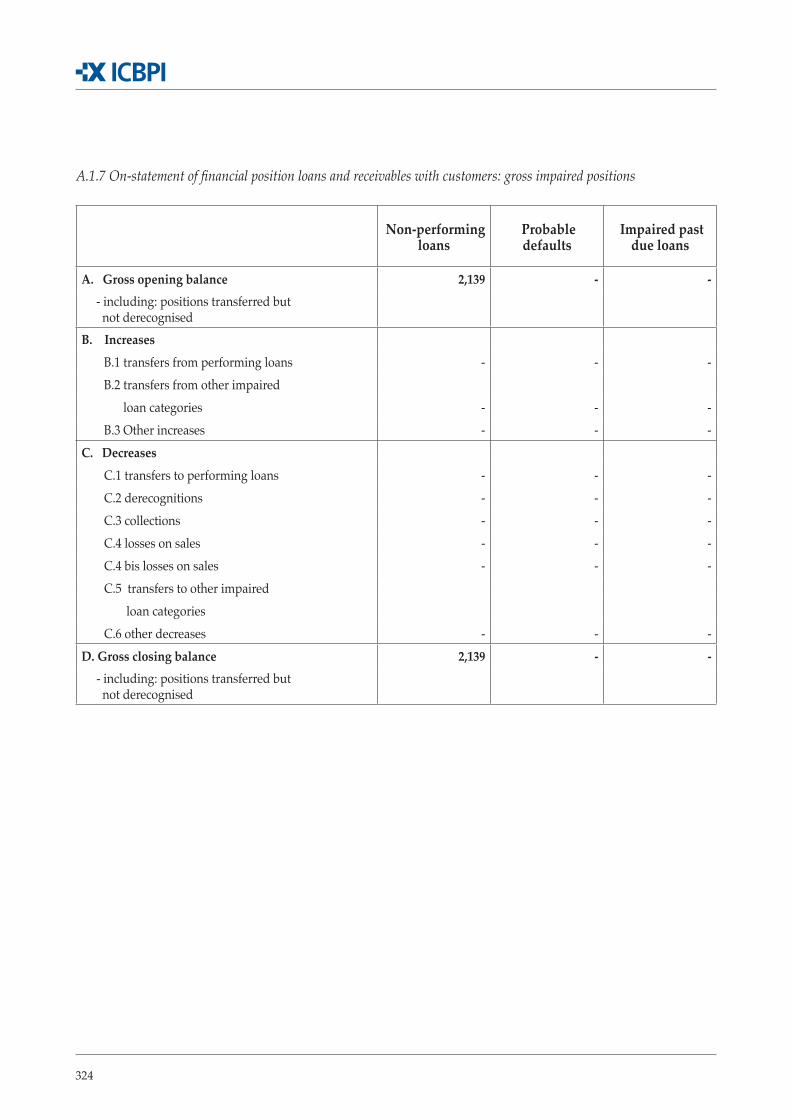
324
A.1.7 On-statement of financial position loans and receivables with customers: gross impaired positions
Non-performing loans
Probable defaults
Impaired past due loans
A. Gross opening balance 2,139 - - - including: positions transferred but not derecognisedB. Increases
B.1 transfers from performing loans - - -B.2 transfers from other impaired
loan categories - - -B.3 Other increases - - -
C. DecreasesC.1 transfers to performing loans - - -C.2 derecognitions - - -C.3 collections - - -C.4 losses on sales - - -C.4 bis losses on sales - - -C.5 transfers to other impaired
loan categoriesC.6 other decreases - - -
D. Gross closing balance 2,139 - - - including: positions transferred but not derecognised
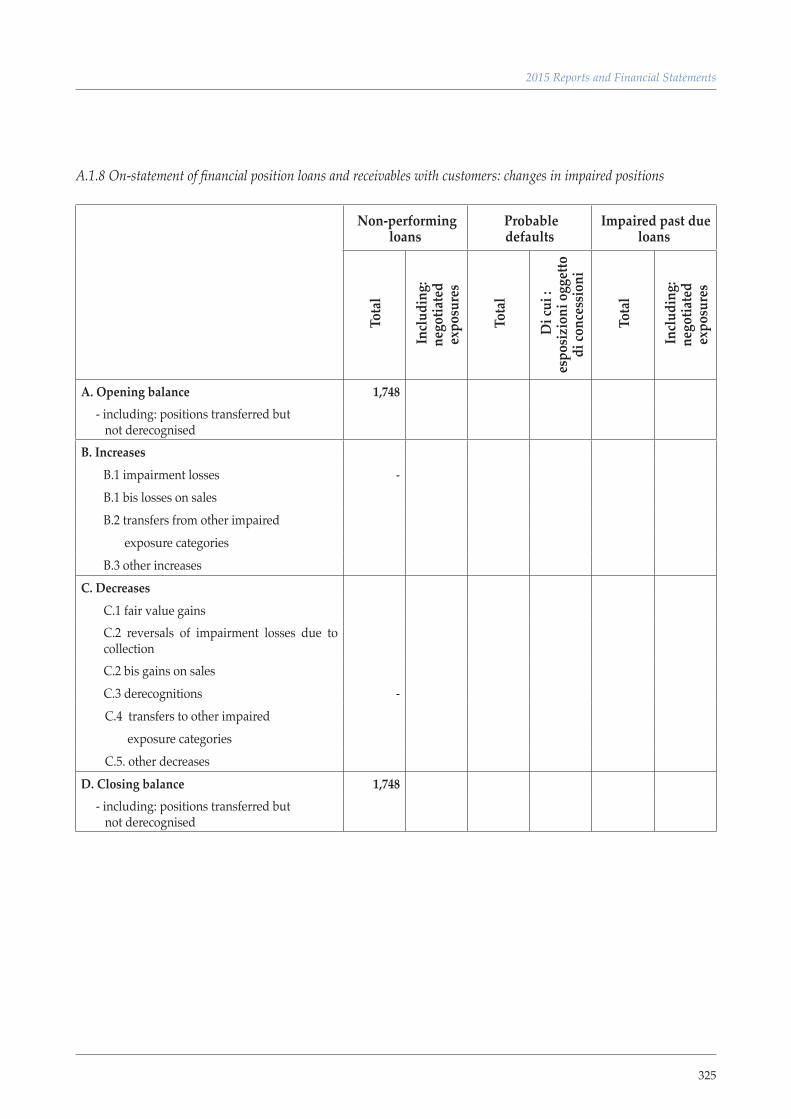
325
2015 Reports and Financial Statements
A.1.8 On-statement of financial position loans and receivables with customers: changes in impaired positions
Non-performing loans
Probable defaults
Impaired past due loans
Tot
al
Incl
udin
g:
nego
tiate
d ex
posu
res
Tot
al
Di c
ui :
espo
sizi
oni o
gget
to
di co
nces
sion
i
Tot
al
Incl
udin
g:
nego
tiate
d ex
posu
res
A. Opening balance 1,748 - including: positions transferred but not derecognisedB. Increases
B.1 impairment losses - B.1 bis losses on salesB.2 transfers from other impaired exposure categoriesB.3 other increases
C. DecreasesC.1 fair value gainsC.2 reversals of impairment losses due to collectionC.2 bis gains on salesC.3 derecognitions -
C.4 transfers to other impaired exposure categories
C.5. other decreasesD. Closing balance 1,748 - including: positions transferred but not derecognised
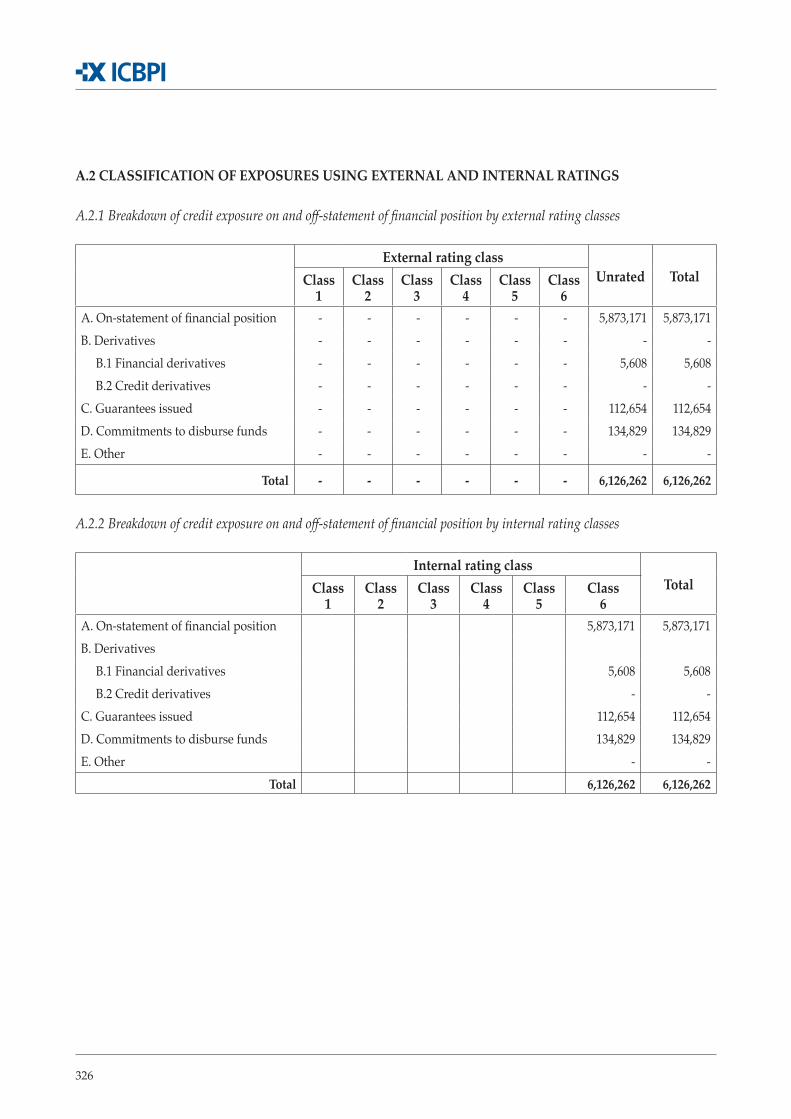
326
A.2 CLASSIFICATION OF EXPOSURES USING EXTERNAL AND INTERNAL RATINGS
A.2.1 Breakdown of credit exposure on and off-statement of financial position by external rating classes
External rating class Unrated TotalClass
1Class
2Class
3Class
4Class
5Class
6A. On-statement of financial position - - - - - - 5,873,171 5,873,171 B. Derivatives - - - - - - - - B.1 Financial derivatives - - - - - - 5,608 5,608 B.2 Credit derivatives - - - - - - - - C. Guarantees issued - - - - - - 112,654 112,654 D. Commitments to disburse funds - - - - - - 134,829 134,829 E. Other - - - - - - - -
Total - - - - - - 6,126,262 6,126,262
A.2.2 Breakdown of credit exposure on and off-statement of financial position by internal rating classes
Internal rating class TotalClass
1Class
2Class
3Class
4Class
5Class
6A. On-statement of financial position 5,873,171 5,873,171 B. Derivatives B.1 Financial derivatives 5,608 5,608 B.2 Credit derivatives - - C. Guarantees issued 112,654 112,654 D. Commitments to disburse funds 134,829 134,829 E. Other - -
Total 6,126,262 6,126,262
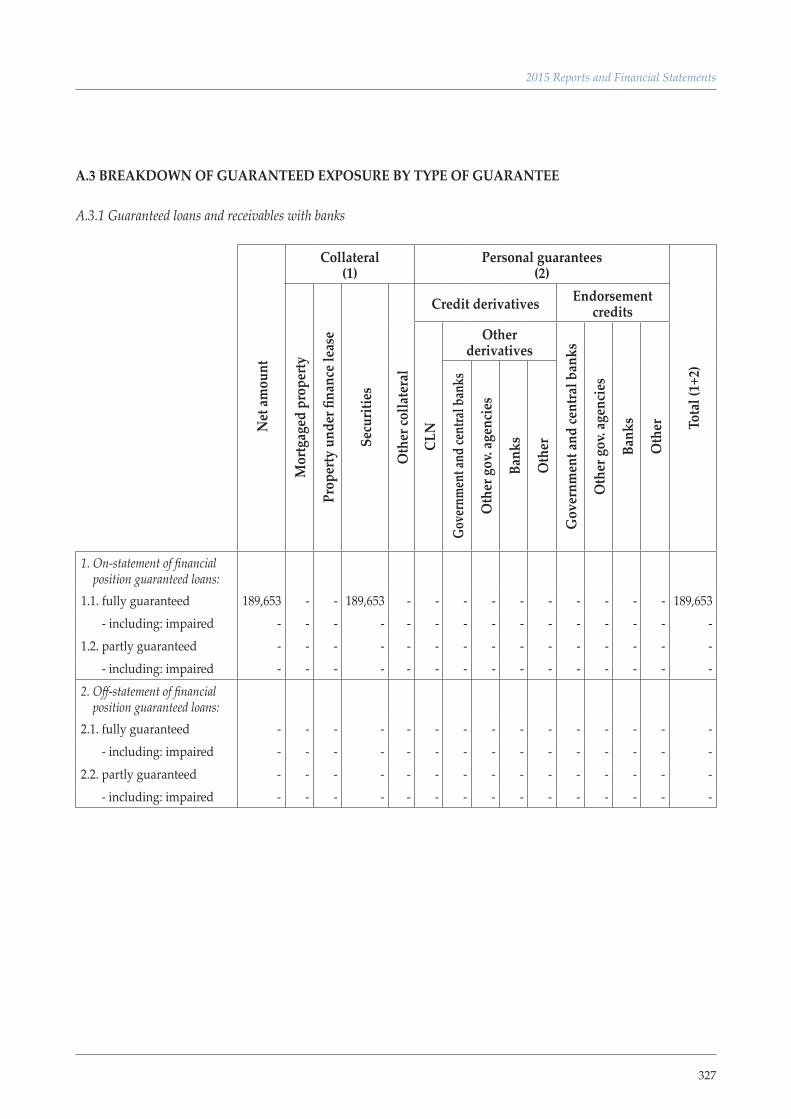
327
2015 Reports and Financial Statements
A.3 BREAKDOWN OF GUARANTEED EXPOSURE BY TYPE OF GUARANTEE
A.3.1 Guaranteed loans and receivables with banks
Net
amou
nt
Collateral(1)
Personal guarantees(2)
Tota
l (1+
2)
Mor
tgag
ed p
rope
rty
Prop
erty
und
er fi
nanc
e lea
se
Secu
ritie
s
Oth
er co
llate
ral
Credit derivatives Endorsement credits
CLN
Other derivatives
Gov
ernm
ent a
nd ce
ntra
l ban
ks
Oth
er g
ov. a
genc
ies
Bank
s
Oth
er
Gove
rnm
ent a
nd ce
ntra
l ban
ks
Oth
er g
ov. a
genc
ies
Bank
s
Oth
er1. On-statement of financial position guaranteed loans:1.1. fully guaranteed 189,653 - - 189,653 - - - - - - - - - - 189,653 - including: impaired - - - - - - - - - - - - - - - 1.2. partly guaranteed - - - - - - - - - - - - - - - - including: impaired - - - - - - - - - - - - - - - 2. Off-statement of financial position guaranteed loans:2.1. fully guaranteed - - - - - - - - - - - - - - - - including: impaired - - - - - - - - - - - - - - - 2.2. partly guaranteed - - - - - - - - - - - - - - - - including: impaired - - - - - - - - - - - - - - -

328
A.3.2 Guaranteed loans and receivables with customers
Net
amou
nt
Collateral(1)
Personal guarantees(2)
Tota
l (1+
2)
Mor
tgag
ed p
rope
rty
Prop
erty
und
er fi
nanc
e lea
se
Secu
ritie
s
Oth
er co
llate
ral
Credit derivatives Endorsement credits
CLN
Other derivatives
Gov
ernm
ent a
nd ce
ntra
l ban
ks
Oth
er g
ov. a
genc
ies
Bank
s
Oth
er
Gove
rnm
ent a
nd ce
ntra
l ban
ks
Oth
er g
ov. a
genc
ies
Bank
s
Oth
er1. On-statement of financial position guaranteed loans:1.1. fully guaranteed 806,784 - - - 806,784 - - - - - - - - - 806,784 - including: impaired - - - - - - - - - - - - - - - 1.2. partly guaranteed - - - - - - - - - - - - - - - - including: impaired - - - - - - - - - - - - - - - 2. Off-statement of financial position guaranteed loans:2.1. fully guaranteed - - - - - - - - - - - - - - - - including: impaired - - - - - - - - - - - - - - - 2.2. partly guaranteed - - - - - - - - - - - - - - - - including: impaired - - - - - - - - - - - - - - -
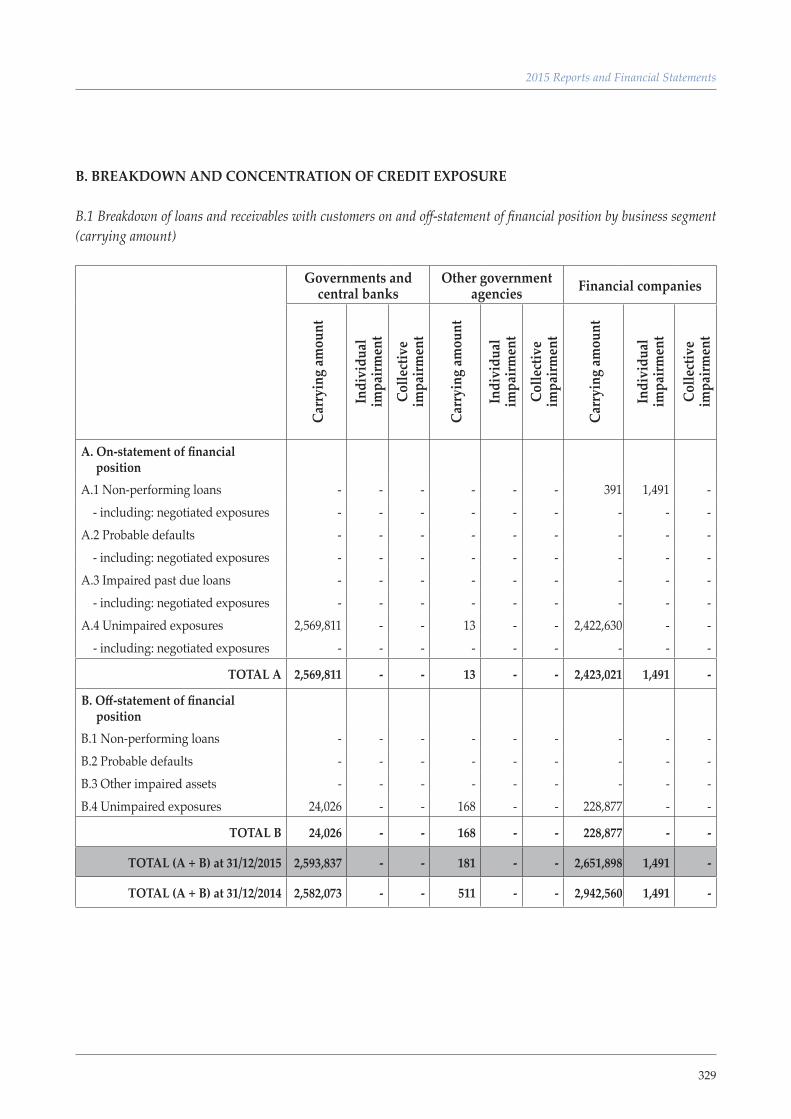
329
2015 Reports and Financial Statements
B. BREAKDOWN AND CONCENTRATION OF CREDIT EXPOSURE
B.1 Breakdown of loans and receivables with customers on and off-statement of financial position by business segment (carrying amount)
Governments and central banks
Other government agencies Financial companies
Carr
ying
amou
nt
Indi
vidu
al
impa
irmen
t
Colle
ctiv
e im
pairm
ent
Carr
ying
amou
nt
Indi
vidu
al
impa
irmen
t
Colle
ctiv
e im
pairm
ent
Carr
ying
amou
nt
Indi
vidu
al
impa
irmen
t
Colle
ctiv
e im
pairm
ent
A. On-statement of financial positionA.1 Non-performing loans - - - - - - 391 1,491 - - including: negotiated exposures - - - - - - - - - A.2 Probable defaults - - - - - - - - - - including: negotiated exposures - - - - - - - - - A.3 Impaired past due loans - - - - - - - - - - including: negotiated exposures - - - - - - - - - A.4 Unimpaired exposures 2,569,811 - - 13 - - 2,422,630 - - - including: negotiated exposures - - - - - - - - -
TOTAL A 2,569,811 - - 13 - - 2,423,021 1,491 -
B. Off-statement of financial position
B.1 Non-performing loans - - - - - - - - - B.2 Probable defaults - - - - - - - - - B.3 Other impaired assets - - - - - - - - - B.4 Unimpaired exposures 24,026 - - 168 - - 228,877 - -
TOTAL B 24,026 - - 168 - - 228,877 - -
TOTAL (A + B) at 31/12/2015 2,593,837 - - 181 - - 2,651,898 1,491 -
TOTAL (A + B) at 31/12/2014 2,582,073 - - 511 - - 2,942,560 1,491 -
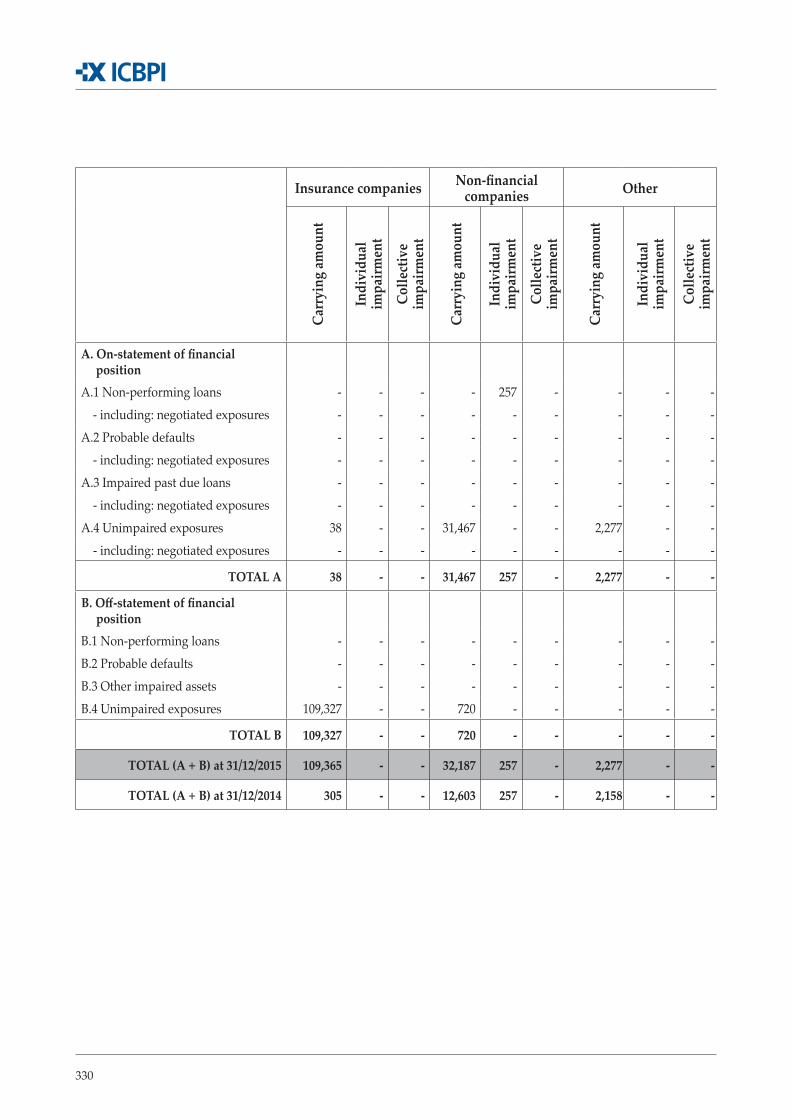
330
Insurance companies Non-financial companies Other
Carr
ying
amou
nt
Indi
vidu
al
impa
irmen
t
Colle
ctiv
e im
pairm
ent
Carr
ying
amou
nt
Indi
vidu
al
impa
irmen
t
Colle
ctiv
e im
pairm
ent
Carr
ying
amou
nt
Indi
vidu
al
impa
irmen
t
Colle
ctiv
e im
pairm
ent
A. On-statement of financial positionA.1 Non-performing loans - - - - 257 - - - - - including: negotiated exposures - - - - - - - - - A.2 Probable defaults - - - - - - - - - - including: negotiated exposures - - - - - - - - - A.3 Impaired past due loans - - - - - - - - - - including: negotiated exposures - - - - - - - - - A.4 Unimpaired exposures 38 - - 31,467 - - 2,277 - - - including: negotiated exposures - - - - - - - - -
TOTAL A 38 - - 31,467 257 - 2,277 - -
B. Off-statement of financial positionB.1 Non-performing loans - - - - - - - - - B.2 Probable defaults - - - - - - - - - B.3 Other impaired assets - - - - - - - - - B.4 Unimpaired exposures 109,327 - - 720 - - - - -
TOTAL B 109,327 - - 720 - - - - -
TOTAL (A + B) at 31/12/2015 109,365 - - 32,187 257 - 2,277 - -
TOTAL (A + B) at 31/12/2014 305 - - 12,603 257 - 2,158 - -

331
2015 Reports and Financial Statements
B.2 Breakdown of loans and receivables with customers on and off-statement of financial position by geographical segment (carrying amount)
ITALYOTHER
EUROPEAN COUNTRIES
AMERICAS ASIAREST
OF THE WORLD
Carr
ying
amou
nt
Tota
l im
pairm
ent
Carr
ying
amou
nt
Tota
l im
pairm
ent
Carr
ying
amou
nt
Tota
l im
pairm
ent
Carr
ying
amou
nt
Tota
l im
pairm
ent
Carr
ying
amou
nt
Tota
l im
pairm
ent
A. On-statement of financial positionA.1 Non-performing loans 391 1,748 - - - - - - - - A.2 Probable defaults - - - - - - - - - - A.3 Impaired past due loans - - - - - - - - - - A.4 Unimpaired exposures 5,017,361 - 6,820 - 2,055 - - - - -
TOTAL A 5,017,752 1,748 6,820 - 2,055 - - - - -
B. Off-statement of financial positionB.1 Non-performing loans - - - - - - - - - - B.2 Probable defaults - - - - - - - - - - B.3 Other impaired assets - - - - - - - - - - B.4 Unimpaired exposures 363,115 - - - - - - - 3 -
TOTAL B 363,115 - - - - - - - 3 -
TOTAL A + B at 31/12/2015 5,380,867 1,748 6,820 - 2,055 - - - 3 -
TOTAL A + B at 31/12/2014 5,485,192 1,748 52,319 - 2,698 - - - - -
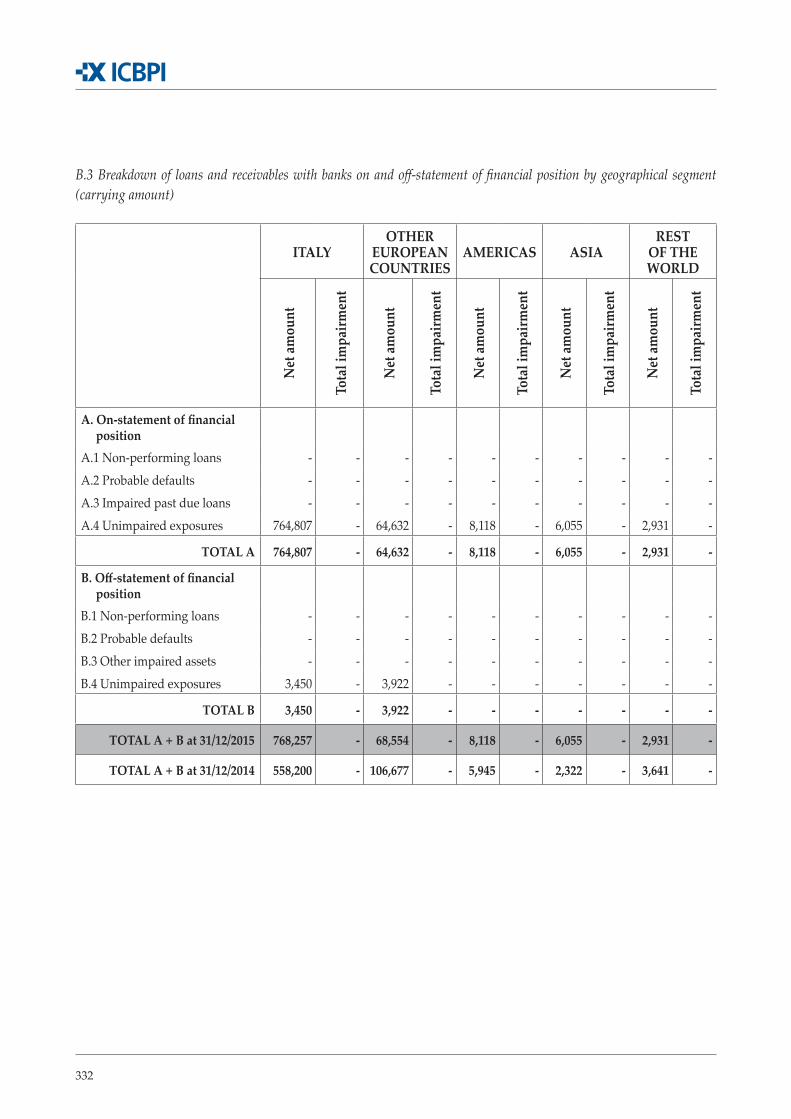
332
B.3 Breakdown of loans and receivables with banks on and off-statement of financial position by geographical segment (carrying amount)
ITALYOTHER
EUROPEAN COUNTRIES
AMERICAS ASIAREST
OF THE WORLD
Net
amou
nt
Tota
l im
pairm
ent
Net
amou
nt
Tota
l im
pairm
ent
Net
amou
nt
Tota
l im
pairm
ent
Net
amou
nt
Tota
l im
pairm
ent
Net
amou
nt
Tota
l im
pairm
ent
A. On-statement of financial positionA.1 Non-performing loans - - - - - - - - - - A.2 Probable defaults - - - - - - - - - - A.3 Impaired past due loans - - - - - - - - - - A.4 Unimpaired exposures 764,807 - 64,632 - 8,118 - 6,055 - 2,931 -
TOTAL A 764,807 - 64,632 - 8,118 - 6,055 - 2,931 -
B. Off-statement of financial positionB.1 Non-performing loans - - - - - - - - - - B.2 Probable defaults - - - - - - - - - - B.3 Other impaired assets - - - - - - - - - - B.4 Unimpaired exposures 3,450 - 3,922 - - - - - - -
TOTAL B 3,450 - 3,922 - - - - - - -
TOTAL A + B at 31/12/2015 768,257 - 68,554 - 8,118 - 6,055 - 2,931 -
TOTAL A + B at 31/12/2014 558,200 - 106,677 - 5,945 - 2,322 - 3,641 -
333
2015 Reports and Financial Statements
C. SECURITISATIONS AND TRANSFERS OF ASSETS
ICBPI has not undertaken these types of transaction.
F. CREDIT RISK MEASUREMENT MODELS
The bank does not have internal models to measure credit risk given its profile.
SECTION 2 – MARKET RISKS
QUALITATIVE DISCLOSURE
Market risk is the risk of incurring losses generated by operating on the market for financial instru-ments (regulatory trading book), currencies and commodities, due to fluctuations in market factors or the issuer’s situation. This risk is applicable to ICBPI as it manages financial instruments on the group’s behalf. Activities that generate market risk are performed by the treasury and finance unit and the securities services department.
The finance regulation governs these activities and defines the operating limits for the subcompo-nents of market risk, such as for example currency risk and interest rate risk on the trading book. In addition, the regulation sets operating limits for the various activities for the amounts involved, VaR, the stop loss as well as the criteria and methods to monitor positions.
The governance model in place to manage and monitor risks is based on the segregation between the management processes and the risk control processes on the one hand and, on the other, deve-lopment of processes to manage and monitor risks in line with the bank’s hierarchical structure and by assigning proxies.
The treasury and finance unit and the securities services department report to the liquidity and fi-nance committee, which analyses the bank’s positions and defines financial policies.
The first level controls are carried out by the treasury and finance unit and the securities services de-partment for the activities related to them, while the second level controls are performed by the risk management unit. This unit monitors market risk on a daily basis using the VaR of the positions in securities and foreign currency. It also performs second level controls on compliance with assigned limits.
The risk management unit also checks and processes ex post the data related to the bank’s total risk positions each day and prepares the reports necessary to check the limits set by the finance regula-tion. It also performs specific tests (back testing and stress testing) to check the level of existing risk scenarios or future scenarios for the current portfolio.
The treasury and finance unit monitors positions in securities and foreign currency using VaR with a confidence interval of 99% and a time horizon of 10 days, calculated using a parametric model.
The VaR, defined to obtain a reasonable estimate of potential losses in normal market conditions,
334
is not designed to, nor does it, include an analysis of extreme events. Stress tests are used to check the impact of extreme conditions on the portfolio and violations of the assumptions underlying the model used by identifying the remaining risk and providing information complementary to VaR.
Basis risk
The basis risk is defined as the risk of losses caused by unmatched variations in the spot and future price that are similar but not identical. This risk is especially pertinent to banks that calculate their capital requirements using standard methods by offsetting positions in one or more equities inclu-ded in an equity index with one or more future positions/other derivatives linked to this index or that offset opposing positions in futures on equity indexes that do not have the same expiry date, composition or both.
ICBPI is not exposed to this risk as it does not use futures/derivatives to hedge positions exposed to market risk and, therefore, these instruments are not included in the calculation of the capital requirement for market risk using the standard method. The bank’s operations in banking book de-rivatives is limited to trading in OTC options which, as per its internal regulations, does not generate positions. The risk positions for other financial instruments are hedged by specular hedges.
B.4 Large exposures
31/12/2015 31/12/2014
a) Carrying amountb) Weighted amountc) Number
7,464,060256,117
9
7,370,085314,453
12
2.1 INTEREST RATE AND PRICE RISK - REGULATORY TRADING BOOK
A1. General aspects about interest rate risk
This risk is inherent in the bank’s core banking business as it is part of the process of change over time, space and form of financial resources and in the financial assets trading business.
The objectives and strategies underlying trading activities in place to manage the securities portfolio are designed to maximise profitability and exploit investment opportunities as part of an approach to contain risks. This leads the bank to have a bonds portfolio with a short duration.
Like in previous years, interest rate risk is non-negligible given the temporary mismatching of the assets and liabilities arising from ICBPI’s operations.
The trading book includes financial instruments subject to regulatory capital requirements for mar-ket risk, as defined in the supervisory communication regulations.
335
2015 Reports and Financial Statements
B1. Interest rate risk management processes and measurement methods
The bank’s risk management unit performs stress tests on the interest rate risk, assuming various types of parallel movements in the interest rate curve and analysing the related effects.
A2. General aspects about price risk
Price risk is the risk of fluctuations in the prices of financial instruments due to variations in market variables or specific factors of the issuers or counterparties. It can be general, due to a change in the price of an equity instrument caused by fluctuations in the reference market, or specific, caused by a change in the price of a specific equity instrument compared to its reference market following chan-ges in expectations about the financial soundness or future profitability of the issuer.
B2. Management and measurement of price risk
Like for the other risks, the bank’s strategy adopted to manage price risk is prudent.
This risk is monitored through specific reports and by calculating the VaR (which is performed daily by the risk management unit).
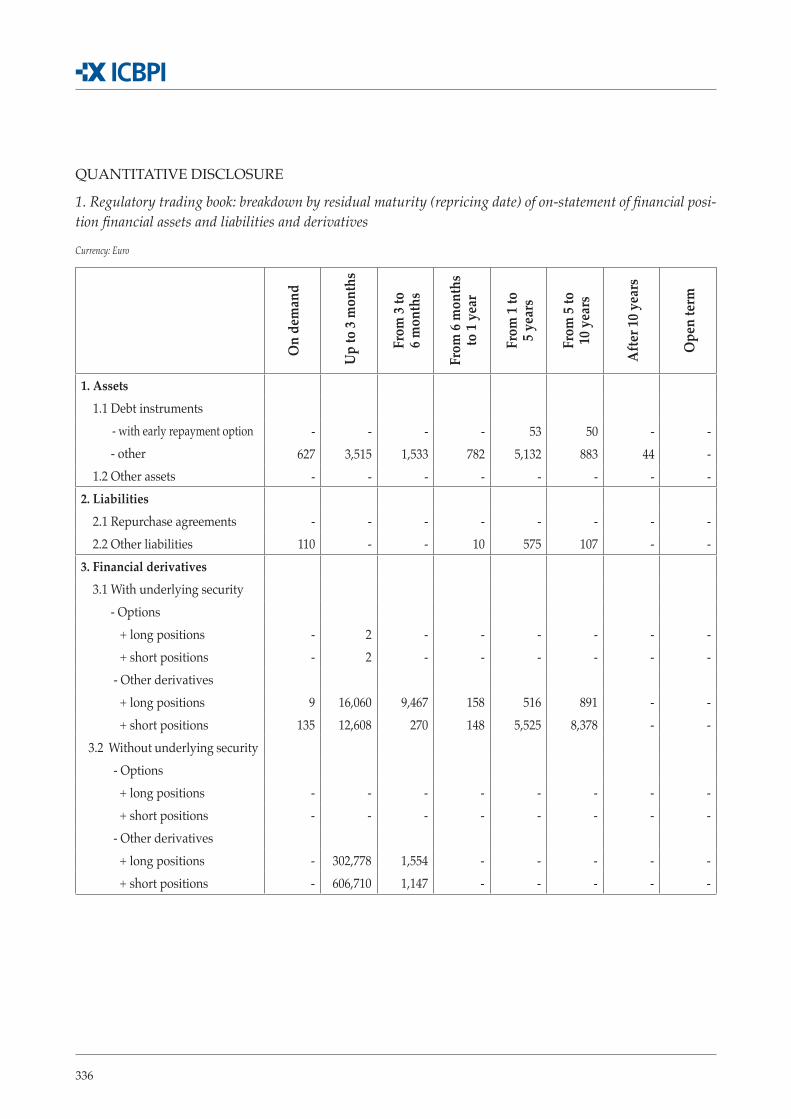
336
QUANTITATIVE DISCLOSURE
1. Regulatory trading book: breakdown by residual maturity (repricing date) of on-statement of financial posi-tion financial assets and liabilities and derivatives
Currency: Euro
On
dem
and
Up
to 3
mon
ths
From
3 to
6 m
onth
s
From
6 m
onth
s to
1 ye
ar
From
1 to
5 y
ears
From
5 to
10
yea
rs
Afte
r 10 y
ears
Ope
n te
rm
1. Assets 1.1 Debt instruments - with early repayment option - - - - 53 50 - - - other 627 3,515 1,533 782 5,132 883 44 - 1.2 Other assets - - - - - - - - 2. Liabilities 2.1 Repurchase agreements - - - - - - - - 2.2 Other liabilities 110 - - 10 575 107 - - 3. Financial derivatives 3.1 With underlying security - Options + long positions - 2 - - - - - - + short positions - 2 - - - - - - - Other derivatives + long positions 9 16,060 9,467 158 516 891 - - + short positions 135 12,608 270 148 5,525 8,378 - - 3.2 Without underlying security - Options + long positions - - - - - - - - + short positions - - - - - - - - - Other derivatives + long positions - 302,778 1,554 - - - - - + short positions - 606,710 1,147 - - - - -
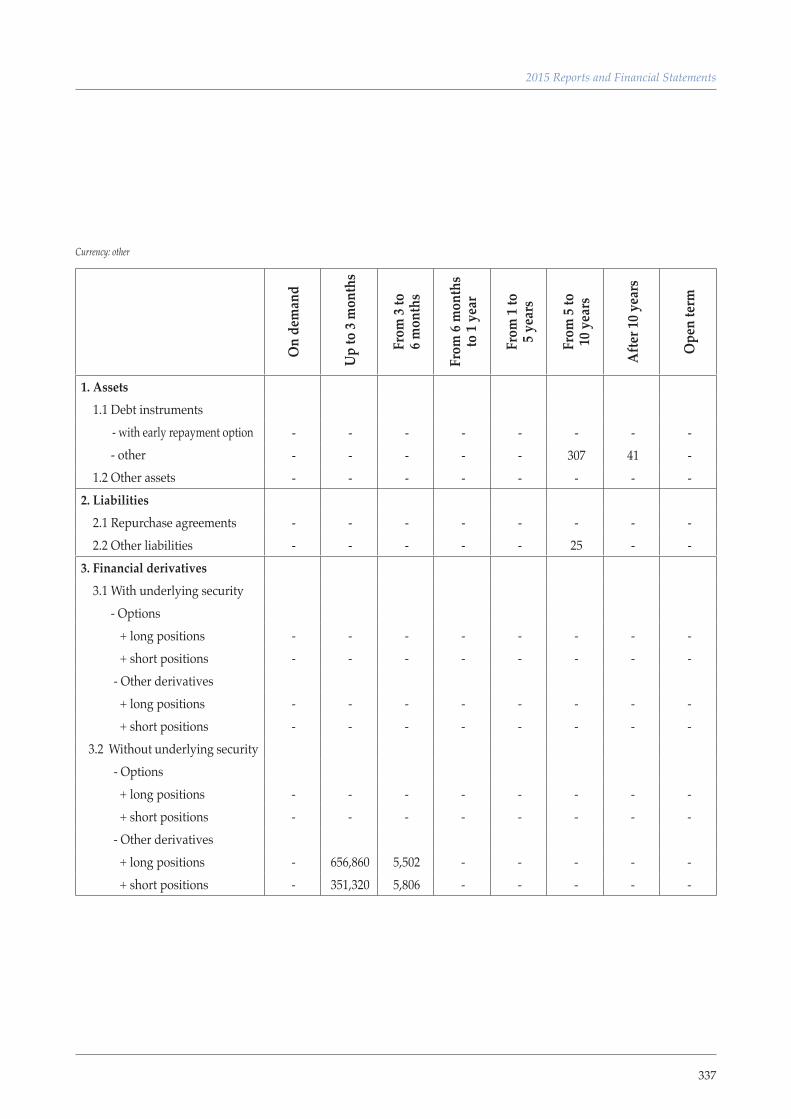
337
2015 Reports and Financial Statements
Currency: other
On
dem
and
Up
to 3
mon
ths
From
3 to
6 m
onth
s
From
6 m
onth
s to
1 ye
ar
From
1 to
5 y
ears
From
5 to
10
yea
rs
Afte
r 10 y
ears
Ope
n te
rm
1. Assets 1.1 Debt instruments - with early repayment option - - - - - - - - - other - - - - - 307 41 - 1.2 Other assets - - - - - - - - 2. Liabilities 2.1 Repurchase agreements - - - - - - - - 2.2 Other liabilities - - - - - 25 - - 3. Financial derivatives 3.1 With underlying security - Options + long positions - - - - - - - - + short positions - - - - - - - - - Other derivatives + long positions - - - - - - - - + short positions - - - - - - - - 3.2 Without underlying security - Options + long positions - - - - - - - - + short positions - - - - - - - - - Other derivatives + long positions - 656,860 5,502 - - - - - + short positions - 351,320 5,806 - - - - -
338
2.2 INTEREST RATE AND PRICE RISKS - BANKING BOOK
A1. General aspects, management and measurement of interest rate risk
The banking book’s interest rate risk is the risk of losses in its value due to potential changes in in-terest rates.
ICBPI’s funding and lending have historically mainly being obtained or granted through current accounts or with short-term maturities (nearly all within three months). As most of the liquidity in current accounts is that in the giro accounts, which are used for operating purposes and not for fun-ding and/or lending transactions, the bank’s actual exposure to this risk is rather limited.
The risk management unit monitors this risk daily to assess its impact using a method based on the guidance set out in Annex C of Title III, Chapter 1 of Bank of Italy Circular no. 285, which assesses the absorption in terms of internal capital of a variation of 200 bp on the return curve on the banking book, weighing the various exposures depending on their residual life and adopting an internal method to classify current accounts, as required by the above-mentioned supervisory regulations.
A2. General aspects, management and measurement of price risk
The banking book’s price risk mainly refers to the equity investments held for the long term and financial instruments, mostly Italian government bonds, which are not included in the trading book as they are also held for investment purposes.
B1. Fair value hedges
Not applicable.
B2. Cash flow hedges
The bank’s hedging strategies are generic and may also refer to the interest rate risk applicable to the on-demand items.
C. Hedges of investments in foreign operations
Not applicable.
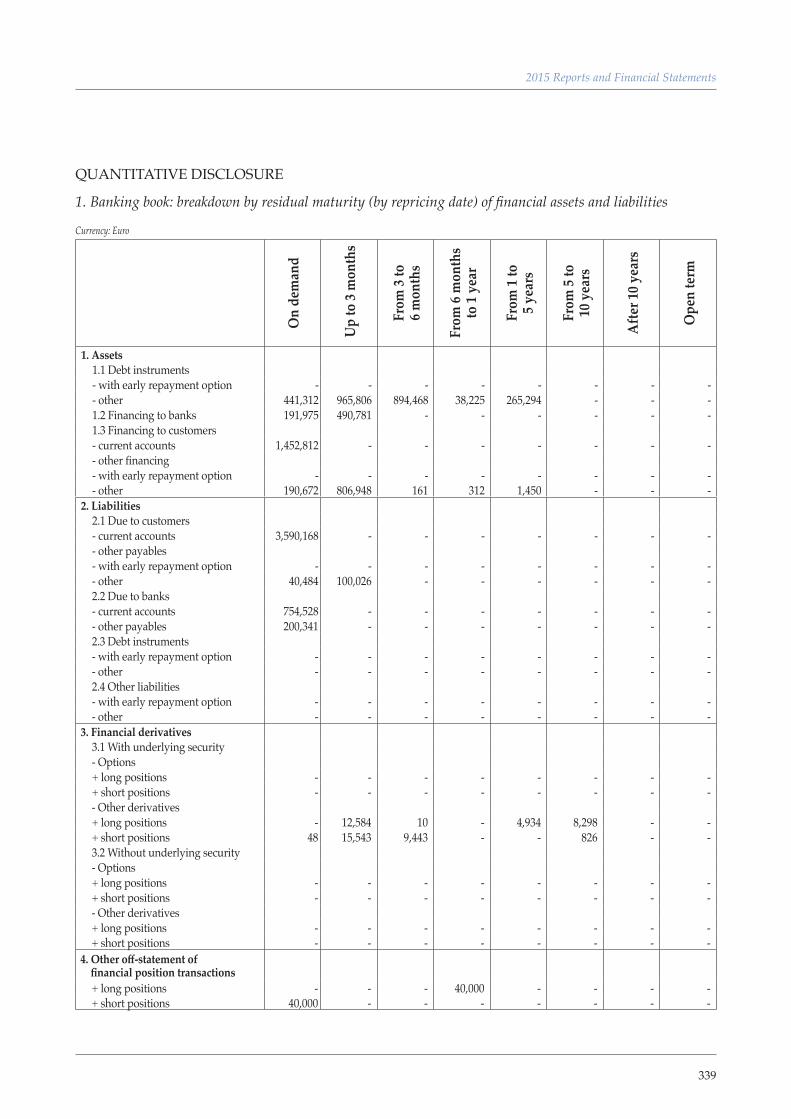
339
2015 Reports and Financial Statements
QUANTITATIVE DISCLOSURE
1. Banking book: breakdown by residual maturity (by repricing date) of financial assets and liabilities
Currency: Euro
On
dem
and
Up
to 3
mon
ths
From
3 to
6 m
onth
s
From
6 m
onth
s to
1 ye
ar
From
1 to
5 y
ears
From
5 to
10
yea
rs
Afte
r 10 y
ears
Ope
n te
rm
1. Assets 1.1 Debt instruments - with early repayment option - - - - - - - - - other 441,312 965,806 894,468 38,225 265,294 - - - 1.2 Financing to banks 191,975 490,781 - - - - - - 1.3 Financing to customers - current accounts 1,452,812 - - - - - - - - other financing - with early repayment option - - - - - - - - - other 190,672 806,948 161 312 1,450 - - -
2. Liabilities 2.1 Due to customers - current accounts 3,590,168 - - - - - - - - other payables - with early repayment option - - - - - - - - - other 40,484 100,026 - - - - - - 2.2 Due to banks - current accounts 754,528 - - - - - - - - other payables 200,341 - - - - - - - 2.3 Debt instruments - with early repayment option - - - - - - - - - other - - - - - - - - 2.4 Other liabilities - with early repayment option - - - - - - - - - other - - - - - - - -
3. Financial derivatives 3.1 With underlying security - Options + long positions - - - - - - - - + short positions - - - - - - - - - Other derivatives + long positions - 12,584 10 - 4,934 8,298 - - + short positions 48 15,543 9,443 - - 826 - - 3.2 Without underlying security - Options + long positions - - - - - - - - + short positions - - - - - - - - - Other derivatives + long positions - - - - - - - - + short positions - - - - - - - -
4. Other off-statement of financial position transactions
+ long positions - - - 40,000 - - - - + short positions 40,000 - - - - - - -
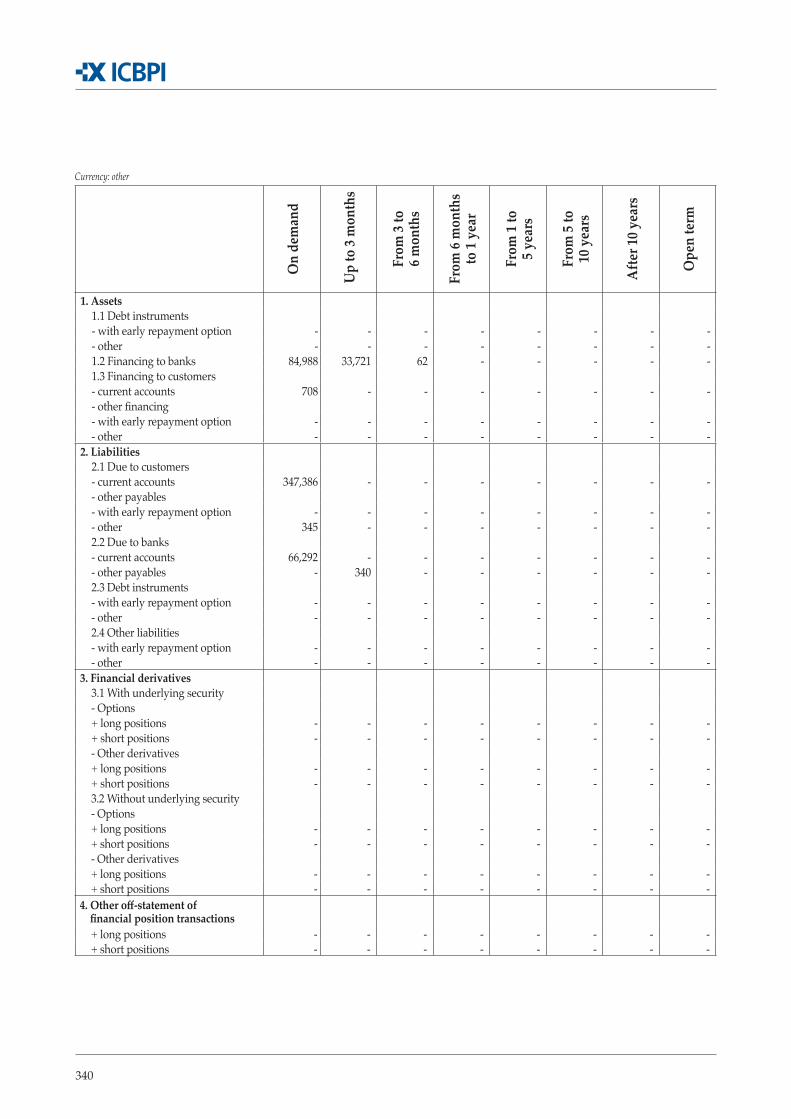
340
Currency: other
On
dem
and
Up
to 3
mon
ths
From
3 to
6 m
onth
s
From
6 m
onth
s to
1 ye
ar
From
1 to
5 y
ears
From
5 to
10
yea
rs
Afte
r 10 y
ears
Ope
n te
rm
1. Assets 1.1 Debt instruments - with early repayment option - - - - - - - - - other - - - - - - - - 1.2 Financing to banks 84,988 33,721 62 - - - - - 1.3 Financing to customers - current accounts 708 - - - - - - - - other financing - with early repayment option - - - - - - - - - other - - - - - - - -
2. Liabilities 2.1 Due to customers - current accounts 347,386 - - - - - - - - other payables - with early repayment option - - - - - - - - - other 345 - - - - - - - 2.2 Due to banks - current accounts 66,292 - - - - - - - - other payables - 340 - - - - - - 2.3 Debt instruments - with early repayment option - - - - - - - - - other - - - - - - - - 2.4 Other liabilities - with early repayment option - - - - - - - - - other - - - - - - - -
3. Financial derivatives 3.1 With underlying security - Options + long positions - - - - - - - - + short positions - - - - - - - - - Other derivatives + long positions - - - - - - - - + short positions - - - - - - - - 3.2 Without underlying security - Options + long positions - - - - - - - - + short positions - - - - - - - - - Other derivatives + long positions - - - - - - - - + short positions - - - - - - - -
4. Other off-statement of financial position transactions
+ long positions - - - - - - - - + short positions - - - - - - - -
341
2015 Reports and Financial Statements
2.3 CURRENCY RISK
A. General aspects, management and measurement of currency risk
Currency risk arises on the mismatch between foreign currency assets and liabilities (cash and forward) for each currency, originating from positions taken on by the centres specialised in market risk, within the assigned limits and proxies.
Currency risk nearly entirely arises on foreign currency trading activities carried out through tra-ding in market instruments. The risk management unit monitors this risk constantly by calculating the VaR while the treasury unit performs the relevant first level controls.
The bank’s exposure to currency risk, calculated using the net foreign currency positions and a me-thod in line with the supervisory regulations, is negligible because every foreign currency transac-tion with institutional counterparties that generates a currency risk is usually hedged on the market with an offsetting transaction.
B. Currency hedges
The trading book is completely hedged with spot forex positions.
The risk management unit checks that the VaR on existing positions is always within the limits set by the finance regulation every day.
C. Transfer risk
The transfer risk is defined as the risk that a bank, exposed to a party that finances itself in a currency different to that in which it earns most of its income, makes losses due to the debtor’s difficulties in converting its currency into the currency of its exposure.
The bank is potentially exposed to this risk due to its credit exposures in foreign currencies and Euro credit exposures of parties based in countries with a legal tender that is not the Euro.
A detailed analysis of these exposures shows that most of them are with operators, such as Eurocle-ar, Clearstream and BNP Paribas that operate as multi-currency settlement houses. Therefore, it can be assumed that they are able to convert currencies except in extreme conditions of their illiquidity.
Therefore, the bank’s transfer risk is very modest, especially if compared to the entire credit risk (of which it can be considered to be an additional component). The amount and composition of expo-sures potentially exposed to transfer risk are monitored every six months to identify any changes.
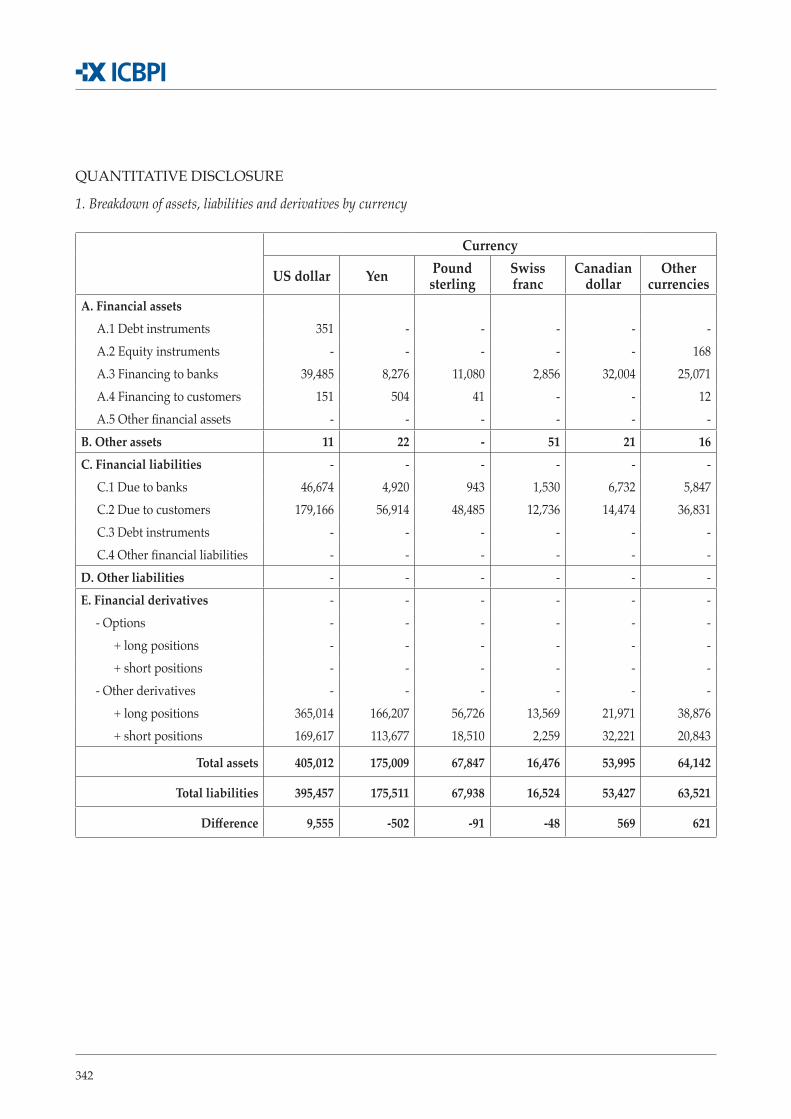
342
QUANTITATIVE DISCLOSURE
1. Breakdown of assets, liabilities and derivatives by currency
Currency
US dollar Yen Pound sterling
Swiss franc
Canadian dollar
Other currencies
A. Financial assets A.1 Debt instruments 351 - - - - - A.2 Equity instruments - - - - - 168 A.3 Financing to banks 39,485 8,276 11,080 2,856 32,004 25,071 A.4 Financing to customers 151 504 41 - - 12 A.5 Other financial assets - - - - - -
B. Other assets 11 22 - 51 21 16 C. Financial liabilities - - - - - -
C.1 Due to banks 46,674 4,920 943 1,530 6,732 5,847 C.2 Due to customers 179,166 56,914 48,485 12,736 14,474 36,831 C.3 Debt instruments - - - - - - C.4 Other financial liabilities - - - - - -
D. Other liabilities - - - - - - E. Financial derivatives - - - - - - - Options - - - - - - + long positions - - - - - - + short positions - - - - - - - Other derivatives - - - - - - + long positions 365,014 166,207 56,726 13,569 21,971 38,876 + short positions 169,617 113,677 18,510 2,259 32,221 20,843
Total assets 405,012 175,009 67,847 16,476 53,995 64,142
Total liabilities 395,457 175,511 67,938 16,524 53,427 63,521
Difference 9,555 -502 -91 -48 569 621
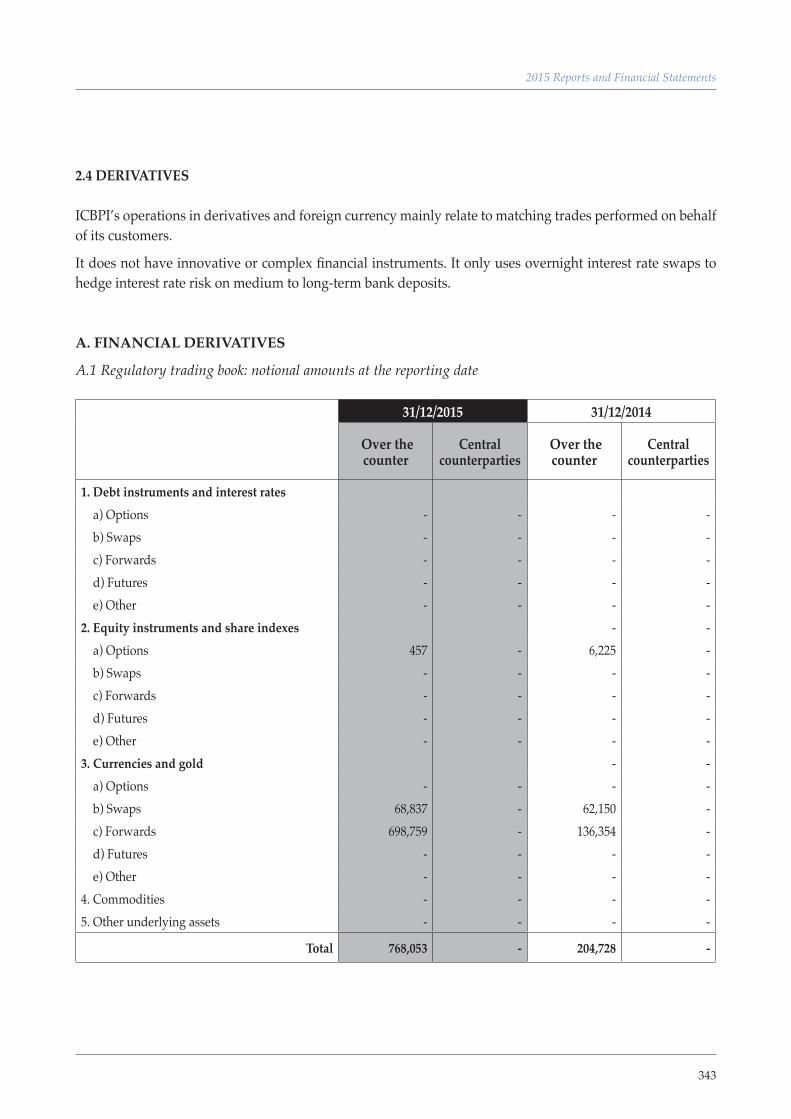
343
2015 Reports and Financial Statements
2.4 DERIVATIVES
ICBPI’s operations in derivatives and foreign currency mainly relate to matching trades performed on behalf of its customers.
It does not have innovative or complex financial instruments. It only uses overnight interest rate swaps to hedge interest rate risk on medium to long-term bank deposits.
A. FINANCIAL DERIVATIVES
A.1 Regulatory trading book: notional amounts at the reporting date
31/12/2015 31/12/2014
Over the counter
Central counterparties
Over the counter
Central counterparties
1. Debt instruments and interest rates a) Options - - - - b) Swaps - - - - c) Forwards - - - - d) Futures - - - - e) Other - - - - 2. Equity instruments and share indexes - - a) Options 457 - 6,225 - b) Swaps - - - - c) Forwards - - - - d) Futures - - - - e) Other - - - - 3. Currencies and gold - - a) Options - - - - b) Swaps 68,837 - 62,150 - c) Forwards 698,759 - 136,354 - d) Futures - - - - e) Other - - - - 4. Commodities - - - - 5. Other underlying assets - - - -
Total 768,053 - 204,728 -
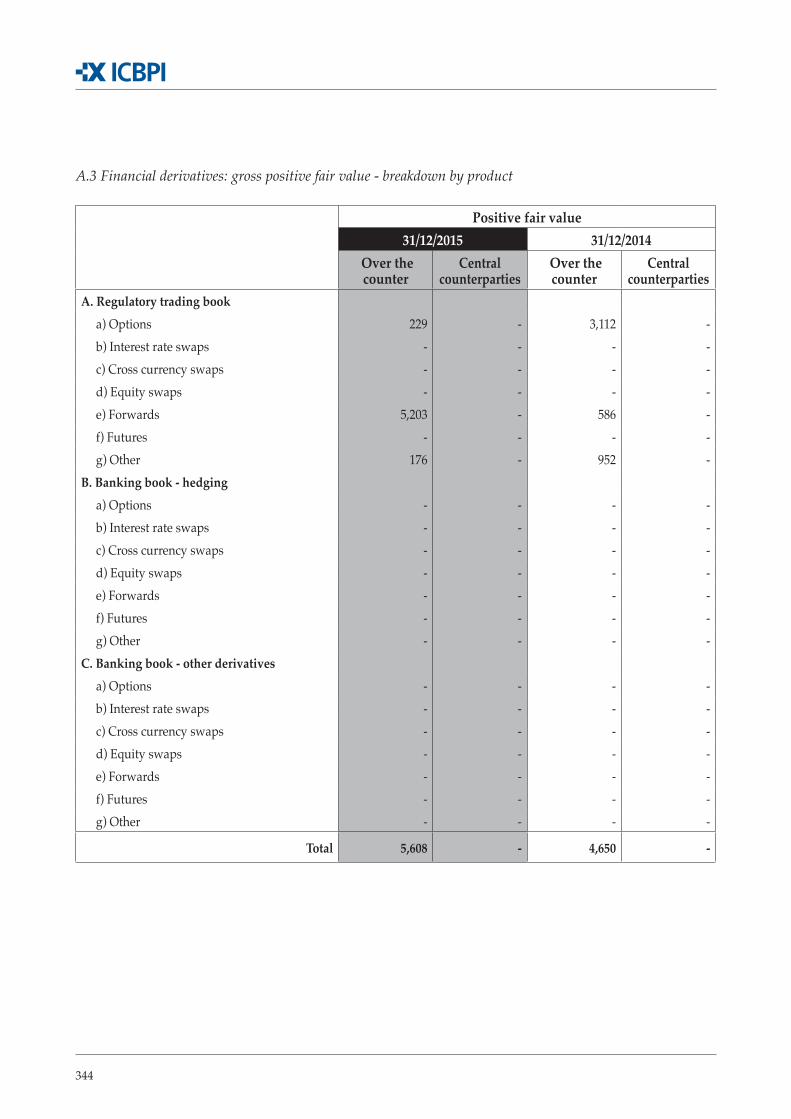
344
A.3 Financial derivatives: gross positive fair value - breakdown by product
Positive fair value31/12/2015 31/12/2014
Over the counter
Central counterparties
Over the counter
Central counterparties
A. Regulatory trading book a) Options 229 - 3,112 - b) Interest rate swaps - - - - c) Cross currency swaps - - - - d) Equity swaps - - - - e) Forwards 5,203 - 586 - f) Futures - - - - g) Other 176 - 952 - B. Banking book - hedging a) Options - - - - b) Interest rate swaps - - - - c) Cross currency swaps - - - - d) Equity swaps - - - - e) Forwards - - - - f) Futures - - - - g) Other - - - - C. Banking book - other derivatives a) Options - - - - b) Interest rate swaps - - - - c) Cross currency swaps - - - - d) Equity swaps - - - - e) Forwards - - - - f) Futures - - - - g) Other - - - -
Total 5,608 - 4,650 -
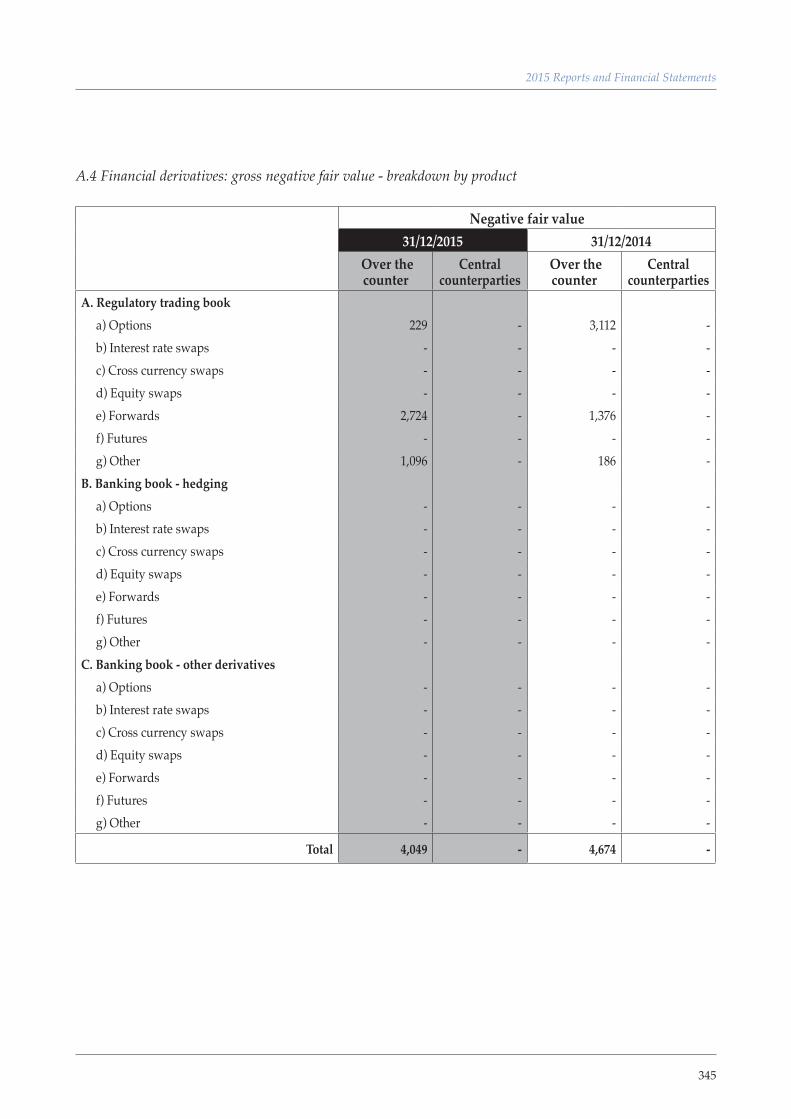
345
2015 Reports and Financial Statements
A.4 Financial derivatives: gross negative fair value - breakdown by product
Negative fair value31/12/2015 31/12/2014
Over the counter
Central counterparties
Over the counter
Central counterparties
A. Regulatory trading book a) Options 229 - 3,112 - b) Interest rate swaps - - - - c) Cross currency swaps - - - - d) Equity swaps - - - - e) Forwards 2,724 - 1,376 - f) Futures - - - - g) Other 1,096 - 186 - B. Banking book - hedging a) Options - - - - b) Interest rate swaps - - - - c) Cross currency swaps - - - - d) Equity swaps - - - - e) Forwards - - - - f) Futures - - - - g) Other - - - - C. Banking book - other derivatives a) Options - - - - b) Interest rate swaps - - - - c) Cross currency swaps - - - - d) Equity swaps - - - - e) Forwards - - - - f) Futures - - - - g) Other - - - -
Total 4,049 - 4,674 -
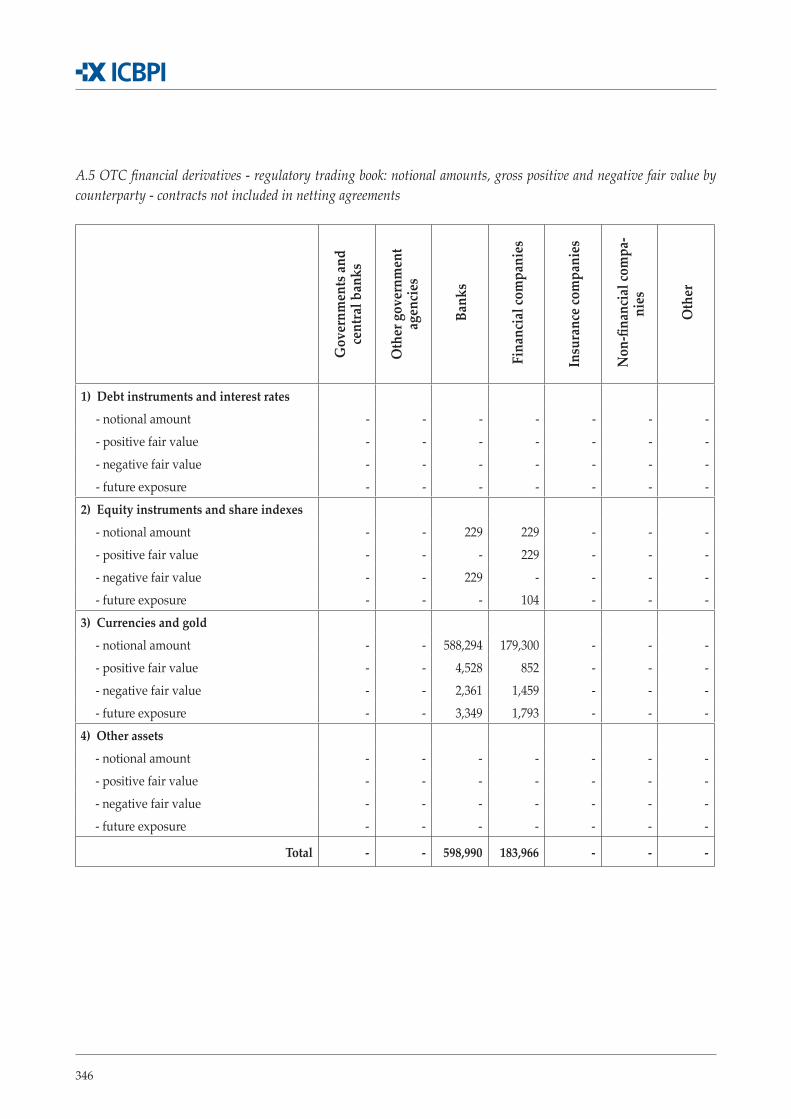
346
A.5 OTC financial derivatives - regulatory trading book: notional amounts, gross positive and negative fair value by counterparty - contracts not included in netting agreements
Gov
ernm
ents
and
cent
ral b
anks
Oth
er g
over
nmen
t ag
enci
es
Ban
ks
Fin
anci
al co
mpa
nies
Insu
ranc
e com
pani
es
Non
-fina
ncia
l com
pa-
nies
Oth
er
1) Debt instruments and interest rates - notional amount - - - - - - - - positive fair value - - - - - - - - negative fair value - - - - - - - - future exposure - - - - - - - 2) Equity instruments and share indexes - notional amount - - 229 229 - - - - positive fair value - - - 229 - - - - negative fair value - - 229 - - - - - future exposure - - - 104 - - - 3) Currencies and gold - notional amount - - 588,294 179,300 - - - - positive fair value - - 4,528 852 - - - - negative fair value - - 2,361 1,459 - - - - future exposure - - 3,349 1,793 - - - 4) Other assets - notional amount - - - - - - - - positive fair value - - - - - - - - negative fair value - - - - - - - - future exposure - - - - - - -
Total - - 598,990 183,966 - - -

347
2015 Reports and Financial Statements
A.9 Residual maturity of OTC financial derivatives: notional amounts
Up to 1 year
From 1 to 5 years
After 5 years Total
A. Regulatory trading bookA.1 Financial derivatives on debt instruments and interest rates
- - - -
A.2 Financial derivatives on equity instruments and share indexes
457 - - 457
A.3 Financial derivatives on currencies and gold 767,596 - - 767,596 A.4 Financial derivatives on other assets - - - -
B. Banking book - - - - A.1 Financial derivatives on debt instruments and interest rates
- - - -
B.2 Financial derivatives on equity instruments and share indexes
- - - -
B.3 Financial derivatives on currencies and gold - - - - B.4 Financial derivatives on other assets - - - -
TOTAL A + B at 31/12/2015 768,053 - - 768,053
TOTAL A + B at 31/12/2014 204,729 - - 204,729
B. CREDIT DERIVATIVES
ICBPI does not have credit derivatives at the reporting date.
C. FINANCIAL DERIVATIVES
ICBPI does not have financial derivatives at the reporting date.
SECTION 3 - LIQUIDITY RISK
A. General aspects, management and measurement of liquidity risk
Liquidity risk is the risk that the bank is unable to meet its payment commitments due to its inability to raise funds on the market (funding liquidity risk) and/or to disinvest its assets (market liquidity risk). This risk includes the risk of meeting its commitments at non-market costs, i.e., incurring high costs to obtain funding or (and sometimes simultaneously) incurring losses when disinvesting as-sets.
The bank’s general liquidity risk management policy is characterised by modest risk appetite and
348
prudently privileges a balance between assets and liabilities as part of its strategy to increase pro-fitability. Deadlines and amounts of its cash flows allow it to limit liquidity risk with the balanced return of funds, notwithstanding the fact that ICBPI is very capable of financing itself in very short periods (one to three days).
Therefore, the bank is not significantly exposed to liquidity risk. Its liabilities mainly consist of cur-rent accounts with banks or customers set up to be used as part of its core business rather than for funding purposes. An analysis of its due dates does not show any critical issues, given the nature of the underlying transactions. Moreover, with respect to its positions other than current accounts, there are no critical issues relating to acceleration clauses or clauses requiring additional guarantees if the group companies are downgraded.
The related liquidity policy and contingency funding plan, approved by the bank’s board of direc-tors, sets the guidelines for liquidity management (liquidity policy) and the rules to be adopted in a liquidity crisis (contingency funding plan). It incorporates the most recent regulatory updates (Bank of Italy Circular no. 285/2013) and the principles of the risk policy, thus integrating and completing the rules defined in the finance regulation.
The liquidity policy defines the actions to be performed daily to ensure a balance between cash in-flows and outflows by monitoring existing and future financial positions. It also includes a vast ran-ge of indicators to facilitate the monitoring of the bank’s liquidity profile and to promptly identify any deterioration caused by internal factors or systemic factors.
The contingency funding plan (CFP) assesses the actions to be taken if there is a drastic reduction in liquidity and the bank has certain lending commitments (e-money service and lending transac-tions that cannot easily be converted into liquidity) caused by either sector-wide liquidity crises or specific liquidity crises. It specifically describes what happens when a normal operating situation deteriorates into an operating stress or crisis situation, based on trends in quantitative and/or quali-tative indicators (internal or sector) that are monitored daily. The plan also presents how to manage stress or crisis situations and specifies how the relevant units are to react and their responsibilities.
Liquidity risk is assessed by monitoring the accumulated balance of the daily situation each day, which is the most critical considering the bank’s typical modus operandi. The results of this process are included in the weekly preparation of the relevant indicator. Once a day, the risk management unit performs a simulation based on the same stress situations applied to the weekly monitoring. It calculates the run-off ratios for the different on demand items related to the “critical” category using the compound interest method and recalculates the accumulated balance in a stress situation, being the sum of the balance in a non-stress situation and outflows required in a stress situation.
Once a week, the risk management unit checks the net accumulated balance of the positions falling due (using the closing positions every Tuesday evening). The net accumulated balance of the posi-tions falling due is calculated considering the inflows and outflows expected during the different “due” categories (11 in total, which go from one day to four months). The schedule also includes data about forecast unrecorded flows or future flows the exact amount of which are not known. The
349
2015 Reports and Financial Statements
risk management unit then sends Bank of Italy a liquidity report once a week.
The treasury and finance unit monitors and checks cash flows and estimates their trends during a business day. The intraday liquidity risk relates to the time mismatch between incoming and out-going payment flows (the latter have different daily cut-offs). In order to mitigate these risks, the regulators require that banks have an appropriate intraday reserve (consisting of eligible, readily convertible into cash securities) to cover their obligations (specific risk) or the sudden illiquidity of markets or bankruptcy of a counterparty in the settlement system (sector risk). Accordingly, the bank has securities (CCT Italian treasury credit certificates and eligible bank bonds) as its intraday reserve for an amount deemed suitable to cover its specific operating needs based on an estimate of the intraday cash outflows.
The treasury and finance unit also closely monitors the bank’s liquidity held in an account with the Italian central bank so as to cover its commitments arising from target movements.
A1. The TIT system
The liquidity risk governance and management tools include the TIT system (internal transfer of funds system), introduced to comply with the provisions of Bank of Italy Circular no. 263 (and now also Circular no. 285, part I, title IV, chapter 6, section IV) in 2012.
A2. LCR/NSFR
In 2010, the bank introduced the assessment and analysis procedures to make its monitoring of liquidity consistent with the requirements of the Basel Committee as well as, obviously, the additio-nal guidance and regulations issued by the control bodies and authorities (e.g., the CRR Regulation and the CRD IV Directive issued by the European Commission to implement the Basel Committee’s indications at EU level).
These requirements introduced, inter alia, two ratios to measure liquidity, the LCR (liquidity cove-rage ratio) and the NSFR (net stable funding ratio). They are used to monitor short-term liquidity (one month) and structural liquidity (one year), respectively. Starting from 31 December 2011 and as part of the QIS (quantitative impact study) on the impact of the Basel 3 regulations, the bank sends Bank of Italy half yearly reports showing the results of its calculation of the liquidity ratios using its financial reporting data.
The bank’s liquidity position remained within the risk limits set by its current liquidity policy in 2015 and, indeed, the regulatory ratio established by Basel 3 (LCR) was complied with, being better than the established values.
A3. Liquidity and risk appetite framework
Liquidity is one of the factors included in the risk appetite framework (RAF) and is considered to be

350
one of the most important for ICBPI. Its inclusion is justified by the importance in managing liqui-dity in the current market situation and given the specific nature of the cash inflows and outflows generated by the bank’s business.
The RAF defines the following two liquidity parameters:
▪ Liquidity Coverage Ratio – LCR, i.e., the ratio of liquid assets (HQLA - high quality liquid assets) to net cash flows in the 30 days of a very acute stress scenario;
▪ the ratio of the minimum cumulated net balance of the “critical bracket” (minimum daily amount for the quarter) to total assets (most recent figure).
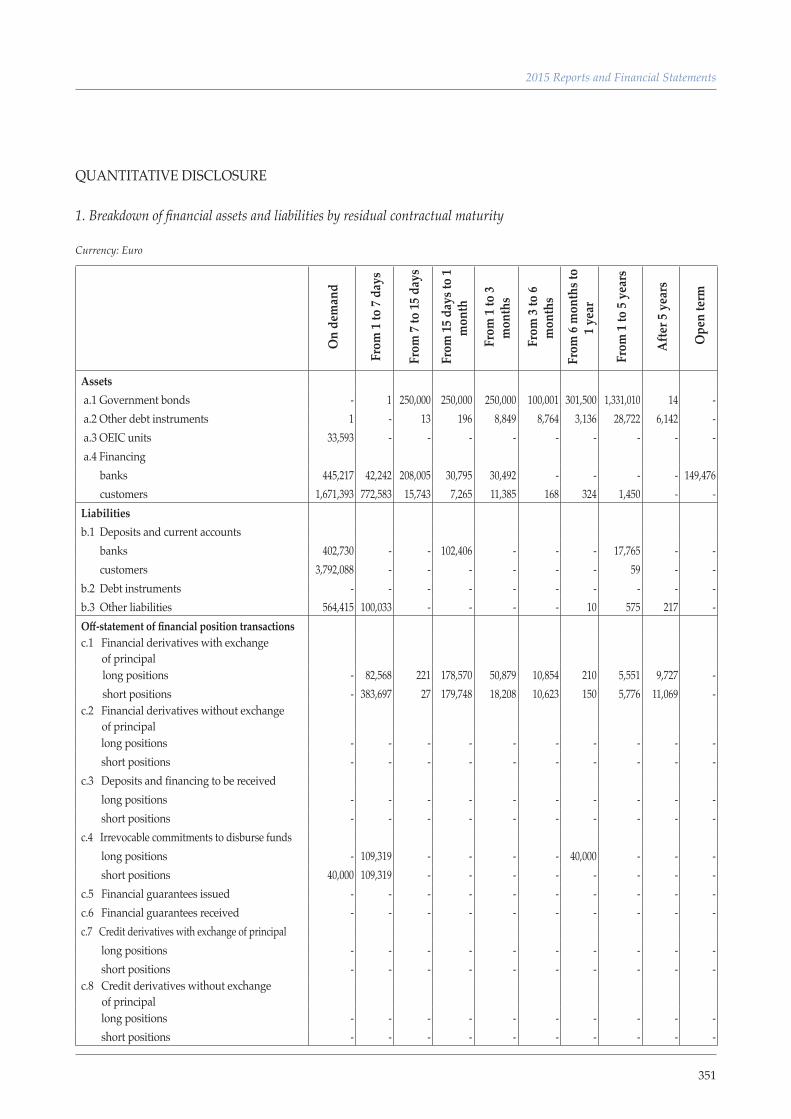
351
2015 Reports and Financial Statements
QUANTITATIVE DISCLOSURE 1. Breakdown of financial assets and liabilities by residual contractual maturity
Currency: Euro
O
n de
man
d
Fro
m 1
to 7
days
Fro
m 7
to 15
day
s
Fro
m 15
day
s to
1 m
onth
Fro
m 1
to 3
mon
ths
Fro
m 3
to 6
mon
ths
Fro
m 6
mon
ths t
o 1 y
ear
Fro
m 1
to 5
year
s
Afte
r 5 y
ears
Ope
n te
rm
Assets a.1 Government bonds - 1 250,000 250,000 250,000 100,001 301,500 1,331,010 14 - a.2 Other debt instruments 1 - 13 196 8,849 8,764 3,136 28,722 6,142 - a.3 OEIC units 33,593 - - - - - - - - - a.4 Financing
banks 445,217 42,242 208,005 30,795 30,492 - - - - 149,476 customers 1,671,393 772,583 15,743 7,265 11,385 168 324 1,450 - -
Liabilities b.1 Deposits and current accounts
banks 402,730 - - 102,406 - - - 17,765 - - customers 3,792,088 - - - - - - 59 - -
b.2 Debt instruments - - - - - - - - - - b.3 Other liabilities 564,415 100,033 - - - - 10 575 217 - Off-statement of financial position transactions c.1 Financial derivatives with exchange of principal
long positions - 82,568 221 178,570 50,879 10,854 210 5,551 9,727 - short positions - 383,697 27 179,748 18,208 10,623 150 5,776 11,069 -
c.2 Financial derivatives without exchange of principal
long positions - - - - - - - - - - short positions - - - - - - - - - -
c.3 Deposits and financing to be received long positions - - - - - - - - - - short positions - - - - - - - - - -
c.4 Irrevocable commitments to disburse funds long positions - 109,319 - - - - 40,000 - - - short positions 40,000 109,319 - - - - - - - -
c.5 Financial guarantees issued - - - - - - - - - - c.6 Financial guarantees received - - - - - - - - - - c.7 Credit derivatives with exchange of principal
long positions - - - - - - - - - - short positions - - - - - - - - - -
c.8 Credit derivatives without exchange of principal
long positions - - - - - - - - - - short positions - - - - - - - - - -
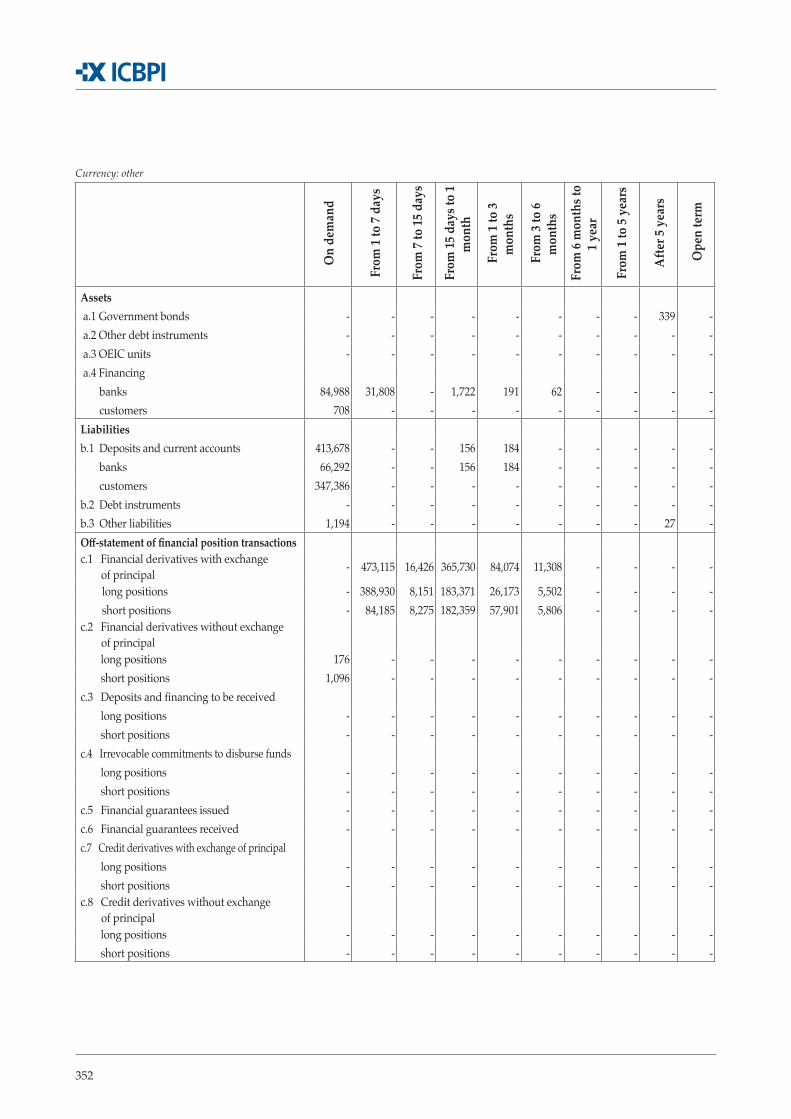
352
Currency: other
On
dem
and
Fro
m 1
to 7
days
Fro
m 7
to 15
day
s
Fro
m 15
day
s to
1 m
onth
Fro
m 1
to 3
mon
ths
Fro
m 3
to 6
mon
ths
Fro
m 6
mon
ths t
o 1 y
ear
Fro
m 1
to 5
year
s
Afte
r 5 y
ears
Ope
n te
rm
Assets a.1 Government bonds - - - - - - - - 339 - a.2 Other debt instruments - - - - - - - - - - a.3 OEIC units - - - - - - - - - - a.4 Financing
banks 84,988 31,808 - 1,722 191 62 - - - - customers 708 - - - - - - - - -
Liabilities b.1 Deposits and current accounts 413,678 - - 156 184 - - - - -
banks 66,292 - - 156 184 - - - - - customers 347,386 - - - - - - - - -
b.2 Debt instruments - - - - - - - - - - b.3 Other liabilities 1,194 - - - - - - - 27 - Off-statement of financial position transactions c.1 Financial derivatives with exchange of principal - 473,115 16,426 365,730 84,074 11,308 - - - -
long positions - 388,930 8,151 183,371 26,173 5,502 - - - - short positions - 84,185 8,275 182,359 57,901 5,806 - - - -
c.2 Financial derivatives without exchange of principal
long positions 176 - - - - - - - - - short positions 1,096 - - - - - - - - -
c.3 Deposits and financing to be received long positions - - - - - - - - - - short positions - - - - - - - - - -
c.4 Irrevocable commitments to disburse funds long positions - - - - - - - - - - short positions - - - - - - - - - -
c.5 Financial guarantees issued - - - - - - - - - - c.6 Financial guarantees received - - - - - - - - - - c.7 Credit derivatives with exchange of principal
long positions - - - - - - - - - - short positions - - - - - - - - - -
c.8 Credit derivatives without exchange of principal
long positions - - - - - - - - - - short positions - - - - - - - - - -
353
2015 Reports and Financial Statements
SECTION 4 – OPERATIONAL RISKS
A. General aspects, management and measurement of operational risk
Operational risk is the risk of losses arising from errors or shortfalls in internal procedures, human resources or systems and external factors, including judicial risk. This risk also comprises legal risk, model risk and the risk related to financial transactions including those related to market risk.
Operational risk is characterised by cause-effect relationships whereby if one or more trigger events occur, this leads to a detrimental event which is directly linked to an economic loss. Therefore, an operating loss is the result of negative economic effects created by operating events, recorded by the bank and that affect its profit or loss.
The main characteristic of operational risks is that they are inherent to the bank’s business and are, therefore, unavoidable and omnipresent. This implies that they are inherent in the decision to perform a certain activity and, in general, the bank’s operations rather than, in the case of the other risks, the bank intentionally takes credit or financial positions based on its risk appetite to achieve its target risk/return profile. In order to measure the bank’s exposure to operational risks and the effects of any mitigating actions, it has to combine the qualitative and quantitative information.
The bank manages its operational risks through specific insurance policies and through:
▪ a suitable internal organisation with defined duties and responsibilities, ensuring the segrega-tion of duties between the control and operating units;
▪ adoption of first level controls for each process to:
▪ monitor their correct performance;
▪ promptly identify any irregularities and, if necessary, introduction of timely remedial ac-tions;
▪ identify technical-organisational defects and ensure their timely analysis and correction;
▪ introduction of a code of ethics for employees;
▪ internal regulations;
▪ a risk control self-assessment (RCSA);
▪ a loss data collection (LDC) process;
▪ specific computer risk controls.
The main procedures for ensuring that the operational risk is managed correctly by the risk mana-gement unit are listed below:
▪ definition and updating of the operational risk management methods;
▪ second level controls over operational risk management;
▪ collection and analysis of operating loss data by type of event and business segment;
354
▪ definition of specific risk indicators and escalation proposals, performance and coordination of the RCSA;
▪ assistance with identification of operational risks inherent in new services/products during the design stage;
▪ appointment of an internal reference person to design and monitor the information safety mana-gement system;
▪ preparation of periodic reports or reports on specific events to general management, the control bodies and the internal audit and compliance units;
▪ annual valuation of the assessment framework for operational risks related to retail payment systems, carried out with the payment unit as per the Italian central bank’s instructions in the relevant regulations.
The bank has adopted an operational risk framework, which includes an operational risk policy and the RCSA and loss data collection methods as specified by Bank of Italy with respect to prudent su-pervisory requirements.
The operational risk policy has the following objectives:
• set out the general operational risk governance principles, the aims, methods and tools adopted;
• present the roles and responsibilities of the units involved;
• describe the operational risk governance framework processes and reference models.
As part of this operational risk management (ORM) framework, the risk control self-assessment (RCSA) process is used for a scenario analysis with the direct involvement of the internal units. It is a useful management tool, especially for the correct understanding of the business processes’ riskiness by the units. As well as the ex ante identification of operational risks, the assessment is fundamental to disseminate a control culture. The RCSA method also includes the model used to assess the effect of operating events on the bank’s reputation.
The RCSA is part of the ongoing monitoring of operational risks. It is designed to ensure ongoing awareness of risks managed or to be managed and is performed not only annually but also when there are significant variations in the bank’s organisation or business. The model to assess the effects of operating events on the bank’s reputation is made of the RCSA method. The loss data collection process is a key part of the operational risks management system because it both guarantees an understanding of the most significant loss factors over time and provides statistics useful to better analyse identified risks. Moreover, the identification and measurement of potentially risky activities allows the bank to monitor and identify over time the most risky factors and to inter-vene to remove the reasons and/or strengthen its controls. The LDC process is based on the LDC method approved as part of the operational risk policy and its objective is to estimate the value of an economic effect generated by an operating event, caused by one or more risk factors. The information is the result of a relationship between different factors: the
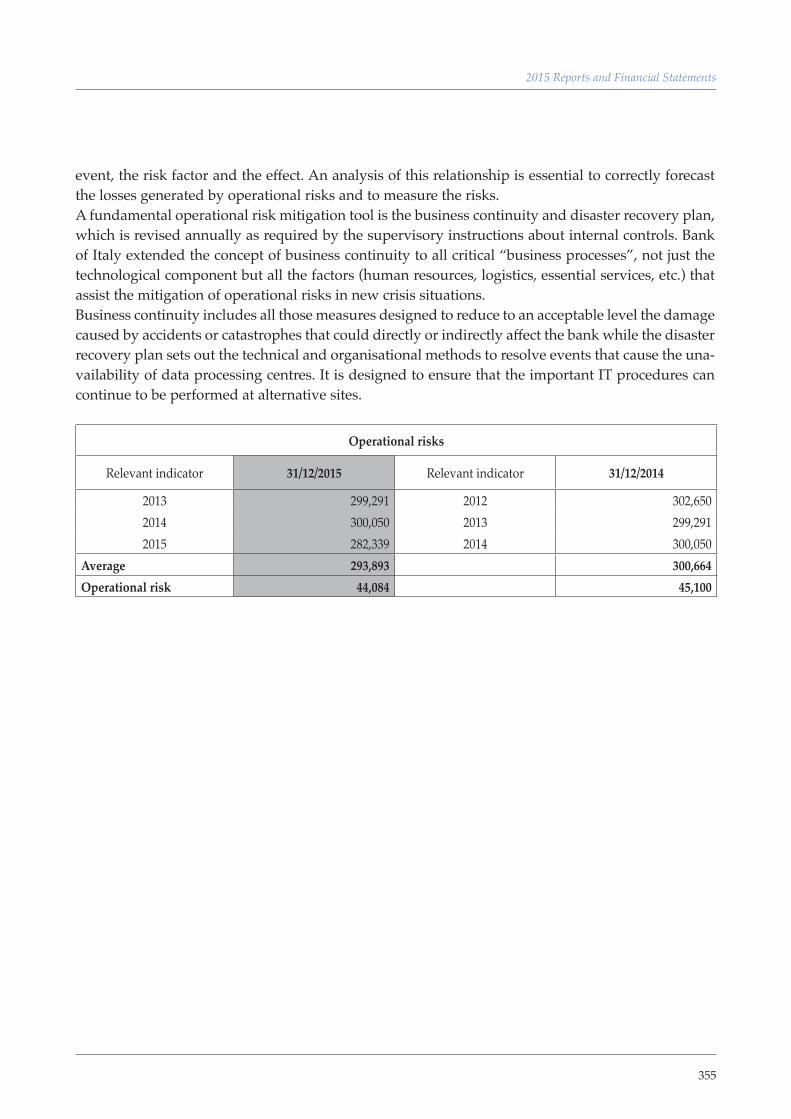
355
2015 Reports and Financial Statements
event, the risk factor and the effect. An analysis of this relationship is essential to correctly forecast the losses generated by operational risks and to measure the risks. A fundamental operational risk mitigation tool is the business continuity and disaster recovery plan, which is revised annually as required by the supervisory instructions about internal controls. Bank of Italy extended the concept of business continuity to all critical “business processes”, not just the technological component but all the factors (human resources, logistics, essential services, etc.) that assist the mitigation of operational risks in new crisis situations. Business continuity includes all those measures designed to reduce to an acceptable level the damage caused by accidents or catastrophes that could directly or indirectly affect the bank while the disaster recovery plan sets out the technical and organisational methods to resolve events that cause the una-vailability of data processing centres. It is designed to ensure that the important IT procedures can continue to be performed at alternative sites.
Operational risks
Relevant indicator 31/12/2015 Relevant indicator 31/12/2014
2013 299,291 2012 302,650 2014 300,050 2013 299,291 2015 282,339 2014 300,050
Average 293,893 300,664 Operational risk 44,084 45,100
356
Part F - EQUITY
Section 1 - Equity
A. QUALITATIVE DISCLOSURE
ICBPI’s equity policy is based on full compliance with the supervisory regulation requirements, which identify equity as the main tool against unexpected losses arising from the various risks (cre-dit, market and operational) taken on by banks. Therefore, equity availability is an indispensable tool supporting the bank’s development plans.
In accordance with internal procedures, the relevant departments regularly monitor the bank’s use of capital and its compliance with capital requirements. These figures are reported with different frequencies to senior management and the board of directors, which are the bodies responsible for deciding, in line with their delegated powers, the methods that the bank should use to pursue its capital management objectives. Similarly, when new activities with potential impacts on the use of capital are carried out, ICBPI forecasts the related effects on equity and their suitability.
Lastly, the bank’s dividend distribution policies are also aimed at ensuring a suitable capitalisation level, in line with its development objectives
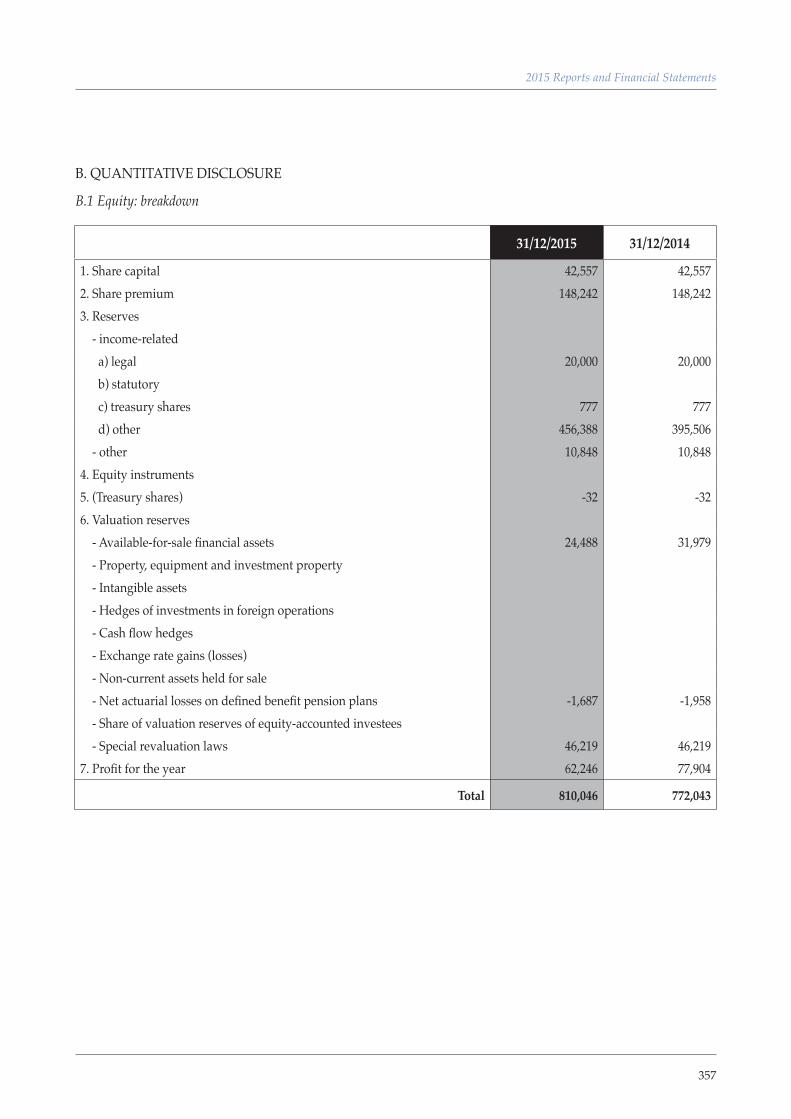
357
2015 Reports and Financial Statements
B. QUANTITATIVE DISCLOSURE
B.1 Equity: breakdown
31/12/2015 31/12/2014
1. Share capital 42,557 42,557 2. Share premium 148,242 148,242 3. Reserves - income-related a) legal 20,000 20,000 b) statutory c) treasury shares 777 777 d) other 456,388 395,506 - other 10,848 10,848 4. Equity instruments5. (Treasury shares) -32 -32 6. Valuation reserves - Available-for-sale financial assets 24,488 31,979 - Property, equipment and investment property - Intangible assets - Hedges of investments in foreign operations - Cash flow hedges - Exchange rate gains (losses) - Non-current assets held for sale - Net actuarial losses on defined benefit pension plans -1,687 -1,958 - Share of valuation reserves of equity-accounted investees - Special revaluation laws 46,219 46,219 7. Profit for the year 62,246 77,904
Total 810,046 772,043

358
B.2 Fair value reserves (AFS financial assets): breakdown
31/12/2015 31/12/2014Fair value gains Fair value losses Fair value gains Fair value losses
1. Debt instruments 24,548 -61 31,979 - 2. Equity instruments - - - - 3. OEIC units - - - - 4. Financing
Total 24,548 -61 31,979 -
B.3 Fair value reserves (AFS financial assets): changes
Debt instruments
Equity instruments OEIC units Financing
1. Opening balance 31,979 - 2. Increases2.1 Fair value gains2.2 Reclassification of fair value losses to profit or loss: due to impairment on sale2.3 Other increases3. Decreases3.1 Fair value losses3.2 Impairment losses3.3 Reclassification of fair value gains to profit or loss: on sale3.4 Other decreases 7,430 614. Closing balance 24,549 -61
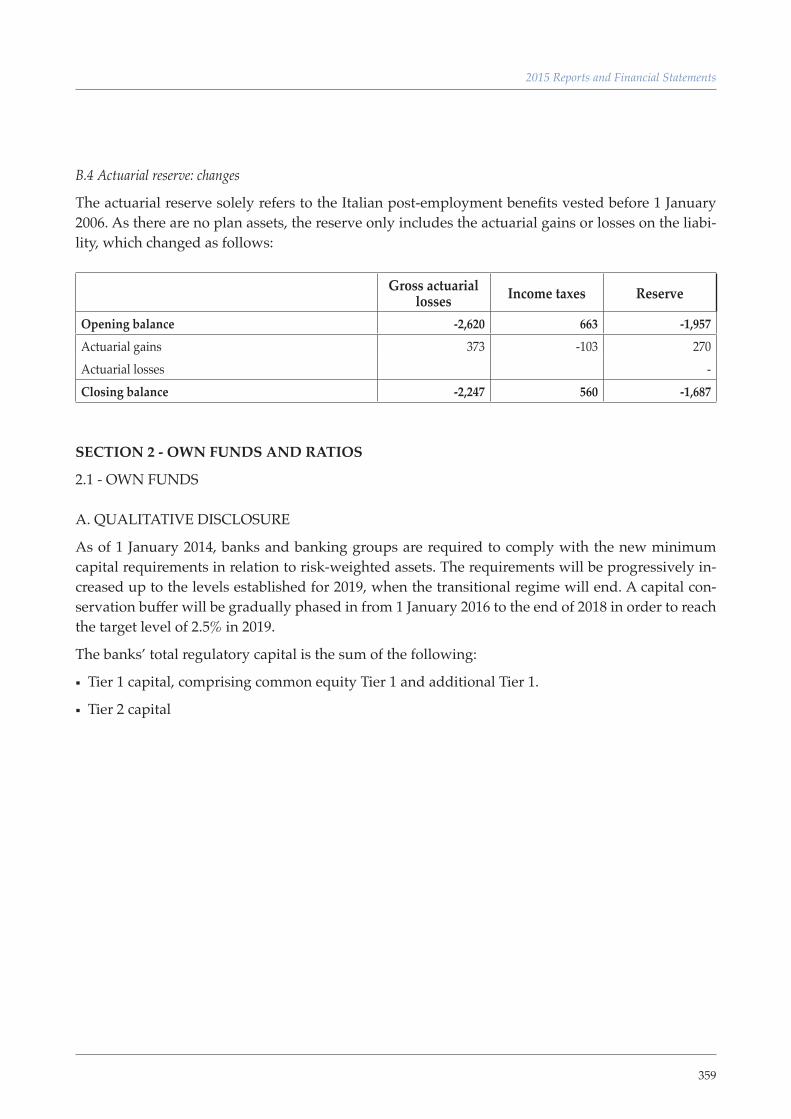
359
2015 Reports and Financial Statements
B.4 Actuarial reserve: changes
The actuarial reserve solely refers to the Italian post-employment benefits vested before 1 January 2006. As there are no plan assets, the reserve only includes the actuarial gains or losses on the liabi-lity, which changed as follows:
Gross actuarial losses Income taxes Reserve
Opening balance -2,620 663 -1,957 Actuarial gains 373 -103 270 Actuarial losses - Closing balance -2,247 560 -1,687
SECTION 2 - OWN FUNDS AND RATIOS
2.1 - OWN FUNDS A. QUALITATIVE DISCLOSURE
As of 1 January 2014, banks and banking groups are required to comply with the new minimum capital requirements in relation to risk-weighted assets. The requirements will be progressively in-creased up to the levels established for 2019, when the transitional regime will end. A capital con-servation buffer will be gradually phased in from 1 January 2016 to the end of 2018 in order to reach the target level of 2.5% in 2019.
The banks’ total regulatory capital is the sum of the following:
▪ Tier 1 capital, comprising common equity Tier 1 and additional Tier 1.
▪ Tier 2 capital
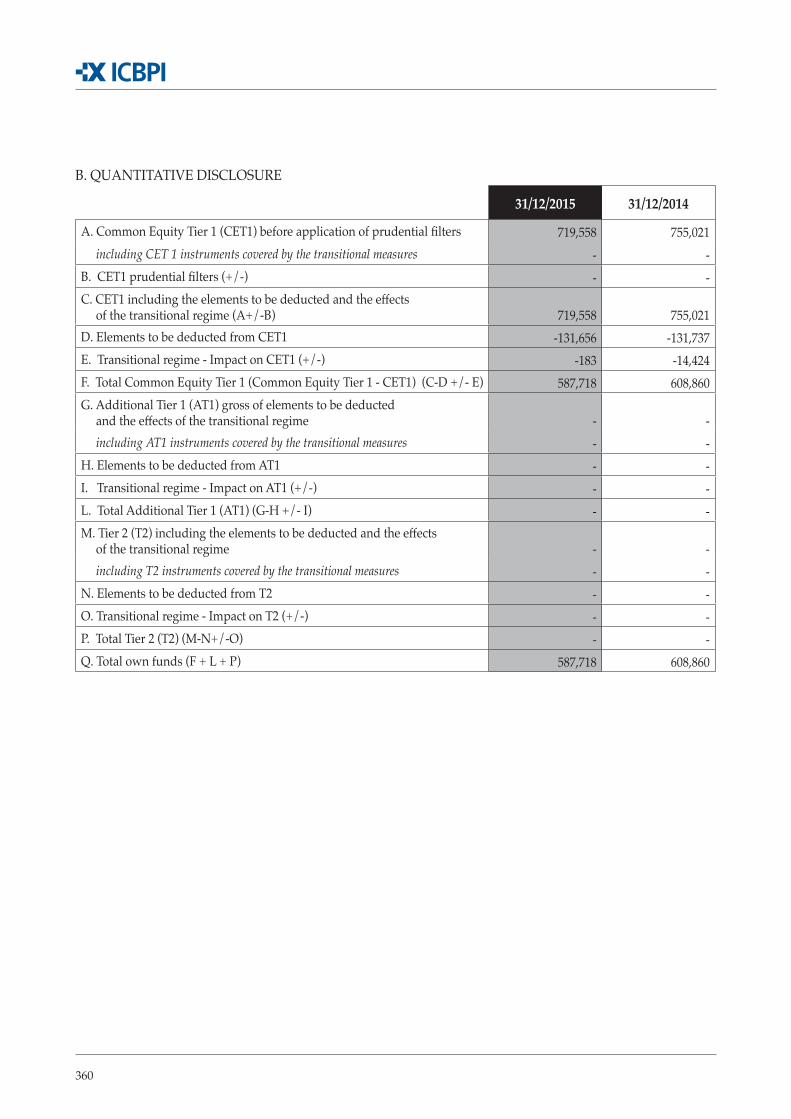
360
B. QUANTITATIVE DISCLOSURE
31/12/2015 31/12/2014
A. Common Equity Tier 1 (CET1) before application of prudential filters 719,558 755,021 including CET 1 instruments covered by the transitional measures - - B. CET1 prudential filters (+/-) - - C. CET1 including the elements to be deducted and the effects of the transitional regime (A+/-B) 719,558 755,021 D. Elements to be deducted from CET1 -131,656 -131,737 E. Transitional regime - Impact on CET1 (+/-) -183 -14,424 F. Total Common Equity Tier 1 (Common Equity Tier 1 - CET1) (C-D +/- E) 587,718 608,860 G. Additional Tier 1 (AT1) gross of elements to be deducted and the effects of the transitional regime - - including AT1 instruments covered by the transitional measures - - H. Elements to be deducted from AT1 - - I. Transitional regime - Impact on AT1 (+/-) - - L. Total Additional Tier 1 (AT1) (G-H +/- I) - - M. Tier 2 (T2) including the elements to be deducted and the effects of the transitional regime - - including T2 instruments covered by the transitional measures - - N. Elements to be deducted from T2 - - O. Transitional regime - Impact on T2 (+/-) - - P. Total Tier 2 (T2) (M-N+/-O) - - Q. Total own funds (F + L + P) 587,718 608,860
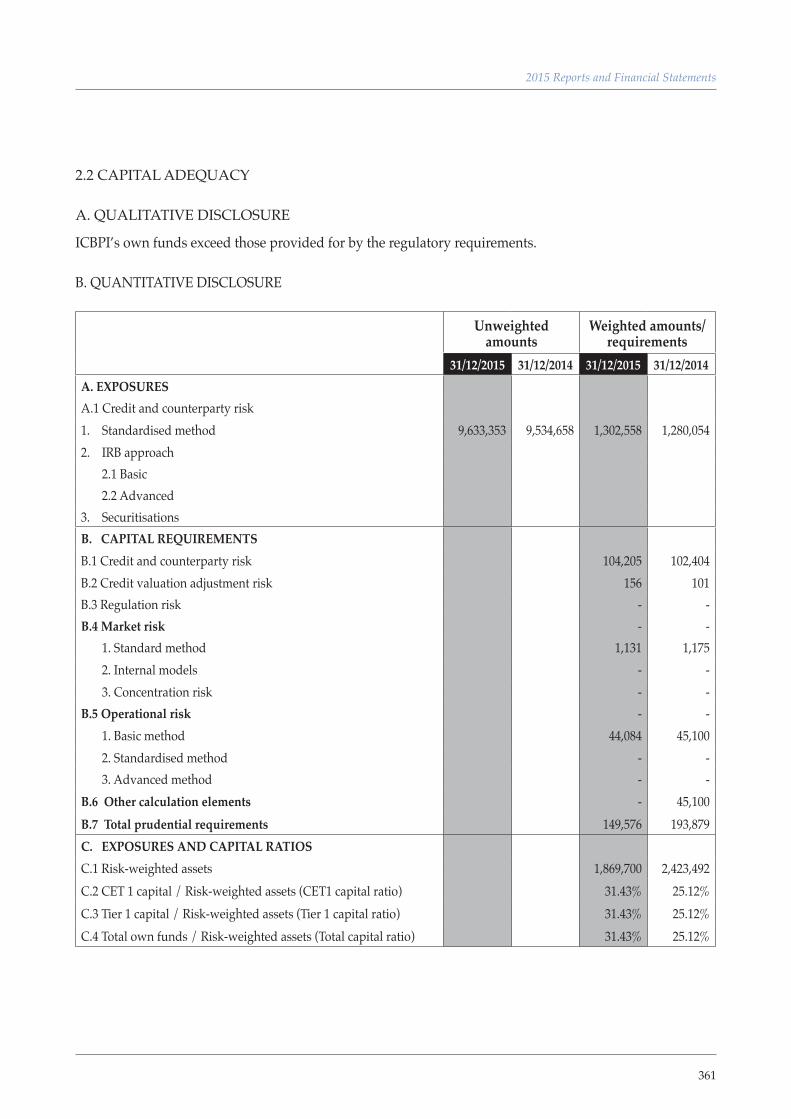
361
2015 Reports and Financial Statements
2.2 CAPITAL ADEQUACY A. QUALITATIVE DISCLOSURE
ICBPI’s own funds exceed those provided for by the regulatory requirements.
B. QUANTITATIVE DISCLOSURE
Unweightedamounts
Weighted amounts/ requirements
31/12/2015 31/12/2014 31/12/2015 31/12/2014A. EXPOSURESA.1 Credit and counterparty risk1. Standardised method 9,633,353 9,534,658 1,302,558 1,280,054 2. IRB approach 2.1 Basic 2.2 Advanced3. SecuritisationsB. CAPITAL REQUIREMENTSB.1 Credit and counterparty risk 104,205 102,404 B.2 Credit valuation adjustment risk 156 101 B.3 Regulation risk - - B.4 Market risk - - 1. Standard method 1,131 1,175 2. Internal models - - 3. Concentration risk - - B.5 Operational risk - - 1. Basic method 44,084 45,100 2. Standardised method - - 3. Advanced method - - B.6 Other calculation elements - 45,100 B.7 Total prudential requirements 149,576 193,879 C. EXPOSURES AND CAPITAL RATIOSC.1 Risk-weighted assets 1,869,700 2,423,492 C.2 CET 1 capital / Risk-weighted assets (CET1 capital ratio) 31.43% 25.12%C.3 Tier 1 capital / Risk-weighted assets (Tier 1 capital ratio) 31.43% 25.12%C.4 Total own funds / Risk-weighted assets (Total capital ratio) 31.43% 25.12%
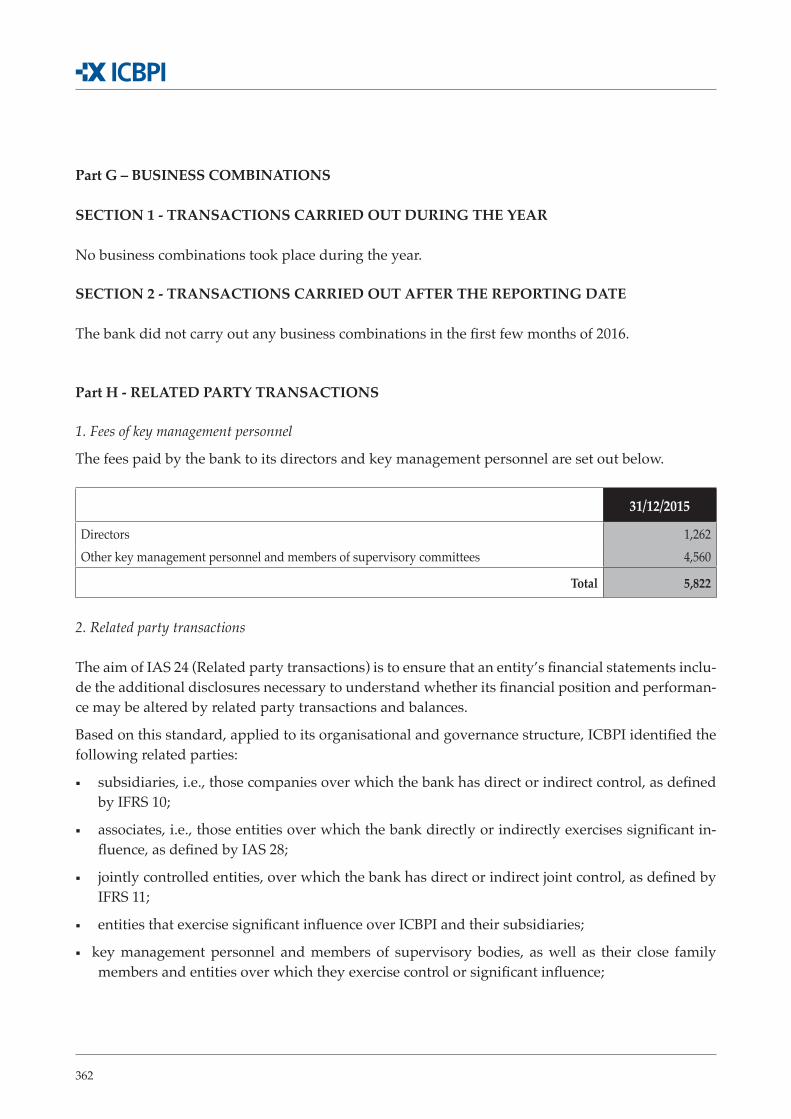
362
Part G – BUSINESS COMBINATIONS
SECTION 1 - TRANSACTIONS CARRIED OUT DURING THE YEAR
No business combinations took place during the year.
SECTION 2 - TRANSACTIONS CARRIED OUT AFTER THE REPORTING DATE
The bank did not carry out any business combinations in the first few months of 2016.
Part H - RELATED PARTY TRANSACTIONS
1. Fees of key management personnel
The fees paid by the bank to its directors and key management personnel are set out below.
31/12/2015
Directors 1,262 Other key management personnel and members of supervisory committees 4,560
Total 5,822
2. Related party transactions The aim of IAS 24 (Related party transactions) is to ensure that an entity’s financial statements inclu-de the additional disclosures necessary to understand whether its financial position and performan-ce may be altered by related party transactions and balances.
Based on this standard, applied to its organisational and governance structure, ICBPI identified the following related parties:
▪ subsidiaries, i.e., those companies over which the bank has direct or indirect control, as defined by IFRS 10;
▪ associates, i.e., those entities over which the bank directly or indirectly exercises significant in-fluence, as defined by IAS 28;
▪ jointly controlled entities, over which the bank has direct or indirect joint control, as defined by IFRS 11;
▪ entities that exercise significant influence over ICBPI and their subsidiaries;
▪ key management personnel and members of supervisory bodies, as well as their close family members and entities over which they exercise control or significant influence;
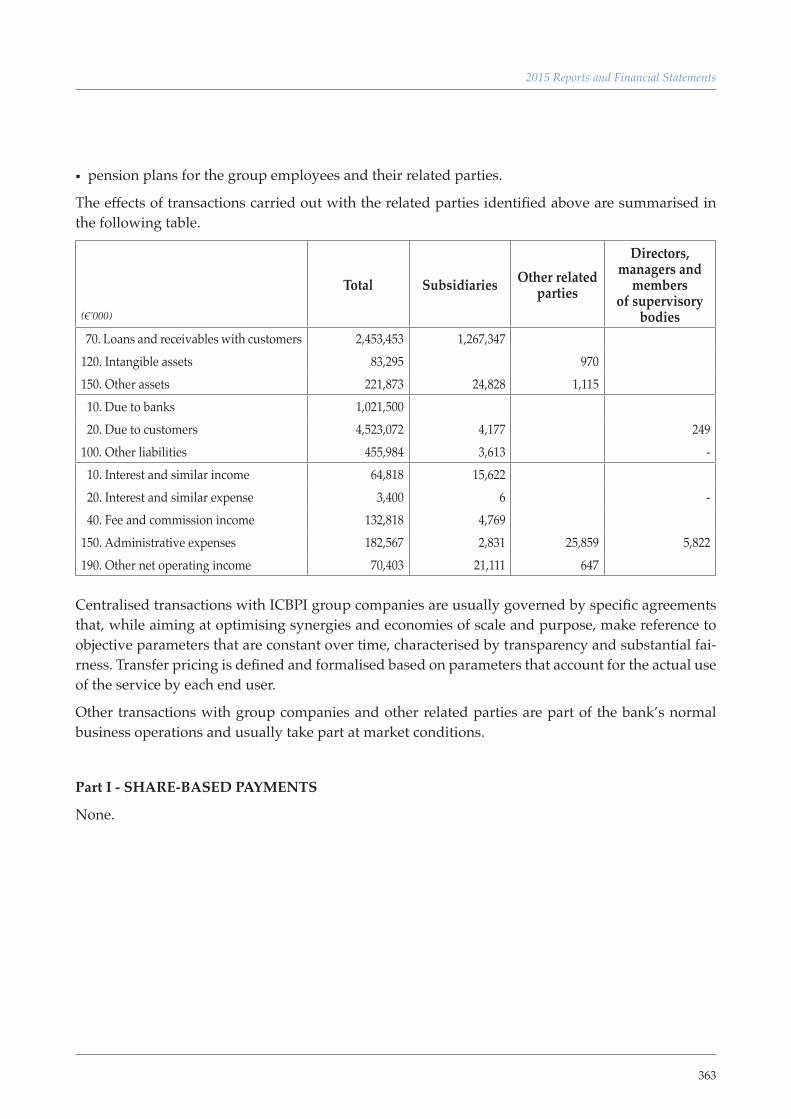
363
2015 Reports and Financial Statements
▪ pension plans for the group employees and their related parties.
The effects of transactions carried out with the related parties identified above are summarised in the following table.
(€’000)
Total Subsidiaries Other related parties
Directors, managers and
members of supervisory
bodies 70. Loans and receivables with customers 2,453,453 1,267,347 120. Intangible assets 83,295 970 150. Other assets 221,873 24,828 1,115 10. Due to banks 1,021,500 20. Due to customers 4,523,072 4,177 249 100. Other liabilities 455,984 3,613 - 10. Interest and similar income 64,818 15,622 20. Interest and similar expense 3,400 6 - 40. Fee and commission income 132,818 4,769 150. Administrative expenses 182,567 2,831 25,859 5,822 190. Other net operating income 70,403 21,111 647
Centralised transactions with ICBPI group companies are usually governed by specific agreements that, while aiming at optimising synergies and economies of scale and purpose, make reference to objective parameters that are constant over time, characterised by transparency and substantial fai-rness. Transfer pricing is defined and formalised based on parameters that account for the actual use of the service by each end user.
Other transactions with group companies and other related parties are part of the bank’s normal business operations and usually take part at market conditions.
Part I - SHARE-BASED PAYMENTS
None.

365
Report by the Board of Auditors to the Shareholders’ meeting

367
368
369
2015 Reports and Financial Statements
370
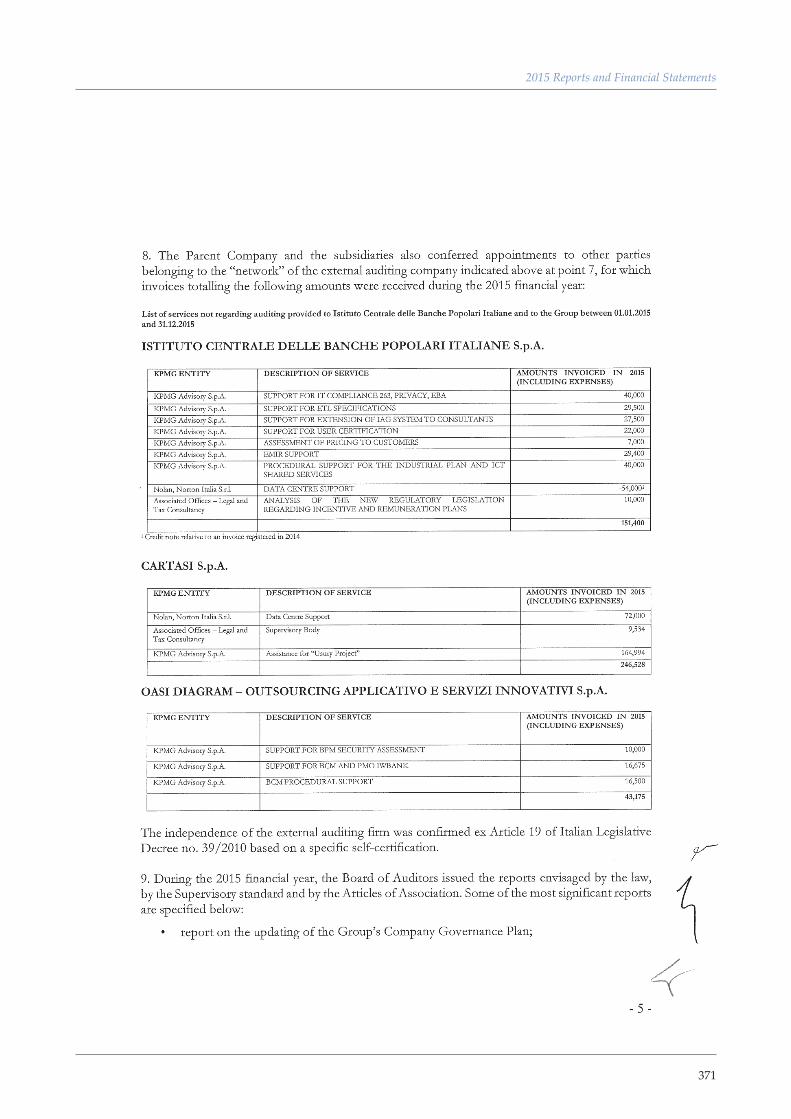
371
2015 Reports and Financial Statements
372
373
2015 Reports and Financial Statements

374
375
2015 Reports and Financial Statements
Report of the Auditing Company

376
377
2015 Reports and Financial Statements

378
379
Financial statements of the group companies

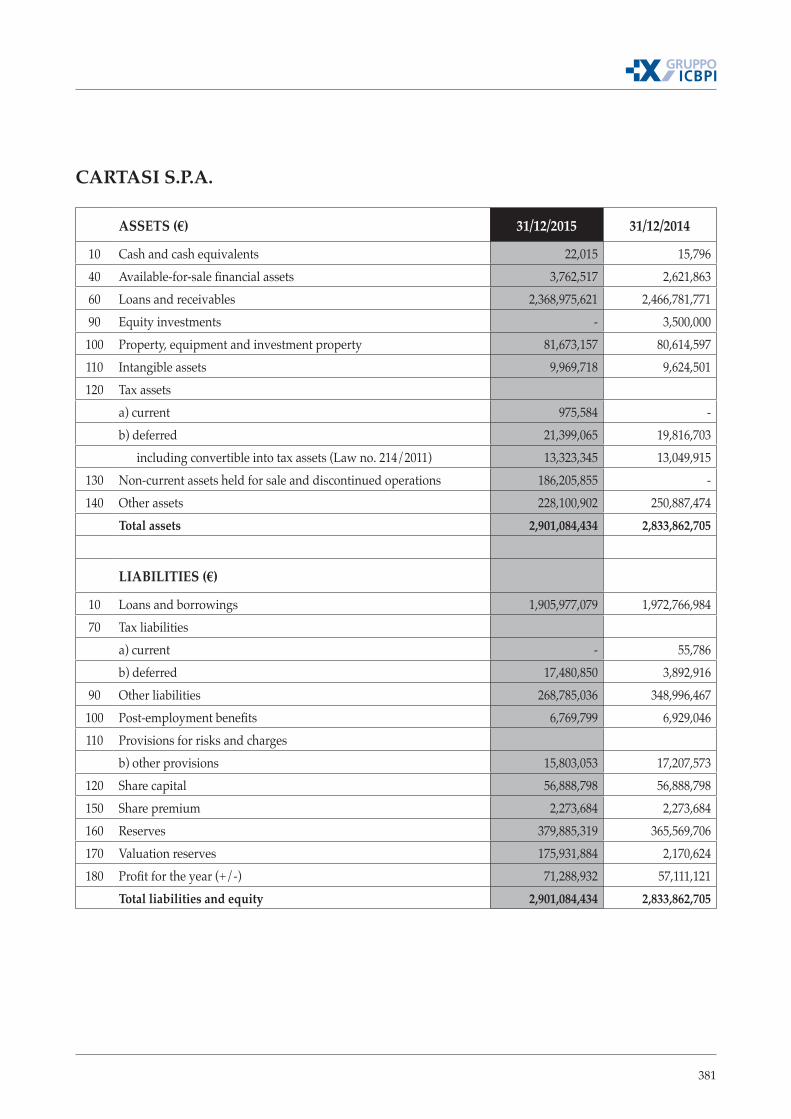
381
CARTASI S.P.A.
ASSETS (€) 31/12/2015 31/12/2014
10 Cash and cash equivalents 22,015 15,796 40 Available-for-sale financial assets 3,762,517 2,621,863 60 Loans and receivables 2,368,975,621 2,466,781,771 90 Equity investments - 3,500,000
100 Property, equipment and investment property 81,673,157 80,614,597 110 Intangible assets 9,969,718 9,624,501 120 Tax assets
a) current 975,584 - b) deferred 21,399,065 19,816,703 including convertible into tax assets (Law no. 214/2011) 13,323,345 13,049,915
130 Non-current assets held for sale and discontinued operations 186,205,855 - 140 Other assets 228,100,902 250,887,474
Total assets 2,901,084,434 2,833,862,705
LIABILITIES (€)
10 Loans and borrowings 1,905,977,079 1,972,766,98470 Tax liabilities
a) current - 55,786b) deferred 17,480,850 3,892,916
90 Other liabilities 268,785,036 348,996,467100 Post-employment benefits 6,769,799 6,929,046110 Provisions for risks and charges
b) other provisions 15,803,053 17,207,573120 Share capital 56,888,798 56,888,798150 Share premium 2,273,684 2,273,684160 Reserves 379,885,319 365,569,706170 Valuation reserves 175,931,884 2,170,624180 Profit for the year (+/-) 71,288,932 57,111,121
Total liabilities and equity 2,901,084,434 2,833,862,705
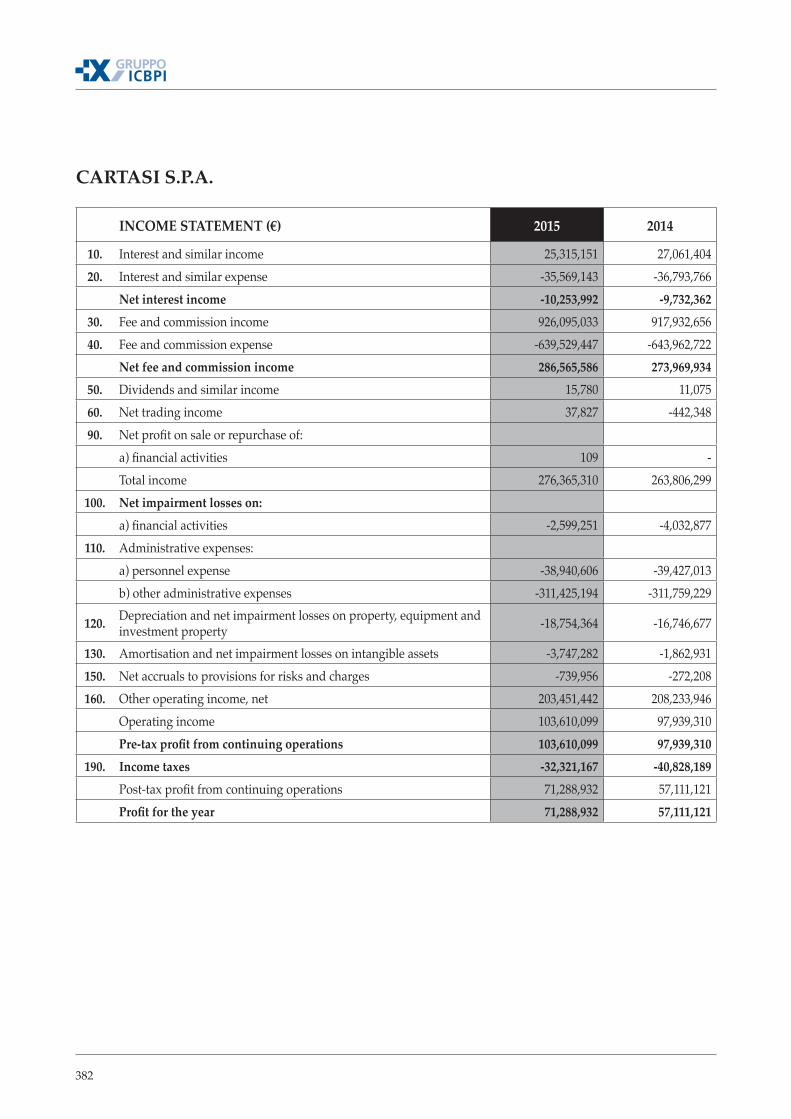
382
CARTASI S.P.A.
INCOME STATEMENT (€) 2015 2014
10. Interest and similar income 25,315,151 27,061,404 20. Interest and similar expense -35,569,143 -36,793,766
Net interest income -10,253,992 -9,732,362 30. Fee and commission income 926,095,033 917,932,656 40. Fee and commission expense -639,529,447 -643,962,722
Net fee and commission income 286,565,586 273,969,934 50. Dividends and similar income 15,780 11,075 60. Net trading income 37,827 -442,348 90. Net profit on sale or repurchase of:
a) financial activities 109 -Total income 276,365,310 263,806,299
100. Net impairment losses on:a) financial activities -2,599,251 -4,032,877
110. Administrative expenses:a) personnel expense -38,940,606 -39,427,013 b) other administrative expenses -311,425,194 -311,759,229
120. Depreciation and net impairment losses on property, equipment and investment property -18,754,364 -16,746,677
130. Amortisation and net impairment losses on intangible assets -3,747,282 -1,862,931 150. Net accruals to provisions for risks and charges -739,956 -272,208 160. Other operating income, net 203,451,442 208,233,946
Operating income 103,610,099 97,939,310 Pre-tax profit from continuing operations 103,610,099 97,939,310
190. Income taxes -32,321,167 -40,828,189 Post-tax profit from continuing operations 71,288,932 57,111,121 Profit for the year 71,288,932 57,111,121
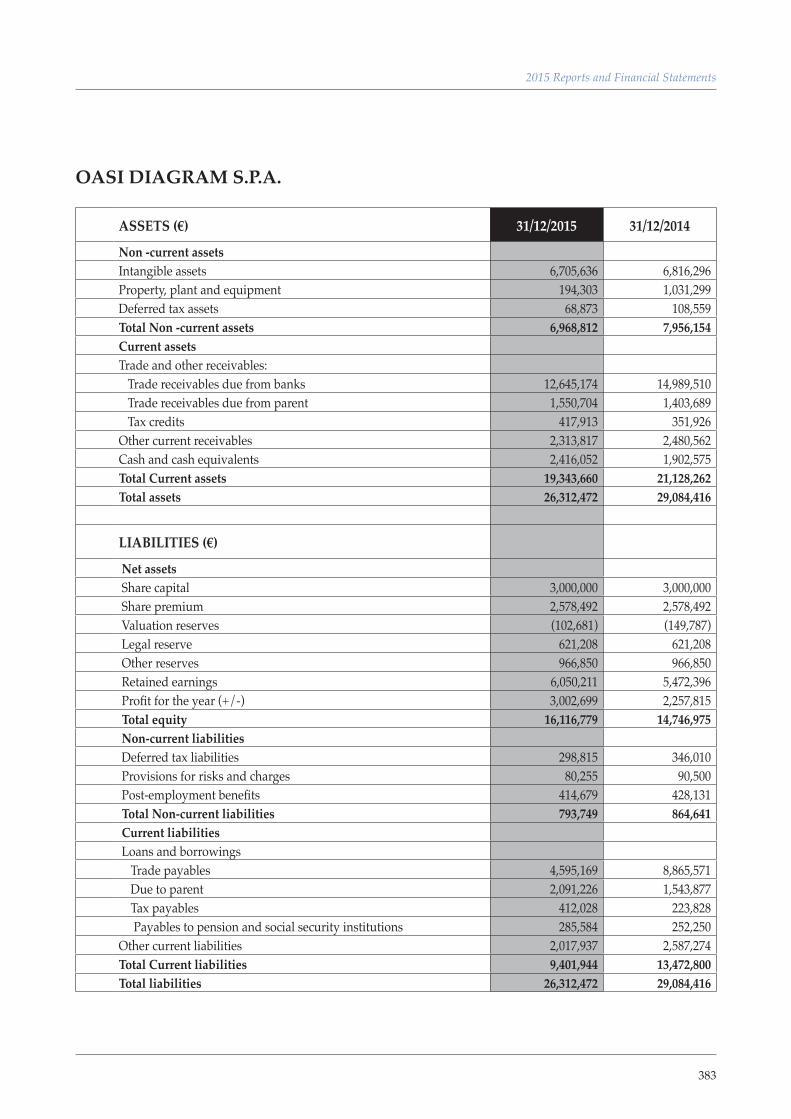
383
2015 Reports and Financial Statements
OASI DIAGRAM S.P.A.
ASSETS (€) 31/12/2015 31/12/2014
Non -current assetsIntangible assets 6,705,636 6,816,296 Property, plant and equipment 194,303 1,031,299 Deferred tax assets 68,873 108,559 Total Non -current assets 6,968,812 7,956,154 Current assetsTrade and other receivables: Trade receivables due from banks 12,645,174 14,989,510 Trade receivables due from parent 1,550,704 1,403,689 Tax credits 417,913 351,926 Other current receivables 2,313,817 2,480,562 Cash and cash equivalents 2,416,052 1,902,575 Total Current assets 19,343,660 21,128,262 Total assets 26,312,472 29,084,416
LIABILITIES (€)
Net assets Share capital 3,000,000 3,000,000 Share premium 2,578,492 2,578,492 Valuation reserves (102,681) (149,787) Legal reserve 621,208 621,208 Other reserves 966,850 966,850 Retained earnings 6,050,211 5,472,396 Profit for the year (+/-) 3,002,699 2,257,815 Total equity 16,116,779 14,746,975 Non-current liabilities Deferred tax liabilities 298,815 346,010 Provisions for risks and charges 80,255 90,500 Post-employment benefits 414,679 428,131 Total Non-current liabilities 793,749 864,641 Current liabilities Loans and borrowings Trade payables 4,595,169 8,865,571 Due to parent 2,091,226 1,543,877 Tax payables 412,028 223,828 Payables to pension and social security institutions 285,584 252,250 Other current liabilities 2,017,937 2,587,274 Total Current liabilities 9,401,944 13,472,800 Total liabilities 26,312,472 29,084,416
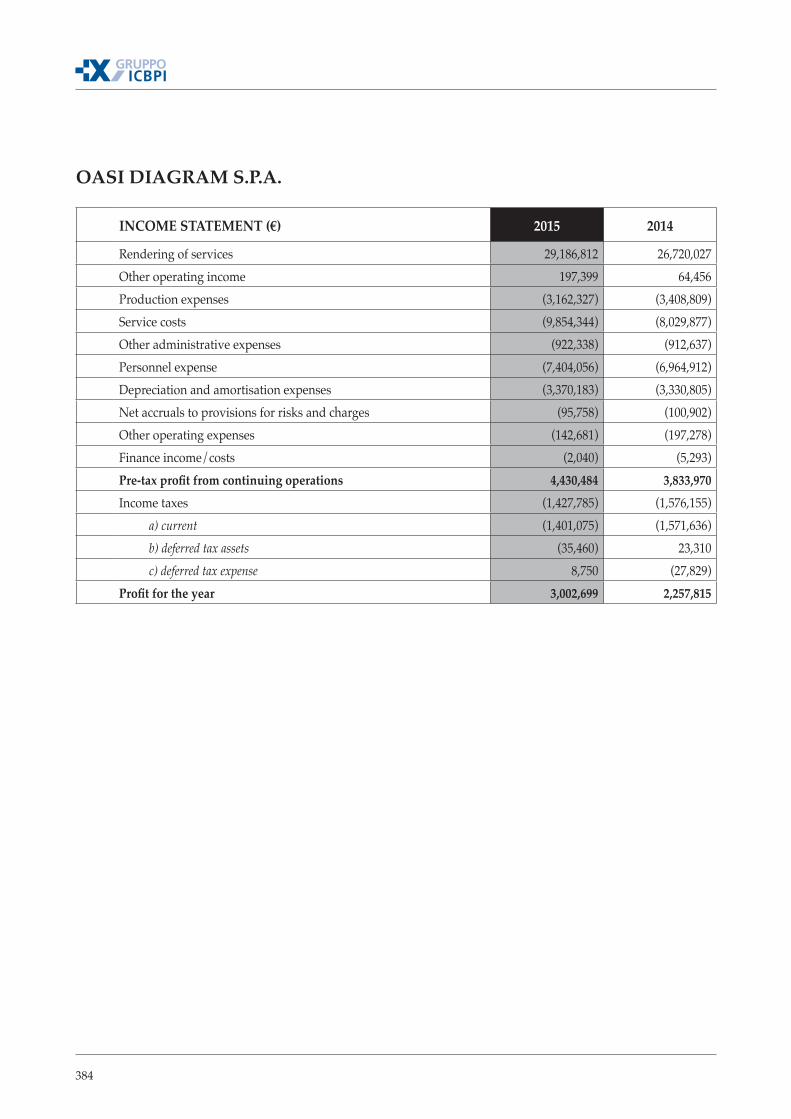
384
OASI DIAGRAM S.P.A.
INCOME STATEMENT (€) 2015 2014
Rendering of services 29,186,812 26,720,027 Other operating income 197,399 64,456 Production expenses (3,162,327) (3,408,809)Service costs (9,854,344) (8,029,877)Other administrative expenses (922,338) (912,637)Personnel expense (7,404,056) (6,964,912)Depreciation and amortisation expenses (3,370,183) (3,330,805)Net accruals to provisions for risks and charges (95,758) (100,902)Other operating expenses (142,681) (197,278)Finance income/costs (2,040) (5,293)Pre-tax profit from continuing operations 4,430,484 3,833,970Income taxes (1,427,785) (1,576,155) a) current (1,401,075) (1,571,636) b) deferred tax assets (35,460) 23,310 c) deferred tax expense 8,750 (27,829)Profit for the year 3,002,699 2,257,815
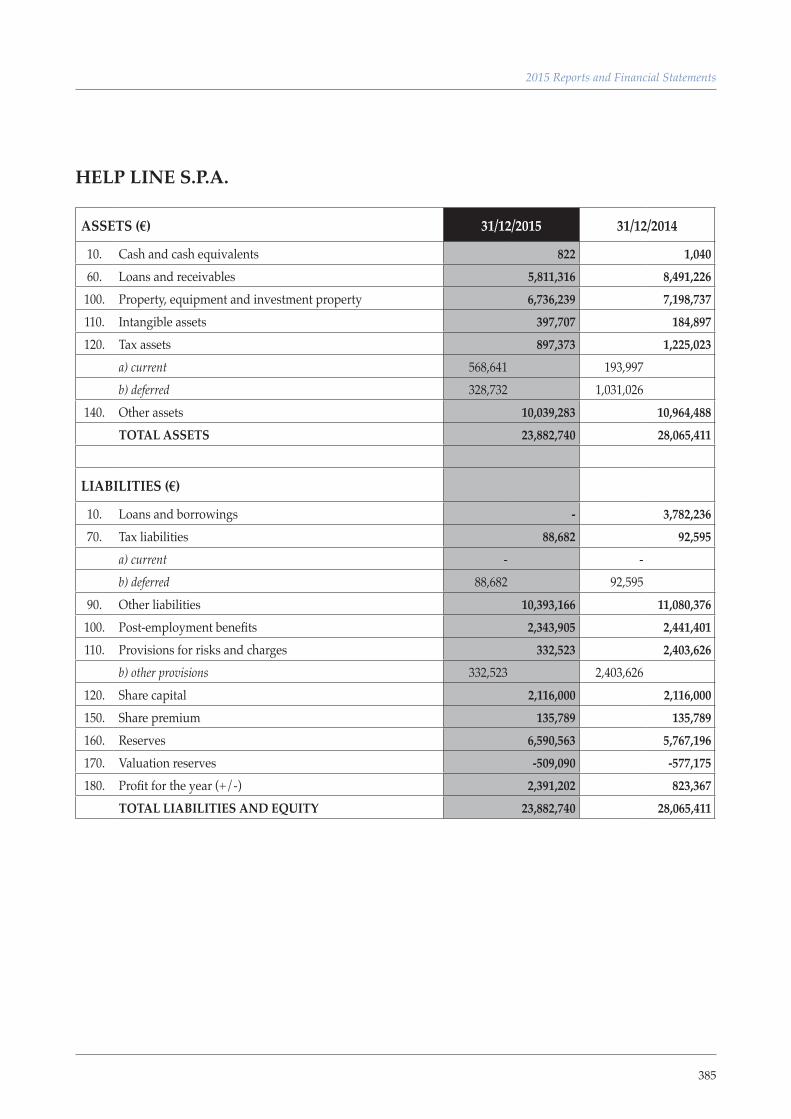
385
2015 Reports and Financial Statements
HELP LINE S.P.A.
ASSETS (€) 31/12/2015 31/12/2014
10. Cash and cash equivalents 822 1,040 60. Loans and receivables 5,811,316 8,491,226 100. Property, equipment and investment property 6,736,239 7,198,737 110. Intangible assets 397,707 184,897 120. Tax assets 897,373 1,225,023
a) current 568,641 193,997 b) deferred 328,732 1,031,026
140. Other assets 10,039,283 10,964,488 TOTAL ASSETS 23,882,740 28,065,411
LIABILITIES (€)
10. Loans and borrowings - 3,782,236 70. Tax liabilities 88,682 92,595
a) current - - b) deferred 88,682 92,595
90. Other liabilities 10,393,166 11,080,376 100. Post-employment benefits 2,343,905 2,441,401 110. Provisions for risks and charges 332,523 2,403,626
b) other provisions 332,523 2,403,626 120. Share capital 2,116,000 2,116,000 150. Share premium 135,789 135,789 160. Reserves 6,590,563 5,767,196 170. Valuation reserves -509,090 -577,175 180. Profit for the year (+/-) 2,391,202 823,367
TOTAL LIABILITIES AND EQUITY 23,882,740 28,065,411
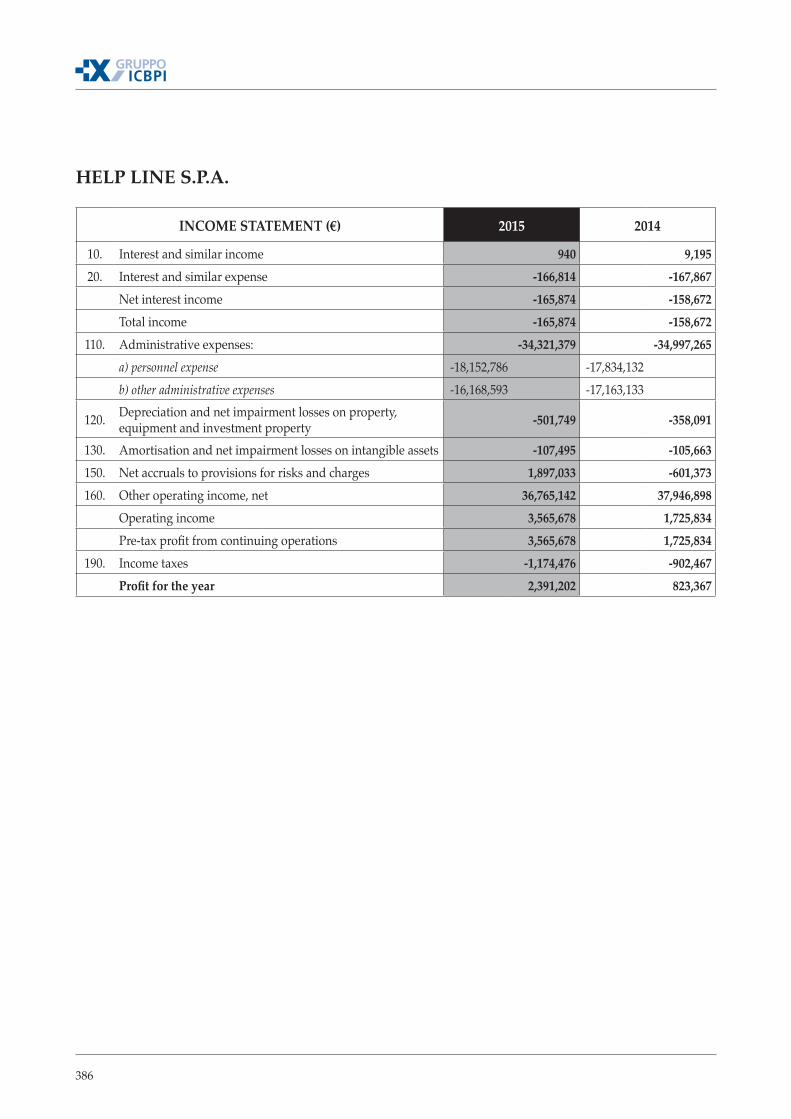
386
HELP LINE S.P.A.
INCOME STATEMENT (€) 2015 2014
10. Interest and similar income 940 9,195 20. Interest and similar expense -166,814 -167,867
Net interest income -165,874 -158,672 Total income -165,874 -158,672
110. Administrative expenses: -34,321,379 -34,997,265 a) personnel expense -18,152,786 -17,834,132 b) other administrative expenses -16,168,593 -17,163,133
120. Depreciation and net impairment losses on property, equipment and investment property -501,749 -358,091
130. Amortisation and net impairment losses on intangible assets -107,495 -105,663 150. Net accruals to provisions for risks and charges 1,897,033 -601,373 160. Other operating income, net 36,765,142 37,946,898
Operating income 3,565,678 1,725,834 Pre-tax profit from continuing operations 3,565,678 1,725,834
190. Income taxes -1,174,476 -902,467 Profit for the year 2,391,202 823,367

387
Shareholders’ Meeting resolutionsof April 27, 2016
Below is a summary of the resolutions adopted by the Ordinary Shareholders’ Mee-ting held on first call on 27 April 2016.
1. Financial statements as of 31 December 2015; Report on Operations of the Board of Directors; reports of the Board of Statutory Auditors and the Auditing Company; related resolutions.
The Meeting approved the financial statements at December 31, 2015 as presented by the Board of Directors and its operating profit.
2. Remuneration policies of the ICBPI Group; related resolutions. The Meeting approved the remuneration policies of ICBPI Group as proposed by
the Board of Directors.


389
Company Boardsat 27 April 2016
BOARD OF DIRECTORS
Chairman: Giovanni De Censi
Deputy Chairman: Franco Bernabè
Managing Director: Giuseppe Capponcelli
Directors: Luca Bassi James Gerald Arthur Brocklebank Riccardo Bruno Francesco Casiraghi Michaela Castelli Simone Cucchetti Stuart James Ashley Gent Larry Allan Klane Robin Marshall Jeffrey David Paduch Ottavio Rigodanza
BOARD OF STATUTORY AUDITORS
Chairman: Alessandro Grange
Standing auditors: Lorenzo Banfi Paolo Francesco Maria Lazzati
Alternate auditors: Alberto Balestreri Marco Giuseppe Zanobio
GENERAL MANAGEMENT
General Manager: Giuseppe Capponcelli
Deputy Vice General Manager: Pier Paolo Cellerino

391
Shareholders’ list
Unione di Banche Italiane - UBI Banca Bergamo
Banca Sella Holding Biella
Banca Popolare di Cividale Cividale del Friuli
Nuova Cassa di Risparmio di Ferrara Ferrara
Banca Popolare del Frusinate Frosinone
Banca Popolare di Milano Milano
ICBPI Milano
Mercury Italia S.r.l. Milano
Banca Popolare dell’Emilia Romagna Modena
ICCREA Holding Roma
Banca Popolare Vesuviana San Giuseppe Vesuviano
Credito Valtellinese Sondrio
Banca Popolare di Sondrio Sondrio
Banco Popolare Verona