Embed Size (px)
Citation preview

2015 ANNUALREPORT
Uscom Limited ASX: UCM
Table of Contents
CHAIRMANS LETTERCHAIRMANS LETTERCHAIRMANS LETTERCHAIRMANS LETTER ................................................................................................................. 2222----5555
TESTIMONIALTESTIMONIALTESTIMONIALTESTIMONIAL .................................................................................................................................6666
THOR PRODUCTSTHOR PRODUCTSTHOR PRODUCTSTHOR PRODUCTS ................................................................................................................................................................................................................................................................................................................................................................................................................................................ 7777----8888
2015 FINANCIAL YEAR HIGHLIGHTS2015 FINANCIAL YEAR HIGHLIGHTS2015 FINANCIAL YEAR HIGHLIGHTS2015 FINANCIAL YEAR HIGHLIGHTS ........................................................................................................................................................................................................................................................................................................................................ 9999
CORPORATE GOVERNANCECORPORATE GOVERNANCECORPORATE GOVERNANCECORPORATE GOVERNANCE ............................................................................................................................................................................................................................................................................................................................................................ 10101010----14141414
DIRECTORS REPORTDIRECTORS REPORTDIRECTORS REPORTDIRECTORS REPORT .................................................................................................................................................................................................................................................................................................................................................................................................................... 15151515----22222222
FINANCIAL FINANCIAL FINANCIAL FINANCIAL REPORTREPORTREPORTREPORT
AUDITORS INDEPENDENCE DECLARATION ........................................................................ 23
INCOME STATEMENT .............................................................................................................. 24
FINANCIAL POSITION STATEMENT ....................................................................................... 25
CHANGES IN EQUITY ............................................................................................................... 26
CASH FLOWS STATEMENT ...................................................................................................... 27
NOTES TO FINANCIAL STATEMENTS .............................................................................. 28-49
DIRECTORS DECLARATIONDIRECTORS DECLARATIONDIRECTORS DECLARATIONDIRECTORS DECLARATION ........................................................................................................................................................................................................................................................................................................................................................................................ 50505050
INDEPENDENT AUDIT REPORTINDEPENDENT AUDIT REPORTINDEPENDENT AUDIT REPORTINDEPENDENT AUDIT REPORT ............................................................................................................................................................................................................................................................................................................................................ 51515151----52525252
SHAREHOLDER INFORMATIONSHAREHOLDER INFORMATIONSHAREHOLDER INFORMATIONSHAREHOLDER INFORMATION ............................................................................................................................................................................................................................................................................................................................................ 53535353----54545454
USCOM LIMITED ANNUAL REPORT 2015

Chairmans Letter
ANNUAL REPORT 2015 2
“Uscom is a rapidly growing de-risked, medical device company, with a global vision and ambition to deliver practice changing non-invasive products into critical
healthcare markets. Uscom science is world leading and associated with standard of care products addressing the diagnosis and management of heart failure,
hypertension, sepsis, pre-eclampsia, asthma and lung disease. Our goal is to create a major, multi-product, medical device company.”
For Uscom shareholders 2015 was transformational; a year in which our investment in world leading science and industry leading management yielded real commercial outcomes and global recognition.
2015 Headlines:
1. Total revenue and income up 48% (to $2.04m), and more than doubled over the last two years 2. Receipts from customers up 59% (to $1.32m), net operating cash out flow reduced 20% (to $0.99m).
3. Distribution increased 57% (23 to 36) 4. Agreement to acquire Thor Laboratories profitable ultrasound Company selling devices for application in
rapidly growing asthma and COPD markets with cost-effective international manufacturing 5. Record growth and sales of USCOM 1A devices 6. Johnson & Johnson Innovation Australian Biotech Company of the Year 7. Appointment of former Welch Allyn VP Corporate Development to Uscom US VP Business Development 8. USCOM 1A awarded 5 year Chinese Regulatory approval (CFDA) for continued sale into China 9. Thor FDA approval granted for sale into the USA 10. The gold standard Uscom BP+ central blood pressure (cBP) monitor measurements were endorsed by the
American Medical Association with their recommendation for acceptance for US CPT 1 Code. 11. Global Uscom BP+ and Thor sales and marketing planned to begin FY 2016 12. USCOM 1A recommended for routine pregnancy screening to detect pre-eclampsia
Overview: 2015 has seen continued growth in Uscom operations. Annual revenue and income was up 48% to $2.04m and customer receipts increased 59% to $1.32m, attributable to the increased sales of the USCOM 1A device. This follows similar growth in 2014. For the final quarter of FY 2015 Uscom reported a cash loss of $0.05m and record revenues suggesting approaching profitability. Cash on hand at the end of the reporting period was $0.53m. The recent PP and SPP capital raising generated an additional $2.14m, with $700k of these funds allocated for completion of the purchase of Thor Laboratories. Although we had anticipated to be cash flow positive in 2015, the entity reported a $0.99m negative cash flow for the year due to the appointment of additional sales and marketing resources, the preparation of the Uscom BP+ for global mass manufacture, and delayed Chinese regulatory approval for the USCOM 1A. This contributed to a 9% increase in costs to $2.91m. During FY 2015 distributor agreements were increased from 23 to 36 (+57%). We also appointed Stephen Wilson, the former VP Corporate Development for Welch Allyn as Uscom US VP Business Development to apply his critical experience to the sale of BP+ and the newly FDA approved Thor products into the US market. Future growth will be underwritten by continuing growth in Uscom sales, sales of the Uscom BP+ in the US, China and Europe, and increased sales from the suite of Thor spirometry devices in the US and China.
$1,010,942
$1,377,716
$2,039,426
$0
$500,000
$1,000,000
$1,500,000
$2,000,000
$2,500,000
2013 2014 2015
Revenue and Income

ANNUAL REPORT 2015 3
Chairmans Letter Continued
Results: Revenue and income for 2015 grew by 48% to $2.04m from 2014, while customer receipts were up 59% to $1.32m, and the net cash flow from operating activities for the year was reduced 20% from $1.24m to $0.99m. There was a 9% increase in cost of operations (to $2.91m) associated with an increase in staff and the development costs of BP+. There was a 20% decrease in operating loss before income tax ($1.52m to $1.22m). This small cash outflow from operations represents the increased costs from new appointments and preparation of BP+ for market, combined with delayed revenue associated with the delayed CFDA approval for USCOM 1A. It is envisaged that with continuing growth of USCOM 1A revenues from a significantly expanded distribution network, combined with early BP+ sales, and the addition of Thor revenues, currently greater than $0.5m, the improving revenue trends will continue.
* As a result of adoption of new accounting policy, the reported 2014 Uscom revenue and income has been “restated” from $1,064,666 to $1,377,716 – see notes in financial statements. 2015 figures represent revenue and income.
Capital: Cash on hand at the end of the period was $0.53m and combined with the recent $2.14m capital raising, and predicted increasing revenues we expect Uscom to be well positioned for capital stability in the year ahead.
Sales: The appointment of Denise Pater, formerly of GE Healthcare, Datex-Omeda, Medtel and Ramsay Healthcare, as Distribution and Sales Manager to collaborate with Steve Haken in Europe and Rik Denicke in the USA, saw a significant increase in sales. The additional appointment of Stephen Wilson, former Vice President of Business Development Welch Allyn, to the Uscom sales team is anticipated to strengthen sales growth over the coming year, particularly given Stephen’s experience in blood pressure and spirometry distribution, as both Uscom technologies are targeted for the US market this year. Uscom will acquire additional distribution with the Thor acquisition, and the current Uscom products (USCOM 1A and Uscom BP+) can be fed into this distribution, while the Thor products can be fed into the growing Uscom distribution network, which was increased by 57% in 2015. This should accelerate revenue growth in 2016.
Share price: Australian capital markets have been volatile and the Uscom share price finished the year at 19c. (16c to 27c) with a VWAP of 21c. While Uscom growth remains unrecognised by the market, management anticipate a realistic revaluation as our results and activities are processed by the market. The effects of the Greek Crisis, The Chinese Correction and the annual end of financial year sell off have all impacted the share price.
Thor Acquisition: Uscom has agreed to acquire 100% of Thor Laboratories operations and intellectual property, after completion of legal and financial due diligence by K&L Gates, and BDO Hungary. Thor is a cash flow positive medical device developer and manufacturer with current annual revenues of approximately A$500k which specialises in high fidelity digital Doppler measurement of respiratory function. Thor is based in Budapest, Hungary, a key centre for European medical device manufacture, and owns a number of devices with specific application in the assessment of asthma, COPD, and other respiratory disorders, with new potential applications in sleep medicine. The devices have regulatory approval in various jurisdictions including FDA, CE, and TGA with additional devices in clinical development. Thor founder, Mr George Ferenczi, will become a full time employee of Uscom as part of the transaction, and will continue to manage the Thor operations and progress an expanded product development programme for Uscom. Consideration for Thor and its assets total $1 million over a three year period from the date of acquisition, comprising $700k in upfront cash, and $300k in cash and equity earn-outs. The Thor tangible assets were valued at $361k at 31st December 2014, while an additional $100k of cash will be left in the company as working capital. The IP, operations and global certificates and approvals were not included in the valuation. The Company considers the Thor acquisition to be a key strategic growth opportunity, delivering cash flow positive operations, significant revenue with growth potential, internationally accredited manufacturing, R&D capabilities, product distribution, a spirometric product suite with global regulatory approvals in place, and staff with device specific experience. There are significant clinical, operational, and strategic synergies associated with the acquisition.
Science: The USCOM 1A and the Uscom BP+ are breakthrough, noninvasive cardiovascular technologies, representing the best of cardiac output monitoring and blood pressure technology, and this year saw further evidence supporting the expanded clinical utility of these technologies. There were 36 new publications supporting the utility of the 1A and the BP+ in 2015, covering the fields of hypertension, heart failure and sepsis in adults, children and neonates.
ANNUAL REPORT 2015 4
Chairmans Letter Continued
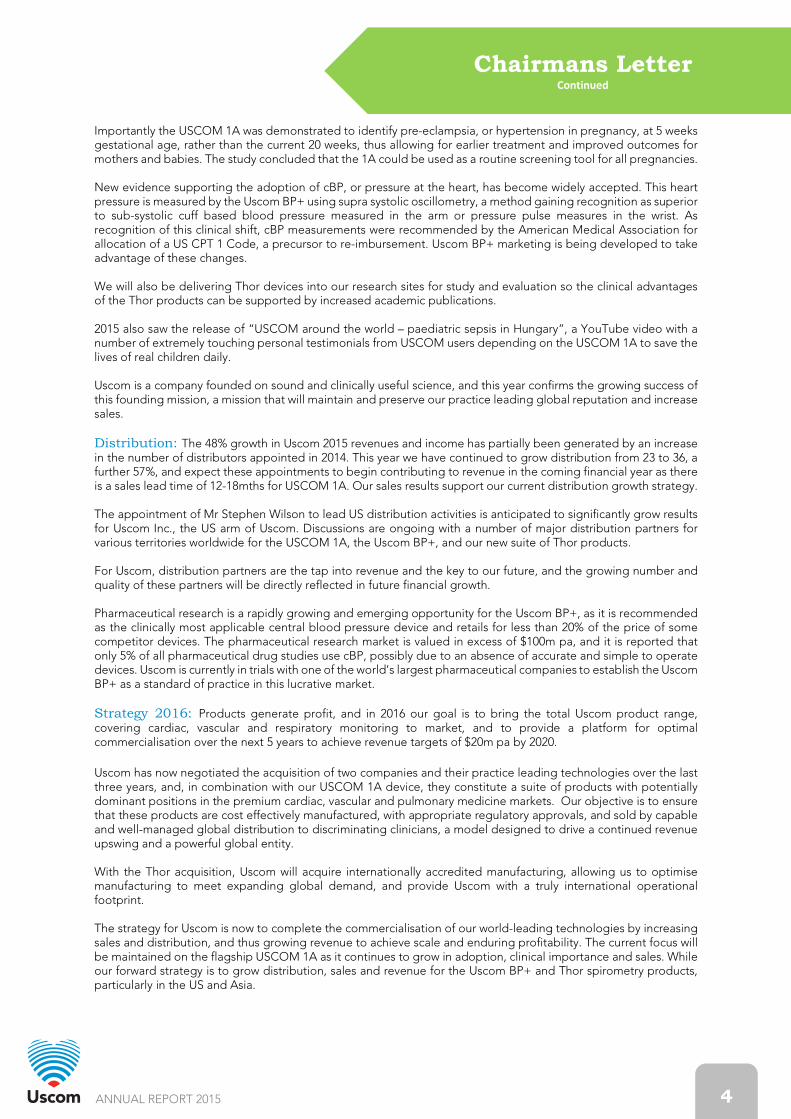
Importantly the USCOM 1A was demonstrated to identify pre-eclampsia, or hypertension in pregnancy, at 5 weeks gestational age, rather than the current 20 weeks, thus allowing for earlier treatment and improved outcomes for mothers and babies. The study concluded that the 1A could be used as a routine screening tool for all pregnancies. New evidence supporting the adoption of cBP, or pressure at the heart, has become widely accepted. This heart pressure is measured by the Uscom BP+ using supra systolic oscillometry, a method gaining recognition as superior to sub-systolic cuff based blood pressure measured in the arm or pressure pulse measures in the wrist. As recognition of this clinical shift, cBP measurements were recommended by the American Medical Association for allocation of a US CPT 1 Code, a precursor to re-imbursement. Uscom BP+ marketing is being developed to take advantage of these changes. We will also be delivering Thor devices into our research sites for study and evaluation so the clinical advantages of the Thor products can be supported by increased academic publications. 2015 also saw the release of “USCOM around the world – paediatric sepsis in Hungary”, a YouTube video with a number of extremely touching personal testimonials from USCOM users depending on the USCOM 1A to save the lives of real children daily. Uscom is a company founded on sound and clinically useful science, and this year confirms the growing success of this founding mission, a mission that will maintain and preserve our practice leading global reputation and increase sales.
Distribution: The 48% growth in Uscom 2015 revenues and income has partially been generated by an increase in the number of distributors appointed in 2014. This year we have continued to grow distribution from 23 to 36, a further 57%, and expect these appointments to begin contributing to revenue in the coming financial year as there is a sales lead time of 12-18mths for USCOM 1A. Our sales results support our current distribution growth strategy. The appointment of Mr Stephen Wilson to lead US distribution activities is anticipated to significantly grow results for Uscom Inc., the US arm of Uscom. Discussions are ongoing with a number of major distribution partners for various territories worldwide for the USCOM 1A, the Uscom BP+, and our new suite of Thor products. For Uscom, distribution partners are the tap into revenue and the key to our future, and the growing number and quality of these partners will be directly reflected in future financial growth. Pharmaceutical research is a rapidly growing and emerging opportunity for the Uscom BP+, as it is recommended as the clinically most applicable central blood pressure device and retails for less than 20% of the price of some competitor devices. The pharmaceutical research market is valued in excess of $100m pa, and it is reported that only 5% of all pharmaceutical drug studies use cBP, possibly due to an absence of accurate and simple to operate devices. Uscom is currently in trials with one of the world’s largest pharmaceutical companies to establish the Uscom BP+ as a standard of practice in this lucrative market.
Strategy 2016: Products generate profit, and in 2016 our goal is to bring the total Uscom product range, covering cardiac, vascular and respiratory monitoring to market, and to provide a platform for optimal commercialisation over the next 5 years to achieve revenue targets of $20m pa by 2020.
Uscom has now negotiated the acquisition of two companies and their practice leading technologies over the last three years, and, in combination with our USCOM 1A device, they constitute a suite of products with potentially dominant positions in the premium cardiac, vascular and pulmonary medicine markets. Our objective is to ensure that these products are cost effectively manufactured, with appropriate regulatory approvals, and sold by capable and well-managed global distribution to discriminating clinicians, a model designed to drive a continued revenue upswing and a powerful global entity. With the Thor acquisition, Uscom will acquire internationally accredited manufacturing, allowing us to optimise manufacturing to meet expanding global demand, and provide Uscom with a truly international operational footprint. The strategy for Uscom is now to complete the commercialisation of our world-leading technologies by increasing sales and distribution, and thus growing revenue to achieve scale and enduring profitability. The current focus will be maintained on the flagship USCOM 1A as it continues to grow in adoption, clinical importance and sales. While our forward strategy is to grow distribution, sales and revenue for the Uscom BP+ and Thor spirometry products, particularly in the US and Asia.

ANNUAL REPORT 2015 5
Chairmans Letter Continued
We believe Uscom is well positioned to accelerate growth in the coming year, and Company management is committed to a strategy of increased distribution and manufacturing growth to meet the anticipated demand. These developments will continue to change the operational environment for Uscom and will reward shareholders.
Risks: While high growth rates are anticipated to continue for the foreseeable future, as an increasingly global entity operating in multiple economic environments, Uscom is exposed to the vicissitudes of global markets which may impair operations and impact predicted outcomes.
Global markets are increasingly volatile, and this may lead to a significant re-alignment of global economies, currencies and corporate value. If this were to continue, particularly in China, then growth expectations for the year ahead may need to be revised. Under performance of distributors, particularly where best endeavours contracts are in place, may also impact forecast revenues. The appointment of key distribution management personnel acts to significantly mitigate these risks by providing regional hands on contact and continual monitoring of distributor performance. Regulatory risks relevant to medical devices are associated with delayed or declined approvals in specific jurisdictions. While both USCOM 1A and BP+ already have major approvals, it is possible that new approvals, and re-approvals associated with changed and inefficient regulatory systems may delay approvals and subsequently revenue. Key personnel risk is also a relevant consideration. Currently there is a small and vital team working on the Uscom project to ensure and manage on going rapid growth. Development of an executive remuneration plan to ensure adequate compensation for executives for extraordinary contributions may mitigate the risk of untimely resignations that may damage operations and impede commercial momentum, and is an important task going forward. The appointment of Mr Steven Haken, Ms Denise Pater and Mr Stephen Wilson and the acquisition of the Thor team significantly expands the Uscom team and mitigates such risks. Other risks include competitive risks and patent breach risks in global markets, and the risk associated with impending rapid growth which may become significant if anticipated sales are achieved. Substantial unpredicted product demand and growth may generate scale up stress on the business, thus challenging cash flow management and equity adequacy may need focused management.
Conclusion: Products generate profit, and Uscom is positioning itself to occupy a position of global leadership in the valuable and critical cardiovascular and pulmonary market, ensuring long term shareholder value. The cost-effective and accredited manufacturing and the experienced R&D team acquired in the Thor transaction will ensure a pipeline of new generation products to feed into our expanding global sales and distribution network. This strategy is conceived to ensure the continued revenue growth trends established over the last three years.
The revenue growth for 2016 will be underwritten by continued growth in USCOM 1A sales, the imminent global marketing of Uscom BP+, particularly in China and the US, and the additional revenue associated with the Thor devices and its expanded marketing. This revenue growth will be supported by an expanded US distribution for all three product series as our US distribution strategy becomes effective. Uscom is a real company, with a vision and strategy for real growth in the years ahead, and has a history of meeting corporate milestones. Uscom’s focus remains on products, distribution, sales and revenue. We will proceed to market our new products, and optimise international operations as we upscale operations and manufacturing to meet the increased demands of our growing international sales organisation. We are grateful for the ongoing support of shareholders as we prosecute this strategy, and we look forward to realising the operational potential of the global corporation that we are building. Thank you.
Associate Professor Rob Phillips
PhD(med), MPhil(med), FASE, DMU(cardiol)
Executive Chairman
Uscom Limited

ANNUAL REPORT 2015
USCOM LIMITED ANNUAL REPORT 2015
“We bought our
USCOM about 4 years
ago, we routinely use , we routinely use , we routinely use , we routinely use
it to manage fluid it to manage fluid it to manage fluid it to manage fluid
and sepsis, and we and sepsis, and we and sepsis, and we and sepsis, and we
love it;love it;love it;love it; it has changed
the way we see and
manage
hemodynamics.”
“…We transformed We transformed We transformed We transformed
the haemodynamic the haemodynamic the haemodynamic the haemodynamic
guidelines. guidelines. guidelines. guidelines. The first
step is USCOM in the
first 5 minutes and
then we see the results
and decide what to
do.”
Eniko Ujhelyi, Director of Pediatric ICU
Szent László Hospital, Hungary
Watch USCOM around the world - Hungary

SPSPSPSPIROMETRYIROMETRYIROMETRYIROMETRY IntroducingIntroducingIntroducingIntroducing
“Thor Thor Thor Thor digital digital digital digital DopplerDopplerDopplerDoppler
spirometry; spirometry; spirometry; spirometry;
clinical synergy with the Uscomwith the Uscomwith the Uscomwith the Uscom
suite of products.suite of products.suite of products.suite of products.”
Rob Phillips, CEORob Phillips, CEORob Phillips, CEORob Phillips, CEO
–
SpiroDesk AAAA complete standalone Pcomplete standalone Pcomplete standalone Pcomplete standalone Pulmonary Diagnostics Desktop ulmonary Diagnostics Desktop ulmonary Diagnostics Desktop ulmonary Diagnostics Desktop Station Platform. It is partnered with SpiroTube Mobile Station Platform. It is partnered with SpiroTube Mobile Station Platform. It is partnered with SpiroTube Mobile Station Platform. It is partnered with SpiroTube Mobile Edition and performs Forced Vital Capacity, Relaxed Vital Edition and performs Forced Vital Capacity, Relaxed Vital Edition and performs Forced Vital Capacity, Relaxed Vital Edition and performs Forced Vital Capacity, Relaxed Vital Capacity, Maximum Voluntary Ventilation and ECG with Capacity, Maximum Voluntary Ventilation and ECG with Capacity, Maximum Voluntary Ventilation and ECG with Capacity, Maximum Voluntary Ventilation and ECG with stress tests. It archives measurement results to an integratstress tests. It archives measurement results to an integratstress tests. It archives measurement results to an integratstress tests. It archives measurement results to an integrated ed ed ed ddddaaaattttaaaabbbbaaaasssseeee wwwwiiiitttthhhh rrrreeeeppppoooorrrrtttt----pppprrrriiiinnnnttttiiiinnnngggg ooooppppttttiiiioooonnnnssss....
� Forced Vital capacityForced Vital capacityForced Vital capacityForced Vital capacity
� Relaxed Vital CapacityRelaxed Vital CapacityRelaxed Vital CapacityRelaxed Vital Capacity
� Maximum Voluntary Maximum Voluntary Maximum Voluntary Maximum Voluntary VentilationVentilationVentilationVentilation
� Oximetry and ECG Oximetry and ECG Oximetry and ECG Oximetry and ECG
� Stress TestingStress TestingStress TestingStress Testing

New Products
Otthon 2.0 AAAA pulmonary function diagnostics and pulmonary function diagnostics and pulmonary function diagnostics and pulmonary function diagnostics and monitoring device for the use of general monitoring device for the use of general monitoring device for the use of general monitoring device for the use of general practitiopractitiopractitiopractitioners and patients. It is a compact, ners and patients. It is a compact, ners and patients. It is a compact, ners and patients. It is a compact, mobile and affordable solution for screening mobile and affordable solution for screening mobile and affordable solution for screening mobile and affordable solution for screening COPD and asthma.COPD and asthma.COPD and asthma.COPD and asthma.
SpiroTube – PC Spirometer SpiroTube incorporates a highly cost effective SpiroTube incorporates a highly cost effective SpiroTube incorporates a highly cost effective SpiroTube incorporates a highly cost effective design. It is userdesign. It is userdesign. It is userdesign. It is user----friendly, robust, compact friendly, robust, compact friendly, robust, compact friendly, robust, compact and mobile. and mobile. and mobile. and mobile. Its high connectabilityIts high connectabilityIts high connectabilityIts high connectability ensures it ensures it ensures it ensures it isisisis suitable forsuitable forsuitable forsuitable for thethethethe longlonglonglong----term screening of term screening of term screening of term screening of COPD and asthma, especially in home care COPD and asthma, especially in home care COPD and asthma, especially in home care COPD and asthma, especially in home care uuuusssseeee....
2015 Highlights
9
ANNUAL REPORT 2015
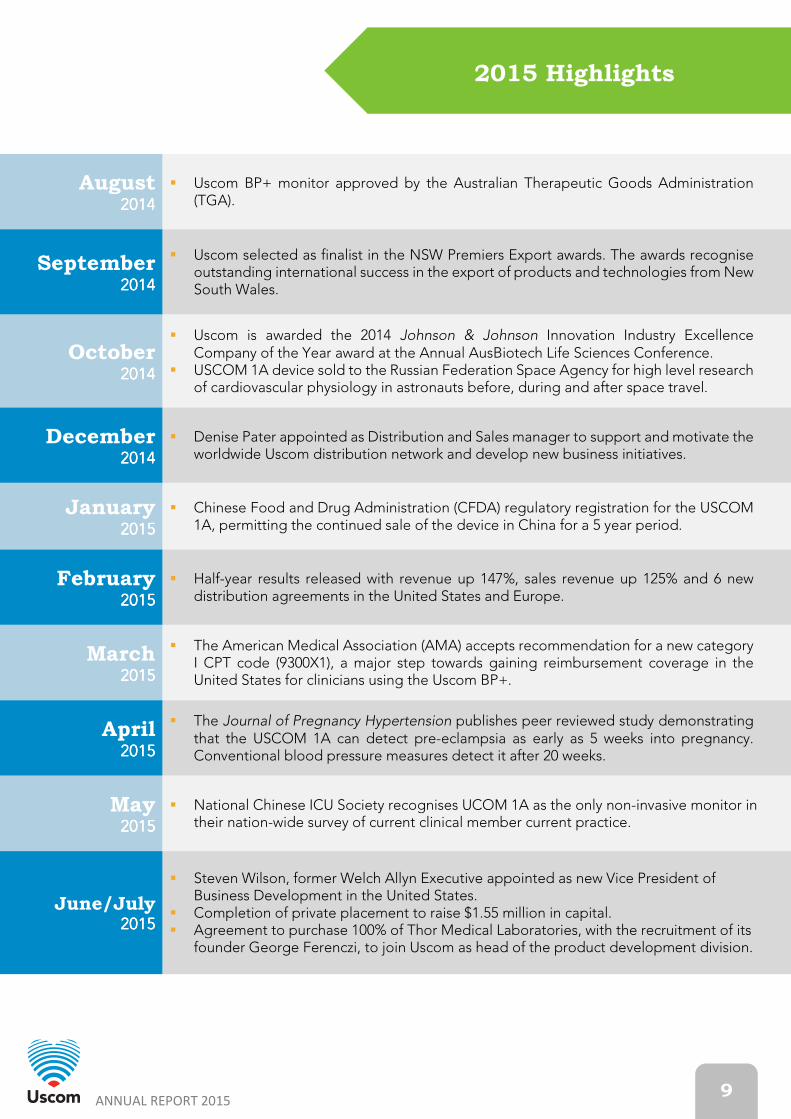
August 2014201420142014
� Uscom BP+ monitor approved by the Australian Therapeutic Goods Administration (TGA).
September 2014201420142014
� Uscom selected as finalist in the NSW Premiers Export awards. The awards recognise outstanding international success in the export of products and technologies from New South Wales.
October 2014201420142014
� Uscom is awarded the 2014 Johnson & Johnson Innovation Industry Excellence Company of the Year award at the Annual AusBiotech Life Sciences Conference.
� USCOM 1A device sold to the Russian Federation Space Agency for high level research of cardiovascular physiology in astronauts before, during and after space travel.
December 2014201420142014
� Denise Pater appointed as Distribution and Sales manager to support and motivate the worldwide Uscom distribution network and develop new business initiatives.
January 2015201520152015
� Chinese Food and Drug Administration (CFDA) regulatory registration for the USCOM 1A, permitting the continued sale of the device in China for a 5 year period.
February 2015201520152015
� Half-year results released with revenue up 147%, sales revenue up 125% and 6 new distribution agreements in the United States and Europe.
March 2015201520152015
� The American Medical Association (AMA) accepts recommendation for a new category I CPT code (9300X1), a major step towards gaining reimbursement coverage in the United States for clinicians using the Uscom BP+.
April 2015201520152015
� The Journal of Pregnancy Hypertension publishes peer reviewed study demonstrating that the USCOM 1A can detect pre-eclampsia as early as 5 weeks into pregnancy. Conventional blood pressure measures detect it after 20 weeks.
May 2015201520152015
� National Chinese ICU Society recognises UCOM 1A as the only non-invasive monitor in their nation-wide survey of current clinical member current practice.
June/July 2015201520152015
� Steven Wilson, former Welch Allyn Executive appointed as new Vice President of Business Development in the United States.
� Completion of private placement to raise $1.55 million in capital. � Agreement to purchase 100% of Thor Medical Laboratories, with the recruitment of its
founder George Ferenczi, to join Uscom as head of the product development division.

Corporate Governance
Statement
ANNUAL REPORT 2015 10
This statement outlines the Corporate Governance framework and practices adopted by the Board of Directors of Uscom Limited (the Boardthe Boardthe Boardthe Board) and in place for the financial year ended 30 June 2015, by reference to the ASX Corporate Governance Council’s Corporate Governance Principles and Recommendations (3rd Edition) (the the the the RecommendationsRecommendationsRecommendationsRecommendations). The Statement was approved by the Board on the 25th of August 2015. The Board and Senior Management of Uscom are committed to acting responsibly, ethically and with high standards of integrity as the Company strives to create shareholder value. Uscom is committed to implementing the highest standards of corporate governance appropriate for a company of its size and operations. The Board considers and applies the Recommendations taking into account the circumstances of the Company. Where the Company’s practices depart from a Recommendation, this Statement identifies the area of divergence and reasons for it, or any alternative practices adopted by the Company. The Board has established a number of corporate governance documents consistent with the Recommendations which form the basis of the Company’s corporate governance framework – these documents are referenced in this Corporate Governance Statement where relevant, and are as follows:
• Uscom Board Charter (updated and adopted 27 May 2015);
• Uscom Continuous Disclosure & Shareholder Communications Policy (updated and adopted 27 May 2015);
• Uscom Code of Conduct (updated and adopted 27 May 2015); and
• Uscom Securities Trading Policy (updated and adopted 27 May 2015).
The corporate governance documents are available on the Uscom website under “Investor” then “Corporate Governance.” http://uscom.com.au/investor/corp_governance.html
Principle 1: Lay solid foundations for management and oversight
The Board has primary responsibility for guiding and monitoring the business and affairs of Uscom, including compliance with the Company’s corporate governance framework, and in conjunction with senior management, setting the strategic direction of the Company.
It is the role of Senior Management to manage the Company in accordance with the direction and delegation of the Board and the responsibility of the Board to provide leadership to, and oversee the activities of Management in carrying out these delegated duties.
The Board Charter sets out the roles and responsibilities of the Board, including those matters specifically reserved to the Board. The Charter also sets out the role and responsibility of the Chief Executive Officer, which is primarily the day to day management of the Company, supported by the senior management team.
The Board Charter provides that prior to the appointment of a new Director, and before a candidate is put forward as a candidate for election as a Director, appropriate checks will be undertaken including checks regarding the person’s experience, education, disqualification from holding certain offices, criminal record and bankruptcy history. At any AGM the Company provides shareholders with all material information in its possession relevant to a decision on whether or not to elect or re-elect a director. Non-executive Directors are provided with a formal letter of appointment which sets out the key terms, conditions, responsibilities and expectations of their appointment. Senior Management are employed under individual service contracts which set out their terms of employment including details of their duties, responsibilities, rights and remuneration entitlements. The Board Charter provides that Directors may seek independent professional advice at the expense of the Company, when considered necessary to discharge their responsibilities to the Company. Any such advice is the property of the Company and may be provided to the other Directors. The Board Charter provides that the Company Secretary is accountable to the Board through the Chairman for all matters concerning the proper functioning of the Board, including advising on governance matters, monitoring that the Board’s policies and procedures are followed and ensuring that the business at Board meetings is accurately captured in the minutes. As a matter of practice, where the Board is considering any matters relating to the Executive Chairman in his capacity as Chief Executive Officer, the Company Secretary reports and is accountable to the Non-Executive Directors.
Corporate Governance
Statement Continued
ANNUAL REPORT 2015 11
The Board does not have a formal Diversity Policy in place and has not established measurable objectives for achieving measurable objectives for achieving gender diversity at this time. Given the small size of the Company workforce and the stage of the Company’s development, the Board considers that it is not currently necessary or practical to establish a Diversity Policy or have measurable objectives aimed at achieving gender diversity. The Company seeks to promote and support an appropriate mix of diversity on its Board, in senior management and the organisation more generally. The Board will continue to review this matter, including whether it may be appropriate to establish a formal framework in this regard as the Company meets its strategy and grows. The proportion of women employees in the whole organisation, women in senior management positions and women on the Board are set out in the following table:
Proportion of Women Proportion of Women Proportion of Women Proportion of Women Whole OrganisationWhole OrganisationWhole OrganisationWhole Organisation 4 of 9 (44%) Senior Management PositionsSenior Management PositionsSenior Management PositionsSenior Management Positions 0 of 2 (0%) BoardBoardBoardBoard 1 of 3 (33%)
Recommendation 1.5(c)(1)Recommendation 1.5(c)(1)Recommendation 1.5(c)(1)Recommendation 1.5(c)(1) The Board has not established a formal process for evaluating its performance and that of individual directors to date. Given the small size of the Board, to date the Directors have considered that they have been able to assess and monitor each other’s performance on an ongoing basis, and raise any concerns as they arise. The Board Charter provides that the Board is responsible for undertaking a formal evaluation process to review its performance once a year, therefore the Board will review this matter with a view to establishing a formal evaluation process in the next reporting period. There is currently no formal evaluation process in place by which the Board assesses the performance of senior management against specific measurable performance criteria. The Board considers that given the size of the Company and the stage of its development, it is most appropriate to assess senior management’s performance on a continuous informal basis.
Principle 2: Structure the Board to add value
The current Board has 3 Directors comprising the Executive Chairman and Chief Executive Officer Rob Phillips, and two independent Non-Executive Directors, Christian Bernecker and Sheena Jack. The Board Charter provides that an independent director is determined by reference to the factors set out in Box 2.3 of the Recommendations. Further details about the Directors, including their tenure, skills, experience and expertise relevant to the position of director, and their non-executive and independent status, are set out in the Directors’ Report on pages 15 to 22 of the Annual Report. The Executive Chairman Rob Phillips is not independent. The Board considers it is appropriate that Dr Phillips undertakes this role, given his specific qualifications, knowledge and experience, and deep understanding of the Company, its products and operations. The Board has also taken into account the size of the Company and the Board, and the stage of development of the Company’s business and strategy. The Board Charter sets out the distinct responsibilities of the role of the Executive Chairman and the Non-Executive Directors, and provides that an Independent Director will be appointed to fulfil the role of Chairman whenever the Executive Chairman is conflicted. Dr Phillips is also the Chief Executive Officer of the Company, and therefore the role of the Chairman and Chief Executive Officer are undertaken by the same person. The Board believes this is appropriate, for the reasons given above in relation to Dr Phillips’ role as Executive Chairman. The Board has not established a Nominations Committee at this time, given the current size and composition of the Board and Company, and taking into account that it is not likely that the size of the Board will increase in the short to medium-term. The Board carries out the functions that would ordinarily be carried out by a Nomination Committee. The Board considers that there is currently an appropriate mix of skills, diversity and experience on the Board, taking into account the size of the company, the stage of its development and the nature of its operations. The
Company seeks to maintain a Board of Directors with a broad range of relevant financial, industry and other relevant skills, experience and knowledge.
Corporate Governance
Statement Continued
ANNUAL REPORT 2015 12
The Board has not developed a skills matrix at this time. The Board considered the attributes of its current Directors at the time of their appointment, including the specific skills, experience, expertise and diversity they brought to the Board, in light of the Company’s stage of development, its operations and strategy. To date the Board has considered that given its small size, it is able to identify any possible gaps in Board skills. However, the Board believes that a skills matrix would provide a sound basis for both Board evaluation purposes and to assist in identifying what may be required of future Board candidates, in the event it determines to appoint a new Director. The Board intends to establish a skills matrix in the next reporting period. The Board will also consider establishing plans to manage the succession of senior management in the next reporting period. The Board Charter provides that each new Director will be required to participate in an induction program to familiarise themselves with the Company, its strategy and operations, and policies and procedures. Directors may undertake and request training as appropriate for their role, with the permission of the Chairman. The Charter also provides that in carrying out their duties and responsibilities, Directors may seek independent professional advice at the Company’s expense, after consultation with the Chairman.
Principle 3: Promote ethical and responsible decision making
The Board is committed to ensuring that the Company maintains the highest standards of integrity, honesty and fairness in its dealings with all stakeholders, and that the Company complies with all legal and other obligations. The Company has established a Code of Conduct (the Codethe Codethe Codethe Code) which applies to all directors, senior management and staff (EmployeesEmployeesEmployeesEmployees). The Code promotes practices that aim to foster the Company’s key values, which include providing a safe and healthy work environment, encouraging Employees to act with fairness, honesty and integrity, being aware of and abiding by relevant laws and regulations and maintaining high standards of professional behaviour. Employees are expected to be honest and ethical in their dealings with each other and all stakeholders. The Company’s Securities Trading Policy applies to all Directors, officers and employees of Uscom. The Policy sets out the prohibitions against insider trading, and prescribes certain requirements for dealing in Uscom securities. All Company personnel are prohibited from trading in Uscom securities while in possession of material non-public information, which is information a reasonable person would expect to have a material effect on the price or value of Uscom securities. The Policy provides for certain black-out periods when no trading may occur.
Principle 4: Safeguard integrity in corporate reporting
The Board does not have an Audit Committee, having dissolved its Audit Committee in February 2014. The Board considers that taking into account the size of the Company and the Board, the nature of the Company’s operations and the stage of the Company’s development, it is not necessary to have a separate Audit Committee. The functions that would ordinarily be undertaken by an Audit Committee, including issues relating to the Company’s financial information and review of the Company’s risk controls and processes, are primarily carried out by the two Non-Executive Directors. Non-Executive Director Sheena Jack is an experienced financial professional who has held senior positions in that capacity. The Board has not currently established a formal procedure for the selection, appointment and rotation of the external auditor. The performance of the external auditor is reviewed on an ongoing basis by the Board. Prior to approval of the Company’s half year and annual financial reports, the Executive Chairman and General Manager are required to provide the Board with written assurances in relation to the half year and annual financial reports that the declaration provided in accordance with section 295A of the Corporations Act 2001(Cth) is founded on a sound system of risk management and internal compliance and control and that the system is operating effectively in all material respects in relation to financial reporting risks. These assurances were provided in the reporting period. The external auditor attends the Company’s Annual General Meeting and is available to answer shareholder questions about the conduct of the audit and preparation and conduct of the Independent Auditor’s Report. Shareholders are also given the opportunity to submit written questions prior to the meeting. The Company
considers that this is important in promoting and encouraging shareholder participation and reflects and supports the roles of the auditor and the auditor’s accountability to shareholders.
Principle 5: Make timely and balanced disclosure
The Company’s Continuous Disclosure Policy and External Communications Policy sets out the policies and procedures relating to: • Uscom’s continuous disclosure obligations under the ASX Listing Rules and Corporations Act 2001 (Cth);

Corporate Governance
Statement Continued
ANNUAL REPORT 2015 13
• how Uscom staff are required to deal with potentially price-sensitive information, and communications
with external stakeholders such as the media, security holders and the community to ensure that the
Company meets its continuous disclosure obligations; and
• The Company’s shareholder communications policy generally.
It is Uscom’s policy to ensure that all market participants have an equal opportunity to review and access material information made available by the Company, and that the Company complies with both the letter and spirit of its continuous disclosure obligations under the ASX Listing Rules and the Corporations Act. The Continuous Disclosure and External Communications Policy facilitates compliance with the Company’s continuous disclosure obligations by setting out procedures that must be followed if staff become aware of material information, and the obligations of senior management and the Board to continuously assess and consider continuous disclosure matters. The Policy specifies those persons authorised to speak to ASX or other external parties in relation to the Company, and those disclosure matters that fall within the reserved powers of the Board. Other matters dealt with in the Policy include:
• dealing with market speculation and rumours;
• trading halts;
• management of information during periods where the Company may be in possession of price-sensitive
information;
• analyst briefings; and
• monitoring of media and social media.
Principle 6: Respect the rights of shareholders
Uscom’s Continuous Disclosure and Shareholder Communications Policy sets out its policy and practices in relation to Uscom’s commitment to providing shareholders with the necessary information and facilities to allow them to exercise their rights effectively, including:
• providing shareholders with ready access to information about Uscom and its governance;
• communicating openly and honestly with shareholders; and
• encouraging and facilitating shareholder participation in shareholder meetings.
The Company’s website www.uscom.com.au provides detailed information about its business and operations. The Investor section of the website provides helpful information to shareholders and a link to Uscom’s Share Registrar, Boardroom. The Investor section also provides a link to the ASX share price and Annual and periodic Reports. Shareholders can find information about the Company’s corporate governance practices in the Uscom Corporate Governance section under “Investors”. This includes the Company’s Constitution, Board and Charter and the Company’s corporate governance policies. The Company provides shareholders with the option of receiving communications from, and sending communications to, the Company and Share Registry electronically, for reasons of cost, convenience and environmental considerations. The Company provides a printed copy of the Annual Report only to those shareholders who have specifically elected to receive a printed copy. Other shareholders are advised that the Annual Report is available on the Company’s website. Shareholders are encouraged to register on the Company website to receive email alerts of ASX Announcements and Media Releases and other news. The Company’s Share Register is managed and maintained by Boardroom Limited. Shareholders can access their shareholding details or make enquiries about their shareholding electronically through the link provided on the Uscom website in the Investor section, or through the Boardroom InvestorServe facility or by emailing [email protected]. The Company has not implemented a formal investor relations program to facilitate effective two-way communication with investors. The Board will consider establishing such a program when it believes it is appropriate, taking into account the Company’s stage of development, and the resources available to the Company.
Corporate Governance
Statement Continued
ANNUAL REPORT 2015 14
Principle 7: Recognise and manage risk
The Board is responsible for oversight of risk, including monitoring and review of risk management matters delegated to senior management. To date, the Board has not established a formal risk management framework and does not conduct formal periodic reviews of the effectiveness of specific risk controls. The Board assesses the Company’s material business risks and controls, including accounting, financial and operating controls, on an informal and ongoing basis. The Board intends to establish a formal risk management framework and processes for monitoring the effectiveness of that framework in the next reporting period. The Company does not retain an Internal Audit function. The Board considers this is appropriate, taking into account the Company’s stage of development, the scale of its operations and the relative simplicity of its finance function. The Board intends to review the processes it employs to evaluate risk management processes and internal control processes as part of its overall consideration of its risk management framework in the next reporting period. The Board does not consider that the Company has any material exposure to economic, environmental and social sustainability risks.
Principle 8: Remunerate fairly and responsibly
The Board has not established a Remuneration Committee. The Board is responsible for:
• reviewing the performance and remuneration of senior management. In the case of the Executive
Chairman the two non-executive Directors are responsible for review of Dr Phillips’ performance and
remuneration package;
• establishing the remuneration framework for non-executive directors, within the threshold approved by
shareholders; and
• reviewing and determining equity-based remuneration plans for senior management and employees.
The Company’s remuneration structure distinguishes between non-executive Directors and that of the Executive Chairman and Senior Management. The Remuneration Report required under section 300A of the Corporations Act 2001 (Cth) is provided in the Directors’ Report on pages 17-22. The Company’s Securities Trading Policy specifically prohibits Directors and senior management from entering into transactions which would limit the economic risk of any unvested entitlements under any equity-based remuneration schemes. Further, Directors and senior management are prohibited from entering into margin loan arrangements or other arrangements whereby their securities in the Company may be used as collateral, without prior approval. Breaches of this policy are regarded as serious misconduct.

ANNUAL REPORT 2015 15
Directors Report
The Directors present their report on Uscom Ltd and its Controlled Entity for the financial year ended 30 June 2015.
Directors
The following persons were Directors of Uscom Ltd during the whole of the financial year and up to the date of this report, unless otherwise stated.
Associate Professor R A Phillips Executive Director - Chairman Ms S Jack Non-Executive Director Mr C Bernecker Non-Executive Director
Directors’ qualifications and experience
Associate ProfessorAssociate ProfessorAssociate ProfessorAssociate Professor Rob PhillipsRob PhillipsRob PhillipsRob Phillips Rob Phillips is the founder of Uscom Ltd, the Chief Executive Officer, Executive Director and Chief Scientist of the Company. Rob has 10 years’ experience as Executive Chairman of the Company, having taken Uscom to IPO in 2003, and has over 20 years in executive corporate management and capital raising. Rob has overseen the company’s acquisition of two international medical device companies in 2013 and 2015. Rob has a Doctor of Philosophy and a Master of Philosophy in Cardiovascular Medicine from The University of Queensland and is an Adjunct Associate Professor with the Critical Care Research Group, at the School of medicine, The University of Queensland. He is an Australian Post Graduate Award recipient and was a finalist in the Time-Google-CNN-Science-NYSE World Health and Medicine Technology Awards in 2004. Rob has pioneered novel clinical approaches to cardiovascular assessment having authored over 30 patents and patent applications and is an internationally recognised author, teacher and examiner in the field of cardiac ultrasound, cardiovascular function and circulation. Ms Sheena JackMs Sheena JackMs Sheena JackMs Sheena Jack Ms Sheena Jack is a Non-Executive Director of Uscom Ltd since November 2011. Sheena was until recently the Chief Financial Officer of HCF when she took up the role of HCF Chief Strategy Officer. Sheena has over 25 years’ experience as a finance professional and corporate executive. She has had experience across a range of corporate organisations including ASX listed companies, government and not for profit in both mature and start-up businesses. Sheena has significant experience in mergers and acquisitions, business integration, strategy development and implementation, capital markets and organisational transformation. She has been a Director of Moneytime Health Pty Ltd since January 2007. Sheena is a Chartered Accountant and a graduate member of the Australian Institute of Company Directors. Mr Christian BerneckerMr Christian BerneckerMr Christian BerneckerMr Christian Bernecker Mr Christian Bernecker is a Non-Executive Director of Uscom Ltd since November 2011. Christian is Chairman of Stream Group Limited and has more than 10 years of broad investment experience across capital raising, acquisitions and divestments. Christian qualified as a Chartered Accountant in Australia and holds a Bachelor of Commerce from Ballarat University.
Company Secretary’s qualifications and experience
Ms Catherine OfficerMs Catherine OfficerMs Catherine OfficerMs Catherine Officer Catherine Officer is an experienced Company Secretary and Corporate Lawyer with over 20 years experience. She has previously hold senior positions at ASX Limited and Macquarie Group. She has a Bachelor of Laws from the University of Melbourne.
Meetings of Directors
Directors Board of Directors Meetings held while a Director No. of meetings attended R A Phillips 8 7 S Jack 8 8 C Bernecker 8 8
ANNUAL REPORT 2015 16
Directors Report Continued
Principal activities
Uscom Ltd is engaged in the development, design, manufacture and marketing of non-invasive cardiac monitoring devices. Uscom Ltd owns a portfolio of intellectual property relating to the technology and techniques associated with these devices and manages a worldwide network of distribution partners for the sale of its equipment to hospitals and other medical care locations. Uscom Ltd owns 100% of Uscom, Inc. a company engaged in the sale and promotion of USCOM devices primarily in the United States.
Operating result
The loss of the Consolidated Entity after providing for income tax amounted to $1,215,654 (2014: $1,520,500)
Dividends
No dividends were declared or recommended for the financial year ended 30 June 2015 (2014: nil).
Significant changes in state of affairs
There were no significant changes in state of affairs during the financial year.
Operating and financial review
The operating and financial review is stated per the Chairman’s letter on pages 2-5.
Events after the reporting date
Apart from the items disclosed in note 28 to the financial statements, no other matters or circumstances have arisen since the end of the financial year to the date of this report, that has significantly affected or may significantly affect the activities of the Consolidated Entity, the results of those activities or the state of affairs of the Consolidated Entity in the ensuing or any subsequent financial year.
Future developments
Other than the business activities described in the annual report and, in particular, those matters discussed in the Operating and Financial Review, the Board is not aware of any likely developments in the foreseeable future which may materially impact on the financial outlook of the Consolidated Entity.
Environmental issues
The Consolidated Entity’s operations are not subject to significant environmental regulation under the law of the Commonwealth and State.
Indemnifying officers
The Consolidated Entity has paid premiums to insure all Directors and Executives against liabilities for costs and expenses incurred by them in defending any legal proceedings arising out of their conduct while acting in the capacity of Director of the Company, other than conduct involving a wilful breach of duty in relation to the Company.
Proceedings on behalf of the Consolidated Entity
No person has applied to the Court under section 237 of the Corporations Act 2001 for leave to bring proceedings on behalf of the Consolidated Entity, or to intervene in any proceedings to which the Consolidated Entity is a party, for the purpose of taking responsibility on behalf of the Consolidated Entity for all or part of those proceedings. No proceedings have been brought or intervened in on behalf of the Consolidated Entity with leave of the Court under section 237 of the Corporations Act 2001.
Non-audit services
The Consolidated Entity may decide to employ the auditor on assignments additional to their audit duties where the auditor’s expertise and experience with the Consolidated Entity are important. The Directors are of the opinion that the provision of non-audit services as disclosed in note 25 in the financial report does not compromise the external auditor’s independence as outlined in the Corporations Act 2001 for the following reasons:
• All non-audit services have been reviewed and approved to ensure that they do not impact the integrity and objectivity of the auditor, and

ANNUAL REPORT 2015 17
Directors Report Continued
• None of the services undermine the general principles relating to auditor independence as set out in the Code of Conduct APES110 Code of Ethics of Professional Accountants issued by the Accounting
• Professional and Ethical Standards Board, including reviewing or auditing the auditor’s own work, acting in management decision making capacity for the Company, acting as advocate for the Company or jointly sharing economic risks and rewards.
Refer to note 25 of the financial statements on page 46 for details of auditors’ remuneration. The auditor’s independence declaration as required under section 307C of the Corporation Act is set out on page 23 and forms part of the Directors’ Report. BDO East Coast Partnership continues in office in accordance with section 327 of the Corporations Act 2001.
Remuneration report (Audited)
This remuneration report has been prepared by the Directors of Uscom Ltd to comply with the Corporations Act 2001 and the key management personnel (KMP) disclosures required under Australian Accounting Standards AASB 124 – Related Party Disclosures.
Key management personnel
The following were key management personnel of the Entity at the start of the financial year to the date of this report unless otherwise stated: NonNonNonNon----Executive DirectorsExecutive DirectorsExecutive DirectorsExecutive Directors Sheena Jack, Non-Executive Director Christian Bernecker, Non-Executive Director Executive DirectorsExecutive DirectorsExecutive DirectorsExecutive Directors Rob Phillips, Executive Director, Chairman, Chief Executive Officer Senior ExecutivesSenior ExecutivesSenior ExecutivesSenior Executives Nick Schicht, General Manager In the Directors’ opinion, there are no other Executives of the Entity.
Remuneration policies
The Board is responsible for reviewing the remuneration policies and practices of the Consolidated Entity, including the compensation arrangements of Executive Directors, Non-Executive Directors and Senior Executives. The Consolidated Entity has adopted remuneration policies based on performance and contribution for determining the nature and amount of emoluments of Board Member and Senior Executives. The objective of these policies is to: • Make Uscom Ltd and its Controlled Entity an employer of choice • Attract and retain the highest calibre personnel • Encourage a culture of reward for effort and contribution • Set incentives that reward short and medium term performance for the Consolidated Entity • Encourage professional and personal development In the case of Senior Executives, a recommendation for compensation review will be made by the Chairman to the Board, which will conduct a performance review.
Non-Executive Directors
The Board determines the Non-Executive Director remuneration by independent market data for comparative Companies. As at the date of this report the maximum aggregate remuneration payable out of the funds of the Entity to Non-Executive Directors of the Consolidated Entity for their services as Directors including their service on a committee of Directors is $165,000 per annum. Non-Executive Directors do not receive any performance related remuneration, therefore they do not receive bonuses or non-cash benefits. Non-Executive Directors’ retirement payments are limited to compulsory employer superannuation.
ANNUAL REPORT 2015 18
Directors Report Continued
Executive Directors and Senior Executives remuneration
The Consolidated Entity’s remuneration policy directs that the remuneration package appropriately reflects the Executives’ duties and responsibilities and that remuneration levels attract and retain high calibre Executives with the skills necessary to successfully manage the Consolidated Entity’s operations and achieve its strategic and financial objectives. The total remuneration packages of Executive Directors and Senior Executives are on a salary basis. In addition to base salary, the Company has a policy of rewarding extraordinary contribution to the growth of the Company with the grant of an annual discretionary cash bonus and options under the Consolidated Entity’s Employee Share Option Plan. Executives are also entitled to be paid for their reasonable travel, accommodation and other expenses incurred in consequence in the execution of duties. Other than the Uscom Ltd Employee Share Option Plan, the Consolidated Entity does not provide any other non-cash benefits in lieu of base salary to Executives. Remuneration packages for Executive Directors and Senior Executives generally consist of three components: • Fixed remuneration which is made up of cash salary, salary sacrifice components and superannuation • Short term incentives • Long term incentives which include issuing options pursuant to the Uscom Ltd Employee Share Option Plan. Fixed remunerationFixed remunerationFixed remunerationFixed remuneration Senior Executives who possess a high level of skill and experience are offered a competitive base salary. The performance of each Executive will be reviewed annually. Following the review, the Consolidated Entity may in its sole discretion increase the salary based on that Executive’s performance, productivity and such other matters as the Board considers relevant. Superannuation contribution by the Consolidated Entity is limited to the statutory level of wages and salaries. ShortShortShortShort----term incentivesterm incentivesterm incentivesterm incentives The remuneration of Uscom Ltd Senior Executives does not include any short-term incentive bonuses as part of their employment conditions. The Board may however approve discretionary bonuses to Executives in relation to certain milestones being achieved. LongLongLongLong----term incentivesterm incentivesterm incentivesterm incentives The Consolidated Entity has adopted an Equity Incentive Plan for the benefit of Executive Director, an employee, contractor, consultant or any other person whom the Board determines to be eligible to participate in the Plans. The Board, at its discretion, may approve the issue of options and rights under the Equity Incentive Plan to the Senior Executives. The vesting of options and rights issued may be conditional upon the achievement of performance hurdles determined by the Board from time to time. The Board may propose the issue of options and rights to Directors, however this will be subject to shareholder approval at the Annual General Meeting. Independent data from applicable sources may be requested by the Board to assess whether the performance hurdles have been met. During the year, 5,409,902 Indeterminate Rights were issued to Rob Phillips on the terms and conditions approved by shareholders at the AGM on 26 November 2014. Vesting dependent on performance hurdles on 1 July 2018, 1 July 2019 & 1 July 2020. The Board may exercise its discretion to pay cash in lieu of issue of ordinary shares. 450,000 Performance Rights were issued to Nick Schicht on 26 November 2014, vesting dependent on performance hurdles on 1 July 2018, 1 July 2019 and 1 July 2020.
Service agreements
The Consolidated Entity has entered into an employment agreement with the Executives that • Outlines the components of remuneration payable; and • Specifies termination conditions. Details of the employment agreement are as follows:
ANNUAL REPORT 2015 19
Directors Report Continued
Each Executive may not, during the term of the employment agreement, perform work for any other person, corporation or business without the prior written consent of the Consolidated Entity. The employment terms do not prescribe the duration of employment for executives. Due to the small number of Executives the remuneration committee comprises the Board of Directors which is made up of two Non-Executive Directors. Reference is made to external market information in order to retain the most suitable Executives for meeting the entity’s goals. Executive Directors are excluded from discussions on their remuneration. The remuneration of key Executives are not linked with the Consolidated Entity’s performance as the focus is on retention of key Executives to ensure growth and traction in what is a new market. The Board of Directors will consider linking executive remuneration to Consolidated Entity’s performance once the Consolidated Entity has sufficient market traction. TerminationTerminationTerminationTermination Despite anything to the contrary in the agreement, the Consolidated Entity or the Executive may terminate the employment at any time by giving the other party 3 months’ notice in writing. If either the Consolidated Entity or the Executive gives notice of termination, the Consolidated Entity may, at its discretion, choose to terminate the Executive’s employment immediately or at any time during the notice period and pay the Executive an amount equal to the salary due to them for the residual period of notice at the time of termination. Where the Executive gives less than 3 months written notice, the Consolidated Entity may withhold from the Executive’s final payment an amount equal to the shortfall in the notice period. The employment of each Executive may be terminated immediately without notice or payment in lieu in the event of any serious or persistent breach of the agreement, any serious misconduct or wilful neglect of duties, in the event of bankruptcy or any arrangement or compensation being made with creditors, on conviction of a criminal offence, permanent incapacity of the Executive or a consistent failure to carry out duties in a manner satisfactory to the Consolidated Entity.
Directors and Executives remuneration
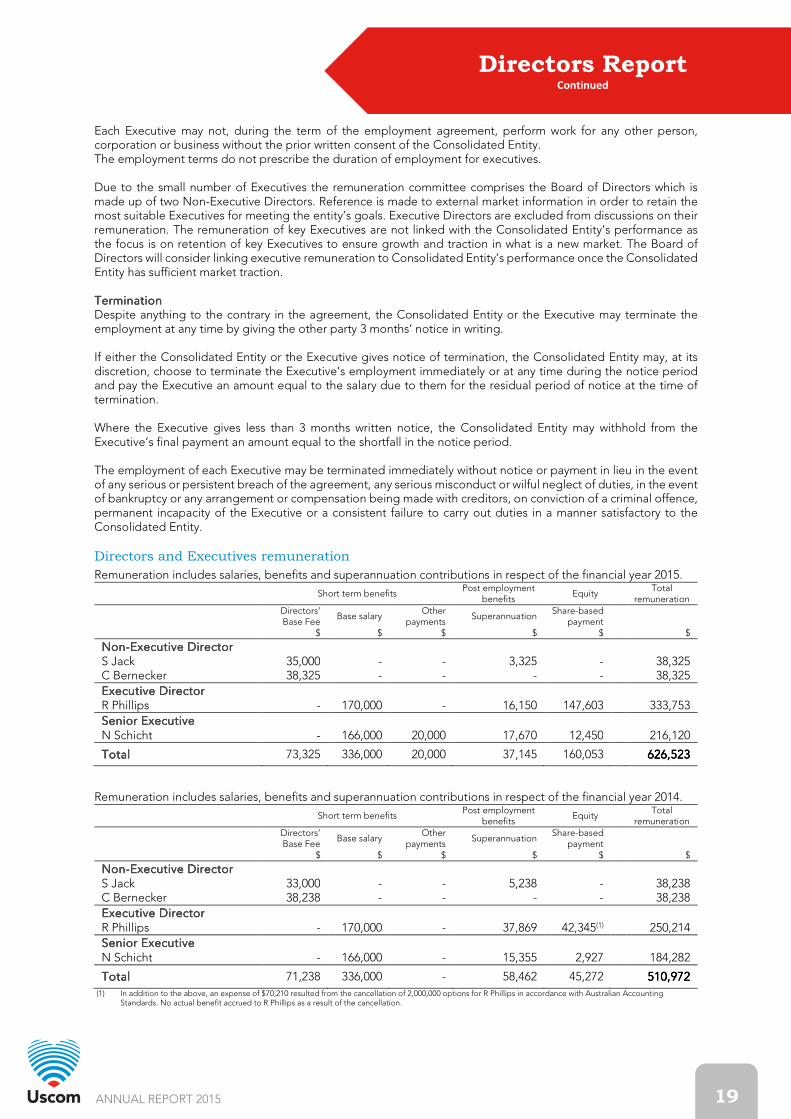
Remuneration includes salaries, benefits and superannuation contributions in respect of the financial year 2015.
Short term benefits Post employment
benefits Equity
Total remuneration
Directors’ Base Fee
Base salary Other
payments Superannuation
Share-based payment
$ $ $ $ $ $
NonNonNonNon----EEEExecutive xecutive xecutive xecutive DDDDirectorirectorirectorirector S Jack 35,000 - - 3,325 - 38,325 C Bernecker 38,325 - - - - 38,325 Executive Executive Executive Executive DDDDirectorirectorirectorirector R Phillips - 170,000 - 16,150 147,603 333,753 Senior ESenior ESenior ESenior Executivexecutivexecutivexecutive N Schicht - 166,000 20,000 17,670 12,450 216,120
TotalTotalTotalTotal 73,325 336,000 20,000 37,145 160,053 626626626626,,,,525252523333
Remuneration includes salaries, benefits and superannuation contributions in respect of the financial year 2014.
Short term benefits Post employment
benefits Equity
Total remuneration
Directors’ Base Fee
Base salary Other
payments Superannuation
Share-based payment
$ $ $ $ $ $
NonNonNonNon----EEEExecutive xecutive xecutive xecutive DDDDirectorirectorirectorirector S Jack 33,000 - - 5,238 - 38,238 C Bernecker 38,238 - - - - 38,238 Executive Executive Executive Executive DDDDirectorirectorirectorirector R Phillips - 170,000 - 37,869 42,345(1) 250,214 Senior ESenior ESenior ESenior Executivexecutivexecutivexecutive N Schicht - 166,000 - 15,355 2,927 184,282
TotalTotalTotalTotal 71,238 336,000 - 58,462 45,272 510,972510,972510,972510,972
(1) In addition to the above, an expense of $70,210 resulted from the cancellation of 2,000,000 options for R Phillips in accordance with Australian Accounting Standards. No actual benefit accrued to R Phillips as a result of the cancellation.

ANNUAL REPORT 2015 20
Directors Report Continued
Equity Incentive Plan
The Consolidated Entity has adopted a new Equity Incentive Plan for the benefit of an employee, contractor, consultant or executive director of the Group or any other person whom the Board determines to be eligible to participate in the Plans. The purpose of the Plan is to:
• provide Eligible Persons with an incentive plan which recognises ongoing contribution to the achievement by the Company of its strategic goals thereby encouraging the mutual interdependence of Participants and the Company;
• align the interests of Participants with shareholders of the Company through the sharing of a personal interest in the future growth and development of the Company as represented in the price of the Company’s ordinary fully paid shares;
• encourage Eligible Persons to improve the performance of the Company and its total return to Shareholders; and
• provide a means of attracting and retaining skilled and experienced employees. Under the Plan, the Consolidated Entity will be able to grant short-term incentive and long-term incentive awards to Eligible Employees (including Executive Directors). The Plan will provide the Board with the flexibility to grant equity incentives to Eligible Persons in the form of Plan Shares, rights or Options, will only vest on the satisfaction of appropriate hurdles.
Number of options over ordinary shares held by Directors and Senior Executives
Balance Granted Exercised Lapsed /
Cancelled Balance Total vested
Total unexercisable
1 July 2014 During FY2015
During FY2015
During FY2015
30 June 2015 30 June 2015 30 June 2015
No. No. No. No. No. No. No.
NonNonNonNon----EEEExecutive xecutive xecutive xecutive DDDDirectorirectorirectorirector S Jack - - - - - - - C Bernecker - - - - - - - Executive Executive Executive Executive DDDDirectorirectorirectorirector R Phillips 1,000,000 - - - 1,000,000 750,000 250,000 SSSSeniorenioreniorenior EEEExecutivexecutivexecutivexecutive N Schicht 300,000 - (200,000) - 100,000 100,000 -
TotalTotalTotalTotal 1,300,000 - (200,000) - 1,100,000 850,000 250,000
Details of options outstanding as at end of year
Holders No. Grant date Exercisable at 30 June
2015 Expiry date
30 June 2015
Outstanding Option
Exercise Price
Issued date fair
value
% No. $ $
8 (Employees & Executive)
29 March 2012 100% 29 March 2016 837,500 0.0595 0.06
1 (Director) 7 November 2012 75% 7 November 2016 1,000,000 0.0595 0.07 1 (Consultant) 1 December 2014 33% 1 July 2018 75,000 0.1700 0.20
TotalTotalTotalTotal 1,912,500
The options issued prior to this financial year were issued under the previous employee option plan and had an exercise price based on 85% of the average ASX closing price for the 5 days prior to offer/acceptance of the options. Each option was issued for a period of 4 years, which vested 25% in tranches throughout the period. The options issued on 1 December 2014 were issued under the Equity Incentive Plan. The options vest one third each on the issue day 1 December 2014, 1 July 2015 and 1 July 2016. Further details of the options are disclosed in note 18 of the financial statements.

ANNUAL REPORT 2015 21
Directors Report Continued
Number of rights over ordinary shares held by Directors and Senior Executives
Balance Granted Exercised Lapsed /
Cancelled Balance
Total vested
Total unexercisable
1 July 2014 During FY2015
During FY2015
During FY2015 30 June 2015 30 June 2015 30 June 2015
No. No. No. No. No. No. No.
NonNonNonNon----EEEExecutive xecutive xecutive xecutive DDDDirectorirectorirectorirector S Jack - - - - - - - C Bernecker - - - - - - - Executive Executive Executive Executive DDDDirectorirectorirectorirector R Phillips - 5,409,902 - - 5,409,902 - 5,409,902 SSSSeniorenioreniorenior EEEExecutivexecutivexecutivexecutive N Schicht - 450,000 - - 450,000 - 450,000
TotalTotalTotalTotal - 5,859,902 - - 5,859,902 - 5,859,902
Details of rights outstanding as at end of year
Holders No. Grant date Exercisable at 30 June
2015 Expiry date
30 June 2015 Outstanding
Option
Exercise Price
Issued date fair
value % No. $ $
1 (Director) 26 November 2014 0% 1 July 2020 5,409,902 0.00 0.19 1 (Executive) 26 November 2014 0% 1 July 2020 450,000 0.00 0.19
TotalTotalTotalTotal 5,859,902
5,409,902 Indeterminate Rights were issued to Rob Phillips on the terms and conditions approved by shareholders at the AGM on 26 November 2014. Vesting dependent on performance hurdles on 1 July 2018, 1 July 2019 & 1 July 2020. Consideration payable upon vesting is $nil. The Board may exercise its discretion to pay cash in lieu of issue of ordinary shares. 450,000 Performance Rights were issued to Nick Schicht, vesting dependent on performance hurdles on 1 July 2018, 1 July 2019 and 1 July 2020. Consideration payable upon vesting is $nil.
Number of shares held by Directors and Senior Executives (including indirect interest)
Balance Received as Options Net change Balance 1 July 2014 Remuneration Exercised Other* 30 June 2015 No. No. No. No. No. NonNonNonNon----EEEExecutive xecutive xecutive xecutive DDDDirectorirectorirectorirector S Jack 796,667 - - - 796,667(1) C Bernecker - - - - - Executive Executive Executive Executive DDDDirectorirectorirectorirector R Phillips 17,046,733 - - - 17,046,733(2) SSSSenior Eenior Eenior Eenior Executivexecutivexecutivexecutive N Schicht 18,200 - 200,000 - 218,200(3)
TotalTotalTotalTotal 17,861,600 - 200,000 - 18,061,600
*Net change other refers to share purchased or sold during the financial year, or cessation of categorisation as a Director or Senior Executive.
(1) All these ordinary shares are held by family associate.
(2) 6,432,924 of these ordinary shares are held by Australian Cardiac Sonography Pty Ltd as trustee for the Phillips Superannuation.
(3) 10,000 of these ordinary shares are held by family associate.

ANNUAL REPORT 2015 22
Directors Report Continued
Additional Information
The earnings of the consolidated entity for the five years to 30 June 2015 are summarised below:
2015201520152015 2014201420142014 2013201320132013 2012201220122012 2011201120112011
$ $ $ $ $
Sales Revenue 1,515,381 1,056,502 578,753 794,135 834,813
Loss after income tax (1,215,654) (1,520,500) (1,371,683) (1,824,547) (2,685,913)
The factors that are considered to affect total shareholders return (‘TSR’) are summarised below:
2015201520152015 2014201420142014 2013201320132013 2012201220122012 2011201120112011
Share Price at financial year end ($) 0.19 0.22 0.17 0.094 0.22
Total dividends declared (cents per share) - - - - -
Basic earnings declared (cents per share) (1.5) (2.0) (2.2) (3.5) (5.8)
This concludes the remuneration report, which has been audited. This Directors’ report is signed in accordance with a resolution of the Board of Directors, pursuant to section 298(2)(a) of the Corporations Act 2001.
Associate Professor Rob Phillips Ms Sheena Jack Executive Director - Chairman Non-Executive Director Sydney, 25 August 2015

ANNUAL REPORT 2015 23
Auditors Independence Declaration
DECLARATION OF INDEPENDENCE BY TIM SYDENHAM TO THE DIRECTORS OF USCOM LIMITED AND
ITS CONTROLLED ENTITY
As lead auditor of Uscom Limited and its controlled entity for the year ended 30 June 2015, I declare that, to the best of my knowledge and belief, there have been:
1. No contraventions of the auditor independence requirements of the Corporations Act 2001 in
relation to the audit; and
2. No contraventions of any applicable code of professional conduct in relation to the audit.
This declaration is in respect of Uscom Limited and the entity it controlled during the period.
Tim Sydenham
Partner
BDO East Coast PartnershipBDO East Coast PartnershipBDO East Coast PartnershipBDO East Coast Partnership
Sydney, 25 August 2015
Tel: +61 2 9251 4100 Fax: +61 2 9240 9821 www.bdo.com.au
Level 11, 1 Margaret St Sydney NSW 2000 Australia
BDO East Coast Partnership ABN 83 236 985 726 is a member of a national association of independent entities which are all members of BDO (Australia) Ltd ABN 77 050 110 275, an Australian company limited by guarantee. BDO East Coast Partnership and BDO (Australia) Ltd are members of BDO International Ltd, a UK company limited by guarantee, and form part of the international BDO network of independent member firms. Liability limited by a scheme
approved under Professional Standards Legislation, other than for the acts or omissions of financial services licensees.

ANNUAL REPORT 2015 24
Statement of Profit or Loss & other
Comprehensive Income For the FY ended 30 June 2015
ConsolidatedConsolidatedConsolidatedConsolidated
Continuing operations 2012012012015555 2012012012014444
Restated Note $ $
Revenue and other income 3 2,039,426 1,377,716 Raw materials and consumables used (341,718) (235,308) Expenses from continuing activities 4 (2,913,362) (2,662,908)
Loss before income tax Loss before income tax Loss before income tax Loss before income tax from continuing operationsfrom continuing operationsfrom continuing operationsfrom continuing operations (1,215,654) (1,520,500)
Income tax 5 - -
Loss after income tax Loss after income tax Loss after income tax Loss after income tax from continuing operationsfrom continuing operationsfrom continuing operationsfrom continuing operations 6 (1,215,654) (1,520,500)
Other comprehOther comprehOther comprehOther compreheeeensive incomensive incomensive incomensive income
Items that may beItems that may beItems that may beItems that may be reclassified subsequently to profit or lossreclassified subsequently to profit or lossreclassified subsequently to profit or lossreclassified subsequently to profit or loss
Foreign currency translation difference for foreign operations 3,511 (893) Other comprehensive income for the year, net of tax
3,511 (893)
Total comprehensive Total comprehensive Total comprehensive Total comprehensive incomeincomeincomeincome for the for the for the for the yearyearyearyear (1,212,143) (1,521,393)
Attributable to:Attributable to:Attributable to:Attributable to:
Owners of the Company (1,212,143) (1,521,393)
Total comprehensive Total comprehensive Total comprehensive Total comprehensive income income income income for the for the for the for the yearyearyearyear (1,212,143) (1,521,393)
Earnings per share from continuing operations attributable to the Earnings per share from continuing operations attributable to the Earnings per share from continuing operations attributable to the Earnings per share from continuing operations attributable to the owners of the Companyowners of the Companyowners of the Companyowners of the Company
Earnings per share (EPS) Basic earnings per share (cents per share) 7 (1.5) (2.0) Diluted earnings per share (cents per share) 7 (1.5) (2.0)
This Statement of Profit or Loss and Other Comprehensive Income is to be read in conjunction with the attached notes.

ANNUAL REPORT 2015 25
Statement of Financial Position
For the FY ended 30 June 2015
ConsolidatedConsolidatedConsolidatedConsolidated
2012012012015555 2012012012014444
Note $ $
Current assetsCurrent assetsCurrent assetsCurrent assets Cash and cash equivalents 8 526,317 1,582,834 Trade and other receivables 9 300,753 325,514 Inventories 10 525,672 216,870 Tax asset 11 366,831 313,050 Other assets 14 104,820 70,384
Total current assets 1,824,393 2,508,652
NonNonNonNon----current assetscurrent assetscurrent assetscurrent assets Plant and equipment 12 46,150 38,039 Intangible assets 13 1,065,812 1,222,518
Total non-current assets 1,111,962 1,260,557
Total assetsTotal assetsTotal assetsTotal assets 2,936,355 3,769,209
Current liabilitiesCurrent liabilitiesCurrent liabilitiesCurrent liabilities Trade and other payables 15 418,524 255,770 Short term provisions 16 196,073 172,474
Total current liabilities 614,597 428,244
NonNonNonNon----current liabilitiescurrent liabilitiescurrent liabilitiescurrent liabilities Long term provisions 16 33,097 21,572
Total non-current liabilities 33,097 21,572
Total liabilities 647,694 449,816
Net assetsNet assetsNet assetsNet assets 2,288,661 3,319,393
EquityEquityEquityEquity Issued capital 17 26,019,429 26,006,168 Options and rights reserve 18 1,806,732 1,638,582 Accumulated losses 6 (25,618,591) (24,402,937) Translation reserve 19 81,091 77,580
Total equityTotal equityTotal equityTotal equity 2,288,661 3,319,393
This Statement of Financial Position is to be read in conjunction with the attached notes.
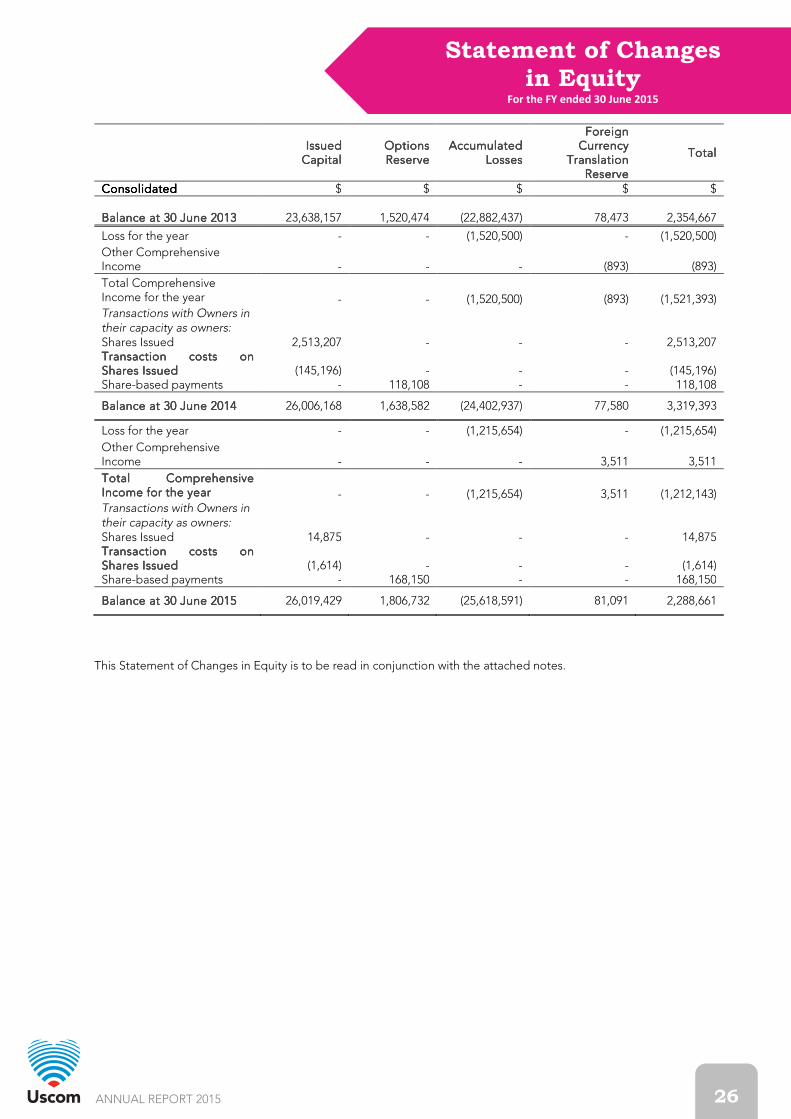
ANNUAL REPORT 2015 26
Statement of Changes in Equity
For the FY ended 30 June 2015
IssuedIssuedIssuedIssued
CapitalCapitalCapitalCapital OptionsOptionsOptionsOptions ReserveReserveReserveReserve
AccumulatedAccumulatedAccumulatedAccumulated LossesLossesLossesLosses
Foreign Foreign Foreign Foreign Currency Currency Currency Currency
TranslationTranslationTranslationTranslation ReserveReserveReserveReserve
TotalTotalTotalTotal
ConsolidatedConsolidatedConsolidatedConsolidated $ $ $ $ $ Balance at 30 June 20Balance at 30 June 20Balance at 30 June 20Balance at 30 June 2013131313 23,638,157 1,520,474 (22,882,437) 78,473 2,354,667
Loss for the year - - (1,520,500) - (1,520,500)
Other Comprehensive Income - - - (893) (893)
Total Comprehensive Income for the year - - (1,520,500) (893) (1,521,393) Transactions with Owners in their capacity as owners:
Shares Issued 2,513,207 - - - 2,513,207 Transaction costs on Transaction costs on Transaction costs on Transaction costs on Shares IssuedShares IssuedShares IssuedShares Issued (145,196) - - - (145,196) Share-based payments - 118,108 - - 118,108
Balance at 30 June 20Balance at 30 June 20Balance at 30 June 20Balance at 30 June 2014141414 26,006,168 1,638,582 (24,402,937) 77,580 3,319,393
Loss for the year - - (1,215,654) - (1,215,654)
Other Comprehensive Income - - - 3,511 3,511
Total Comprehensive Total Comprehensive Total Comprehensive Total Comprehensive Income for the yearIncome for the yearIncome for the yearIncome for the year - - (1,215,654) 3,511 (1,212,143) Transactions with Owners in their capacity as owners:
Shares Issued 14,875 - - - 14,875 Transaction costs on Transaction costs on Transaction costs on Transaction costs on Shares IssuedShares IssuedShares IssuedShares Issued (1,614) - - - (1,614) Share-based payments - 168,150 - - 168,150
Balance at 30 June 20Balance at 30 June 20Balance at 30 June 20Balance at 30 June 2011115555 26,019,429 1,806,732 (25,618,591) 81,091 2,288,661
This Statement of Changes in Equity is to be read in conjunction with the attached notes.
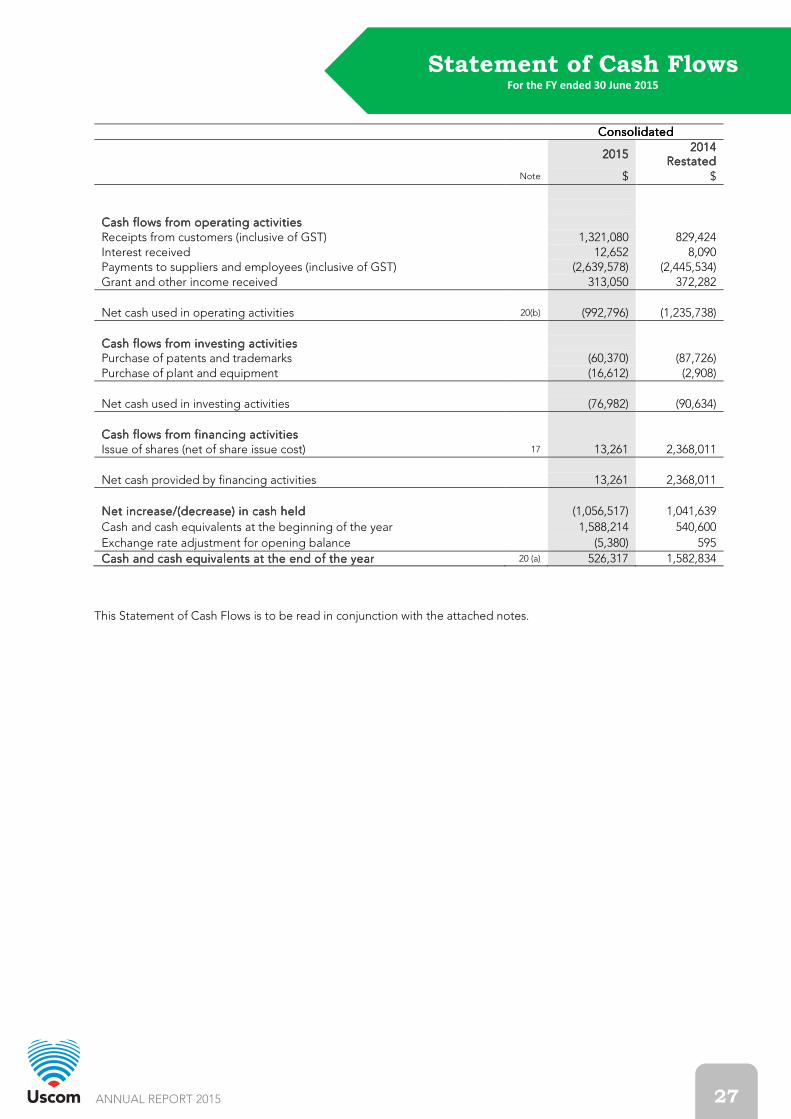
ANNUAL REPORT 2015 27
Statement of Cash Flows For the FY ended 30 June 2015
ConsolidatedConsolidatedConsolidatedConsolidated
2012012012015555 2014201420142014
RestatedRestatedRestatedRestated Note $ $
Cash flows from operating Cash flows from operating Cash flows from operating Cash flows from operating activitiesactivitiesactivitiesactivities Receipts from customers (inclusive of GST) 1,321,080 829,424 Interest received 12,652 8,090 Payments to suppliers and employees (inclusive of GST) (2,639,578) (2,445,534) Grant and other income received 313,050 372,282
Net cash used in operating activities 20(b) (992,796) (1,235,738)
Cash flows from investing activitiesCash flows from investing activitiesCash flows from investing activitiesCash flows from investing activities Purchase of patents and trademarks (60,370) (87,726) Purchase of plant and equipment (16,612) (2,908)
Net cash used in investing activities (76,982) (90,634)
Cash flows from financing activitiesCash flows from financing activitiesCash flows from financing activitiesCash flows from financing activities Issue of shares (net of share issue cost) 17 13,261 2,368,011
Net cash provided by financing activities 13,261 2,368,011
Net increase/(decrease) in cash heldNet increase/(decrease) in cash heldNet increase/(decrease) in cash heldNet increase/(decrease) in cash held (1,056,517) 1,041,639
Cash and cash equivalents at the beginning of the year 1,588,214 540,600
Exchange rate adjustment for opening balance (5,380) 595
Cash and cash equivalents at the end of the yearCash and cash equivalents at the end of the yearCash and cash equivalents at the end of the yearCash and cash equivalents at the end of the year 20 (a) 526,317 1,582,834 This Statement of Cash Flows is to be read in conjunction with the attached notes.

ANNUAL REPORT 2015 28
Notes to Financial Statements
Note 1: Adoption of new and revised accounting standards
New, revised or amending Accounting Standards and Interpretations adoptedNew, revised or amending Accounting Standards and Interpretations adoptedNew, revised or amending Accounting Standards and Interpretations adoptedNew, revised or amending Accounting Standards and Interpretations adopted The consolidated entity has adopted all of the new, revised or amending Accounting Standards and Interpretations issued by the Australian Accounting Standards Board ('AASB') that are mandatory for the current reporting period. Any new, revised or amending Accounting Standards or Interpretations that are not yet mandatory have not been early adopted. The adoption of these Accounting Standards and Interpretations did not have any significant impact on the financial performance or position of the consolidated entity. The following Accounting Standards and Interpretations are most relevant to the consolidated entity: AASB 2012AASB 2012AASB 2012AASB 2012----3 Amendments to Australian Accounting 3 Amendments to Australian Accounting 3 Amendments to Australian Accounting 3 Amendments to Australian Accounting Standards Standards Standards Standards ---- Offsetting Financial Assets and Financial Offsetting Financial Assets and Financial Offsetting Financial Assets and Financial Offsetting Financial Assets and Financial LiabilitiesLiabilitiesLiabilitiesLiabilities The consolidated entity has applied AASB 2012-3 from 1 July 2014. The amendments add application guidance to address inconsistencies in the application of the offsetting criteria in AASB 132 'Financial Instruments: Presentation', by clarifying the meaning of 'currently has a legally enforceable right of set-off'; and clarifies that some gross settlement systems may be considered to be equivalent to net settlement. AASB 2013AASB 2013AASB 2013AASB 2013----3 Amendments to A3 Amendments to A3 Amendments to A3 Amendments to AASB 136 ASB 136 ASB 136 ASB 136 ---- Recoverable Amount Disclosures for NonRecoverable Amount Disclosures for NonRecoverable Amount Disclosures for NonRecoverable Amount Disclosures for Non----Financial AssetsFinancial AssetsFinancial AssetsFinancial Assets The consolidated entity has applied AASB 2013-3 from 1 July 2014. The disclosure requirements of AASB 136 'Impairment of Assets' have been enhanced to require additional information about the fair value measurement when the recoverable amount of impaired assets is based on fair value less costs of disposals. Additionally, if measured using a present value technique, the discount rate is required to be disclosed. AASB 2014AASB 2014AASB 2014AASB 2014----1 Amendments to Aus1 Amendments to Aus1 Amendments to Aus1 Amendments to Australian Accounting Standards (Parts A to C)tralian Accounting Standards (Parts A to C)tralian Accounting Standards (Parts A to C)tralian Accounting Standards (Parts A to C) The consolidated entity has applied Parts A to C of AASB 2014-1 from 1 July 2014. These amendments affect the following standards: AASB 2 'Share-based Payment': clarifies the definition of 'vesting condition' by separately defining a 'performance condition' and a 'service condition' and amends the definition of 'market condition'; AASB 3 'Business Combinations': clarifies that contingent consideration in a business combination is subsequently measured at fair value with changes in fair value recognised in profit or loss irrespective of whether the contingent consideration is within the scope of AASB 9; AASB 8 'Operating Segments': amended to require disclosures of judgements made in applying the aggregation criteria and clarifies that a reconciliation of the total reportable segment assets to the entity's assets is required only if segment assets are reported regularly to the chief operating decision maker; AASB 13 'Fair Value Measurement': clarifies that the portfolio exemption applies to the valuation of contracts within the scope of AASB 9 and AASB 139; AASB 116 'Property, Plant and Equipment' and AASB 138 'Intangible Assets': clarifies that on revaluation, restatement of accumulated depreciation will not necessarily be in the same proportion to the change in the gross carrying value of the asset; AASB 124 'Related Party Disclosures': extends the definition of 'related party' to include a management entity that provides KMP services to the entity or its parent and requires disclosure of the fees paid to the management entity; AASB 140 'Investment Property': clarifies that the acquisition of an investment property may constitute a business combination.
Note 2: Statement of significant accounting policies
(a)(a)(a)(a) IntroductIntroductIntroductIntroductionionionion The financial report covers the Consolidated Entity of Uscom Ltd and its Controlled Entity. Uscom Ltd is a listed public company, incorporated and domiciled in Australia. Operations and principal activitiesOperations and principal activitiesOperations and principal activitiesOperations and principal activities Uscom Ltd is engaged in the development, design, manufacture and marketing of non-invasive cardiac monitoring devices. Uscom Ltd owns a portfolio of intellectual property relating to the technology and techniques associated with these devices and manages a worldwide network of distribution partners for the sale of its equipment to hospitals and other medical care locations. Scope of financial statementsScope of financial statementsScope of financial statementsScope of financial statements The financial report is a general purpose financial report that has been prepared in accordance with Australian Accounting Standards, Australian Accounting Interpretations, the Corporations Act 2001 and complies with other requirements of the law, as appropriate for-profit oriented entities.
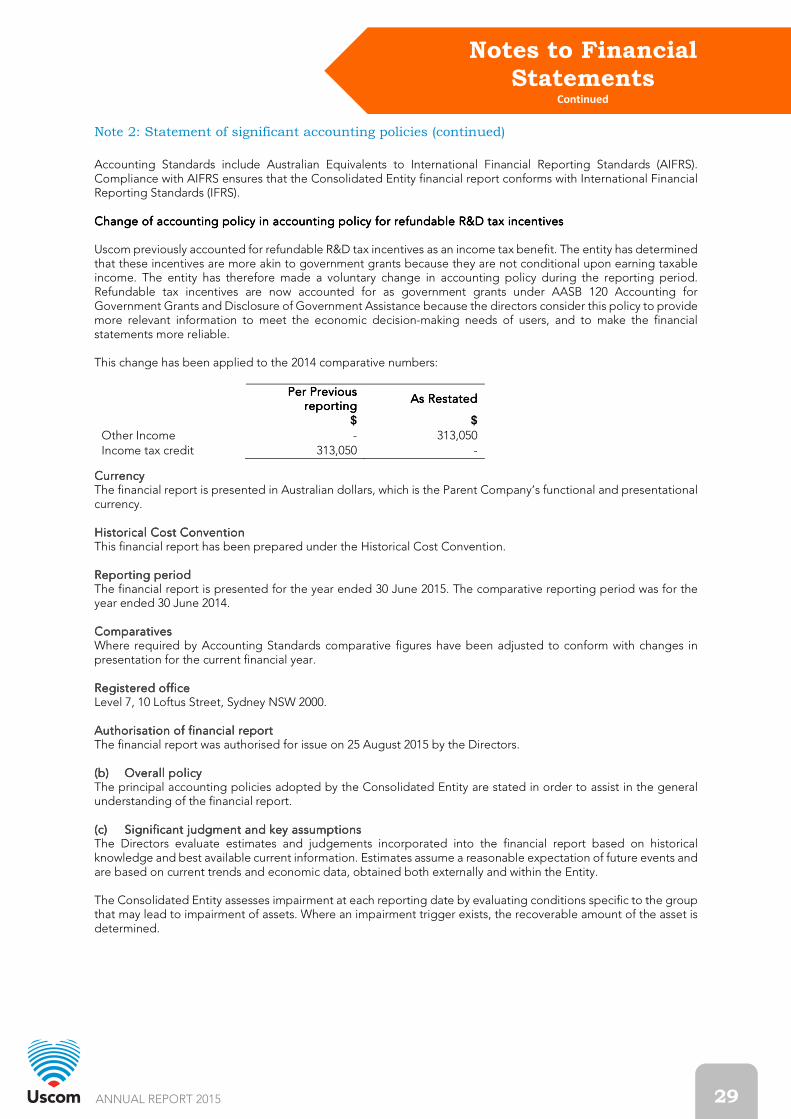
ANNUAL REPORT 2015 29
Notes to Financial Statements
Continued
Note 2: Statement of significant accounting policies (continued)
Accounting Standards include Australian Equivalents to International Financial Reporting Standards (AIFRS). Compliance with AIFRS ensures that the Consolidated Entity financial report conforms with International Financial Reporting Standards (IFRS). Change of accounting policy in accounting policy for refundable R&D tax incentivesChange of accounting policy in accounting policy for refundable R&D tax incentivesChange of accounting policy in accounting policy for refundable R&D tax incentivesChange of accounting policy in accounting policy for refundable R&D tax incentives Uscom previously accounted for refundable R&D tax incentives as an income tax benefit. The entity has determined that these incentives are more akin to government grants because they are not conditional upon earning taxable income. The entity has therefore made a voluntary change in accounting policy during the reporting period. Refundable tax incentives are now accounted for as government grants under AASB 120 Accounting for Government Grants and Disclosure of Government Assistance because the directors consider this policy to provide more relevant information to meet the economic decision-making needs of users, and to make the financial statements more reliable. This change has been applied to the 2014 comparative numbers:
CurrencyCurrencyCurrencyCurrency The financial report is presented in Australian dollars, which is the Parent Company’s functional and presentational currency. Historical Cost ConventionHistorical Cost ConventionHistorical Cost ConventionHistorical Cost Convention This financial report has been prepared under the Historical Cost Convention. Reporting Reporting Reporting Reporting periodperiodperiodperiod The financial report is presented for the year ended 30 June 2015. The comparative reporting period was for the year ended 30 June 2014. ComparativesComparativesComparativesComparatives Where required by Accounting Standards comparative figures have been adjusted to conform with changes in presentation for the current financial year. Registered officeRegistered officeRegistered officeRegistered office Level 7, 10 Loftus Street, Sydney NSW 2000. Authorisation of financial reportAuthorisation of financial reportAuthorisation of financial reportAuthorisation of financial report The financial report was authorised for issue on 25 August 2015 by the Directors. (b)(b)(b)(b) Overall policyOverall policyOverall policyOverall policy The principal accounting policies adopted by the Consolidated Entity are stated in order to assist in the general understanding of the financial report. (c)(c)(c)(c) Significant Significant Significant Significant jjjjudgment and udgment and udgment and udgment and kkkkey ey ey ey aaaassumptionsssumptionsssumptionsssumptions The Directors evaluate estimates and judgements incorporated into the financial report based on historical knowledge and best available current information. Estimates assume a reasonable expectation of future events and are based on current trends and economic data, obtained both externally and within the Entity. The Consolidated Entity assesses impairment at each reporting date by evaluating conditions specific to the group that may lead to impairment of assets. Where an impairment trigger exists, the recoverable amount of the asset is determined.
Per PreviousPer PreviousPer PreviousPer Previous
reportingreportingreportingreporting As RestatedAs RestatedAs RestatedAs Restated
$ $
Other Income - 313,050 Income tax credit 313,050 -
ANNUAL REPORT 2015 30
Notes to Financial Statements
Continued
Note 2: Statement of significant accounting policies (continued)
The consolidated entity assesses impairment of non-financial assets other than goodwill and other indefinite life intangible assets at each reporting date by evaluating conditions specific to the consolidated entity and to the particular asset that may lead to impairment. If an impairment trigger exists, the recoverable amount of the asset is determined. This involves fair value less costs of disposal or value-in-use calculations, which incorporate a number of key estimates and assumptions. (d)(d)(d)(d) Financial assets and Financial assets and Financial assets and Financial assets and ffffinancial liabilitiesinancial liabilitiesinancial liabilitiesinancial liabilities Financial assets and financial liabilities are recognised on the Statement of Financial Position when the Consolidated Entity becomes party to the contractual provisions of the financial instrument. A financial asset is derecognised when the contractual rights to the cash flows from the financial assets expire or are transferred and no longer controlled by the Entity. A financial liability is removed from the statement of financial position when the obligation specified in the contract is discharged or cancelled or expires. Upon initial recognition a financial asset or financial liability is designated as at fair value through profit or loss except for investments in equity instruments that do not have a quoted market price in an active market and whose fair value cannot be reliably measured. A gain or loss arising from a change in the fair value of a financial asset or financial liability classified as at fair value through profit or loss is recognised in the statement of profit and loss and other comprehensive income. Financial assets not measured at fair value comprise receivables and investment in subsidiary. These are non-derivative financial assets with fixed or determinable payments that are not quoted in an active market and are measured at amortised cost using the effective interest method. Available-for-sale financial assets include other financial assets, comprising investments in subsidiaries, not included in the above categories. Available-for-sale financial assets are reflected at fair value. Unrealised gains and losses arising from changes in fair value are taken directly to equity. Financial liabilities comprise of trade and other payables, and borrowings and are measured at amortised cost using the effective interest method. Trade accounts payable represent the principal amounts outstanding at reporting date plus, where applicable, any accrued interest. The amortised cost of a financial asset or a financial liability is the amount initially recognised minus principal repayments, plus or minus cumulative amortisation of any difference between the initial amount and maturity amount and minus any write-down for impairment or uncollectibility. Financial assets, other than those at fair value through profit or loss, are reassessed for indicators of impairment at each reporting date. Financial assets are impaired where there is objective evidence that as a result of one or more events that occurred after the initial recognition of the financial asset the estimated future cash flows of the investment have been impacted. For financial assets carried at amortised cost, the amount of the impairment is the difference between the asset’s carrying amount and the present value of estimated future cash flows, discounted at the original effective interest rate. The carrying amount of the financial asset is reduced by the impairment loss directly for all financial assets with the exception of trade receivables where the carrying amount is reduced through the use of an allowance account. When a trade receivable is uncollectible, it is written off against the allowance account. Subsequent recoveries of amounts previously written off are credited against the allowance account. Changes in the carrying amount of the allowance account are recognised in profit and loss. With the exception of available-for-sale equity instruments, if, in a subsequent period, the amount of the impairment loss decreases and the decrease can be related objectively to an event occurring after the impairment was recognised, the previously recognised impairment loss is revered through profit and loss to the extent the carrying amount of the investment at the date the impairment is reversed does not exceed what the amortised cost would have been had the impairment not been recognised. (e)(e)(e)(e) Principles of Principles of Principles of Principles of cccconsolidationonsolidationonsolidationonsolidation A Controlled Entity is any entity Uscom Ltd has the power to control the financial and operating policies of so as to obtain benefits from its activities.

ANNUAL REPORT 2015 31
Notes to Financial Statements
Continued
Note 2: Statement of significant accounting policies (continued)
A list of Controlled Entities is contained in note 22 to the financial statements. All Controlled Entities have a June financial year-end. All inter-company balances and transactions between Entities in the Consolidated Group, including any unrealised profits or losses, have been eliminated on consolidation. Accounting policies of Subsidiaries have been changed where necessary to ensure consistencies with those polices applied by the Parent Entity. On consolidation, the assets and liabilities of the Consolidated Entity’s overseas operations are translated at exchange rates prevailing at the reporting dates. Income and expense items are translated at the average exchange rates for the period unless exchange rates fluctuate significantly. Exchange differences arising, if any, are recognised in the foreign currency translation reserve, and are recognised in statement of profit or loss and other comprehensive income on disposal of the foreign operation. (f)(f)(f)(f) Foreign Foreign Foreign Foreign ccccurrency urrency urrency urrency ttttransactions and ransactions and ransactions and ransactions and bbbbalancesalancesalancesalances All foreign currency transactions during the financial year are brought to account using the exchange rate in effect at the date of the transaction. Foreign currency monetary items at reporting date are translated at the exchange rate existing at reporting date. Non-monetary assets and liabilities carried at fair value that are denominated in foreign currencies are translated at the rates prevailing at the date when the fair value was determined. Non-monetary items that are measured in terms of historical cost in a foreign currency are not retranslated. The gains and losses from conversion of assets and liabilities, whether realised or unrealised, are included in profit or loss from continuous operations as they arise. (g)(g)(g)(g) Revenue Revenue Revenue Revenue rrrrecognitionecognitionecognitionecognition • Sale of goods
Revenue from the sale of goods is recognised when all significant risks and rewards of ownership have been transferred to the buyer and when the other contractual obligations of the Entity are performed.
• Revenue from rendering of services Rendering of services consists of training, repair and product maintenance supplied to customers. Revenue is recognised when contractual obligations are expired and services are provided.
• Interest revenue Interest revenue is recognised on a proportional basis taking into account the interest rates applicable to the financial assets.
• Government grants Government grants revenue is recognised at fair value when there is reasonable assurance that the grant will be received and the grant conditions will be met.
(h)(h)(h)(h) InventoriesInventoriesInventoriesInventories Inventories are measured at the lower of cost or net realisable value. Costs are assigned on the basis of weighted average costs. Cost comprises all costs of purchase and conversion and an appropriate proportion of fixed and variable overheads, net of settlement discounts. Overheads are applied on the basis of normal operative capacity. The costs are recognised when materials are delivered to the Consolidated Entity. (i)(i)(i)(i) Property, Property, Property, Property, pppplant and equipmentlant and equipmentlant and equipmentlant and equipment Property, plant and equipment are included at cost. Assets in plant and equipment are depreciated on diminishing value basis over their estimated useful lives covering a period of two to seven years. On disposal of an item of property, plant and equipment, the difference between the sales proceeds and the carrying amount of the asset is recognised as a gain or loss in the statement of profit or loss and other comprehensive income. The depreciation rates used for each class of depreciable assets are:
Class Of Fixed Asset Depreciation Rate - Plant & Equipment 10% - 40% - Office Furniture & Equipment 15% - Computer Software 40% - Low Value Pool 37.5%

ANNUAL REPORT 2015 32
Notes to Financial Statements
Continued
Note 2: Statement of significant accounting policies (continued)
(j)(j)(j)(j) IntangiblesIntangiblesIntangiblesIntangibles Patents and Trademarks are valued in the financial statements at cost of acquisition less accumulated amortisation and are amortised on diminishing value basis at 12.5% per annum. (k)(k)(k)(k) Impairment of Impairment of Impairment of Impairment of aaaassetsssetsssetsssets At each reporting date, the Consolidated Entity reviews the carrying values of its tangible and intangible assets to determine whether there is any indication that those assets have been impaired. If such an indication exists, the recoverable amount of the asset, being the higher of the asset’s fair value less costs to sell and value in use, is compared to the asset’s carrying value. Any excess of the asset’s carrying value over its recoverable amount is expensed to the statement of profit or loss and other comprehensive income. In assessing value in use, the estimated future cash flows discounted to their present value using a pre-tax discount rate.
(l)(l)(l)(l) LeasesLeasesLeasesLeases Lease of assets where substantially all the risks and benefits incidental to the ownership of the asset, but not the legal ownership, are transferred to the Consolidated Entity were classified as finance leases. Finance leases are capitalised, recording an asset and a liability equal to the present value of the minimum lease payments, including any guaranteed residual values. Leased assets are amortised on diminishing value basis over their estimated useful lives where it is likely that the Consolidated Entity will obtain ownership of the asset or over the term of the lease. Lease payments are allocated between the reduction of the lease liability and the lease interest expense for the period. Lease payments for operating leases, where substantially all the risks and benefits remain with the lessor, are recognised as an expense on a straight line basis over the lease term unless another systematic basis is more representative of the time pattern in which benefits are diminished. Lease incentives under operating leases are recognised as liabilities. The incentives are recognised as a reduction of expenses on a straight line basis unless another systematic basis is more representative of the time pattern in which benefits are diminished.
(m)(m)(m)(m) Cash and cash equivalentsCash and cash equivalentsCash and cash equivalentsCash and cash equivalents Cash and cash equivalents comprise cash on hand and at call deposits with banks or financial institutions.
(n)(n)(n)(n) InvInvInvInvestmentsestmentsestmentsestments Investments in Controlled Entities are carried at the lower of cost and recoverable amount.
(o)(o)(o)(o) Research & Research & Research & Research & ddddevelopment evelopment evelopment evelopment eeeexpenditurexpenditurexpenditurexpenditure Research & development costs are charged to the statement of profit or loss and other comprehensive income as incurred, or deferred where it is probable that sufficient future benefits will be derived so as to recover those deferred costs.
(p)(p)(p)(p) Income Income Income Income ttttaxaxaxax Income taxes are accounted for using the Balance Sheet liability method whereby: • The tax consequences of recovering (settling) all assets (liabilities) are reflected in the financial statements; • Current and deferred tax is recognised as income or expenses except to the extent that the tax relates to equity
items or to a business combination; • A deferred tax asset is recognised to the extent that it is probable that future taxable profit will be available to
realise the asset; • Deferred tax assets and liabilities are measured at the tax rates that are expected to apply to the period when
the asset is realised or the liability settled.
The charge for current income tax expense/credit is based on the profit or loss for the year adjusted for any non- assessable or disallowed items. It is credited using tax rates that have been enacted or are substantively enacted by the reporting date. Deferred tax is accounted for using the Balance Sheet liability method in respect of temporary differences arising between the tax bases of assets and liabilities and their carrying amounts in the financial statements. Deferred tax is calculated at the tax rates that are expected to apply to the period when the asset is realised or liability is settled. Deferred tax is credited in the income statement except where it relates to items that may be credited directly to equity, in which case the deferred tax is adjusted directly against equity.

ANNUAL REPORT 2015 33
Notes to Financial Statements
Continued
Note 2: Statement of significant accounting policies (continued)
Deferred income tax assets are recognised to the extent that it is probable that future tax profits will be available against which deductible temporary differences can be utilised. The amount of benefits brought to account or which may be realised in the future is based on the assumption that no adverse change will occur in income taxation legislation and the anticipation that the Consolidated Entity will derive sufficient future assessable income to enable the benefit to be realised and comply with the conditions of deductibility imposed by the law. Where the Consolidated Entity is entitled to a research and development tax offset, this is treated as other income in the period to which the entitlement relates. (q)(q)(q)(q) Short term employee benefitsShort term employee benefitsShort term employee benefitsShort term employee benefits Short term employee benefits are employee benefits (other than termination benefits and equity compensation benefits) which fall due wholly within 12 months after the end of the period in which employee services are rendered. They comprise wages, salaries, social security obligations, short-term compensation absences, profit sharing and bonuses payables within 12 months and non-mandatory benefits such as medical care, housing, car and service goods. The provision for employee entitlements to wages, salaries and annual leave represents the amount that the Consolidated Entity has a present obligation to pay resulting from employee services provided up to reporting date. The provision has been calculated after taking into consideration estimated future increases in wages and salaries and past experience regarding staff departures and includes related on-costs. The undiscounted amount of short-term benefits expected to be paid is recognised as an expense. (r)(r)(r)(r) Long Long Long Long tttterm erm erm erm eeeemployee mployee mployee mployee bbbbenefitsenefitsenefitsenefits Long term employee benefits include long-service leave, long-term disability benefits, deferred compensation and profit sharing and bonuses payable 12 months or more after the end of the period in which employee services are rendered. Uscom Ltd has adopted an Employee Share Option Plan for the benefit of Executive Directors and full-time or part-time staff members employed by the Consolidated Entity. Refer note 18 to the financial statements for details. An Executive Share Option Plan has also been developed to provide approved participants further incentive in their performance for the Consolidated Entity and an opportunity to acquire an ownership interest in the Consolidated Entity. (s)(s)(s)(s) ShareShareShareShare----based payment arrangementbased payment arrangementbased payment arrangementbased payment arrangement Goods or services received or acquired in a share-based payment transaction are recognised as an increase in equity if the goods or services were received in an equity-settled share based payment transaction or as a liability if the goods and services were acquired in a cash settled share based payment transaction. For equity-settled share based transactions, goods or services received are measured directly at the fair value of the goods or services received provided this can be estimated reliably. If a reliable estimate cannot be made the value of the goods or services is determined indirectly by reference to the fair value of the equity instrument granted. Transactions with employees and others providing similar services are measured by reference to the fair value at grant date of the equity instrument granted. (t)(t)(t)(t) Goods and Goods and Goods and Goods and sssservices ervices ervices ervices ttttax (GST)ax (GST)ax (GST)ax (GST) Revenues, expenses and assets are recognised net of the amount of GST, except where the amount of GST incurred is not recoverable from the Australian Tax Office. In these circumstances the GST is recognised as part of the cost of acquisition of the asset or as part of an item of the expense. Receivables and payables in the Statement of Financial Position are shown inclusive of GST. (u)(u)(u)(u) ReceivablesReceivablesReceivablesReceivables Trade receivables and other receivables represent the principal amounts due at reporting date plus accrued interest and less, where applicable, any unearned income and provision for doubtful accounts. An estimated doubtful debt is made when collection of the full amount is no longer probable.
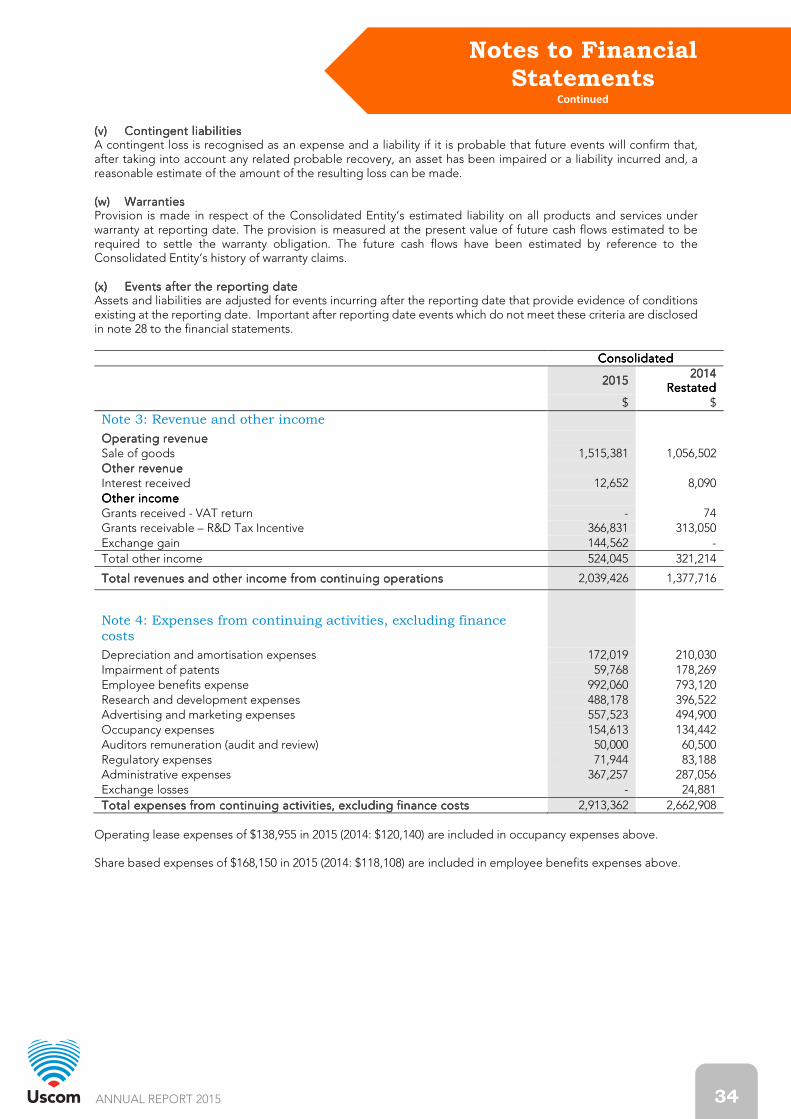
ANNUAL REPORT 2015 34
Notes to Financial Statements
Continued
(v)(v)(v)(v) Contingent Contingent Contingent Contingent lllliabilitiesiabilitiesiabilitiesiabilities A contingent loss is recognised as an expense and a liability if it is probable that future events will confirm that, after taking into account any related probable recovery, an asset has been impaired or a liability incurred and, a reasonable estimate of the amount of the resulting loss can be made. (w)(w)(w)(w) WarrantiesWarrantiesWarrantiesWarranties Provision is made in respect of the Consolidated Entity’s estimated liability on all products and services under warranty at reporting date. The provision is measured at the present value of future cash flows estimated to be required to settle the warranty obligation. The future cash flows have been estimated by reference to the Consolidated Entity’s history of warranty claims. (x)(x)(x)(x) Events after the Events after the Events after the Events after the reportingreportingreportingreporting ddddateateateate Assets and liabilities are adjusted for events incurring after the reporting date that provide evidence of conditions existing at the reporting date. Important after reporting date events which do not meet these criteria are disclosed in note 28 to the financial statements.
ConsolidatedConsolidatedConsolidatedConsolidated
2015201520152015 2014201420142014
RestatedRestatedRestatedRestated $ $
Note 3: Revenue and other income
Operating revenueOperating revenueOperating revenueOperating revenue Sale of goods 1,515,381 1,056,502 Other revenueOther revenueOther revenueOther revenue Interest received 12,652 8,090 Other incomeOther incomeOther incomeOther income Grants received - VAT return - 74 Grants receivable – R&D Tax Incentive 366,831 313,050 Exchange gain 144,562 -
Total other income 524,045 321,214
Total revenues Total revenues Total revenues Total revenues and other income and other income and other income and other income from continuing from continuing from continuing from continuing operationsoperationsoperationsoperations 2,039,426 1,377,716
Note 4: Expenses from continuing activities, excluding finance costs
Depreciation and amortisation expenses 172,019 210,030 Impairment of patents 59,768 178,269 Employee benefits expense 992,060 793,120 Research and development expenses 488,178 396,522 Advertising and marketing expenses 557,523 494,900 Occupancy expenses 154,613 134,442 Auditors remuneration (audit and review) 50,000 60,500 Regulatory expenses 71,944 83,188 Administrative expenses 367,257 287,056 Exchange losses - 24,881
Total expenses from Total expenses from Total expenses from Total expenses from continuingcontinuingcontinuingcontinuing activities, excluding finance costsactivities, excluding finance costsactivities, excluding finance costsactivities, excluding finance costs 2,913,362 2,662,908 Operating lease expenses of $138,955 in 2015 (2014: $120,140) are included in occupancy expenses above. Share based expenses of $168,150 in 2015 (2014: $118,108) are included in employee benefits expenses above.
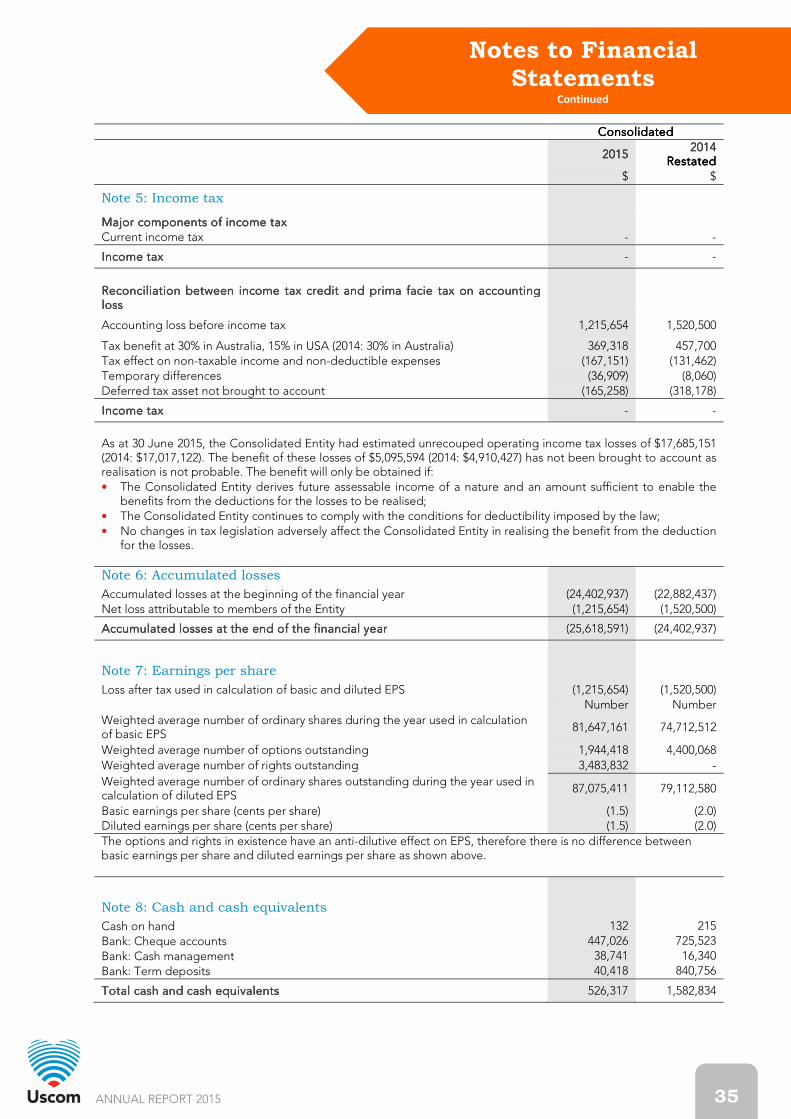
ANNUAL REPORT 2015 35
Notes to Financial Statements
Continued
ConsolidatedConsolidatedConsolidatedConsolidated
2015201520152015 2014201420142014
RestatedRestatedRestatedRestated $ $
Note 5: Income tax
Major components of income taxMajor components of income taxMajor components of income taxMajor components of income tax Current income tax - -
Income taxIncome taxIncome taxIncome tax - -
Reconciliation between income tax credit and prima facie tax on accounting Reconciliation between income tax credit and prima facie tax on accounting Reconciliation between income tax credit and prima facie tax on accounting Reconciliation between income tax credit and prima facie tax on accounting loss loss loss loss
Accounting loss before income tax 1,215,654 1,520,500
Tax benefit at 30% in Australia, 15% in USA (2014: 30% in Australia) 369,318 457,700 Tax effect on non-taxable income and non-deductible expenses (167,151) (131,462) Temporary differences (36,909) (8,060) Deferred tax asset not brought to account (165,258) (318,178)
Income taxIncome taxIncome taxIncome tax - -
As at 30 June 2015, the Consolidated Entity had estimated unrecouped operating income tax losses of $17,685,151 (2014: $17,017,122). The benefit of these losses of $5,095,594 (2014: $4,910,427) has not been brought to account as realisation is not probable. The benefit will only be obtained if: • The Consolidated Entity derives future assessable income of a nature and an amount sufficient to enable the
benefits from the deductions for the losses to be realised; • The Consolidated Entity continues to comply with the conditions for deductibility imposed by the law; • No changes in tax legislation adversely affect the Consolidated Entity in realising the benefit from the deduction
for the losses.
Note 6: Accumulated losses
Accumulated losses at the beginning of the financial year (24,402,937) (22,882,437) Net loss attributable to members of the Entity (1,215,654) (1,520,500)
Accumulated losses at the end of the financial yearAccumulated losses at the end of the financial yearAccumulated losses at the end of the financial yearAccumulated losses at the end of the financial year (25,618,591) (24,402,937)
Note 7: Earnings per share
Loss after tax used in calculation of basic and diluted EPS (1,215,654) (1,520,500) Number Number
Weighted average number of ordinary shares during the year used in calculation of basic EPS
81,647,161 74,712,512
Weighted average number of options outstanding 1,944,418 4,400,068 Weighted average number of rights outstanding 3,483,832 -
Weighted average number of ordinary shares outstanding during the year used in calculation of diluted EPS
87,075,411 79,112,580
Basic earnings per share (cents per share) (1.5) (2.0) Diluted earnings per share (cents per share) (1.5) (2.0) The options and rights in existence have an anti-dilutive effect on EPS, therefore there is no difference between basic earnings per share and diluted earnings per share as shown above.
Note 8: Cash and cash equivalents
Cash on hand 132 215 Bank: Cheque accounts 447,026 725,523 Bank: Cash management 38,741 16,340
Bank: Term deposits 40,418 840,756
Total cash and cash equivalentsTotal cash and cash equivalentsTotal cash and cash equivalentsTotal cash and cash equivalents 526,317 1,582,834

ANNUAL REPORT 2015 36
Notes to Financial Statements
Continued
ConsolidatedConsolidatedConsolidatedConsolidated
2015201520152015 2014201420142014
$ $
Note 9: Trade and other receivables
CurrentCurrentCurrentCurrent Trade receivables 300,753 325,514
Total current receivablesTotal current receivablesTotal current receivablesTotal current receivables 300,753 325,514
Trade receivables are non-interest bearing and on an average of 45 day terms. Details of trade receivables past due but not impaired are disclosed in note 21.
Note 10: Inventories
Current inventories at costCurrent inventories at costCurrent inventories at costCurrent inventories at cost Raw materials 162,172 139,933 Work in Progress 105,340 39,912 Finished products 258,160 37,025
Total inventoriesTotal inventoriesTotal inventoriesTotal inventories 525,672 216,870
Note 11: Tax asset
R & D tax incentive 366,831 313,050
Total Total Total Total tax assettax assettax assettax asset 366,831 313,050
Note 12: Plant and equipment
Plant and equipment at cost 581,315 564,251 Accumulated depreciation (542,194) (529,431)
39,121 34,820 Office furniture and equipment at cost 59,166 59,166 Accumulated depreciation (57,422) (57,114)
1,744 2,052 Computer software at cost 26,130 22,120 Accumulated depreciation (22,881) (21,939)
3,249 181
Low value asset pool at cost 34,619 32,871 Accumulated depreciation (32,583) (31,885)
2,036 986
Total Total Total Total plant and equipmentplant and equipmentplant and equipmentplant and equipment 46,150 38,039
Movements in carrying amountsMovements in carrying amountsMovements in carrying amountsMovements in carrying amounts Plant and
equipment
Office furniture and
equipment
Computer software
Low value asset pool
Useful life 2-7 years 2-7 years 3 years 3 years $ $ $ $
Consolidated EntityConsolidated EntityConsolidated EntityConsolidated Entity Carrying amount at 1 July 2014 34,820 2,052 181 986 Additions 17,064 - 4,010 1,748 Disposals - - - - Depreciation expense (12,763) (308) (942) (698)
Carrying amount at 30 June 20Carrying amount at 30 June 20Carrying amount at 30 June 20Carrying amount at 30 June 2015151515 39,121 1,744 3,249 2,036

ANNUAL REPORT 2015 37
Notes to Financial Statements
Continued
ConsolidatedConsolidatedConsolidatedConsolidated
2015201520152015 2014201420142014
$ $
Note 13: Intangible assets
NonNonNonNon----currentcurrentcurrentcurrent Patents at cost 2,037,460 1,977,090 Accumulated amortisation and impairment (971,648) (754,572)
Carrying amount at 30 JuneCarrying amount at 30 JuneCarrying amount at 30 JuneCarrying amount at 30 June 1,065,812 1,222,518
Movements in carrying amountsMovements in carrying amountsMovements in carrying amountsMovements in carrying amounts
Carrying amount at 1 July 1,222,518 1,506,634 Additions (i) 60,370 87,726 Impairment (59,768) (178,269) Amortisation (157,308) (193,573)
Carrying amount at 30 June Carrying amount at 30 June Carrying amount at 30 June Carrying amount at 30 June 1,065,812 1,222,518
Intangible Assets comprise Intellectual Property in the form of Patents. The Patents have finite useful lives. The current amortisation charge in respect of Patents is included under Expenses from Continuing Activities in the Statement of Profit or Loss and Other Comprehensive Income. An impairment charge of $59,768 has been recognised in the current year in relation to certain Patents cancelled in the USA and Europe. In 2014, an impairment charge of $178,269 was recognised in relation to Patents carried in Australia where there wasn’t sufficient sales generated to support the full carrying value. The impairment charge is recorded under Expenses from Continuing Activities (refer to note 4).
Note 14: Other assets
CurrentCurrentCurrentCurrent GST receivable 26,240 29,136 Deposit paid - 26,327 Prepayments 78,580 14,921
Total other current assetsTotal other current assetsTotal other current assetsTotal other current assets 104,820 70,384
Note 15: Trade and other payables
CurrentCurrentCurrentCurrent Trade payables 179,815 61,508 Sundry payables and accrued expenses 198,888 165,404 Employee related payables 39,821 28,858
Total payablesTotal payablesTotal payablesTotal payables 418,524 255,770
Note 16: Provisions
CurrentCurrentCurrentCurrent Provision for annual leave 129,837 85,390 Provision for long service leave 66,236 87,084
196,073 172,474 NonNonNonNon----currentcurrentcurrentcurrent Provision for long service leave 19,797 12,672 Provision for warranties 13,300 8,900
33,097 21,572
(a) Aggregate employee benefits(a) Aggregate employee benefits(a) Aggregate employee benefits(a) Aggregate employee benefits 215,870 185,146
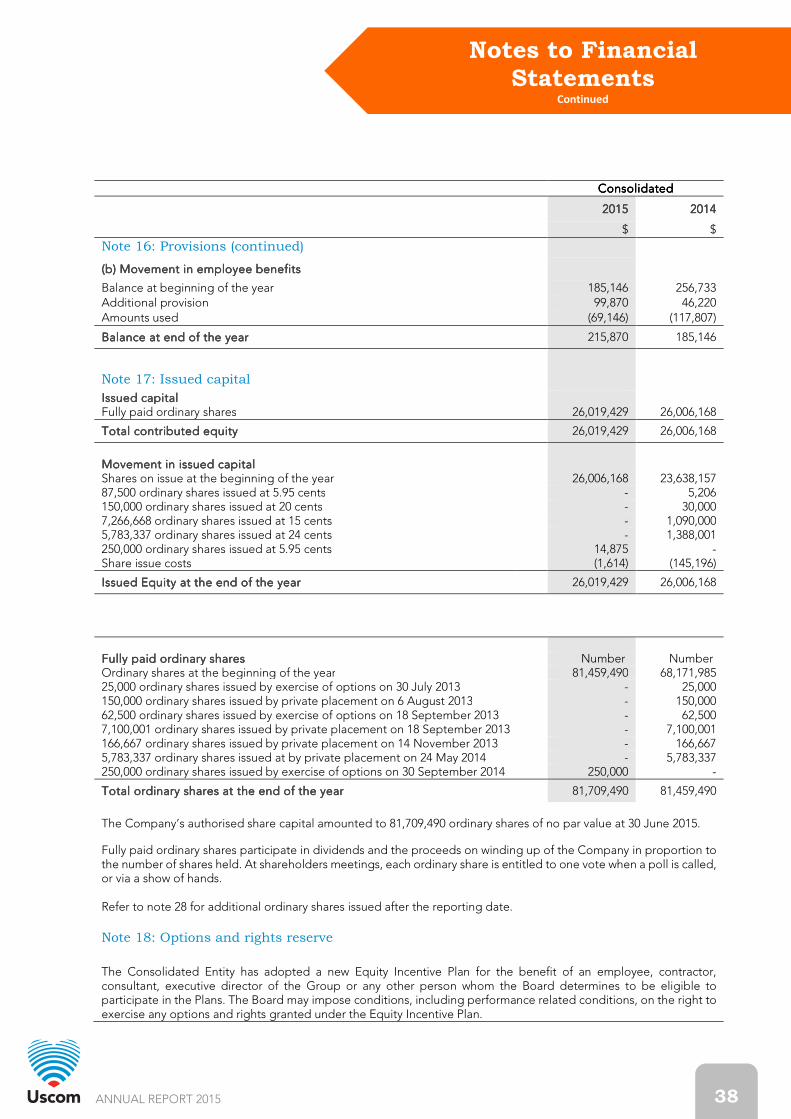
ANNUAL REPORT 2015 38
Notes to Financial Statements
Continued
ConsolidatedConsolidatedConsolidatedConsolidated
2015201520152015 2014201420142014
$ $
Note 16: Provisions (continued)
(b) Movement in employee benefits(b) Movement in employee benefits(b) Movement in employee benefits(b) Movement in employee benefits
Balance at beginning of the year 185,146 256,733 Additional provision 99,870 46,220 Amounts used (69,146) (117,807)
Balance at end of the yearBalance at end of the yearBalance at end of the yearBalance at end of the year 215,870 185,146
Note 17: Issued capital
Issued capitalIssued capitalIssued capitalIssued capital Fully paid ordinary shares 26,019,429 26,006,168
Total contributedTotal contributedTotal contributedTotal contributed equityequityequityequity 26,019,429 26,006,168
Movement in issued capitalMovement in issued capitalMovement in issued capitalMovement in issued capital Shares on issue at the beginning of the year 26,006,168 23,638,157 87,500 ordinary shares issued at 5.95 cents - 5,206 150,000 ordinary shares issued at 20 cents - 30,000 7,266,668 ordinary shares issued at 15 cents - 1,090,000 5,783,337 ordinary shares issued at 24 cents - 1,388,001 250,000 ordinary shares issued at 5.95 cents 14,875 - Share issue costs (1,614) (145,196)
Issued EquityIssued EquityIssued EquityIssued Equity at the end of the yearat the end of the yearat the end of the yearat the end of the year 26,019,429 26,006,168
Fully paid ordinary sFully paid ordinary sFully paid ordinary sFully paid ordinary shareshareshareshares Number Number Ordinary shares at the beginning of the year 81,459,490 68,171,985 25,000 ordinary shares issued by exercise of options on 30 July 2013 - 25,000 150,000 ordinary shares issued by private placement on 6 August 2013 - 150,000 62,500 ordinary shares issued by exercise of options on 18 September 2013 - 62,500 7,100,001 ordinary shares issued by private placement on 18 September 2013 - 7,100,001 166,667 ordinary shares issued by private placement on 14 November 2013 - 166,667 5,783,337 ordinary shares issued at by private placement on 24 May 2014 - 5,783,337 250,000 ordinary shares issued by exercise of options on 30 September 2014 250,000 -
Total Total Total Total ordinary shares at the end of the yearordinary shares at the end of the yearordinary shares at the end of the yearordinary shares at the end of the year 81,709,490 81,459,490
The Company’s authorised share capital amounted to 81,709,490 ordinary shares of no par value at 30 June 2015.
Fully paid ordinary shares participate in dividends and the proceeds on winding up of the Company in proportion to the number of shares held. At shareholders meetings, each ordinary share is entitled to one vote when a poll is called, or via a show of hands. Refer to note 28 for additional ordinary shares issued after the reporting date.
Note 18: Options and rights reserve
The Consolidated Entity has adopted a new Equity Incentive Plan for the benefit of an employee, contractor, consultant, executive director of the Group or any other person whom the Board determines to be eligible to participate in the Plans. The Board may impose conditions, including performance related conditions, on the right to exercise any options and rights granted under the Equity Incentive Plan.

ANNUAL REPORT 2015 39
Notes to Financial Statements
Continued
Note 18: Options and rights reserve (continued)
The purpose of the Plan is to:
• provide Eligible Persons with an incentive plan which recognises ongoing contribution to the achievement by the Company of its strategic goals thereby encouraging the mutual interdependence of Participants and the Company;
• align the interests of Participants with shareholders of the Company through the sharing of a personal interest in the future growth and development of the Company as represented in the price of the Company’s ordinary fully paid shares;
• encourage Eligible Persons to improve the performance of the Company and its total return to Shareholders; and
• provide a means of attracting and retaining skilled and experienced employees. Under the Plan, the Consolidated Entity will be able to grant short-term incentive and long-term incentive awards to Eligible Employees (including Executive Directors). The Plan will provide the Board with the flexibility to grant equity incentives to Eligible Persons in the form of Plan Shares, rights or Options, will only vest on the satisfaction of appropriate hurdles. ConsolidatedConsolidatedConsolidatedConsolidated
2015201520152015 2014201420142014
$ $
Effect of shareEffect of shareEffect of shareEffect of share----based payment transactionsbased payment transactionsbased payment transactionsbased payment transactions Share Share Share Share Option POption POption POption Planlanlanlan Options and rights reserve balance at the beginning of the year 1,638,582 1,520,474 Expenses arising from share-based payment transactions 168,150 118,108
Options and rights reserve balance for Share Option Plan at the end of the year 1,806,732 1,638,582
Movement in options during the financial yearMovement in options during the financial yearMovement in options during the financial yearMovement in options during the financial year
Movement during the financial yearMovement during the financial yearMovement during the financial yearMovement during the financial year Number of
Options 2015
Weighted average
exercise price
Number of Options 2014
Weighted average
exercise price
Opening number of options 2,100,000 0.06 6,287,500 0.16
Granted during the financial year – Consultant 75,000 0.17 - -
Lapsed during the financial year (12,500) 0.06 (2,050,000) 0.37
Cancelled during the financial year - (2,050,000) 0.06
Exercised during the financial year (250,000) 0.06 (87,500) 0.06
Closing number of optionsClosing number of optionsClosing number of optionsClosing number of options 1,912,500 0.06 2,100,000 0.06
Details of options outstanding as at end of the yearDetails of options outstanding as at end of the yearDetails of options outstanding as at end of the yearDetails of options outstanding as at end of the year
Holders No. Grant date Exercisable at 30 June
2015 Expiry date
30 June 2015 Outstanding
Option
Exercise Price
Issued date fair
value % No. $ $
8 (Employees & Executives)
29 March 2012 100% 29 March 2016 837,500 0.0595 0.06
1 (Director) 7 November 2012 75% 7 November 2016 1,000,000 0.0595 0.06 1 (Consultant) 1 December 2014 33% 1 July 2018 75,000 0.1700 0.20
TotalTotalTotalTotal 1,912,500

ANNUAL REPORT 2015 40
Notes to Financial Statements
Continued
Note 18: Options and rights reserve (continued)
The options issued prior to this financial year were issued under the existing employee option plan, have an exercise price based on 85% of the average ASX closing price for the 5 days prior to offer/acceptance of the options. Each option is issued for a period of 4 years, which vest 25% in tranches throughout the period. The options issued in on 1 December were issued under the Equity Incentive plan. The options vest one third each on the issue day, 1 July 2015 and 1 July 2016 respectively. Fair valueFair valueFair valueFair value Fair value was measured using Blackscholes and the inputs to it were as follows: Weighted average share price Range from $0.06 to $0.20 Exercise price 1,837,500 at $0.0595 and 75,000 at $0.17 Option life 3-4 years Risk-free interest rate Range from 2.53% to 4.17% Expected dividends 0 Expected volatility* Range from 62% to 76%
* Historical volatility has been the basis for determining the expected share price volatility as it is assumed that it is indicative of the future trade, which may not eventuate.
Refer to note 28 for additional options issued after the reporting date. Movement in rightMovement in rightMovement in rightMovement in rights during the financial years during the financial years during the financial years during the financial year
5,409,902 Indeterminate rights were issued to Rob Phillips on the terms and conditions approved by shareholders at the AGM on 26 November 2014 under the Equity Incentive Plan, vesting dependent on performance hurdles on 1 July 2018, 1 July 2019 & 1 July 2020. Consideration payable upon vesting is $nil. The Board may exercise its discretion to pay cash in lieu of issue of ordinary shares. 450,000 Performance rights were issued to Nick Schicht under the Equity Incentive Plan, vesting dependent on performance hurdles on 1 July 2018, 1 July 2019 and 1 July 2020. Consideration payable upon vesting is $nil.
ConsolidatedConsolidatedConsolidatedConsolidated
2015201520152015 2014201420142014
$ $
Note 19: Translation reserve
Opening balance 77,580 78,473 Translation of financial statements of foreign Controlled Entity 3,511 (893)
Closing balanceClosing balanceClosing balanceClosing balance 81,091 77,580
Note 20: Cash flow information
(a) Reconciliation of cash Cash at bank and on hand 526,317 1,582,834
Total cash at end of yearTotal cash at end of yearTotal cash at end of yearTotal cash at end of year 526,317 1,582,834
2015201520152015 2014
Number Number Rights at the beginning of the period - - Granted during the period 5,859,902 -
Rights at the end of the period 5,859,902 -

ANNUAL REPORT 2015 41
Notes to Financial Statements
Continued
Note 20: Cash flow information (continued)
ConsolidatedConsolidatedConsolidatedConsolidated
2015201520152015 2014201420142014
$ $
(b) Reconciliation of cash flow from operations to loss from continuing operations after income tax
Loss from continuing operations after income tax (1,215,654) (1,520,500) Non cash flows in loss from continuing operations Depreciation 14,711 16,457 Amortisation 157,308 193,573 Impairment of patents 59,768 178,269 Options reserve 168,150 118,108 Translation reserve 3,511 (893) (Increase)/decrease in assets Trade debtors 24,761 (227,078) Inventories (314,513) (26,216) Prepayments (37,332) (7,323) R & D tax incentive (53,781) 59,158 GST assets 2,896 (8,589) Increase/(decrease) in liabilities Trade payables 118,307 (46,468) Sundry payables and accrued expenses 32,991 109,752 Employee related payables 10,963 (3,621) Employee provisions 30,724 (71,587) Other provisions 4,394 1,220
Net cNet cNet cNet cash ash ash ash used in operating activitiesused in operating activitiesused in operating activitiesused in operating activities (992,796) (1,235,738)
Note 21: Financial instruments
(a)(a)(a)(a) Significant accounting policiesSignificant accounting policiesSignificant accounting policiesSignificant accounting policies Details of the significant accounting policies and methods adopted, including the criteria of recognition, the basis of measurement and the basis on which income and expenses are recognised, in respect of each class of financial asset, financial liability and equity instrument are disclosed in note 2 to the financial statements.
(b)(b)(b)(b) Capital risk managementCapital risk managementCapital risk managementCapital risk management The Consolidated Entity manages its capital to ensure that companies in the Consolidated Entity are able to continue as a going concern. The capital structure of the Entity consists of cash and cash equivalents (note 8 on page 35) and equity attributable to equity holders of the Parent Entity, comprising issued capital (note 17 on page 38), and accumulated losses (note 6 on page 35). (c)(c)(c)(c) Outstanding contractsOutstanding contractsOutstanding contractsOutstanding contracts At 30 June 2015, there were no outstanding contracts. (d)(d)(d)(d) Financial risk management objectivesFinancial risk management objectivesFinancial risk management objectivesFinancial risk management objectives The Consolidated Entity’s principal financial instruments are cash and term deposit accounts. Its financial instruments risk is with interest rate risk on its cash and term deposits and liquidity risk for its term deposits. The Consolidated Entity does not enter into or trade financial instruments, including derivative financial instruments, for speculative purposes. The Board is updated monthly by management as to the amounts of funds available to the Consolidated Entity from either cash in the bank or term deposits, and continually monitors interest rate movements. (e)(e)(e)(e) Foreign currency risk managementForeign currency risk managementForeign currency risk managementForeign currency risk management The Consolidated Entity undertakes certain transactions denominated in foreign currencies, hence exposures to exchange rate fluctuations arise. The Consolidated Entity does not have any forward foreign exchange contracts as at 30 June 2015 and is exposed to foreign currency risk on sales and purchases denominated in a currency other than Australian dollars. The currencies giving rise to this risk is primarily the US Dollar, Euro and British Pound. The Consolidated Entity incurs costs in US Dollars for its operations which provide a natural hedge for a portion of income denominated in US Dollars.
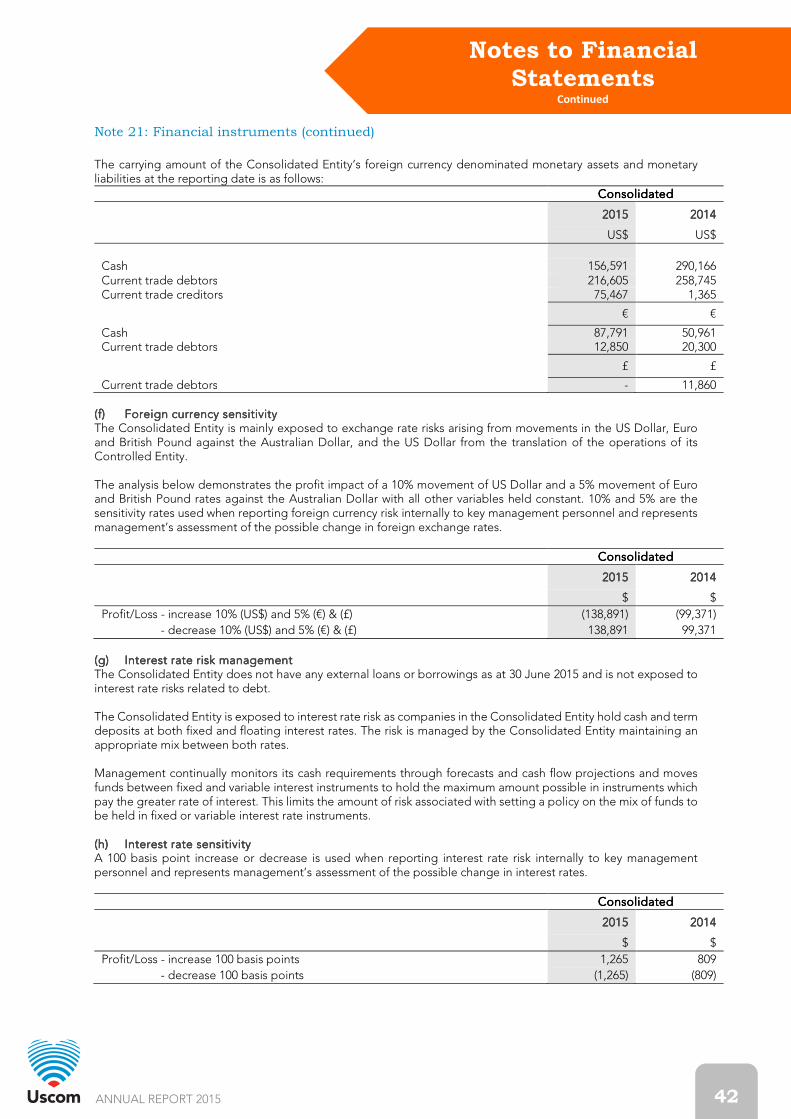
ANNUAL REPORT 2015 42
Notes to Financial Statements
Continued
Note 21: Financial instruments (continued)
The carrying amount of the Consolidated Entity’s foreign currency denominated monetary assets and monetary liabilities at the reporting date is as follows:
ConsolidatedConsolidatedConsolidatedConsolidated
2015201520152015 2014201420142014
US$ US$
Cash 156,591 290,166 Current trade debtors 216,605 258,745 Current trade creditors 75,467 1,365
€ €
Cash 87,791 50,961 Current trade debtors 12,850 20,300
£ £
Current trade debtors - 11,860 (f)(f)(f)(f) Foreign currency sensitivityForeign currency sensitivityForeign currency sensitivityForeign currency sensitivity The Consolidated Entity is mainly exposed to exchange rate risks arising from movements in the US Dollar, Euro and British Pound against the Australian Dollar, and the US Dollar from the translation of the operations of its Controlled Entity. The analysis below demonstrates the profit impact of a 10% movement of US Dollar and a 5% movement of Euro and British Pound rates against the Australian Dollar with all other variables held constant. 10% and 5% are the sensitivity rates used when reporting foreign currency risk internally to key management personnel and represents management’s assessment of the possible change in foreign exchange rates.
ConsolidatedConsolidatedConsolidatedConsolidated
2015201520152015 2014201420142014
$ $
Profit/Loss - increase 10% (US$) and 5% (€) & (£) (138,891) (99,371)
- decrease 10% (US$) and 5% (€) & (£) 138,891 99,371
(g)(g)(g)(g) Interest rate risk managementInterest rate risk managementInterest rate risk managementInterest rate risk management The Consolidated Entity does not have any external loans or borrowings as at 30 June 2015 and is not exposed to interest rate risks related to debt. The Consolidated Entity is exposed to interest rate risk as companies in the Consolidated Entity hold cash and term deposits at both fixed and floating interest rates. The risk is managed by the Consolidated Entity maintaining an appropriate mix between both rates. Management continually monitors its cash requirements through forecasts and cash flow projections and moves funds between fixed and variable interest instruments to hold the maximum amount possible in instruments which pay the greater rate of interest. This limits the amount of risk associated with setting a policy on the mix of funds to be held in fixed or variable interest rate instruments. (h)(h)(h)(h) Interest rate sensitivityInterest rate sensitivityInterest rate sensitivityInterest rate sensitivity A 100 basis point increase or decrease is used when reporting interest rate risk internally to key management personnel and represents management’s assessment of the possible change in interest rates.
ConsolidatedConsolidatedConsolidatedConsolidated
2015201520152015 2014201420142014
$ $
Profit/Loss - increase 100 basis points 1,265 809
- decrease 100 basis points (1,265) (809)
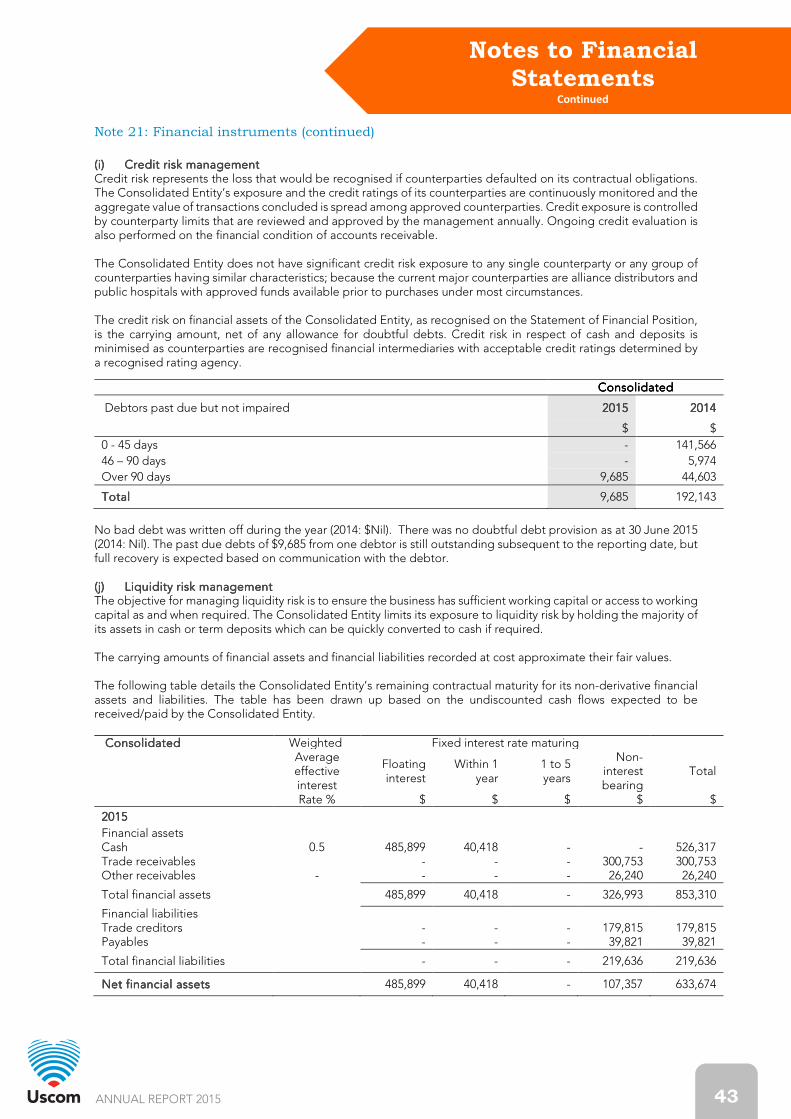
ANNUAL REPORT 2015 43
Notes to Financial Statements
Continued
Note 21: Financial instruments (continued)
(i)(i)(i)(i) Credit risk managementCredit risk managementCredit risk managementCredit risk management Credit risk represents the loss that would be recognised if counterparties defaulted on its contractual obligations. The Consolidated Entity’s exposure and the credit ratings of its counterparties are continuously monitored and the aggregate value of transactions concluded is spread among approved counterparties. Credit exposure is controlled by counterparty limits that are reviewed and approved by the management annually. Ongoing credit evaluation is also performed on the financial condition of accounts receivable. The Consolidated Entity does not have significant credit risk exposure to any single counterparty or any group of counterparties having similar characteristics; because the current major counterparties are alliance distributors and public hospitals with approved funds available prior to purchases under most circumstances. The credit risk on financial assets of the Consolidated Entity, as recognised on the Statement of Financial Position, is the carrying amount, net of any allowance for doubtful debts. Credit risk in respect of cash and deposits is minimised as counterparties are recognised financial intermediaries with acceptable credit ratings determined by a recognised rating agency.
ConsolidatedConsolidatedConsolidatedConsolidated
Debtors past due but not impaired 2015201520152015 2014201420142014
$ $
0 - 45 days - 141,566
46 – 90 days - 5,974
Over 90 days 9,685 44,603
TotalTotalTotalTotal 9,685 192,143
No bad debt was written off during the year (2014: $Nil). There was no doubtful debt provision as at 30 June 2015 (2014: Nil). The past due debts of $9,685 from one debtor is still outstanding subsequent to the reporting date, but full recovery is expected based on communication with the debtor. (j)(j)(j)(j) Liquidity risk managementLiquidity risk managementLiquidity risk managementLiquidity risk management The objective for managing liquidity risk is to ensure the business has sufficient working capital or access to working capital as and when required. The Consolidated Entity limits its exposure to liquidity risk by holding the majority of its assets in cash or term deposits which can be quickly converted to cash if required. The carrying amounts of financial assets and financial liabilities recorded at cost approximate their fair values. The following table details the Consolidated Entity’s remaining contractual maturity for its non-derivative financial assets and liabilities. The table has been drawn up based on the undiscounted cash flows expected to be received/paid by the Consolidated Entity.
ConsolidatedConsolidatedConsolidatedConsolidated Weighted Fixed interest rate maturing
Average effective interest
Floating interest
Within 1 year
1 to 5 years
Non-interest bearing
Total
Rate % $ $ $ $ $
2015201520152015
Financial assets Cash 0.5 485,899 40,418 - - 526,317 Trade receivables - - - 300,753 300,753 Other receivables - - - - 26,240 26,240
Total financial assets 485,899 40,418 - 326,993 853,310
Financial liabilities Trade creditors - - - 179,815 179,815 Payables - - - 39,821 39,821
Total financial liabilities - - - 219,636 219,636
Net Net Net Net financial assetsfinancial assetsfinancial assetsfinancial assets 485,899 40,418 - 107,357 633,674
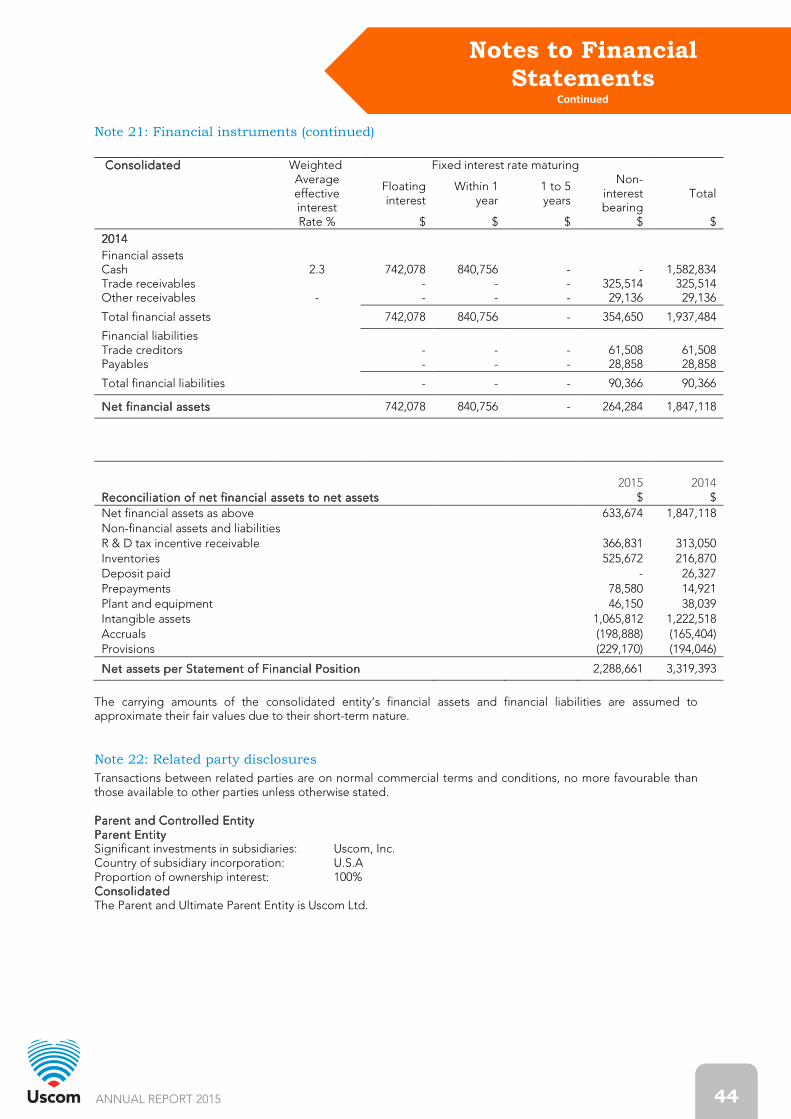
ANNUAL REPORT 2015 44
Notes to Financial Statements
Continued
Note 21: Financial instruments (continued)
ConsolidatedConsolidatedConsolidatedConsolidated Weighted Fixed interest rate maturing
Average effective interest
Floating interest
Within 1 year
1 to 5 years
Non-interest bearing
Total
Rate % $ $ $ $ $
2014201420142014
Financial assets Cash 2.3 742,078 840,756 - - 1,582,834 Trade receivables - - - 325,514 325,514 Other receivables - - - - 29,136 29,136
Total financial assets 742,078 840,756 - 354,650 1,937,484
Financial liabilities Trade creditors - - - 61,508 61,508 Payables - - - 28,858 28,858
Total financial liabilities - - - 90,366 90,366
Net financial assetsNet financial assetsNet financial assetsNet financial assets 742,078 840,756 - 264,284 1,847,118
2015 2014 Reconciliation Reconciliation Reconciliation Reconciliation of net financial assets to net assetsof net financial assets to net assetsof net financial assets to net assetsof net financial assets to net assets $ $
Net financial assets as above 633,674 1,847,118 Non-financial assets and liabilities R & D tax incentive receivable 366,831 313,050 Inventories 525,672 216,870 Deposit paid - 26,327 Prepayments 78,580 14,921 Plant and equipment 46,150 38,039 Intangible assets 1,065,812 1,222,518 Accruals (198,888) (165,404) Provisions (229,170) (194,046)
Net assets perNet assets perNet assets perNet assets per Statement of Financial PositionStatement of Financial PositionStatement of Financial PositionStatement of Financial Position 2,288,661 3,319,393
The carrying amounts of the consolidated entity’s financial assets and financial liabilities are assumed to approximate their fair values due to their short-term nature.
Note 22: Related party disclosures
Transactions between related parties are on normal commercial terms and conditions, no more favourable than those available to other parties unless otherwise stated. Parent Parent Parent Parent and Controlled Eand Controlled Eand Controlled Eand Controlled Entityntityntityntity Parent EntityParent EntityParent EntityParent Entity Significant investments in subsidiaries: Uscom, Inc. Country of subsidiary incorporation: U.S.A Proportion of ownership interest: 100% ConsolidatedConsolidatedConsolidatedConsolidated The Parent and Ultimate Parent Entity is Uscom Ltd.

ANNUAL REPORT 2015 45
Notes to Financial Statements
Continued
Note 22: Related party disclosures (continued)
Key management personnelKey management personnelKey management personnelKey management personnel The following were key management personnel of the Consolidated Entity at any time during the reporting period and unless otherwise indicated were key management personnel for the entire period: NonNonNonNon----Executive DirectorsExecutive DirectorsExecutive DirectorsExecutive Directors Sheena Jack, Non-Executive Director Christian Bernecker, Non-Executive Director Executive DirectorsExecutive DirectorsExecutive DirectorsExecutive Directors Rob Phillips, Executive Director, Chairman, Chief Executive Officer Senior ExecutivesSenior ExecutivesSenior ExecutivesSenior Executives Nick Schicht, General Manager For further remuneration information of key management personnel refer to the remuneration report in the Directors’ report on pages 17-22. The aggregate compensation made to Directors and other members of key management personnel of the Company and the Consolidated Entity is set out below:
ConsolidatedConsolidatedConsolidatedConsolidated
2015201520152015 2014201420142014
$ $
Short-term employee benefits 409,325 407,238 Post-employment benefits 37,145 58,462 Other payments 20,000 - Share-based payment 160,053 115,482
Total key management personnel remunerationTotal key management personnel remunerationTotal key management personnel remunerationTotal key management personnel remuneration 626,523 581,182
Note 23: Parent entity information
ParentParentParentParent
2015201520152015 2014201420142014
$ $
Set out below is the supplementary information about the parent entity. Statement of comprehensive incomeStatement of comprehensive incomeStatement of comprehensive incomeStatement of comprehensive income Loss after income tax (1,246,463) (1,535,874) Total comprehensive income (1,246,463) (1,535,874) Statement of financial positionStatement of financial positionStatement of financial positionStatement of financial position Total current assets 1,785,997 2,484,085 Total assets 2,751,433 3,622,481 Total current liabilities 606,955 424,474 Total liabilities 640,052 446,046 EquityEquityEquityEquity Contributed equity 26,019,429 26,006,168 Options reserve 1,806,732 1,638,582 Accumulated losses (25,714,780) (24,468,315) Total equity 2,111,381 3,176,435

ANNUAL REPORT 2015 46
Notes to Financial Statements
Continued
Note 23: Parent entity information (Continued)
Contingent liabilitiesContingent liabilitiesContingent liabilitiesContingent liabilities The parent entity has provided a guarantee in respect of obligations under premises lease of $40,418 (2014: $40,418). No liability was recognised by the parent entity or the consolidated entity in relation to this guarantee. Other than the guarantee mentioned above, the parent entity did not have any contingent liabilities as at 30 June 2015 or 30 June 2014. Significant accounting policiesSignificant accounting policiesSignificant accounting policiesSignificant accounting policies The accounting policies of the parent entity are consistent with those of the consolidated entity, as disclosed in note 2. ConsolidatedConsolidatedConsolidatedConsolidated
2015201520152015 2014201420142014
$ $
Note 24: Commitments
Operating lease commitmentsOperating lease commitmentsOperating lease commitmentsOperating lease commitments Operating commitments represent payments due for office rentals and have an average term from 18 to 30 months and month to month thereafter.
Less than 1 year 67,334 131,862 Between 1 and 5 years - 67,334
Total operating commitmentsTotal operating commitmentsTotal operating commitmentsTotal operating commitments 67,334 199,196
Note 25: Auditors’ remuneration
a. Audit servicesAudit servicesAudit servicesAudit services BDO East Coast Partnership forBDO East Coast Partnership forBDO East Coast Partnership forBDO East Coast Partnership for
Audit and review of financial reports 50,000 60,500
Total remunerationTotal remunerationTotal remunerationTotal remuneration for audit servicesfor audit servicesfor audit servicesfor audit services 50,000 60,500
b. NonNonNonNon----audit servicesaudit servicesaudit servicesaudit services BDO East Coast Partnership forBDO East Coast Partnership forBDO East Coast Partnership forBDO East Coast Partnership for
Accounting advice 1,000 - Taxation advice 1,250 -
Total Total Total Total auditors’ remunerationauditors’ remunerationauditors’ remunerationauditors’ remuneration 2,250 -
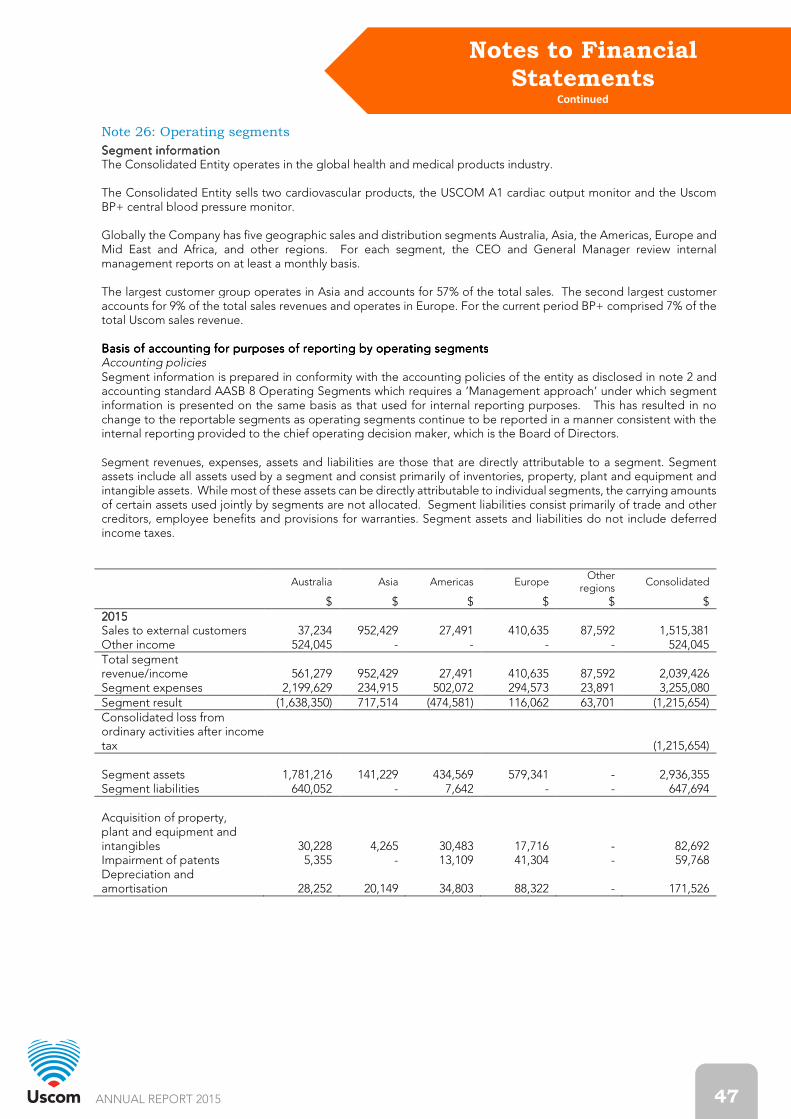
ANNUAL REPORT 2015 47
Notes to Financial Statements
Continued
Note 26: Operating segments
Segment information Segment information Segment information Segment information The Consolidated Entity operates in the global health and medical products industry. The Consolidated Entity sells two cardiovascular products, the USCOM A1 cardiac output monitor and the Uscom BP+ central blood pressure monitor. Globally the Company has five geographic sales and distribution segments Australia, Asia, the Americas, Europe and Mid East and Africa, and other regions. For each segment, the CEO and General Manager review internal management reports on at least a monthly basis. The largest customer group operates in Asia and accounts for 57% of the total sales. The second largest customer accounts for 9% of the total sales revenues and operates in Europe. For the current period BP+ comprised 7% of the total Uscom sales revenue. Basis of accounting for purposes of reporting by operating sBasis of accounting for purposes of reporting by operating sBasis of accounting for purposes of reporting by operating sBasis of accounting for purposes of reporting by operating segmentsegmentsegmentsegments Accounting policies Segment information is prepared in conformity with the accounting policies of the entity as disclosed in note 2 and accounting standard AASB 8 Operating Segments which requires a ‘Management approach’ under which segment information is presented on the same basis as that used for internal reporting purposes. This has resulted in no change to the reportable segments as operating segments continue to be reported in a manner consistent with the internal reporting provided to the chief operating decision maker, which is the Board of Directors. Segment revenues, expenses, assets and liabilities are those that are directly attributable to a segment. Segment assets include all assets used by a segment and consist primarily of inventories, property, plant and equipment and intangible assets. While most of these assets can be directly attributable to individual segments, the carrying amounts of certain assets used jointly by segments are not allocated. Segment liabilities consist primarily of trade and other creditors, employee benefits and provisions for warranties. Segment assets and liabilities do not include deferred income taxes.
Australia Asia Americas Europe Other
regions Consolidated
$ $ $ $ $ $ 2015201520152015 Sales to external customers 37,234 952,429 27,491 410,635 87,592 1,515,381 Other income 524,045 - - - - 524,045 Total segment revenue/income 561,279 952,429 27,491 410,635 87,592 2,039,426 Segment expenses 2,199,629 234,915 502,072 294,573 23,891 3,255,080 Segment result (1,638,350) 717,514 (474,581) 116,062 63,701 (1,215,654) Consolidated loss from ordinary activities after income tax (1,215,654) Segment assets 1,781,216 141,229 434,569 579,341 - 2,936,355 Segment liabilities 640,052 - 7,642 - - 647,694 Acquisition of property, plant and equipment and intangibles 30,228 4,265 30,483 17,716 - 82,692 Impairment of patents 5,355 - 13,109 41,304 - 59,768 Depreciation and amortisation 28,252 20,149 34,803 88,322 - 171,526
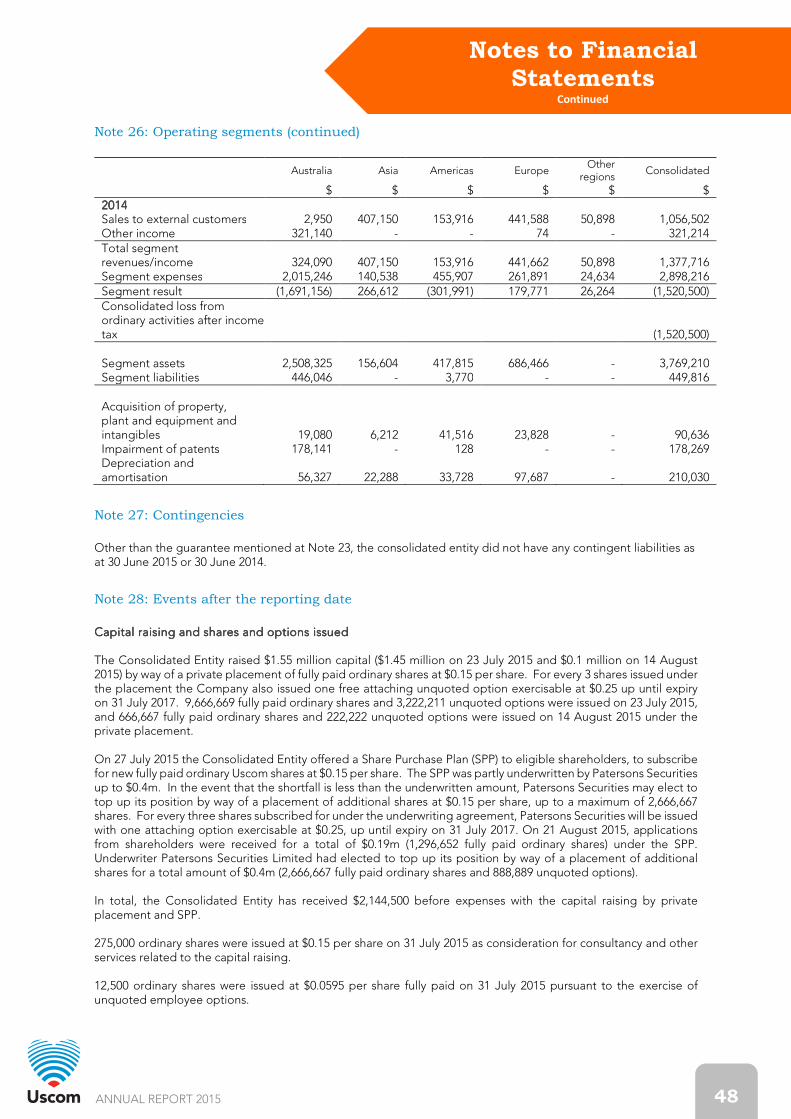
ANNUAL REPORT 2015 48
Notes to Financial Statements
Continued
Note 26: Operating segments (continued)
Australia Asia Americas Europe Other
regions Consolidated
$ $ $ $ $ $ 2014201420142014 Sales to external customers 2,950 407,150 153,916 441,588 50,898 1,056,502 Other income 321,140 - - 74 - 321,214 Total segment revenues/income 324,090 407,150 153,916 441,662 50,898 1,377,716 Segment expenses 2,015,246 140,538 455,907 261,891 24,634 2,898,216 Segment result (1,691,156) 266,612 (301,991) 179,771 26,264 (1,520,500) Consolidated loss from ordinary activities after income tax (1,520,500) Segment assets 2,508,325 156,604 417,815 686,466 - 3,769,210 Segment liabilities 446,046 - 3,770 - - 449,816 Acquisition of property, plant and equipment and intangibles 19,080 6,212 41,516 23,828 - 90,636 Impairment of patents 178,141 - 128 - - 178,269 Depreciation and amortisation 56,327 22,288 33,728 97,687 - 210,030
Note 27: Contingencies
Other than the guarantee mentioned at Note 23, the consolidated entity did not have any contingent liabilities as at 30 June 2015 or 30 June 2014.
Note 28: Events after the reporting date
Capital raisingCapital raisingCapital raisingCapital raising and shares and options issuedand shares and options issuedand shares and options issuedand shares and options issued The Consolidated Entity raised $1.55 million capital ($1.45 million on 23 July 2015 and $0.1 million on 14 August 2015) by way of a private placement of fully paid ordinary shares at $0.15 per share. For every 3 shares issued under the placement the Company also issued one free attaching unquoted option exercisable at $0.25 up until expiry on 31 July 2017. 9,666,669 fully paid ordinary shares and 3,222,211 unquoted options were issued on 23 July 2015, and 666,667 fully paid ordinary shares and 222,222 unquoted options were issued on 14 August 2015 under the private placement. On 27 July 2015 the Consolidated Entity offered a Share Purchase Plan (SPP) to eligible shareholders, to subscribe for new fully paid ordinary Uscom shares at $0.15 per share. The SPP was partly underwritten by Patersons Securities up to $0.4m. In the event that the shortfall is less than the underwritten amount, Patersons Securities may elect to top up its position by way of a placement of additional shares at $0.15 per share, up to a maximum of 2,666,667 shares. For every three shares subscribed for under the underwriting agreement, Patersons Securities will be issued with one attaching option exercisable at $0.25, up until expiry on 31 July 2017. On 21 August 2015, applications from shareholders were received for a total of $0.19m (1,296,652 fully paid ordinary shares) under the SPP. Underwriter Patersons Securities Limited had elected to top up its position by way of a placement of additional shares for a total amount of $0.4m (2,666,667 fully paid ordinary shares and 888,889 unquoted options). In total, the Consolidated Entity has received $2,144,500 before expenses with the capital raising by private placement and SPP. 275,000 ordinary shares were issued at $0.15 per share on 31 July 2015 as consideration for consultancy and other services related to the capital raising. 12,500 ordinary shares were issued at $0.0595 per share fully paid on 31 July 2015 pursuant to the exercise of unquoted employee options.

ANNUAL REPORT 2015 49
Notes to Financial Statements
Continued
Acquisition of Thor Laboratories KFTAcquisition of Thor Laboratories KFTAcquisition of Thor Laboratories KFTAcquisition of Thor Laboratories KFT The capital raising outlined above was in part to fund the acquisition of Thor Laboratories KFT in Hungary. The Heads of Agreement for the acquisition was signed on 8 March 2015. The acquisition is subject to satisfactory completion of due diligence by the company which is yet to be finalised. Consideration for the proposed acquisition is as follows:
a) $700K in cash to the Owners of Thor Laboratories KFT (the Owners) on completion of the proposed transaction.
b) $100K in cash to the Owners on the first anniversary of completion of the proposed transaction c) $100K in cash to the Owners on the second anniversary of completion of the proposed transaction, subject
to the achievement of revenue targets of not less than $1 million in the financial year 2017. In the event of any shortfall, this amount will be discounted on an indexed pro rata basis.
d) $100K in equity earn-outs to the Owners over a three year period from the date of acquisition.

ANNUAL REPORT 2015 50
Directors Declaration Uscom Limited and its Controlled Entity
1. The directors of the company declare that: The financial statements, comprising the statement of comprehensive income, statement of financial position, statement of cash flows, statement of changes in equity, accompanying notes, are in accordance with the Corporations Act 2001 and:
a. comply with Accounting Standards and the Corporations Regulations 2001; and
b. give a true and fair view of the consolidated entity’s financial position as at 30 June 2015 and of its
performance for the year ended on that date. 2. The company has included in the notes to the financial statements an explicit and unreserved statement of
compliance with International Financial Reporting Standards. 3. In the directors’ opinion, there are reasonable grounds to believe that the company will be able to pay its
debts as and when they become due and payable. 4. The directors have been given the declarations required by section 295A. This declaration is made in accordance with a resolution of the Board of Directors and is signed for and on behalf of the directors by:
Associate Professor Rob Phillips Ms Sheena Jack Executive Director - Chairman Non-Executive Director Sydney, 25 August 2015
DIRECTORS’ REPORT
Independent Audit Report
ANNUAL REPORT 2015 51
INDEPENDENT AUDITOR’S REPORT
To the members of Uscom Limited and its controlled entity
Report on the Financial Report
We have audited the accompanying financial report of Uscom Limited and its controlled entity,
which comprises the consolidated statement of financial position as at 30 June 2015, the
consolidated statement of profit or loss and other comprehensive income, the consolidated
statement of changes in equity and the consolidated statement of cash flows for the year then
ended, notes comprising a summary of significant accounting policies and other explanatory
information, and the directors’ declaration of the consolidated entity comprising the company and
the entity it controlled at the year’s end or from time to time during the financial year.
Directors’ Responsibility for the Financial Report
The directors of the company are responsible for the preparation of the financial report that gives a
true and fair view in accordance with Australian Accounting Standards and the Corporations Act
2001 and for such internal control as the directors determine is necessary to enable the preparation
of the financial report that gives a true and fair view and is free from material misstatement,
whether due to fraud or error. In Note 2, the directors also state, in accordance with Accounting
Standard AASB 101 Presentation of Financial Statements, that the financial statements comply with
International Financial Reporting Standards.
Auditor’s Responsibility
Our responsibility is to express an opinion on the financial report based on our audit. We conducted
our audit in accordance with Australian Auditing Standards. Those standards require that we comply
with relevant ethical requirements relating to audit engagements and plan and perform the audit to
obtain reasonable assurance about whether the financial report is free from material misstatement.
An audit involves performing procedures to obtain audit evidence about the amounts and disclosures
in the financial report. The procedures selected depend on the auditor’s judgement, including the
assessment of the risks of material misstatement of the financial report, whether due to fraud or
error. In making those risk assessments, the auditor considers internal control relevant to the
company’s preparation of the financial report that gives a true and fair view in order to design audit
procedures that are appropriate in the circumstances, but not for the purpose of expressing an
opinion on the effectiveness of the company’s internal control. An audit also includes evaluating the
appropriateness of accounting policies used and the reasonableness of accounting estimates made
by the directors, as well as evaluating the overall presentation of the financial report.
We believe that the audit evidence we have obtained is sufficient and appropriate to provide a basis
for our audit opinion.
Tel: +61 2 9251 4100 Fax: +61 2 9240 9821 www.bdo.com.au
Level 11, 1 Margaret St Sydney NSW 2000 Australia
BDO East Coast Partnership ABN 83 236 985 726 is a member of a national association of independent entities which are all members of BDO (Australia) Ltd ABN 77 050 110 275, an Australian company limited by guarantee. BDO East Coast Partnership and BDO (Australia) Ltd are members of BDO International Ltd, a UK company limited by guarantee, and form part of the international BDO network of independent member firms. Liability limited by a scheme
approved under Professional Standards Legislation, other than for the acts or omissions of financial services licensees.
ANNUAL REPORT 2015 52
Independent Audit Report Continued
Independence
In conducting our audit, we have complied with the independence requirements of the Corporations
Act 2001. We confirm that the independence declaration required by the Corporations Act 2001,
which has been given to the directors of Uscom Limited and its controlled entity, would be in the
same terms if given to the directors as at the time of this auditor’s report.
Opinion
In our opinion:
(a) the financial report of Uscom Limited and its controlled entity is in accordance with the
Corporations Act 2001, including:
(i) giving a true and fair view of the company’s financial position as at 30 June 2015 and of
its performance for the year ended on that date; and
(ii) complying with Australian Accounting Standards and the Corporations Regulations 2001;
and
(b) the financial report also complies with International Financial Reporting Standards as disclosed
in Note 2.
Report on the Remuneration Report
We have audited the Remuneration Report included in pages 17 to 22 of the directors’ report for
the year ended 30 June 2015. The directors of the company are responsible for the preparation and
presentation of the Remuneration Report in accordance with section 300A of the Corporations Act
2001. Our responsibility is to express an opinion on the Remuneration Report, based on our audit
conducted in accordance with Australian Auditing Standards.
Opinion
In our opinion, the Remuneration Report of Uscom Limited and its controlled entity for the year
ended 30 June 2015 complies with section 300A of the Corporations Act 2001.
BDO East Coast Partnership
Tim Sydenham
Partner Sydney, 25 August 2015
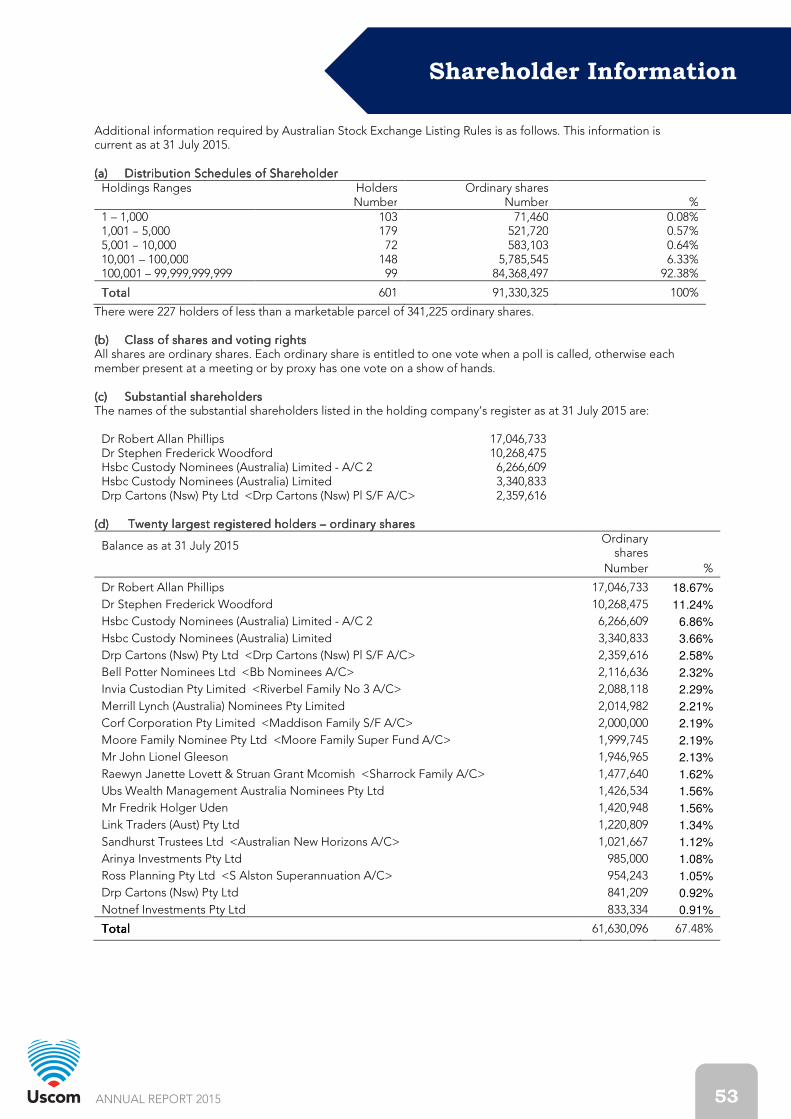
ANNUAL REPORT 2015 53
Shareholder Information
Additional information required by Australian Stock Exchange Listing Rules is as follows. This information is current as at 31 July 2015. (a)(a)(a)(a) Distribution Schedules of ShareholderDistribution Schedules of ShareholderDistribution Schedules of ShareholderDistribution Schedules of Shareholder Holdings Ranges Holders Ordinary shares Number Number % 1 – 1,000 103 71,460 0.08% 1,001 – 5,000 179 521,720 0.57% 5,001 – 10,000 72 583,103 0.64% 10,001 – 100,000 148 5,785,545 6.33% 100,001 – 99,999,999,999 99 84,368,497 92.38%
TotalTotalTotalTotal 601 91,330,325 100%
There were 227 holders of less than a marketable parcel of 341,225 ordinary shares. (b)(b)(b)(b) Class of shares and voting rightsClass of shares and voting rightsClass of shares and voting rightsClass of shares and voting rights All shares are ordinary shares. Each ordinary share is entitled to one vote when a poll is called, otherwise each member present at a meeting or by proxy has one vote on a show of hands. (c)(c)(c)(c) Substantial shareholdersSubstantial shareholdersSubstantial shareholdersSubstantial shareholders The names of the substantial shareholders listed in the holding company’s register as at 31 July 2015 are:
Dr Robert Allan Phillips 17,046,733 Dr Stephen Frederick Woodford 10,268,475 Hsbc Custody Nominees (Australia) Limited - A/C 2 6,266,609 Hsbc Custody Nominees (Australia) Limited 3,340,833 Drp Cartons (Nsw) Pty Ltd <Drp Cartons (Nsw) Pl S/F A/C> 2,359,616
(d)(d)(d)(d) Twenty largest registered holders Twenty largest registered holders Twenty largest registered holders Twenty largest registered holders –––– ordinary sharesordinary sharesordinary sharesordinary shares
Balance as at 31 July 2015 Ordinary
shares
Number %
Dr Robert Allan Phillips 17,046,733 18.67%
Dr Stephen Frederick Woodford 10,268,475 11.24%
Hsbc Custody Nominees (Australia) Limited - A/C 2 6,266,609 6.86%
Hsbc Custody Nominees (Australia) Limited 3,340,833 3.66%
Drp Cartons (Nsw) Pty Ltd <Drp Cartons (Nsw) Pl S/F A/C> 2,359,616 2.58%
Bell Potter Nominees Ltd <Bb Nominees A/C> 2,116,636 2.32%
Invia Custodian Pty Limited <Riverbel Family No 3 A/C> 2,088,118 2.29%
Merrill Lynch (Australia) Nominees Pty Limited 2,014,982 2.21%
Corf Corporation Pty Limited <Maddison Family S/F A/C> 2,000,000 2.19%
Moore Family Nominee Pty Ltd <Moore Family Super Fund A/C> 1,999,745 2.19%
Mr John Lionel Gleeson 1,946,965 2.13%
Raewyn Janette Lovett & Struan Grant Mcomish <Sharrock Family A/C> 1,477,640 1.62%
Ubs Wealth Management Australia Nominees Pty Ltd 1,426,534 1.56%
Mr Fredrik Holger Uden 1,420,948 1.56%
Link Traders (Aust) Pty Ltd 1,220,809 1.34%
Sandhurst Trustees Ltd <Australian New Horizons A/C> 1,021,667 1.12%
Arinya Investments Pty Ltd 985,000 1.08%
Ross Planning Pty Ltd <S Alston Superannuation A/C> 954,243 1.05%
Drp Cartons (Nsw) Pty Ltd 841,209 0.92%
Notnef Investments Pty Ltd 833,334 0.91%
TotalTotalTotalTotal 61,630,096 67.48%

ANNUAL REPORT 2015 54
Shareholder Information Continued
Registered office and principal place of office
Level 7, 10 Loftus Street Sydney NSW 2000 Australia Tel: 02 9247 4144 Fax: 02 9247 8157
Company Secretary
Catherine Officer
Registers of securities
Boardroom Pty Limited Level 12, 225 George Street Sydney NSW 2000 Australia GPO Box 3993 Sydney NSW 2001 Australia Tel: 1300 737 760 Fax: 1300 653 459 www.boardroomlimited.com.au
Stock exchange listing
Quotation has been granted for 91,330,325 ordinary shares of the Company as at 31 July 2015 on all Member Exchanges of the Australian Stock Exchange Limited.
Unquoted securities
Options Options Options Options and rights and rights and rights and rights over unissued sharesover unissued sharesover unissued sharesover unissued shares as atas atas atas at 31 July 201531 July 201531 July 201531 July 2015 A total of 5,122,211 options over ordinary shares are on issue. 1,000,000 options are on issue to a director. 825,000 options are on issue to six employees and executives under the previous Uscom Employee Share Option Plan and previous Uscom Executive Share Option Plan; 75,000 options are on issue to a consultant under the new Equity Incentive Plan. 3,222,111 options are on issue to investors. A total of 5,859,902 rights over ordinary shares are on issue. 5,409,902 rights are on issue to a director and 450,000 are on issue to an executive under the new Equity Incentive Plan.
USCOM LIMITED ANNUAL REPORT 2015
Uscom Limited, Suite 1, Level 7, 10 Loftus Street, Sydney NSW 2000 Australia E: [email protected]
www.uscom.com.au