Embed Size (px)
Citation preview

2015 Number 4

Copyright © 2015 McKinsey & Company. All rights reserved.
Published since 1964 by McKinsey & Company, 55 East 52nd Street, New York, New York 10022.
Cover illustration by Vasava
McKinsey Quarterly meets the Forest Stewardship Council (FSC) chain-of- custody standards.
The paper used in the Quarterly is certified as being produced in an environ- mentally responsible, socially beneficial, and economi- cally viable way.
Printed in the United States of America.

2015 Number 4
This Quarter
It’s almost a truism these days to say that modern corporations must be agile. The pace of industry disruption arising from the digital revolution, combined with nimble, new competitors—including many from emerging markets—have raised the cost of complacency and rigidity.
But what does it mean to achieve agility? This issue’s cover package tries to answer that question, starting with intriguing new McKinsey research. Using data from McKinsey’s Organizational Health Index, Michael Bazigos, Aaron De Smet, and Chris Gagnon show how organizations that combine speed with stability are far likelier to be healthy than companies that simply move fast.
The utility sector is a striking example of one industry that needs to combine flexibility and stability. Although digital competitors, new data-based business models, and renewable-energy sources are changing the landscape in certain markets, the industry’s sprawl- ing base of heavy assets remains core to its future. Sven Heiligtag and his colleagues Dominik Luczak and Eckart Windhagen describe how a number of leading utilities are trying to straddle these two worlds, suggesting some lessons for companies in other sectors.
The importance of balance in our agile age extends to individual executives. Many are overwhelmed by information, and it’s not clear they or their organizations are extracting as much value from it as they could. London Business School professor Julian Birkinshaw and his coauthor Jonas Ridderstråle suggest the answer may be to

create organizations that can maximize “return on attention,” which they define as “the quantity of focused action to generate a possible solution divided by the time and effort spent analyzing the problem.” Such organizations, say the authors, are more likely to look like an
“adhocracy” than a traditional bureaucracy or meritocracy.
The forces at work in today’s large organizations demand more than agility, of course, and we’re using both this issue of the Quarterly and the next to further explore what it means to organize for the future. You’ll find here, for example, new research from McKinsey and Gallup on matrix organizations, as well as thinking from Ashridge Business School professor and McKinsey alumnus Andrew Campbell and his coauthor INSEAD professor Gabriel Szulanski, on ways to deter the corporate center from inadvertently subtracting value. Finally, our global managing director, Dominic Barton, along with Sandrine Devillard and Judith Hazelwood, examine a critical challenge for many organizations: achieving gender parity. Through the lens of McKinsey’s experience, they explore why it’s been elusive, and what we can do about it.
The leaders of Chinese organizations—whether local companies or the local business units of multinationals—have had a challenging year amid economic and financial-market headwinds. This issue also presents new research about how they are responding. The article featuring those insights, “How China country heads are coping,” is part of a broader package that takes China’s pulse. Despite economic and financial-market difficulties in 2015, research from the McKinsey Global Institute and our colleagues on the ground detect a wellspring of innovation and significant resilience. Global leaders shouldn’t be writing China off anytime soon—in part because of the agility with which its companies and leaders are responding to changing circumstances. We hope this issue of the Quarterly will inspire agile responses to your biggest challenges, too.
Allen WebbEditor in chief, Seattle office

Why agility pays
Five myths about the Chinese economy
28
60
Michael Bazigos, Aaron De Smet, and Chris Gagnon
Jonathan Woetzel
Sven Heiligtag, Dominik Luczak, and Eckart Windhagen
Erik Roth, Jeongmin Seong, and Jonathan Woetzel
Wouter Baan and Christopher Thomas
Julian Birkinshaw and Jonas Ridderstråle
Cindy Chiu, Todd Guild, and Gordon Orr
New research shows that the trick for companies is to combine speed with stability.
Predictions of deepening economic woes are plentiful. Here are five arguments against the pessimism.
Agility lessons from utilities
Gauging the strength of Chinese innovation
How China country heads are coping
Adhocracy for an agile age
Five keys to connecting with China’s wired consumers
36
66
82
44
74
The industry faces pressure on its core businesses and unexpected digital competition. Evaluating the external environment and making bets more quickly will be decisive for incumbents.
China does well in customer- and manufacturing-oriented innovation, though not in the more advanced varieties. But the country will need them to sustain growth.
As multinational companies face stronger headwinds, how are local leaders dealing with the situation, and what would help them move faster?
China is the world’s largest and most dynamic e-commerce market. But being successful requires understanding and embracing its unique digital landscape and consumers.
The agile organizational model gives primacy to action while improving the speed and quality of the decisions that matter most.
Agility
Taking China’s pulse
On the cover
Features

Dominic Barton, Sandrine Devillard, and Judith Hazlewood
Gender equality: Taking stock of where we are
Digging into the numbers on gender equality
86
90Why are women still underrepresented at every level of today’s corporations?
Highlights from recent research
Features
Jacques Bughin, Michael Chui, and James Manyika
An executive’s guide to the Internet of Things92
The rate of adoption is accelerating. Here are six things you need to know.
Andrew Campbell and Gabriel Szulanski
Knowing when corporate headquarters adds rather than subtracts value
102
Reduce value destruction by applying three tests to initiatives from the center.

How should you tap into Silicon Valley?
Alex Kazaks, Eric Kutcher, and Michael Uhl
Not by sticking a toe in the water. Get your management team aligned and then commit.
Closing View
Industry dynamics
Consumer packaged goods: When subpar operations threaten margin growth
A quick look at research and analysis from selected sectors
Leading Edge
Revisiting the matrix organization
Michael Bazigos and James Harter
Matrices are often necessary, but they may create uncomfortable ambiguity for employees. Clarifying roles can boost employee engagement and organizational health.
Why it’s still a world of ‘grow or go’
Yuval Atsmon and Sven Smit
In a challenging environment, growth matters more than ever.
Taking the measure of the networked enterprise
Jacques Bughin
New research shows that power users reap the greatest benefits from social technologies.
Short takes
Perspectives on management today
Reflections on oil and gas
Extra PointThe global gender-parity landscape
116
8
11114
19
24
23

McKinsey Quarterly editorsFrank Comes, Executive editorLang Davison, Executive editorTim Dickson, Deputy editor in chiefHolly Lawson, Editorial associateDavid Schwartz, Senior editorAllen P. Webb, Editor in chief
Contributing editorsMichael T. BorrusoGeoff LewisRon StachJonathan Ward
Design and data visualizationElliot Cravitz, Design directorMary Reddy, Senior editor, data visualization
Editorial operationsAndrew Cha, Assistant web producerRoger Draper, Copy chiefDrew Holzfeind, Assistant managing editorHeloisa Nogueira, Editorial assistantDavid Peak, Editorial assistant
DistributionDevin A. Brown, Social media and syndicationDebra Petritsch, LogisticsLeslie Poston, Editor, social media
McKinsey Quarterly ChinaGlenn Leibowitz, EditorLin Lin, Managing editorRebecca Zhang, Assistant managing editor
How to change your mailing address McKinsey clients and other [email protected]
McKinsey [email protected]
How to contact the QuarterlyE-mail customer service [email protected]
To request permission to republish an [email protected]
To submit an article proposal [email protected]
Websitesmckinsey.com/insightsmckinsey.com/quarterlymckinseychina.com/insights-publications
Download the McKinsey Insights app on the Apple App Store and the Google Play storehttp://bit.ly/McKInsightsApphttp://bit.ly/McKAppGoogle
Download digital editions of McKinsey Quarterly On the McKinsey Insights app and from our website: http://www.mckinsey.com/quarterly_newsstand
Audio and video podcasts on iTunes audio: http://bit.ly/mckinseyitunesaudio video: http://bit.ly/mckinseyitunesvideo
Follow us on Twitter@McKQuarterly
Connect with us on LinkedInlinkedin.com/company/mckinsey-&-company
Join the McKinsey Quarterly community on Facebook facebook.com/mckinseyquarterly
Watch us on YouTubeyoutube.com/mckinsey
Digital offerings

Install the McKinsey Insights appNow available for iPhone, iPad, and Android devices
With mobile access to our
research and insights, you’ll
know what matters in
business and management—
wherever you are.
Our latest thinking on your smartphone or tablet
The app brings together
management insights
from McKinsey Quarterly,
economics research
from the McKinsey Global
Institute, and intelligence
from across our network of
industry and functional
practices.
Select the topics you care
about for a personalized
experience. Read offline.
Download articles and
reports. Logical controls
and a clean, uncluttered
layout let you focus on the
content. Great insights,
beautifully presented.
8 2015 Number 4
8 Revisiting the matrix
organization
19 Taking the measure
of the networked
enterprise
14 Why it’s still a world
of “grow or go”
Industry dynamics: Short takes:
24 Consumer
packaged goods
23 Reflections on
oil and gas
Leading EdgeResearch, trends, and emerging thinking
Matrix organizations have been around
for decades, stimulating vigorous
debate between supporters and detrac-
tors for nearly as long.1 They remain
prevalent at the large number of
companies that need to bring functional
centers of excellence together with
business-specific people and processes.
Eighty-four percent of respondents
to a recent Gallup survey, for example,
were at least slightly matrixed.
That survey, covering nearly 4,000
workers in the United States, highlights
some benefits for employees in
matrices, particularly in areas related to
collaboration. At the same time, the
survey suggests that these employees
feel less clear about what’s expected
of them than their nonmatrixed counter-
parts do. This problem has conse-
quences: Gallup research indicates that
clarity of expectations is a foundation
for building an engaged workplace that
performs at high levels. Furthermore,
according to McKinsey’s Organizational
Health Index (OHI), clear and account-
able roles are among the most important
drivers of organizational health. Taken
together, the Gallup and McKinsey
findings underscore how important it is
for executives and line managers to
address the role ambiguity that’s all too
common in matrix organizations.
(For more on the research behind these
two studies, see sidebar, “About
the research,” on page 11.)
Michael Bazigos and James Harter
Matrices are often necessary, but they may create uncomfortable ambiguity for employees. Clarifying roles can boost both the engagement of the workforce and a company’s organizational health.
Revisiting the matrix organization

Leading Edge 9
Ubiquitous and unexceptional
Eighty-four percent of the US employees
Gallup surveyed were matrixed to
some extent. Forty-nine percent served
on multiple teams some days (we
categorized them as slightly matrixed),
and 18 percent served on multiple
teams every workday but with different
people, though mostly reporting to the
same manager (matrixed). The remaining
17 percent reported to different man-
agers in their work with different teams
(supermatrixed).
Most employees in matrixed organiza-
tions, according to the survey, aren’t
terribly engaged with their jobs. (Gallup
defines employee engagement as
involvement in and enthusiasm for work.)
These figures are consistent with what
Gallup has found in the workplace at
large over a decade of study. They are
alarming, given the relationship between
worker engagement and vital business
outcomes, such as productivity, profit-
ability, and customer perceptions of
service quality.2 The survey does sug-
gest a modestly positive relationship
between the four categories of organi-
zation and employee engagement,
which rises slightly across them (exhibit).
Collaboration and clarity
Beneath the surface, we found some
areas (particularly collaboration) where
matrixed organizations performed
better than less matrixed ones and others
(related to role clarity) where they did
worse. The differences in engagement
at more and less matrixed organizations
suggest advantages and disadvantages
that may cancel one another out.
A key area of strength for matrixed
organizations lies in collaboration—a
heartening discovery, since cross-
company teamwork is one of the chief
aims of many matrices. We asked
employees of slightly matrixed, matrixed,
and supermatrixed organizations
about the benefits of being on different
teams. Supermatrixed employees
were generally about twice as likely as
slightly matrixed ones to say that
their organizations not only helped them
collaborate more effectively with
coworkers, do their best work, and
serve customers well but also stimulated
bottom-up innovation. Supermatrixed
employees were also somewhat more
likely than those in the other categories
to say they had received recognition
or praise during the past seven days, that
their opinions counted, and that their
fellow employees were committed to
doing quality work. These are key
elements in the overall engagement of
employees and suggest that relationships
and collaboration among employees in
matrixed organizations and their peers
and superiors really are better.
On the other hand, only a minority of
the supermatrixed employees strongly
agreed with the statement, “I know
what is expected of me at work,” com-
pared with 60 percent of the nonmatrixed.
This reflects a common complaint
about matrixed organizations—that the
structure gives rise to a lack of clarity
about responsibilities, expectations, and
who reports to whom. Workers in the
three matrixed groups were more likely

10 2015 Number 4
than nonmatrixed ones to say that
they need clear direction from project
leaders and communication between
their managers and project leaders to
prioritize their work most effectively.
Also, employees in the matrixed cate-
gories were more likely than their
nonmatrixed counterparts to say they
spent their days responding to
coworkers’ requests and attending
internal meetings. Such responses are
not surprising in an environment
where employees receive instructions
and feedback from multiple managers
and work with a range of people to com-
plete projects. These are also probably
factors in the critics’ assertions that the
matrix structure can slow decision
making, blur lines of communication,
stifle productivity, and hinder organiza-
tional responsiveness and agility.3
The link to organizational health
Interestingly, role clarity and related
accountability practices emerge as
among the most important drivers of
organizational health, and ultimately
Exhibit
Matrixed employees are slightly more engaged.
Q4 2015Matrix organizationExhibit 1 of 1
% of US employees1
Nonmatrixed
Slightly matrixedWork on multiple teams on some days
MatrixedWork on multiple teams every day, primarily reporting to same manager
Supermatrixed2
Work on multiple teams every day, reporting to different managers
165628
145729
145531
115634
Engaged Not engaged Actively disengaged
1 Controlled for employment level. Data reflect merged responses from 2 surveys and are not weighted.2 Figures do not sum to 100%, because of rounding. Source: Gallup
11Leading Edge
The findings of the study on matrixed employees are based on a Gallup panel web survey, completed by 3,956 full-time employees aged 18 and older, that was administered between April 8 and April 27, 2015. The Gallup panel is a probability-based longitudinal group of US adults selected through random-digit-dial (RDD) phone interviews over landlines and cell phones. Address-based sampling methods are also used to recruit panel members. The Gallup panel is not an opt-in panel, and members are not given incentives for participating.
Our sample for this study, which used Current Population Survey figures, was weighted to be demographically repre- sentative of the US adult population. For results based on this sample, the maxi- mum margin of sampling error is plus or minus two percentage points at the 95 percent confidence level. Margins of error are higher for subsamples. In addition to sampling error, the wording of ques- tions and practical difficulties in conducting surveys can introduce error and bias into the findings of public-opinion polls. The survey responses were matched with those of a US workforce panel survey administered in November 2014 to study the engagement and other work-related factors of matrixed employees. Separately, Gallup’s meta-analysis of the relation- ship between employee engagement and business outcomes included more than 49,000 business units across 49 industries.
The results of the organizational studies are based on subsets of McKinsey’s global database for the Organizational Health Index (OHI). This index is a survey-based assessment of organizational health, defined as the ability to perform over the long term. That kind of performance is
based on three capabilities: aligning around strategies, executing them, and adapting when necessary.1 The index includes data from more than two million respondents and over 2,000 unique surveys. Organizations in the top quartile for health collectively outpace organizations in the bottom quar- tile in total returns to shareholders (TRS): they earned three times the annual TRS of bottom-quartile organizations over the nine-year period of the study.2
The study focusing on the accountability practices of organizations was conducted using data from 254 unique companies and 781,224 respondents, collected in 2014 and 2015. This study determined the rank order of practices structurally related to organizational-health outcomes. The order of the practices was based on the magnitude and significance of the standardized betas produced by regressing the outcome on the direct practices. To determine the rank order of the related practices, we first regressed the outcome on the direct practices and then (using a stepwise regression) entered the remain- ing practices. Practices that explained a minimum incremental 1 percent of the variance were labeled related practices. Their rank order (like our treatment of direct practices) was based on the incremental amount of variance explained.
About the research
1 Organizational health is operationally defined by scores on nine organizational outcomes: direction, leadership, culture and climate, accountability, capabilities, coordination and control, innovation and learning, motivation, and external orientation. Unlike employee engagement, they are assessed by survey questions about the organization’s effectiveness in these areas rather than their impact on employees.
2 See Aaron De Smet, Bill Schaninger, and Matthew Smith, “The hidden value of organizational health—and how to capture it,” McKinsey Quarterly, April 2014, on mckinsey.com.

12 2015 Number 4
performance, in McKinsey research
based on the Organizational Health
Index (OHI). McKinsey has consistently
found that improving role clarity improves
accountability, an outcome that is a
critical component of the overall health-
index score. In fact, organizations with
high accountability scores have a
76 percent probability of achieving top-
quartile organizational health—more than
triple the expected rate. What’s more,
the independent effects of role clarity are
so powerful that they affect OHI scores
directly, one of only four management
practices (among 37) that do.4
These findings are consistent with work
by McKinsey’s Suzanne Heywood and
others showing that organizations can
mitigate the complexity associated
with matrices through clear accountability
and targets for individuals.5 Further
reinforcing these findings is the academic
literature suggesting that higher levels
of the ownership mentality predict higher
levels of collaboration, organizational
commitment, and corporate citizenship,
as well as reduced levels of behavior
that deviate from workplace norms.6
The Gallup survey does suggest that
role clarity takes a hit in matrixed organi-
zations. Yet it also indicates that super-
matrixed employees were more likely to
have received recognition or praise
in the previous seven days and to believe
that their opinions counted. McKinsey
research suggests that these features of
the employee experience in matrixed
companies have a positive impact on
organizational health: two management
practices—recognition and employee
involvement in direction setting—are
important drivers of two of the OHI’s
outcomes—motivation and direction—
which, along with accountability, are
meaningful components of the overall
OHI score.
Priorities for matrixed managers
Given the importance of role clarity and
accountability to organizational health
and, ultimately, performance, address-
ing the role ambiguity that pervades
matrixed companies is a critical priority
for their leaders, who should help
employees by continually setting clear
expectations aligned with the direc-
tion of the business. This clarity should
cascade into frequent conversa-
tions between managers and their direct
reports about the specific role each
person plays in advancing the company’s
objectives. Consultative (as opposed
to authoritarian) leadership practices can
contribute meaningfully to accountability,
according to McKinsey’s OHI research.
It is also imperative to maintain day-
to-day lines of communication to root
out and dispel ambiguity and ensure
that everyone is consistently on the
same page. This is true at the organiza-
tional as well as the team level: Gallup
research shows that managers should
not save critical conversations for
once-a-year performance reviews—
engagement flourishes when employees

13Leading Edge
receive regular, actionable feedback on
their progress.
Last, the matrix structure is notorious for
frequently obscuring lines of account-
ability, so leaders and managers should
ensure that all employees understand
whom they answer to and the duties for
which they are responsible. The impor-
tance of regular discussions to reclarify
expectations as work demands change
is compounded in matrix organizations.
And highly engaged employees thrive in
a system where everyone is account-
able for his or her work.
1 For a classic critique, see Tom Peters, “Beyond the matrix organization,” McKinsey Quarterly, September 1979, on mckinsey.com.
2 James K. Harter et al., The relationship between engagement at work and organizational outcomes, Gallup, February 2013, gallup.com.
3 For more, see Billie Nordmeyer, “Disadvantages of organizations with the matrix approach,” Houston Chronicle, chron.com; and Eric Krell,
“Managing the matrix,” HR Magazine, Society for Human Resource Management, April 1, 2011, shrm.org.
4 Since the impact of these practices transcends geography, industry sector, and company size, we call them power practices. Besides role clarity, personal ownership (another accountability practice), strategic clarity, and competitive insights are also in this select group. Overall, we assessed the 37 management practices through empirically derived survey items that were independent of the outcomes they predicted. We assessed the independent effect of role clarity after statistically controlling for shared or overlapping effects among the 37 practices.
Copyright © 2015 McKinsey & Company. All rights reserved.
5 See Suzanne Heywood, Jessica Spungin, and David Turnbull, “Cracking the complexity code,” McKinsey Quarterly, 2007 Number 2; and Suzanne Heywood and Julian Birkinshaw,
“Putting organizational complexity in its place,” McKinsey Quarterly, May 2010, on mckinsey.com.
6 James B. Avey, Bruce J. Avolio, Craig D. Crossley, and Fred Luthans, “Psychological ownership: Theoretical extensions, measurement, and relation to work outcomes,” Journal of Organizational Behavior, 2009, Volume 30, Number 2, pp. 173–91; doi 10.1002/job.583.
The authors wish to thank Gallup’s Sangeeta
Agrawal, Annamarie Mann, and Susan
Sorenson, as well as McKinsey’s Lili Duan,
Dominik Deja, Dinora Fitzgerald, and Yuan
Tian, for their contributions to this article.
Michael Bazigos, head of organizational
science at McKinsey, is based in McKinsey’s
New York office. Jim Harter is the chief
scientist of workplace management and well-
being for Gallup’s Workplace Management
Practice in Omaha, Nebraska.

14 2015 Number 4
Growth is magic. It makes it easier
to fund new investments, attract great
talent, and acquire assets. But the
environment for growth has been difficult
since 2008, and while there are signs
that the Great Recession is at last reced-
ing, significant challenges remain.
Real-GDP growth in the United States
remains below historical averages;
the economies of most European coun-
tries are still sluggish; and growth in
emerging markets, particularly the BRICS
countries—Brazil, Russia, India, China,
and South Africa—is slowing down.
For more than a decade, we’ve been
building and mining a global-growth
database containing hundreds of the
largest US and European companies.
Recently, we’ve been revisiting some
of the core analyses in the 2008 book,
The Granularity of Growth,1 to see
if the challenging environment of recent
years has shifted the picture of fun-
damentals we painted before the financial
crisis. The answer is no, though the
economic context arguably has
increased the importance of an effective
growth strategy.
Survival rates
Healthy growth boosts corporate survival
rates, which was true in 2008 and
remains true in the United States and in
other developed markets. From 1983
to 2013, for instance, roughly 60 percent
of the nonfinancial companies then in
the S&P 500 were acquired—it’s grow or
go, and they have gone. Consider these
findings over that period:
• Sixty of the 78 S&P 500 companies
that generated top-line growth and
improved or at least maintained their
margins outperformed the S&P 500.
• Companies with deteriorating margins
performed less well, even if these
companies were growing; just 8 out of
30 outperformed the index.
• A higher percentage (56 percent)
of companies that grew slowly, but
also aggressively distributed cash
to shareholders, outperformed the
S&P 500.
In a challenging environment, growth matters more than ever.
Why it’s still a world of ‘grow or go’Yuval Atsmon and Sven Smit

15Leading Edge
Exhibit 1
Not all growth opportunities are created equal, but growth is still a critical driver of performance.
Q4 2015Grow or goExhibit 1 of 2
1 Analysis of S&P 500 companies in 1983, excluding financial-services companies; n = 458.2 TRS for acquired companies calculated up to year of acquisition.3 CAGR = compound annual growth rate; ROIC = return on invested capital; TRS = total returns to shareholders.
30
78
Average TRS,3 %
S&P 500, CAGR3 1983–2013
= 10.3%
12 11
Number of S&P 500 companies,1 1983–2013
Ou
tperf
orm
ed
th
e
S&
P 5
00
Low growth, with high cash-flow distribution
Acquired2
267
Growing with declining margins or low ROIC3
Low growth, low capital returns
–179
57
Growing with steady or improving margins
26
As analysis of these companies’ total
returns to shareholders (TRS) suggests
(Exhibit 1), growth is only a means
to the ultimate end: creating value. Not
all growth opportunities are equal.
Still, there’s no escaping the fact that
growth is a critical driver of performance
as measured by total returns to share-
holders. And TRS underperformers are
far more likely to be acquired.
Growth can be sustained, but that’s not easy
Growth must be actively and continually
renewed. That may seem like common
sense, but sometimes, as Voltaire aptly
noted, “common sense is very rare.”
When we looked at several economic
cycles, we found that very few companies
managed to maintain strong growth

16 2015 Number 4
over time (Exhibit 2). Less than half of
the S&P companies that increased
their revenues faster than GDP from 1983
to 1993 managed to do so from 1993
to 2003. Fewer than 25 percent of the
outperformers of 1983 to 1993 remained
in that group through 2013. Similarly,
in the eurozone, only about one-third of
the nonfinancial companies whose
revenue growth outpaced GDP in 1993
also outpaced it through 2013. None-
theless, some evidence suggests that
enduringly fast growth is not a fluke:
the rate at which long-term survivors in
the United States fell out of the growth-
leader category actually decreased over
the years. While 62 percent of the
companies that outpaced GDP growth
after one decade failed to do so after
two, only 36 percent of the surviving
companies fell away in the decade
that followed.
Rethinking where to compete and which assets to buy
A consistent finding in our research is
that about 75 percent of all growth
is a function of the markets in which
businesses compete—portfolio
momentum—and the acquisitions they
initiate. In other words, just 25 per-
cent of a company’s growth typically
comes at the expense of competitors.
We highlighted this analysis before
the market downturn in 2008, and it has
continued to hold true since then.
Making good choices about where to
compete requires a truly granular
understanding of market dynamics and
of a company’s business performance.
Opportunities will not always come in
traditional or even familiar locales; indeed,
from 2010 to 2025, almost 50 percent
of global GDP growth will take place in
approximately 440 small- and medium-
size cities in emerging markets.2
Nor do overall averages reliably indicate
where the opportunities lie. One com-
pany we know had a three-year growth
rate that averaged 13 percent across
12 key business units. A closer inspec-
tion, however, revealed that their median
growth rate was only 2.5 percent. The
top-performing unit had been growing at
a 62.4 percent clip, but only two others
topped the company-wide average of
13 percent. In fact, five of the business
units were growing at around 1 per-
cent or less over the three-year period,
and the worst performer had been
contracting at a rate of close to 5 percent.
Companies can predict their growth
momentum by identifying the unique
factors that drive their sales and
how these factors connect to broader
economic developments. To that
end, another company we know employs
a robust set of tools that go beyond
reporting where growth exists at present—
it aims to forecast where opportuni-
ties will probably arise over the coming
quarters. This company starts by feeding
its data to econometric models and
time-tested algorithms to predict
its momentum. Disaggregating the data
exposes its market momentum and
financial outcomes in the past. Analyzing
the data to look for patterns helps
to identify shifts, opportunities, and
threats indicating potential opportunities
in the future.

17Leading Edge
You can’t grow without reallocating resources
Even the smartest “where to compete”
strategy will fail to bring results unless the
company that develops it follows through
with the strong resolve that can bring
it to life. This is among the most challeng-
ing aspects of growing in a slow-growth
environment. In such times, companies
don’t have the benefit of a rising tide to
generate surpluses for new initiatives—
pushing into new markets, acquir-
ing existing businesses, or focusing on
promising products or services.
But while it’s easy to agree that growth
is imperative, it’s not always clear
how to achieve it. Managers are often
uncertain whether the answer lies in
expanding beyond the core. When we
surveyed more than 600 executives
from developed markets, fully 75 percent
believed that the share prices of their
organizations would increase over the
next five years if they pursued a new
activity outside their core business. At
the same time, though, more than half of
the respondents assumed that growth
would result from refining the corporate
focus. When we asked them what would
Exhibit 2
Few companies manage to maintain strong growth over time.
Q4 2015Grow or goExhibit 2 of 2
1 Sample = 458 companies; financial-services companies are excluded.
After 1st decade 1983–93
After 2nd decade 1993–2003
After 3rd decade 2003–13
147388 56 36
In 1983
Number of companies1 that remained in S&P 500 and had revenue-growth rates outpacing GDP growth

18 2015 Number 4
happen if their companies divested
a current noncore activity, for example,
54 percent predicted that share prices
would rise over the next five years.
There’s an element of truth to both per-
spectives. Businesses decay, and
yesterday’s core may not be today’s or
tomorrow’s. Getting free from a decay-
ing business is different from investing in
one with a strong potential. But the two
perspectives may become linked through
the reallocation of scarce financial and
human resources. Companies must
often let go of businesses that were once
important and focus on up-and-comers.
But it can be hard to jettison businesses
that management grew up with or to
accept that they can’t be turned around
enough to justify further investments.
Hard but important. A leading global
industrial manufacturer we know
assessed the profitability, growth, market
attractiveness, competitive position-
ing, and other dimensions of the products
and components produced by its
largest business group. This analysis
revealed opportunities to reallocate
tens of millions of dollars to business
areas that could deliver significantly
better returns than existing priorities did.
It also highlighted ways to raise the
bottom line quickly and thus to overcome
initial misgivings that these moves
might sabotage the company’s short-
term performance.
Capital-market pressures and organi-
zational dynamics can make it difficult for
companies to place big, long-term bets
on the growth opportunities of tomorrow.
And the bigger you are, the harder
it is to grow. That said, outperforming
the competition remains possible in
all industries, even in sluggish economic
times. But this takes discipline and a
relentlessly granular analysis, as well as
a commitment to seek the kind of
growth that generates real and sustain-
able value—the most important
objective of all.
1 See Mehrdad Baghai, Sven Smit, and Patrick Viguerie, The Granularity of Growth: How to Identify the Sources of Growth and Drive Enduring Company Performance, Hoboken: Wiley, 2008.
2 See Urban world: Cities and the rise of the consuming class, McKinsey Global Institute, June 2012, on mckinsey.com.
The authors wish to thank McKinsey’s
Kate Armstrong and Ankit Mishra for their
contributions to this article.
Yuval Atsmon is a principal in McKinsey’s
London office, and Sven Smit is a director in
the Amsterdam office.
Copyright © 2015 McKinsey & Company. All rights reserved.

19Leading Edge
The adoption by companies of Enterprise
2.0 tools, a cluster of web-based
social technologies first popularized by
consumers, appears to be leveling
off after a decade of rapid growth. But
new research also suggests that
power users—businesses that deploy
the more advanced technologies
extensively—achieve stronger results
than companies dabbling at the edge.
Our latest analysis
For nearly a decade, we’ve tracked the
adoption and diffusion of social tech-
nologies—wikis, blogs, social technolo-
gies, and the like—through a unique
database of 1,500 companies.1 Two
points stand out in our latest analysis.
1. An S-curve pattern of adoption
Levels of social-technology use, by our
estimates, were low in 2006. By 2008,
two-thirds of the companies in our data-
base had adopted at least one such
technology, though internal diffusion was
narrow: only 20 percent of all employees
had used them, and no single technology
had gone mainstream. Thereafter, our
analysis shows, an S-curve dynamic
(Exhibit 1) spurred the wider diffusion
of these tools, particularly blogs and
social networks.
Strong evidence indicates that imitation
and innovation have been driving
the spread of Enterprise 2.0 tools. Using
modeling techniques, we found that
35 percent of the companies had adopted
social technologies in response to
their adoption by competitors. Copycat
behavior was also responsible for their
diffusion within organizations, though
at a slightly lower rate: 25 percent of all
employee usage. (Teams, for example,
typically tried to burnish their perfor-
mance by imitating early users of social
networks and internal blogs.) As for
innovation, company policies designed
to encourage it sparked the adoption of
wikis. Within enterprises, social networks
help to spread innovative ideas.
According to our analysis, imitation and
innovation spread Enterprise 2.0
social technologies more quickly than
they did nonsocial web-based ones
such as email, as estimated by academic
researchers.2 But their effect seemed
Jacques Bughin
New research shows that power users reap the greatest benefits from social technologies.
Taking the measure of the networked enterprise

20 2015 Number 4
to be weaker than others have found it
to be on the diffusion of consumer
technologies such as Facebook (social
networks) or Netflix (social recommen-
dations).3 One reason for the difference
is that the adoption of Enterprise 2.0
tools requires two things that are not
always available: additional invest-
ment and management discipline to
spur integration.
2. Enterprise 2.0 tools follow power laws
Roughly a fifth of the companies we
studied will account for an estimated
50 percent of all social-technology usage
in 2015. The steepness of the power-
curve distribution diminishes slightly from
2010 to 2015 as more companies
adopted these tools and broadened their
internal deployment (notably of wikis
and social networks). Our surveys also
asked specifically about the perceived
impact of Enterprise 2.0 tools on
revenues and operating costs.4 These
self-reported responses were combined
to calculate a measure of enterprise
value added.
We found that the companies we
identified as power users reported an
incremental 5 percent in value added
in 2010 and of up to 6.5 percent in
2014. These findings were tested with
a traditional measure of statistical
Exhibit 1
Since 2006, corporate use of blogs and social networks grew most rapidly, but growth is flattening.
Q4 2015Enterprise 2.0Exhibit 1 of 2
70
60
50
40
30
20
10
0
2006 (estimated)
Blogs
Video sharing
Prediction markets
Social networks
2007 2008 2009 2010 2011 2012 2013 2014 2015 2016(forecast)
Podcasts
Wikis
Corporate adoption of Enterprise 2.0 technologies,1 %
1 Companies that have ever adopted the social technologies, including those not using them now.
Source: 2007–15 McKinsey survey of 1,500 companies

21Leading Edge
significance which confirmed the cor-
relation. We also used a more sophisti-
cated technique that indicated a
causal relationship between usage and
performance.5 That seems plausible:
power laws should naturally skew perfor-
mance benefits toward heavier users.
It’s interesting that the incremental value
from social technologies appears
to be as large as it was from computers
in the 1990s and, more recently, from
technologies linked to big data.6
In addition, we found significant returns
from the greater diffusion of Enterprise
2.0 within companies. The data allowed
us to estimate the returns for each
technology at several levels of penetration,
from 25 percent to 100 percent. We found
that even incremental use among
employees could significantly increase
the value added for each technology
(Exhibit 2). The highest usage level of
social networks, wikis, and blogs created
a self-reported added value of at least
Exhibit 2
The diffusion of Enterprise 2.0 technologies within companies offers significant returns to scale.
Q4 2015Enterprise 2.0Exhibit 2 of 2
Source: 2007–15 McKinsey survey of 1,500 companies
Increase in value added, %
100%
5.8 3.4 1.7 0.6
5.7 3.1 1.5 0.5
5.0 2.6 1.3 0.4
1.4 1.0 0.6 0.3
0.6 0.4 0.3 0.1
0.6 0.4 0.2 0.1
75% 50% 25%
Wikis
Video sharing
Podcasts
Social networking
Blogs
Prediction markets
Level of penetration

22
5 percent each, but the impact of other
social technologies was much smaller.
We also found returns to scope: using a
second social technology doubles the
value added at most levels of penetration.
New frontiers
Social technologies are approaching
the top of the S-curve. Adoption across
organizations started to taper in 2012,
and internal diffusion flattened out some-
what later. Yet the growing popularity of
mobile and cloud technologies,
as well as the Internet of Things (see
“An executive’s guide to the Internet
of Things,” on page 92), could alter the
pattern in the future. Companies
placing bets should consider how these
technologies will interact with
Enterprise 2.0 tools and potentially
multiply their impact.
Meanwhile, Facebook and other digital
players are developing a new generation
of social tools geared to enterprise use.
These providers, with their huge base of
consumers, may further increase the
adoption and diffusion of Enterprise 2.0
tools among and within companies. They
may also open up new sources of value,
both for heavy users and for companies
still sitting on the sidelines.
Jacques Bughin is a director based in
McKinsey’s Brussels office.
Copyright © 2015 McKinsey & Company. All rights reserved.
2015 Number 4
1 Our database includes 11,000 companies around the world across industries. For this study, we drew on a random sample of 1,500 companies that had completed our Enterprise 2.0 survey for each of the eight years from 2007 to 2014 and had a minimum of 50 data points for each question on adoption and performance to ensure statistical relevance. The research comprised blogs, prediction markets, podcasts,
video sharing, social networking, and wikis. The full range of early results can be found on mckinsey.com. For example, see “Transforming the business through social tools,” January 2015; “Organizing for change through social technologies: McKinsey Global Survey results,” November 2013; and “Evolution of the networked enterprise: McKinsey Global Survey results,” March 2013.
2 Nexhmi Rexha, Bradley Turner, David H. Wong, and Kenneth B. Yap, “Predicting the diffusion pattern of Internet-based communication applications using Bass model parameter estimates for email,” Journal of Internet Business, 2011, Volume 9.
3 Bruno Ribeiro, “Modeling and predicting the growth and death of membership-based websites,” International World Wide Web Conference, Seoul, South Korea, April 2014.
4 Regressions for both the adoption and diffusion tests were statistically significant across variables with high goodness fits. For details, see “Ten years of Enterprise 2.0: The power law of Enterprise 2.0 revisited,” forthcoming later this year in the Encyclopedia of E-Business Development and Management in the Global Economy, IGI Global.
5 We used Granger tests to measure whether a variance in performance is reduced when it depends on a level of technology use. See C. W. J. Granger,
“Investigating causal relations by econometric models and cross-spectral methods,” Econometrica, 1969, Volume 37, Number 3, pp. 424–38.
6 Erik Brynjolfsson and Lorin M. Hitt, “Computing productivity: Firm-level evidence,” Review of Economics and Statistics, 2003, Volume 85, Number 4, pp. 793–808; and Prasanna Tambe, “Big data investment, skills, and firm value,” Management Science, Volume 60, Number 6, pp. 1452–69.

23
65: a magic number for oil in the United States
“As I was making my notes for this morning, I realized I wrote down the number 65 more than once. First, 65 percent of new production that came on in 2014 is profitable at $65. The other thing is that by the end of the year we expect that every dollar spent upstream in the US will be 65 percent more productive than it would have been in 2014.”
— Daniel Yergin, Vice Chairman, IHS
Still a ways off
“China has, or is believed to have, more shale gas than the United States. Three years ago the Chinese were really bullish about developing this gas and meeting a lot of their energy needs domestically, at least on the gas front. That’s still an ambition of the Chinese, but it’s not at all their top ambition….My guess is in 10, 20 years, we’ll definitely see China being a big producer of shale gas, but in the short term I think the Chinese look out, they see that there is this abundance of energy that they can get cheaply from other sources, and they’re contracting it from Russia, from Turkmenistan, from Australia, from Qatar, maybe even from the US. And so they’re going to develop their own industry, but they’re not confident that they’re going to make the institutional
changes quickly enough to meet all their needs, so they’re not putting all their eggs in that basket. And I think that’s because they realized to replicate what has hap- pened in the United States requires massive reforms to their system. For instance, it requires price reforms. They have price controls on natural gas, and they are undertaking some reforms; it will take time to generate effects.”
— Meghan O’Sullivan, Professor, Harvard University Kennedy School
Relearning that what goes up can also come down
“I was talking to a group of one- to three-year employees recently and I said, ‘This was, is, and it always will be, a very volatile business.’ And one of them raised their hand and said, ‘We understand it’s volatile, but we thought volatile always meant up.’ So we’re teaching a whole new generation about commodity cycles and what’s going on in our business. And I think the fact is that at $100 you’re not bullet proof, and at $50 you really shouldn’t jump out of a window. You want to structure your business so that you prepare and that you can run and power through this period of time.” — Greg Garland, Chairman & CEO, Phillips 66
At a recent meeting of Prium, a CEO forum, three energy experts weighed in. Here are some highlights.
Reflections on oil and gas
Short takes
Copyright © 2015 McKinsey & Company. All rights reserved.
Leading Edge 23

24 2015 Number 4
Companies can generally take two
paths to improve their margins: on the
revenue side, through innovation and
brand building to increase prices, and
on the cost side, through operational
efficiencies. We looked at 17 global
leaders in the food and beverage industry
over the period from 2009 to 2013 and
found that operational improvement was
the determining factor in margin growth.
By creating a baseline case that adjusts
for cost-growth momentum, we isolated
the impact of operational improvements
on the cost of goods sold (COGS)
for functions such as manufacturing,
purchasing, and the supply chain.1
We then plotted the performance of
companies against the COGS momen-
tum case and compared that data
point with margin growth. As the exhibit
shows, none of the companies in
the sample improved margins through
revenue growth alone. But those in
the top-right quadrant (for instance, a
beverage business facing shrinking
revenues and fierce competition in
its premium segment) also managed
their bottom-line performance through
operational efficiencies.
By contrast, companies in the bottom-
left quadrant (such as one that increased
its revenues quickly through acquisi-
tions, new products, and new approaches
to distribution but also had subpar
operations) could not offset the higher
costs associated with growth and
therefore found their margins eroding.
Finally, for companies in the bottom-
right quadrant, dramatic revenue losses
were hard to overcome with only
middling operational performance.
When subpar operations threaten margin growth
Consumer packaged goods
Mike Doheny is a principal in McKinsey’s
Atlanta office, and Jan Henrich is a director
in the Chicago office, where Shruti Lal is a
senior expert.
Mike Doheny, Jan Henrich, and Shruti Lal
Consumer-goods companies with weak cost management will struggle to increase the bottom line—no matter how much they grow.
1 We looked at large North American and European companies, with a collective revenue of approximately $200 billion in three categories: packaged foods and snacks, beer, and spirits. For the momentum (baseline) case, we excluded input-price increases in labor and materials and adjusted for scale and regional differences.

25Leading Edge
Copyright © 2015 McKinsey & Company. All rights reserved.
Not one company managed to improve its margins without at least maintaining cost parity with the baseline case.
Q4 2015CPG OPsExhibit 1 of 1
1 With revenues of $2 billion–$13 billion and with compound annual growth rates of 3–14%.2Calculated as weighted average compound annual growth rate for price indices of materials and resources used by
given industry.
Overall gross margin
Growth
Loss
Lagging LeadingEqual
Cost of goods sold (COGS) per unit vs momentum (baseline) case2
Revenues cannot cover cost increases
Operations management cannot cover revenue shrinkage
Growth via operations management and revenues
Packaged foods Beer Spirits
Global leaders in consumer packaged goods,1 2009–13 (n = 17 companies)
Growth via revenue alone

26
Illus
trat
ion
by
Vas
ava

27
28Why agility pays
Michael Bazigos,
Aaron De Smet, and
Chris Gagnon
44Adhocracy for an agile age
Julian Birkinshaw and
Jonas Ridderstråle
36Agility lessons from utilities
Sven Heiligtag,
Dominik Luczak, and
Eckart Windhagen
Most companies are striving to be more nimble—but what’s the prize for agility and the best way to achieve it?

28
Over the past decade, we’ve studied the impact of a wide range of management practices on different dimensions of organizational health.1 This analysis, based on surveys of more than two million respondents at over 1,000 companies, has become a stable baseline for understanding the incremental contributions of specific organizational and leadership characteristics to the health, positive and negative, of the companies in our sample.
We’ve long inquired into the processes and structures that reinforce organizational stability. But from November 2013 to October 2014, we added questions, for the first time, on speed and flexibility. Our goal was to discover how often leaders and managers moved quickly when challenged and how rapidly organizations adjusted to changes and to new ways of doing things.
Taken together, these two sets of questions, old and new, provided the foundation for a simple matrix, comprising a speed axis and a stability axis. The matrix turns out to be a surprisingly strong predictor of organizational health and, ultimately, of perfor- mance. We describe companies that combine speed and stability as agile (see sidebar, “A word on methodology,” on page 34).
No one would expect sluggish companies to thrive. It’s equally reasonable to assume that success achieved through breakneck speed, without stabilizing processes and structures underfoot, will be hard to sustain over the long term. Yet some executives might not only reasonably maintain that speed and stability pull in opposite directions but also hypothesize that they may be negatively correlated. Our latest research, however, confirms that the opposite is true.
Why agility pays
New research shows that the trick for
companies is to combine speed with stability.
Michael Bazigos, Aaron De Smet, and Chris Gagnon
1 We define health as an organization’s ability to align, execute, and renew itself faster than the competition does and thus to sustain exceptional performance over time.

29
It’s significant that all 37 of the management practices we scrutinize, when combined with speed and stability, generated better outcomes in their respective dimensions of health, as well as better overall health. In 4 of the 37—financial management, financial incentives, capturing external ideas, and involving employees in shaping a com- pany’s vision—speed and stability had a particularly striking impact.
Exhibit 1
Few companies excelled in either speed or stability—58 percent hovered near average.
Q4 2015Why agility paysExhibit 1 of 3
1 Scores have been adjusted to remove the portion of OHI variance shared by the factors of speed and stability, to highlight the specific contribution of each factor (speed or stability) along its axis.
2 That is, companies with a mode of operating suited to a very small start-up (not actual start-ups).3 Mean +/− 0.50 standard deviation on each axis of matrix.
Distribution of 161 companies by Organizational Health Index (OHI) scores1
“Start-up”2
8% of sampleAgile
12% of sample
Bureaucratic8% of sample
Trapped14% of sample
Speedindex
Stability index
Weak
Strong
Strong
Average3
Average3
58% of sample

30 2015 Number 4
When we divided the companies in our sample2 among different groups based on their stability and speed scores, things got even more interesting (Exhibit 1):
• Relatively few companies stood out as being especially agile: 58 percent of them had speed scores, stability scores, or both that hovered near average.
• An additional 22 percent of companies in our sample were slow—either slow and unstable, a group we describe as trapped (14 percent), or slow and stable, which we call bureaucratic (the remaining 8 percent). These slow companies generally have poor organizational health: in fact, they had the lowest percentage of companies with top-quartile organizational-health scores in our sample: only 5 percent for trapped companies and 17 percent for bureaucratic ones.
• Twenty percent of the companies in our sample were fast. Eight percent were fast, pure and simple—a group we describe as “start-up.” (These companies were not start-ups, but resembled start-ups in their speed, irrespective of size.) The rest (12 percent), which we call agile, combined speed with stability. All of these fast companies had better organizational-health scores than the other 80 percent did. Agile companies, however, enjoyed a far greater premium: the odds that one of them would rank in the top quartile for organizational health were 70 percent (Exhibit 2). Fewer
“start-ups” enjoyed top-quartile performance, but this quadrant was our only nonagile category in which a majority of the companies (52 percent) had health scores above the median.
Given the striking outperformance of the agile companies, we conducted additional analyses to better understand the character- istics and benefits of agility. For example, we identified the ten management practices that differentiated our sample’s most agile companies from the least agile ones (Exhibit 3). This analysis showed the following:
2 These observations rest on a global study of 161 different companies around the world. In this effort, we used our Organizational Health Index (OHI), including the new matrix, to survey more than 365,000 individual employees.

31
• Both role clarity and operational discipline are highly ranked practices among agile organizations (those in the top quartile of the Agility Index) but not among the least agile ones (the bottom quartile). This is powerful evidence that part of what makes agile companies special is their ability to balance fast action and rapid
Why agility pays
Exhibit 2
Seventy percent of agile companies rank in the top quartile of organizational health.
Q4 2015Why agility paysExhibit 1 of 3
Note: Figures may not sum to 100%, because of rounding.1 Scores have been adjusted to remove the portion of OHI variance shared by the factors of speed and stability,
to highlight the specific contribution of each factor (speed or stability) along its axis.2 Mean +/− 0.50 standard deviation on each axis of matrix; these 93 companies were nearly evenly spread across
quartiles for organizational health.
% of organizations within each category, by quartile, for Organizational Health Index (OHI) scores1 (n = 161)
“Start-up”100% = ~13 companies
Agile100% = ~19 companies
Bureaucratic100% = ~13 companies
Trapped100% = ~23 companies
Speedindex
Stability index
Weak
Strong
Strong
23 70
38 15
23 10
15
5
27
36
32
17
8
17
58
5
Average2 (93 companies)
Top quartile Second quartile Third quartile Bottom quartile

32 2015 Number 4
change, on the one hand, with organizational clarity, stability, and structure, on the other.
• Agile organizations appear to be powerful machines for innovation and learning. Their performance stands out in three of the four management practices—top-down innovation, capturing external ideas, and knowledge sharing—associated with that outcome.
Exhibit 3
Ten management practices differentiated the most from the least agile companies.
Q4 2015Why agility paysExhibit 3 of 3
1 OHI = Organizational Health Index.
Ranking of 161 companies based on OHI scores1
PracticeRank for most agile
Rank for least agile
Difference in rank
Associated Outcome
Accountability
Innovation and learning
Innovation and learning
Capabilities
Culture and climate
Culture and climate
Motivation
Motivation
Coordination and control
Innovation and learning
Role clarity
Top-down innovation
Capturing external ideas
Process-based capabilities
Operationally disciplined
Internally competitive
Meaningful values
Knowledge sharing
Inspirational leaders
People-performance review
1
2
3
4
5
6
7
8
9
10
35
37
27
19
33
29
31
21
32
20
34
35
24
15
28
23
24
13
23
10

33
• Agile companies seem to be strong at motivation. Five practices on the Organizational Health Index promote it, and these companies particularly excel at two of them: meaningful values and inspirational leadership.
The achievements of one of the most agile organizations we studied, a business-process-outsourcing company, emphasize the impor- tance of balancing speed and stability. Financially successful and growing, it has captured market share by rapidly entering new geographical markets. But it is equally adept at exiting markets that contract. In 2014, the company extricated itself from them so effectively that it offset declining revenues by capturing new oper- ational efficiencies in the most profitable markets. In this way, it continued to increase earnings before interest, taxes, depreciation, and amortization (EBITDA).
By way of contrast, let’s look at a bureaucratic organization and at a “start-up” organization we know. The former is a leading professional-services firm specializing in audit, tax, and advisory services. Its processes and structure are stable to a fault. Of course, the industry is highly regulated by many government and judicial entities. But while the firm’s competitors have found ways to act quickly, this one is dogged by an obsession with compliance and a blind determination to minimize litigation risk.
For example, it deliberately avoids storing assessments of its employees—an unusual choice, since most other companies have elaborate talent-management databases. (The compliance officer’s rationale is that a dissatisfied client might start discovery proceed- ings in a future lawsuit and find out that the firm knew about a relevant issue concerning the person at the center of such a case.) A board composed entirely of senior partners, many of them CEO aspirants, exacerbates the firm’s cumbersome decision making. Not surprisingly, it has been trailing its competitors in major performance categories each year.
The “start-up” organization was a joint venture between the divisions of two large technology companies, one North American and one from continental Europe, responsible for a similar range of consumer offerings. The joint venture’s main product line was
Why agility pays

34 2015 Number 4
communications equipment. It celebrated an early win, producing an award-winning product that generated high demand. That device was designed by just one person in record time, an achievement showing exemplary speed and flexibility. But this person’s three func- tional titles—all at the senior level—were far from optimal for the next stage of the joint venture’s development. With little thought given to designing replicable innovation processes, the joint venture found it impossible to develop another winning product. The speed that had been its hallmark began to wane as management focused on the constant renegotiations between the two parties. These unhealthy levels of internal competition caused leaders to lose sight of external threats. The joint venture ended as a one- hit wonder.
We measured speed by asking survey respondents how often they observed their leaders (and, separately, managers) making important decisions quickly and their organizations adjusting rapidly to new ways of doing things. We measured stability by asking respondents how often they observed their organizations implementing clear operating goals and metrics, setting clear standards and objectives for work, establishing structures that promote accountability, designing jobs with clear objectives, and devising processes to document knowledge and ideas.
The percentage of respondents who answered “often” or “almost always” compared to all respondents was calculated for all companies, resulting in the Agility Index.
A word on methodology

35
Our earlier research consistently showed a strong relationship between organizational health and the creation of value: the healthiest companies far outpace those with moderate or low health in long-term total returns to shareholders.3 Our new analyses suggest that speed and stability are significant catalysts for organizational health and performance.
Why agility pays
The authors wish to thank McKinsey’s Wouter Aghina, Lili Duan, Claudio Feser, Dinora Fitzgerald, Bill Schaninger, Rob Theunissen, Kirsten Weerda, Abby Wurts, and Cynthia Zhang for their contributions to this article.
Michael Bazigos, head of organizational science at McKinsey, is based in McKinsey’s New York office; Aaron De Smet is a principal in the Houston office; and Chris Gagnon is a principal in the New Jersey office.
Copyright © 2015 McKinsey & Company. All rights reserved.
3 See Aaron De Smet, Bill Schaninger, and Matthew Smith, “The hidden value of organizational health—and how to capture it,” McKinsey Quarterly, April 2014, mckinsey.com.

3636©
gjp
311/
iSto
ck/G
etty
Imag
es P
lus

37
The utility industry offers a fascinating microcosm of the challenges facing legacy companies today. Its sprawling base of heavy assets amplifies the forces of inertia, while agile-by- nature digital players nip at parts of the value chain once considered immune to competition.
Utilities need a nimble strategic response to both of these challenges. In the core businesses—the generation and distribution of energy—companies scramble to address the uncertainty and volatility mani- fested in sudden policy shifts on nuclear power, skyrocketing demands to ramp up renewable energy, and the possibility of high- stakes (and profit-draining) regulatory changes for carbon prices and often dirty backup power plants. At the same time, new tech- nology is steadily reshaping the energy sector: the falling cost of solar power makes historical scale economies less valuable as distributed generation becomes more feasible. And digitization is disrupting traditional areas of business and enabling new ones (see sidebar, “Digital dilemma,” on page 40).
Utilities aren’t alone, of course, in their need to manage both new horizons and valuable legacies. In the automotive sector, capital-intensive value pools based on production expertise are yielding to service offerings such as car sharing. Digital and communications technologies are propelling innovation in connectivity for vehicles, autonomous driving, in-car “infotainment,” and other areas. In global banking, digitization has reached an inflection point: for example, it is expected to penetrate a third to nearly a half of all
Agility lessons from utilities
The industry faces pressure on its core
businesses and unexpected digital
competition. Evaluating the external
environment and making bets more quickly
will be decisive for incumbents.
Sven Heiligtag, Dominik Luczak, and Eckart Windhagen

38 2015 Number 4
European revenue pools by the decade’s end, according to McKinsey analysis. With legions of digital competitors emerging, traditional banks are under pressure to match disruptive new business models while maintaining valuable customer relationships.
In a companion piece (see “Why agility pays,” on page 28) our colleagues present new research findings suggesting that agility of the type needed by many industries that are now in flux calls for a balance between speed and stability. They argue as well that companies capable of striking this balance are dramatically more likely to show strong performance and organizational health. Independently, we have been working closely with a wide range of utilities to explore how the sector can best adapt to its challenges. What emerges not only demonstrates the wider case for agility but also highlights the opportunities and challenges associated with its pursuit.
This article describes how the more farsighted utility companies are doing things differently in four critical areas: sensing opportunities, seizing them across new and legacy businesses, going beyond tradi- tional corporate boundaries, and creating an organizational design and new ways of working to balance flexibility and stability (see infographic).
Agile sensing
Many utilities have a fortress mentality that inhibits the adoption of new ideas. Their information-seeking infrastructure is often underdeveloped—in an era of information networks and crowd- sourcing, they rely on conventional (and often one-dimensional) ways of gathering market intelligence.
Nimble information gathering produces a better foundation for strategic decisions and a more diversified flow of ideas for innovation. For this reason, first-mover utilities have established outposts and venture-capital (VC) arms in Silicon Valley, where they systematically test their own tech innovations, search for new ideas, and tap information flows from energy start-ups—often through their VC partnerships. (For more on this subject, see
“How should you tap into Silicon Valley?,” on page 111.)

39
As energy moves from a commodity to a product wrapped in infor- mation, building digital skills will be crucial to develop the value of customer data. Ideas for exploiting new digital possibilities may come from diverse and unexpected areas of your company. Utilities and other traditional businesses should therefore follow leading-edge open-innovation approaches, such as competitions and “hackathons” to spark creativity and online platforms to manage the flow of bottom-up ideas across the entire organization.
Seizing opportunities
Fresh ideas are just a starting point; companies must also seize emerging opportunities. As in many sectors, utilities too often ground their decision making and allocation of resources in static finan- cial planning, which is hindered by the cumbersome dynamics of existing businesses and a strong internal focus.
Yet a number of European and US renewable-energy players we know with strong growth pipelines have used financial innovations
Agility lessons from utilities
Q4 2015Agility EPNGExhibit 1 of1
Agile companies focus on three aspects of strategy—and the right organizational design.
• Practice nimble information gathering
• Exploit new digital possibilities, drawing on insights from diverse and unexpected areas of the organization
Mobilize the entire organization
• Engage in open-source collaborations
• Create networks for sharing complementary skills with customers, suppliers, and industry partners
Exploit complementary skills across the value chain
Reallocate resources dynamically
• Scale up initiatives rapidly with a “fail fast, fail small” mind-set
• Employ flexible financing
Combining flexibility and stability in organizational design
Sensing Seizing Bursting company boundaries
40 2015 Number 4
to attract external funds on favorable terms. Some have established so-called growth or return yieldcos, which bundle renewable assets for sale to private and institutional investors, or forged partnerships with investors such as pension funds for specific projects. We’ve also recently seen utilities rethinking their processes for pursuing fast-moving opportunities:
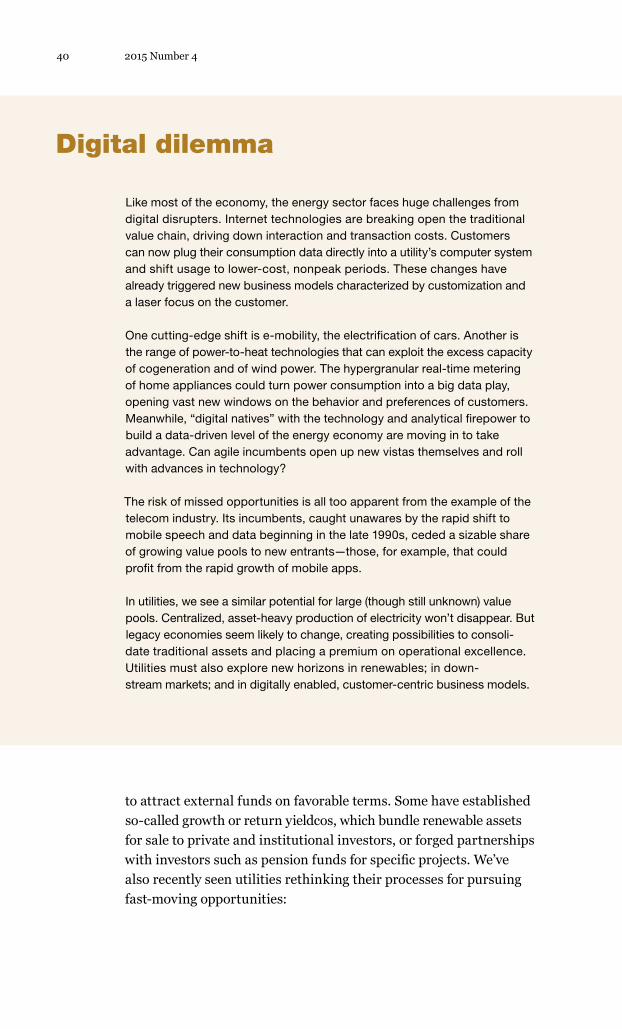
Like most of the economy, the energy sector faces huge challenges from digital disrupters. Internet technologies are breaking open the traditional value chain, driving down interaction and transaction costs. Customers can now plug their consumption data directly into a utility’s computer system and shift usage to lower-cost, nonpeak periods. These changes have already triggered new business models characterized by customization and a laser focus on the customer.
One cutting-edge shift is e-mobility, the electrification of cars. Another is the range of power-to-heat technologies that can exploit the excess capacity of cogeneration and of wind power. The hypergranular real-time metering of home appliances could turn power consumption into a big data play, opening vast new windows on the behavior and preferences of customers. Meanwhile, “digital natives” with the technology and analytical firepower to build a data-driven level of the energy economy are moving in to take advantage. Can agile incumbents open up new vistas themselves and roll with advances in technology?
The risk of missed opportunities is all too apparent from the example of the telecom industry. Its incumbents, caught unawares by the rapid shift to mobile speech and data beginning in the late 1990s, ceded a sizable share of growing value pools to new entrants—those, for example, that could profit from the rapid growth of mobile apps.
In utilities, we see a similar potential for large (though still unknown) value pools. Centralized, asset-heavy production of electricity won’t disappear. But legacy economies seem likely to change, creating possibilities to consoli- date traditional assets and placing a premium on operational excellence. Utilities must also explore new horizons in renewables; in down- stream markets; and in digitally enabled, customer-centric business models.
Digital dilemma
41
● One utility’s standard top-down allocation process was tied to internal incumbent stakeholders, so little was left for innovative projects. This company found that reforming its budgeting process was the best path to a more dynamic allocation of financial resources. It now sets aside part of its budget for new projects and has established a more rigorous funneling process to ensure that the best ideas get funding—and that failed ideas die quickly.
● Another large utility developed a framework for rating projects by risk/return profile. It classified more than 150 of them, identi- fying those that had not only greater risk but also greater returns, which could bolster the company’s performance in slower- growth scenarios. It balanced its overall level of risk by identifying projects, suitable for more robust market conditions, with rela- tively moderate returns and dangers. The company can now respond rapidly to different market developments by shuffling the pipeline, using the rating system for guidance.
● A European utility established a committee, which included an independent, financially savvy challenger, to reframe and debias investment decisions and establish clear criteria for judging priorities. At the operating level, the company shifted to more rapid prototyping: a stage-gate process helped it to make “go/no-go” decisions more quickly and to create “speedboats.” One of them involved a quick, early-stage test of interactive videos for customers whose power consumption had increased significantly and were likely to experience “bill shock.” These explanatory videos helped reduce customer churn by 80 percent from forecast levels. Building on this success, the utility created a range of videos on customer issues posing a risk of churn.
Bursting boundaries
An inward bias frequently makes utility leaders reluctant to share talent and operating knowledge or to look beyond company boundaries. These inhibitions hinder collaboration outside traditional industry areas—a sizable penalty at a time when utilities should partner with players that understand the rising power of customers.
Agility lessons from utilities

42 2015 Number 4
Riding the sector’s wave of change means engaging, in new ways, with a broader ecosystem. Many companies will have to rethink their boundaries and even what business they’re in. Although utility leaders naturally fear the dilution of core strengths, company and sector boundaries have been redrawn in some industries for years, often through digital communications.1 It’s time for incumbent utilities to embrace these changes.
That could take the form of new open-source collaborations, part- nerships, or minority investments with start-ups and innovative niche players to take utilities out of familiar territory and provide a range of possible outcomes rather than contracted goals. For example, one utility we know partnered with a venture-capital fund to get a window on energy-related start-ups and emerging ideas that needed financing. It now gets preferential rights to invest in the VC’s portfolio companies, many built on digital platforms that drive down the cost of transactions with customers.
Utilities should also create networks that help customers, suppliers, and industry partners to share complementary skills. After all, they have not only huge stores of information about market conditions and customer needs and preferences but also big patent portfolios. These are valuable assets to trade for knowledge and the right to collaborate with start-ups.
Balanced organizational design
Underlying all this should be an organizational design that gives fast, agile problem-solving teams a stable foundation of core functions. To understand how this dynamic tension operates, consider the experience of a utility we know that made an early move into large renewable-energy sources.
The company began by setting up a renewables unit that operated independently, with a culture and capabilities akin to those of a start-up. Frontline teams ran hard to navigate an array of regulatory demands, to assess potential project partnerships, and to model tariff regimes for setting prices, but they had difficulty scaling up
1 For an early description of these dynamics, see John Hagel III and Marc Singer, “Unbundling the corporation,” McKinsey Quarterly, June 2000, on mckinsey.com.

43
this business amid so much change. Senior management then decided to assess the renewables value chain to make its risks and volatile returns (compared with those of the legacy business) more transparent.
Leaders addressed these issues in several areas:
Project finance. The company’s central finance unit identified institutional investors that were seeking returns in renewables and would be willing to invest in individual projects.
Risk management and deal making. Specialists helped the new renewables unit to forge partnerships that distributed financial risk and satisfied government demands for local participation and ownership.
Culture. The company started out with a linear, one-project-at-a-time mentality, governed from the center. This has gradually given way to a mind-set that’s comfortable with locally made decisions— the project teams are now fully responsible for managing the perfor- mance of the team members (as well as the project) while the business line focuses on capability building and the codifying and sharing of best practices. Teams attuned to the regulatory and competitive environments therefore have more control, while the company’s core values—technical excellence and high levels of execution—remain the guiding framework.
The hybrid organizational design that’s now emerging isn’t just propelling the renewables business forward; it’s also rubbing off on the core business.
The authors wish to thank McKinsey’s Florian Pollner, Jan Reichwald, Rob Theunissen, Thomas Vahlenkamp, and Kirsten Weerda for their contributions to this article.
Sven Heiligtag is a principal in McKinsey’s Hamburg office, Dominik Luczak is an associate principal in the Munich office, and Eckart Windhagen is a director in the Frankfurt office.
Copyright © 2015 McKinsey & Company. All rights reserved.
Agility lessons from utilities

44 2015 Number 444A
ndre
w B
anne
cker

45
Even as companies from IBM to Caesars Entertainment to American Express succeed through advanced analytics and big data, a less visible side of the preoccupation with information may be having the opposite effect.
Academic studies show that information overload at the individual level leads to distractedness, confusion, and poor decision making.1 These problems beleaguer organizations, too, as we have seen from working with many large companies and through many inter- views and workshops with senior executives in a range of sectors and geographies. Our experience reveals frequent cases of analysis paralysis (gathering more and more information rather than making a decision), endless debate, and a bias toward rational, scientific evidence at the expense of intuition or gut feel. These pathologies can have a deleterious impact on the functioning of companies. They can lessen the quality and speed of decision making and engender a sterile operating environment in which intuitive thinking is quashed. As a result, many companies end up standing still, even as the world around them is speeding up.
Adhocracy for an agile age
The agile organizational model gives primacy
to action while improving the speed and
quality of the decisions that matter most.
Julian Birkinshaw and Jonas Ridderstråle
1 Two influential books that summarize a lot of these studies are Nicholas Carr, The Shallows: What the Internet Is Doing to Our Brains, New York: W.W. Norton, 2010; and Daniel Kahneman, Thinking, Fast and Slow, New York: Farrar, Straus and Giroux, 2011. For a management perspective on information overload, see Derek Dean and Caroline Webb, “Recovering from information overload,” McKinsey Quarterly, January 2011, mckinsey.com.

46 2015 Number 4
In short, the undeniable power of information brings the risk of becoming overly reliant on or even obsessed with it. What’s more, as the information age advances into an increasingly agile one, something important is changing: information is less of a scarce resource as it becomes ubiquitous and search costs plummet. In such a world, as Herbert Simon speculated more than 40 years ago, the scarce resource we have to manage is no longer information— it is attention.2 We believe that large companies today are poor at managing what might be called their return on attention. Particu- larly at the executive level, attention is fragmented; people are distracted; and even when the data are impeccable, decisions can be unduly delayed or just plain bad.
Clearly, not everyone has fallen into this trap. At some companies, executives understand both the power and the limits of information; they know that at times, getting the right answer is imperative but that at other times, being decisive and intuitive, and acting swiftly and experimenting, can work better. As Amazon’s Jeff Bezos says,
“there are decisions that can be made by analysis. These are the best kinds of decisions! They’re fact-based decisions. . . . Unfortunately, there’s this whole other set of decisions that you can’t ultimately boil down to a math problem,”3 such as big bets on new businesses. Some of Bezos’s bets, like the Kindle and Amazon Web Services, have paid off; others, such as Amazon’s mobile phone, have not. But that hasn’t dissuaded the company from continued experimentation and action.
Clearly, there’s a need for balance—for a more nuanced under- standing of when to dig deeper into the data, when to stimulate the kind of extended debate that can help eliminate hasty or biased decision making, and when to act fast.4 In our experience, many companies are more comfortable analyzing and debating than they are acting decisively and intuitively. Their default orientation
2 Herbert Simon originally offered this insight in an article, “Designing organizations for an information-rich world,” in Martin Greenberger (ed.), Computers, Communication, and the Public Interest, Baltimore, MD: Johns Hopkins Press, 1971. See also the academic literature on managing attention—for example, William Ocasio, “Attention to attention,” Organization Science, 2010, Volume 22, Number 5, pp. 1286–96.
3 Alan Deutschman, “Inside the mind of Jeff Bezos,” Fast Company, August 1, 2004, fastcompany.com.
4 For more on cognitive bias and strategic decision making, see Dan Lovallo and Olivier Sibony, “The case for behavioral strategy,” McKinsey Quarterly, March 2010, on mckinsey.com.

47
toward more and better information binds and restricts their ability to move surely and quickly.
The purpose of this article is to suggest a set of capabilities—about how work is organized and people think—to complement the default orientation of companies and to help them manage their return on attention in a more systematic way. These capabilities, we suggest, are part of an organizational model—adhocracy—that differs from the bureaucratic and meritocratic organizational models currently in favor. By clarifying the pros and cons of these three models, and the conditions when each should be used, we aim to provide guidance on how to get the right balance between information and attention.
Three organizational models
The concept of adhocracy was first proposed several decades ago,5 essentially as a flexible and informal alternative to bureaucracy. Here we’re intending to redefine the concept in a way that further distinguishes it not only from bureaucracy but also from the meritocracy model of organization.
Adhocracy’s defining feature is that it privileges decisive (and often intuitive) action rather than formal authority or knowledge. For example, when bureaucracies face a difficult decision, the default is to defer to a senior colleague. In a meritocracy, the default is to collect more data, to debate vigorously, or both. The default in an adhocracy is to experiment—to try a course of action, receive feedback, make changes, and review progress.
Adhocracies are also likely to use more flexible forms of governance, so they can be created and closed down very quickly, according to the nature of the opportunity. By emphasizing experimentation, motivation, and urgency, adhocracy provides a necessary com- plement to progress in advanced analytics and in machine learning, which automates decisions previously made through more
Adhocracy for an agile age
5 The term adhocracy has been used by several illustrious management thinkers, notably Warren Bennis and Philip Slater, The Temporary Society, New York: Harper & Row, 1968; Robert H. Waterman Jr., Adhocracy: The Power to Change, Knoxville, TN: Whittle Direct Books, 1990; and Henry Mintzberg, Mintzberg on Management: Inside Our Strange World of Organizations, New York: Free Press, 1989.

48 2015 Number 4
bureaucratic approaches.6 Specifically, we view adhocracy as an organizational model that maximizes a company’s return on attention, defined as the quantity of focused action taken divided by the time and effort spent analyzing the problem.7
The exhibit summarizes the differences among bureaucracies, merit- ocracies, and adhocracies. The right organizational model, though, often varies according to the business environment in which a company (or a part of it) competes. Bureaucracy still has merit in highly regulated and safety-first environments. Generally speaking, meritocracy works well in, for example, professional-
Exhibit
6 See, for example, Dorian Pyle and Cristina San José, “An executive’s guide to machine learning,” McKinsey Quarterly, June 2015, mckinsey.com.
7 This definition of return on attention builds on the ideas developed during the 1950s and 1960s by James March and Herbert Simon, in which decision makers engage in problemistic search to address opportunities. For instance, see James March and Herbert Simon, Organizations, New York: John Wiley and Sons, 1958; and Richard Cyert and James March (eds.), A Behavioral Theory of the Firm, Englewood Cliffs, NJ: Prentice-Hall, 1963. Note that quality of action is omitted, since rapid experimentation is itself aimed at separating good from bad ideas.
The right organizing model often varies according to the business environment in which a company competes.
Q4 2015AdhocracyExhibit 1 of 2
Source: Julian Birkinshaw and Jonas Ridderstråle
Under which conditions is the model appropriate?
Formal, positional authority is privileged
Individual knowledge is privileged
High levels of technological progress
Mutual adjustment and the free flow of ideas
Via argument and discussion—the power of the idea
By experimentation, trial and error
Stretch goals and recognition for achieving them
Action is privileged
How are activities coordinated?
How are decisions made?
How are people motivated?
Relatively stable environment
Rules and procedures
Through the hierarchy
Extrinsic rewards—pay
Personal mastery, interesting work
BureaucracyThree organizing models
Meritocracy Adhocracy
High levels of unpredictability
Around a problem or opportunity

49
service environments, universities, and science-based companies. Adhocracy is well aligned with the needs of start-ups and com- panies operating in fast-changing environments. The appropriate model also varies by function, with compliance more likely to be a bureaucracy, R&D a meritocracy, and sales an adhocracy.
That said, executives must carefully weigh their overall approach and the extent to which any of these models should hold sway. A professional-service firm, for example, might take an adhocratic approach to organizing its teams so as to exploit opportunities, even as its professional-development and strategic-planning groups use more meritocratic approaches. The selective application of all three models is a core executive task.
In the rest of this article, we describe adhocracy in more depth, explaining its key features and comparing its pros and cons with those of the bureaucratic and meritocratic models.
Three key features of adhocracy
An adhocracy can be readily observed in many organizational settings. For example, if you go to a hospital’s emergency room or an investment bank’s trading floor, the focus on getting things done rapidly is clear. Many companies have used “skunkworks” operations: small project teams that tackle a one-off problem outside the organization’s formal processes at an accelerated pace. Many small companies have adopted the lean start-up model, which emphasizes early prototyping and pivoting rapidly to new business models as circumstances change.8 In all these settings, informed, decisive action matters more than formal authority or knowledge.
Three key features distinguish adhocracy from bureaucracy and meritocracy. Each helps increase a company’s return on attention.
1. Coordinating activities around opportunitiesBureaucracies coordinate their activities through rules, procedures, and routines; meritocracies, through adjustments based on flows
Adhocracy for an agile age
8 See, for example, Eric Ries, The Lean Startup, New York: Crown Business, 2011; and Steve Blank, “Why the lean start-up changes everything,” Harvard Business Review, May 2013, pp. 3–10, hbr.org.

50 2015 Number 4
of information. In an adhocracy, by contrast, coordination coheres around discrete opportunities. For example, many companies have experimented with decentralized business units focused on specific customers or projects. One such company is the UK- based pharmaceutical firm GlaxoSmithKline, which has broken its drug-discovery operation into about 40 units that compete with one another for funding.9
Valve, the gaming company (based in Bellevue, Washington) that’s behind such best sellers as Half-Life and Counter-Strike, has developed an interesting version of adhocracy, though it doesn’t use the term. Valve claims to have no managers. Employees are encouraged to initiate new projects and to choose which of them to work on. Self-selected teams emerge spontaneously where the most exciting opportunities appear to be rather than according to a strategic plan or a product-development road map.10 As employee Michael Abrash noted in his blog, this approach is appropriate because “most of the value [in gaming] is now in the initial creative act. . . .What matters is being first and bootstrapping your product into a positive feedback spiral . . . Hierarchical management doesn’t help with that. . . .”11 Nor, we might add, would the meritocratic model, for speed to market could be sacrificed to disputes and debates.
A key feature of this form of coordination is the disbanding of project teams once activities are complete. Opportunities are ephemeral by nature, and work in an adhocracy should reflect this. Mundipharma is a fast-growing midsize player in the pharmaceutical industry. Traditional pharmaceutical companies make long-term commitments to specific therapy areas. Mundipharma organizes its business units around specific drug opportunities. When a business unit successfully launches a new drug, that unit continues to operate, but it shuts down if the launch fails, and the employees move over to other, more promising areas. As a result, the company is quite
9 The GlaxoSmithKline, Mundipharma, and Costa Coffee examples are based on personal interviews.
10 SAPM: Course Blog, “Management at Valve, as seen through the Valve Employee Handbook,” blog entry for course at School of Informatics, University of Edinburgh, March 24, 2014, blog.inf.ed.ac.uk/sapm.
11 Ramblings in Valve Time, “Valve: How I got here, what it’s like, and what I’m doing,” blog entry by Michael Abrash, April 13, 2012, blogs.valvesoftware.com.

51
market focused—its model resembles that of a venture capitalist: it invests only when it sees a clear pathway toward a commercially viable drug.
In sum, adhocracy’s ability to coordinate workers around tangible external opportunities keeps them closer to the action and less inclined to spend time deliberating. That, in turn, generates a higher return on attention than the traditional coordination processes of bureaucracies or meritocracies do.
2. Making decisions through experimentationIn a bureaucracy, decisions are made through the hierarchy: superiors tell their subordinates what to do, and so on down the line. In a meritocracy, decisions are made through argument and discussion, and everyone is entitled to weigh in with a point of view. The decision-making model in an adhocracy, in contrast, is experimental, which means consciously cutting short internal deliberations and trying things out with customers to gain rapid feedback. While this concept has been around for many years, in our experience most large companies still fall back on formal stage-gate processes and committees rather than risk releasing unproven ideas in the market.
In 2012, Costa Coffee, the world’s second-largest coffee chain, developed an ambitious plan, codenamed Project Marlow, to trans- form its vending-machine offering by creating an entirely new self-serve coffee system that would engage all the five senses of the customer. Project Marlow was agreed on with a handshake in January 2012. The formal kick-off meeting, with 20 people, was held on April 19th. The beta version was delivered, on time and on budget, on September 20th of the same year. “The pace of work was uncomfortably high,” recalled project leader Eric Achtmann,
“the team was small and world-class without exception, and decisions were made on a 24-hour cycle.”
One key principle of Project Marlow was to base decisions on what would move the effort forward. For example, potential partners that required a legal agreement to be in place before starting work were eschewed in favor of those prepared to get going on the basis of a handshake. Project Marlow’s ground rules included rapid decision making (less than 24 hours); a relentless focus on results, not activities; and a preference for asking forgiveness, not permission.
Adhocracy for an agile age

52 2015 Number 4
In one instance, technical problems with a key subsystem threatened to delay the project as a whole, so Achtmann created a parallel team to find a way around them. Decisions were made by the person closest to the action, whose proximity gave the company a better- informed and more instinctive understanding of what had to be done.
“On a project like this,” observed Achtmann, “people are making decisions on the fly, very aggressively. But they are informed deci- sions. The purpose is always just to get to the next stage as effectively as possible; and once there, the next target becomes visible.”
This approach to decision making, by nature, has a strong intui- tive component. While that can entail greater risk and doesn’t work out every time, it helps companies to avoid analysis paralysis—an increasingly costly pitfall in a world with more and more infor- mation but fewer and fewer clear answers. Adhocracy is extremely well suited to help generate such intuitions.
In a meritocracy, employees gather information to persuade their peers. In a bureaucracy, they pass information upward, often in a bid to influence budget allocations. Decisions are passed down from more senior levels, often in the form of budget distributions. Adhocracy keeps decision makers more deeply immersed in the flow of a project or a business rather than more removed from it. For individuals, this place in the flow is a powerful position for inspiring useful intuitions, although such a flow can be generated by various means, including the collective activity that takes place in online communities or internal social-media platforms.12
This experimental approach to decision making has already found its way into some management processes. Agile techniques, for example, have been shown to be a better way of developing software in many settings than the traditional waterfall model.13 But many other management processes—from budgeting to capital allocation to new-product development to project staffing—continue to be managed through the traditional bureaucratic or meritocratic models.
12 See Arne Gast and Raul Lansink, “Digital hives: Creating a surge around change,” McKinsey Quarterly, April 2015, mckinsey.com.
13 See, for example, Jeff Sutherland, Scrum: A revolutionary approach to building teams, beating deadlines, and boosting productivity, London: Random House Business Books, 2014.

53
As the rapid experimentation characteristic of adhocracy gains sway, a company’s return on attention improves. The ratio’s numerator rises with the quantity and quality of quick, experimental decisions, even as less time is spent (or even available for) disputing data or managing upward in a hierarchy.
3. Motivating people through achievement and recognitionGenerally speaking, bureaucracies motivate people primarily through extrinsic rewards—above all, money. Meritocracies and adhocracies both motivate them through achievement and recognition. But meritocracies also emphasize giving people inter- esting work and enabling them to achieve personal mastery in a field of expertise. In adhocracies, motivation centers on giving people a challenge and providing the resources and freedom they need to surmount it.
Consider again Costa Coffee’s Project Marlow: Eric Achtmann deli- berately built an elite team and gave its members an almost impossible deadline. Of course, this doesn’t mean that an adhocracy can’t offer financial rewards as well; the Marlow team members all had a stake in the upside growth of the project—the sale of lots of machines—which ensured an alignment of material interests. Achtmann also spent a good deal of time working on team spirit, coupling demanding standards and grueling milestones with celebratory events every time a milestone was achieved. He also created a plaque that would be permanently mounted inside every production machine, with the names of all 38 key team members who made “an extraordinary and enduring contribution to Marlow, above and beyond the call of duty.”
Valve offers a slightly different proposition to its employees. Chal- lenge is the starting point: the handbook for new employees says,
“Valve has an incredibly unique way of doing things that will make this the greatest professional experience of your life, but it can take some getting used to.” Employees have very high levels of responsibility (“You have the power to green-light projects. You have the power to ship products.”), and the company emphasizes that hiring great colleagues is “your most important role.” There is also a significant extrinsic component to motivation at Valve—one that
Adhocracy for an agile age
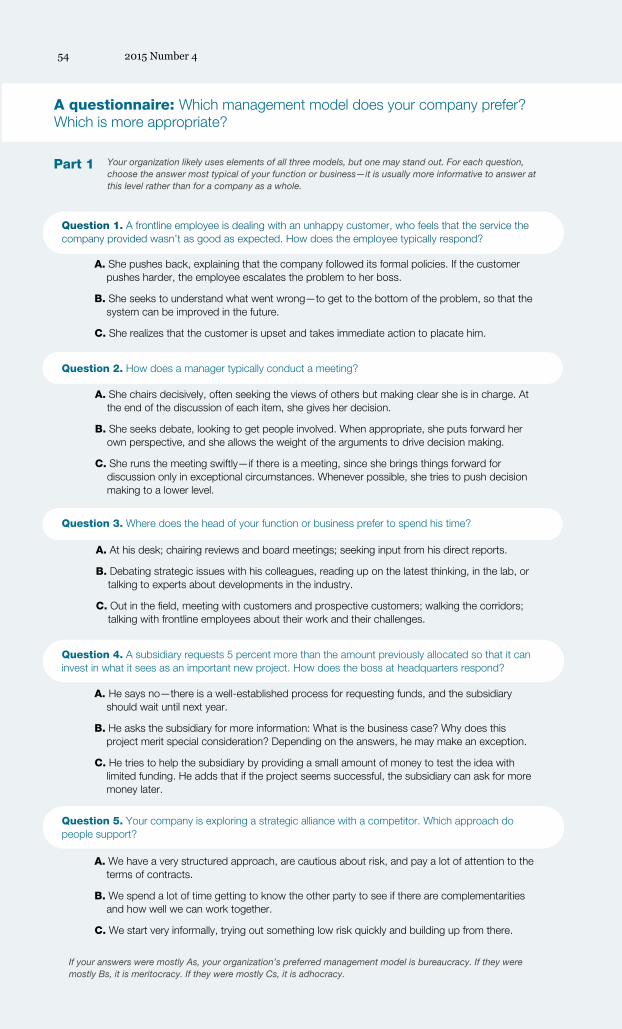
54 2015 Number 4
A questionnaire: Which management model does your company prefer? Which is more appropriate?
Q4 2015AdhocracyExhibit 2a of 2
Your organization likely uses elements of all three models, but one may stand out. For each question, choose the answer most typical of your function or business—it is usually more informative to answer at this level rather than for a company as a whole.
Question 1. A frontline employee is dealing with an unhappy customer, who feels that the service the company provided wasn’t as good as expected. How does the employee typically respond?
Question 1. What is the level of regulation and compliance imposed on your function or business by external factors?
Part 1 Now consider your organization’s external business environment. Again, please focus on the specific function or business you work in rather than the company as a whole. Your answers will indicate which model your organization favors.
Part 2
Q4 2015AdhocracyExhibit 2b of 2
Source: Julian Birkinshaw and Jonas Ridderstråle
A. She pushes back, explaining that the company followed its formal policies. If the customer pushes harder, the employee escalates the problem to her boss.
B. She seeks to understand what went wrong—to get to the bottom of the problem, so that the system can be improved in the future.
C. She realizes that the customer is upset and takes immediate action to placate him.
If your answers were mostly As, your organization’s preferred management model is bureaucracy. If they were mostly Bs, it is meritocracy. If they were mostly Cs, it is adhocracy.
Add up the number of times each model (bureaucracy, meritocracy, or adhocracy) is favored. Your answers probably won’t be entirely consistent, so choose your model according to which is favored more often.
Question 2. How does a manager typically conduct a meeting?
A. She chairs decisively, often seeking the views of others but making clear she is in charge. At the end of the discussion of each item, she gives her decision.
B. She seeks debate, looking to get people involved. When appropriate, she puts forward her own perspective, and she allows the weight of the arguments to drive decision making.
C. She runs the meeting swiftly—if there is a meeting, since she brings things forward for discussion only in exceptional circumstances. Whenever possible, she tries to push decision making to a lower level.
Question 3. Where does the head of your function or business prefer to spend his time?
A. At his desk; chairing reviews and board meetings; seeking input from his direct reports.
B. Debating strategic issues with his colleagues, reading up on the latest thinking, in the lab, or talking to experts about developments in the industry.
C. Out in the field, meeting with customers and prospective customers; walking the corridors; talking with frontline employees about their work and their challenges.
Question 4. A subsidiary requests 5 percent more than the amount previously allocated so that it can invest in what it sees as an important new project. How does the boss at headquarters respond?
A. He says no—there is a well-established process for requesting funds, and the subsidiary should wait until next year.
B. He asks the subsidiary for more information: What is the business case? Why does this project merit special consideration? Depending on the answers, he may make an exception.
C. He tries to help the subsidiary by providing a small amount of money to test the idea with
limited funding. He adds that if the project seems successful, the subsidiary can ask for more money later.
Question 5. Your company is exploring a strategic alliance with a competitor. Which approach do people support?
A. We have a very structured approach, are cautious about risk, and pay a lot of attention to the terms of contracts.
B. We spend a lot of time getting to know the other party to see if there are complementarities and how well we can work together.
C. We start very informally, trying out something low risk quickly and building up from there.
Bureaucracy is favoredMeritocracy or Adhocracy is favored
very low low medium high very high
Question 2. How significant are the downside risks (safety and costs) if something goes wrong?
Bureaucracy is favoredAdhocracy is favored Meritocracy is favored
very low low medium high very high
Question 3. What is the rate of technological or scientific change (or both) in your business area?
Meritocracy is favoredBureaucracy is favored Adhocracy is favored
very low low medium high very high
Adhocracy is favoredBureaucracy is favored Meritocracy is favored
very low low medium high very high
Question 4. To what extent do people in your function or business require advanced professional training to operate effectively?
Adhocracy or Bureaucracy is favored Meritocracy is favored
very low low medium high very high
Question 5. How much volatility exists on the demand side—for example, changing customer needs or emerging new segments?
Meritocracy or Bureaucracy is favored Adhocracy is favored
very low low medium high very high
Question 6. What is your operating environment’s level of ambiguity—a lack of clarity about what course of action is required for your organization to succeed?
Adhocracy is favoredBureaucracy is favored Meritocracy is favored
very low low medium high very high
Question 7. What is the degree of malleability in your operating environment—your ability to influence and shape it in your favor?

55Adhocracy for an agile age
A questionnaire: Which management model does your company prefer? Which is more appropriate?
Q4 2015AdhocracyExhibit 2a of 2
Your organization likely uses elements of all three models, but one may stand out. For each question, choose the answer most typical of your function or business—it is usually more informative to answer at this level rather than for a company as a whole.
Question 1. A frontline employee is dealing with an unhappy customer, who feels that the service the company provided wasn’t as good as expected. How does the employee typically respond?
Question 1. What is the level of regulation and compliance imposed on your function or business by external factors?
Part 1 Now consider your organization’s external business environment. Again, please focus on the specific function or business you work in rather than the company as a whole. Your answers will indicate which model your organization favors.
Part 2
Q4 2015AdhocracyExhibit 2b of 2
Source: Julian Birkinshaw and Jonas Ridderstråle
A. She pushes back, explaining that the company followed its formal policies. If the customer pushes harder, the employee escalates the problem to her boss.
B. She seeks to understand what went wrong—to get to the bottom of the problem, so that the system can be improved in the future.
C. She realizes that the customer is upset and takes immediate action to placate him.
If your answers were mostly As, your organization’s preferred management model is bureaucracy. If they were mostly Bs, it is meritocracy. If they were mostly Cs, it is adhocracy.
Add up the number of times each model (bureaucracy, meritocracy, or adhocracy) is favored. Your answers probably won’t be entirely consistent, so choose your model according to which is favored more often.
Question 2. How does a manager typically conduct a meeting?
A. She chairs decisively, often seeking the views of others but making clear she is in charge. At the end of the discussion of each item, she gives her decision.
B. She seeks debate, looking to get people involved. When appropriate, she puts forward her own perspective, and she allows the weight of the arguments to drive decision making.
C. She runs the meeting swiftly—if there is a meeting, since she brings things forward for discussion only in exceptional circumstances. Whenever possible, she tries to push decision making to a lower level.
Question 3. Where does the head of your function or business prefer to spend his time?
A. At his desk; chairing reviews and board meetings; seeking input from his direct reports.
B. Debating strategic issues with his colleagues, reading up on the latest thinking, in the lab, or talking to experts about developments in the industry.
C. Out in the field, meeting with customers and prospective customers; walking the corridors; talking with frontline employees about their work and their challenges.
Question 4. A subsidiary requests 5 percent more than the amount previously allocated so that it can invest in what it sees as an important new project. How does the boss at headquarters respond?
A. He says no—there is a well-established process for requesting funds, and the subsidiary should wait until next year.
B. He asks the subsidiary for more information: What is the business case? Why does this project merit special consideration? Depending on the answers, he may make an exception.
C. He tries to help the subsidiary by providing a small amount of money to test the idea with
limited funding. He adds that if the project seems successful, the subsidiary can ask for more money later.
Question 5. Your company is exploring a strategic alliance with a competitor. Which approach do people support?
A. We have a very structured approach, are cautious about risk, and pay a lot of attention to the terms of contracts.
B. We spend a lot of time getting to know the other party to see if there are complementarities and how well we can work together.
C. We start very informally, trying out something low risk quickly and building up from there.
Bureaucracy is favoredMeritocracy or Adhocracy is favored
very low low medium high very high
Question 2. How significant are the downside risks (safety and costs) if something goes wrong?
Bureaucracy is favoredAdhocracy is favored Meritocracy is favored
very low low medium high very high
Question 3. What is the rate of technological or scientific change (or both) in your business area?
Meritocracy is favoredBureaucracy is favored Adhocracy is favored
very low low medium high very high
Adhocracy is favoredBureaucracy is favored Meritocracy is favored
very low low medium high very high
Question 4. To what extent do people in your function or business require advanced professional training to operate effectively?
Adhocracy or Bureaucracy is favored Meritocracy is favored
very low low medium high very high
Question 5. How much volatility exists on the demand side—for example, changing customer needs or emerging new segments?
Meritocracy or Bureaucracy is favored Adhocracy is favored
very low low medium high very high
Question 6. What is your operating environment’s level of ambiguity—a lack of clarity about what course of action is required for your organization to succeed?
Adhocracy is favoredBureaucracy is favored Meritocracy is favored
very low low medium high very high
Question 7. What is the degree of malleability in your operating environment—your ability to influence and shape it in your favor?

56 2015 Number 4
would not be out of place at GE: employees rate their peers, and a forced-ranking system gears discretionary pay toward those who contribute the most. Valve is a competitive and challenging place to work, and its founders believe that this makes it attractive to the most talented game developers.
Again, this approach to motivation helps overcome analysis paralysis and increases a company’s return on attention. The heroes are the people who make something happen—for example, completing a pilot project quickly and ahead of budget—rather than those who come up with the cleverest ideas (which would be celebrated in a meritocracy) or who oversee the biggest budgets (the mark of respect in a bureaucracy).
Choosing the right model
So which is the right model for your company? It is worth noting, first of all, that bureaucracy, meritocracy, and adhocracy are all about the relative emphasis on formal authority, knowledge, and action. When we ask executives which model they prefer, they typically say they want the benefits of all three: people who bring their knowledge and formal authority to bear, take decisive action, and act intuitively when necessary.
But we would argue that this is a hedge. Companies can’t put equal emphasis on all three dimensions at once; they have to make it clear which one takes precedence, at least in specific business environments and units. For example, if your company aspires to be focused and action oriented but continues to operate on traditional bureaucratic principles, don’t be surprised when things move more slowly than you expect. To get a better sense of your current overall organizing model—and which parts of your organization might be best suited for bureaucracy, meritocracy, or adhocracy—think about the descriptions in the exhibit and try out the simple diagnostic on page 54.

57
The demands of the business world often change more quickly than the organizations where we work. Many companies are still moving from the traditional bureaucratic model, which has been around for 100 years, toward a more meritocratic one built around the primacy of information and knowledge. But our analysis suggests that for many companies, this isn’t enough. Meritocracy has its benefits, but we believe adhocracy will become increasingly important in the decades ahead. By understanding the benefits of all three management models, you will have a better chance of creating a style of working that positions your organization for future success.
Adhocracy for an agile age
Julian Birkinshaw is a professor of strategy and entrepreneurship at London Business School, and Jonas Ridderstråle is an author, most recently of Re-energizing the Corporation: How Leaders Make Change Happen (Wiley, 2008).
Copyright © 2015 McKinsey & Company. All rights reserved.

58©
pra
nodh
m/iS
tock
/Get
ty Im
ages
Plu
s

59
Taking China’s pulse
60Five myths about the Chinese economy
Jonathan Woetzel
82How China country heads are coping
Wouter Baan and
Christopher Thomas
74Five keys to connecting with China’s wired consumers
Cindy Chiu,
Todd Guild, and
Gordon Orr
In 2015, China has had to navigate some unusually choppy economic and financial rapids. McKinsey authors assess the outlook.
66Gauging the strength of Chinese innovation
Erik Roth, Jeongmin
Seong, and
Jonathan Woetzel

60
A widely held Western view of China is that its stunning economic success contains the seeds of imminent collapse. This is a kind of anchoring bias,1 which colors academic and think-tank views of the country, as well as stories in the media. In this analysis, China appears to have an economy unlike others—the normal rules of development haven’t been followed, and behavior is irrational at best, criminal at worst.
There’s no question, of course, that China’s slowdown is both real and important for the global economy. But news events like this year’s stock-market plunge and the yuan’s devaluation versus the dollar reinforce the refrain, among a chorus of China watchers, that the country’s long flirtation with disaster has finally ended, as predicted, in tears. Meanwhile, Chinese officials, worried about political blowback, are said to ignore advice from outside experts on heading off further turmoil and to be paranoid about criticism.
My experience working and living in China for the past three decades suggests that this one-dimensional view is far from reality. Doubts about China’s future regularly ebb and flow. In what follows, I challenge five common assumptions.
1. China has been faking it
A key tenet of the China-meltdown thesis is that the country has simply not established the basis for a sustainable economy. It is said
Five myths about the Chinese economy
Predictions of deepening economic woes
are plentiful. Here are five arguments against
the pessimism.
Jonathan Woetzel
1 See Charles Roxburgh, “Hidden flaws in strategy,” McKinsey Quarterly, May 2003, mckinsey.com.

61
to lack a competitive, dynamic private-enterprise structure and to have captured most of the value possible from cheap labor and heavy foreign investment already.
Clearly, China lacks some elements of a modern market economy— for example, the legal system falls short of the support for property rights in advanced countries.2 Nonetheless, as China-economy scholar Nicholas Lardy recently pointed out, the private sector is vibrant and tracing an upward trend line. The share of state- owned enterprises in industrial output continues to drop steadily, from 78 percent in 1978 to 26 percent in 2011.3 Private industry far outstrips the value added in the state sector, and lending to private players is growing rapidly.
In fact, much of China’s development model mirrors that of other industrializing and urbanizing economies in Asia and elsewhere. The high savings rate, initial investments in heavy industries and manufacturing, and efforts to guide and stabilize a rapidly indus- trializing and urbanizing economy, for example, resemble the policies that Japan, South Korea, and Taiwan followed at a similar stage of their development. This investment-led model can lead to its own problems, as Japan’s experience over the past 20 years indicates. Still, a willingness to intervene pragmatically in the market doesn’t imply backwardness or economic management that’s heedless of its impact on neighboring economies and global partners.
Furthermore, China’s reform initiatives4 since 2013 are direct responses to the structural changes in the economy. The new policies aim to spur higher-value exports, to target vibrant emerging markets, to open many sectors for private investors, and to promote consumption-led growth rooted in rising middle-class incomes. Today, consumption continues to go up faster than GDP, and investors have recently piled into sectors from water treatment to e-commerce. These reforms are continuing at the same time China is stepping
2 See Francesco Di Lorenzo, 2014 International Property Rights Index, Property Rights Alliance, 2014, internationalpropertyrightsindex.org. China ranked 46th among 97 nations. The index has three components: the legal and political environment, rights to physical property, and intellectual-property rights.
3 Nicholas R. Lardy, Markets over Mao: The Rise of Private Business in China, Washington, DC: Peterson Institute for International Economics, 2014.
4 Those emerging from the Third Plenary Session of the 18th National Congress of the Communist Party of China.

62 2015 Number 4
up its anticorruption drive, and the government hasn’t resorted to massive investment spending (as it did in 2008). That shows just how important the reforms are.
2. China’s economy lacks the capacity to innovate
Think tanks, academics, and journalists alike maintain that China has, at best, a weak capacity to innovate—the lifeblood of a modern economy. They usually argue as well that the educational system stomps out creativity.
My work with multinationals keen on partnering with innovative Chinese companies suggests that there’s no shortage of local players with a strong creative streak. A recent McKinsey Global Institute (MGI) study describes areas where innovation is flourishing here.5 Process innovations are propelling competitive advantage and growth for many manufacturers. Innovation is at the heart of the success of companies in sectors adapting to fast-changing con- sumer needs, so digital leaders like Alibaba (e-commerce) and Xiaomi (smartphones) are emerging as top global contenders. Heavy investment in R&D—China ranks number two globally in overall spending—and over a million science and engineering graduates a year are helping to establish important beachheads in science- and engineering-based innovation. (See “Gauging the strength of Chinese innovation,” on page 66.)
3. China’s environmental degradation is at the point of no return
To believe this, you need to think that the Chinese are content with a dirty environment and lack the financial muscle to clean things up. OK, they got things wrong in the first place, but so did most countries moving from an agrarian to an industrial economy.
In fact, a lot that’s good is happening. Start with social activism. A documentary on China’s serious air-pollution problems (Under the
5 To download the full MGI report, The China effect on global innovation, see “Gauging the strength of Chinese innovation,” October 2015, on mckinsey.com.

63
Dome), by Chai Jing—a former journalist at China Central Television (CCTV), the most important state-owned broadcaster—was viewed over 150 million times in the three days after it was posted online, in March 2015. True, the 140-minute video, which sharply criticizes regulators, state-owned energy companies, and steel and coal producers, was ultimately removed. But the People’s Daily interviewed Chai Jing, and she was praised by a top environmental minister.
China is spending heavily on abatement efforts, as well. The nation’s Airborne Pollution Prevention and Control Action Plan, mandating reductions in coal use and emissions, has earmarked an estimated $277 billion to target regions with the heaviest pollution.6 That’s just one of several policy efforts to limit coal’s dominance in the economy and to encourage cleaner energy supplies. My interactions with leaders of Chinese cities have shown me that many of them incorporate strict environmental targets into their economic master plans.
4. Unproductive investment and rising debt fuels China’s rapid growth
To believe this, you would have to think, as many skeptics do, that the Chinese economy is fundamentally driven by overbuilding—too many roads, bridges, and buildings.7 In fact, as one economist has noted, this is a misperception created by the fact that the country is just very big. An eye-popping statistic is illustrative: in 2013, China consumed 25 times more cement than the US economy did, on average, from 1985 to 2010. But adjusted for per-capita consumption and global construction patterns, China’s use is pretty much in line with that of South Korea and Taiwan during their economic booms.8
China’s rising debt, of course, continues to raise alarms. In fact, rather than deleveraging since the onset of the financial crisis, China has seen its total debt quadruple, to $28.2 trillion last year, a recent
Five myths about the Chinese economy
6 Sonal Patel, “China’s war on air pollution,” Power Magazine, November 1, 2014, powermag.com.
7 For a view on overcapacity in the power industry, see Li Wei, “The Chinese economy needs to break out of the overcapacity trap,” CKGSB Knowledge, July 13, 2015, knowledge.ckgsb.edu.cn.
8 Jonathan Anderson, “China, cement, and the art of meaningless statistics,” Emerging Advisors Group, December 23, 2014.

64 2015 Number 4
MGI study found.9 Nearly half of the debt is directly or indirectly related to real estate (prices have risen by 60 percent since 2008). Local governments too have borrowed heavily in their rush to finance major infrastructure projects.
While the borrowing does border on recklessness, China’s govern- ment has plenty of financial capacity to weather a crisis. According to MGI research, state debt hovers at only 55 percent of GDP, substantially lower than it is in much of the West. A recent analysis of China’s financial sector shows that even in the worst case—if credit write-offs reached unprecedented levels—only a fairly narrow segment of Chinese financial institutions would endure severe damage. And while growth would surely slow, in all likelihood the overall economy wouldn’t seize up.10
Finally, the stock-market slide is less significant than the recent global hysteria suggests. The government holds 60 percent of the market cap of Chinese companies. Moreover, the stock market represents only a small portion of their capital funding. And remember, it went up by 150 percent before coming down by 40.
Rumors drive the volatility on China’s stock exchange, often in anticipation of trading by state entities. The upshot is that the direct impact on the real economy will most likely be some reduction in consumer demand from people who have lost money trading in shares.
5. Social inequities and disenfranchised people threaten stability
On this one, I agree with the bears, but it’s not just China that must worry about this problem. While economic growth has benefited the vast majority of the population, the gap between the countryside and the cities is increasing as urban wealth accelerates. There’s also a widening breach within urban areas—the rich are growing richer.11
9 For more, see Debt and (not much) deleveraging, McKinsey Global Institute, February 2015, on mckinsey.com.
10 See Jonathan Anderson, “Financial armageddon, China-style (2015),” Emerging Advisors Group, April 2, 2015.
11 China’s Gini coefficient, a measure of income disparity, has risen steadily and now stands at 47.

65
Jonathan Woetzel is a director in McKinsey’s Shanghai office, as well as a director of the McKinsey Global Institute. A version of this article was previously published on Forbes.com, on October 5, 2015.
Copyright © 2015 McKinsey & Company. All rights reserved.
Urban inequality and a lack of access to education and healthcare are not problems unique to China. People here and in the West may find fruitful opportunities to exchange ideas because the pattern across Western economies is similar. Leaders of the central gov- ernment have suggested policies to improve income distribution and to create a fair and sustainable social-security system, though implementation remains a matter for localities and varies greatly among them.
In short, China’s growth is slower, but weighing the evidence I have seen, the sky isn’t falling. Adjustment and reform are the hallmarks of a stable and responsive economy—particularly in volatile times.
Five myths about the Chinese economy

66
1 To download the full MGI report, The China effect on global innovation, see “Gauging the strength of Chinese innovation,” October 2015, on mckinsey.com.
2 The estimated increase in total factor productivity is $3 trillion to $5 trillion. We use this figure as a proxy for innovation’s macroeconomic impact. Total factor productivity is growth that doesn’t flow from factors of production such as labor and capital investment. In our research, we found that about 40 percent of the increase in total factor productivity could come from innovations in higher-level manufacturing and services enabled by the Internet. Other innovations could come from catch-up activities that bring Chinese enterprises up to global best practices as well as breakthroughs yet to emerge.
The events of 2015 have shown that China is passing through a challenging transition: the labor-force expansion and surging investment that propelled three decades of growth are now weak- ening. This is a natural stage in the country’s economic develop- ment. Yet it raises questions such as how drastically the expansion of GDP will slow down and whether the country can tap new sources of growth.
New research1 by the McKinsey Global Institute (MGI) suggests that to realize consensus growth forecasts—5.5 to 6.5 percent a year— during the coming decade, China must generate two to three percent- age points of annual GDP growth through innovation, broadly defined. If it does, innovation could contribute an estimated $3 tril- lion to $5 trillion a year to GDP by 2025.2 China will have evolved from an “innovation sponge,” absorbing and adapting existing tech- nology and knowledge from around the world, into a global innovation leader. Our analysis suggests that this transformation is possible, though far from inevitable.
Gauging the strength of Chinese innovation
China does well in customer- and manufacturing-
oriented innovation, though not in the more
advanced varieties. But the country will need
them to sustain growth.
Erik Roth, Jeongmin Seong, and Jonathan Woetzel

67
To date, when we have evaluated how well Chinese companies commercialize new ideas and use them to raise market share and profits and to compete around the world, the picture has been decidedly mixed. China has become a strong innovator in areas such as consumer electronics and construction equipment. Yet in others—creating new drugs or designing automobile engines, for example—the country still isn’t globally competitive. That’s true even though every year it spends more than $200 billion on research (second only to the United States), turns out close to 30,000 PhDs in science and engineering, and leads the world in patent applications (more than 820,000 in 2013).
When we look ahead, though, we see broad swaths of opportunity. Our analysis suggests that by 2025, such new innovation oppor- tunities could contribute $1.0 trillion to $2.2 trillion a year to the Chinese economy—or equivalent to up to 24 percent of total GDP growth. To achieve this goal, China must continue to transform the manufacturing sector, particularly through digitization, and the service sector, through rising connectivity and Internet enablement. Additional productivity gains would come from progress in science- and engineering-based innovation and improvements in the operations of companies as they adopt modern business methods.
To develop a clearer view of this potential, we identified four innova- tion archetypes: customer focused, efficiency driven, engineer- ing based, and science based. We then compared the actual global revenues of individual industries with what we would expect them to generate given China’s share of global GDP (12 percent in 2013). As the exhibit on the next page shows, Chinese companies that rely on customer-focused and efficiency-driven innovation—in industries such as household appliances, Internet software and services, solar panels, and construction machinery—perform relatively well.
However, Chinese companies are not yet global leaders in any of the science-based industries (such as branded pharmaceuticals) that we analyzed. In engineering-based industries, the results are inconsistent: China excels in high-speed trains but gets less than its GDP-based share from auto manufacturing. In this article, we’ll describe the state of play and the outlook in these four categories, starting with the two outperformers.

68 2015 Number 4
1. Customer-focused innovation: The Chinese commercialization machine
China benefits from the sheer size of its consumer market, which helps companies to commercialize new ideas quickly and on a large scale; even a relatively small market like online gaming is bigger than the auto industry in Turkey or Thailand. Chinese companies have learned how to read the requirements of their rapidly urbaniz- ing country and to scale up new products and services quickly to meet them.
Manufacturers of appliances and other household goods dominated the first wave of customer-focused innovators in China. Their innovations were “good enough” products such as refrigerators and TV sets. But these offerings no longer suffice to gain a growing share of consumers. Companies like smartphone manufacturer Xiaomi are responding with cheaper and better products designed to offer hardware features as good as those from global brands
Exhibit
Chinese companies in industries that rely on efficiency-driven innovation perform well, science-based companies less so.
Q4 2015China InnovationExhibit 1 of 1
Chinese industries: actual vs expected performance in innovation (based on China’s share of global GDP1 ), number of industries = 31
Above fair share
Below fair share
Customer focused
Four innovation archetypes
Efficiency driven Engineering based Science based
9
3
3
4 4
3
5
1 China’s share was 12% in 2013.
Source: IHS Global Insight; International Data Corporation; annual reports; McKinsey Global Institute analysis

69Gauging the strength of Chinese innovation
but priced for the Chinese market. Like other customer-focused innovators in China, Xiaomi also uses the massive consumer market as a collaborator, rapidly refining its offerings through online feedback. Internet service providers are another hotbed of customer-focused innovation. Alibaba, Baidu, and Tencent have become global leaders in online services, largely thanks to their success in the enormous Chinese market. (See “Five keys to connect- ing with China’s wired consumers,” on page 74.)
Customer-focused innovation could reshape large swaths of China’s service sector, where productivity lags behind that of its counter- parts in developed economies. The government already is pushing to modernize traditional businesses through its Internet Plus initia- tive, announced in early 2015. Innovations are needed to expand access to services (for example, remotely monitoring the health of rural patients), to improve the quality of offerings (greater choice and customization in financial and educational products), and to optimize operations (crowd-sourced logistics). Chinese companies will also have opportunities to use their skills in customer-focused innovation to take a lead in selling to other emerging markets.
2. Efficiency-driven innovation: The ecosystem advantage
In manufacturing, China’s extensive ecosystem has provided an unmatched environment for efficiency-driven innovation. The country has the world’s largest and most highly concentrated supplier base, a massive manufacturing workforce, and a modern logistics infrastructure. These advantages give Chinese manufacturers a lead in some important knowledge-based manufacturing categories, such as electrical equipment, construction equipment, and solar panels.
Today, Chinese companies improve their efficiency with a variety of cutting-edge approaches, including agile manufacturing, modular design, and flexible automation. The apparel manufacturer Everstar, for example, uses automated equipment and online design and e-commerce systems that help consumers to customize designs for clothing and receive finished goods within 72 hours. China is also pioneering the use of open manufacturing platforms.

70 2015 Number 4
The challenges are mounting, however. As wages rise, the country becomes less competitive for the most labor-intensive work. At the same time, a worldwide transition is under way toward a new kind of manufacturing, sometimes called Industry 4.0: a much more intense digital linkage of manufacturing components, processes, and logistics. As a result, Chinese companies will face pressure to improve their performance in utilizing assets, matching supply with demand, and controlling quality. Success will depend on how well China can exploit the scale of today’s manufacturing ecosystems and clusters to extend their benefits beyond individual factories through digitally linked networks.
Some efforts are under way to mobilize rapid, flexible manufactur- ing. In Guangdong province, for example, manufacturers have set up joint platforms to share the benefits of R&D and operations among companies in the same clusters. Elsewhere, companies are looking at ways to mass-customize products by combining flex- ible manufacturing with the aggregation of a huge Internet consumer base. New manufacturing gains may also emerge from the aggressive use of robots, which could make China’s huge pool of semiskilled factory workers more effective.
Entrepreneurs are poised to play a bigger role. In Shenzhen, a rich ecosystem of component suppliers, design services, business incubators, and outsourced assembly capacity has helped start-ups prototype products and scale up global manufacturing businesses quickly.
3. Engineering-based innovation in ‘learning industries’
China has had mixed success with engineering-based innovation. The best performers are found in Chinese markets where motivated domestic industries are nurtured by national and local govern- ments that create local demand, push for innovation, and facilitate the transfer of knowledge from foreign players. China has used this formula successfully in high-speed rail (Chinese companies have a 41 percent share of the global railroad-equipment revenues, according to McKinsey estimates), wind power, and telecommunications equipment.

71Gauging the strength of Chinese innovation
In 2008, the Ministry of Railways launched a major program to develop a new generation of high-speed trains—a top-down, nation- wide effort that has been China’s equivalent of the Apollo space program in scale and complexity. We estimate that the country has accounted for 86 percent of global growth in this market since then. Using technology transfers from overseas partners as a knowl- edge base, Chinese companies tailor their offerings to local requirements, such as terrain and temperature conditions, through incremental innovation.
Learning and innovation have been slower to come in automotive manufacturing. To date, most domestic Chinese carmakers have relied on platforms from their global partners or on designs from outside firms to bring products to market quickly. Thanks to exploding domestic demand and strong profit streams from joint ventures, they have felt little pressure to innovate.
Deregulation, a rapid increase in China’s base of engineering talent, and continued high levels of government investment promise to make engineering-based companies more motivated and effective innovators in the future. In some sectors, such as nuclear power, explicit state support will continue to be critical. China has an ambi- tious government plan to build nuclear plants resulting in a total installed capacity of 58 gigawatts by 2020, which can support its goal of obtaining 20 percent of its energy from non–fossil fuel sources by 2030.

72 2015 Number 4
In other industries, such as medical equipment, the private sector will drive innovation. Mindray, United Imaging Healthcare, and other smaller new Chinese players will continue to make inroads in market categories (for instance, CT scanners and MRI machines) that foreign suppliers now dominate. Government programs to sub- sidize purchases of Chinese-made equipment by the country’s hospitals are providing a boost even as a new generation of medical entrepreneurs draws from global knowledge and partnerships.
4. Science-based innovation: Novel Chinese approaches
A massive government push to raise R&D spending, train more scientists, and file more patents has yet to give China a lead in science-based innovation. The slow progress has a number of explanations—not least that this type of work takes a long time to pay off and requires an effective regulator to protect intellectual property. Huge investments by government and the private sector to shepherd projects from the lab to commercial deployment are needed, as well. What’s more, despite the large number of Chinese students trained in scientific and technical fields, companies struggle to find capable talent.
The government is addressing some of these obstacles. For example, recently launched reforms to the drug-review process could reduce the time to get a new drug to patients by two or more years. Efforts such as the Thousand Talents program bring overseas Chinese to the country to launch their own companies and work in scientific organizations and universities.
Even as these reforms play out, Chinese innovators are adopting novel approaches—for instance, using the country’s massive market size and huge pool of low-cost researchers to industrialize and speed up experimentation and data collection. One such innovator, BeiGene, gained ground in the biotech industry by developing drugs to treat cancers and other diseases. The company has accelerated the drug-discovery process by deploying a large-scale drug-testing team, testing compounds on human tissue (such as cancerous tumor samples) during the preclinical phase to get

73
The authors wish to thank McKinsey’s Jason Lee for his contributions to this article.
Erik Roth is a director in McKinsey’s Shanghai office; Jeongmin Seong is a senior fellow of the McKinsey Global Institute; and Jonathan Woetzel is a director in the Shanghai office, as well as a director of the McKinsey Global Institute.
Copyright © 2015 McKinsey & Company. All rights reserved.
early indications of issues that might arise in human testing, and capitalizing on access to China’s large pool of patients. In genomics research, another company, BGI, is deploying massive scale (2,000 PhDs and more than 200 gene-sequencing machines) to power its way through biotech problems.
The extent and speed of China’s advances in innovation will have significant implications for the country’s growth and competitive- ness and for the types of jobs, products, and services available to the Chinese people. They will also have powerful consequences for multinationals (competing at home and abroad with Chinese companies), some of which are now using China as an R&D base for global innovation. Fortunately, that isn’t a zero-sum game: a more innovative China ought to be good for a global economy that seeks new sources of growth.
Gauging the strength of Chinese innovation

74
China’s annual online-retail sales passed those of the United States in 2013. By 2018, they are estimated to reach about $610 billion—likely passing Europe and the United States combined (exhibit). Yet though the market is vast, succeeding in China is far from easy. While select leading Western companies have captured some of the country’s explosive e-commerce growth, many make basic mistakes, from equating China’s e-commerce leaders with US companies (“Alibaba is China’s Amazon!”) to assuming selling and distribution practices from home markets are transferable. The reality is that China is simply different. As a point of comparison for consumer and retail companies, we regard the combination of the size of the prize and the degree of change needed to succeed as roughly analogous to what consumer-packaged-goods companies experienced in the late 1980s when Walmart changed the consumer game.
Understanding China’s e-commerce market starts with knowing its online consumers and companies. The country’s three most promi- nent players are Baidu, the largest search engine; Alibaba, proprietor of the largest online shopping mall; and Tencent, the leader in gaming and social networking (see sidebar, “Understanding BAT,”
Five keys to connecting with China’s wired consumers
China is the world’s largest and most dynamic
e-commerce market. But being successful
requires understanding and embracing its
unique digital landscape and consumers.
Cindy Chiu, Todd Guild, and Gordon Orr

75
on page 77). While each may appear as though it plays in a different arena (search, e-commerce, and social, respectively), in reality, the companies compete more directly with one another. Each is a crucial partner, capable of connecting brands with hundreds of millions of new customers, and each has a role throughout the online consumer’s decision journey: generating demand, finding and comparing local merchants, moving customers from consideration to making a purchase, paying, and then reviewing or telling a friend and building loyalty.
But it’s not enough to understand these three digital powerhouses. More than a dozen multibillion-dollar players shape parts of China’s digital marketplaces, ranging from JD.com (a cross-category e-tailer) to VIP.com (a fashion-focused discount e-tailer). Engag- ing with just one of these important platforms isn’t enough—they
Exhibit
China’s e-commerce market is likely to exceed that of Europe and the United States combined within three years.
Q4 2015China wired consumersExhibit 1 of 1
Source: eMarketer; Forrester Research; iResearch Services; McKinsey analysis
Online-retail gross merchandise value, $ billion
United StatesEurope China
226
259
380
146166
230210
298
610
2012 2013 2018 (estimated)

76 2015 Number 4
are interrelated, and you need to work with several. Finally, in our experience, mastering the country’s e-commerce landscape is a journey specific to an industry and a company. We recommend strategies that incorporate the following five priorities.
1. Adopt an integrated platform strategy
Retailers know that e-commerce platforms can compensate for limited physical-store networks. This is especially applicable in China, where our research shows consistently that up to 70 percent of Internet users shop online regardless of the size of the cities in which they live, despite significant differences in Internet penetration (which averages 86 percent in Tier 1 cities, compared with 52 percent in Tier 3 cities).1
Yet advanced consumer companies in China don’t just sell online through their own sites. They use a variety of digital platforms, typically managing a flagship store on Tmall and selling through cross-category players such as JD.com and category-specific sites such as VIP.com. It’s an approach international players have evolved to adopt. Even British luxury brand Burberry now has a flagship digital store on Tmall, giving it access to traffic beyond its usual cus- tomers by virtue of being on the broader platform.
2. Understand China’s vast network of distributors
Managing distributors in the digital space in China is different than in the West. The country’s e-commerce market is filled with small distributors who have opened online shops through Tmall or Taobao, Alibaba’s consumer-to-consumer platform embraced by millions of small businesses and entrepreneurs.
While consumer to consumer is declining as a percentage of China’s total e-commerce market, it still accounts for about 50 percent of China’s e-commerce sales. That makes it a critical platform for
1 Tiers are defined by urban population and economic factors, such as GDP and GDP per capita. In China, Tier 1 cities include Beijing, Guangzhou, Shanghai, and Shenzhen; Tier 2 comprises about 40 cities; and Tier 3 is made up of about 170 cities.

77
China’s digital powerhouses—Baidu, Alibaba, and Tencent—are not the country’s equivalents of Amazon, Google, or Facebook. In fact, direct comparisons overlook the richness and depth of the capabilities and business models of the three Chinese companies, often described by the acronym BAT:
• Search-engine-optimization strategies designed for Google rarely work for Baidu, for example, since it places different emphases on ranking algorithm variables, such as overindexing the frequency of content updates.
• Alibaba resembles Amazon only insofar as it runs a digital retail platform. In reality, the Chinese company has multiple platforms, ranging from its namesake business-to-business marketplace to Taobao, its consumer-to-consumer marketplace, and to Tmall, its business-to-consumer site. In addition, none of these platforms hold inventory or operate fulfillment centers. Unlike Amazon, whose business primarily involves buying products and taking a cut from on-selling them, Alibaba’s digital platforms make money by collecting fees from the companies listing merchandise on them and by charging for the search engine and digital advertising placement. In addition, Jack Ma, the founder of Alibaba, established Cainiao, a platform that rents facilities to logistics companies and sellers so they can distribute products better.
• Tencent differs from Facebook in that its main source of revenue is not advertising but selling value-added online services, such as avatars, emoticons, games, and other virtual products. Tencent also moved far earlier than Facebook into e-commerce and online payments: it holds a 15 percent stake in JD.com, China’s second-largest e-commerce platform, with over 90 million active purchasing customers and gross merchandise value of more than $40 billion. Tencent’s digital-payment system, Tenpay, trails only Alibaba’s Alipay in third-party online payments. And Tencent has integrated its original social and mobile business with its newly established e-commerce and payment operations, unlike any other player.
Understanding BAT
Five keys to connecting with China’s wired consumers
78 2015 Number 4
companies, even if sites such as Taobao present challenges for global brands. That’s because brands have little control over how products are presented or priced: anyone with a Chinese identi- fication number can set up shop on Taobao, and the site has become a haven for counterfeiters, as well as for parallel importers—who purchase genuine foreign products meant for sale in other countries but bring them back to China for resale (often without paying import duties). In addition, excess inventory from large retailers or their sales forces also serves as a major source of authentic products on Taobao, sold at significant discounts.
While Alibaba has strengthened measures to purge pirates from Taobao, we’ve also seen multinational corporations evolve their approaches. At first, many battled rogue distributors with a variety of “get tough” measures, ranging from lodging official trade complaints to using computer chips and bar codes to track down inventory leaks. Yet practices involving “carrots” as well as
“sticks” are more effective. Several large consumer companies, including Kimberly-Clark, have instead proactively identified and partnered with their largest local distributors on Taobao, providing them with store certificates, stable product supply, and select product prelaunch benefits. In return, Kimberly-Clark asked distributors to comply with its branding and pricing guide- lines, for example.
Two-thirds of China’s consumers cite recommendations from families and friends as the critical factor influencing their decision to buy, compared with only one-third of consumers in the United States.

79Five keys to connecting with China’s wired consumers
3. Harness the power of social media
Brands have found social media especially important in China. Chinese consumers do not trust official sources, such as government and big corporations, and as a result, their purchasing decisions are influenced much more by word of mouth. In fact, two-thirds of China’s consumers cite recommendations from families and friends as the critical factor influencing their decision to buy, compared with only one-third of consumers in the United States. What’s more, we regard China’s social-media-platform leaders as more attuned to commerce and opportunities to work with brands and retailers than their US counterparts—none more so than China’s dominant social-media player, Tencent, which evolved its WeChat messaging service from a platform for social networking to one for customer- relationship management, commerce, and payments.
Xiaomi, for example, used WeChat to manage both product-launch buzz and sales. And since Hanting Hotel, a local midprice hotel chain, began providing virtual membership cards through WeChat, it has recruited more than 500,000 members and realized 62,000 room bookings. In parallel, WeChat is rapidly evolving its commerce services. Our recent iConsumer survey found that 15 percent of WeChat users have made a purchase through the WeChat platform, and 40 percent are interested in doing so in the near future. Many brands are adding WeChat commerce functionality into their official WeChat accounts.
4. Leverage China’s growth in location- based services
China already has more mobile Internet users than PC Internet users. Our research shows that almost two-thirds of Chinese con- sumers have made mobile purchases, and mobile commerce is predicted to surpass PC commerce in 2016. Not surprisingly, as mobile grows exponentially, so will location-based services that make online-to-offline transactions evermore important.

80 2015 Number 4
China is rapidly becoming a market where the consumer shopping experience integrates social media, location-specific information, and mobile-payment capabilities on smartphones. For example, mass chain player Pudding Hotels uses WeChat’s “people around me” function to proactively recommend its hotels to users based on their location—a service that generated more than 10,000 WeChat-enabled bookings within three months of launch.
We are finding that winning brand-building and e-commerce strate- gies increasingly require leading-edge capabilities to partner with digital platforms in social media, location services, and mobile mar- keting (“SoLoMo”) and, ideally, mobile commerce and payments.
5. Work with platforms to understand China’s consumers
Need to know more about your potential customers? Brand owners and retailers can uncover consumer insights by collaborating with digital-platform businesses in China. Consider P&G, China’s biggest digital advertiser, which has partnered with Baidu to develop multichannel advertising campaigns for its products. In reviewing search patterns for P&G’s Olay skin-care products, for example, Baidu analysts determined that many users were framing their queries in ways that suggested a strong connection between concerns about skin care and aging. P&G used those insights to devise an advertising campaign built on the idea that Olay products could help older women “hold on to age 25,” a message that resonated strongly with Chinese consumers. Similarly, a diaper player worked with business-to-consumer e-commerce player Dangdang to identify pregnant women entering their third trimester and issue relevant coupons.
Working with China’s e-commerce providers to codevelop con- sumer insights can benefit brand owners, retailers, and platform companies—and help strengthen a company’s relationship with China’s e-commerce players beyond being purely transactional.

81
Global brands will not maximize their digital-commerce potential in China solely with practices and formulas that have worked for them at home. In fact, success may require unlearning what you know to understand how to operate across China’s multiplatform e-commerce environment. Finally, the country’s landscape is still evolving quickly. Aside from the principles above, being alert to new channels and new business models and being ready to adapt early is also essential to future success.
Cindy Chiu is an alumnus of McKinsey’s Shanghai office, where Gordon Orr formerly served as a director; Todd Guild is a director emeritus in the Tokyo office.
Copyright © 2015 McKinsey & Company. All rights reserved.
Five keys to connecting with China’s wired consumers

8282
Signs of weaker growth in China during 2015, including its stock market’s tumble, have commanded widespread attention from economic policy makers, businesspeople, and investors. Not surprisingly, the leaders of local operations of multinational companies are feeling the pressure.
Earlier this year, we surveyed more than 70 such country heads, who, for simplicity’s sake, we call China CEOs. The companies they lead cover a wide range of B2B and B2C businesses, generate more than $200 billion in China-based revenue, and in many cases are among the top five global players in their industries. Fifty-five percent tell us that their companies are growing faster than the correspond- ing market segments in China. Nearly 40 percent of the China CEOs were Chinese nationals; a similar proportion came from Europe or North America, the rest primarily from other countries in Asia. Roughly 90 percent work for companies based in the United States or Europe. Nearly half had more than ten years of experience in China before taking on their current roles, but roughly 30 percent had less than two years’ experience there or were new to the region.
Regardless of background, these China CEOs are under severe time constraints. Forty percent said they don’t have time to respond quickly enough to the rapid changes in the China market, and another 40 percent admit that they are hard pressed to do so. Two challenges that China CEOs say demand large amounts of their time are hitting the numbers while they cope with the downturn in demand, as well as building their local teams. Another major issue
How China country heads are coping
As multinational companies face stronger
headwinds, how are local leaders dealing
with the situation, and what would help them
move faster?
Wouter Baan and Christopher Thomas

8383
is managing headquarters, including explaining the unique Chinese context to senior management there. That’s particularly true for the subset of the sample that can be characterized as headquarters focused, who spend nearly 40 percent of their time at or dealing with headquarters. Even locally focused China CEOs spend about 20 percent of their time at or speaking with the global HQ.
Most China CEOs have direct line control over go-to-market and support functions, such as branding and corporate affairs, but limited direct line reporting in upstream areas like product development, operations, and supply-chain management. Less than 50 percent can make decisions about pricing and product strategy independently of headquarters (Exhibit 1). Among those with integrated control over country operations and commercial results, most must still involve HQ in overall China strategy, long-term multiyear plans, and annual budgeting.
Exhibit 1
Less than half of China CEOs can make decisions in key business areas independently of headquarters.
Q4 2015China CEOExhibit 1 of 2
Source: 2015 McKinsey survey of 73 China CEOs
% of respondents who report exercising over 90% of all decision-making authority independently of headquarters
People and functions
Strategy
Investment
Products andpricing
Hiring and firing
Government-affairs strategy
Overall China strategy
Long-term, multiyear China investment plan
Product strategy
49
24
27
71
56
Annual China budgets and investments
35
Pricing 40

84 2015 Number 4
Regional-reporting relationships complicated things for some. Roughly two-fifths of China CEOs report to an Asia head, 20 per- cent to a global CEO (Exhibit 2). Many say it’s challenging, even uncomfortable, for them to report to the Asia head, when their China businesses account for a huge proportion of Asian results. Problems include the risk that they will duplicate approaches to targeting and reaching customers made at a regional level, along with lengthy planning and decision cycles.
Time pressures and decision-making complexity are hampering China CEOs as they seek to adapt to a changing country, to custom- ize their business models and product offerings to Chinese requirements, to compete with local competitors, and to respond nimbly to opportunities and threats.
Exhibit 2
Approximately 40 percent of China CEOs report to an Asia head—twice as many as report to the global CEO.
Q4 2015China CEOExhibit 2 of 2
Global functional head
Regional functional head
Decreased since 2013
Asia regional head
Increased since 2013
41%Business-unit CEO
Global CEO
20%
Share of China CEOs1 in 2015 who report to
16%
0
13%
1 Leaders of multinational corporations who are local to China; titles include China chairperson, country general manager, China president, China vice president, and China CEO. Figures do not sum to 100%, because the category of “Other” is not shown.
Source: 2015 McKinsey survey of 73 China CEOs

8585How China country heads are coping
Despite these issues, the vast majority of respondents said that China remains a top-priority growth engine for their companies—and that experience as the China head is a “rocket” to advance their own careers. However, on the whole, most don’t see the business environment in China getting any easier. Most also fear that the policy environment for multinationals in the country will get more challenging. Efforts to increase their agility by simplifying inter- actions with headquarters or by delayering and accelerating decision-making processes may therefore be a boon for many China CEOs and the organizations they oversee.
Companies address these challenges in different ways. Some have removed the regional structure and elevated China to a position equal to that of the rest of Asia. Others have consolidated all activities there under a China CEO with direct access to the global CEO. Several companies have built up their organic capabilities by moving full business units and global senior executives to the country. One created a China advisory board of senior global executives who coordinate and accelerate the local agenda.
Still others have taken people-based rather than structural approaches—promoting the China head to a global executive position, so that China expertise enters the boardroom. Some CEOs are addressing the slower-growth environment in today’s China by making personal commitments to remove barriers, in the cause of creating an organization that’s sufficiently nimble and respon- sive to the market. Efforts to attain that objective would seem to be a sensible use of time not only for executives at headquarters but also for those struggling on the front line.
The authors wish to thank McKinsey’s Yatu Ji and Rachel Jin for their contributions to this article.
Wouter Baan is an associate principal in McKinsey’s Beijing office, where Christopher Thomas is a principal.
Copyright © 2015 McKinsey & Company. All rights reserved.

86
There is a growing consensus among top
executives that gender diversity is both
an ethical and a business imperative. Yet
progress is painfully slow. Despite modest
improvements, women are underrepre-
sented at every level of today’s corpora-
tions, especially in senior positions.
We’re quite cognizant of how difficult it
is to make progress. Despite the fact
that McKinsey has, for a number of years,
been conducting research that has
helped our firm and many other com-
panies improve their gender balance—
for example, through our Women Matter
initiative,1 led by Sandrine Devillard,
one of this essay’s coauthors—we’re not
yet where we want to be. Women now
represent about 39 percent of McKinsey’s
entry-level hires, but occupy just 11 per-
cent of the senior-leadership roles
within the firm. There are currently four
women (including Judith Hazlewood,
another of this article’s coauthors) on our
30-member Shareholders Council.
These numbers are certainly up from a
decade ago, but less than we would like.
Our ability to help our clients with their
Gender equality: Taking stock of where we are
Why are women still underrepresented at every level of today’s corporations?
Dominic Barton, Sandrine Devillard, and Judith Hazlewood
toughest problems depends on attracting
and retaining the world’s best people,
who can offer the diverse perspectives
that enhance creative problem solving.
Although we are glad to be making
progress, including recently being named
one of Working Mother magazine’s top
ten companies for women,2 we know
we would be a better firm if we had more
top female talent. That’s why we have
committed publicly, through the United
Nations’ HeForShe initiative and the 30%
Club,3 to some ambitious gender goals
for our firm over the next five years—ones
that won’t be trivial to achieve.
The persistence of the gender gap
We believe there are several reasons
the gender gap so stubbornly persists.
For one, in many organizations, senior
leadership has only recently committed
itself to addressing this challenge.
A Women Matter study showed that
gender diversity was a top-ten strategic
priority for only 28 percent of companies
in 2010—and for a third of companies,
it was not on the strategic agenda at all.

87
It’s widely acknowledged that without
a commitment from the top, nearly any
major change program will fail.
Our experience has been that top-down
targets make a difference. We didn’t
set explicit gender goals for McKinsey
until 2014, and in just one year after
doing so, our intake of female consul-
tants has increased by five percentage
points. We’re encouraged by this,
and by the fact that a growing number
of companies are recognizing the case
for gender parity and declaring their
determination to pursue and achieve it.
Our hope is that initiatives like HeForShe,
in which we are participating, are just
the start of a growing wave of increased
transparency and more ambitious goals.
A second reason for sluggish progress
has to do with the nature of the gender
inequality issue itself, which, like many
efforts to change organizational cultures,
requires companies to take action
across a broad range of factors and keep
their managers aligned with multiple
objectives for years at a time. Our
research shows that the focus in these
interventions must be to help women
better develop as leaders, and to design
the conditions in which this can take
place. Crucial aspects include sponsor-
ing (not just mentoring), neutralizing the
effects of maternity leave and ongoing
parenting responsibilities on career
advancement and wage increases, and
evolving the criteria companies use
for promotions to include a diversity of
leadership styles.
The complex dynamics of the gender
issue create a variety of challenges.
Consider sponsorship: it’s easy to
say more is needed, but we’ve found that
women at McKinsey are disproportion-
ately sponsored by other women, which
places a higher burden on our more
senior women relative to senior men. This
surely limits the sponsorship they
are able to provide. Similarly, while the
anytime-anywhere model that currently
prevails in the corporate world has
placed everyone under more pressure,
the weight surely is heavier for
women, who continue to shoulder a
disproportionate share of the res-
ponsibility for managing home and family
issues. These forces challenge women
at McKinsey—a recent internal
diagnostic confirmed the persistence
of gender-based roles at home for
many women at the firm—and we believe
they are emblematic of those faced by
women in many organizations.
Addressing these interrelated gender
issues is difficult, which brings us to a
third reason change has been slow:
major transformation efforts require
steady, broad-based interventions over
time. After an initial commitment from
the top, significant changes can typically
take as many as eight or more years,
requiring the close and visible monitoring
of progress by the executive team. It’s
never easy and it’s rarely quick.4
Beyond the factors we’ve mentioned
lies at least one other that is mostly exo-
genous to private-sector institutions.
Economic equality for women, to
no small degree, depends on achieving
a sweeping set of social-equality
reforms. Is it the business of executives
to help solve broader social issues?

88 2015 Number 4
We would say yes, provided they
don’t distract from the other very
real issues executives face in their
own organizations.
The road ahead
Is it, then, only a matter of time before
gender equality will be achieved?
Yes and no. To the extent that private
and public institutions have made
the necessary commitment from the top
and are working to intervene in the
ecosystem of change, we are confident
they will, given time, reach their goal.
Too many companies have yet to grasp
the case for change, however, and
still lack both commitment and a pro-
gram of action. For these institutions,
gender parity will take longer to achieve.
As a member of the 30% Club, our
global managing director Dominic Barton
(also a coauthor here) is one of
47 US chairpersons and CEO members
who have publicly committed to
better gender equality at all levels. This
commitment reinforces efforts we
have under way to challenge fundamental
mind-sets and behaviors inside the
firm while setting (or continuing) in motion
a number of initiatives in support of
gender diversity. These range from new
flexibility programs, adjustments
to travel expectations, and upgrades to
maternity benefits, among others.
We’re working also to improve the quality
of sponsorship women receive at the
firm. A new diagnostic we’re piloting, for
instance, aims to create transparency
in the sponsorship arrangements among
all our consultants, many of whom
we have found to be unsure what good
sponsorship entails or how to create
it when it’s lacking. To help make all this
happen, we now have a global team
of managers fully dedicated to this issue,
The case for gender equality is strong. Why is progress so slow?
Get a quick overview or dive deeper into the issues with “A CEO’s guide to gender equality,” on mckinsey.com. It includes more of our recent research and video interviews with Facebook COO Sheryl Sandberg and actress Geena Davis.

89Gender equality: Taking stock of where we are
and a network of deeply passionate
leaders actively driving this topic
throughout the firm.
We’re acutely aware that there will be
surprises along the way. Here’s one: so
far, a higher percentage of men than
women have been taking advantage of
some of our flexibility programs. Do
some women at McKinsey, like their
counterparts at many companies, worry
that participating in such programs will
raise questions about how committed
they are to their careers? We hope
not, but we are exploring ways to dispel
any concerns—for example, by refining
our “up or out” promotion system to
ensure people can stay in the same roles
for longer periods of time with no impact
on their eventual advancement if they
are at a stage in life where they need that
flexibility. As a project-based orga-
nization, we think we’re reasonably well
positioned to pull this off.
Clearly, we don’t have all the answers.
Gender inequality is a multifaceted,
entrenched global issue. But our com-
mitment to diversity and inclusion
is an abiding part of our firm’s history
and daily practice. That we have
yet to achieve it only further strengthens
our determination to do so.
1 For more about the research, visit McKinsey’s Women Matter page, at mckinsey.com/features/women_matter.
2 For more, see “McKinsey & Co.,” Working Mother, September 9, 2015, on workingmother.com/mckinsey-co.
3 For more about the United Nations’ HeForShe initiative, visit heforshe.org; for more about the 30% Club, visit 30percentclub.org.
4 See “How to beat the transformation odds,” April 2015, on mckinsey.com.
Dominic Barton is McKinsey’s global managing director; Sandrine Devillard is a director in the Paris office and has helped lead McKinsey’s research on gender diversity for more than a decade; Judith Hazlewood is a director in the New Jersey office and a member of McKinsey’s Shareholders Council.
Copyright © 2015 McKinsey & Company. All rights reserved.

90 2015 Number 4
The challenges and the opportunities
of enabling women to reach their
full economic potential have been high-
lighted in two major reports published
in 2015.
Analysis1 by the McKinsey Global
Institute (MGI) showed that world GDP
could jump by $12 trillion over the
next 10 years under a scenario whereby
all countries make the same rate of
progress toward gender equality as the
fastest-improving country in their
region (Exhibit 1). MGI found that 40 of
the 95 countries it mapped for the
study have high or extremely high levels
of gender inequality with respect to
at least half of the 15 indicators it used,
covering everything from the work-
place and essential services to legal
protection and physical security.
While this is alarming, the potential, on
the other hand, is enormous: the
economic boost from a “best in region”
scenario would be equivalent in size
to the current GDP of Germany, Japan,
and the United Kingdom combined,
or twice the likely growth in global GDP
contributed by female workers
between 2014 and 2025 under business-
as-usual conditions. MGI concludes
that businesses will need to play a more
active role with governments and
Digging into the numbers on gender equalityHighlights from recent research
nongovernmental organizations in
bridging the gender gap, and lists six
types of intervention, including finan-
cial incentives, capability building, and
advocacy and shaping attitudes.
The scale of that task, however, was
emphasized in a second report—
a study undertaken by LeanIn.Org and
McKinsey—showing that women are
underrepresented at every level in the
corporate pipeline, are less likely to
advance than men, and face more bar-
riers to senior leadership. Women in
the Workplace,2 a comprehensive survey
of the state of women in corporate
America, follows a similar initiative con-
ducted by McKinsey alone in 2012.
Exhibit 2 comprises employee-pipeline
data from 118 companies in the 2015
report and 60 companies in 2012.
If progress doesn’t pick up from the
modest rate of the last three years,
the data suggest it will take decades to
reach parity in the C-suite.
Copyright © 2015 McKinsey & Company. All rights reserved.
1 For more on the research, see The power of parity: How advancing women’s equality can add $12 trillion to global growth, McKinsey Global Institute, September 2015, on mckinsey.com.
2 For more, see the full report, Women in the Workplace, 2015, on womenintheworkplace.com.
90

Exhibit 2
Exhibit 1
If every country matched the progress toward gender parity of its fastest-moving neighbor, global GDP could increase by up to $12 trillion in 2025.
Q4 2015Gender CharticlesExhibit 1 of 2
1 Sample = 95 countries.Source: IHS; ILO; Oxford Economics; World Input-Output Database; national statistical agencies; McKinsey Global Institute analysis
Incremental global GDP over business-as-usual scenario,1 %
India
Latin America
China
Sub-Saharan Africa
North America and Oceania
World
Middle East and North Africa
South Asia (excl. India)
Western Europe
Eastern Europe and Central Asia
East and Southeast Asia (excl. China)
0.7
1.1
2.5
0.3
3.1
11.8
0.6
0.1
2.1
0.4
0.9
16%
14%
12%
12%
11%
11%
11%
11%
9%
9%
8%
$ trillion
Women are underrepresented at every level of the corporate pipeline.
Q4 2015Gender CharticlesExhibit 2 of 2
Source: Data for 2012 are from Unlocking the full potential of women at work, in which McKinsey examined the employee pipeline of 60 US corporations. Data for 2015 are from Women in the Workplace, in which LeanIn.Org and McKinsey examined the employee pipeline of 118 US corporations.
Corporate-talent pipeline by gender
33422012 28 23 20 16
37452015 32 27 23 17
Women in the pipeline, %
ManagerEntry-level professional
Men
Women
Senior manager/director
Vice president
Senior vice president
C-suite
91Digging into the numbers on gender equality

92©
Joh
n Lu
nd/D
igita
lVis
ion/
Get
ty Im
ages

93
As the Internet of Things (IoT) has gained popular attention in the five years since we first published on the topic,1 it has also beguiled executives. When physical assets equipped with sensors give an information system the ability to capture, communicate, and process data—and even, in a sense, to collaborate—they create game- changing opportunities: production efficiency, distribution, and innovation all stand to benefit immensely. While the consumer’s adoption of fitness bands and connected household appliances might generate more media buzz, the potential for business usage is much greater. Research from the McKinsey Global Institute suggests that the operational efficiencies and greater market reach IoT affords will create substantial value in many industries.2
There are many implications for senior leaders across this horizon of change. In what follows, we identify three sets of opportuni- ties: expanding pools of value in global B2B markets, new levers of operational excellence, and possibilities for innovative business models. In parallel, executives will need to deal with three sets of challenges: organizational misalignment, technological interoper- ability and analytics hurdles, and heightened cybersecurity risks.
An executive’s guide to the Internet of Things
The rate of adoption is accelerating. Here are
six things you need to know.
Jacques Bughin, Michael Chui, and James Manyika
1 See Michael Chui, Markus Löffler, and Roger Roberts, “The Internet of Things,” McKinsey Quarterly, March 2010, mckinsey.com.
2 For the full McKinsey Global Institute report, see The Internet of Things: Mapping the value beyond the hype, June 2015, on mckinsey.com. We analyzed more than 150 IoT use cases across the global economy. Using detailed bottom-up economic modeling, we estimated the economic impact of these applications across a number of dimensions.

94
Opportunities beckon . . .
IoT’s impact is already extending beyond its early, most visible appli- cations. A much greater potential remains to be tapped.
Creating B2B value globallyTo make the Internet of Things more understandable, media cover- age has often focused on consumer applications, such as wearable health and fitness devices, as well as the automation products that create smart homes. Our research reveals considerable value in those areas. Yet the more visible manifestations of IoT’s power shouldn’t distract executives from a core fact: business-to-business applications will account for nearly 70 percent of the value that we estimate will flow from IoT in the next ten years. We believe it could create as much as $11.1 trillion a year globally in economic value in nine different types of physical settings (Exhibit 1). Nearly $5 billion would be generated almost exclusively in B2B settings: factories in the extended sense, such as those in manufacturing, agriculture, and even healthcare environments; work sites across mining, oil and gas, and construction; and, finally, offices.
There’s also a global dimension to IoT’s B2B potential. Over the next ten years, the total economic impact from IoT will be greater in advanced economies, given the possibility of larger cost savings and higher adoption rates. However, emerging markets, whose manufacturing-intensive economies often supply goods to final manufacturers, will be prime areas for IoT adoption.
An estimated 38 percent of IoT’s overall worldwide value will likely be generated in developing economies, and eventually, the number of IoT deployments in such markets could surpass those in developed ones. In fact, deployments in developing economies are likely to exceed the global average in work-site settings (such as mining, oil and gas drilling, and construction) and in factories. For instance, China, with its large and growing industrial and manufacturing base, stands to reap major benefits not only on the factory floor but also in product distribution. In fact, developing economies could leapfrog the developed world in some IoT applications because there are fewer legacy technologies to displace.
2015 Number 4

95
Exhibit 1
The Internet of Things offers a potential economic impact of $4 trillion to $11 trillion a year in 2025.
Q4 2015Internet of ThingsExhibit 1 of 2
1 Adjusted to 2015 dollars; for sized applications only; includes consumer surplus. Figures do not sum to total, because of rounding.
Source: McKinsey Global Institute analysis
Low estimate High estimate
Homes—eg, energy management, safety and security, chore automation
Offices—eg, organizational redesign and worker monitoring, augmented reality for training
Work sites—eg, operations management, equipment maintenance, health and safety
Vehicles—eg, condition-based maintenance, reduced insurance
Size in 2025, $ trillion1Nine settings where value may accrue
0.2–0.3
0.1–0.2
0.2–0.9
0.2–0.7
Total $4 trillion–$11 trillion
Factories—eg, operations management, predictive maintenance 1.2–3.7
Cities—eg, public safety and health, traffic control, resource management
0.9–1.7
0.2–1.6Human—eg, monitoring and managing illness, improving wellness
Retail—eg, self-checkout, layout optimization, smart customer-relationship management 0.4–1.2
Outside—eg, logistics routing, autonomous (self-driving) vehicles, navigation 0.6–0.9
An executive’s guide to the Internet of Things
Optimizing operationsInvesting in IoT hardware—from sensors embedded in manufac- turing equipment and products to electronically tagged items along the supply chain—is only the starting point of the value equation. The biggest competitive gains come when IoT data inform decisions.

96
Our work shows that most of the new business value will arise from optimizing operations. For example, in factories, sensors will make processes more efficient, providing a constant flow of data to optimize workflows and staffing:
• Sensor data that are used to predict when equipment is wearing down or needs repair can reduce maintenance costs by as much as 40 percent and cut unplanned downtime in half.
• Inventory management could change radically, as well. At auto-parts supplier Wurth USA, cameras measure the number of components in iBins along production lines, and an inventory-management system automatically places supply orders to refill the containers.
• In mining, self-driving vehicles promise to raise productivity by 25 percent and output by 5 percent or more. They could also cut health and safety costs as much as 20 percent by reducing the number of workplace accidents.
IoT systems can also take the guesswork out of product develop- ment by gathering data about how products (including capital goods) function, as well as how they are actually used. Using data from equipment rather than information from customer focus groups or surveys, manufacturers will be able to modify designs so that new models perform better and to learn what features and functionality aren’t used and should therefore be eliminated or redesigned. By analyzing usage data, for example, a carmaker found that customers were not using the seat heater as frequently as would be expected from weather data. That information prompted a redesign to allow easier access: the carmaker updated the software for the dashboard touchscreen to include the seat-heater command. This illustrates another capability of connected devices: with the ability to download new features, these products can actually become more robust and valuable while in service, rather than depreciate in value.
Despite this value, most data generated by existing IoT sensors are ignored. In the oil-drilling industry, an early adopter, we found
2015 Number 4

97An executive’s guide to the Internet of Things
that only 1 percent of the data from the 30,000 sensors on a typical oil rig are used, and even this small fraction of data is not used for optimization, prediction, and data-driven decision making, which can drive large amounts of incremental value.
Creating innovative business modelsIoT can also spur new business models that would shift competi- tive dynamics within industries. One example is using IoT data and connectivity to transform the sale of industrial machinery and other goods into a service. The pioneers of this trend were jet-engine manufacturers that shifted their business model to selling thrust and ancillary services rather than physical equipment. Now these models are proliferating across industries and settings. Transportation as a service, enabled by apps and geolocation devices, is encroaching on vehicle sales and traditional distribution alike. Manufacturers of products such as laser printers with IoT capabilities are morphing into robust service businesses.
IoT makes these business models possible in a number of ways. First, the ability to track when and how physical assets are actually used allows providers to price and charge for use. Second, the combined data from all these connected assets help a supplier to operate equipment much more efficiently than its customers would, since its customers would only have a limited view of their own equipment if they purchased and ran it themselves. Furthermore, analysis of IoT data can enable condition-based, predictive maintenance, which minimizes unplanned downtime.
This business-model shift will require product companies to develop and flex their service muscles. Product development, for instance, becomes service development, where value is cocreated with customers. It won’t be enough to focus on the product features customers will pay the most for. Developers will need to under- stand the business outcomes their customers seek and learn how to shape offerings to facilitate those outcomes most effectively. Service providers will also have to take on capacity-planning functions—including planning for peak usage and utilizing IoT data to forecast demand.

98
. . . but challenges remain
As with any major technological shift, realizing IoT’s potential will require significant management attention not just to new technical imperatives but also to organizational issues.
Aligning the organizationIoT will challenge traditional organizational roles as information technology becomes widely embedded across assets, inventories, and operations. One focal point will be the IT function, for the Internet of Things requires it to assume a transformed role that spans beyond computers, networks, mobile devices, and data centers. Instead, IT will have to join with line managers to oversee IoT systems that are essential to improve both the top and bottom lines.
In retailing, for instance, one of the largest sources of value could be the sales lift that real-time, in-store personalized offers are expected to deliver. This will require the sophisticated integration of data across many sources: real-time location data (the shopper’s whereabouts in a store), which would link to data from sensors in the building; customer-relationship-management data, including the shopper’s online-browsing history; and data from tags in the items on display, telling the customer to enter a specific aisle, where he or she could use an instant coupon sent to a phone to buy an item previously viewed online. In short, information technology and operations technology will converge, both technically and in their metrics of success. As a result, companies will have to align their IT and operational leadership tightly, though traditionally these functions tended to work separately and, more often than not, held each other at arm’s length.
Beyond expanding IT’s role, IoT will challenge other notions of organizational responsibilities. Chief financial, marketing, and operating officers, as well as leaders of business units, will have to be receptive to linking up their systems. Companies may need to train employees in new skills, so the organization can become more analytically rigorous and data driven. Analytics experts and data scientists must be connected with executive decision makers and (to optimize insights from the new data) with frontline managers. In some cases, the decision makers will be algorithms. When companies need large-scale real-time action—such as
2015 Number 4

99
3 For more, see Big data: The next frontier for innovation, competition, and productivity, McKinsey Global Institute, May 2011, on mckinsey.com.
An executive’s guide to the Internet of Things
optimizing the control of equipment across an entire factory—IoT systems will make decisions automatically. Managers will monitor metrics and set policy.
Overcoming interoperability and analytics hurdlesStrategies that use IoT data in an effective way often call for inter- operability. We estimate that nearly 40 percent of the potential value, on average, will require different IoT systems to communicate with one another and to integrate data (Exhibit 2). Relatively little of that is happening now. For example, on offshore oil platforms today, components such as pumps are often installed as connected devices, but in a limited fashion: devices individually connect back to their manufacturers, which monitor and control machines and can optimize their maintenance and performance individually. However, data from multiple components and systems must be combined to identify more than half of the predictable performance issues that arise in day-to-day platform operations, including those that could impact overall oil-production volumes.
Many large companies will have enough market power to specify that their IoT vendors make systems interoperable. In some cases, this will lead vendors to choose common standards that will ultimately speed up adoption. In other cases, interoperability could also be achieved with software platforms designed to combine data from multiple systems. That will create new market opportunities for companies capable of integrating data from diverse sources.
However, simply bringing data together from different IoT systems won’t be enough. Indeed, IoT may exacerbate many of the challenges we have observed when companies use big data.3 In moving to a world where IoT is used for prediction and optimization, companies face an analytics challenge. They’ll need to develop or purchase, to customize, and then to deploy analytical software that extracts actionable insights from the torrent of data IoT will generate. And in many cases, the algorithms embedded in this software will have to analyze data streams in real time—a task many traditional analytical tools are not designed to do. This offers another potential market opportunity for innovative software developers.
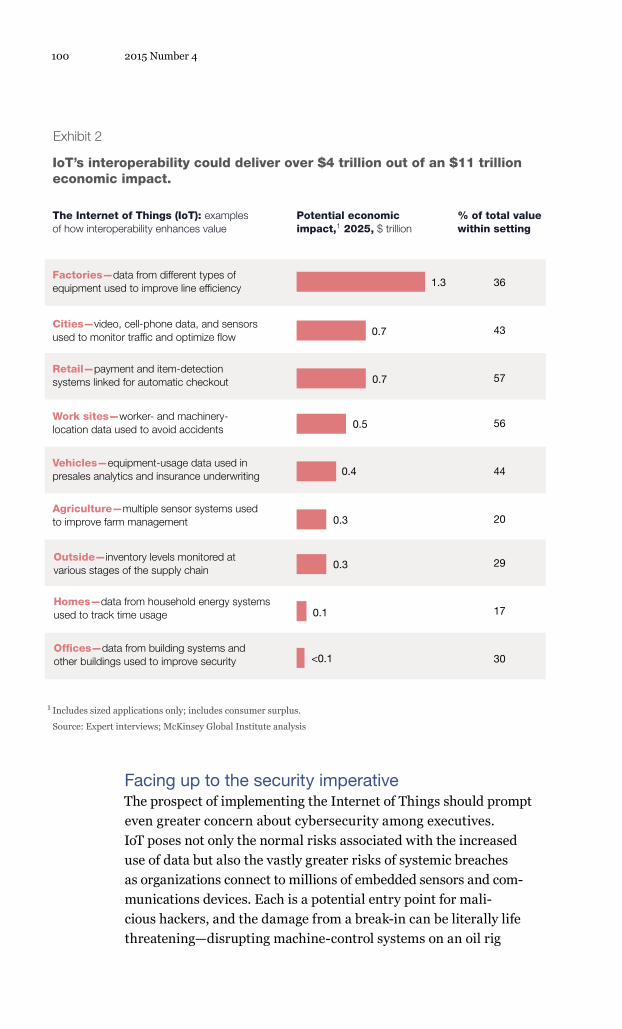
100
Exhibit 2
Facing up to the security imperativeThe prospect of implementing the Internet of Things should prompt even greater concern about cybersecurity among executives. IoT poses not only the normal risks associated with the increased use of data but also the vastly greater risks of systemic breaches as organizations connect to millions of embedded sensors and com- munications devices. Each is a potential entry point for mali- cious hackers, and the damage from a break-in can be literally life threatening—disrupting machine-control systems on an oil rig
2015 Number 4
IoT’s interoperability could deliver over $4 trillion out of an $11 trillion economic impact.
Q4 2015Internet of ThingsExhibit 2 of 2
1 Includes sized applications only; includes consumer surplus. Source: Expert interviews; McKinsey Global Institute analysis
Homes—data from household energy systems used to track time usage
Offices—data from building systems and other buildings used to improve security
Agriculture—multiple sensor systems used to improve farm management
Outside—inventory levels monitored at various stages of the supply chain
The Internet of Things (IoT): examplesof how interoperability enhances value
0.1
<0.1
0.3
0.3
Factories—data from different types of equipment used to improve line efficiency 1.3 36
43
57
56
44
20
29
17
30
Cities—video, cell-phone data, and sensors used to monitor traffic and optimize flow 0.7
0.7Retail—payment and item-detection systems linked for automatic checkout
Work sites—worker- and machinery-location data used to avoid accidents 0.5
Vehicles—equipment-usage data used in presales analytics and insurance underwriting 0.4
Potential economic impact,1 2025, $ trillion
% of total value within setting

101
or in a hospital, for example. The same interoperability that creates operational efficiency and effectiveness also exposes more of a company’s units to cyberrisks. Growing interconnections among companies and links with consumer devices will create other challenges to the integrity of corporate networks, too.
Companies will need to rely on the capabilities of vendors to mitigate some of these risks. However, preparing for a revolutionary change in distributed connectedness and computation will also require a new strategic approach, which our colleagues have described as “digital resilience.”4 In other words, companies need to embed methods of protecting critical information into technology architec- tures, business-model-innovation processes, and interactions with customers. They can start by assessing the full set of risks in an integrated way and by creating an extensive system of defenses that will be hard for hackers to penetrate. Companies also need to tailor cybersecurity protections to the processes and information assets of each of their businesses, which in an IoT world will increas- ingly be linked. Given the extent of the risks and the cross-functional nature (and significant cost) of the solutions, progress will require senior-level participation and input.
IoT will soon become a differentiating factor in competition. Senior leaders and board members must take a systems approach to address the organizational challenges and risks this expansion of the digital domain will create. That will allow companies to capture the full range of benefits promised by the Internet of Things.
4 See Tucker Bailey, James M. Kaplan, and Chris Rezek, “Repelling the cyberattackers,” McKinsey Quarterly, July 2015, mckinsey.com.
The authors wish to thank McKinsey’s Dan Aharon and Mark Patel for their contributions to this article.
Jacques Bughin is a director in McKinsey’s Brussels office; Michael Chui is a partner at the McKinsey Global Institute, where James Manyika is a director.
Copyright © 2015 McKinsey & Company. All rights reserved.
An executive’s guide to the Internet of Things

102©
sam
xmeg
/E+
/Get
ty Im
ages

103
It’s a familiar dilemma for managers in corporate headquarters everywhere: how to add value to operating units without inadvertently subtracting it through misguided influence, bureaucracy, delays, and time wasting.
Consultants and academics, ourselves included, have wrestled with this challenge for years. We know many head-office initiatives that successfully exploited economies of scale, uncovered opportunities to cross-sell products, or devised strategies to share valuable knowledge. But the net impact of many others is negative. Why else, after all, do spin-offs from large conglomerates often perform well after being released from the warm embrace of the parent company? Why do executives in divisions complain so frequently about corporate functions and initiatives?
We have been experimenting with three simple tests that help companies reduce the risks of unproductive interference by head offices.1 They entail asking whether the project adds significant value, whether there are risks of unintended value subtraction, and whether the initiative will encounter barriers to implementation. In this article, we’ll describe the application of these tests to one company’s recent efforts to improve its websites, as well as another company’s initiative to make its sales force more effective (see sidebar, “Failing to surmount the barriers,” on page 108). But analytical tools alone are not enough, so we also reflect on how
Knowing when corporate headquarters adds rather than subtracts value
Reduce value destruction by applying three
tests to initiatives from the center.
Andrew Campbell and Gabriel Szulanski
1 The first two tests evolved out of Andrew Campbell’s work on centralization. For more, see Andrew Campbell, Sven Kunisch, and Günter Müller-Stewens, “To centralize or not to centralize,” McKinsey Quarterly, June 2011, on mckinsey.com.

104
to improve the dialogue between business units and the center. That interaction is critical to the effectiveness of the three tests.
The three tests in action
The project to improve websites was typical of many head-office initiatives. The managers concerned wanted to go ahead with an upgrade to make the sites more mobile friendly and improve their search rankings, as well as integrate the sites across the company’s four businesses. The stakes may seem small, but it’s easy, even with the best of intentions, to do more harm than good. That’s why we believe that managers at headquarters and in the businesses need rules of thumb to guide such decisions.
Some head-office initiatives—preparing financial statements, paying taxes, or conducting internal audits, for example—are required for external governance or compliance and form part of an organiza- tion’s right to do business. But many others, such as the website example, are discretionary and can be evaluated with our added-value, subtracted-value, and barriers-to-implementation tests.
1. The added-value testHead-office projects should focus on significant opportunities. A corporate headquarters, after all, only has a limited amount of execu- tive capacity, and the business units themselves can only cope with a limited number of initiatives from the center. So what is a sig- nificant opportunity? Our rule of thumb is that such projects should have the potential to improve a company’s overall performance—sales, profits, return on assets, or value to beneficiaries—by a number that is large enough to make the risk of subtracting value worth taking. As a starting point, we suggest 10 percent. The exact number isn’t important; it could be 5 percent or 20 percent, as long as it is large enough to command the attention of HQ executives.
In the case of the company that wanted to improve its websites, the upgrade was likely to deliver a considerable increase in sales: the number of mobile users was increasing and search rankings were becoming significant. A 10 percent impact was not impossible. So the project, at least on the overall level, appeared to pass this test. But
2015 Number 4

105Knowing when corporate headquarters adds rather than subtracts value
we have learned from experience that good evaluation calls for disaggregating projects into their component parts and applying the added-value test to each part.
It was clear that all of the websites in question needed an upgrade. But the issue was whether to manage the project from the center or in a more decentralized way. A center-led project would not generate sales 10 percent higher than a decentralized project would. Also, the second goal of more fully integrating the four websites would, on its own, not have passed the 10 percent test.
The analysis would have been speculative, and managers might have disagreed. But it would have been hard to argue that central- ized project management of the upgrade or greater integration of the websites would deliver significantly more than a decentralized, nonintegrated approach.
This suggests that the head-office project should not go ahead unless the results of the other two tests were favorable. It is OK to pursue small sources of added value if the risk of subtracted value is low and there are few barriers to execution.
2. The subtracted-value testThis test may seem obvious, but companies rarely apply it in a formal way. Managers in business divisions may be more sensitive to the risk of subtracted value than managers at headquarters, who may be overoptimistic, but neither side is wholly unbiased. Anecdotes from previous company initiatives and an analysis of possible downsides can help uncover areas where value could be subtracted.
For the upgrade objective, a plan to centrally manage the project appeared to involve relatively few risks of subtracting value. One risk was timing. Separately managed projects would let each unit choose the moment most suited to its business needs. Another risk was complexity. It might have proved harder to upgrade all sites simultaneously. But neither risk seemed large. However, raising the issue of subtracted value can suggest ways to manage projects with a view to reducing even these small risks.
The risks were greater for the integration objective. Integration would require some control of standardization from the center, which

106 2015 Number 4
might reduce initiative in the businesses or their willingness to experiment. So the subtracted-value test suggests that centralizing the upgrade could be sensible, but the integration objective might be risky.
3. The barriers-to-implementation testThe barriers test allows executives to assess the likelihood that a project will be well implemented. Academic research on initiatives to transfer skills and good practices has helped us distill a list of nine barriers to successful implementation. We’ve observed that projects facing more than three of these barriers are so unlikely to be implemented successfully that they are not worth pursuing (see exhibit).
In upgrading the websites, the company faced only one barrier: the project leader had not led a similar project before and therefore wasn’t fully credible. But he was well supported by outside advisers.
As for the integration part of the project, there were a number of barriers. Neither the project leader nor the consultants had the necessary skills. It wasn’t clear what should be integrated to achieve a good outcome. There was little evidence that integration would increase sales or cut costs. Moreover, some of the businesses were lukewarm about integration and thus not likely to embrace it fully. There was little contextual pressure for integration—no burning platform. With at least five barriers to implementation, this part of the project would have failed the implementation test.
The verdict
Generally, if the opportunity to add value is big, it may be worth trying to manage subtracted value, to look for ways around the imple- mentation barriers, or both. But if the opportunity to add value is small, problems with either of the other two tests should suffice to deter the initiative.
In the case of the website project, the three tests support manage- ment’s instinct to centralize the upgrade part of the project. But

107
the integration part should only move forward if ways could be found to reduce the risks of subtracted value and to remove barriers to implementation.
In reality, the company launched a project to achieve both objec- tives, with unfortunate results. While the upgrade was successful, integration delivered few benefits at a high cost. The project ran over budget and was late, which was damaging to one business with a summer sales peak. Moreover, after the project was complete, the policies put in place to protect standardization discouraged the businesses from experimenting with ways to upgrade their sites. Looking back, the business heads doubt that the project in total added much net value. They would have preferred to have kept control of their own sites.
Exhibit
Knowing when corporate headquarters adds rather than subtracts value
Q4 2015Corporate HQExhibit 1 of 1
Source: Adapted from Gabriel Szulanski, Sticky Knowledge: Barriers to Knowing in the Firm, London: SAGE Publications, 2003
Initiatives facing more than three of the following barriers to implementation are less likely to succeed.
The actions needed for a good outcome are poorly understood
The change agent does not have credibility
People whose contributions to the project will be needed aren’t motivated
People who will have to change their behavior will probably find it hard to do so
Few spare resources are available to help those who need to change
There is little contextual pressure to motivate change
The managersconcerned have a history of poor relationships
There is little evidence that a proposed change will yield improved results
The designated change agent is not motivated to lead the project

108 2015 Number 4
Process supports
The three tests are not simple calculations. Judgment is required, and we are not suggesting that the judgments are trivial. Moreover, the tests are easier to apply in hindsight than before a project starts. We also know that analysis alone is not sufficient. Good decisions
A technology company we know launched an initiative to identify strong sales-force practices within its international division and to transfer them across the division’s country-based units. The project was called Wave II, stimulated by a successful project—Wave I—that had focused on revenue-growth opportunities.
Wave II involved identifying good practices in the sales processes of the different country units. These processes were then to be consolidated into a best-practice template for a set of software modules that the entire sales force could use.
The project passed the added-value test: managers knew that the performance of the sales force in different countries varied by as much as 25 percent. If the company could reduce this variation and the country-based units with the best-performing sales forces could improve their current levels, the payoff would be well above 10 percent.
In addition, the project passed the subtracted-value test. The sales task in each country was similar, so it wasn’t likely that standardized
Failing to surmount the barriers
processes would harm any of the country-based units. Moreover, the project team contained people from different countries, so its members would probably know which ideas were universally applicable and which would work only in some places.
However, unlike Wave I, Wave II faced several barriers to implemen- tation. First, there was no urgency for change. As one manager explained, “we had an excellent year . . . outperforming the US part of the group, so why make changes? There is no crisis.” Second, there was no hard evidence to convince skeptics that a good practice in one country would work in another. Third, changes in each country would need to happen in quick succession because the changes were linked. This would make it hard for the country units to implement them. Fourth, few extra resources were available to support countries making changes.
Unfortunately, managers implemented the project without considering the barriers. Not surprisingly, after six months, the initiative was not showing results and was cancelled.

109
come from a dialogue between headquarters managers and busi- ness managers based on mutual respect. Each side has something to offer. Because they have access to the big picture, managers at headquarters may see opportunities to add value that business managers miss. Business managers, on the other hand, are better positioned to detect subtracted value and implementation barriers.
Organizational clarityA clear understanding of the division of responsibilities between headquarters and business units is always helpful. Franchise organizations provide an extreme but instructive metaphor. The franchisees (that is, the business divisions) are clearly less power- ful than the franchisor (headquarters). But all parties understand that the relationship will work only if the franchisor provides value for the franchisees and if the franchisees have autonomy in all areas not covered by the franchise agreement. Both sides should evaluate any new initiative by the franchisor to test the likely impact on added and subtracted value.
Without clarity, power struggles and competing agendas can emerge when companies fail to communicate the different roles that headquarters, functions, and businesses should play.
Measuring perceived added valueAlthough the value that headquarters adds can’t always be measured in financial terms, companies can gauge perceptions. One approach is to ask senior managers in business divisions, every three or six months, to assess the net added value of different headquarters functions, processes, policies, and projects on a simple scale of one to ten. A low score typically sparks a dialogue.
The main argument against such an evaluation process is that headquarters sometimes needs to use tough love and hard-to-take medicine, and that the business units may therefore rate head- office performance unfairly. But our experience suggests that man- agers in the businesses understand the benefits of tough love. And headquarters, of course, can always choose how to react to a bad score after engaging in the appropriate dialogue.
Blowing the bureaucracy whistleOur final suggestion is to give all managers, especially those in the business divisions, a notional “bureaucracy whistle.” Like the
Knowing when corporate headquarters adds rather than subtracts value

110 2015 Number 4
famous andon cord, the emergency cable once strung above Toyota production lines that brought managers and engineers running to pinpoint the problem so as to minimize downtime, the bureaucracy whistle should trigger a similarly focused dialogue.
Every month or every quarter, an appropriate management com- mittee can review the reported bureaucracy issues. Of course, such a committee runs the risk of becoming a bureaucracy in its own right. But at the very least, it will show the organization the importance of keeping an eye on subtracted value.
Andrew Campbell, an alumnus of McKinsey’s London and Los Angeles offices, is a director of the Ashridge Business School’s Strategic Management Centre in the United Kingdom. Gabriel Szulanski is a professor of strategy at INSEAD in Singapore.
Copyright © 2015 McKinsey & Company. All rights reserved.

How should you tap into Silicon Valley?
The roughly 1,800-square-mile area commonly known
as Silicon Valley, southeast of San Francisco Bay, is home
to just three million people—slightly less than 1 percent
of the US population. Yet the Valley, seat of several world-
class universities and numerous cutting-edge enterprises,
has become an economic and innovation powerhouse whose
importance is hugely disproportionate to its small physical
size. If it were a country, it would rank among the world’s
50 largest economies, larger than those of Hungary, Vietnam,
and New Zealand, among others. In 2013, Silicon Valley
generated over 12 percent of US patent registrations and
produced about 11 percent of new US-company IPOs, and the
greater Bay Area attracted almost 40 percent of US venture-
capital (VC) investment.1 More than a few ideas hatched
in the Bay Area have paid off handsomely. Thirty-two of the
50 private start-ups with valuations at or exceeding $1 bil-
lion are based there. This is not a new phenomenon, of course.
Bay Area enterprises have been creating new markets and
disrupting a wide swath of industries for decades.
As companies everywhere strive to stay ahead of the digital
revolution, the payoff from engaging with Silicon Valley can be
substantial. BMW, which first arrived there almost 20 years
ago, linked up with Apple to become the first carmaker to inte-
grate the iPod into its vehicles—an initiative that likely would
not have been possible without a physical presence in the area.
BMW’s development of its i3 electric vehicle also benefited
from collaboration with other Valley companies.2
No silver bullet
But for every success, companies launch many haphazard
“Valley initiatives” that yield little and end in disappointment.
Consider, for example, the Bay Area networking offices
Alex Kazaks is a principal in McKinsey’s San Francisco office.
Eric Kutcher is a director in the Silicon Valley office.
Michael Uhl is a principal in the Silicon Valley office.
Not by sticking a toe in the water. Get your management team aligned and then commit.
Closing View111

beloved of many outsiders. These attempts to get a foot in the
door typically involve establishing a small outpost charged
with responsibility for networking with VC funds, leading area
businesses, and promising Valley start-ups. Many companies
find it difficult to make this model work. Even if employees in
these offices can identify winning ideas—no sure thing, of
course—their potential tends to get watered down or lost as
the news is passed back to corporate headquarters and up
the chain of command. Often, opportunities are squandered,
and frustrated employees at the satellite office leave to join
some fast-growing Valley employer.
Companies that set up their own venture-capital funds or cor-
porate-investment arms often report disappointing results,
too. In the Bay Area, after all, money is generally less important
than good connections; well-established entrepreneurs and
VCs there tend to stick together and pick winners cooperatively.
Even corporate-backed entities flush with money struggle
to embed themselves in the local network. Intel Capital—
launched by one of the Valley’s original corporate pillars—is
a notable exception, but many more fail to make meaningful
contributions to their corporate parents or don’t follow a
coherent corporate strategy in training their sights on target
companies. For many big businesses looking in from the
outside, creating a venture fund is a difficult way to channel the
Valley’s entrepreneurial spirit and generate fresh ideas.
A practical playbook
In our experience, there are three proven ways to engage with
Silicon Valley and tap into its zeitgeist.
The innovation boot campOne option is a visit to Silicon Valley, typically for a few days
and often undertaken by an organization’s board or highest
executives. Consider it an innovation boot camp. The goal is
to immerse company leaders in the Valley’s entrepreneurial
approach, which can be an invaluable means of galvanizing
members of a top team to act.
The board of a large North American bank, for example,
recently visited Silicon Valley because that institution, like
112 2015 Number 4

other financial players—and indeed like companies in many
other industries—was beginning to foresee a future in which
unprecedented technological change would disrupt its
business model. What the board found most valuable from its
boot-camp experience wasn’t learning about specific digital
platforms or uncovering new fintech systems but getting to
know the culture of innovation and grasping the importance
of accelerating the bank’s digitization program. The board’s
perspective shifted as it considered how the Valley’s
companies approach challenges entrepreneurially, with an
eye to industry transformation; what kind of talent these
companies require; and how the bank’s model had to become
more customer focused. Indeed, one board member described
the experience as the bank’s “highest ROI project”; another
said, “We saw more change and urgency introduced in
the board in the last two days than in the entire last two years.”
Other companies we know have benefited similarly, using
visits to Silicon Valley to help craft a digital strategy and develop
valuable relationships with senior Bay Area executives.
Targeted strategic partnershipsProperly executed, partnerships with a Silicon Valley enterprise
can hit the sweet spot, especially for companies that sense
a closing window of time before technology disrupts their core
business. Broadly, these combinations tend to take one of two
forms. In the first, two large companies—one in Silicon Valley,
the other based elsewhere—agree to collaborate on a new
technology. Such combinations between local and nonlocal
giants can succeed. For example, the initiative between Google
and the Swiss pharmaceutical company Novartis to develop
contact lenses that can, among other uses, monitor the
glucose levels of diabetes patients is showing early progress.
Yet the “partnership of equals” approach can encounter
significant barriers; two large enterprises often find it difficult to
work together and frequently get bogged down in logistics.
By contrast, large non-Valley companies that partner with
Valley-based start-ups tend to move quickly: the smaller, more
nimble company pilots leading-edge ideas and technolo-
gies, while the big-branded partner helps refine and scale the
product. Done properly—with C-level strategic urgency on
both sides—these can be win–win partnerships. Case in point:
113How should you tap into Silicon Valley?

the arrangement between the major hotel chain Four Seasons
and start-up Medallia, developer of a digital platform that
captures customer feedback and helps manage customer
experiences across properties. The relationship not only
helped make the smaller company an industry leader but also
enabled the large hotelier to become world class at antici-
pating its guests’ needs.
Bigger betsMore ambitious but potentially fruitful endeavors include
opening technology centers in Silicon Valley and using acquisi-
tions to access local talent and cultivate a more innovative
culture away from legacy operations. These initiatives immerse
companies in Silicon Valley’s culture more fully than “toe in
the water” networking offices do and have more credibility. A
classic example is GE’s San Ramon–based Software Center,
which the company launched in 2012 after concluding that the
Internet of Things would significantly affect several of its core
businesses and that it still had time to build an IoT capability
from the ground up. GE attracted local talent from industry
leaders and start-ups alike and made substantial invest-
ments to achieve the needed scale. Currently, annual revenues
generated by the initiative have reached about $1 billion
annually—and are growing.
Walmart’s experience is another example. After several false
starts, and under pressure from large Internet retailers, its
e-commerce business relocated to Silicon Valley, where it has
become one of the three largest e-commerce enterprises
in the United States, with more than two thousand employees.
Ultimately, Silicon Valley’s sauce is no secret. Its ecosystem
benefits from a highly educated workforce and a critical mass of
excellence drawn from across the globe—in 2011, college
graduates born outside the United States held 60 percent of
the area’s science and engineering jobs. This talent can thrive
in a culture where personal networks run deep, noncompete
agreements are restricted, disruption is celebrated, and failure
is considered a rite of passage.
The three models we’ve highlighted for tapping into that eco-
system are points on a spectrum. The applicability of any of
these models depends on how well aligned a top-management
114 2015 Number 4

team is about the challenges on the horizon, the time a company
has before they become real, and their potential impact.
GE’s big bet on the Internet of Things, for example, reflected
the strong alignment of its management team, as well as
an understanding of the coming disruption and a belief that
the company had enough time to act itself. For others, the
ship may already have sailed, leaving them no choice but to
buy their way in or to go in a different direction entirely. The
key for most companies in a rapidly digitizing world is
to take stock of what Silicon Valley has to offer for their own
circumstances and then to chart a course accordingly.
Copyright © 2015 McKinsey & Company. All rights reserved.
1 See 2015 Silicon Valley Index, Silicon Valley Institute for Regional Studies, February 2015, jointventure.org.
2 Rachael King and Steven Rosenbush, “Mining Silicon Valley’s culture,” Wall Street Journal, July 24, 2013, wsj.com.
115
The authors wish to thank McKinsey’s Deepika Chauhan for her contribution to this article.
How should you tap into Silicon Valley?

116
Copyright © 2015 McKinsey & Company. All rights reserved.
The global gender-parity landscape
Extra Point
For more, see “Digging into the numbers on gender equality,” on page 90.
For the full report, see The power of parity: How advancing women’s equality can add $12 trillion to global growth, McKinsey Global Institute, September 2015, on mckinsey.com.
The McKinsey Global Institute has analyzed gender issues in 95 countries, using 15 indicators
to measure the cumulative global extent of gender inequality. These indicators encompass
its physical, social, political, and legal dimensions, in addition to workforce participation. Six
out of the 15 stand out for their high levels of gender inequality.
Q4 2015Extra Point: MGI GenderExhibit 1 of 1
Extremely high
% of countries1
Medium
Low
100%
Perceived wage gap for similar work
Leadership positions
Unpaid work Legal protection
Political representation
Violence against women
Gender inequality
1 Total number of countries per indicator varies, based on availability of data.
High
58
38
4
84
13
3
67
26
7
25
68
6
1
47
42
7
23
35
42
4


Highlights:
Competing in an agile age:
New research on how to combine
speed with stability; lessons
from the utility industry
Adhocracy: A model for moving
quickly and acting decisively
Spotlight on China: Perspectives
on Chinese innovation, online
auto sales, leadership challenges,
and the future of the economy
An executive’s guide to the Internet
of Things
Networked enterprises: Tracking
corporate use of social media
How to engage with Silicon Valley
Revisiting the matrix organization
Taking stock of gender equality
in today’s corporations: New data
from McKinsey and LeanIn.org,
plus commentary from global
managing director Dominic Barton
and two women leading McKinsey’s
gender-diversity efforts
mckinsey.com/quarterly