Embed Size (px)
Citation preview

2015 Minnesota Economic OutlookJanuary 6, 2015

minneapolisfed.org

Agenda
Minnesota Economy Outlook
Surveys Models
Sector Analysis Agriculture Manufacturing Home building

9th District
Cleveland

Comparing 2014 with last year’s forecast
Employment growth stronger than forecast
Unemployment rate lower than forecast
Personal income growth slightly slower than forecast
Home building somewhat weaker than forecast

1998
1999
2000
2001
2002
2003
2004
2005
2006
2007
2008
2009
2010
2011
2012
2013
2014
-5
-4
-3
-2
-1
0
1
2
3
4
2014 nonfarm employment stronger than forecast
Forecast
Actual
Percent change from a year earlier – 4th quarterMinnesota

1998
1999
2000
2001
2002
2003
2004
2005
2006
2007
2008
2009
2010
2011
2012
2013
2014
0
1
2
3
4
5
6
7
8
9
2014 unemployment ratelower than forecast
Forecast
Actual
4th quarterMinnesota

Information and Financial Services
Trade, Transportation and Utilities
Government
Total Nonfarm Employment
Education and Health Services
Construction
Leisure and Hospitality
Manufacturing
Professional and Business Services
Natural Resources and Mining
-1 0 1 2 3 4 5 6 7 8 9
Minnesota United States
Source: Bureau of Labor Statistics
Employment increased in most sectorsNonfarm employment, percent change from a year earlier,
November 2014

2007
2008
2009
2010
2011
2012
2013
2014
2015
0123456789
1011
5.8%
3.7%USMN
Minnesota’s unemployment rate below prerecession levels
Percent
Source: Bureau of Labor Statistics
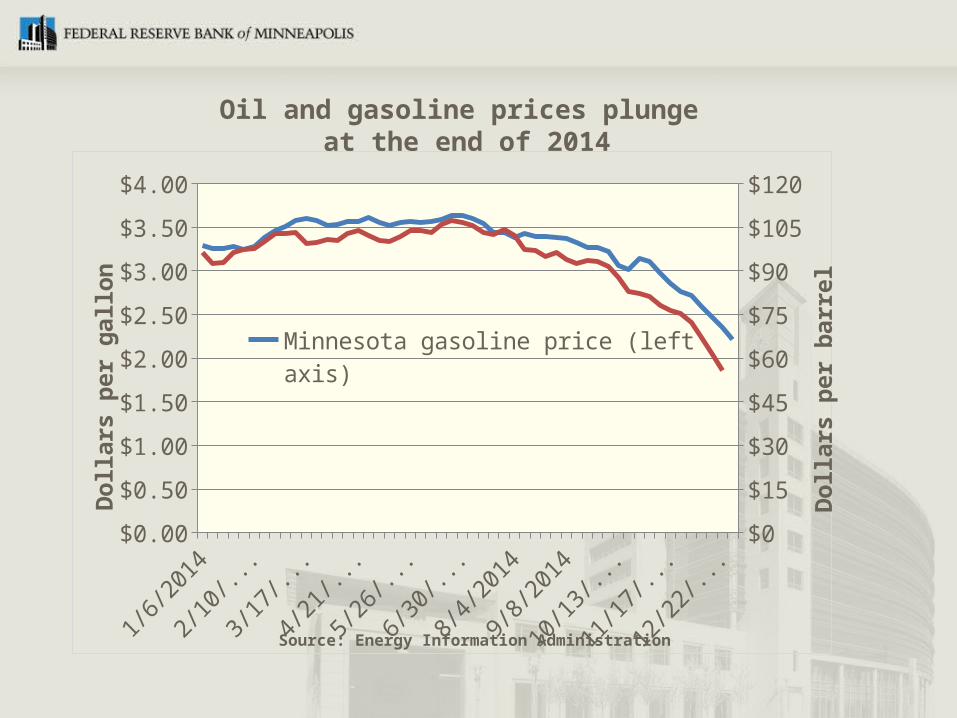
Oil and gasoline prices plunge at the end of 2014
$0.00
$0.50
$1.00
$1.50
$2.00
$2.50
$3.00
$3.50
$4.00
$0
$15
$30
$45
$60
$75
$90
$105
$120
Minnesota gasoline price (left axis)
WTI oil price (right axis)
Dollars
per
gallon
Dollars
per
barr
el
Source: Energy Information Administration

Forecast models: Solid employment growth and continued decrease in the unemployment rate
Business optimism near record high
Manufacturers expect growth
Home building flat
Minnesota economy: Signs of optimism for 2015

1997
1998
1999
2000
2001
2002
2003
2004
2005
2006
2007
2008
2009
2010
2011
2012
2013
2014
20150%
10%
20%
30%
40%
50%
60%
70%
80%
90%
100%
Business leader optimism jumps
Greater MN
Twin Cities
Percent of respondents selecting somewhat optimistic or very optimistic

Minnesota employment expected to grow by 1.9 percent
MN MT ND SD WI UP0.0
1.0
2.0
3.0
4.0
5.0
6.0
2014
2015
Nonfarm employment forecastPercent change from a year earlier – 4th quarter

Montana
U.P. of MI
Greater MN
South Dakota
District
North Dakota
Twin Cities
NW Wisconsin
0 20 40 60 80 100
2014 Out-look
2015 Out-look
Diffusion index*
Twin Cities business leaders expect increased employment at their
companies
*Index number above 50 indicates expansion. Index number below 50 indicates contraction.

Services
Total MN
Retail
Manufacturing
Construction
F.I.R.E.
0 20 40 60 80 100
2014 Out-look
2015 Out-look
Diffusion index*
Minnesota employment outlook positive
*Index number above 50 indicates expansion. Index number below 50 indicates contraction.

MN MT ND SD WI UP0
1
2
3
4
5
6
7
8
2014
2015
Unemployment rate – 4th quarter
Minnesota unemployment rate forecast at 3.3 percent by end of 2015

0% to 1%
2% to 3%
4% to 5%
Above 5%
0 10 20 30 40 50 60 70 80 90
2014 Out-look
2015 Out-look
Percent of respondents
Overall Minnesota business leaders anticipate moderate increases in wages and
salaries

Agriculture
Retail
Manufacturing
District
Construction
0 10 20 30 40 50 60 70 80 90 100
2014 Outlook
2015 Outlook
Diffusion index*
Minnesota business leaders foresee overall moderate price increases
*Index number above 50 indicates expansion. Index number below 50 indicates contraction.

Minnesota personal income growth expected to increase by 4.6 percent
MN MT ND SD WI0
1
2
3
4
5
6
2014
2015
Percent change from a year earlier – 4th quarterNot adjusted for inflation

Crop prices dropped
Average farm prices
2011/2012 2012/2013 Estimated 2013/2014
Projected 2014/2015
(Current $ per bushel)Corn 6.22 6.89 4.46 3.20-3.80Soybean 12.5 14.4 13.00 9.00-11.00Wheat 7.24 7.77 6.87 5.80-6.20
U.S. Department of Agriculture, estimates as of December 2014

Cattle prices solid
Average farm prices
2012 2013Estimated 2014 Projected 2015
(Current $ per cwt)All Milk 18.52 20.05 24.05-24.15 18.45-19.25Steers 122.82 125.89 155.29 160-172Hogs 60.88 64.05 76.22 63-68
U.S. Department of Agriculture, estimates as of December 2014

Minnesota manufacturing survey indicates
faster growth expected in 2015
Investment
Profits
Employment
Production level
0 20 40 60 80 100
2014 Ac-tual
2015 Outlook
Diffusion index*
*Index number above 50 indicates expansion. Index number below 50 indicates contraction.

1998
1999
2000
2001
2002
2003
2004
2005
2006
2007
2008
2009
2010
2011
2012
2013
2014*0
5,000
10,000
15,000
20,000
25,000
30,000
35,000
40,000
45,000
Home building recovery moderates in Minnesota
Housing Units Authorized*Estimate based on November year-to-date change from 2013 to 2014

UP of MI
SD
Western WI
MT
Greater MN
MPLS MSA
ND
0 10 20 30 40 50 60 70 80 90 100
2014 Outlook
2015 Outlook
Diffusion index*
Minnesota business leaders expect slower growth in home building
*Index number above 50 indicates expansion. Index number below 50 indicates contraction.

Minnesota economy: Signs of optimism for 2015
Forecast models: Solid employment growth and continued decrease in the unemployment rate
Business optimism at record high
Manufacturers expect growth
Home building flat

Questions?