Embed Size (px)
Citation preview

DISCLOSURE: Raptor Partners LLC is a registered broker-dealer with the U.S. Securities Exchange Commission and a member of the Financial Industry Regulatory Authority. This document is not a “research report”, as such term is defined by applicable laws and regulations. The information in this report has been obtained from third-party sources deemed to be reliable, but is not represented to be complete. This document has been prepared for general information purposes only and does not represent a complete analysis of any specific security, industry or issuer. This information contained in this document does not represent an offer or a solicitation of an offer to buy or sell securities of any form or to participate in any particular trading strategy. This document does not consider the investment objectives or financial situation of any individual or entity. Raptor Partners has provided, may continue to provide, or may seek to provide investment banking services for companies included in this document.
2015 Mergers & Acquisitions Second Quarter Review
ONE NORTH SHORE CENTER | 12 FEDERAL STREET, 2ND FLOOR | PITTSBURGH, PA 15212
MERGERS & ACQUISITIONS | CORPORATE FINANCE | FAIRNESS OPINIONS
VISION INTEGRITY EXPERIENCE
Summer 2015

10,691
11,513
10,0038,928
12,729
14,662
16,468 16,477
18,55819,082
4,5364,486
$0
$400
$800
$1,200
$1,600
$2,000
0
4,000
8,000
12,000
16,000
20,000
2006 2007 2008 2009 2010 2011 2012 2013 2014 LTM Q22014
Q22015
Agg
rega
te V
alue
($
Bill
ions
)
Tra
nsac
tions
Ann
ounc
ed
Transactions Announced Aggregate Value
VISION INTEGRITY EXPERIENCE
M&A Market Monitor
Summer 2015
1
Source: Standard & Poor’s CapitalIQ Excludes minority interest purchases and share buybacks.
In This Report:
1 M&A Commentary
2 Global M&A Activity
3 U.S. M&A Statistics
4 Industrials & Materials
5 Healthcare & Life Sciences
6 Business Services
7 Software & Technology
8 Consumer Products/Services
9 Private Equity & LBO Activity
Mergers & Acquisitions Q2 2015 Market Review
M&A Activity at Record Levels: After a bullish start to the year, the M&A market has remained at record levels in Q2 with nearly 4,500 deals announced with an aggregate value of $570 billion. Although Q2 2015 volume was flat versus Q2 2014, aggregate transaction value grew over 50% in the current quarter with a growing number of multi-billion dollar deals fueling the increase.
Valuation Multiples Remain Strong Across Industry Sectors: Valuation multiples paid by acquirors remained strong in Q2 2015. The Industrials and Materials, Healthcare and Life Sciences, and Software and Technology sectors all saw takeover multiples remain near or above six-year highs.
Value of $1 Billion+ Deals Spikes: In Q2 2015, the number of large ($1 billion+) transactions in the U.S. was 57, up slightly from 53 in Q2 2014, however, the aggregate transaction value of these deals increased a remarkable 90.2% from $251 billion in Q2 2014 to $477 billion in Q2 2015. The quarter saw nine mega deals (each valued in excess of $10 billion) announced in several different sectors, which accounted for the lion’s share of transaction value for the quarter. Deals included Williams Companies/Energy Transfer Equity $81.5 billion, Time Warner Cable/Charter Communications $78.2 billion, Cigna/Anthem $50.9 billion, and Broadcom/Avago $33.7 billion amongst others.
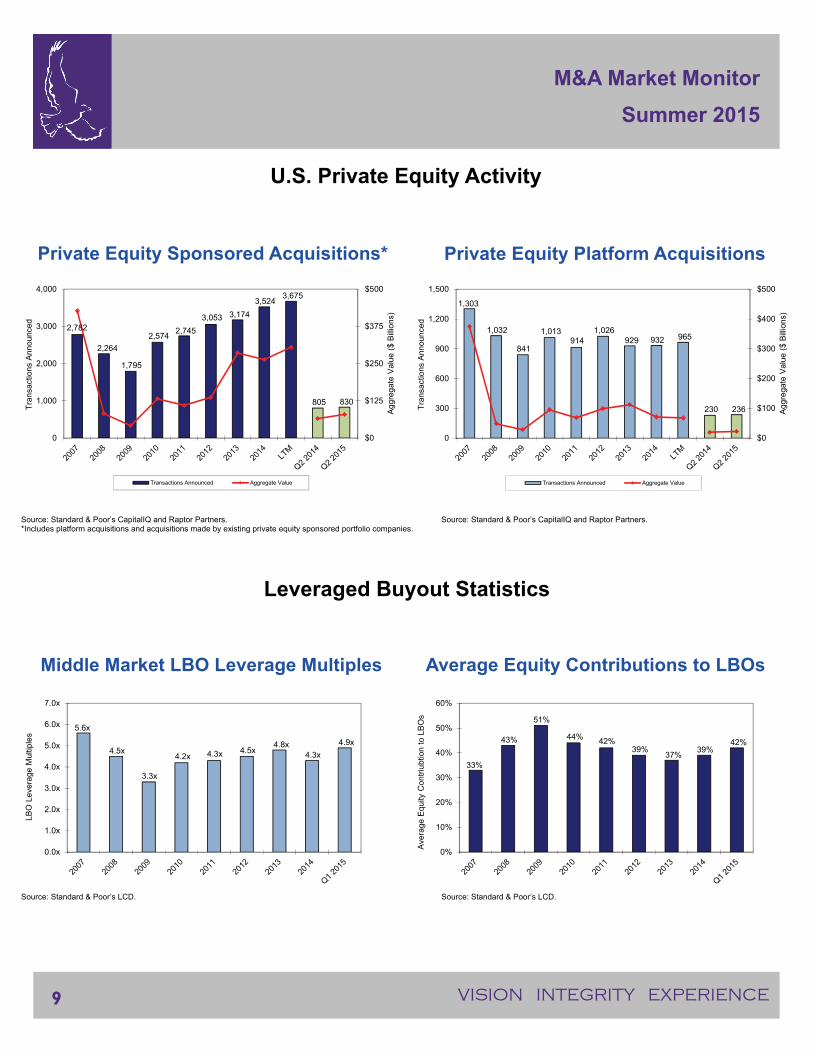
Private Equity Activity Up Slightly: The number of private equity platform acquisitions increased 2.6% during the quarter versus last year, while the aggregate value of transactions increased 11.9%. Private equity platform transactions has been relatively flat over the past several years as PE firms have had to compete with aggressive strategic investors looking to supplement slower organic growth with acquisitions.
LBO Leverage Multiples Fall, Valuation Multiples Strong: LBO leverage multiples for middle market transactions (EBITDA less than $50 million) began to decline in 2015 to 4.9x versus 5.3x in 2014. Increased regulation meant to avoid a repeat of the over-levered conditions prior to the 2008 recession have added pressure to reduce the debt multiples. Due to the restrictions, non-bank or institutional lenders have invested in the majority of debt issued by private equity-backed companies. Equity contributions to LBOs have increased as the valuation multiples paid by private equity buyers have risen in order to compete with the aggressive strategic investors. During 2015, EBITDA multiples for larger LBO transactions remained near 10x, which is above the highs reached in 2007.
U.S. Merger & Acquisition Activity

46.7%
32.1%
17.0%
4.2%
44.5%
31.2%
19.2%
5.1%
32,143
35,568
31,668
27,509
36,612
40,78341,853 41,122
45,748 46,849
11,246 11,176
$0
$800
$1,600
$2,400
$3,200
$4,000
0
10,000
20,000
30,000
40,000
50,000
2006 2007 2008 2009 2010 2011 2012 2013 2014 LTM Q22014
Q22015
Agg
rega
te V
alue
($
Bill
ions
)
Tra
nsac
tions
Ann
ounc
ed
Transactions Announced Aggregate Value
44.5%
31.0%
19.5%
5.0%
44.2%
33.2%
17.7%
4.9%
VISION INTEGRITY EXPERIENCE
M&A Market Monitor
Summer 2015
2
Global Merger & Acquisition Activity
Source: Standard & Poor’s CapitalIQ Excludes minority interest purchases and share buybacks.
Merger & Acquisition Activity by Geography
North America Europe Asia/Pacific Other
Source: Standard & Poor’s CapitalIQ and Raptor Partners
2014 2013 1H 2015 1H 2014

8.9x
10.3x
8.1x 8.2x
9.7x
8.3x
11.1x 11.6x
10.1x10.9x 10.7x
10.3x
0.0x
2.0x
4.0x
6.0x
8.0x
10.0x
12.0x
2010 2011 2012 2013 2014 LTM
<$100mm $100mm - $500mm
Transaction Volume Aggregate Transaction Value ($B)Transaction Value 1H 2015 1H 2014 % Change 1H 2015 1H 2014 % Change
$1 Billion + 111 94 18.1% $789.2 $397.3 98.7%
$500M - $1B 73 71 2.8% $49.4 $50.0 -1.1%
$250M - $500M 110 137 -19.7% $37.6 $47.8 -21.2%
$100M - $250M 259 303 -14.5% $39.1 $46.8 -16.4%
$75M - $100M 129 129 0.0% $11.0 $11.0 -0.6%
$50M - $75M 257 241 6.6% $15.4 $14.5 6.6%
$25M - $50M 542 509 6.5% $19.2 $18.0 6.9%
>$0M - $25M 2,218 2,466 -10.1% $18.0 $19.4 -7.5%
Undisclosed 5,585 4,931 13.3% NA NA NA
Total 9,284 8,881 4.5% $978.8 $604.6 61.9%
Years Ended December 31,
2010 2011 2012 2013 2014 LTM
One Day Discount -23.8% -23.6% -27.4% -22.3% -22.0% -19.8%
One Week Discount -24.6% -24.1% -27.1% -24.9% -22.2% -21.4%
Four Week Discount -26.9% -25.3% -27.9% -27.6% -23.7% -22.5%
Years Ended December 31,
2010 2011 2012 2013 2014 LTM
One Day Premium 31.3% 30.9% 37.8% 28.7% 28.2% 24.7%
One Week Premium 32.6% 31.8% 37.2% 33.2% 28.5% 27.2%
Four Week Premium 36.8% 33.9% 38.7% 38.1% 31.0% 29.1%
Median Enterprise Value/EBITDA
VISION INTEGRITY EXPERIENCE
M&A Market Monitor
Summer 2015
3
U.S. Transaction Volume by Deal Size
Source: Standard & Poor’s CapitalIQ and Raptor Partners
U.S. Merger & Acquisition Control Premiums and Minority Discounts Median M&A Control Premiums Median M&A Minority Discounts
Source: Standard & Poor’s CapitalIQ and Raptor Partners
U.S. Middle Market Merger & Acquisition Valuation Multiples
Source: Standard & Poor’s CapitalIQ and Raptor Partners

EV/
Date Target Acquiror EV Sales EBITDA
11/04/2014 Baker Hughes Incorporated (NYSE:BHI) Halliburton Company (NYSE:HAL) $38.3 B 1.6x 9.0x
7/10/2014 TRW Automotive Holdings Corp. (NYSE:TRW) ZF Friedrichshafen AG $13.6 B 0.8x 7.3x5/13/2015 Pall Corporation (NYSE:PLL) Danaher Corp. (NYSE:DHR) $13.6 B 4.8x 20.4x
1/26/2015 MeadWestvaco Corporation (NYSE:MWV) Rock-Tenn Company (NYSE:RKT) $10.9 B 1.9x 11.2x
9/21/2014 Dresser-Rand Group Inc. (NYSE:DRC) Siemens Energy, Inc. $7.5 B 2.7x 18.8x3/11/2015 ITR Concession Company LLC IFM Investors Pty Ltd $7.5 B NA NA
7/15/2014 Rockwood Holdings, Inc. (NYSE:ROC) Albemarle Corporation (NYSE:ALB) $6.9 B 4.9x 22.2x
7/13/2014 URS Corporation (NYSE:URS) AECOM Technology Corporation (NYSE:ACM) $5.6 B 0.5x 7.6x
3/27/2015The Dow Chemical Company, Chlor-Alkali and Downstream Derivatives Businesses Olin Corp. (NYSE:OLN) $5.1 B NA 8.0x
4/29/2014 Orbital Sciences Corp. (NYSE:ORB) Alliant Techsystems Inc. (NYSE:ATK) $3.6 B 2.7x 24.6x
4/13/2015 ProBuild Holdings, Inc. Builders FirstSource, Inc. (NasdaqGS:BLDR) $3.4 B 0.8x NA
2/23/2015 Polypore International Inc. (NYSE:PPO) ESM Holdings Corporation $3.2 B 4.8x 21.4x
6/23/2015 Capital Safety Group 3M Company (NYSE:MMM) $2.5 B 5.8x NA
2009 2010 2011 2012 2013 2014 LTMEV/Sales* 0.82x 0.89x 0.93x 0.86x 1.10x 1.09x 1.00xRevenue $M* $22.6 $54.8 $47.1 $100.0 $104.7 $80.0 $69.7Observations (93) (144) (172) (149) (95) (173) (144)
EV/EBITDA* 7.1x 8.6x 9.2x 8.7x 8.6x 9.7x 10.7xEBITDA $M* $10.2 $35.0 $13.7 $26.7 $35.0 $33.4 $24.0Observations (18) (46) (56) (51) (33) (61) (61)
Volume 1,211 1,573 1,765 1,850 1,538 1,868 1,794Value $B $39.8 $91.8 $122.0 $99.0 $79.0 $180.6 $212.2
0.8x 0.9x 0.9x 0.9x1.1x 1.1x 1.0x
7.1x
8.6x9.2x
8.7x 8.6x9.7x
10.7x
0
700
1,400
2,100
2,800
0x
3x
6x
9x
12x
2009 2010 2011 2012 2013 2014 LTM
EV/Sales* EV/EBITDA* Volume
VISION INTEGRITY EXPERIENCE
M&A Market Monitor
Summer 2015
4
Sector Spotlight: Industrials & Materials U.S. Deal Statistics
Source: Standard & Poor’s CapitalIQ & Raptor Partners *Represents group median
Recent U.S. Industrials & Materials Transactions

EV/
Date Target Acquiror EV Sales EBITDA
11/17/2014 Allergan Inc. (NYSE:AGN) Actavis plc (NYSE:ACT) $65.3 B 9.3x 28.0x
6/20/2015 Cigna Corp. (NYSE:CI) Anthem, Inc. (NYSE:ANTM) $50.9 B 1.4x 13.1x
6/15/2014 Covidien plc (NYSE:COV) Medtronic, Inc. (NYSE:MDT) $46.9 B 4.5x 16.8x
3/04/2015 Pharmacyclics Inc. (NasdaqGS:PCYC) AbbVie Inc. (NYSE:ABBV) $19.0 B 26.1x NM
9/22/2014 Sigma-Aldrich Corporation (NasdaqGS:SIAL) Merck KGaA (DB:MRK) $16.5 B 6.0x 19.8x
2/05/2015 Hospira Inc. (NYSE:HSP) Pfizer Inc. (NYSE:PFE) $16.3 B 3.7x 21.9x
5/06/2014 Merck & Co. Consumer Care Business Bayer AG (DB:BAYN) $14.2 B NA NA
2/22/2015 Salix Pharmaceuticals Ltd. Valeant Pharmaceuticals International $13.5 B 12.0x NM
3/30/2015 Catamaran Corporation (TSX:CCT) OptumRx, Inc. $13.2 B 0.6x 15.6x
10/05/2014 CareFusion Corporation (NYSE:CFN) Becton, Dickinson and Company (NYSE:BDX) $12.1 B 3.1x 13.6x
6/20/2015 Omnicare Inc. (NYSE:OCR) CVS Pharmacy, Inc. $11.3 B 1.7x 15.0x
5/21/2015 Par Pharmaceutical Holdings, Inc. Endo International plc (NasdaqGS:ENDP) $10.2 B 7.4x 21.7x
5/18/2015 Synageva BioPharma Corp. Alexion Pharmaceuticals, Inc. (NasdaqGS:ALXN) $8.2 B NA NA
2009 2010 2011 2012 2013 2014 LTMEV/Sales* 1.21x 1.59x 1.83x 2.03x 1.83x 2.79x 2.05xRevenue $M* $20.7 $39.0 $36.4 $53.1 $59.9 $44.1 $31.7Observations (94) (162) (157) (115) (75) (104) (109)
EV/EBITDA* 7.7x 10.4x 9.6x 9.2x 9.6x 12.9x 12.9xEBITDA $M* $25.3 $21.3 $23.4 $21.3 $28.5 $16.7 $19.5Observations (25) (49) (46) (45) (19) (47) (50)
Volume 847 1,182 1,099 1,197 1,262 1,450 1,455Value $B $190.0 $119.4 $166.2 $110.1 $112.2 $264.0 $354.5
1.2x 1.6x 1.8x 2.0x 1.8x2.8x
2.0x
7.7x
10.4x9.6x 9.2x 9.6x
12.9x 12.9x
0
400
800
1,200
1,600
2,000
0x
3x
6x
9x
12x
15x
2009 2010 2011 2012 2013 2014 LTM
EV/Sales* EV/EBITDA* Volume
VISION INTEGRITY EXPERIENCE
M&A Market Monitor
Summer 2015
5
Sector Spotlight: Healthcare & Life Sciences U.S. Deal Statistics
Source: Standard & Poor’s CapitalIQ & Raptor Partners *Represents group median
Recent U.S. Healthcare & Life Sciences Transactions

1.1x 1.2x 1.2x 0.9x 1.0x 1.3x 1.5x
8.8x
10.2x 9.7x
9.0x8.4x
9.8x 9.0x
0
700
1,400
2,100
2,800
3,500
0x
3x
6x
9x
12x
15x
2009 2010 2011 2012 2013 2014 LTM
EV/Sales* EV/EBITDA* Volume
EV/
Date Target Acquiror EV Sales EBITDA
2/05/2015 Verizon Wireline Assets in CA, FL, and TX Frontier Communications Corporation (NasdaqGS:FTR) $10.5 B 1.8x 6.6x
6/30/2015 Towers Watson & Co. (NasdaqGS:TW)Willis Group Holdings Public Limited Company (NYSE:WSH) $7.9 B 2.2x 11.0x
6/29/2015Gelco Corporation, U.S., Mexico, Australia and New Zealand Fleet Operations Element Financial Corporation (TSX:EFN) $6.9 B NA NA
2/05/2015 Wireless Communication Sites of Verizon American Tower Corporation (NYSE:AMT) $5.1 B NA NA
6/15/2015Dealertrack Technologies, Inc. (NasdaqGS:TRAK) Cox Automotive, Inc. $4.5 B 4.7x 36.1x
4/27/2015 iGATE Corporation (NasdaqGM:IGTE) Capgemini North America, Inc. $4.5 B 3.5x 17.9x
11/03/2014 Sapient Corp. (NasdaqGS:SAPE) Publicis Groupe SA (ENXTPA:PUB) $3.4 B 2.4x 19.2x
9/11/2014 Conversant, Inc. (NasdaqGS:CNVR) Alliance Data Systems Corporation (NYSE:ADS) $2.4 B 4.0x 12.0x
6/30/2015 AlliedBarton Security Services LLC Wendel (ENXTPA:MF) $1.7 B NA NA
5/26/2015 Virtustream, Inc. EMC Corporation (NYSE:EMC) $1.2 B NA NA
7/31/2014 ViaWest, Inc. Shaw Communications, Inc. (TSX:SJR.B) $1.2 B NA 13.0x
5/06/2015 Quality Distribution Inc. (NasdaqGM:QLTY) Apax Partners LLP $0.8 B 0.8x 11.3x
4/21/2015 Command Transportation, LLC Echo Global Logistics, Inc. (NasdaqGS:ECHO) $0.4 B 0.7x 11.1x
2009 2010 2011 2012 2013 2014 LTMEV/Sales* 1.12x 1.20x 1.16x 0.88x 0.97x 1.26x 1.48xRevenue $M* $59.3 $42.0 $44.6 $40.5 $40.0 $27.4 $33.4Observations (68) (99) (119) (89) (105) (145) (161)
EV/EBITDA* 8.8x 10.2x 9.7x 9.0x 8.4x 9.8x 9.0xEBITDA $M* $17.9 $22.0 $10.7 $27.2 $28.1 $14.0 $12.9Observations (15) (30) (37) (31) (36) (53) (66)
Volume 1,817 2,517 2,538 2,051 2,285 3,065 3,110Value $B $79.9 $63.9 $57.9 $50.8 $71.5 $100.4 $110.8
VISION INTEGRITY EXPERIENCE
M&A Market Monitor
Summer 2015
6
Sector Spotlight: Business Services U.S. Deal Statistics
Source: Standard & Poor’s CapitalIQ & Raptor Partners *Represents group median
Recent U.S. Business Services Transactions

EV/
Date Target Acquiror EV Sales EBITDA
5/28/2015 Broadcom Corp. (NasdaqGS:BRCM) Avago Technologies Limited (NasdaqGS:AVGO) $33.7 B 4.0x 18.8x
3/01/2015 Freescale Semiconductor, Ltd. (NYSE:FSL) NXP Semiconductors NV (NasdaqGS:NXPI) $16.6 B 3.6x 16.1x
6/01/2015 Altera Corp. (NasdaqGS:ALTR) Intel Corporation (NasdaqGS:INTC) $15.8 B 8.3x 27.4x
3/31/2015 Bright House Netw orks, LLC CCH I, LLC $10.4 B NA NA
9/18/2014 Concur Technologies, Inc. (NasdaqGS:CNQR) SAP America, Inc. $7.7 B 11.5x NA
6/16/2014 TW Telecom Inc. (NasdaqGS:TWTC) Level 3 Communications, Inc. (NYSE:LVLT) $7.4 B 4.6x 14.2x
6/23/2014 MICROS Systems, Inc. (NasdaqGS:MCRS) Oracle Corporation (NYSE:ORCL) $4.6 B 3.4x 17.5x
4/07/2015 Informatica Corporation (NasdaqGS:INFA) Permira Advisers Ltd.; Canada Pension Plan Investment $4.8 B 4.6x 25.6x
6/15/2015 Dealertrack Technologies (NasdaqGS:TRAK) Cox Automotive, Inc. $4.5 B 4.7x 36.1x
5/12/2015 AOL Inc. (NYSE:AOL) Verizon Communications Inc. (NYSE:VZ) $4.3 B 1.7x 9.9x
9/29/2014 TIBCO Softw are Inc. (NasdaqGS:TIBX) Vista Equity Partners $4.2 B 3.9x 24.8x
5/07/2015 Micrel Inc. (NasdaqGS:MCRL) Microchip Technology Inc. (NasdaqGS:MCHP) $0.7 B 2.9x 25.4x
5/13/2015 Integrated Silicon Solution, Inc. (NasdaqGS:ISSI) Cypress Semiconductor Corporation (NasdaqGS:CY) $0.7 B 2.0x 22.7x
2009 2010 2011 2012 2013 2014 LTMEV/Sales* 1.46x 1.57x 1.90x 1.66x 1.68x 2.30x 2.20xRevenue $M* $44.2 $38.5 $31.6 $39.9 $52.9 $35.2 $48.6Observations (149) (225) (216) (165) (119) (178) (172)
EV/EBITDA* 9.2x 11.0x 12.0x 10.8x 11.2x 15.3x 16.8xEBITDA $M* $40.7 $18.0 $20.2 $15.3 $25.8 $19.7 $26.2Observations (43) (65) (78) (48) (33) (70) (72)
Volume 1,573 2,115 2,057 2,064 2,052 2,437 2,465Value $B $90.3 $136.6 $128.4 $103.4 $124.5 $172.7 $234.4
VISION INTEGRITY EXPERIENCE
M&A Market Monitor
Summer 2015
7
Sector Spotlight: Software & Technology U.S. Deal Statistics
Source: Standard & Poor’s CapitalIQ & Raptor Partners *Represents group median
Recent U.S. Software & Technology Transactions
1.5x 1.6x 1.9x 1.7x 1.7x 2.3x 2.2x
9.2x
11.0x12.0x
10.8x 11.2x
15.3x16.8x
0
600
1,200
1,800
2,400
3,000
0x
4x
8x
12x
16x
20x
2009 2010 2011 2012 2013 2014 LTM
EV/Sales* EV/EBITDA* Volume

0.9x 1.3x 1.3x 1.0x 1.2x 0.9x 0.9x
9.5x 8.9x
8.4x9.3x
9.9x
12.1x
10.5x
0
700
1,400
2,100
2,800
3,500
0x
3x
6x
9x
12x
15x
2009 2010 2011 2012 2013 2014 LTM
EV/Sales* EV/EBITDA* Volume
EV/
Date Target Acquiror EV Sales EBITDA
5/26/2015 Time Warner Cable Inc. (NYSE:TWC) Charter Communications, Inc. (NasdaqGS:CHTR) $78.2 B 3.4x 9.8x
5/18/2014 DIRECTV (NasdaqGS:DTV) AT&T, Inc. (NYSE:T) $65.9 B 2.1x 8.1x
3/25/2015 Kraft Foods Group, Inc. (NasdaqGS:KRFT) H.J. Heinz Holding Corporation $53.7 B 3.0x 22.6x
7/15/2014 Lorillard, Inc. (NYSE:LO) Reynolds American Inc. (NYSE:RAI) $27.6 B 5.5x 12.8x
7/28/2014 Family Dollar Stores Inc. (NYSE:FDO) Dollar Tree, Inc. (NasdaqGS:DLTR) $9.2 B 0.9x 11.3x12/14/2014 PetSmart, Inc. (NasdaqGS:PETM) BC Partners $8.8 B 1.3x 9.0x
5/29/2014 The Hillshire Brands Company (NYSE:HSH) Tyson Foods, Inc. (NYSE:TSN) $8.5 B 2.1x 15.8x
2/04/2015 Office Depot, Inc. (NasdaqGS:ODP) Staples, Inc. (NasdaqGS:SPLS) $6.9 B 0.4x 12.9x
8/01/2014 Bally Technologies, Inc. (NYSE:BYI) Scientific Games Corporation (NasdaqGS:SGMS) $5.1 B 4.2x 12.1x
3/16/2015 Life Time Fitness, Inc. (NYSE:LTM) Leonard Green & Partners, L.P. $4.1 B 3.2x 10.9x
9/08/2014 GE Appliances Business Electrolux AB (OM:ELUX B) $3.3 B 0.6x 9.4x
6/14/2015 Ryland Group Inc. (NYSE:RYL) Standard Pacific Corp. (NYSE:SPF) $3.1 B 1.2x 10.0x
5/18/2015 ANN INC. (NYSE:ANN) Ascena Retail Group Inc. (NasdaqGS:ASNA) $2.0 B 0.8x 8.4x
VISION INTEGRITY EXPERIENCE
M&A Market Monitor
Summer 2015
8
Sector Spotlight: Consumer Products & Services U.S. Deal Statistics
Source: Standard & Poor’s CapitalIQ & Raptor Partners *Represents group median
Recent U.S. Consumer Products & Services Transactions
2009 2010 2011 2012 2013 2014 LTMEV/Sales* 0.90x 1.26x 1.33x 0.98x 1.18x 0.88x 0.94xRevenue $M* $53.0 $55.2 $40.9 $100.9 $133.2 $90.9 $100.0Observations (100) (155) (165) (180) (106) (143) (147)
EV/EBITDA* 9.5x 8.9x 8.4x 9.3x 9.9x 12.1x 10.5xEBITDA $M* $44.9 $30.4 $27.0 $28.2 $65.7 $29.2 $28.2Observations (32) (64) (50) (76) (53) (68) (59)
Volume 1,868 2,319 2,463 2,904 2,741 3,021 3,087Value $B $115.6 $115.0 $84.1 $189.6 $169.7 $364.2 $310.0
33%
43%
51%
44% 42%39%
37%39%
42%
0%
10%
20%
30%
40%
50%
60%
Ave
rage
Equ
ity C
ontr
iubt
ion
to L
BO
s
2,782
2,264
1,795
2,5742,745
3,053 3,174
3,5243,675
805 830
$0
$125
$250
$375
$500
0
1,000
2,000
3,000
4,000
Ag
greg
ate
Val
ue (
$ B
illio
ns)
Tra
nsa
ctio
ns A
nnou
nced
Transactions Announced Aggregate Value
1,303
1,032
841
1,013914
1,026929 932 965
230 236
$0
$100
$200
$300
$400
$500
0
300
600
900
1,200
1,500
Agg
rega
te V
alue
($
Bill
ions
)
Tra
nsac
tions
Ann
oun
ced
Transactions Announced Aggregate Value
VISION INTEGRITY EXPERIENCE
M&A Market Monitor
Summer 2015
9
U.S. Private Equity Activity
Source: Standard & Poor’s CapitalIQ and Raptor Partners. *Includes platform acquisitions and acquisitions made by existing private equity sponsored portfolio companies.
Private Equity Sponsored Acquisitions*
Source: Standard & Poor’s CapitalIQ and Raptor Partners.
Leveraged Buyout Statistics
Private Equity Platform Acquisitions
Middle Market LBO Leverage Multiples Average Equity Contributions to LBOs
5.6x
4.5x
3.3x
4.2x 4.3x 4.5x4.8x
4.3x
4.9x
0.0x
1.0x
2.0x
3.0x
4.0x
5.0x
6.0x
7.0x
LBO
Lev
erag
e M
ultip
les
Source: Standard & Poor’s LCD. Source: Standard & Poor’s LCD.

O N S C 12 F S , 2 F P , PA 15212
P : (412) 281‐5151 F : (412) 564‐9900 E‐M : .
Specialty Manufacturing | Business Services | So ware & Technology Healthcare, Life Sciences & Safety | Consumer Products & Services
For the last 30 years, our professionals have assisted private and public companies navigate the turbulent terrain of mergers, acquisi ons and private
capital, with over $35 billion in transac onal experience.
For a confiden al discussion on how Raptor Partners can serve your company’s needs, please call Craig A. Wolfanger,
Execu ve Managing Director, at (412) 281‐1101.
$35+ Billion in Experience
Advisory Services:
Mergers & Acquisi ons
Corporate Carve‐outs & Dives tures
Cross‐Border Transac ons
Fairness Opinions
Valua ons
Strategic Alterna ves
Corporate Finance
Capital Structure
Restructuring
Private Capital Raising
Takeover Defense
www.RAPTORLLC.com
has been acquired by
CHART INDUSTRIES
Raptor Partners acted as financial advisor to SeQual Technologies and
rendered a fairness opinion.
has sold its Watertown Deep Drawn Products Division
to
HARWOOD CAPITAL LLP
Raptor Partners acted as financial advisor to Accellent.
has acquired the Creosote Distribution Business
from
KMG CHEMICALS
Raptor Partners acted as financial advisor to Koppers and assisted in the
negotiations.
Raptor Partners acted as financial advisor to Aris Corporation.
has been acquired by
ASSETMARK
has acquired the U.S. IT Staffing Business
from
HUDSON GLOBAL
Raptor Partners acted as financial advisor to Mastech and assisted in the
negotiations.
Raptor Partners acted as financial advisor to Industrial Scientific Corporation and assisted in the
negotiations.
INDUSTRIAL SAFETY TECHNOLOGIES, A BATTERY
VENTURES COMPANY
has been acquired by