Embed Size (px)
Citation preview

2015 IBM Annual Report
20
15 IB
M A
nn
ua
l Re
po
rt


Dear IBM Investor:
IBM is unique. It is the only company in our industry that
has reinvented itself through multiple technology eras and
economic cycles. We do so for one reason: to create
differentiating value for our clients and for you, our owners.
We are doing so again, in an IT industry that is
fundamentally reordering at an unprecedented pace.
In important ways, our industry is unrecognizable from
what it looked like just a few years ago. So is your company.
Today, IBM is much more than a “hardware, software,
services” company. IBM is now emerging as a cognitive
solutions and cloud platform company.

2 A Letter from the Chairman
Virginia M. Rometty
Chairman, President and
Chief Executive Officer
2015 IBM Annual Report 3
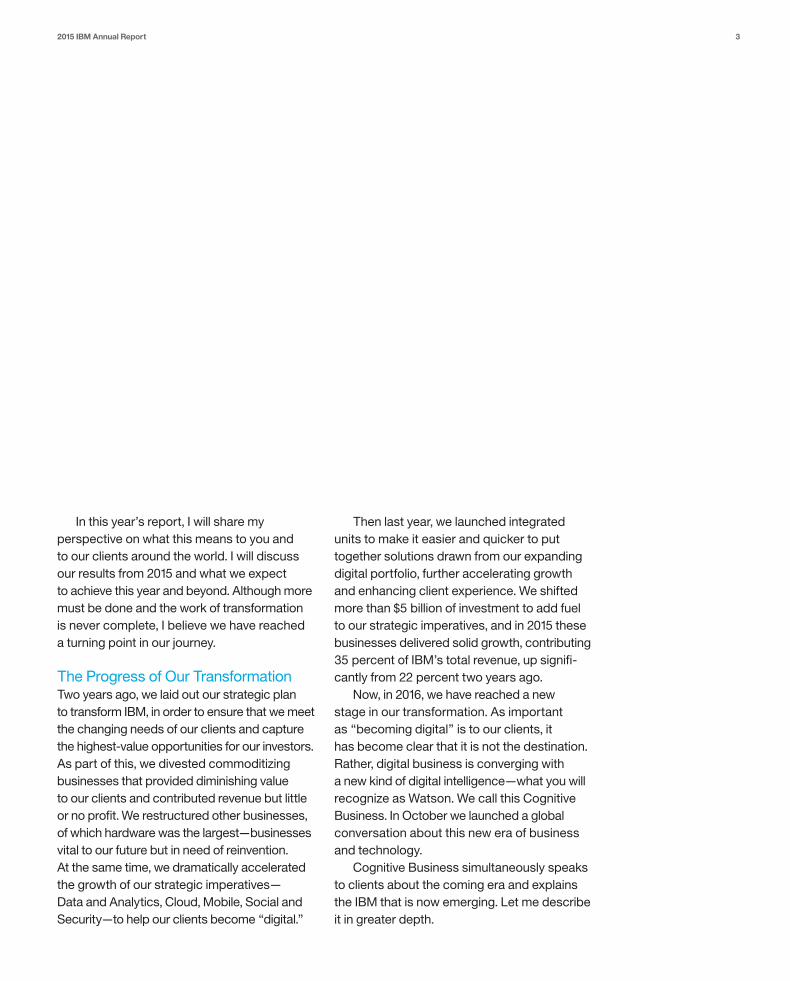
Then last year, we launched integrated
units to make it easier and quicker to put
together solutions drawn from our expanding
digital portfolio, further accelerating growth
and enhancing client experience. We shifted
more than $5 billion of investment to add fuel
to our strategic imperatives, and in 2015 these
businesses delivered solid growth, contributing
35 percent of IBM’s total revenue, up signifi -
cantly from 22 percent two years ago.
Now, in 2016, we have reached a new
stage in our transformation. As important
as “becoming digital” is to our clients, it
has become clear that it is not the destination.
Rather, digital business is converging with
a new kind of digital intelligence—what you will
recognize as Watson. We call this Cognitive
Business. In October we launched a global
conversation about this new era of business
and technology.
Cognitive Business simultaneously speaks
to clients about the coming era and explains
the IBM that is now emerging. Let me describe
it in greater depth.
In this year’s report, I will share my
perspective on what this means to you and
to our clients around the world. I will discuss
our results from 2015 and what we expect
to achieve this year and beyond. Although more
must be done and the work of transformation
is never complete, I believe we have reached
a turning point in our journey.
The Progress of Our TransformationTwo years ago, we laid out our strategic plan
to transform IBM, in order to ensure that we meet
the changing needs of our clients and capture
the highest-value opportunities for our investors.
As part of this, we divested commoditizing
businesses that provided diminishing value
to our clients and contributed revenue but little
or no profi t. We restructured other businesses,
of which hardware was the largest—businesses
vital to our future but in need of reinvention.
At the same time, we dramatically accelerated
the growth of our strategic imperatives—
Data and Analytics, Cloud, Mobile, Social and
Security—to help our clients become “digital.”

4 A Letter from the Chairman
Cognitive includes—but is broader than—
artifi cial intelligence, machine learning and natural
language processing. And its embodiment
is Watson.
Watson has come a long way since it won
on the American quiz show Jeopardy! in 2011.
Back then, it did one thing: natural language Q&A,
powered by fi ve technologies. Today, Q&A is
just one of more than 30 Watson capabilities—
all of which have been turned into digital services,
or application programming interfaces (APIs),
delivered via the cloud. This means that we can
literally build cognition into everything digital.
With Watson, every digital application, product
and process can understand, reason and learn.
You can see why cognitive is becoming the
heart of our solutions businesses. What started
as one Watson unit is now a growing family:
the core Watson team, which continues to build
new capabilities and nurture its expanding
ecosystem; and individual Watson businesses,
aimed at particular industries or professional
domains, such as IBM Watson Health and
IBM Watson Internet of Things. Each business
brings together Watson capabilities with industry
expertise, vast data sets and an ecosystem
of partners and clients, and each is powered
by the IBM Cloud.
Our Solutions Are Cognitive Data is the world’s
new natural resource, and it is transforming
all industries and professions. IBM has been
building and acquiring the capabilities
necessary to lead in data and analytics,
deepening our industry expertise and growing
partnerships and ecosystems. Today, our data
and analytics business is the industry leader,
generating revenue of $18 billion in 2015.
This is a strong and growing business—
but its potential is actually much greater.
That potential lies in the 80 percent of the
world’s data that is unstructured: everything
we encode in language—from textbooks
and formulas to literature and conversation—
plus all digital video, audio and images. This
unstructured data has been essentially
invisible to computers. They can capture, store
and process it, but they cannot understand
what it means.
But with cognitive technology, we can now
probe this “dark data.” Cognitive systems
can ingest it all, and they can understand its
meaning, through sensing and interaction. They
can reason about it, generating hypotheses,
arguments and recommendations. And unlike
any computing system we have known, they
are not programmed. Rather, they learn—from
training by experts and from their own
experience. In fact, they never stop learning.

2015 IBM Annual Report 5
In IBM Watson Health, for example, our
partners include Medtronic, Memorial Sloan
Kettering Cancer Center, the New York Genome
Center and CVS Health. We have enhanced
our capabilities in healthcare with expertise and
data sets acquired through population health
management leader Phytel, health data
analytics provider Explorys and medical images
fi rm Merge Healthcare. In February 2016 we
announced our intention to acquire Truven
Health Analytics, a leading provider of cloud-
based healthcare data, analytics and insights.
And Watson is being trained by the world’s
leading practitioners and researchers in multiple
fi elds of life sciences, medicine and healthcare.
Because these IBM Watson units will be
fed by an enormous new volume and variety of
data, we have moved aggressively to expand
our clients’ access to it, through partnerships
with companies such as Twitter and Box and our
acquisition of assets from The Weather Company.
IBM Watson today is a rapidly expanding
business, with clients in 36 countries, including
leaders and start-ups in healthcare, fi nancial
services, retail, energy, automotive, government
and more. And we continue to grow Watson’s
capabilities—for example, giving it the capacity to
“see” and expanding its natural language range
beyond English—so far including Japanese,
Spanish, Brazilian Portuguese and Arabic.
“ We can literally build
cognition into everything
digital. With Watson,
every digital application,
product and process
can understand, reason
and learn.”

6 A Letter from the Chairman
Our Platform Is Cloud In a world being rewritten
in code, coders are the new builders, and
cloud is the platform on which they are building.
All of our IBM Watson units, along with the rest
of our growing portfolio of cognitive solutions,
are being built on a cloud platform.
The word “platform” is important. Much
more than simply a faster and cheaper way
to access IT, a cloud platform is a new model
of innovation, manufacturing and distribution.
Cloud platforms provide an open environment
for collaboration and rapid scaling. They expose
growing libraries of APIs from which partners
and third parties across a broad ecosystem can
create new, innovative solutions. And cloud
offers access to multiple data sets and relevant
expertise—not only about technology, but also
from business and societal domains.
The IBM Cloud is designed for this new era.
It is the overall platform on which we, our
clients and our ecosystem partners are building
a rapidly expanding array of solutions.
It encompasses multiple technology and
data platforms:
• IBM Bluemix, our platform-as-a-service for
developers, was created by IBMers using
Agile and Design Thinking approaches.
It has grown rapidly, ending the year onboard-
ing 15,000 developers a week. And with more
“ Hybrid is the fastest-
growing segment
of the cloud market,
and IBM is the global
leader in hybrid cloud
for the enterprise.”

2015 IBM Annual Report 7
than 120 services, IBM Bluemix is the largest
deployment of Cloud Foundry, an open source
cloud application development platform.
• IBM SoftLayer is the core of our infrastructure-
as-a-service platform, which now consists
of 46 cloud data centers in every major market
in the world. This business grew by double
digits in 2015.
• The Weather Company is not just a source
of enormously valuable weather data. It is
a platform, and it forms the heart of our new
IBM Watson Internet of Things solutions unit.
Today the platform can analyze data from
3 billion weather forecast reference points,
including satellites, weather stations, air-
planes, consumer apps and more. It handles
26 billion inquiries to its cloud-based
services each day in the United States alone,
making it the country’s fourth most popular
app. Going forward, we will apply this
powerful platform to collect, integrate and
analyze data from multiple sources, such as
telematics in cars, sensors in buildings,
readings from wearable devices and data
from smartphones, social media, supply
chains and the environment.
• For our industry-leading IBM Security
business, the IBM QRadar Security
Intelligence Platform offers collaboration,
an app exchange and pertinent APIs. Our
Security business also launched IBM X-Force
Exchange, a cloud platform for more than
2,000 mem bers across 16 industries to share
threat data, with one of the world’s fullest
catalogs of threat information, from more than
20 billion security events monitored daily.
• In January 2016 we announced IBM Cloud
Video Services, enhancing our substantial
organic video capabilities with the acquisi-
tions of Aspera, Cleversafe, Clearleap
and, most recently, streaming video service
Ustream. Like weather, video is one of the
richest and fastest-growing data sources—
expected to comprise 80 percent of Internet
traffi c by 2019. The market for cloud-based
video services, analytics and software
is estimated to be more than $100 billion by
2019, and we are now positioned for strong
growth there.
• Finally, Watson itself is a cloud platform,
supporting a growing ecosystem. More
than 80,000 developers are using Watson
APIs, and more than 500 start-ups and
businesses in the Watson ecosystem
are building applications and solutions
powered by Watson.

8 A Letter from the Chairman
will be the heart of hybrid. IBM WebSphere,
for example, unlocks all data and applications for
the cloud. It enables clients’ existing apps to
access the cloud and new “born on the cloud”
applications to access existing assets.
A fi nal reason we will remain the global
leader in enterprise cloud is that cloud’s future
depends on infrastructure innovation. This is
why the full spectrum of IBM Systems remains
critical in this new era. We continue to design,
develop and deliver leading-edge servers,
storage and software built for a hybrid cloud
world. For instance, our mainframe, reinvented
for mobile transactions, serves as an advanced
analytics accelerator and security-rich enterprise
cloud server. And our Power platform is being
used to deliver cognitive workloads through the
rapidly growing OpenPOWER ecosystem and
a vibrant Linux community.
Cognitive and cloud—many in our industry
see these as two separate phenomena. We see
them differently: as two sides of the same coin,
two dimensions of a single model. Cognitive
is the only way to ingest and extract value from
the new natural resource of data in all its forms,
so that it can be turned into competitive
advantage and societal value. And cloud is the
platform on which these solutions are designed,
built, tested and deployed in the world.
Importantly, the future of cloud is hybrid,
spanning public cloud, private cloud and the
integration software, systems and services
needed to bring these environments together
securely and seamlessly. As enterprises move
to the cloud, hybrid is not a transition phase;
it is the destination.
Indeed, it is the fastest-growing segment
of the cloud market, and IBM is the global leader
in hybrid cloud for the enterprise. In this, our
incumbency is a signifi cant advantage—from
processing and protecting nearly three-fourths
of the world’s transactions on the IBM main-
frame to designing and running core banking
systems, supply chains, reservation and retail
systems, and more.
For example, we are bringing our large base
of clients in IBM Global Technology Services
(GTS) to the cloud. Last year, of our more than
70 services deals greater than $100 million,
seven out of 10 featured hybrid cloud.
We have also brought all of IBM’s relevant
middleware into IBM Cloud. Our middleware
is the world’s leading IT integration platform,
with one analyst fi rm naming us the middleware
leader for the past 14 years. And middleware
2015 IBM Annual Report 9
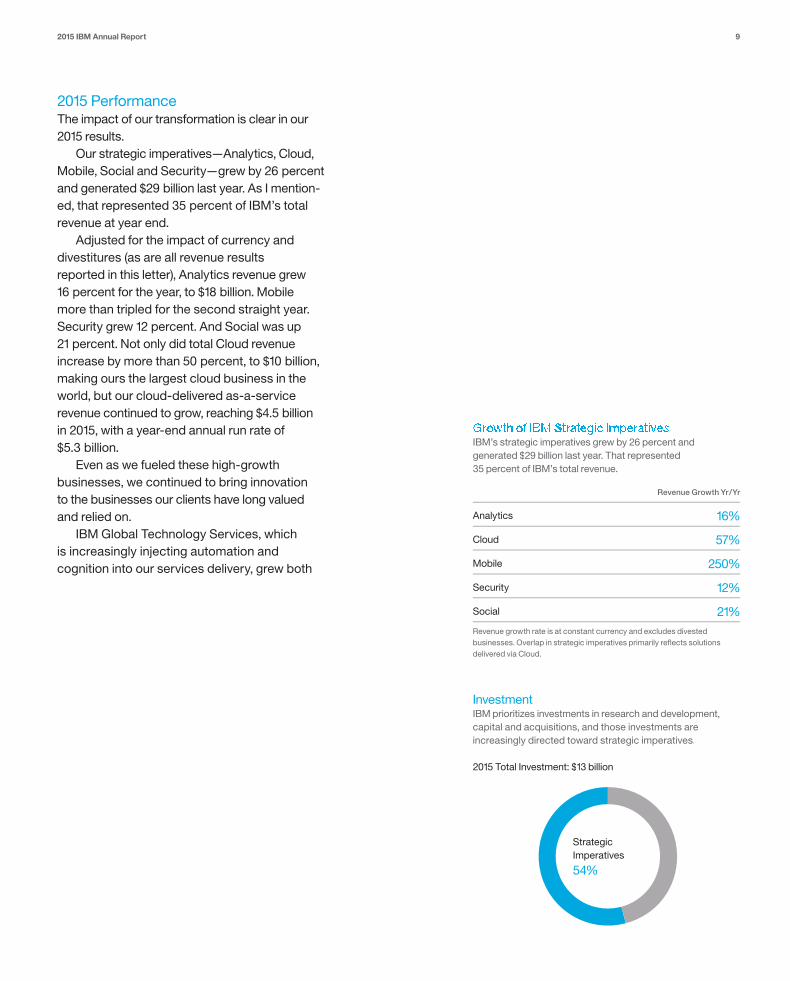
2015 PerformanceThe impact of our transformation is clear in our
2015 results.
Our strategic imperatives—Analytics, Cloud,
Mobile, Social and Security—grew by 26 percent
and generated $29 billion last year. As I mention-
ed, that represented 35 percent of IBM’s total
revenue at year end.
Adjusted for the impact of currency and
divestitures (as are all revenue results
reported in this letter), Analytics revenue grew
16 percent for the year, to $18 billion. Mobile
more than tripled for the second straight year.
Security grew 12 percent. And Social was up
21 percent. Not only did total Cloud revenue
increase by more than 50 percent, to $10 billion,
making ours the largest cloud business in the
world, but our cloud-delivered as-a-service
revenue continued to grow, reaching $4.5 billion
in 2015, with a year-end annual run rate of
$5.3 billion.
Even as we fueled these high-growth
businesses, we continued to bring innovation
to the businesses our clients have long valued
and relied on.
IBM Global Technology Services, which
is increasingly injecting automation and
cognition into our services delivery, grew both
IBM’s strategic imperatives grew by 26 percent and
generated $29 billion last year. That represented
35 percent of IBM’s total revenue.
Revenue Growth Yr /Yr
Analytics 16%
Cloud 57%
Mobile 250%
Security 12%
Social 21%
Revenue growth rate is at constant currency and excludes divested
businesses. Overlap in strategic imperatives primarily refl ects solutions
delivered via Cloud.
InvestmentIBM prioritizes investments in research and develop ment,
capital and acquisitions, and those investments are
increasingly directed toward strategic imperatives.
2015 Total Investment: $13 billion
Strategic
Imperatives
54%

10 A Letter from the Chairman
revenue and signings, fi nishing with a growing
backlog. We have also grown in the parts
of IBM Global Business Services (GBS) where
we have transitioned to our high-growth
strategic imperatives, with nearly half of our
GBS revenue now coming from those busi-
nesses. In December we announced that our
partnership with Apple had delivered more
than 100 IBM MobileFirst for iOS applications,
helping to transform the way work gets done
across 14 industries and 65 professions.
Our Systems Hardware business had
a strong year. Since the launch of the z13
in the fi rst quarter of 2015, we have delivered
mainframe growth of 35 percent, with strong
double-digit gains every quarter. Power revenue
grew 4 percent in 2015 and has grown for
four straight quarters on the strength of
OpenPOWER and Linux on Power. The strong
performance of our Systems Hardware
business over the past two years—swinging
from a year-to-year decline in profi t of $1.7 billion
in 2013 to reporting profi t growth of nearly
$600 million last year—is largely the result of
the signifi cant business restructuring we
have implemented.
For the full year, we generated revenue
of $81.7 billion, down 1 percent. We achieved
operating earnings per share of $14.92 and
delivered operating net income of $14.7 billion.
The progress of our transformation—in
particular our growth in hardware and GTS—
shows what IBMers can do to reinvent
our core businesses. In 2016, we will focus on:
• Our software businesses, where we will
accelerate our shift to cognitive solution-
based opportunities and help our
clients make the transition to as-a-service
models delivered via hybrid cloud.
• GBS, where we will use cognitive to differen-
tiate and drive our consulting business;
modernize GBS’s core business with digital
value propositions; and grow margin through
continued focus on high-value markets and
improved productivity.
• Storage, where we will accelerate our
shift to object storage and strengthen
our leadership in fl ash.
Our model is based on strong generation
of free cash fl ow, which we maintained with
$13.1 billion in 2015. We use our cash to invest in
the future and to return value to you, our owners.
In 2015 we invested more than 6 percent of
our revenue in R&D and about $4 billion in capital
expenditures. We announced 15 acquisitions.
And for the 23rd consecutive year, IBM led

2015 IBM Annual Report 11
in U.S. patents earned, once again breaking
the 7,000 threshold. Even more important than
the total number is the transformation those
patents represent. Consider that when our streak
began more than two decades ago, 27 percent
of our patents were in hardware. Last year,
not only did we earn seven times as many total
patents, but 31 percent of them were in cloud,
analytics and cognitive.
We also returned $9.5 billion to you in
2015, including dividends of nearly $5 billion
and $4.6 billion in gross share repurchases.
This marks the 20th consecutive year of an
increased dividend, and IBM’s 100th straight
year of providing one.
The Emerging IBMBecause IBM uniquely transforms both tech-
nology and business, our own reinventions
in response to changing eras have been far-
reaching. This is evident again today. As you
have seen, we have transformed our portfolio—
shedding businesses that provided little differ-
entiating value to our clients, shifting our R&D
and making dozens of acquisitions to fuel our
growth businesses. At the same time, we have
also injected new thinking and talent into
IBM’s culture—such as training 60,000 IBMers
in Agile methods and increasing our team
“ As important as ‘becoming
digital’ is to our clients,
it has become clear that
it is not the destination.
Rather, digital business is
converging with a new kind
of digital intelligence. We call
this Cognitive Business.”

12 A Letter from the Chairman
about the company’s fi nancial results related to z Systems revenue and Power
revenue adjusted for currency, operating earnings per share and operating net
income on a continuing operations basis and free cash fl ow, which are non-GAAP
measures, see the company’s 2015 Annual Report, which is Exhibit 13 to the
Form 10-K submitted to the SEC on February 23, 2016. For reconciliation and other
information concerning these items, refer to pages 33, 41 and 62 of the company’s
2015 Annual Report.
This letter includes selected references to certain non-GAAP fi nancial measures
that are made to facilitate a comparative view of the company’s ongoing operational
performance. For information about the company’s fi nancial results related to
strategic imperatives, Analytics revenue, Security revenue, Social revenue, Mobile
revenue and IBM revenue adjusted for the impact of currency and divestitures, which
are non-GAAP measures, see Non-GAAP Supplementary Materials and related
information in the Form 8-K submitted to the SEC on January 19, 2016. For information
of professional designers to more than 1,000,
embedded with clients and in 23 design studios
around the world. Both client satisfaction and
employee engagement are on the rise.
Our experience over multiple eras of techno-
logical change has also taught us the importance
of understanding its implications for the global
economy, for society and for how all of us work
and live. Today, some have expressed concerns
about the impact of intelligent systems on
jobs and the future of work. These are legitimate
questions, which must be addressed in a
thoughtful manner across business, government
and civil society.
At IBM, our experience with cognitive systems
—undertaking the deep science, learning what
cognitive systems actually do and working every
day to apply these capabilities in the world—has
taught us that cognitive technology does not
replace, but rather enhances, human capabilities.
Instead of “artifi cial” intelligence, the real-world
work of cognitive business is intelligence
augmentation. And its benefi ts for the human
condition will be extraordinary.
In the end, the most important challenges
we face are not about technology, but about
values. Whether the question is civil liberties
and national security; or privacy and conven-
ience; or some professions rising while others
decline, our path to this enormously hopeful
future will depend on the creation of mutual
value, transparency and, above all, trust.
For IBM, 2015 was a pivotal year in our journey
to this new era, providing strong confi rmation
of the strategic direction of our transformation.
We know who we are. We know why our clients
seek to work with us. We know why you choose
to invest with us.
We also know why brilliant experts,
professionals and innovators seek to become
and remain IBMers. Together, we understand
that we are at a turning point in IBM history
and in the history of technology. We are
committed to doing what every prior generation
of IBMers has done—transforming ourselves
to lead in a new era of business and technology,
in order to remain essential to our clients and
to the world.
My colleagues and I are excited and
confi dent about the cognitive future, and we
are working hard with our clients, partners
and peers to build it. I am proud of the IBM team
for bringing us here, and I am grateful to you,
our shareholders, for your steadfast support.
Virginia M. Rometty
Chairman, President and
Chief Executive Offi cer

2015 IBM Annual Report 13
What does
it take
to change
the world
and transform
a company?

14

Explore 150+
stories of
IBM Today.
ibm.com/2015ar

16 Financial Highlights
International Business Machines Corporation and Subsidiary Companies
($ in millions except per share amounts)
For the year ended December 31: 2015 2014
Revenue $ 81,741 $ 92,793
Net income $ 13,190 $ 12,022
Income from continuing operations $ 13,364 $ 15,751
Operating (non-GAAP) earnings* $ 14,659 $ 16,702
Earnings per share of common stock (continuing operations)
Assuming dilution $ 13.60 $ 15.59
Basic $ 13.66 $ 15.68
Diluted operating (non-GAAP)* $ 14.92 $ 16.53
Net cash provided by operating activities $ 17,008 $ 16,868
Capital expenditures, net 3,780 3,779
Share repurchases 4,609 13,679
Cash dividends paid on common stock 4,897 4,265
Per share of common stock 5.00 4.25
At December 31: 2015 2014**
Cash, cash equivalents and marketable securities $ 8,195 $ 8,476
Total assets 110,495 117,271
Working capital 8,235 7,797
Total debt 39,890 40,722
Total equity 14,424 12,014
Common shares outstanding (in millions) 966 991
Market capitalization $133,507 $158,920
Stock price per common share $ 137.62 $ 160.44
* See pages 41 and 42 for a reconciliation of net income to operating earnings.
** Reclassified to reflect adoption of FASB guidance on deferred taxes and debt issuance costs in consolidated financial statements.

17Report of Financials
International Business Machines Corporation and Subsidiary Companies
MANAGEMENT DISCUSSION
Overview 18
Forward-Looking and Cautionary Statements 19
Management Discussion Snapshot 19
Description of Business 22
Year in Review 29
Prior Year in Review 49
Other Information 60
Looking Forward 60
Liquidity and Capital Resources 61
Critical Accounting Estimates 64
Currency Rate Fluctuations 67
Market Risk 68
Financing Risks 68
Cybersecurity 68
Employees and Related Workforce 69
Global Financing 69
Report of Management 74
Report of Independent Registered
Public Accounting Firm 75
CONSOLIDATED FINANCIAL STATEMENTS
Earnings 76
Comprehensive Income 77
Financial Position 78
Cash Flows 79
Changes in Equity 80
NOTES TO CONSOLIDATED
FINANCIAL STATEMENTS
A Significant Accounting Policies 82
B Accounting Changes 92
C Acquisitions/Divestitures 93
D Financial Instruments 99
E Inventories 106
F Financing Receivables 106
G Property, Plant and Equipment 109
H Investments and Sundry Assets 110
I Intangible Assets Including Goodwill 110
J Borrowings 111
K Other Liabilities 114
L Equity Activity 114
M Contingencies and Commitments 118
N Taxes 120
O Research, Development and Engineering 123
P Earnings Per Share of Common Stock 123
Q Rental Expense and Lease Commitments 124
R Stock-Based Compensation 124
S Retirement-Related Benefits 127
T Segment Information 141
U Subsequent Events 146
Five-Year Comparison of Selected Financial Data 147
Selected Quarterly Data 148
Performance Graph 149
Board of Directors and Senior Leadership 150
Stockholder Information 151
18 Management Discussion
International Business Machines Corporation and Subsidiary Companies
OVERVIEW
The financial section of the International Business Machines Cor-
por ation (IBM or the company) 2015 Annual Report includes the
Management Discussion, the Consolidated Financial State ments
and the Notes to Consolidated Financial State ments. This Over-
view is designed to provide the reader with some perspective
regarding the information contained in the financial section.
Organization of Information• The Management Discussion is designed to provide readers
with an overview of the business and a narrative on the
company’s financial results and certain factors that may affect
its future prospects from the perspective of the company’s
management. The “Management Discussion Snap shot,”
beginning on page 19, presents an overview of the key per-
formance drivers in 2015.
• Beginning with the “Year in Review” on page 29, the
Manage ment Discussion contains the results of operations
for each reportable segment of the business and a discus-
sion of the company’s financial position and cash flows.
Other key sections within the Management Discussion
include: “Looking Forward” on page 60, and “Liquidity and
Capital Resources” on page 61.
• Global Financing is a reportable segment that is measured
as a stand-alone entity. A separate “Global Financing” section
is included in the Management Discussion beginning on
page 69.
• The Consolidated Financial Statements are presented on
pages 76 through 81. These statements provide an overview
of the company’s income and cash flow performance and
its financial position.
• The Notes follow the Consolidated Financial Statements.
Among other items, the Notes contain the company’s
accounting policies (pages 82 to 92), acquisitions and
divestitures (pages 93 to 99), detailed information
on specific items within the financial statements, certain
contingencies and commitments (pages 118 to 120) and
retirement-related plans information (pages 127 to 141).
• The Consolidated Financial Statements and the Notes have
been prepared in accordance with accounting principles
generally accepted in the United States (GAAP).
• In October 2014, the company announced a definitive agree-
ment to divest its Microelectronics business. The assets and
liabilities of the Microelectronics business were reported as
held for sale at December 31, 2014. The operating results of
the Microelectronics business are reported as discontinued
operations. The transaction closed on July 1, 2015. In addition,
in 2015, the company renamed its Systems & Technology
segment to Systems Hardware and its System z brand to
z Systems. Also, in 2015, the company’s business process
outsourcing business, Global Process Services, which was
previously managed within Global Technology Services,
was integrated into Global Business Services, creating an
end-to-end business transformation capability for clients and
to better leverage the company’s industry knowledge. Prior
periods have been reclassified to conform to this presenta-
tion in the Management Discussion, the Consolidated
Financial Statements and the Notes, where applicable, to
allow for a meaningful comparison of continuing operations.
• The references to “adjusted for currency” or “at constant
currency” in the Management Discussion do not include
operational impacts that could result from fluctuations in
foreign currency rates. Certain financial results are adjusted
based on a simple mathematical model that translates current
period results in local currency using the comparable prior
year period’s currency conversion rate. This approach is used
for countries where the functional currency is the local country
currency. This information is provided so that certain financial
results can be viewed without the impact of fluctuations in
foreign currency rates, thereby facilitating period- to-period
comparisons of business performance. See “Currency Rate
Fluctuations” on page 67 for additional information.
• Within the financial statements and tables in this Annual
Report, certain columns and rows may not add due to
the use of rounded numbers for disclosure purposes.
Percentages reported are calculated from the underlying
whole-dollar numbers.
Operating (non-GAAP) EarningsIn an effort to provide better transparency into the operational
results of the business, the company separates business results
into operating and non-operating categories. Operating earnings
from continuing operations is a non-GAAP measure that excludes
the effects of certain acquisition-related charges, retirement-re-
lated costs, discontinued operations and their related tax impacts.
For acquisitions, operating earnings exclude the amortization of
purchased intangible assets and acquisition-related charges
such as in-process research and development, transaction costs,
applicable restructuring and related expenses and tax charges
related to acquisition integration. For retirement-related costs, the
19Management Discussion
International Business Machines Corporation and Subsidiary Companies
company characterizes certain items as operating and others as
non-operating. The company includes defined benefit plan and
nonpension postretirement benefit plan service cost, amortization
of prior service cost and the cost of defined contribution plans
in operating earnings. Non-operating retirement-related cost
includes defined benefit plan and nonpension postretirement
benefit plan interest cost, expected return on plan assets, amor-
tized actuarial gains/losses, the impacts of any plan curtailments/
settlements and multi-employer plan costs, pension insolvency
costs and other costs. Non-operating retirement-related costs are
primarily related to changes in pension plan assets and liabilities
which are tied to financial market performance and the company
considers these costs to be outside the operational performance
of the business.
Overall, the company believes that providing investors with a
view of operating earnings as described above provides increased
transparency and clarity into both the operational results of the
business and the performance of the company’s pension plans;
improves visibility to management decisions and their impacts on
operational performance; enables better comparison to peer com-
panies; and allows the company to provide a long-term strategic
view of the business going forward. The company’s reportable
segment financial results reflect operating earnings from continu-
ing operations, consistent with the company’s management and
measurement system.
FORWARD-LOOKING AND
CAUTIONARY STATEMENTS
Certain statements contained in this Annual Report may consti-
tute forward-looking statements within the meaning of the Private
Secur ities Litigation Reform Act of 1995. Any forward-looking
statement in this Annual Report speaks only as of the date on
which it is made; the company assumes no obligation to update
or revise any such statements. Forward-looking statements are
based on the company’s current assumptions regarding future
business and financial performance; these statements, by their
nature, address matters that are uncertain to different degrees.
Forward-looking statements involve a number of risks, uncer-
tainties and other factors that could cause actual results to be
materially different, as discussed more fully elsewhere in this
Annual Report and in the company’s filings with the Securities
and Exchange Commission (SEC), including the company’s 2015
Form 10-K filed on February 23, 2016.
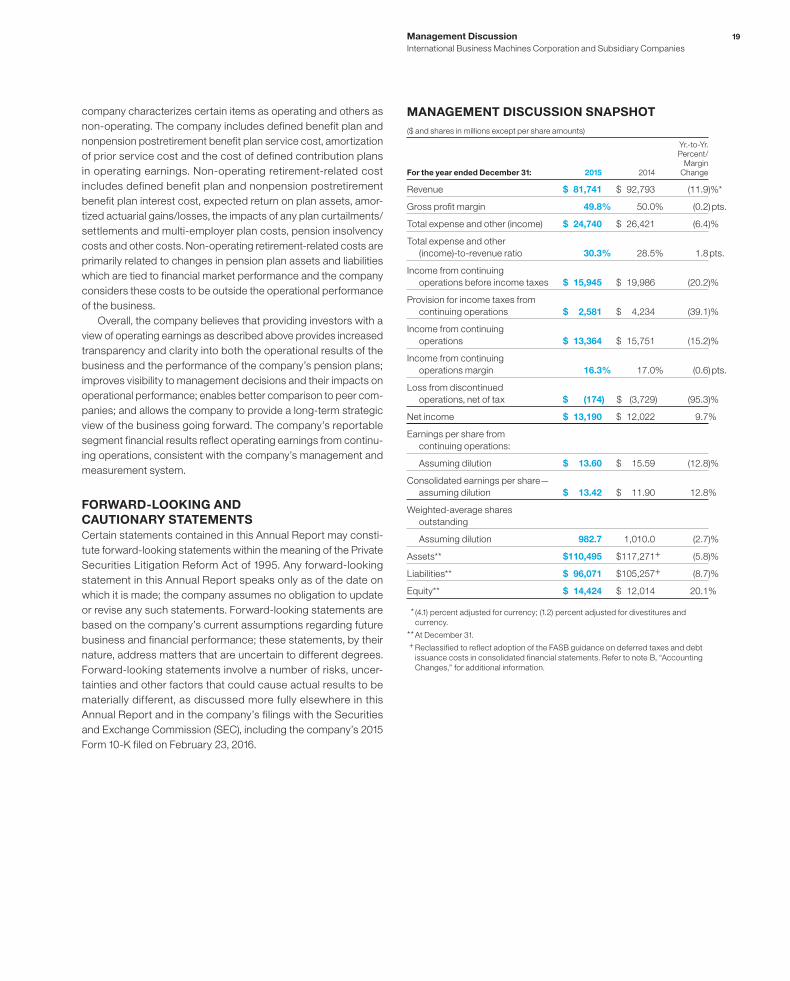
MANAGEMENT DISCUSSION SNAPSHOT
($ and shares in millions except per share amounts)
For the year ended December 31: 2015 2014
Yr.-to-Yr. Percent/
Margin Change
Revenue $ 81,741 $ 92,793 (11.9)%*
Gross profi t margin 49.8% 50.0% (0.2) pts.
Total expense and other (income) $ 24,740 $ 26,421 (6.4)%
Total expense and other
(income)-to-revenue ratio 30.3% 28.5% 1.8 pts.
Income from continuing
operations before income taxes $ 15,945 $ 19,986 (20.2)%
Provision for income taxes from
continuing operations $ 2,581 $ 4,234 (39.1)%
Income from continuing
operations $ 13,364 $ 15,751 (15.2)%
Income from continuing
operations margin 16.3% 17.0% (0.6) pts.
Loss from discontinued
operations, net of tax $ (174) $ (3,729) (95.3)%
Net income $ 13,190 $ 12,022 9.7%
Earnings per share from
continuing operations:
Assuming dilution $ 13.60 $ 15.59 (12.8)%
Consolidated earnings per share—
assuming dilution $ 13.42 $ 11.90 12.8%
Weighted-average shares
outstanding
Assuming dilution 982.7 1,010.0 (2.7)%
Assets** $110,495 $117,271+ (5.8)%
Liabilities** $ 96,071 $105,257+ (8.7)%
Equity** $ 14,424 $ 12,014 20.1%
* (4.1) percent adjusted for currency; (1.2) percent adjusted for divestitures and
currency.
** At December 31.
+ Reclassified to reflect adoption of the FASB guidance on deferred taxes and debt
issuance costs in consolidated financial statements. Refer to note B, “Accounting
Changes,” for additional information.
20 Management Discussion
International Business Machines Corporation and Subsidiary Companies
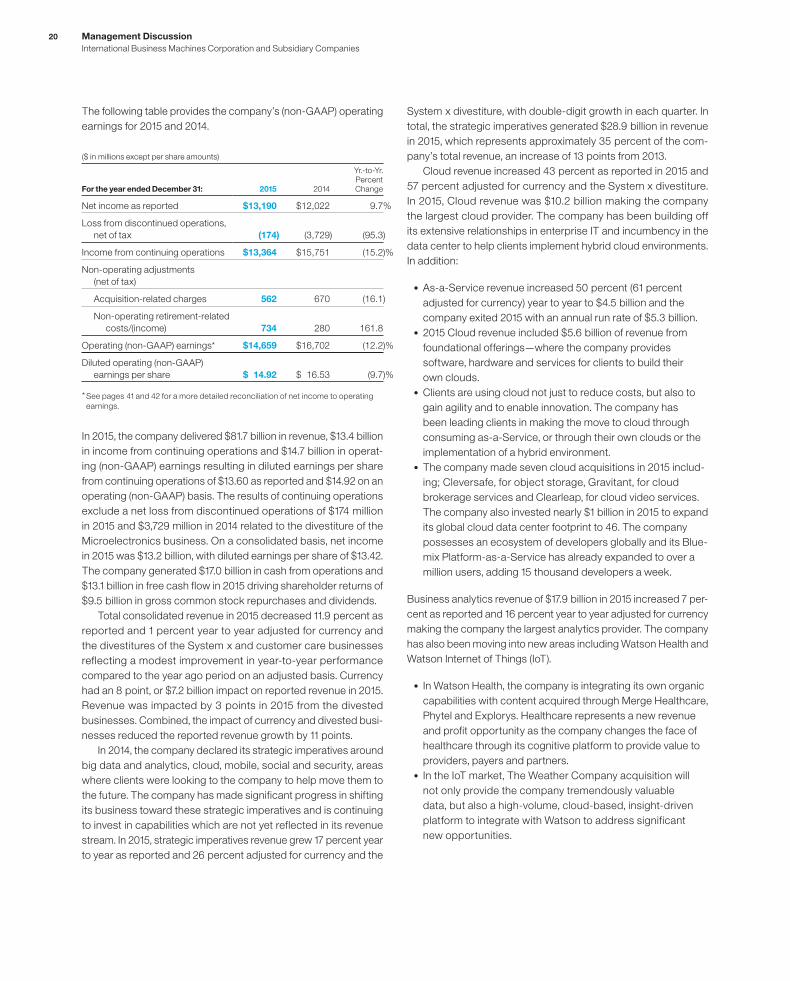
The following table provides the company’s (non-GAAP) operating
earnings for 2015 and 2014.
($ in millions except per share amounts)
For the year ended December 31: 2015 2014
Yr.-to-Yr. PercentChange
Net income as reported $13,190 $12,022 9.7%
Loss from discontinued operations,
net of tax (174) (3,729) (95.3)
Income from continuing operations $13,364 $15,751 (15.2)%
Non-operating adjustments
(net of tax)
Acquisition-related charges 562 670 (16.1)
Non-operating retirement-related
costs/(income) 734 280 161.8
Operating (non-GAAP) earnings* $14,659 $16,702 (12.2)%
Diluted operating (non-GAAP)
earnings per share $ 14.92 $ 16.53 (9.7)%
* See pages 41 and 42 for a more detailed reconciliation of net income to operating
earnings.
In 2015, the company delivered $81.7 billion in revenue, $13.4 billion
in income from continuing operations and $14.7 billion in operat-
ing (non-GAAP) earnings resulting in diluted earnings per share
from continuing operations of $13.60 as reported and $14.92 on an
operating (non-GAAP) basis. The results of continuing operations
exclude a net loss from discontinued operations of $174 million
in 2015 and $3,729 million in 2014 related to the divestiture of the
Microelectronics business. On a consolidated basis, net income
in 2015 was $13.2 billion, with diluted earnings per share of $13.42.
The company generated $17.0 billion in cash from operations and
$13.1 billion in free cash flow in 2015 driving shareholder returns of
$9.5 billion in gross common stock repurchases and dividends.
Total consolidated revenue in 2015 decreased 11.9 percent as
reported and 1 percent year to year adjusted for currency and
the divestitures of the System x and customer care businesses
reflecting a modest improvement in year-to-year performance
compared to the year ago period on an adjusted basis. Currency
had an 8 point, or $7.2 billion impact on reported revenue in 2015.
Revenue was impacted by 3 points in 2015 from the divested
businesses. Combined, the impact of currency and divested busi-
nesses reduced the reported revenue growth by 11 points.
In 2014, the company declared its strategic imperatives around
big data and analytics, cloud, mobile, social and security, areas
where clients were looking to the company to help move them to
the future. The company has made significant progress in shifting
its business toward these strategic imperatives and is continuing
to invest in capabilities which are not yet reflected in its revenue
stream. In 2015, strategic imperatives revenue grew 17 percent year
to year as reported and 26 percent adjusted for currency and the
System x divestiture, with double-digit growth in each quarter. In
total, the strategic imperatives generated $28.9 billion in revenue
in 2015, which represents approximately 35 percent of the com-
pany’s total revenue, an increase of 13 points from 2013.
Cloud revenue increased 43 percent as reported in 2015 and
57 percent adjusted for currency and the System x divestiture.
In 2015, Cloud revenue was $10.2 billion making the company
the largest cloud provider. The company has been building off
its extensive relationships in enterprise IT and incumbency in the
data center to help clients implement hybrid cloud environments.
In addition:
• As-a-Service revenue increased 50 percent (61 percent
adjusted for currency) year to year to $4.5 billion and the
company exited 2015 with an annual run rate of $5.3 billion.
• 2015 Cloud revenue included $5.6 billion of revenue from
foundational offerings—where the company provides
software, hardware and services for clients to build their
own clouds.
• Clients are using cloud not just to reduce costs, but also to
gain agility and to enable innovation. The company has
been leading clients in making the move to cloud through
consuming as-a-Service, or through their own clouds or the
implementation of a hybrid environment.
• The company made seven cloud acquisitions in 2015 includ-
ing; Cleversafe, for object storage, Gravitant, for cloud
brokerage services and Clearleap, for cloud video services.
The company also invested nearly $1 billion in 2015 to expand
its global cloud data center footprint to 46. The company
possesses an ecosystem of developers globally and its Blue-
mix Platform-as-a-Service has already expanded to over a
million users, adding 15 thousand developers a week.
Business analytics revenue of $17.9 billion in 2015 increased 7 per-
cent as reported and 16 percent year to year adjusted for currency
making the company the largest analytics provider. The company
has also been moving into new areas including Watson Health and
Watson Internet of Things (IoT).
• In Watson Health, the company is integrating its own organic
capabilities with content acquired through Merge Healthcare,
Phytel and Explorys. Healthcare represents a new revenue
and profit opportunity as the company changes the face of
healthcare through its cognitive platform to provide value to
providers, payers and partners.
• In the IoT market, The Weather Company acquisition will
not only provide the company tremendously valuable
data, but also a high-volume, cloud-based, insight-driven
platform to integrate with Watson to address significant
new opportunities.

21Management Discussion
International Business Machines Corporation and Subsidiary Companies
In the area of engagement, revenue increased 64 percent as
reported and 77 percent adjusted for currency. Security revenue
increased 5 percent as reported (12 percent adjusted for cur-
rency), mobile revenue more than tripled year to year and social
revenue increased 14 percent as reported (21 percent adjusted
for currency).
From a segment perspective, Global Services revenue
declined 10.5 percent as reported and 1 percent adjusted for
currency (9 points) and divestitures. Global Technology Services
(GTS) declined 9.7 percent as reported, but increased 1 percent
year to year adjusted for currency (10 points) and the System x
divestiture with strong growth in the strategic imperatives on
an adjusted basis. Global Business Services (GBS) revenue
decreased 12.0 percent as reported and 4 percent adjusted for
currency (8 points). GBS revenue continues to be impacted by
the shift away from traditional large enterprise application imple-
mentations. Software revenue declined 9.8 percent as reported
and 4 percent adjusted for currency with growth in annuity-based
revenue, including Software-as-a-Service (SaaS), more than
offset by declines in transactional revenue reflecting the flexi-
bility the company has provided to its largest enterprise clients.
Systems Hardware revenue decreased 24.2 percent as reported,
but increased 8 percent adjusted for the System x divestiture
(28 points) and currency (4 points), reflecting a successful main-
frame cycle in 2015 and the repositioning of Power Systems to
address a broader opportunity.
From a geographic perspective, revenue in the major markets
declined 9.9 percent as reported and 1 percent adjusted for cur-
rency (8 points) and divestitures (2 points) with growth in Germany,
Japan and the UK on an adjusted basis. Growth markets revenue
decreased 18.4 percent as reported and 3 percent adjusted for
currency (9 points) and divestitures (6 points). On an adjusted
basis, declines in Asia Pacific were partially offset by growth in
Latin America and Middle East and Africa.
The consolidated gross profit margin of 49.8 percent
decreased 0.2 points year to year. The operating (non-GAAP)
gross margin of 50.8 percent increased 0.2 points compared to
the prior year primarily driven by the shift to higher value through
portfolio actions and the relative strength of z Systems, partially
offset by margin declines in Global Services and Software.
Total expense and other (income) decreased 6.4 percent in
2015 compared to the prior year. Total operating (non-GAAP)
expense and other (income) decreased 7.8 percent compared to
2014. The key year-to-year drivers were:
Total Operating Consolidated (non-GAAP)
• Currency* (9) points (9) points
• System x divestiture (2) points (2) points
• Divestiture gains 6 points 6 points
• Workforce rebalancing (3) points (3) points
* Reflects impacts of translation and hedging programs.
The reduction in expense was driven primarily by currency
impacts, a lower level of workforce rebalancing charges and the
impact of the divested System x business. These benefits were
partially offset by the impact of lower divestiture gains ($1.6 billion)
year to year. The reduction in operating (non-GAAP) expense was
driven primarily by the same factors. The company is continuing
to shift resources and spending within its operational expense
base—driving productivity and efficiency in some areas while
increasing investment in support of the strategic imperatives. In
2015, the company shifted over $5 billion of spending across cost,
expense and capital expenditures, to the strategic imperatives.
Pre-tax income from continuing operations of $15.9 billion in
2015 decreased 20.2 percent year to year and the pre-tax margin
was 19.5 percent, a decrease of 2.0 points. The continuing oper-
ations effective tax rate for 2015 was 16.2 percent, a decrease
of 5.0 points versus 2014. The tax rate in 2015 reflected benefits
from the settlement of the U.S. tax audit and geographic mix of
pre-tax profits, partially offset by less utilization of foreign tax cred-
its. Income from continuing operations of $13.4 billion decreased
15.2 percent and the net income margin was 16.3 percent, a
decrease of 0.6 points versus 2014. Losses from discontin-
ued operations, net of tax, were $174 million in 2015 compared
to $3,729 million in 2014. Net income of $13.2 billion increased
9.7 percent year to year. Operating (non-GAAP) pre-tax income
from continuing operations decreased 16.3 percent year to year
and the operating (non-GAAP) pre-tax margin from continu-
ing operations decreased 1.1 points to 21.6 percent. Operating
(non-GAAP) income from continuing operations of $14.7 billion
decreased 12.2 percent including an impact of 7 points from the
2014 gains from the System x and customer care divestitures. The
operating (non-GAAP) income margin from continuing operations
of 17.9 percent decreased 0.1 points. The operating (non-GAAP)
effective tax rate from continuing operations in 2015 was 17.2 per-
cent versus 21.0 percent in 2014. The 2015 profit and margin
performance reflect portfolio actions taken as the company shifts
to higher value, as well as investments being made to add capa-
bilities to drive the transformation.
Diluted earnings per share from continuing operations of $13.60
in 2015 decreased 12.8 percent year to year. In 2015, the company
repurchased 30.3 million shares of its common stock at a cost of
$4.7 billion. Operating (non-GAAP) diluted earnings per share of
$14.92 decreased 9.7 percent versus 2014 including an impact
of 7 points from the 2014 gains from the System x and customer
care divestitures. Diluted earnings per share from discontinued
operations was ($0.18) in 2015 compared to ($3.69) in 2014.

22 Management Discussion
International Business Machines Corporation and Subsidiary Companies
At December 31, 2015, the company continued to have the
financial flexibility to support the business over the long term. Cash
and marketable securities at year end was $8.2 billion, a decrease
of $0.3 billion from December 31, 2014. Key drivers in the balance
sheet and total cash flows were:
Total assets decreased $6.8 billion ($0.3 billion adjusted for
currency) from December 31, 2014 driven by:
• Decreases in total receivables ($4.4 billion), deferred taxes
($1.9 billion) and prepaid expenses and sundry assets
($1.1 billion); partially offset by
• Increased goodwill ($1.5 billion).
Total liabilities decreased $9.2 billion ($4.7 billion adjusted for cur-
rency) from December 31, 2014 driven by:
• Decreases in other liabilities ($2.3 billion), taxes ($2.2 billion),
retirement-related liabilities ($1.8 billion), deferred income
($0.8 billion), total debt ($0.8 billion) and accounts payable
($0.8 billion).
Total equity of $14.4 billion increased $2.4 billion from Decem-
ber 31, 2014 as a result of:
• Higher retained earnings ($8.3 billion) and higher common
stock ($0.6 billion); partially offset by
• Increased treasury stock ($4.8 billion) and increased
accumulated other comprehensive losses ($1.7 billion).
The company generated $17.0 billion in cash flow provided by
operating activities, an increase of $0.1 billion when compared to
2014, driven primarily by lower income tax payments, offset by
net income performance. Net cash used in investing activities of
$8.2 billion was $5.2 billion higher than 2014, primarily driven by a
decrease in cash provided from divestitures ($2.8 billion) and an
increase in net cash used for acquisitions ($2.7 billion). Net cash
used in financing activities of $9.2 billion decreased $6.3 billion
compared to the prior year, driven primarily by a decrease in cash
used for gross common stock repurchases ($9.1 billion), partially
offset by lower net debt issuances ($1.8 billion) and higher dividend
payments ($0.6 billion).
The 2015 results are a reflection of the continuing transition in
the company’s business as it addresses the significant shifts in the
industry, as well as some of the cyclical challenges of the global
business environment. This transformation is taking place over
the longer term. In 2015, the company strengthened its existing
portfolio while investing aggressively in new opportunities such
as Watson Health, Watson Internet of Things and IBM Cloud. In
January 2016, the company disclosed that it is expecting GAAP
earnings of at least $12.45 and operating (non-GAAP) earnings of
at least $13.50 per diluted share for 2016.
DESCRIPTION OF BUSINESS
Please refer to IBM’s Annual Report on Form 10-K filed with
the SEC on February 23, 2016 for a more detailed version
of this Des cription of Business, especially Item 1A. entitled
“Risk Factors.”
The company creates value for clients through integrated solu-
tions and products that leverage: data, information technology,
deep expertise in industries and business processes, and a
broad ecosystem of partners and alliances. IBM solutions typi-
cally create value by enabling new capabilities for clients that
transform their businesses and help them engage with their cus-
tomers and employees in new ways. These solutions draw from
an industry-leading portfolio of consulting and IT implementation
services, cloud and cognitive offerings, and enterprise systems
and software; all bolstered by one of the world’s leading research
organizations.
StrategyIBM has transformed throughout its 100+ year history, and in its
current transformation, IBM is leading a reordering of the tech-
nology industry.
In 2014, the company’s strategic imperatives were declared
around the three main forces behind “digital”: big data and ana-
lytics, cloud and engagement. Since 2010, IBM has invested
approximately $30 billion in these areas, built out the IBM Cloud
on a global scale, established the Watson Group, announced 50
acquisitions and entered into major partnerships, including the
landmark alliance with Apple to bring mobile to the enterprise.
As IBM’s clients transform, “digital” itself is not the destina-
tion, but a foundation to create a truly Cognitive Enterprise. This is
resulting in new types of interactions between people, organiza-
tions and machines.
Through these developments, IBM is emerging as more than
a hardware, software and services company; IBM is transforming
into a cognitive solutions and cloud platform company. Key tenets
of the company’s highly differentiated strategy include:
Cognitive Solutions: Cognitive, advanced analytics and key data
are being integrated into all leading solutions.
Cloud Platform: New solutions will be built on the IBM Cloud and
the company’s offerings will be cloud-enabled. The company is
continuing to build the premier cloud stack, developer environment
and most secure hybrid cloud platform in the industry.
Industry Focus: Because industry context is so important to the
value of IBM’s solutions, these solutions will be built for the needs
of individual industries and professions.

23Management Discussion
International Business Machines Corporation and Subsidiary Companies
Cognitive SolutionsSince 2011 when IBM’s Watson was introduced, IBM has been
developing a new generation of cognitive systems that can see
and analyze the massive amounts of data that have previously
been invisible to computers and enterprises. Cognitive systems
have the capability to inject a kind of thinking ability into every
digitalized object, process and service. IBM is on the forefront of
deploying these systems and assisting clients to become truly
Cognitive Enterprises.
Cognitive systems are not programmed; like humans, they
learn from experts, from every interaction, and from big data. They
are enabled to learn by using advanced algorithms to sense, pre-
dict and infer. Ultimately they can augment human intelligence,
allowing individuals to make more informed decisions.
For the past five years, IBM has continued to invest in Watson,
including dedicating $100 million to venture investments to support
start-ups building cognitive apps through the Watson Developer
Zone on Bluemix. IBM is also making Watson more widely available
through the Watson Ecosystem, which has grown to more than
500 partners.
Paired with Watson is the company’s core big data and ana-
lytics business. IBM has invested over $15 billion in these areas
since 2010, including over $7 billion on more than 20 acquisitions.
Nearly half of IBM Research’s spending is focused on analytics
and cognitive.
IBM’s leading-edge cognitive technology is only the starting
point. The company is developing entirely new solutions busi-
nesses around that cognitive capability. In 2015, the Watson
Health unit was formed, which is IBM’s first business unit designed
around a single industry. Watson Health will create cognitive
solutions that can better help doctors diagnose and anticipate
disease; it will recommend treatments that are tailored to individ-
uals; and it will assist researchers to predict and prevent the next
generation of diseases.
Another set of cognitive solutions IBM is building is the Internet
of Things (IoT). It is estimated that there are more than 9 billion
connected devices operating in the world today, generating
2.5 quintillion bytes of new data daily. Watson IoT will bring the
power of cognitive to the challenge of extracting and analyzing
data embedded in intelligent devices in real time. In addition,
the recent closure of The Weather Company acquisition essen-
tially expands the company’s IoT platform; with one that collects,
integrates and analyzes data from three billion weather forecast
reference points, including satellites, weather stations, airplanes,
consumer apps and more for IBM and our clients.
Through Cognitive, IBM is ushering in a new era for the industry
and for clients.
Cloud PlatformCloud is at the heart of the “digital” revolution. No enterprise is
untouched by this revolution and the shifts are occurring rapidly.
Enterprises are benefiting from cloud by using it to transform
their information technology (IT) and business processes into dig-
ital services. Cloud brings two compelling sources of value:
• Innovation: In addition to cloud enabling the sharing of
infrastructure, the real promise of cloud is innovation. By
forcing greater levels of standards throughout the technol-
ogy value chain, new products and services, and even
entire business models, can be created in weeks rather
than months or years.
• Hybrid: Data, cloud and engagement are powerful forces
changing the landscape of technology and businesses.
Enterprises need to bring this new world of technology
together with their existing systems in order to capture their
full value. Hybrid cloud brings together the back-end systems
infrastructure with the new strategic imperative “digital”
technologies. Unless the new and traditional IT worlds
are brought together, they will be isolated within the
enterprise. IBM servers and storage can handle mobile
transactions, compose and expose APIs and integrate
across hybrid clouds to unlock new value from data.
Making applications work across on-premise, public and private
cloud environments is what hybrid cloud is all about. This requires
a deep understanding of both traditional and new IT models,
something that IBM is unique in bringing to its clients:
• In traditional IT, for example, the z Systems mainframe is
used by all of the top 25 global banks and almost three-
quarters of the top 25 U.S. retailers. In addition, 70 percent
of the top 25 Fortune 500 companies rely on IBM to manage
their critical IT infrastructures.
• In the new world of IT, the IBM Cloud has become the stan-
dard for enterprise-grade cloud—bringing performance
and the integration across all IT. The company continues to
build cloud into Global Technology Services’ (GTS) large
base of outsourcing relationships.
• Each of these areas of IT requires uncompromising security.
IBM Security brings to clients advanced technologies in fraud
and threat protection, identity and access management,
application and data security, mobile and cloud security.
IBM’s systems are among the most secure in the world with
advanced encryption, threat monitoring and tracking and
behavioral analytics. Further, high-end security consulting
brings the expertise of 6,000 dedicated security specialists.
Built on big data analytics, IBM manages over 20 billion
security events per day on 2.5 million desktops for 12,000
clients through its Security Operations Centers.

24 Management Discussion
International Business Machines Corporation and Subsidiary Companies
IBM’s Cloud platform includes:
• IBM Cloud’s Infrastructure-as-a-Service, which offers bare
metal, private cloud and virtual server instances, enabling it
to cover many different workloads with unprecedented per-
formance. IBM’s platform also has tremendous geographic
reach—with 46 cloud centers around the globe.
• Bluemix is IBM’s Platform-as-a-Service, built on the open
standards foundation of Cloud Foundry and powered by IBM
Cloud’s infrastructure. Bluemix offers cloud-based services,
APIs and leading third-party services to developers in an
integrated platform. With $1 billion of investment, Bluemix
is now the largest Cloud Foundry development, has a signifi-
cant number of services and is onboarding thousands of
developers per week.
• IBM Cloud Marketplace brings together the company’s
extensive portfolio of cloud capabilities, providing a self-
service, digital experience for developers, IT and business
leaders. IBM has a significant number of Software-as-a-Ser-
vice offerings and visitors to the Marketplace have access
to an extensive and growing portfolio of cloud capabilities
from IBM and qualified third-party vendors.
• In 2015, IBM acquired: Blue Box Group, Inc. (private cloud),
Compose (database-as-a-service), StrongLoop, Inc. (devel-
oper technology), Cleversafe, Inc. (object-based storage),
Gravitant, Inc. (cloud brokerage) and Clearleap, Inc. (cloud-
based video).
• The Weather Company acquisition in January 2016, whose
dynamic cloud data platform powers the fourth most-used
daily mobile app in the United States and handles 26 billion
inquiries to its cloud-based services each day. This high-
volume cloud platform processes, analyzes and distributes
enormous data sets at scale in real time. It adds an important
dimension to the company’s cloud platform.
• IBM has entered into strategic partnerships all focused
on bringing innovative data and analytics solutions to the
market. The IBM Cloud is the most powerful platform for
enterprise-grade environments, bringing clients unparalleled
levels of security, performance and scalability.
Industry FocusIBM’s solutions and platforms are most relevant in the context of
each client’s industry. General-purpose tools have their place, but
the company can unlock much greater value in building solutions
for the specific needs of an industry. In this context, Industries
are the focus.
Watson Health is an example of how the company is defining
solutions around industry needs. In addition to Watson Health, in
2015, 20 new industry-specific analytics solutions were launched
with pre-built predictive analytics capabilities. These include solu-
tions that allow clients to mine customer data for hidden insights
for action, spot fraud or risk and predict vulnerabilities to preempt
before they occur. These solutions, which are tailored specifically
for retail, banking, telecommunications, insurance and others, will
make it easier and faster for organizations to uncover and act on
critical business insights. In addition, IBM has announced over
100 apps through its alliance with Apple that bring value in the
context of individual industries.
Complementing the power of the company’s technology solu-
tions is the industry expertise of IBM’s Global Business Services
consulting business. It is the combination of IBM’s technology and
services, which enable clients to achieve their business outcomes.
SummaryEach successive transformation of IBM has brought something
new and innovative to the world. More than 50 years ago, IBM
brought forward a revolutionary transactional computer called the
mainframe. In the decades that followed, IBM commercialized the
personal computer, created an industry around IT services and a
software market around middleware. Each of these innovations is
with the world today; they were built to last.
The company’s next chapter is ushering in an entirely new era
of human-organization-computer interaction—embodied in Cog-
nitive Solutions and the Cloud Platform.
Business ModelThe company’s business model is built to support two principal
goals: helping enterprise clients to become more innovative, effi-
cient and competitive through the application of business insight
and IT solutions; and providing long-term value to shareholders.
The business model has been developed over time through strate-
gic investments in capabilities and technologies that have superior
long-term growth and profitability prospects based on the value
they deliver to clients.
The company’s global capabilities include services, software,
systems, fundamental research and related financing. The broad
mix of businesses and capabilities are combined to provide inte-
grated solutions and platforms to the company’s clients.
25Management Discussion
International Business Machines Corporation and Subsidiary Companies
The business model is dynamic, adapting to the continuously
changing industry and economic environment, including the
company’s transformation into cloud and -as-a-Service delivery
models. The company continues to strengthen its position through
strategic organic investments and acquisitions in higher-value
areas while divesting certain businesses. In addition, the company
is transforming into a more agile enterprise helping to drive pro-
ductivity, which supports investments for participation in markets
with significant long-term opportunity.
This business model, supported by the company’s financial
model, has enabled the company to deliver strong earnings, cash
flows and returns to shareholders over the long term.
Business Segments and CapabilitiesThe company’s major operations consists of five business seg-
ments: Global Technology Services and Global Business Services,
which the company collectively calls Global Services, Software,
Systems Hardware and Global Financing.
In late February 2016, the company plans to meet with investors
to discuss changes in the business, which will result in a change in
the company’s reportable segments beginning in the first quarter
of 2016.
Global Services: is a critical component of the company’s strategy
of providing IT infrastructure and business insight and solutions
to clients. These solutions include industry-leading IBM software
and systems, as well as other suppliers’ products if a solution
requires it. Approximately 60 percent of external Global Services
segment revenue is annuity based, coming primarily from out-
sourcing and maintenance arrangements. The Global Services
backlog provides a solid revenue base entering each year. Within
Global Services, there are two reportable segments: Global Tech-
nology Services and Global Business Services.
Global Technology Services (GTS) provides IT infrastructure
services, creating business value for clients through integrated
services, incorporating unique intellectual property within its global
delivery model. By leveraging insights and experience drawn
from IBM’s global scale, skills and technology, with applied inno-
vation from IBM Research, clients gain access to leading-edge,
high-quality services with improved productivity, flexibility, cost
and outcomes.
GTS Capabilities
Strategic Outsourcing: delivers comprehensive IT outsourcing
services focused on clients’ enterprise IT infrastructure environ-
ments to enable digital transformation and consistently deliver
improved quality, flexibility, risk management and financial value.
The company integrates long-standing expertise in service man-
agement and technology with the ability to exploit the power of
new technologies from IBM systems and software, such as cloud
computing, analytics, cognitive computing and virtualization,
to deliver high performance, innovation and improved ability to
achieve business objectives.
Integrated Technology Services: delivers a portfolio of project-
based and managed services that enable clients to transform and
optimize their IT environments by driving efficiency, flexibility and
productivity. The portfolio is built around a key set of solutions
addressing systems, mobility, resiliency, networking, cloud and
security. This portfolio includes key assets and intellectual prop-
erty and incorporates best practices and proven methodologies
that ensure high quality delivery, security and compliance.
Cloud: delivers a comprehensive set of hybrid cloud services
including assisting clients with building their own private clouds,
building customized dedicated managed clouds, allowing cli-
ents to leverage standardized cloud infrastructure services from
the SoftLayer and Cloud Managed Services offerings; and cre-
ating environments linking their private and public workloads
together. This portfolio of cloud offerings spans across the GTS
business lines.
Technology Support Services (Maintenance Services): delivers
a complete line of support services from product maintenance
through solution support to maintain and improve the availability
of clients’ IT infrastructures.
Global Business Services (GBS) has the mission to deliver pre-
dictable business outcomes to the company’s clients across:
Consulting and Systems Integration, Application Management Ser-
vices and Process Services. These professional services deliver
business value and innovation to clients through solutions which
leverage industry and business process expertise. The role of GBS
is to drive initiatives that integrate IBM content and solutions and
drive the progress of the company’s strategic imperatives. As cli-
ents transform themselves in response to market trends like big
data, social and mobile computing, GBS helps clients use these
technologies to reinvent relationships with their customers and
realize new standards of efficacy and efficiency in the internal pro-
cesses, data and applications that they use to run their businesses.
In 2015, GBS announced the industry’s first practice dedicated to
cognitive business, Cognitive Business Solutions.
GBS Capabilities
Consulting and Systems Integration: delivers client value with
solutions in Strategy and Transformation, Application Innovation
Services, Enterprise Applications and Smarter Analytics. Consult-
ing is also focused on bringing to market client solutions that drive
smarter commerce, cloud, mobile and social business.
Application Management Services: delivers application manage-
ment, maintenance and support services for packaged software,
as well as custom and legacy applications. Value is delivered
through advanced capabilities in areas such as application test-
ing and modernization, cloud application services, the company’s
highly differentiated globally integrated capability model, industry
knowledge and the standardization and automation of applica-
tion management.

26 Management Discussion
International Business Machines Corporation and Subsidiary Companies
Global Process Services: (included within Application Management
Services) delivers a range of offerings consisting of standardized
through transformational solutions including processing plat-
forms and business process outsourcing. These services deliver
improved business results to clients through the strategic change
and/or operation of the client’s business processes, applications
and infrastructure.
Software consists primarily of middleware and operating systems
software. Middleware serves as a software layer that connects
operating systems to applications across a standard software plat-
form. The IBM Middleware portfolio allows seamless integration of
unrelated systems, processes, and applications all while providing
market leading functionality, in both on-premise and hybrid cloud
environments. Operating systems are the software engines that
run computers. Approximately 70 percent of external Software
segment revenue is annuity based, coming from recurring license
charges, software sold “as-a-Service” and ongoing post-contract
support. The remaining revenue relates to one-time charge (OTC)
arrangements in which clients pay one, up-front payment for a
perpetual license. Typically, the sale of OTC software includes one
year of post-contract support. Clients can also purchase ongoing
post-contract support after the first year, which includes unspec-
ified product upgrades and technical support.
Software Capabilities
WebSphere: delivers capabilities that enable organizations to run
high-performance business applications. With these applications,
clients can integrate and manage business processes across their
organizations with the flexibility and agility they need to respond
to changing conditions. Built on services-oriented architecture
(SOA), and open standards support for cloud, mobile and social
interactions, the WebSphere platform enables enterprises to
extend their reach and optimize interactions with their key con-
stituents. Smarter Commerce software helps companies better
manage and improve each step of their value chain and capitalize
on opportunities for profitable growth, efficiency and increased
customer loyalty.
Information Management: enables clients to integrate, manage
and analyze enormous amounts of data from a large variety of
sources in order to gain competitive advantage and improve their
business outcomes. With this approach, clients can extract real
value out of their data and use it to make better business decisions.
IBM’s middleware and integrated solutions include advanced
database management, information integration, data governance,
enterprise content management, data warehousing, business ana-
lytics and intelligence, predictive analytics and big data analytics.
Tivoli: helps clients optimize the value they get from their infrastruc-
tures and technology assets through greater visibility, control and
automation across their end-to-end business operations. These
asset management solutions foster integrated service delivery
for cloud and datacenter management, enterprise endpoint and
mobile device management, asset and facilities management, and
storage management. Tivoli includes security systems software
that provides clients with a single security intelligence platform
that enables them to better secure all aspects of their enterprise
and prevent security breaches.
Workforce Solutions: enables businesses to connect people and
processes for more effective communication and increased pro-
ductivity through collaboration, messaging and social networking
software. By remaining at the forefront of collaboration tools, IBM’s
social business offerings help organizations reap real benefits
associated with social networking, as well as create a more effi-
cient and effective workforce.
Rational: supports software development for both IT and com-
plex embedded system solutions, with a portfolio of products and
solutions supporting DevOps and Smarter Product Development,
transforming the way lines of business, development and opera-
tions work together to deliver innovation via software.
In January 2015, the company made several changes designed
to more effectively align its key capabilities and resources to its
strategic imperatives. These changes have enabled the com-
pany to respond more quickly to critical client agendas and drive
higher value. Across Software, the company is transitioning its
portfolio to capture growth and continue to drive innovation. The
focus is centered around analytics, security, and commerce, uti-
lizing its software assets to improve speed and agility in bringing
integrated solutions to its clients and to help clients become cog-
nitive enterprises.
Watson: the first commercially available cognitive computing
platform that has the ability to interact in natural language, pro-
cessing vast amounts of big data, and learning from its interactions
with people and computers. As an advisor, Watson is able to sift
through and understand large amounts of data delivering insights
with unprecedented speeds and accuracy.
27Management Discussion
International Business Machines Corporation and Subsidiary Companies
Watson Health: a business unit focused on the health industry,
built upon the foundation of the work done with Watson and the
momentum of Cloud. This team of consultants, medical prac-
titioners, clinicians, developers and researchers work with an
extensive ecosystem of partners and clients to advance the quality
and effectiveness of individual health with advanced data ana-
lytics and insights.
Watson Internet of Things (IoT): in today’s world, physical devices
of all types are now instrumented with compute capabilities that
allow for direct sensing and communication of data. IBM’s focus is
enabling companies to use that data to improve operations, drive
new business and work directly with clients.
Systems Hardware provides clients with innovative infrastructure
technologies to help meet the new requirements of hybrid cloud
and cognitive workloads—from deploying advanced analytics,
to moving to digital service delivery with the cloud, and securing
mobile transaction processing. Approximately half of Systems
Hardware’s server and storage sales transactions are through
the company’s business partners; with the balance direct to end-
user clients. IBM Systems also designs and procures advanced
semiconductor devices for use in the company’s systems.
Systems Hardware Capabilities
Servers: a range of high-performing systems designed to address
capacity, security, speed and compute power needs for busi-
nesses, organizations and technical computing applications. The
portfolio includes z Systems, a trusted enterprise platform for
integrating data, transactions and insight, and Power Systems, a
system designed from the ground up for big data, optimized for
scale-out cloud and Linux, and delivering open innovation with
OpenPOWER. The company is also a founding member of the
OpenPOWER foundation, a group of industry-leading companies
working together to develop high-performance compute solutions
based on the IBM POWER architecture.
Storage: data storage products and solutions that allow clients
to retain and manage rapidly growing, complex volumes of digital
information. These solutions address critical client requirements
for information retention and archiving, security, compliance
and storage optimization including data deduplication, availabil-
ity and virtualization. The portfolio consists of a broad range of
software-defined storage solutions, flash storage, disk and tape
storage solutions.
Technology: In 2014, the company announced a definitive agree-
ment to divest its Microelectronics business and manufacturing
operations. This transaction closed in 2015.
Global Financing facilitates IBM clients’ acquisition of information
technology systems, software and services by providing financ-
ing solutions in the areas where the company has the expertise.
The financing arrangements are predominantly for products or
services that are critical to the end users’ business operations.
These financing contracts are entered into after a comprehensive
credit evaluation and are secured by legal contracts. As a captive
financier, Global Financing has the benefit of both deep knowledge
of its client base and a clear insight into the products and services
financed. These factors allow the business to effectively manage
two of the major risks, credit and residual value, associated with
financing while generating strong returns on equity. Global Financ-
ing also maintains a long-term partnership with the companies’
clients through various stages of IT asset life cycle—from initial
purchase and technology upgrades to asset disposition decisions.
Global Financing Capabilities
Client Financing: lease, installment payment plan and loan financ-
ing to end users and internal clients for terms up to seven years.
Assets financed are primarily IT products and services where
the company has expertise. Internal financing is predominantly
in support of Global Services’ long-term client service contracts.
Global Financing also factors a selected portion of the company’s
accounts receivable, primarily for cash management purposes. All
internal financing arrangements are at arm’s-length rates and are
based upon market conditions.
Commercial Financing: short-term inventory and accounts receiv-
able financing to suppliers, distributors and remarketers of IBM
and OEM products.
Remanufacturing and Remarketing: assets include used equip-
ment returned from lease transactions, or used surplus equipment
acquired internally or externally. These assets may be refurbished
or upgraded and sold or leased to new or existing clients both
externally or internally. Externally remarketed equipment revenue
represents sales or leases to clients and resellers. Internally remar-
keted equipment revenue primarily represents used equipment
that is sold internally to Systems Hardware and Global Services.
Systems Hardware may also sell the equipment that it purchases
from Global Financing to external clients.

28 Management Discussion
International Business Machines Corporation and Subsidiary Companies
IBM Worldwide OrganizationsThe following worldwide organizations play key roles in IBM’s deliv-
ery of value to its clients:
• Sales and Distribution
• Research, Development and Intellectual Property
• Integrated Supply Chain
Sales and Distribution
IBM has a significant global presence, operating in more than
175 countries, with an increasingly broad-based geographic
distribution of revenue. The company’s Sales and Distribution
organization manages the IBM global footprint, with dedicated
country-based operating units focused on delivering unique value
and a superior client experience. Within these units, client rela-
tionship professionals work with integrated teams of consultants,
product specialists and delivery fulfillment teams to enable clients’
business growth and innovation. These teams deliver value by
understanding the clients’ business and needs, and then bringing
together capabilities from across IBM and an extensive network
of Business Partners to develop and implement client solutions.
By combining global expertise and digital sales capabilities
with local experience, IBM’s geographic structure enables client
relationships through dedicated management focus for local cli-
ents, speed in addressing new market opportunities and timely
investments in emerging opportunities. The geographic units align
industry solution, product and services expertise to serve clients’
agendas. IBM also extends the reach of its capabilities to com-
mercial clients by leveraging industry skills with digital marketing,
digital sales and local Business Partner resources.
The company continues to invest to capture the long-term
opportunity in key growth markets around the world—India, China
and countries within Southeast Asia, Eastern Europe, the Middle
East, Africa and Latin America. The company’s major markets
include the G7 countries of Canada, France, Germany, Italy, Japan,
the United States (U.S.) and the United Kingdom (UK) plus Austria,
the Bahamas, Belgium, the Caribbean region, Cyprus, Denmark,
Finland, Greece, Iceland, Ireland, Israel, Malta, the Netherlands,
Norway, Portugal, Spain, Sweden and Switzerland.
Research, Development and Intellectual Property
IBM’s research and development (R&D) operations differentiate
the company from its competitors. IBM annually invests approxi-
mately 6 percent of total revenue for R&D, focusing on high-growth,
high-value opportunities. IBM Research works with clients and
the company’s business units through global labs on near-term
and midterm innovations. It contributes many new technologies
to IBM’s portfolio every year and helps clients address their most
difficult challenges. IBM Research also explores the boundaries
of science and technology—from nanotechnology and future
systems, to big data analytics, secure clouds and advancing the
world’s first cognitive computing platform, IBM Watson.
In 2015, IBM was awarded more U.S. patents than any other
company for the 23rd consecutive year. IBM’s 7,355 patents
awarded in 2015 position the company to compete and lead in
the emerging opportunities represented by big data and analyt-
ics, security, social and mobile technologies. These inventions will
advance IBM’s cloud platform and the new era of computing in
which machines will learn, reason and interact with people in more
natural ways.
The company continues to actively seek intellectual property
(IP) protection for its innovations, while increasing emphasis on
other initiatives designed to leverage its IP leadership. Some of
IBM’s technological breakthroughs are used exclusively in IBM
products, while others are licensed and may be used in IBM prod-
ucts and/or the products of the licensee. While the company’s
various proprietary IP rights are important to its success, IBM
believes its business as a whole is not materially dependent on
any particular patent or license, or any particular group of patents
or licenses. IBM owns or is licensed under a number of patents,
which vary in duration, relating to its products.
Integrated Supply Chain
IBM has an extensive integrated supply chain, procuring mate-
rials and services globally. In 2015, the company also managed
approximately $24 billion in procurement spending for its clients
through the Global Process Services organization. The supply,
manufacturing and logistics operations are seamlessly integrated
and have optimized inventories over time. Simplifying and stream-
lining internal processes has improved sales force productivity and
operational effectiveness and efficiency. Supply chain resiliency
enables IBM to reduce its risk during marketplace changes.
The company continues to derive business value from its own
globally integrated supply chain providing a strategic advantage
for the company to create value for clients. IBM leverages its supply
chain expertise for clients through its supply chain business trans-
formation outsourcing service to optimize and help operate clients’
end-to-end supply chain processes, from procurement to logistics.
Utilizing analytics, mobile, cloud and social—with numerous proj-
ects, has allowed the integrated supply chain to drive positive
business outcomes for the company and its clients.

29Management Discussion
International Business Machines Corporation and Subsidiary Companies
YEAR IN REVIEW
Results of Continuing Operations
Segment Details
The following is an analysis of the 2015 versus 2014 reportable segment results. The table below presents each reportable segment’s
external revenue and gross margin results. Segment pre-tax income includes transactions between segments that are intended to reflect
an arm’s-length transfer price and excludes certain unallocated corporate items.
($ in millions)
For the year ended December 31: 2015 2014**
Yr.-to-Yr. Percent/
Margin Change
Yr.-to-Yr. Percent Change
Adjusted for Currency
Revenue
Global Technology Services $32,017 $35,442 (9.7)% 0.5%*
Gross margin 37.4% 39.0% (1.5) pts.
Global Business Services 17,166 19,512 (12.0)% (4.1)%*
Gross margin 28.2% 30.4% (2.2) pts.
Software 22,932 25,434 (9.8)% (3.5)%
Gross margin 87.3% 88.6% (1.3) pts.
Systems Hardware 7,581 9,996 (24.2)% 7.6%*
Gross margin 46.6% 39.5% 7.2 pts.
Global Financing 1,840 2,034 (9.5)% 1.5%
Gross margin 45.6% 49.4% (3.7) pts.
Other 206 374 (45.0)% (39.1)%
Gross margin (253.0)% (215.0)% (38.0) pts.
Total consolidated revenue $81,741 $92,793 (11.9)% (1.2)%*
Total consolidated gross profi t $40,684 $46,407 (12.3)%
Total consolidated gross margin 49.8% 50.0% (0.2) pts.
Non-operating adjustments
Amortization of acquired intangible assets 373 416 (10.5)%
Retirement-related costs/(income) 469 173 170.7%
Operating (non-GAAP) gross profi t $41,526 $46,996 (11.6)%
Operating (non-GAAP) gross margin 50.8% 50.6% 0.2 pts.
* Adjusted for divestitures and currency.
** Reclassified to conform with 2015 presentation.
Global Services
In 2015, the Global Services segments, GTS and GBS, delivered
combined revenue of $49,182 million, a decrease of 10.5 percent as
reported and 1 percent adjusted for currency (9 points) and dives-
titures. Total outsourcing revenue of $21,889 million decreased
10.7 percent as reported and 1 percent adjusted for currency
(10 points) and divestitures. Total transactional revenue of $21,161
million decreased 10.3 percent and 2 percent adjusted for cur-
rency. The estimated Global Services backlog at December 31,
2015 of $121 billion increased 1 percent year to year, adjusted
for currency. Combined pre-tax income for the year decreased
18.2 percent and the pre-tax margin decreased 1.4 points to
15.1 percent.

30 Management Discussion
International Business Machines Corporation and Subsidiary Companies
($ in millions)
For the year ended December 31: 2015 2014**
Yr.-to-Yr. PercentChange
Yr.-to-Yr. Percent Change
Adjusted for Currency
Global Services external revenue $49,182 $54,954 (10.5)% (1.1)%*
Global Technology Services $32,017 $35,442 (9.7)% 0.5%*
Outsourcing 16,992 19,082 (11.0) (0.5)
Integrated Technology Services 8,893 9,506 (6.4) 2.5
Maintenance 6,132 6,853 (10.5) 1.2*
Global Business Services $17,166 $19,512 (12.0)% (4.1)%*
Outsourcing 4,898 5,438 (9.9) (2.0)*
Consulting and Systems Integration 12,268 14,075 (12.8) (4.9)
* Adjusted for divestitures and currency.
** Reclassified to conform with 2015 presentation.
Global Technology Services revenue of $32,017 million decreased
9.7 percent as reported in 2015 compared to the prior year, but
increased 1 percent adjusted for currency (10 points) and the
System x divestiture, as the company helps clients transition to a
hybrid cloud services platform bringing cloud, mobility and secu-
rity to infrastructure services. Within GTS, outsourcing revenue
of $16,992 million decreased 11.0 percent as reported and 1 per-
cent adjusted for currency as the company continues to reinvent
its portfolio, providing the most modern IT services that connect
clients to the cloud-based mobile world. Integrated Technology
Services (ITS) revenue of $8,893 million decreased 6.4 percent
as reported, but grew 3 percent adjusted for currency compared
to the prior year with strong performance in SoftLayer through-
out the year. Maintenance revenue of $6,132 million decreased
10.5 percent as reported, but grew 1 percent adjusted for currency
(9 points) and the System x divestiture (3 points). This business
continues to contribute significant revenue by delivering a wide
range of support services to maintain and improve clients’ IT infra-
structure. Throughout 2015, there was continued strong demand
for Multi-Vendor Support services where clients can leverage the
company’s global distribution and inventory capabilities.
Within GTS, the strategic imperatives, including hybrid cloud
services, grew strong double digits at constant currency for the full
year, including strong demand for SoftLayer. The company con-
tinues to increase its cloud capacity with 46 cloud data centers
opened around the world as of December 31, 2015. This Infrastruc-
ture-as-a-Service cloud platform provides clients with a range of
cloud services, including virtual and bare metal servers along with
a dedicated dark fiber network infrastructure. As clients evaluate
their technology roadmap, they look for agility and innovation and
to gain insight into data from all sources. The company’s hybrid
cloud stack is an open platform that enables this innovation. Cli-
ents can choose from public, private and dedicated environments
based on their needs, such as workload, performance, data sov-
ereignty and regulatory requirements. Entire industries and value
chains are being disrupted, and clients are looking to the company
for competitive advantage.
Global Business Services revenue of $17,166 million decreased
12.0 percent as reported and 4 percent adjusted for currency
(8 points) compared to the prior year. Within GBS, outsourcing
revenue of $4,898 million decreased 9.9 percent as reported and
2 percent adjusted for currency (8 points). Consulting and Systems
Integration (C&SI) revenue of $12,268 million declined 12.8 percent
as reported and 5 percent adjusted for currency.
As the company continued to transform the GBS business
during the year, revenue from the strategic imperative practices
grew at strong rates. However, overall revenue performance con-
tinues to be impacted by the company’s shift away from traditional
enterprise application implementations. Clients are moving away
from ERP engagements to initiatives that focus on digitizing their
business with analytics, cloud and mobile technologies. As part of
the company’s partnership with Apple, it has now delivered over
100 MobileFirst for iOS applications. This unique partnership
brings together the simplicity of design and ease of use of the
Apple mobile device with IBM’s ability to build applications that
scale securely and efficiently to the enterprise, helping to transform
the way work gets done across 14 industries and 65 professions.
These applications allow clients to securely access their most
critical data and processes, so that they can redesign workflows
and drive productivity. Since the partnership with Apple was
announced in 2014, the company has generated over $1 billion in
signings from the program.

31Management Discussion
International Business Machines Corporation and Subsidiary Companies
($ in millions)
For the year ended December 31: 2015 2014*
Yr.-to-Yr. Percent/
Margin Change
Global Services
Global Technology Services
External gross profi t $11,981 $13,808 (13.2)%
External gross profi t margin 37.4% 39.0% (1.5) pts.
Pre-tax income $ 5,002 $ 5,931 (15.7)%
Pre-tax margin 15.2% 16.3% (1.1) pts.
Global Business Services
External gross profi t $ 4,837 $ 5,923 (18.3)%
External gross profi t margin 28.2% 30.4% (2.2) pts.
Pre-tax income $ 2,634 $ 3,408 (22.7)%
Pre-tax margin 14.9% 17.0% (2.1) pts.
* Reclassified to conform with 2015 presentation.
The GTS gross profit margin decreased 1.5 points to 37.4 per-
cent in 2015 compared to prior year. Pre-tax income decreased
15.7 percent to $5,002 million. The GTS pre-tax margin declined
1.1 points to 15.2 percent compared to the prior year, primarily due
to investments being made in this business. The company con-
tinues to invest to deliver the most contemporary offerings that
are built with cloud, analytics, mobile, security and cognitive tech-
nologies enabling it to transform clients’ enterprises. In addition,
currency had a large year-to-year impact on profit given the strong
dollar currency environment.
The GBS gross profit margin decreased 2.2 points to 28.2 per-
cent in 2015 compared to the prior year. Pre-tax income decreased
22.7 percent to $2,634 million and pre-tax margin declined
2.1 points to 14.9 percent compared to the prior year. This year-to-
year profit decline reflects the market shifts in the GBS business.
In parts of the portfolio where the market is declining, there is
price and profit pressure and action is being taken to optimize the
cost structure in these areas. The company continues to shift and
add significant resources to the high-growth analytics, cloud and
mobility practices, which impacts productivity and margin in the
near term.
Global Services Backlog
The estimated Global Services backlog at December 31, 2015 was
$121 billion, a decrease of 6.0 percent as reported, but an increase
of 1 percent adjusted for currency, compared to the December 31,
2014 balance. The estimated transactional backlog at Decem-
ber 31, 2015 decreased 6.5 percent as reported, but was flat year
to year adjusted for currency. The estimated outsourcing backlog
decreased 5.4 percent as reported, but grew 2 percent adjusted
for currency compared to the prior year.
Clients are looking to transform their most critical systems into
hybrid cloud environments, and the complexity of these partner-
ships in many cases results in larger engagements. For the full year
of 2015, over 70 services deals greater than $100 million were
signed, which was 40 percent more than in 2014. About 70 percent
of those transactions feature hybrid cloud content, which reflects
both the value IBM’s clients see in hybrid and the reality that not
all their workloads are optimized for the cloud.
($ in billions)
At December 31: 2015 2014
Yr.-to-Yr.Percent Change
Yr.-to-Yr. Percent Change
Adjusted forCurrency
Backlog
Total backlog $120.7 $128.4 (6.0)% 0.8%
Outsourcing backlog 76.4 80.8 (5.4) 1.7
Total Global Services backlog includes GTS Outsourcing, ITS,
GBS Outsourcing, Consulting and Systems Integration and Main-
tenance. Outsourcing backlog includes GTS Outsourcing and GBS
Outsourcing. Transactional backlog includes ITS and Consulting
and Systems Integration. Total backlog is intended to be a state-
ment of overall work under contract and therefore does include
Maintenance. Backlog estimates are subject to change and are
affected by several factors, including terminations, changes in the
scope of contracts, periodic revalidations, adjustments for revenue
not materialized and adjustments for currency.
Global Services signings are management’s initial estimate
of the value of a client’s commitment under a Global Services
contract. There are no third-party standards or requirements
governing the calculation of signings. The calculation used by
management involves estimates and judgments to gauge the
extent of a client’s commitment, including the type and duration of
the agreement, and the presence of termination charges or wind-
down costs.

32 Management Discussion
International Business Machines Corporation and Subsidiary Companies
Signings include GTS Outsourcing, ITS, GBS Outsourcing and
Consulting and Systems Integration contracts. Contract exten-
sions and increases in scope are treated as signings only to the
extent of the incremental new value. Maintenance is not included
in signings as maintenance contracts tend to be more steady state,
where revenues equal renewals.
Contract portfolios purchased in an acquisition are treated as
positive backlog adjustments provided those contracts meet the
company’s requirements for initial signings. A new signing will be
recognized if a new services agreement is signed incidental or
coincidental to an acquisition or divestiture.
($ in millions)
For the year ended December 31: 2015 2014
Yr.-to-Yr. Percent Change
Yr.-to-Yr. Percent Change
Adjusted for Currency
Total signings $48,243 $51,569 (6.5)% 2.8%
Outsourcing signings $25,196 $26,517 (5.0)% 4.9%
Transactional signings 23,046 25,052 (8.0) 0.5
Software
($ in millions)
For the year ended December 31: 2015 2014
Yr.-to-Yr. Percent Change
Yr.-to-Yr. Percent Change
Adjusted for Currency
Software external revenue $22,932 $25,434 (9.8)% (3.5)%
Middleware $19,473 $21,474 (9.3)% (3.0)%
Key branded middleware 15,778 17,098 (7.7) (1.5)
WebSphere (5.3) 0.2
Information Management (8.0) (1.6)
Workforce Solutions (8.1) (0.6)
Tivoli (6.3) 0.1
Rational (20.3) (15.1)
Other middleware 3,695 4,376 (15.6) (8.7)
Operating systems 1,815 2,119 (14.3) (8.1)
Other 1,644 1,841 (10.7) (4.9)
Software revenue of $22,932 million decreased 9.8 percent as
reported and 4 percent adjusted for currency in 2015 compared
to the prior year. Year-to-year software revenue performance
reflected a decrease in middleware with declines in transactional
revenue and a continuing headwind from operating systems.
Key branded middleware revenue of $15,778 million, which
accounted for approximately 69 percent of total software revenue
in 2015, decreased 7.7 percent as reported and 2 percent adjusted
for currency compared to the prior year. Within key branded
middleware, WebSphere decreased 5.3 percent (flat adjusted
for currency), Information Management decreased 8.0 percent
(2 percent adjusted for currency), Workforce Solutions decreased
8.1 percent (1 percent adjusted for currency), Tivoli decreased
6.3 percent (flat adjusted for currency), and Rational decreased
20.3 percent (15 percent adjusted for currency). Other middleware
decreased 15.6 percent as reported and 9 percent adjusted for
currency. Operating systems decreased 14.3 percent as reported
and 8 percent adjusted for currency.
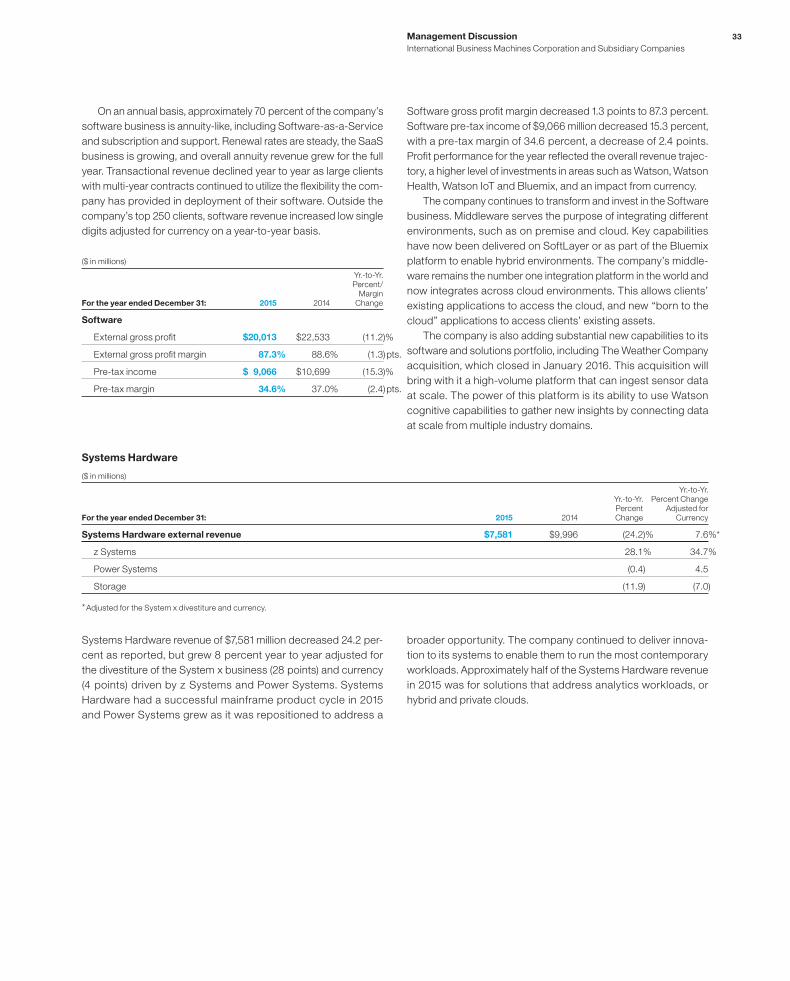
33Management Discussion
International Business Machines Corporation and Subsidiary Companies
On an annual basis, approximately 70 percent of the company’s
software business is annuity-like, including Software-as-a-Service
and subscription and support. Renewal rates are steady, the SaaS
business is growing, and overall annuity revenue grew for the full
year. Transactional revenue declined year to year as large clients
with multi-year contracts continued to utilize the flexibility the com-
pany has provided in deployment of their software. Outside the
company’s top 250 clients, software revenue increased low single
digits adjusted for currency on a year-to-year basis.
($ in millions)
For the year ended December 31: 2015 2014
Yr.-to-Yr. Percent/
Margin Change
Software
External gross profi t $20,013 $22,533 (11.2)%
External gross profi t margin 87.3% 88.6% (1.3) pts.
Pre-tax income $ 9,066 $10,699 (15.3)%
Pre-tax margin 34.6% 37.0% (2.4) pts.
Software gross profit margin decreased 1.3 points to 87.3 percent.
Software pre-tax income of $9,066 million decreased 15.3 percent,
with a pre-tax margin of 34.6 percent, a decrease of 2.4 points.
Profit performance for the year reflected the overall revenue trajec-
tory, a higher level of investments in areas such as Watson, Watson
Health, Watson IoT and Bluemix, and an impact from currency.
The company continues to transform and invest in the Software
business. Middleware serves the purpose of integrating different
environments, such as on premise and cloud. Key capabilities
have now been delivered on SoftLayer or as part of the Bluemix
platform to enable hybrid environments. The company’s middle-
ware remains the number one integration platform in the world and
now integrates across cloud environments. This allows clients’
existing applications to access the cloud, and new “born to the
cloud” applications to access clients’ existing assets.
The company is also adding substantial new capabilities to its
software and solutions portfolio, including The Weather Company
acquisition, which closed in January 2016. This acquisition will
bring with it a high-volume platform that can ingest sensor data
at scale. The power of this platform is its ability to use Watson
cognitive capabilities to gather new insights by connecting data
at scale from multiple industry domains.
Systems Hardware
($ in millions)
For the year ended December 31: 2015 2014
Yr.-to-Yr. Percent Change
Yr.-to-Yr. Percent Change
Adjusted for Currency
Systems Hardware external revenue $7,581 $9,996 (24.2)% 7.6%*
z Systems 28.1% 34.7%
Power Systems (0.4) 4.5
Storage (11.9) (7.0)
* Adjusted for the System x divestiture and currency.
Systems Hardware revenue of $7,581 million decreased 24.2 per-
cent as reported, but grew 8 percent year to year adjusted for
the divestiture of the System x business (28 points) and currency
(4 points) driven by z Systems and Power Systems. Systems
Hardware had a successful mainframe product cycle in 2015
and Power Systems grew as it was repositioned to address a
broader opportunity. The company continued to deliver innova-
tion to its systems to enable them to run the most contemporary
workloads. Approximately half of the Systems Hardware revenue
in 2015 was for solutions that address analytics workloads, or
hybrid and private clouds.
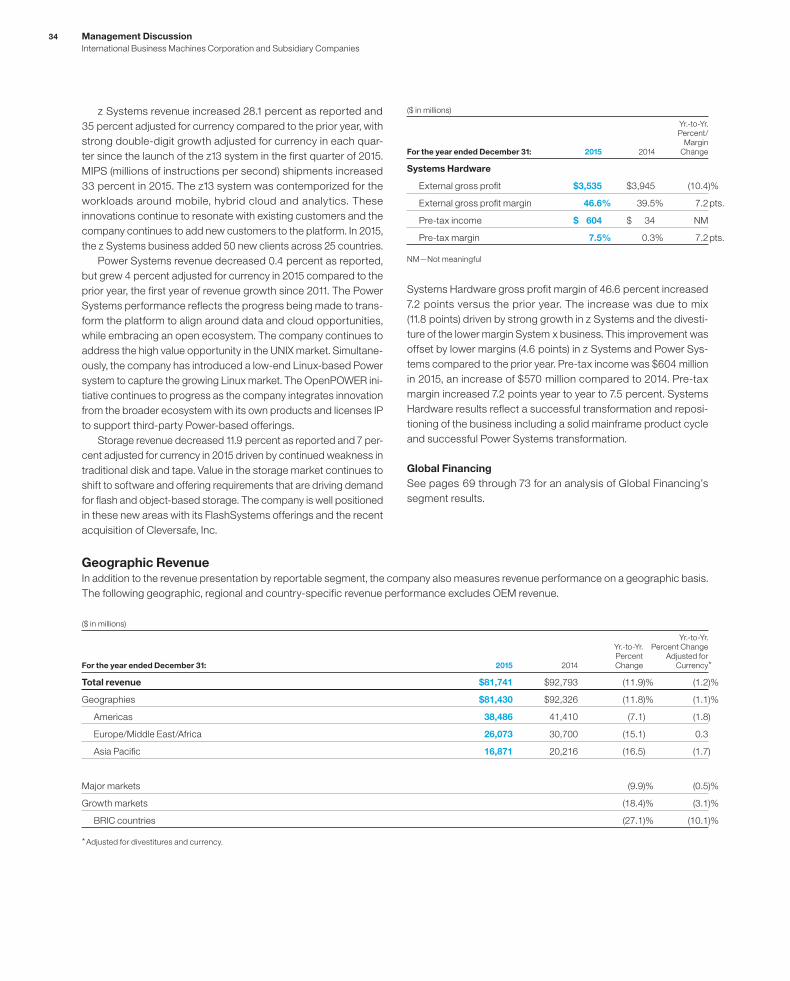
34 Management Discussion
International Business Machines Corporation and Subsidiary Companies
z Systems revenue increased 28.1 percent as reported and
35 percent adjusted for currency compared to the prior year, with
strong double-digit growth adjusted for currency in each quar-
ter since the launch of the z13 system in the first quarter of 2015.
MIPS (millions of instructions per second) shipments increased
33 percent in 2015. The z13 system was contemporized for the
workloads around mobile, hybrid cloud and analytics. These
innovations continue to resonate with existing customers and the
company continues to add new customers to the platform. In 2015,
the z Systems business added 50 new clients across 25 countries.
Power Systems revenue decreased 0.4 percent as reported,
but grew 4 percent adjusted for currency in 2015 compared to the
prior year, the first year of revenue growth since 2011. The Power
Systems performance reflects the progress being made to trans-
form the platform to align around data and cloud opportunities,
while embracing an open ecosystem. The company continues to
address the high value opportunity in the UNIX market. Simultane-
ously, the company has introduced a low-end Linux-based Power
system to capture the growing Linux market. The OpenPOWER ini-
tiative continues to progress as the company integrates innovation
from the broader ecosystem with its own products and licenses IP
to support third-party Power-based offerings.
Storage revenue decreased 11.9 percent as reported and 7 per-
cent adjusted for currency in 2015 driven by continued weakness in
traditional disk and tape. Value in the storage market continues to
shift to software and offering requirements that are driving demand
for flash and object-based storage. The company is well positioned
in these new areas with its FlashSystems offerings and the recent
acquisition of Cleversafe, Inc.
($ in millions)
For the year ended December 31: 2015 2014
Yr.-to-Yr. Percent/
Margin Change
Systems Hardware
External gross profi t $3,535 $3,945 (10.4)%
External gross profi t margin 46.6% 39.5% 7.2 pts.
Pre-tax income $ 604 $ 34 NM
Pre-tax margin 7.5% 0.3% 7.2 pts.
NM—Not meaningful
Systems Hardware gross profit margin of 46.6 percent increased
7.2 points versus the prior year. The increase was due to mix
(11.8 points) driven by strong growth in z Systems and the divesti-
ture of the lower margin System x business. This improvement was
offset by lower margins (4.6 points) in z Systems and Power Sys-
tems compared to the prior year. Pre-tax income was $604 million
in 2015, an increase of $570 million compared to 2014. Pre-tax
margin increased 7.2 points year to year to 7.5 percent. Systems
Hardware results reflect a successful transformation and reposi-
tioning of the business including a solid mainframe product cycle
and successful Power Systems transformation.
Global Financing
See pages 69 through 73 for an analysis of Global Financing’s
segment results.
Geographic RevenueIn addition to the revenue presentation by reportable segment, the company also measures revenue performance on a geographic basis.
The following geographic, regional and country-specific revenue performance excludes OEM revenue.
($ in millions)
For the year ended December 31: 2015 2014
Yr.-to-Yr. Percent Change
Yr.-to-Yr. Percent Change
Adjusted for Currency*
Total revenue $81,741 $92,793 (11.9)% (1.2)%
Geographies $81,430 $92,326 (11.8)% (1.1)%
Americas 38,486 41,410 (7.1) (1.8)
Europe/Middle East/Africa 26,073 30,700 (15.1) 0.3
Asia Pacifi c 16,871 20,216 (16.5) (1.7)
Major markets (9.9)% (0.5)%
Growth markets (18.4)% (3.1)%
BRIC countries (27.1)% (10.1)%
* Adjusted for divestitures and currency.

35Management Discussion
International Business Machines Corporation and Subsidiary Companies
Total geographic revenue of $81,430 million in 2015 decreased
11.8 percent as reported and 1 percent adjusted for currency
(8 points) and the divestitures of the System x and customer care
businesses (3 points) compared to 2014. Major market coun-
tries decreased 9.9 percent as reported and 1 percent adjusted
for currency (8 points) and the divested businesses (2 points).
Within the major markets, performance varied in 2015. While the
U.S. was down compared to the prior year, revenue in Germany,
Japan and the UK grew year to year on an adjusted basis. Over-
all, growth market countries decreased 18.4 percent as reported
and 3 percent adjusted for currency (9 points) and the divested
businesses (6 points). From a regional perspective, on an adjusted
basis, growth in Latin America and the Middle East and Africa
region was more than offset by declines in the Asia Pacific growth
market countries.
Americas revenue of $38,486 million decreased 7.1 percent
as reported and 2 percent adjusted for currency (3 points) and
divestitures (2 points) compared to 2014 with a decline in North
America and growth in Latin America on an adjusted basis. The
U.S. decreased 4.4 percent as reported and 3 percent adjusted for
divestitures. Canada was down 17.2 percent as reported and 2 per-
cent adjusted for currency (13 points) and divestitures (2 points).
In Latin America, Brazil decreased 26.0 percent as reported and
2 percent adjusted for currency (22 points) and the divested
businesses (2 points), while Mexico had growth of 0.5 percent
as reported and 14 percent adjusted for currency (9 points) and
divestitures (4 points).
Europe/Middle East/Africa (EMEA) revenue of $26,073 million
in 2015 decreased 15.1 percent as reported, but was flat year to
year adjusted for currency (13 points) and the divested businesses
(3 points). On an adjusted basis, there was growth in Germany
and the UK. Germany decreased 13.2 percent as reported, but
grew 7 percent adjusted for currency (17 points) and the divested
businesses (3 points). The UK decreased 6.3 percent year to year
as reported, but grew 3 percent adjusted for currency (7 points)
and the divested businesses (2 points). The Middle East and Africa
region decreased 4.8 percent as reported, but grew 5 percent
adjusted for the divested businesses (6 points) and currency
(4 points). Russia decreased 32.2 percent as reported and 24 per-
cent adjusted for the divestitures.
Asia Pacific revenue of $16,871 million decreased 16.5 percent
as reported and 2 percent adjusted for currency (9 points) and the
divested businesses (6 points) compared to the prior year. Japan
decreased 9.9 percent as reported, but had growth of 5 percent
adjusted for currency (13 points) and the divested businesses
(2 points). On an adjusted basis, the Japan growth was more than
offset by a decline in other markets. China decreased 34.4 percent
as reported and 21 percent adjusted for the divested businesses
(12 points) and currency (1 point). India decreased 3.8 percent as
reported, but had growth of 8 percent adjusted for the divested
businesses (7 points) and currency (5 points).
Total Expense and Other (Income)
($ in millions)
For the year ended December 31: 2015 2014
Yr.-to-Yr. Percent/
Margin Change
Total consolidated expense
and other (income) $24,740 $26,421 (6.4)%
Non-operating adjustments
Amortization of acquired
intangible assets (304) (374) (18.8)
Acquisition-related charges (26) (12) 112.6
Non-operating retirement-related
(costs)/income (581) (180) 222.4
Operating (non-GAAP)
expense and other (income) $23,830 $25,855 (7.8)%
Total consolidated
expense-to-revenue ratio 30.3% 28.5% 1.8 pts.
Operating (non-GAAP)
expense-to-revenue ratio 29.2% 27.9% 1.3 pts.
The key drivers of the year-to-year change in total expense and
other (income) were approximately:
Total Operating Consolidated (non-GAAP)
• Currency* (9) points (9) points
• System x divestiture (2) points (2) points
• Divestiture gains 6 points 6 points
• Workforce rebalancing (3) points (3) points
* Reflects impacts of translation and hedging programs.
For additional information regarding total expense and other
(income) for both expense presentations, see the following anal-
yses by category.

36 Management Discussion
International Business Machines Corporation and Subsidiary Companies
Selling, General and Administrative
($ in millions)
For the year ended December 31: 2015 2014
Yr.-to-Yr. PercentChange
Selling, general and
administrative expense
Selling, general and
administrative—other $16,643 $18,532 (10.2)%
Advertising and promotional
expense 1,290 1,307 (1.3)
Workforce rebalancing charges 587 1,472 (60.1)
Retirement-related costs 1,052 811 29.7
Amortization of acquired
intangible assets 304 374 (18.8)
Stock-based compensation 322 350 (8.0)
Bad debt expense 231 334 (30.8)
Total consolidated selling,
general and administrative
expense $20,430 $23,180 (11.9)%
Non-operating adjustments
Amortization of acquired
intangible assets (304) (374) (18.8)
Acquisition-related charges (21) (11) 81.1
Non-operating retirement-related
(costs)/income (533) (257) 107.3
Operating (non-GAAP)
selling, general and
administrative expense $19,573 $22,537 (13.2)%
Total selling, general and administrative (SG&A) expense d e-
creased 11.9 percent in 2015 versus 2014, driven primarily by the
following factors:
• The effects of currency (7 points); and
• Lower workforce rebalancing charges (3 points); and
• The impact of the divested System x business (1 point).
Operating (non-GAAP) expense decreased 13.2 percent year to
year driven primarily by the same factors.
Bad debt expense decreased $103 million in 2015 compared
to 2014. The receivables provision coverage was 2.6 percent at
December 31, 2015, an increase of 40 basis points from Decem-
ber 31, 2014.
Research, Development and Engineering
($ in millions)
For the year ended December 31: 2015 2014
Yr.-to-Yr. PercentChange
Total consolidated research,
development and engineering $5,247 $5,437 (3.5)%
Non-operating adjustment
Non-operating retirement-related
(costs)/income (48) 77 NM
Operating (non-GAAP) research,
development and engineering $5,200 $5,514 (5.7)%
NM—Not meaningful
Research, development and engineering (RD&E) expense was
6.4 percent of revenue in 2015 and 5.9 percent of revenue in 2014.
RD&E expense decreased 3.5 percent in 2015 versus 2014
primarily driven by:
• The effects of currency (5 points); and
• The impact of the divested System x business (4 points);
partially offset by
• Increased base spending (4 points); and
• Higher expense due to acquisitions (1 point).
Operating (non-GAAP) RD&E expense decreased 5.7 percent
in 2015 compared to the prior year, driven primarily by the same
factors.
Intellectual Property and Custom Development Income
($ in millions)
For the year ended December 31: 2015 2014
Yr.-to-Yr. Percent Change
Sales and other transfers
of intellectual property $303 $283 7.1%
Licensing/royalty-based fees 117 129 (9.8)
Custom development income 262 330 (20.5)
Total $682 $742 (8.1)%
The timing and amount of Sales and other transfers of IP may vary
significantly from period to period depending upon the timing of
divestitures, economic conditions, industry consolidation and the
timing of new patents and know-how development. There were no
material individual IP transactions in 2015 or 2014.

37Management Discussion
International Business Machines Corporation and Subsidiary Companies
Other (Income) and Expense
($ in millions)
For the year ended December 31: 2015 2014
Yr.-to-Yr. PercentChange
Other (income) and expense
Foreign currency transaction
losses/(gains) $ 414 $ (599) NM
(Gains)/losses on derivative
instruments (853) 654 NM
Interest income (72) (90) (19.8)%
Net (gains)/losses from securities
and investment assets 47 (26) NM
Other (260) (1,878) (86.1)%
Total consolidated other
(income) and expense $(724) $(1,938) (62.6)%
Non-operating adjustment
Acquisition-related charges (5) (1) NM
Operating (non-GAAP)
other (income) and expense $(729) $(1,939) (62.4)%
NM—Not meaningful
The decrease in income of $1,214 million year over year was pri-
marily driven by:
• Lower gains on divestitures ($1,623 million) primarily associ-
ated with the divestitures of the System x and customer care
businesses in 2014; and
• Higher foreign currency transaction losses ($1,013 million);
partially offset by
• Increased gains on derivative instruments ($1,507 million).
Interest Expense
($ in millions)
For the year ended December 31: 2015 2014
Yr.-to-Yr. Percent Change
Interest expense
Total $468 $484 (3.2)%
The decrease in interest expense in 2015 versus 2014 was primar-
ily driven by lower average debt levels, partially offset by higher
average interest rates. Interest expense is presented in cost of
financing in the Consolidated Statement of Earnings only if the
related external borrowings are to support the Global Financing
external business. Overall interest expense (excluding capital-
ized interest) in 2015 was $1,009 million, a decrease of $16 million
year to year.
Stock-Based CompensationPre-tax stock-based compensation cost of $468 million decreased
$44 million compared to 2014. This was due primarily to decreases
related to performance share units ($32 million), the conversion
of stock-based awards previously issued by acquired entities
($6 million) and restricted stock units ($6 million). Stock-based
compensation cost, and the year-to-year change, was reflected
in the following categories: Cost: $100 million, down $21 million;
SG&A expense: $322 million, down $28 million; RD&E expense:
$51 million, down $3 million and Other (income) and expense:
($6 million), down $8 million. The amount of stock-based com-
pensation cost included in the loss from discontinued operations,
net of tax, was immaterial in 2015 and 2014.
Retirement-Related Plans The following table provides the total pre-tax cost for all retire -
ment-related plans. These amounts are included in the Consoli-
dated Statement of Earnings within the caption (e.g., Cost, SG&A,
RD&E) relating to the job function of the plan participants.
($ in millions)
For the year ended December 31: 2015 2014
Yr.-to-Yr. Percent Change
Retirement-related plans—cost
Service cost $ 484 $ 482 0.5%
Amortization of prior service
costs/(credits) (100) (114) (12.0)
Cost of defi ned contribution
plans 1,138 1,253 (9.2)
Total operating costs/(income) $ 1,522 $ 1,621 (6.1)%
Interest cost 3,316 3,994 (17.0)
Expected return on plan assets (5,879) (6,351) (7.4)
Recognized actuarial losses 3,283 2,467 33.1
Curtailments/settlements 36 25 41.2
Multi-employer plan/other costs 293 218 34.8
Total non-operating costs/
(income) $ 1,050 $ 353 197.2%
Total retirement-related
plans—cost $ 2,572 $ 1,974 30.3%

38 Management Discussion
International Business Machines Corporation and Subsidiary Companies
In 2015, total pre-tax retirement-related plan cost increased by
$598 million compared to 2014, primarily driven by an increase in
recognized actuarial losses ($816 million), lower expected return
on plan assets ($472 million) and higher pension obligations related
to litigation in Spain ($85 million), partially offset by lower inter-
est cost ($678 million) and lower defined contribution plans cost
($115 million).
As discussed in the “Operating (non-GAAP) Earnings” section
on pages 18 and 19, the company characterizes certain retire-
ment-related costs as operating and others as non-operating.
Utilizing this characterization, operating retirement-related costs
in 2015 were $1,522 million, a decrease of $99 million compared
to 2014, primarily driven by lower defined contribution plans cost
($115 million). Non-operating costs of $1,050 million increased
$696 million in 2015 compared to the prior year, driven primarily
by an increase in recognized actuarial losses ($816 million), lower
expected return on plan assets ($472 million), higher pension obli-
gations related to litigation in Spain ($85 million), partially offset by
lower interest cost ($678 million).
Income TaxesThe continuing operations effective tax rate for 2015 was 16.2 per-
cent, a decrease of 5.0 points versus the prior year, driven by the
following factors:
• The benefit resulting from the completion of the U.S. 2011–2012
tax audit, including the associated reserve redeterminations
(3.9 points); and
• A benefit due to the geographic mix of pre-tax income in
2015 (3.5 points); and
• A benefit due to the 2014 tax charge related to the divestiture
of the System x business (0.9 points); partially offset by
• A reduced benefit year to year in the utilization of foreign tax
credits (2.5 points); and
• The year-to-year increase in tax charges related to
intercompany payments made by foreign subsidiaries and
the intercompany licensing of certain IP (0.8 points).
The continuing operations operating (non-GAAP) effective tax rate
was 17.2 percent, a decrease of 3.8 points versus 2014 principally
driven by the same factors described above.
Earnings Per ShareBasic earnings per share is computed on the basis of the weight-
ed-average number of shares of common stock outstanding
during the period. Diluted earnings per share is computed on the
basis of the weighted-average number of shares of common stock
outstanding plus the effect of dilutive potential common shares
outstanding during the period using the treasury stock method.
Dilutive potential common shares include outstanding stock
options and stock awards.
For the year ended December 31: 2015 2014
Yr.-to-Yr. Percent Change
Earnings per share of common stock
from continuing operations
Assuming dilution $13.60 $15.59 (12.8)%
Basic $13.66 $15.68 (12.9)%
Diluted operating (non-GAAP) $14.92 $16.53 (9.7)%
Weighted-average shares
outstanding (in millions)
Assuming dilution 982.7 1,010.0 (2.7)%
Basic 978.7 1,004.3 (2.5)%
Actual shares outstanding at December 31, 2015 and 2014 were
965.7 million and 990.5 million, respectively. The average number
of common shares outstanding assuming dilution was 27.3 million
shares lower in 2015 versus 2014. The decrease was primarily the
result of the common stock repurchase program.
Results of Discontinued OperationsThe loss from discontinued operations, net of tax, was $0.2 billion
in 2015 and $3.7 billion in 2014. The loss from discontinued opera-
tions in 2014 included a nonrecurring pre-tax charge of $4.7 billion,
or $3.4 billion, net of tax, which included an impairment to reflect
the fair value less estimated costs to sell the Microelectronics
business and other estimated costs related to the transaction,
including cash consideration. The discontinued operations effec-
tive tax rate in 2015 was 40.3 percent compared to 30.2 percent
in 2014.
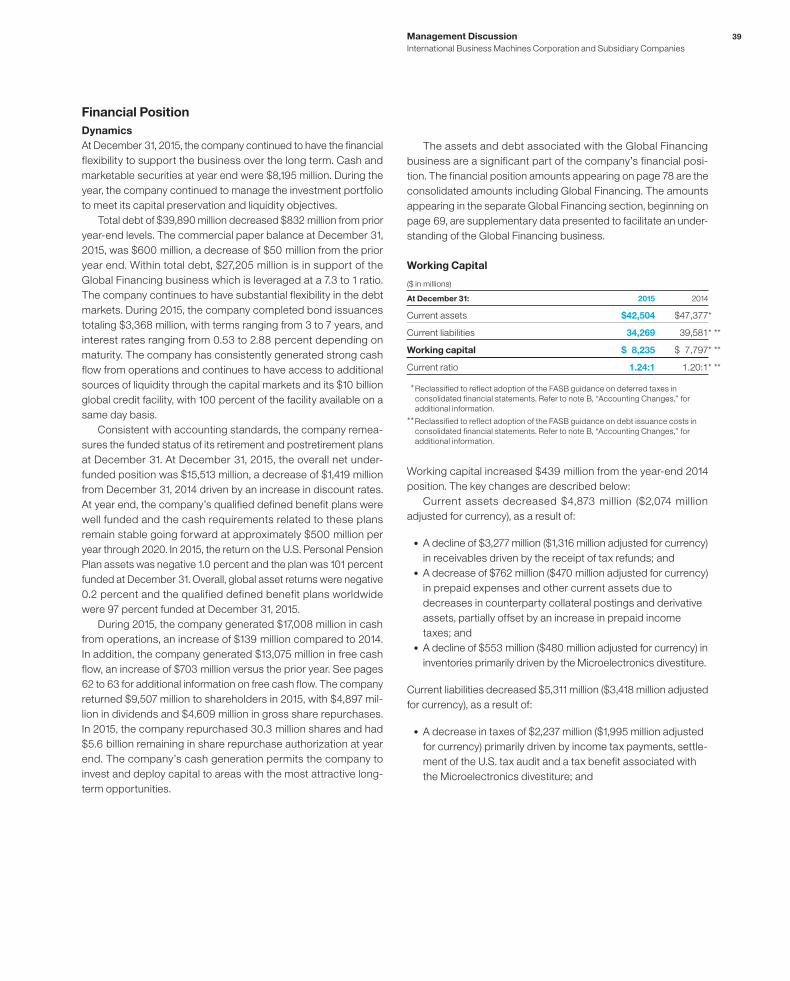
39Management Discussion
International Business Machines Corporation and Subsidiary Companies
Financial Position
Dynamics
At December 31, 2015, the company continued to have the financial
flexibility to support the business over the long term. Cash and
marketable securities at year end were $8,195 million. During the
year, the company continued to manage the investment portfolio
to meet its capital preservation and liquidity objectives.
Total debt of $39,890 million decreased $832 million from prior
year-end levels. The commercial paper balance at December 31,
2015, was $600 million, a decrease of $50 million from the prior
year end. Within total debt, $27,205 million is in support of the
Global Financing business which is leveraged at a 7.3 to 1 ratio.
The company continues to have substantial flexibility in the debt
markets. During 2015, the company completed bond issuances
totaling $3,368 million, with terms ranging from 3 to 7 years, and
interest rates ranging from 0.53 to 2.88 percent depending on
maturity. The company has consistently generated strong cash
flow from operations and continues to have access to additional
sources of liquidity through the capital markets and its $10 billion
global credit facility, with 100 percent of the facility available on a
same day basis.
Consistent with accounting standards, the company remea-
sures the funded status of its retirement and postretirement plans
at December 31. At December 31, 2015, the overall net under-
funded position was $15,513 million, a decrease of $1,419 million
from December 31, 2014 driven by an increase in discount rates.
At year end, the company’s qualified defined benefit plans were
well funded and the cash requirements related to these plans
remain stable going forward at approximately $500 million per
year through 2020. In 2015, the return on the U.S. Personal Pension
Plan assets was negative 1.0 percent and the plan was 101 percent
funded at December 31. Overall, global asset returns were negative
0.2 percent and the qualified defined benefit plans worldwide
were 97 percent funded at December 31, 2015.
During 2015, the company generated $17,008 million in cash
from operations, an increase of $139 million compared to 2014.
In addition, the company generated $13,075 million in free cash
flow, an increase of $703 million versus the prior year. See pages
62 to 63 for additional information on free cash flow. The company
returned $9,507 million to shareholders in 2015, with $4,897 mil-
lion in dividends and $4,609 million in gross share repurchases.
In 2015, the company repurchased 30.3 million shares and had
$5.6 billion remaining in share repurchase authorization at year
end. The company’s cash generation permits the company to
invest and deploy capital to areas with the most attractive long-
term opportunities.
The assets and debt associated with the Global Financing
business are a significant part of the company’s financial posi-
tion. The financial position amounts appearing on page 78 are the
consolidated amounts including Global Financing. The amounts
appearing in the separate Global Financing section, beginning on
page 69, are supplementary data presented to facilitate an under-
standing of the Global Financing business.
Working Capital
($ in millions)
At December 31: 2015 2014
Current assets $42,504 $47,377*
Current liabilities 34,269 39,581* **
Working capital $ 8,235 $ 7,797* **
Current ratio 1.24:1 1.20:1* **
* Reclassified to reflect adoption of the FASB guidance on deferred taxes in
consolidated financial statements. Refer to note B, “Accounting Changes,” for
additional information.
** Reclassified to reflect adoption of the FASB guidance on debt issuance costs in
consolidated financial statements. Refer to note B, “Accounting Changes,” for
additional information.
Working capital increased $439 million from the year-end 2014
position. The key changes are described below:
Current assets decreased $4,873 million ($2,074 million
adjusted for currency), as a result of:
• A decline of $3,277 million ($1,316 million adjusted for currency)
in receivables driven by the receipt of tax refunds; and
• A decrease of $762 million ($470 million adjusted for currency)
in prepaid expenses and other current assets due to
decreases in counterparty collateral postings and derivative
assets, partially offset by an increase in prepaid income
taxes; and
• A decline of $553 million ($480 million adjusted for currency) in
inventories primarily driven by the Microelectronics divestiture.
Current liabilities decreased $5,311 million ($3,418 million adjusted
for currency), as a result of:
• A decrease in taxes of $2,237 million ($1,995 million adjusted
for currency) primarily driven by income tax payments, settle-
ment of the U.S. tax audit and a tax benefit associated with
the Microelectronics divestiture; and
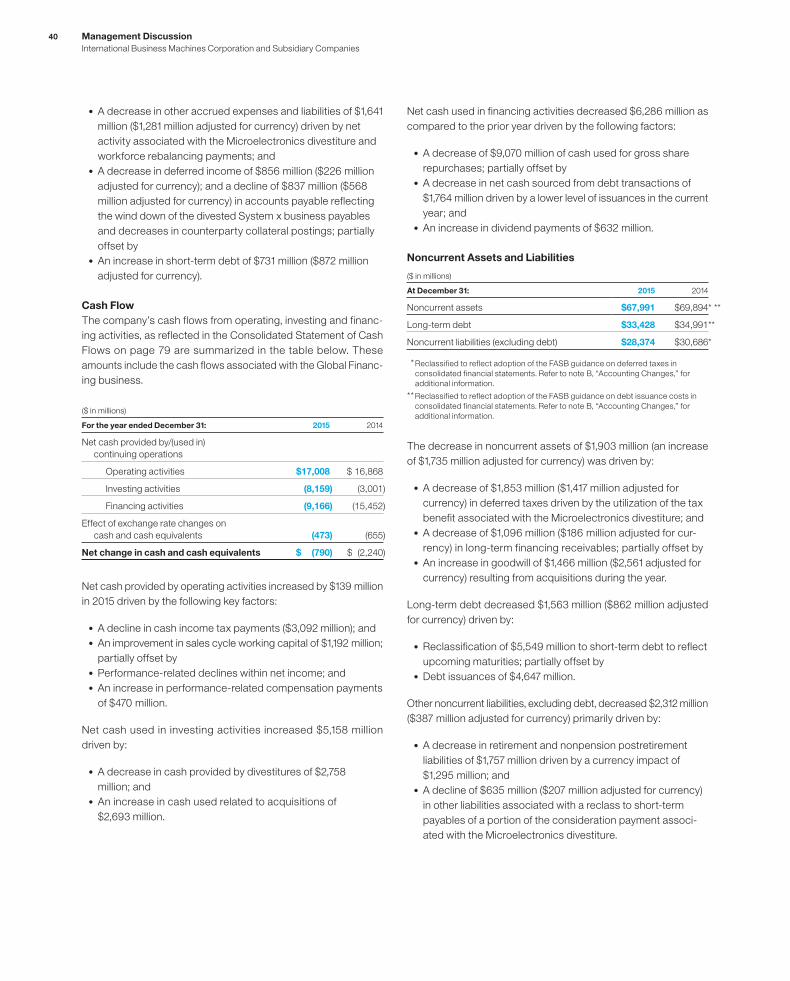
40 Management Discussion
International Business Machines Corporation and Subsidiary Companies
• A decrease in other accrued expenses and liabilities of $1,641
million ($1,281 million adjusted for currency) driven by net
activity associated with the Microelectronics divestiture and
workforce rebalancing payments; and
• A decrease in deferred income of $856 million ($226 million
adjusted for currency); and a decline of $837 million ($568
million adjusted for currency) in accounts payable reflecting
the wind down of the divested System x business payables
and decreases in counterparty collateral postings; partially
offset by
• An increase in short-term debt of $731 million ($872 million
adjusted for currency).
Cash Flow
The company’s cash flows from operating, investing and financ-
ing activities, as reflected in the Consolidated Statement of Cash
Flows on page 79 are summarized in the table below. These
amounts include the cash flows associated with the Global Financ-
ing business.
($ in millions)
For the year ended December 31: 2015 2014
Net cash provided by/(used in)
continuing operations
Operating activities $17,008 $ 16,868
Investing activities (8,159) (3,001)
Financing activities (9,166) (15,452)
Effect of exchange rate changes on
cash and cash equivalents (473) (655)
Net change in cash and cash equivalents $ (790) $ (2,240)
Net cash provided by operating activities increased by $139 million
in 2015 driven by the following key factors:
• A decline in cash income tax payments ($3,092 million); and
• An improvement in sales cycle working capital of $1,192 million;
partially offset by
• Performance-related declines within net income; and
• An increase in performance-related compensation payments
of $470 million.
Net cash used in investing activities increased $5,158 million
driven by:
• A decrease in cash provided by divestitures of $2,758
million; and
• An increase in cash used related to acquisitions of
$2,693 million.
Net cash used in financing activities decreased $6,286 million as
compared to the prior year driven by the following factors:
• A decrease of $9,070 million of cash used for gross share
repurchases; partially offset by
• A decrease in net cash sourced from debt transactions of
$1,764 million driven by a lower level of issuances in the current
year; and
• An increase in dividend payments of $632 million.
Noncurrent Assets and Liabilities
($ in millions)
At December 31: 2015 2014
Noncurrent assets $67,991 $69,894* **
Long-term debt $33,428 $34,991**
Noncurrent liabilities (excluding debt) $28,374 $30,686*
* Reclassified to reflect adoption of the FASB guidance on deferred taxes in
consolidated financial statements. Refer to note B, “Accounting Changes,” for
additional information.
** Reclassified to reflect adoption of the FASB guidance on debt issuance costs in
consolidated financial statements. Refer to note B, “Accounting Changes,” for
additional information.
The decrease in noncurrent assets of $1,903 million (an increase
of $1,735 million adjusted for currency) was driven by:
• A decrease of $1,853 million ($1,417 million adjusted for
currency) in deferred taxes driven by the utilization of the tax
benefit associated with the Microelectronics divestiture; and
• A decrease of $1,096 million ($186 million adjusted for cur-
rency) in long-term financing receivables; partially offset by
• An increase in goodwill of $1,466 million ($2,561 adjusted for
currency) resulting from acquisitions during the year.
Long-term debt decreased $1,563 million ($862 million adjusted
for currency) driven by:
• Reclassification of $5,549 million to short-term debt to reflect
upcoming maturities; partially offset by
• Debt issuances of $4,647 million.
Other noncurrent liabilities, excluding debt, decreased $2,312 million
($387 million adjusted for currency) primarily driven by:
• A decrease in retirement and nonpension postretirement
liabilities of $1,757 million driven by a currency impact of
$1,295 million; and
• A decline of $635 million ($207 million adjusted for currency)
in other liabilities associated with a reclass to short-term
payables of a portion of the consideration payment associ-
ated with the Microelectronics divestiture.

41Management Discussion
International Business Machines Corporation and Subsidiary Companies
Debt
The company’s funding requirements are continually monitored
and strategies are executed to manage the overall asset and liabil-
ity profile. Additionally, the company maintains sufficient flexibility
to access global funding sources as needed.
($ in millions)
At December 31: 2015 2014
Total company debt $39,890 $40,722*
Total Global Financing segment debt $27,205 $29,103
Debt to support external clients 23,934 25,531
Debt to support internal clients 3,271 3,572
Non-Global Financing debt 12,684 11,619*
* Reclassified to reflect adoption of the FASB guidance on debt issuance costs in
consolidated financial statements. Refer to note B, “Accounting Changes,” for
additional information.
Global Financing provides financing predominantly for the com-
pany’s external client assets, as well as for assets under contract
by other IBM units. These assets, primarily for Global Services,
generate long-term, stable revenue streams similar to the Global
Financing asset portfolio. Based on their attributes, these Global
Services assets are leveraged with the balance of the Global
Financing asset base. The debt analysis above is further detailed
in the Global Financing section on pages 72 and 73.
Given the significant leverage, the company presents a
debt-to-capitalization ratio which excludes Global Financing debt
and equity as management believes this is more representative
of the company’s core business operations. This ratio can vary
from period to period as the company manages its global cash
and debt positions. “Core” debt-to-capitalization ratio (excluding
Global Financing debt and equity) was 54.3 percent at Decem-
ber 31, 2015 compared to 59.2 percent at December 31, 2014.
Consolidated debt-to-capitalization ratio at December 31, 2015
was 73.4 percent versus 77.2 percent at December 31, 2014.
Equity
Total equity increased by $2,410 million from December 31, 2014
as a result of an increase in retained earnings of $8,332 million and
common stock of $596 million offset by an increase in treasury
stock of $4,803 million mainly due to gross common stock repur-
chases and an increase in other comprehensive losses of $1,731
million primarily due to foreign currency translation adjustments.
GAAP ReconciliationThe tables below provide a reconciliation of the company’s income
statement results as reported under GAAP to its operating earn-
ings presentation which is a non-GAAP measure. The company’s
calculation of operating (non-GAAP) earnings, as presented, may
differ from similarly titled measures reported by other companies.
Please refer to the “Operating (non-GAAP) Earnings” section on
pages 18 and 19 for the company’s rationale for presenting oper-
ating earnings information.
($ in millions except per share amount)
For the year ended December 31, 2015: GAAP
Acquisition-Related
Adjustments
Retirement-Related
AdjustmentsOperating
(non-GAAP)
Gross profi t $40,684 $ 373 $ 469 $41,526
Gross profi t margin 49.8% 0.5 pts. 0.6 pts. 50.8%
SG&A $20,430 $(324) $ (533) $19,573
RD&E 5,247 — (48) 5,200
Other (income) and expense (724) (5) — (729)
Total expense and other (income) 24,740 (330) (581) 23,830
Pre-tax income from continuing operations 15,945 703 1,050 17,697
Pre-tax margin from continuing operations 19.5% 0.9 pts. 1.3 pts. 21.6%
Provision for income taxes* $ 2,581 $ 141 $ 316 $ 3,037
Effective tax rate 16.2% 0.2 pts. 0.9 pts. 17.2%
Income from continuing operations $13,364 $ 562 $ 734 $14,659
Income margin from continuing operations 16.3% 0.7 pts. 0.9 pts. 17.9%
Diluted earnings per share from continuing operations $ 13.60 $0.57 $ 0.75 $ 14.92
* The tax impact on operating (non-GAAP) pre-tax income is calculated under the same accounting principles applied to the GAAP pre-tax income which employs an annual
effective tax rate method to the results.

42 Management Discussion
International Business Machines Corporation and Subsidiary Companies
($ in millions except per share amount)
For the year ended December 31, 2014: GAAP
Acquisition-Related
Adjustments
Retirement-Related
AdjustmentsOperating
(non-GAAP)
Gross profi t $46,407 $ 416 $ 173 $46,996
Gross profi t margin 50.0% 0.4 pts. 0.2 pts. 50.6%
SG&A $23,180 $(385) $(257 ) $22,537
RD&E 5,437 — 77 5,514
Other (income) and expense (1,938) (1) — (1,939)
Total expense and other (income) 26,421 (386) (180) 25,855
Pre-tax income from continuing operations 19,986 803 353 21,142
Pre-tax margin from continuing operations 21.5% 0.9 pts. 0.4 pts. 22.8%
Provision for income taxes* $ 4,234 $ 133 $ 73 $ 4,440
Effective tax rate 21.2% (0.2) pts. 0.0 pts. 21.0%
Income from continuing operations $15,751 $ 670 $ 280 $16,702
Income margin from continuing operations 17.0% 0.7 pts. 0.3 pts. 18.0%
Diluted earnings per share from continuing operations $ 15.59 $0.66 $0.28 $ 16.53
* The tax impact on operating (non-GAAP) pre-tax income is calculated under the same accounting principles applied to the GAAP pre-tax income which employs an annual
effective tax rate method to the results.
Consolidated Fourth-Quarter Results
($ and shares in millions except per share amounts)
For the fourth quarter: 2015 2014
Yr.-to-Yr. Percent/
MarginChange
Revenue $22,059 $24,113 (8.5)%*
Gross profi t margin 51.7% 53.3% (1.6) pts.
Total expense and other (income) $ 6,308 $ 5,767 9.4%
Total expense and other
(income)-to-revenue ratio 28.6% 23.9% 4.7 pts.
Income from continuing operations
before income taxes $ 5,098 $ 7,094 (28.1)%
Provision for income taxes from
continuing operations $ 638 $ 1,580 (59.6)%
Income from continuing operations $ 4,460 $ 5,515 (19.1)%
Income from continuing
operations margin 20.2% 22.9% (2.7) pts.
Income/(loss) from discontinued
operations, net of tax $ 3 $ (31) NM
Net income $ 4,463 $ 5,484 (18.6)%
Earnings per share from continuing
operations:
Assuming dilution $ 4.59 $ 5.54 (17.1)%
Consolidated earnings per share—
assuming dilution $ 4.59 $ 5.51 (16.7)%
Weighted-average shares
outstanding
Assuming dilution 972.8 995.4 (2.3)%
* (2.3) percent adjusted for currency.
NM—Not meaningful
The following table provides the company’s operating (non-GAAP)
earnings for the fourth quarter of 2015 and 2014.
($ in millions except per share amounts)
For the fourth quarter: 2015 2014
Yr.-to-Yr. PercentChange
Net income as reported $4,463 $5,484 (18.6)%
Income/(loss) from discontinued
operations, net of tax 3 (31) NM
Income from continuing operations 4,460 5,515 (19.1)
Non-operating adjustments
(net of tax)
Acquisition-related charges 110 186 (41.0)
Non-operating retirement-related
costs/(income) 137 84 63.8
Operating (non-GAAP) earnings* $4,707 $5,785 (18.6)%
Diluted operating (non-GAAP)
earnings per share $ 4.84 $ 5.81 (16.7)%
* See page 48 for a more detailed reconciliation of net income to operating earnings.
NM—Not meaningful

43Management Discussion
International Business Machines Corporation and Subsidiary Companies
Snapshot
In the fourth quarter of 2015, the company reported $22.1 billion
in revenue and delivered $4.5 billion in income from continuing
operations with diluted earnings per share from continuing oper-
ations of $4.59 as reported and $4.84 on an operating (non-GAAP)
basis. The results of continuing operations exclude net income
from discontinued operations of $3 million related to the divesti-
ture of the company’s Microelectronics business. The company
generated $5.3 billion in cash from operations and $6.1 billion in
free cash flow in the fourth quarter and continued a high level of
investment, including $2.5 billion in acquisitions and driving share-
holder returns of $2.0 billion in gross common stock repurchases
and dividends.
Performance in the fourth quarter continued to reflect the
transitions in the business as the company addressed both the
significant shifts in the industry as well as some of the cyclical
challenges of the global business environment.
In the fourth quarter, total consolidated revenue decreased
8.5 percent as reported and 2 percent adjusted for currency, with
a year-to-year impact of $1.5 billion due to currency. Revenue in the
strategic imperatives grew 10 percent as reported and 16 percent
adjusted for currency.
Within the company’s segments, total Global Services reve-
nue declined 8.1 percent as reported and 1 percent adjusted for
currency. Global Technology Services revenue decreased 7.1 per-
cent as reported but grew 1 percent adjusted for currency as the
company continues to help clients transition to a hybrid cloud
services platform bringing more mobility and security to infra-
structure services. Global Business Services revenue decreased
9.9 percent (4 percent adjusted for currency). GBS has continued
to add resources and transition to the strategic areas while shift-
ing away from some of the more traditional areas of the business.
Software revenue decreased 10.7 percent (6 percent adjusted for
currency). Software annuity content grew but transactional per-
formance continued to be impacted by the flexibility the company
has provided in Enterprise License Agreements with clients. Sys-
tems Hardware revenue decreased 1.4 percent but grew 3 percent
adjusted for currency driven by z Systems and Power Systems.
From a geographic perspective, revenue in the major markets
declined 6.9 percent and 2 percent adjusted for currency. While
the U.S. was down, revenue in Europe and Japan grew on an
adjusted basis. Growth markets revenue decreased 13.6 percent
and 4 percent adjusted for currency with growth in Latin America
and the Middle East and Africa region more than offset by declines
in Asia Pacific.
The consolidated gross profit margin decreased 1.6 points
versus the fourth quarter of 2014 to 51.7 percent. The operating
(non-GAAP) gross margin of 52.7 percent decreased 1.2 points
with year-to-year declines across all business segments.
Total expense and other (income) increased 9.4 percent in the
fourth quarter of 2015 compared to the prior year. Total operating
(non-GAAP) expense and other (income) increased 9.2 percent
year to year. The key drivers of the year-to-year change in total
expense and other (income) were approximately:
Total Operating Consolidated (non-GAAP)
• Currency* (8) points (8) points
• Divestiture gains 23 points 24 points
• Workforce rebalancing (10) points (10) points
* Reflects impacts of translation and hedging programs.
The year-to-year increase in expense was driven by prior year
items. A gain of $1.4 billion associated with the System x dives-
titure was recorded in the fourth quarter of 2014 and a charge
of $86 million for the impairment of equity securities received as
consideration was recorded in the fourth quarter of 2015. These
items were partially offset by lower workforce rebalancing charges
of $0.6 billion and the impact of currency in the fourth quarter of
2015 compared to the prior-year period.
Pre-tax income from continuing operations of $5,098 million
decreased 28.1 percent year to year and the pre-tax margin was
23.1 percent, a decrease of 6.3 points versus the fourth quarter
of 2014. The prior period gain from the System x divestiture rep-
resented effectively all of the year-to-year decline in the pre-tax
margin, but the margin performance also reflected higher levels
of investment, mix of contracts and resource shifts in the ser-
vices business. The continuing operations effective tax rate for

44 Management Discussion
International Business Machines Corporation and Subsidiary Companies
($ in millions)
For the fourth quarter: 2015 2014*
Yr.-to-Yr. Percent/
Margin Change
Yr.-to-Yr. Percent Change
Adjusted for Currency
Revenue
Global Technology Services $ 8,126 $ 8,746 (7.1)% 0.9%
Gross margin 37.7% 39.1% (1.5) pts.
Global Business Services 4,297 4,771 (9.9)% (4.2)%
Gross margin 28.2% 31.5% (3.3) pts.
Software 6,767 7,578 (10.7)% (5.8)%
Gross margin 88.0% 90.0% (2.0) pts.
Systems Hardware 2,372 2,406 (1.4)% 2.7%
Gross margin 48.0% 49.6% (1.6) pts.
Global Financing 454 532 (14.6)% (5.8)%
Gross margin 39.9% 48.7% (8.8) pts.
Other 43 82 (47.1)% (42.2)%
Gross margin (312.7)% (401.7)% (89.0) pts.
Total consolidated revenue $22,059 $24,113 (8.5)% (2.3)%
Total consolidated gross profi t $11,407 $12,862 (11.3)%
Total consolidated gross margin 51.7% 53.3% (1.6) pts.
Non-operating adjustments
Amortization of acquired intangible assets 105 101 3.2%
Retirement-related costs/(income) 119 33 262.8%
Operating (non-GAAP) gross profi t $11,630 $12,996 (10.5)%
Operating (non-GAAP) gross margin 52.7% 53.9% (1.2 ) pts.
* Reclassified to conform with 2015 presentation.
the fourth quarter was 12.5 percent, down 9.7 points year to year.
While the underlying effective tax rate was approximately 20 per-
cent, the fourth quarter 2015 rate reflected the benefit from the
recent U.S. tax legislation and settlement of the company’s U.S.
tax audit. Income from continuing operations of $4,460 million
decreased 19.1 percent year to year. Net income of $4,463 million
decreased $1,021 million year to year. Operating (non-GAAP) pre-
tax income from continuing operations of $5,516 million decreased
25.4 percent with a year-to-year impact from currency of approx-
imately $300 million. The operating (non-GAAP) pre-tax margin
was 25.0 percent, a decrease of 5.7 points year to year. Operat-
ing (non-GAAP) income from continuing operations decreased
18.6 percent and the operating (non-GAAP) income margin of
21.3 percent decreased 2.7 points compared to the prior year. The
operating (non-GAAP) effective tax rate from continuing operations
was 14.7 percent versus 21.8 percent in the fourth quarter of 2014
reflecting the same current year factors described above.
Diluted earnings per share from continuing operations of
$4.59 decreased 17.1 percent year to year. Operating (non-GAAP)
diluted earnings per share of $4.84 decreased $0.97 or 16.7 per-
cent versus the fourth quarter of 2014. There was no impact to
diluted earnings per share from discontinued operations in the
fourth quarter of 2015. In the fourth quarter of 2015, the company
repurchased 6.0 million shares of its common stock.
Results of Continuing Operations
Segment Details
The following is an analysis of the fourth quarter of 2015 versus
the fourth quarter of 2014 reportable segment external revenue
and gross margin results. Segment pre-tax income includes
transactions between the segments that are intended to reflect
an arms-length transfer price and excludes certain unallocated
corporate items.

45Management Discussion
International Business Machines Corporation and Subsidiary Companies
Global Services
In the fourth quarter of 2015, the Global Services segments,
GTS and GBS, delivered combined revenue of $12,422 million, a
decrease of 8.1 percent as reported and 1 percent adjusted for cur-
rency. Combined pre-tax income in the fourth quarter decreased
0.1 percent year to year and the pre-tax margin increased 1.3 points
to 17.2 percent.
Global Technology Services revenue of $8,126 million de-
creased 7.1 percent as reported, but grew 1 percent adjusted
for currency. This was the third consecutive quarter of revenue
growth, adjusted for currency and divestitures. Outsourcing rev-
enue of $4,262 million decreased 9.1 percent as reported and
1 percent adjusted for currency. ITS revenue of $2,360 million
decreased 2.6 percent as reported but grew 5 percent adjusted
for currency. Maintenance revenue of $1,505 million decreased
8.0 percent as reported but was flat adjusted for currency.
Within GTS, strategic imperatives including hybrid cloud ser-
vices grew strong double digits in the fourth quarter adjusted for
currency. This included strong demand for SoftLayer which again
grew double digits on an adjusted basis. The company continues
to expand its cloud capabilities through acquisitions including
Gravitant, Inc. and Clearleap, Inc. announced in the fourth quarter
of 2015.
The GTS gross profit margin decreased 1.5 points to 37.7 per-
cent in the fourth quarter of 2015 compared to prior year. This
decline was driven by investments in cloud data centers and the
acceleration of new contracts, which generally have lower up-front
margins. In the fourth quarter, pre-tax income increased 4.5 per-
cent to $1,486 million and pre-tax margin was up 1.9 points to
17.8 percent. The margin increase was driven by lower workforce
rebalancing charges and savings from actions taken throughout
the year to drive efficiency in the delivery model. These savings
were offset by higher investment as the company continues to
invest to contemporize clients IT systems, transforming them
into digital enterprises. The company is scaling its cloud foot-
print with 46 cloud centers opened around the world. Currency
also continued to impact margin in the fourth quarter and was
the largest impact on year-to-year profit growth given the strong
dollar environment.
Global Business Services revenue of $4,297 million decreased
9.9 percent as reported and 4 percent adjusted for currency in the
fourth quarter of 2015 compared to the prior year. GBS outsourc-
ing revenue of $1,223 million decreased 9.7 percent as reported
and 4 percent adjusted for currency. C&SI revenue of $3,074 mil-
lion declined 10.0 percent as reported and 4 percent adjusted for
currency.
Revenue continued to be impacted by the company’s shift
away from traditional enterprise application implementations as
clients move from these engagements to initiatives that focus on
digitizing their business with analytics, cloud and mobile tech-
nologies. Revenue from the strategic imperatives within the GBS
segment increased double digits adjusted for currency in the
fourth quarter compared to the prior year.
The GBS gross profit margin decreased 3.3 points to 28.2 per-
cent in the fourth quarter compared to the prior year. Pre-tax
income decreased 8.6 percent to $708 million and pre-tax margin
was up 0.2 points to 16.0 percent. Current year benefit from lower
workforce rebalancing charges was offset by the impact of price
pressure in declining areas of the business and continued invest-
ment in analytics, cloud and mobility practices. In addition, the
company is investing to scale a new cognitive consulting practice
that is focused on helping clients unlock the transformative value
of cognitive business.
Within Global Services, the company has continued momen-
tum in services offerings that modernize clients’ IT systems and
move their operations into the cloud-based mobile world.
Software
In the fourth quarter of 2015, Software revenue of $6,767 million
decreased 10.7 percent as reported and 6 percent adjusted for
currency compared to the prior year period. Annuity content grew
year to year, but transactional content declined. Key branded mid-
dleware revenue of $4,858 million, which accounted for 72 percent
of total software revenue in the fourth quarter, decreased 10.4 per-
cent as reported and 6 percent adjusted for currency with declines
across all brands. Within key branded middleware, WebSphere
decreased 9.2 percent (5 percent adjusted for currency), Infor-
mation Management decreased 10.2 percent (5 percent adjusted
for currency), Tivoli decreased 5.8 percent (1 percent adjusted for
currency), Workforce Solutions decreased 9.9 percent (4 percent

46 Management Discussion
International Business Machines Corporation and Subsidiary Companies
adjusted for currency) and Rational decreased 31.6 percent
(28 percent adjusted for currency). Other middleware decreased
14.0 percent as reported and 9 percent adjusted for currency.
Operating systems decreased 12.2 percent as reported and
7 percent adjusted for currency.
While the transactional performance in the quarter was
consistent with the third quarter of the year; the fourth quarter
has a higher transactional mix. This had a larger impact on total
software performance resulting in a deceleration in the software
performance in the fourth quarter. Many large clients with multi-
year contracts continue to utilize the flexibility on deployment of
their software as they build out their environments with the com-
pany’s broad portfolio. Outside the company’s top 250 clients,
software revenue increased low single digits adjusted for currency
in the quarter.
The Software gross profit margin decreased 2.0 points to
88.0 percent in the fourth quarter of 2015 compared to the prior
year. Software pre-tax income of $2,959 million in the fourth quar-
ter decreased 21.4 percent, with a pre-tax margin of 39.4 percent,
a decrease of 5.3 points. Profit performance in Software con-
tinues to reflect the overall revenue trajectory, a higher level of
investments in areas like Watson, Watson Health, Watson IoT and
Bluemix, and an impact from currency translation.
Systems Hardware
In the fourth quarter of 2015, Systems Hardware revenue of $2,372
million decreased 1.4 percent as reported but grew 3 percent
adjusted for currency compared to the prior year period. This
was the fourth consecutive quarter of growth in both z Systems
and Power Systems, adjusted for currency. z Systems revenue
increased 15.6 percent as reported and 21 percent adjusted for
currency. MIPS shipments increased 28 percent year to year. Since
the launch of z13 in the first quarter of 2015, there has been strong
double-digit revenue growth on an adjusted basis in every quar-
ter of the year. Power Systems revenue increased 3.8 percent as
reported and 8 percent adjusted for currency in the fourth quar-
ter compared to the prior year. This was the strongest quarterly
performance during 2015. In Power, the company continues to
serve a high-value market while adding capabilities and finding
new economic models to grow over time. However, in the fourth
quarter the strong growth in servers was mitigated by a year-to-
year decline in Storage. Storage revenue decreased 11.2 percent
as reported and 7 percent adjusted for currency and continued to
be impacted by weakness in traditional disk and tape.
The Systems Hardware gross profit margin of 48.0 percent
decreased 1.6 points in the fourth quarter of 2015 compared to
the prior year. The decrease was due to margin (4.3 points) driven
by z Systems, partially offset by a more favorable product mix.
Systems Hardware pre-tax income of $349 million in the fourth
quarter decreased 10.1 percent year to year with a pre-tax margin
of 13.9 percent, down 1.5 points year to year.
Global Financing
Global Financing Revenue of $454 million was down 14.6 per-
cent as reported and 6 percent adjusted for currency due to
decreases in financing revenue and used equipment sales reve-
nue. The Global Financing fourth quarter pre-tax income increased
28.3 percent to $674 million and the pre-tax margin increased
8.5 points to 55.4 percent. The increase in pre-tax income was
driven by an increase in gross profit ($97 million) and decreases in
financing receivable provisions ($41 million) and SG&A expenses
($11 million).
Geographic Revenue
Total geographic revenue of $21,988 million decreased 8.3 per-
cent as reported and 2 percent adjusted for currency in the fourth
quarter of 2015 compared to the prior year. Major market countries
decreased 6.9 percent as reported and 2 percent adjusted for
currency. Adjusted for currency, Europe returned to growth, led by
continued growth in Germany, France and the UK. In Asia Pacific,
Japan continued to grow year to year, adjusted for currency. U.S.
revenue was down in the fourth quarter compared to the prior
year. Overall, growth market countries decreased 13.6 percent as
reported and 4 percent adjusted for currency, relatively consistent
with the previous two quarters. From a regional perspective, on an
adjusted basis, growth in Latin America and the Middle East and
Africa region was more than offset by declines in the Asia Pacific
growth market countries.
Americas revenue of $10,251 million decreased 7.6 percent as
reported and 4 percent adjusted for currency compared to the
fourth quarter of 2014 with a decline in North America and growth
in Latin America on an adjusted basis. The U.S. decreased 5.5 per-
cent year to year. Although there was strong growth in the U.S. in
Systems Hardware, it was offset by weak services and transac-
tional software performance. Canada was down 14.6 percent as
reported and was flat adjusted for currency. In Latin America, on
an adjusted basis, there was growth across a number of the larger
countries including Brazil, Mexico, Argentina, and Colombia.
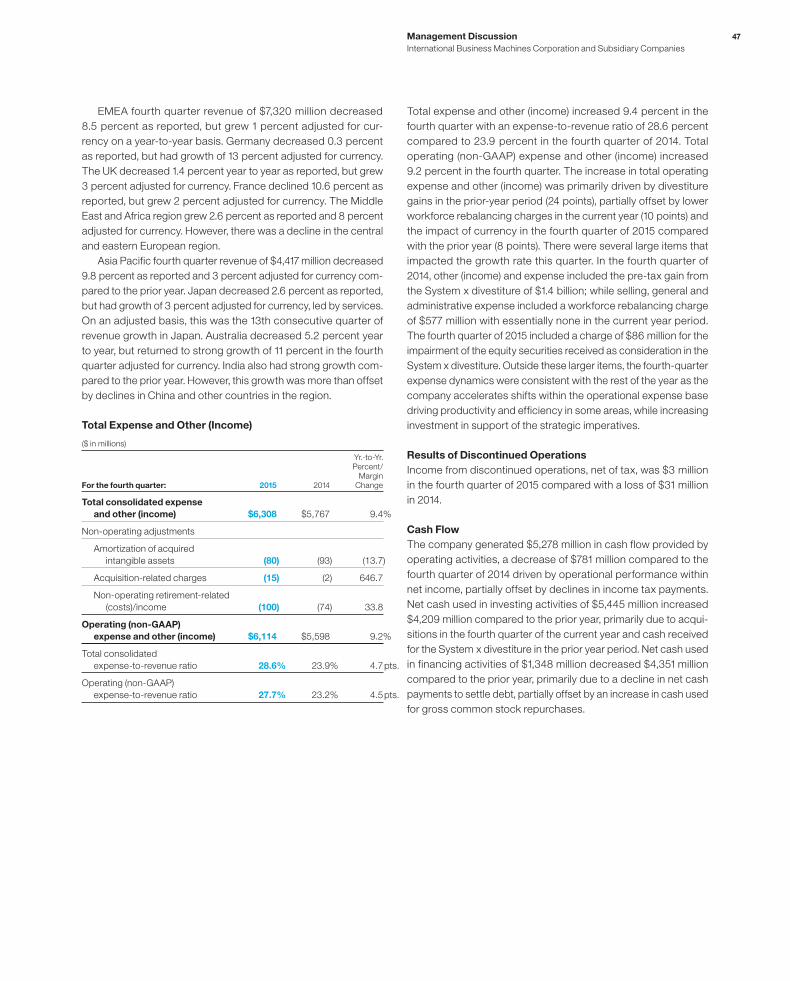
47Management Discussion
International Business Machines Corporation and Subsidiary Companies
EMEA fourth quarter revenue of $7,320 million decreased
8.5 percent as reported, but grew 1 percent adjusted for cur-
rency on a year-to-year basis. Germany decreased 0.3 percent
as reported, but had growth of 13 percent adjusted for currency.
The UK decreased 1.4 percent year to year as reported, but grew
3 percent adjusted for currency. France declined 10.6 percent as
reported, but grew 2 percent adjusted for currency. The Middle
East and Africa region grew 2.6 percent as reported and 8 percent
adjusted for currency. However, there was a decline in the central
and eastern European region.
Asia Pacific fourth quarter revenue of $4,417 million decreased
9.8 percent as reported and 3 percent adjusted for currency com-
pared to the prior year. Japan decreased 2.6 percent as reported,
but had growth of 3 percent adjusted for currency, led by services.
On an adjusted basis, this was the 13th consecutive quarter of
revenue growth in Japan. Australia decreased 5.2 percent year
to year, but returned to strong growth of 11 percent in the fourth
quarter adjusted for currency. India also had strong growth com-
pared to the prior year. However, this growth was more than offset
by declines in China and other countries in the region.
Total Expense and Other (Income)
($ in millions)
For the fourth quarter: 2015 2014
Yr.-to-Yr. Percent/
MarginChange
Total consolidated expense
and other (income) $6,308 $5,767 9.4%
Non-operating adjustments
Amortization of acquired
intangible assets (80) (93) (13.7)
Acquisition-related charges (15) (2) 646.7
Non-operating retirement-related
(costs)/income (100) (74) 33.8
Operating (non-GAAP)
expense and other (income) $6,114 $5,598 9.2%
Total consolidated
expense-to-revenue ratio 28.6% 23.9% 4.7 pts.
Operating (non-GAAP)
expense-to-revenue ratio 27.7% 23.2% 4.5 pts.
Total expense and other (income) increased 9.4 percent in the
fourth quarter with an expense-to-revenue ratio of 28.6 percent
compared to 23.9 percent in the fourth quarter of 2014. Total
operating (non-GAAP) expense and other (income) increased
9.2 percent in the fourth quarter. The increase in total operating
expense and other (income) was primarily driven by divestiture
gains in the prior-year period (24 points), partially offset by lower
workforce rebalancing charges in the current year (10 points) and
the impact of currency in the fourth quarter of 2015 compared
with the prior year (8 points). There were several large items that
impacted the growth rate this quarter. In the fourth quarter of
2014, other (income) and expense included the pre-tax gain from
the System x divestiture of $1.4 billion; while selling, general and
administrative expense included a workforce rebalancing charge
of $577 million with essentially none in the current year period.
The fourth quarter of 2015 included a charge of $86 million for the
impairment of the equity securities received as consideration in the
System x divestiture. Outside these larger items, the fourth-quarter
expense dynamics were consistent with the rest of the year as the
company accelerates shifts within the operational expense base
driving productivity and efficiency in some areas, while increasing
investment in support of the strategic imperatives.
Results of Discontinued Operations
Income from discontinued operations, net of tax, was $3 million
in the fourth quarter of 2015 compared with a loss of $31 million
in 2014.
Cash Flow
The company generated $5,278 million in cash flow provided by
operating activities, a decrease of $781 million compared to the
fourth quarter of 2014 driven by operational performance within
net income, partially offset by declines in income tax payments.
Net cash used in investing activities of $5,445 million increased
$4,209 million compared to the prior year, primarily due to acqui-
sitions in the fourth quarter of the current year and cash received
for the System x divestiture in the prior year period. Net cash used
in financing activities of $1,348 million decreased $4,351 million
compared to the prior year, primarily due to a decline in net cash
payments to settle debt, partially offset by an increase in cash used
for gross common stock repurchases.
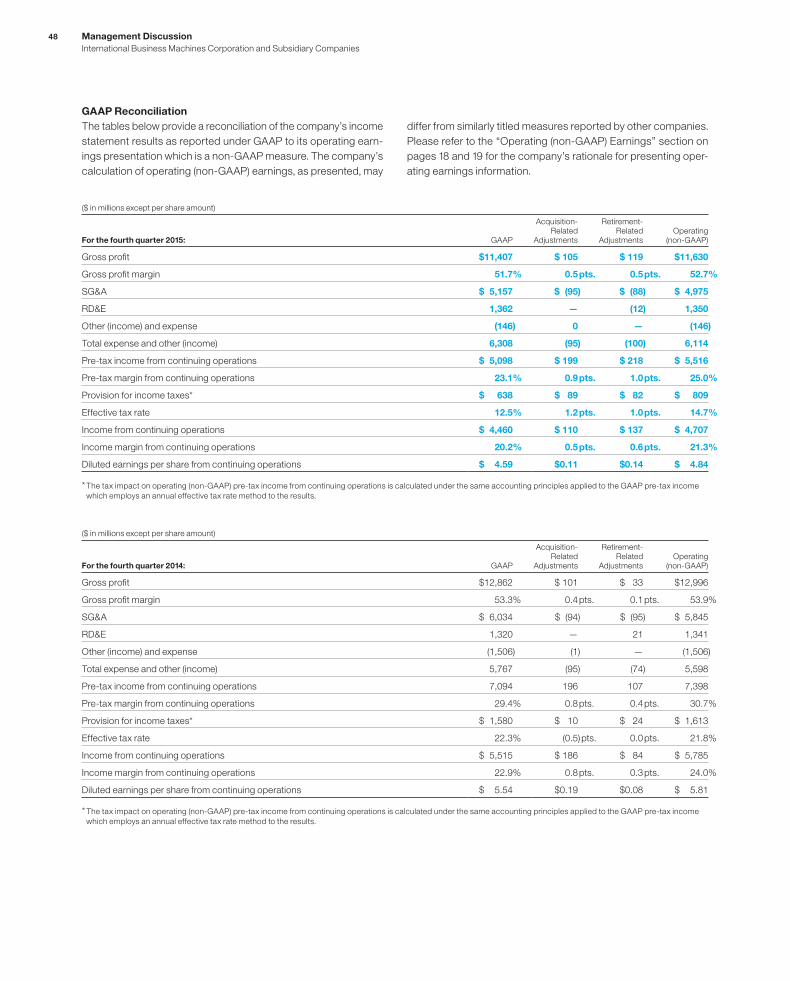
48 Management Discussion
International Business Machines Corporation and Subsidiary Companies
($ in millions except per share amount)
For the fourth quarter 2015: GAAP
Acquisition-Related
Adjustments
Retirement-Related
AdjustmentsOperating
(non-GAAP)
Gross profi t $11,407 $ 105 $ 119 $11,630
Gross profi t margin 51.7% 0.5 pts. 0.5 pts. 52.7%
SG&A $ 5,157 $ (95) $ (88) $ 4,975
RD&E 1,362 — (12) 1,350
Other (income) and expense (146) 0 — (146)
Total expense and other (income) 6,308 (95) (100) 6,114
Pre-tax income from continuing operations $ 5,098 $ 199 $ 218 $ 5,516
Pre-tax margin from continuing operations 23.1% 0.9 pts. 1.0 pts. 25.0%
Provision for income taxes* $ 638 $ 89 $ 82 $ 809
Effective tax rate 12.5% 1.2 pts. 1.0 pts. 14.7%
Income from continuing operations $ 4,460 $ 110 $ 137 $ 4,707
Income margin from continuing operations 20.2% 0.5 pts. 0.6 pts. 21.3%
Diluted earnings per share from continuing operations $ 4.59 $0.11 $0.14 $ 4.84
* The tax impact on operating (non-GAAP) pre-tax income from continuing operations is calculated under the same accounting principles applied to the GAAP pre-tax income
which employs an annual effective tax rate method to the results.
($ in millions except per share amount)
For the fourth quarter 2014: GAAP
Acquisition-Related
Adjustments
Retirement-Related
AdjustmentsOperating
(non-GAAP)
Gross profi t $12,862 $ 101 $ 33 $12,996
Gross profi t margin 53.3% 0.4 pts. 0.1 pts. 53.9%
SG&A $ 6,034 $ (94) $ (95) $ 5,845
RD&E 1,320 — 21 1,341
Other (income) and expense (1,506) (1) — (1,506)
Total expense and other (income) 5,767 (95) (74) 5,598
Pre-tax income from continuing operations 7,094 196 107 7,398
Pre-tax margin from continuing operations 29.4% 0.8 pts. 0.4 pts. 30.7%
Provision for income taxes* $ 1,580 $ 10 $ 24 $ 1,613
Effective tax rate 22.3% (0.5) pts. 0.0 pts. 21.8%
Income from continuing operations $ 5,515 $ 186 $ 84 $ 5,785
Income margin from continuing operations 22.9% 0.8 pts. 0.3 pts. 24.0%
Diluted earnings per share from continuing operations $ 5.54 $0.19 $0.08 $ 5.81
* The tax impact on operating (non-GAAP) pre-tax income from continuing operations is calculated under the same accounting principles applied to the GAAP pre-tax income
which employs an annual effective tax rate method to the results.
GAAP Reconciliation
The tables below provide a reconciliation of the company’s income
statement results as reported under GAAP to its operating earn-
ings presentation which is a non-GAAP measure. The company’s
calculation of operating (non-GAAP) earnings, as presented, may
differ from similarly titled measures reported by other companies.
Please refer to the “Operating (non-GAAP) Earnings” section on
pages 18 and 19 for the company’s rationale for presenting oper-
ating earnings information.

49Management Discussion
International Business Machines Corporation and Subsidiary Companies
PRIOR YEAR IN REVIEW
The “Prior Year in Review” section provides a summary of the
company’s financial performance in 2014 as compared to 2013.
For additional information, see the company’s 2014 Annual Report.
($ and shares in millions except per share amounts)
For the year ended December 31: 2014 2013
Yr.-to-Yr. Percent/
MarginChange
Revenue $ 92,793 $ 98,367 (5.7)%*
Gross profi t margin 50.0% 49.5% 0.5 pts.
Total expense and other (income) $ 26,421 $ 28,440 (7.1)%
Total expense and other
(income)-to-revenue ratio 28.5% 28.9% (0.4) pts.
Income before income taxes from
continuing operations $ 19,986 $ 20,244 (1.3)%
Provision for income taxes from
continuing operations 4,234 3,363 25.9%
Income from continuing
operations $ 15,751 $ 16,881 (6.7)%
Income from continuing
operations margin 17.0% 17.2% (0.2) pts.
Loss from discontinued
operations, net of tax $ (3,729) $ (398) NM
Net income $ 12,022 $ 16,483 (27.1)%
Earnings per share from
continuing operations:
Assuming dilution $ 15.59 $ 15.30 1.9%
Consolidated earnings per share—
assuming dilution $ 11.90 $ 14.94 (20.3)%
Weighted-average shares
outstanding:
Assuming dilution 1,010.0 1,103.0 (8.4)%
Assets** $117,271+ $125,641+ (6.7)%
Liabilities** $105,257+ $102,711+ 2.5%
Equity** $ 12,014 $ 22,929 (47.6)%
* (4.0) percent adjusted for currency; (1.5) percent adjusted for divestitures and
currency.
** At December 31.
+ Reclassified to reflect adoption of the FASB guidance on deferred taxes and debt
issuance costs in consolidated financial statements. Refer to note B, “Accounting
Changes,” for additional information.
NM—Not meaningful
The following table provides the company’s operating (non-GAAP)
earnings for 2014 and 2013.
($ in millions except per share amounts)
For the year ended December 31: 2014 2013
Yr.-to-Yr. PercentChange
Net income as reported $12,022 $16,483 (27.1)%
Loss from discontinued operations,
net of tax (3,729) (398) NM
Income from continuing operations $15,751 $16,881 (6.7)%
Non-operating adjustments
(net of tax)
Acquisition-related charges 670 747 (10.3)
Non-operating retirement-related
costs/(income) 280 729 (61.5)
Operating (non-GAAP) earnings* $16,702 $18,356 (9.0)%
Diluted operating (non-GAAP)
earnings per share $ 16.53 $ 16.64 (0.7)%
* See page 59 for a more detailed reconciliation of net income to operating (non-
GAAP) earnings.
NM—Not meaningful
SnapshotIn 2014, the company reported $92.8 billion in revenue, and deliv-
ered $20.0 billion in pre-tax income and diluted earnings per share
from continuing operations of $15.59 as reported and $16.53 on an
operating (non-GAAP) basis. The results of continuing operations
excluded net losses from discontinued operations of $3.7 billion
in 2014 and $0.4 billion in 2013 related to the divestiture of the
Microelectronics business. On a consolidated basis, net income
in 2014 was $12.0 billion, with diluted earnings per share of $11.90.
The company generated $16.9 billion in cash from operations and
$12.4 billion in free cash flow in 2014, driving shareholder returns of
$17.9 billion in gross common stock repurchases and dividends.
Total consolidated revenue decreased 5.7 percent as reported
and 1 percent adjusted for divestitures (3 points) and currency
(2 points) in 2014 versus 2013. In 2014, the company divested its
System x and customer care businesses. The company made
progress in 2014 in repositioning its portfolio and making invest-
ments to shift into the areas with the most value in enterprise
information technology.

50 Management Discussion
International Business Machines Corporation and Subsidiary Companies
The company has a set of strategic imperatives for growth that
are focused on the market shifts in data, cloud and engagement.
The model for these combined strategic imperatives is to deliver
double-digit revenue growth. In 2014, revenue from cloud, ana-
lytics, mobile, social and security solutions combined, increased
16 percent with double-digit growth in each quarter. In total, the
strategic imperatives generated $25 billion in revenue, which
represented approximately 27 percent of total revenue. Business
analytics revenue of $17 billion increased 7 percent year to year
with growth led by the consulting business, as the company helped
clients extract value from their data. Cloud revenue of $7 billion
was up 60 percent year to year as client demand grew for high-
er-value cloud solutions across public, private and hybrid clouds.
Cloud delivered as-a-Service revenue increased approximately
75 percent to $3 billion in 2014, and exited the year with an annual
run rate of $3.5 billion. Cloud revenue also includes the compa-
ny’s foundational offerings where it provides software, hardware
and services to clients to build private clouds. In engagement, the
mobile business more than tripled year to year with strong growth
in MobileFirst driven by the integrated portfolio of offerings. Secu-
rity revenue increased 19 percent year to year.
The company continued to shift its investments and resources
to the strategic imperatives and solutions that address clients’
most critical needs. During 2014, the company spent approxi-
mately 6 percent of revenue in research and development and
invested approximately $4 billion on capital investments—support-
ing actions in a number of areas that will yield financial benefits in
the future. For example:
• Launched Bluemix, the company’s cloud Platform-as-a-
Service for the enterprise.
• Invested to globally expand the SoftLayer cloud datacenters.
• Invested to bring Watson’s capabilities to the enterprise and
to build a partner ecosystem, effectively creating a market for
cognitive computing.
• Introduced cloud application innovations around Watson
Analytics and Verse.
• Launched POWER8, and building the OpenPOWER
consortium.
• Formed a partnership with Apple for enterprise mobility, with
Twitter for big data, and with SAP and Tencent for cloud.
The recurring core franchises include the annuity businesses, and
the highly recurring portions of the transactions business, such as
mainframe revenue from the largest clients. This content has annu-
ity characteristics, and in many cases, it supports mission-critical
processes for clients. The model for these combined businesses
is to have stable revenue, with improving margins. In 2014, reve-
nue was down approximately 3 percent with a modest decline in
margin. The decline was primarily driven by the mainframe product
cycle and currency.
The company’s high-value transactional businesses include
project-based work in services, transactional software, Power
Systems and Storage—in areas other than the strategic imper-
atives. The objective for these businesses is to optimize the
business model and maintain margins. In 2014, revenue declined
year to year, with gross margins over 40 percent. Performance
reflected the secular challenges faced in some parts of the hard-
ware business.
In 2014, the company divested businesses that no longer fit
its strategic profile—System x and the customer care business
process outsourcing services and it announced the divestiture of
the Microelectronics business. These three businesses generated
approximately $7 billion of revenue when reported in 2013, but
had a pre-tax loss of approximately $500 million. The divestitures
reduce revenue but improve the company’s profit profile, consis-
tent with the shift to higher value.
From a segment perspective, Global Services revenue declined
3.5 percent as reported, but increased 1 percent adjusted for the
divestitures (2 points) and currency (2 points). Global Technology
Services declined 0.8 percent as reported, but increased 2 per-
cent adjusted for currency (2 points) and divestitures with growth
in outsourcing and ITS on an adjusted basis. Global Business
Services revenue decreased 8.0 percent and 1 percent adjusted
for divestitures (5 points) and currency (2 points). Software reve-
nue declined 1.9 percent (1 percent adjusted for currency). Total
middleware revenue was flat as reported, but increased 1 percent
at constant currency. Systems Hardware revenue decreased
23.0 percent as reported and 17 percent adjusted for the divested
System x business (5 points) and currency (1 point). Performance
reflected the impact of the z Systems product cycle as well as
declines in Power Systems and Storage. In 2014, the company took
significant actions to reposition the Systems Hardware business
for higher value, and reinforced its commitment to driving innova-
tion in high-end systems and storage.
Revenue from the major markets declined 4.3 percent as
reported and 1 percent adjusted for the divestitures (2 points) and
currency (1 point). Growth markets revenue decreased 9.9 percent
as reported and 3 percent adjusted for the divestitures (3 points)
and currency (4 points) compared to 2013.
The consolidated gross profit margin of 50.0 percent improved
0.5 points year to year. The operating (non-GAAP) gross margin
of 50.6 percent increased 0.1 points compared to 2013 primarily
driven by an improved mix toward Software.

51Management Discussion
International Business Machines Corporation and Subsidiary Companies
Total expense and other (income) decreased 7.1 percent in
2014 versus 2013. Total operating (non-GAAP) expense and other
(income) decreased 6.3 percent year to year. The year-to-year
drivers were approximately: Total Operating Consolidated (non-GAAP)
• Currency* (1) point (1) point
• Acquisitions** 2 points 2 points
• Base expense (8) points (7) points
* Reflects impacts of translation and hedging programs.
** Includes acquisitions completed in prior 12-month period; operating (non-GAAP) is
net of non-operating acquisition-related charges.
The reported base expense reflected not only the ongoing run
rate of the business, but also the impact of divestitures and work-
force rebalancing charges. The company recorded pre-tax gains
of $1.6 billion in 2014 related to the divestitures of the System x
($1.4 billion) and customer care ($0.2 billion) businesses. Work-
force rebalancing charges in 2014 were $1.5 billion, an increase
of $0.4 billion year to year. Excluding the gains from the divested
businesses and the impact of workforce rebalancing charges,
operating (non-GAAP) base expense decreased 3 points year
to year versus the 7 point as-reported decrease. Within base
expense, the company continued to shift resources and spending
to areas within the strategic imperatives.
Pre-tax income from continuing operations decreased 1.3 per-
cent and the pre-tax margin was 21.5 percent, an increase of
1.0 points versus 2013. The continuing operations effective tax
rate for 2014 was 21.2 percent, an increase of 4.6 points versus
the prior year primarily driven by benefits in the 2013 rate asso-
ciated with discrete items. Income from continuing operations of
$15.8 billion decreased 6.7 percent and the net income margin
was 17.0 percent, a decrease of 0.2 points versus 2013. Losses
from discontinued operations, net of tax, were $3.7 billion in
2014 compared to $0.4 billion 2013. Net income of $12.0 billion
decreased $4.5 billion year to year. Operating (non-GAAP) pre-
tax income from continuing operations decreased 4.4 percent
year to year and the operating (non-GAAP) pre-tax margin from
continuing operations improved 0.3 points to 22.8 percent versus
2013. Operating (non-GAAP) income from continuing operations of
$16.7 billion decreased 9.0 percent and the operating (non-GAAP)
income margin from continuing operations of 18.0 percent
decreased 0.7 points. The operating (non-GAAP) effective tax
rate from continuing operations in 2014 was 21.0 percent versus
17.0 percent in 2013.
Diluted earnings per share from continuing operations of
$15.59 increased 1.9 percent year to year reflecting the benefits
of the common stock repurchase program. In 2014, the company
repurchased 71.5 million shares of its common stock. Operat-
ing (non-GAAP) diluted earnings per share of $16.53 decreased
0.7 percent versus 2013 driven primarily by the impacts of
decreased revenue and the higher tax rate, partially offset by the
impact of share repurchases. Diluted earnings per share from
discontinued operations was ($3.69) in 2014 compared to ($0.36)
in 2013.
At December 31, 2014, the company continued to have the
financial flexibility to support the business over the long term. Cash
and marketable securities at year end was $8.5 billion, a decrease
of $2.6 billion from December 31, 2013. Key drivers in the balance
sheet and total cash flows are highlighted below:
Total assets decreased $8.4 billion ($2.3 billion adjusted for
currency) from December 31, 2013 driven by:
• Decreases in prepaid pension assets ($3.4 billion), property,
plant and equipment ($3.1 billion) driven primarily by the
expected divestiture of the Microelectronics business ($2.4
billion), cash and cash equivalents ($2.2 billion) and total
receivables ($1.7 billion); partially offset by
• Increased deferred taxes ($2.5 billion).
Total liabilities increased $2.5 billion ($7.3 billion adjusted for cur-
rency) from December 31, 2013 driven by:
• Increases in pension liabilities ($2.0 billion) and total debt
($1.1 billion).
Total equity of $12.0 billion decreased $10.9 billion from Decem-
ber 31, 2013 as a result of:
• Increased treasury stock ($13.5 billion) primarily from share
repurchases, and increased losses in accumulated other
comprehensive income/(loss) ($6.3 billion), driven primarily
by the year-end remeasurement of the retirement-related
liabilities; partially offset by
• Higher retained earnings ($7.8 billion) and higher common
stock ($1.1 billion).
The company generated $16.9 billion in cash flow provided by
operating activities, a decrease of $0.6 billion when compared
to 2013, driven primarily by a higher level of cash tax payments
($1.7 billion). Net cash used in investing activities of $3.0 billion was
$4.3 billion lower than 2013, primarily due to a decrease in cash
used for acquisitions ($2.4 billion) and an increase in cash provided
from divestitures ($2.1 billion). Net cash used in financing activities
of $15.5 billion increased $5.6 billion compared to 2013, driven
primarily by lower net cash proceeds from total debt ($5.2 billion).
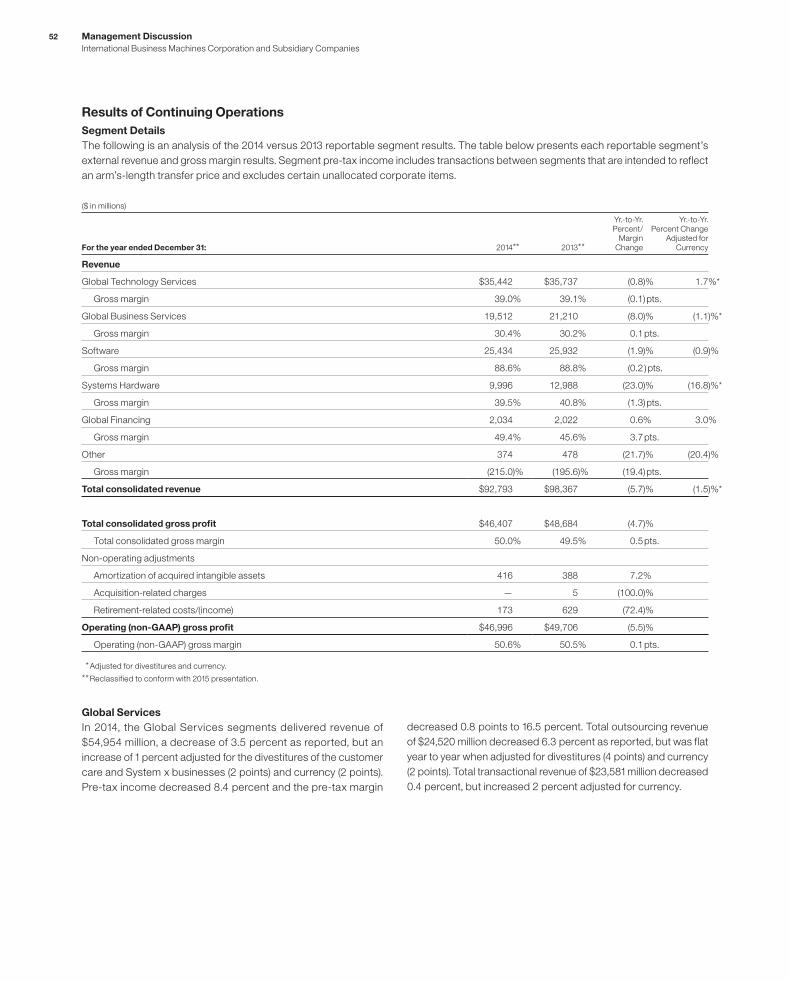
52 Management Discussion
International Business Machines Corporation and Subsidiary Companies
Results of Continuing Operations
Segment Details
The following is an analysis of the 2014 versus 2013 reportable segment results. The table below presents each reportable segment’s
external revenue and gross margin results. Segment pre-tax income includes transactions between segments that are intended to reflect
an arm’s-length transfer price and excludes certain unallocated corporate items.
($ in millions)
For the year ended December 31: 2014** 2013**
Yr.-to-Yr. Percent/
Margin Change
Yr.-to-Yr. Percent Change
Adjusted for Currency
Revenue
Global Technology Services $35,442 $35,737 (0.8)% 1.7%*
Gross margin 39.0% 39.1% (0.1) pts.
Global Business Services 19,512 21,210 (8.0)% (1.1)%*
Gross margin 30.4% 30.2% 0.1 pts.
Software 25,434 25,932 (1.9)% (0.9)%
Gross margin 88.6% 88.8% (0.2 ) pts.
Systems Hardware 9,996 12,988 (23.0)% (16.8)%*
Gross margin 39.5% 40.8% (1.3) pts.
Global Financing 2,034 2,022 0.6% 3.0%
Gross margin 49.4% 45.6% 3.7 pts.
Other 374 478 (21.7)% (20.4)%
Gross margin (215.0)% (195.6)% (19.4) pts.
Total consolidated revenue $92,793 $98,367 (5.7)% (1.5)%*
Total consolidated gross profi t $46,407 $48,684 (4.7)%
Total consolidated gross margin 50.0% 49.5% 0.5 pts.
Non-operating adjustments
Amortization of acquired intangible assets 416 388 7.2%
Acquisition-related charges — 5 (100.0)%
Retirement-related costs/(income) 173 629 (72.4)%
Operating (non-GAAP) gross profi t $46,996 $49,706 (5.5)%
Operating (non-GAAP) gross margin 50.6% 50.5% 0.1 pts.
* Adjusted for divestitures and currency.
** Reclassified to conform with 2015 presentation.
Global Services
In 2014, the Global Services segments delivered revenue of
$54,954 million, a decrease of 3.5 percent as reported, but an
increase of 1 percent adjusted for the divestitures of the customer
care and System x businesses (2 points) and currency (2 points).
Pre-tax income decreased 8.4 percent and the pre-tax margin
decreased 0.8 points to 16.5 percent. Total outsourcing revenue
of $24,520 million decreased 6.3 percent as reported, but was flat
year to year when adjusted for divestitures (4 points) and currency
(2 points). Total transactional revenue of $23,581 million decreased
0.4 percent, but increased 2 percent adjusted for currency.
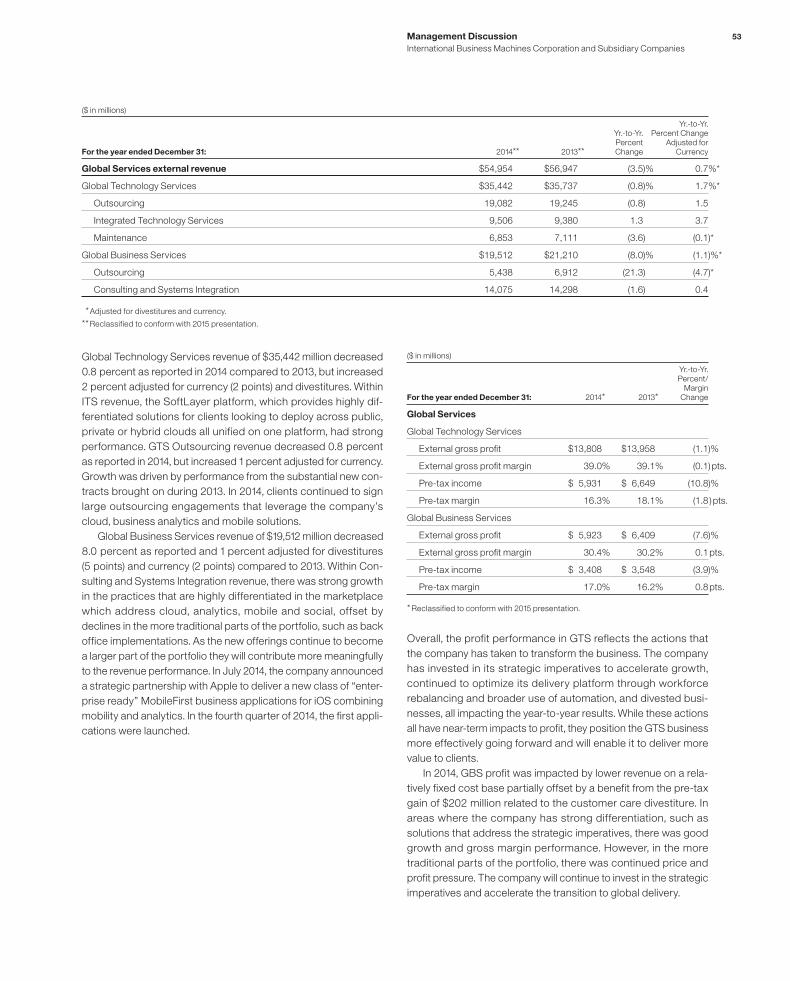
53Management Discussion
International Business Machines Corporation and Subsidiary Companies
($ in millions)
For the year ended December 31: 2014** 2013**
Yr.-to-Yr. Percent Change
Yr.-to-Yr. Percent Change
Adjusted for Currency
Global Services external revenue $54,954 $56,947 (3.5)% 0.7%*
Global Technology Services $35,442 $35,737 (0.8)% 1.7%*
Outsourcing 19,082 19,245 (0.8) 1.5
Integrated Technology Services 9,506 9,380 1.3 3.7
Maintenance 6,853 7,111 (3.6) (0.1)*
Global Business Services $19,512 $21,210 (8.0)% (1.1)%*
Outsourcing 5,438 6,912 (21.3) (4.7)*
Consulting and Systems Integration 14,075 14,298 (1.6) 0.4
* Adjusted for divestitures and currency.
** Reclassified to conform with 2015 presentation.
Global Technology Services revenue of $35,442 million decreased
0.8 percent as reported in 2014 compared to 2013, but increased
2 percent adjusted for currency (2 points) and divestitures. Within
ITS revenue, the SoftLayer platform, which provides highly dif-
ferentiated solutions for clients looking to deploy across public,
private or hybrid clouds all unified on one platform, had strong
performance. GTS Outsourcing revenue decreased 0.8 percent
as reported in 2014, but increased 1 percent adjusted for currency.
Growth was driven by performance from the substantial new con-
tracts brought on during 2013. In 2014, clients continued to sign
large outsourcing engagements that leverage the company’s
cloud, business analytics and mobile solutions.
Global Business Services revenue of $19,512 million decreased
8.0 percent as reported and 1 percent adjusted for divestitures
(5 points) and currency (2 points) compared to 2013. Within Con-
sulting and Systems Integration revenue, there was strong growth
in the practices that are highly differentiated in the marketplace
which address cloud, analytics, mobile and social, offset by
declines in the more traditional parts of the portfolio, such as back
office implementations. As the new offerings continue to become
a larger part of the portfolio they will contribute more meaningfully
to the revenue performance. In July 2014, the company announced
a strategic partnership with Apple to deliver a new class of “enter-
prise ready” MobileFirst business applications for iOS combining
mobility and analytics. In the fourth quarter of 2014, the first appli-
cations were launched.
($ in millions)
For the year ended December 31: 2014* 2013*
Yr.-to-Yr. Percent/
Margin Change
Global Services
Global Technology Services
External gross profi t $13,808 $13,958 (1.1)%
External gross profi t margin 39.0% 39.1% (0.1) pts.
Pre-tax income $ 5,931 $ 6,649 (10.8)%
Pre-tax margin 16.3% 18.1% (1.8 ) pts.
Global Business Services
External gross profi t $ 5,923 $ 6,409 (7.6)%
External gross profi t margin 30.4% 30.2% 0.1 pts.
Pre-tax income $ 3,408 $ 3,548 (3.9)%
Pre-tax margin 17.0% 16.2% 0.8 pts.
* Reclassified to conform with 2015 presentation.
Overall, the profit performance in GTS reflects the actions that
the company has taken to transform the business. The company
has invested in its strategic imperatives to accelerate growth,
continued to optimize its delivery platform through workforce
rebalancing and broader use of automation, and divested busi-
nesses, all impacting the year-to-year results. While these actions
all have near-term impacts to profit, they position the GTS business
more effectively going forward and will enable it to deliver more
value to clients.
In 2014, GBS profit was impacted by lower revenue on a rela-
tively fixed cost base partially offset by a benefit from the pre-tax
gain of $202 million related to the customer care divestiture. In
areas where the company has strong differentiation, such as
solutions that address the strategic imperatives, there was good
growth and gross margin performance. However, in the more
traditional parts of the portfolio, there was continued price and
profit pressure. The company will continue to invest in the strategic
imperatives and accelerate the transition to global delivery.
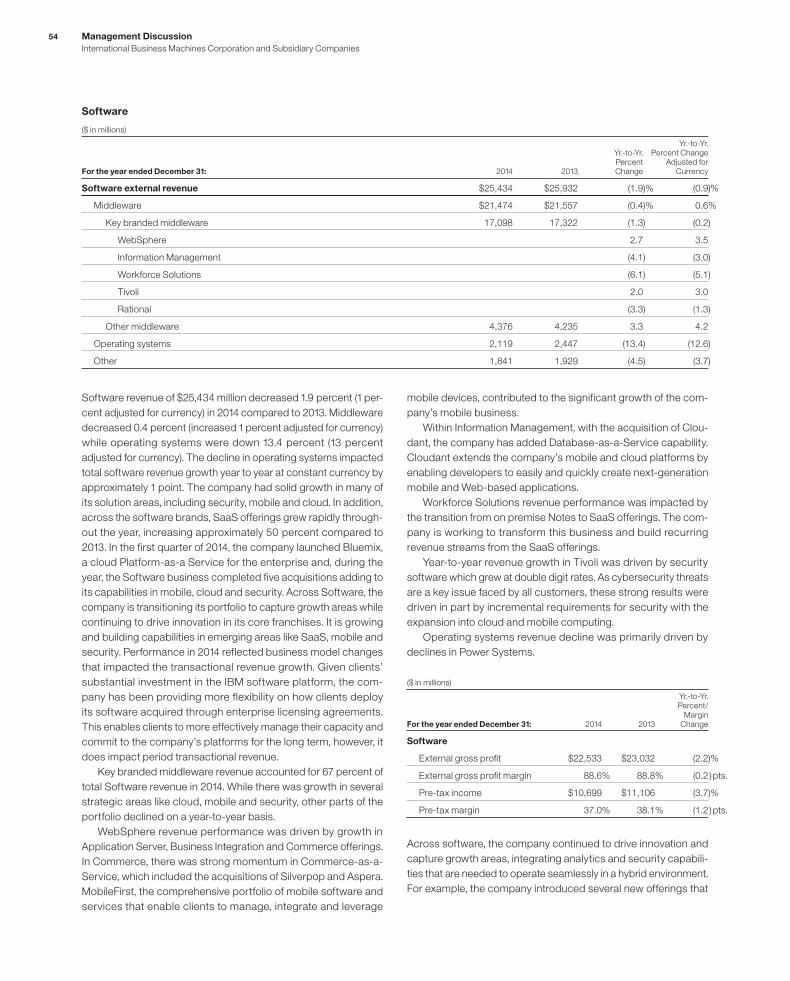
54 Management Discussion
International Business Machines Corporation and Subsidiary Companies
Software
($ in millions)
For the year ended December 31: 2014 2013
Yr.-to-Yr. Percent Change
Yr.-to-Yr. Percent Change
Adjusted for Currency
Software external revenue $25,434 $25,932 (1.9)% (0.9)%
Middleware $21,474 $21,557 (0.4)% 0.6%
Key branded middleware 17,098 17,322 (1.3) (0.2)
WebSphere 2.7 3.5
Information Management (4.1) (3.0)
Workforce Solutions (6.1) (5.1)
Tivoli 2.0 3.0
Rational (3.3) (1.3)
Other middleware 4,376 4,235 3.3 4.2
Operating systems 2,119 2,447 (13.4) (12.6)
Other 1,841 1,929 (4.5) (3.7)
Software revenue of $25,434 million decreased 1.9 percent (1 per-
cent adjusted for currency) in 2014 compared to 2013. Middleware
decreased 0.4 percent (increased 1 percent adjusted for currency)
while operating systems were down 13.4 percent (13 percent
adjusted for currency). The decline in operating systems impacted
total software revenue growth year to year at constant currency by
approximately 1 point. The company had solid growth in many of
its solution areas, including security, mobile and cloud. In addition,
across the software brands, SaaS offerings grew rapidly through-
out the year, increasing approximately 50 percent compared to
2013. In the first quarter of 2014, the company launched Bluemix,
a cloud Platform-as-a Service for the enterprise and, during the
year, the Software business completed five acquisitions adding to
its capabilities in mobile, cloud and security. Across Software, the
company is transitioning its portfolio to capture growth areas while
continuing to drive innovation in its core franchises. It is growing
and building capabilities in emerging areas like SaaS, mobile and
security. Performance in 2014 reflected business model changes
that impacted the transactional revenue growth. Given clients’
substantial investment in the IBM software platform, the com-
pany has been providing more flexibility on how clients deploy
its software acquired through enterprise licensing agreements.
This enables clients to more effectively manage their capacity and
commit to the company’s platforms for the long term, however, it
does impact period transactional revenue.
Key branded middleware revenue accounted for 67 percent of
total Software revenue in 2014. While there was growth in several
strategic areas like cloud, mobile and security, other parts of the
portfolio declined on a year-to-year basis.
WebSphere revenue performance was driven by growth in
Application Server, Business Integration and Commerce offerings.
In Commerce, there was strong momentum in Commerce-as-a-
Service, which included the acquisitions of Silverpop and Aspera.
MobileFirst, the comprehensive portfolio of mobile software and
services that enable clients to manage, integrate and leverage
mobile devices, contributed to the significant growth of the com-
pany’s mobile business.
Within Information Management, with the acquisition of Clou-
dant, the company has added Database-as-a-Service capability.
Cloudant extends the company’s mobile and cloud platforms by
enabling developers to easily and quickly create next-generation
mobile and Web-based applications.
Workforce Solutions revenue performance was impacted by
the transition from on premise Notes to SaaS offerings. The com-
pany is working to transform this business and build recurring
revenue streams from the SaaS offerings.
Year-to-year revenue growth in Tivoli was driven by security
software which grew at double digit rates. As cybersecurity threats
are a key issue faced by all customers, these strong results were
driven in part by incremental requirements for security with the
expansion into cloud and mobile computing.
Operating systems revenue decline was primarily driven by
declines in Power Systems.
($ in millions)
For the year ended December 31: 2014 2013
Yr.-to-Yr. Percent/
Margin Change
Software
External gross profi t $22,533 $23,032 (2.2)%
External gross profi t margin 88.6% 88.8% (0.2 ) pts.
Pre-tax income $10,699 $11,106 (3.7)%
Pre-tax margin 37.0% 38.1% (1.2 ) pts.
Across software, the company continued to drive innovation and
capture growth areas, integrating analytics and security capabili-
ties that are needed to operate seamlessly in a hybrid environment.
For example, the company introduced several new offerings that

55Management Discussion
International Business Machines Corporation and Subsidiary Companies
Systems Hardware
($ in millions)
For the year ended December 31: 2014 2013
Yr.-to-Yr. Percent Change
Yr.-to-Yr. Percent Change
Adjusted for Currency
Systems Hardware external revenue $9,996 $12,988 (23.0)% (16.8)%*
z Systems (23.3)% (22.6)%
Power Systems (18.9) (18.2)
Storage (12.0) (11.0)
System x (35.1) (34.9)
* Adjusted for divestitures and currency.
Systems Hardware revenue of $9,996 million decreased 23.0
percent as reported in 2014, 17 percent adjusted for the divesti-
ture of the System x business (5 points) and currency (1 point). In
2013, the Systems Hardware business reported a profit decline
of $1,653 million compared to 2012. During 2014, the company
worked to reposition this business and to stabilize profit. It divested
the System x business and announced the divestiture of the
Microelectronics business. Performance in 2014 reflected year-
to-year declines related to the z Systems product cycle as well
as declines in Power Systems and Storage. Systems Hardware
grew profit in the fourth quarter, and was profitable for the year.
Profit performance year to year was impacted by the divestiture
and currency, in addition to the revenue impacts.
The fourth quarter of 2014 marked the 10th quarter of the
current z Systems product cycle. In January 2015, the company
announced the z13, the new generation mainframe. The z13
system culminates a $1 billion investment and five years of devel-
opment, leverages the innovation of more than 500 new patents
and represents a collaboration with more than 60 clients. The
result of this effort is a mainframe that has the world’s fastest pro-
cessor that can execute two-and-a-half billion transactions a day.
Although Power Systems revenue was down year to year, there
was sequential improvement in the year-to-year revenue growth
rate at constant currency in the last two quarters of 2014. The com-
pany has repositioned Power which is not only a systems business,
but also an open chip processor and an IP income opportunity
through the OpenPOWER foundation. In June 2014, scale-out
systems based on POWER8 were introduced and high-end POW-
ER8-based enterprise systems were announced in October 2014.
These systems are highly scalable and can handle the most data
intensive, mission critical applications in the industry. In addition,
the company saw continued expansion of the OpenPOWER con-
sortium, with over 80 members, 14 of which are in greater China.
Since the establishment of the consortium in 2013, several offer-
ings have been introduced by consortium members based on
the POWER architecture. In addition, the company has initiated
a strategic partnership with Suzhou PowerCore, which intends to
use POWER architecture to develop and market processors for
servers in China.
Storage revenue decreased year to year in 2014. However,
at constant currency, it delivered sequential improvement in the
year-to-year growth rate over the last three quarters of 2014. Full-
year performance included strong contribution from FlashSystem
and the Storwize portfolio. However, this was more than offset by
weakness in high-end disk and the continued wind down of the
legacy storage-related OEM business.
($ in millions)
For the year ended December 31: 2014 2013
Yr.-to-Yr. Percent/
Margin Change
Systems Hardware
External gross profi t $3,945 $5,299 (25.6)%
External gross profi t margin 39.5% 40.8% (1.3) pts.
Pre-tax income $ 34 $ 213 (84.1)%
Pre-tax margin 0.3% 1.6% (1.3) pts.
Systems Hardware gross profit margin of 39.5 percent decreased
1.3 points year to year. The decrease was driven by lower margins
in Power Systems (1.3 points) and Storage (0.9 points), partially
offset by an increase due to mix (0.7 points), driven by the divesti-
ture of the System x business.
In 2014, the company took significant actions to reposition its
Systems Hardware business for higher value, and reinforced its
commitment to driving innovation in high-end systems and storage.
It repositioned Power through the development of the POWER8
systems which are built for cloud and big data, and it made
available the POWER8 architecture through the OpenPOWER
consortium to build an open ecosystem and an IP opportunity.
further enable its analytics portfolio in a cloud environment and
announced IBM Verse, a cloud-based email and collaboration
offering that integrates Watson capabilities. This type of continued
innovation in offerings, together with expanding services on the
Bluemix Platform-as-a-Service, will better allow customers to
move to a hybrid environment.
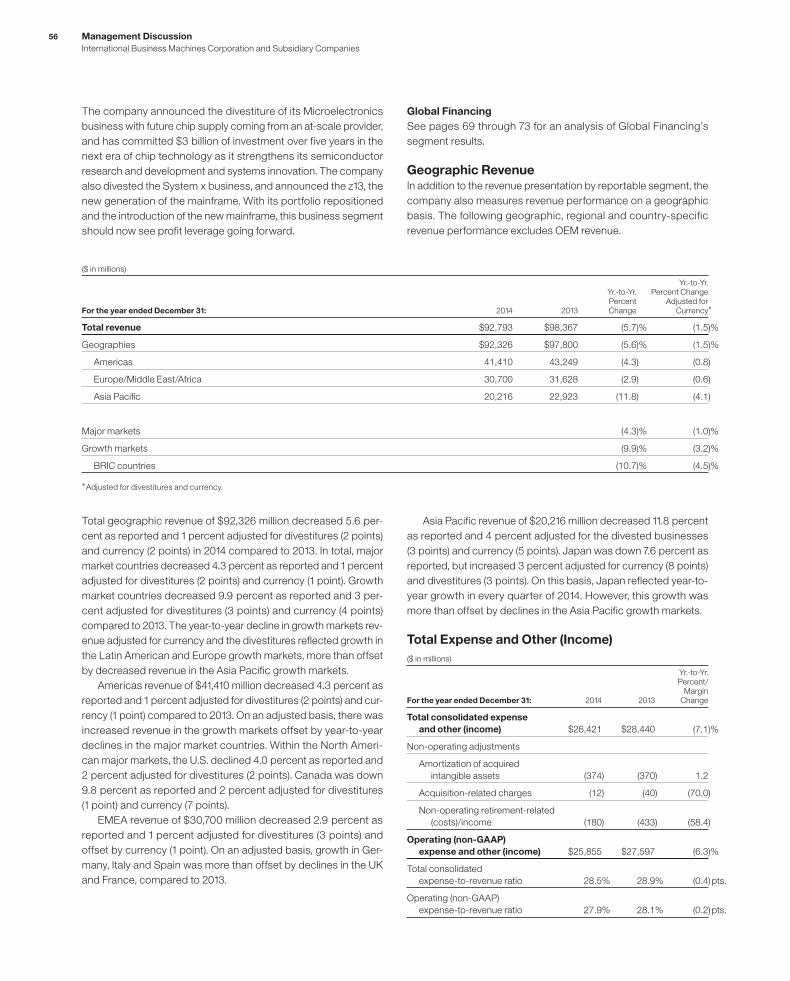
56 Management Discussion
International Business Machines Corporation and Subsidiary Companies
The company announced the divestiture of its Microelectronics
business with future chip supply coming from an at-scale provider,
and has committed $3 billion of investment over five years in the
next era of chip technology as it strengthens its semiconductor
research and development and systems innovation. The company
also divested the System x business, and announced the z13, the
new generation of the mainframe. With its portfolio repositioned
and the introduction of the new mainframe, this business segment
should now see profit leverage going forward.
Global Financing
See pages 69 through 73 for an analysis of Global Financing’s
segment results.
Geographic RevenueIn addition to the revenue presentation by reportable segment, the
company also measures revenue performance on a geographic
basis. The following geographic, regional and country-specific
revenue performance excludes OEM revenue.
($ in millions)
For the year ended December 31: 2014 2013
Yr.-to-Yr. Percent Change
Yr.-to-Yr. Percent Change
Adjusted for Currency*
Total revenue $92,793 $98,367 (5.7)% (1.5)%
Geographies $92,326 $97,800 (5.6)% (1.5)%
Americas 41,410 43,249 (4.3) (0.8)
Europe/Middle East/Africa 30,700 31,628 (2.9) (0.6)
Asia Pacifi c 20,216 22,923 (11.8) (4.1)
Major markets (4.3)% (1.0)%
Growth markets (9.9)% (3.2)%
BRIC countries (10.7)% (4.5)%
* Adjusted for divestitures and currency.
Total geographic revenue of $92,326 million decreased 5.6 per-
cent as reported and 1 percent adjusted for divestitures (2 points)
and currency (2 points) in 2014 compared to 2013. In total, major
market countries decreased 4.3 percent as reported and 1 percent
adjusted for divestitures (2 points) and currency (1 point). Growth
market countries decreased 9.9 percent as reported and 3 per-
cent adjusted for divestitures (3 points) and currency (4 points)
compared to 2013. The year-to-year decline in growth markets rev-
enue adjusted for currency and the divestitures reflected growth in
the Latin American and Europe growth markets, more than offset
by decreased revenue in the Asia Pacific growth markets.
Americas revenue of $41,410 million decreased 4.3 percent as
reported and 1 percent adjusted for divestitures (2 points) and cur-
rency (1 point) compared to 2013. On an adjusted basis, there was
increased revenue in the growth markets offset by year-to-year
declines in the major market countries. Within the North Ameri-
can major markets, the U.S. declined 4.0 percent as reported and
2 percent adjusted for divestitures (2 points). Canada was down
9.8 percent as reported and 2 percent adjusted for divestitures
(1 point) and currency (7 points).
EMEA revenue of $30,700 million decreased 2.9 percent as
reported and 1 percent adjusted for divestitures (3 points) and
offset by currency (1 point). On an adjusted basis, growth in Ger-
many, Italy and Spain was more than offset by declines in the UK
and France, compared to 2013.
Asia Pacific revenue of $20,216 million decreased 11.8 percent
as reported and 4 percent adjusted for the divested businesses
(3 points) and currency (5 points). Japan was down 7.6 percent as
reported, but increased 3 percent adjusted for currency (8 points)
and divestitures (3 points). On this basis, Japan reflected year-to-
year growth in every quarter of 2014. However, this growth was
more than offset by declines in the Asia Pacific growth markets.
Total Expense and Other (Income)
($ in millions)
For the year ended December 31: 2014 2013
Yr.-to-Yr. Percent/
Margin Change
Total consolidated expense
and other (income) $26,421 $28,440 (7.1)%
Non-operating adjustments
Amortization of acquired
intangible assets (374) (370) 1.2
Acquisition-related charges (12) (40) (70.0)
Non-operating retirement-related
(costs)/income (180) (433) (58.4)
Operating (non-GAAP)
expense and other (income) $25,855 $27,597 (6.3)%
Total consolidated
expense-to-revenue ratio 28.5% 28.9% (0.4) pts.
Operating (non-GAAP)
expense-to-revenue ratio 27.9% 28.1% (0.2) pts.

57Management Discussion
International Business Machines Corporation and Subsidiary Companies
Selling, General and Administrative
($ in millions)
For the year ended December 31: 2014 2013
Yr.-to-Yr. PercentChange
Selling, general and
administrative expense
Selling, general and
administrative—other $18,532 $19,178 (3.4)%
Advertising and promotional
expense 1,307 1,294 1.1
Workforce rebalancing charges 1,472 1,031 42.7
Retirement-related costs 811 986 (17.8)
Amortization of acquired
intangible assets 374 370 1.2
Stock-based compensation 350 435 (19.4)
Bad debt expense 334 156 113.8
Total consolidated selling, general
and administrative expense $23,180 $23,451 (1.2)%
Non-operating adjustments
Amortization of acquired
intangible assets (374) (370) 1.2
Acquisition-related charges (11) (25) (54.1)
Non-operating retirement-related
(costs)/income (257) (376) (31.7)
Operating (non-GAAP)
selling, general and
administrative expense $22,537 $22,680 (0.6)%
Total selling, general and administrative expense decreased
1.2 percent in 2014 versus 2013 primarily driven by the following
factors:
• The effects of currency (2 points); and
• Lower base expense (1 point); partially offset by
• Acquisition-related spending (2 points).
Operating (non-GAAP) SG&A expense decreased 0.6 percent
primarily driven by:
• The effects of currency (2 points); partially offset by
• Acquisition-related spending (1 point).
Workforce rebalancing charges in 2014 were $1,472 million, an
increase of $440 million year to year, which resulted in a 2 point
year-to-year impact in operating (non-GAAP) SG&A base
expense. Bad debt expense increased $178 million year to year
driven by higher specific provision additions, primarily in China and
Latin America. The receivables provision coverage was 2.2 per-
cent at December 31, 2014, an increase of 60 basis points from
year-end 2013.
Research, Development and Engineering
($ in millions)
For the year ended December 31: 2014 2013
Yr.-to-Yr. PercentChange
Total consolidated research,
development and engineering $5,437 $5,743 (5.3)%
Non-operating adjustment
Non-operating retirement-related
(costs)/income 77 (57) NM
Operating (non-GAAP) research,
development and engineering $5,514 $5,686 (3.0)%
NM—Not meaningful
Research, development and engineering expense was 5.9 percent
of revenue in 2014 and 5.8 percent of revenue in 2013.
RD&E expense decreased 5.3 percent in 2014 year to year
primarily driven by:
• Lower base expense (7 points); and
• The effects of currency (1 point); partially offset by
• Higher expense due to acquisitions (2 points).
Operating (non-GAAP) RD&E expense decreased 3.0 percent in
2014 compared to the prior year, primarily driven by:
• Lower base expense (4 points); and
• The effects of currency (1 point); partially offset by
• Higher expense due to acquisitions (2 points).
Intellectual Property and Custom Development Income
($ in millions)
For the year ended December 31: 2014 2013
Yr.-to-Yr. PercentChange
Sales and other transfers of
intellectual property $283 $352 (19.7)%
Licensing/royalty-based fees 129 150 (13.9)
Custom development income 330 320 3.1
Total $742 $822 (9.8)%
The timing and amount of Sales and other transfers of IP may vary
significantly from period to period depending upon the timing of
divestitures, economic conditions, industry consolidation and the
timing of new patents and know-how development. There were no
significant individual IP transactions in 2014 or 2013.

58 Management Discussion
International Business Machines Corporation and Subsidiary Companies
Other (Income) and Expense
($ in millions)
For the year ended December 31: 2014 2013
Yr.-to-Yr. Percent Change
Other (income) and expense
Foreign currency transaction
losses/(gains) $ (599) $(260) 130.4%
(Gains)/losses on
derivative instruments 654 166 293.3
Interest income (90) (74) 22.1
Net (gains)/losses from securities
and investment assets (26) (29) (11.5)
Other (1,878) (137) NM
Total consolidated other
(income) and expense $(1,938) $(333) 482.4%
Non-operating adjustment
Acquisition-related charges (1) (16) (94.7)
Operating (non-GAAP) other
(income) and expense $(1,939) $(349) 456.2%
NM—Not meaningful
The increase in income of $1,605 million year over year was pri-
marily driven by higher gains associated with divestitures ($1,710
million), driven by the System x ($1,400 million) and customer care
($202 million) transactions. Divestiture gains are reflected in Other
in the table above.
Interest Expense
($ in millions)
For the year ended December 31: 2014 2013
Yr.-to-Yr. PercentChange
Interest expense
Total $484 $402 20.4%
The increase in interest expense in 2014 versus 2013 was primar-
ily driven by higher average debt levels, partially offset by lower
average interest rates. Overall interest expense, including interest
presented in the cost of financing, and excluding capitalized interest,
for 2014 was $1,025 million, an increase of $36 million year to year.
Income Taxes
The continuing operations effective tax rate for 2014 was 21.2 per-
cent, an increase of 4.6 points versus 2013, driven by the following
factors:
• The year-to-year impact of factors that benefited the 2013
rate (14.5 points), including completion of the U.S. 2008–2010
tax audit and the associated reserve redeterminations
(11.1 points), the retroactive impact of the 2012 American
Taxpayer Relief Act (0.7 points), a tax agreement which
required a reassessment of certain valuation allowances on
deferred tax assets (1.4 points), the resolution of certain
non-U.S. tax audits (0.7 points) and newly enacted U.S. state
tax legislation (0.6 points); and
• A tax charge related to the sale of the System x business
(0.9 points); partially offset by;
• A year-to-year benefit of reduced tax charges related to
certain intercompany payments made by foreign subsidiaries
and the intercompany licensing of certain IP (3.7 points); and
• An increased benefit in the utilization of foreign tax credits
(4.7 points); and
• A benefit due to the geographic mix of pre-tax income in
2014 (2.5 points).
The continuing operations operating (non-GAAP) effective tax rate
was 21.0 percent, an increase of 4.0 points versus 2013 principally
driven by the same factors described above.
Results of Discontinued OperationsLosses from discontinued operations, net of tax, were $3.7 bil-
lion in 2014 and $0.4 billion in 2013. The loss in 2014 included a
non-recurring pre-tax charge of $4.7 billion, or $3.4 billion, net of
tax. The charge included an impairment to reflect the fair value
less estimated costs to sell the Microelectronics business, which
the company initially reported as held for sale at September 30,
2014. The charge also included other estimated costs related
to the transaction, including cash consideration expected to be
transferred of approximately $1.5 billion. The cash consideration is
expected to be paid over the next three years and will be adjusted
down by the amount of the working capital due from GLOBAL-
FOUNDRIES, estimated to be $0.2 billion. In addition, discontinued
operations included operational net losses from the Microelec-
tronics business of $0.3 billion in 2014 and $0.4 billion in 2013. The
discontinued operations effective tax rate in 2014 was 30.2 percent
compared to 44.8 percent in 2013. The year-to-year decrease in
the rate was driven primarily by a one-time tax charge of $428 mil-
lion in the third quarter of 2014 in connection with the disposal.
Financial PositionAt December 31, 2014, the company continued to have the financial
flexibility to support the business over the long term. Cash and
marketable securities at December 31, 2014 were $8,476 million,
a decrease of $2,589 million from December 31, 2013.
Total debt of $40,722 million increased $1,084 million from
the December 31, 2013 level. The commercial paper balance at
December 31, 2014, was $650 million, a decrease of $1,808 mil-
lion. Within total debt, $29,103 million was in support of the Global
Financing business which was leveraged at a 7.2 to 1 ratio. During
2014, the company completed bond issuances totaling $6,852
million, with terms ranging from 2 to 10 years, and interest rates
ranging from 0.30 to 3.63 percent depending on maturity.
Consistent with accounting standards, the company remea-
sured the funded status of its retirement and postretirement plans
at December 31. At December 31, 2014, the overall net under-
funded position was $16,932 million, an increase of $5,498 million
from December 31, 2013 driven by a decrease in discount rates
and changes in U.S. mortality rate assumptions, partially offset by
strong asset returns worldwide. At December 31, 2014, the compa-
ny’s qualified defined benefit plans were well funded and the cash

59Management Discussion
International Business Machines Corporation and Subsidiary Companies
requirements related to these plans remain stable going forward at
approximately $600 million per year through 2019. In 2014, the return
on the U.S. Personal Pension Plan assets was 10.1 percent and the
plan was 102 percent funded at December 31. Overall, global asset
returns were 12.2 percent and the qualified defined benefit plans
worldwide were 97 percent funded at December 31, 2014.
During 2014, the company generated $16,868 million in cash
from operations, a decrease of $616 million compared to 2013. In
addition, the company generated $12,372 million in free cash flow,
a decrease of $2,649 million versus 2013. The company returned
$17,944 million to shareholders in 2014, with $13,679 million in gross
share repurchases and $4,265 million in dividends. In 2014, the
company repurchased 71.5 million shares and had $6.3 billion
remaining in share repurchase authorization at year end.
GAAP ReconciliationThe tables below provide a reconciliation of the company’s income
statement results as reported under GAAP to its operating earn-
ings presentation which is a non-GAAP measure. The company’s
calculation of operating (non-GAAP) earnings, as presented, may
differ from similarly titled measures reported by other companies.
Please refer to the “Operating (non-GAAP) Earnings” section on
pages 18 and 19 for the company’s rationale for presenting oper-
ating earnings information.
($ in millions except per share amount)
For the year ended December 31, 2014: GAAP
Acquisition-Related
Adjustments
Retirement-Related
AdjustmentsOperating
(non-GAAP)
Gross profi t $46,407 $ 416 $ 173 $46,996
Gross profi t margin 50.0% 0.4 pts. 0.2 pts. 50.6%
SG&A $23,180 $(385) $(257) $22,537
RD&E 5,437 — 77 5,514
Other (income) and expense (1,938) (1) — (1,939)
Total expense and other (income) 26,421 (386) (180) 25,855
Pre-tax income from continuing operations 19,986 803 353 21,142
Pre-tax margin from continuing operations 21.5% 0.9 pts. 0.4 pts. 22.8%
Provision for income taxes* $ 4,234 $ 133 $ 73 $ 4,440
Effective tax rate 21.2% (0.2) pts. 0.0 pts. 21.0%
Income from continuing operations $15,751 $ 670 $ 280 $16,702
Income margin from continuing operations 17.0% 0.7 pts. 0.3 pts. 18.0%
Diluted earnings per share from continuing operations $ 15.59 $0.66 $0.28 $ 16.53
* The tax impact on operating (non-GAAP) pre-tax income is calculated under the same accounting principles applied to the GAAP pre-tax income which employs an annual
effective tax rate method to the results.
($ in millions except per share amount)
For the year ended December 31, 2013: GAAP
Acquisition-Related
Adjustments
Retirement-Related
AdjustmentsOperating
(non-GAAP)
Gross profi t $48,684 $ 394 $ 629 $49,706
Gross profi t margin 49.5% 0.4 pts. 0.6 pts. 50.5%
SG&A $23,451 $(394) $ (376) $22,680
RD&E 5,743 — (57) 5,686
Other (income) and expense (333) (16) — (349)
Total expense and other (income) 28,440 (410) (433) 27,597
Pre-tax income from continuing operations 20,244 804 1,062 22,110
Pre-tax margin from continuing operations 20.6% 0.8 pts. 1.1 pts. 22.5%
Provision for income taxes* $ 3,363 $ 57 $ 333 $ 3,753
Effective tax rate 16.6% (0.4) pts. 0.7 pts. 17.0%
Income from continuing operations $16,881 $ 747 $ 729 $18,356
Income margin from continuing operations 17.2% 0.8 pts. 0.7 pts. 18.7%
Diluted earnings per share from continuing operations $ 15.30 $0.68 $ 0.66 $ 16.64
* The tax impact on operating (non-GAAP) pre-tax income is calculated under the same accounting principles applied to the GAAP pre-tax income which employs an annual
effective tax rate method to the results.
60 Management Discussion
International Business Machines Corporation and Subsidiary Companies
OTHER INFORMATION
Looking ForwardThe company’s strategies, investments and actions are all taken
with an objective of optimizing long-term performance. A long-term
perspective ensures that the company is well-positioned to take
advantage of major shifts occurring in technology, business and
the global economy.
Within the IT industry, there are major shifts occurring—driven
by data and analytics, cloud and changes in the ways individuals
and enterprises are engaging. In 2015, the company had continued
strong performance in its strategic imperatives that are focused on
these market shifts. The company’s cloud, analytics, mobile, social
and security solutions together generated $29 billion in revenue,
which is approximately 35 percent of total consolidated revenue.
Revenue from the strategic imperatives increased 17 percent
compared to 2014, or 26 percent excluding the impacts of cur-
rency and the divested System x and customer care businesses.
In 2015, the company continued to take significant actions to drive
the shift towards its strategic imperatives with targeted invest-
ments, as well as moving away from areas that do not support the
strategic profile.
The company’s strategic direction is clear and compelling, and
the company continues its shift to the higher value areas of enter-
prise IT. The strong revenue growth in the strategic imperatives
confirms that, as does the overall profitability of the business. The
company expects revenue from its strategic imperatives to con-
tinue to deliver strong growth. These offerings are as high value
as other parts of the business, which continue to manage clients’
most critical business processes. As investments in the strategic
imperatives begin to reach scale, the company expects modest
margin improvement. In addition, the company expects to continue
to allocate its capital efficiently and effectively to investments, and
to return value to its shareholders through a combination of divi-
dends and share repurchases. Over the longer term, in considering
the opportunities it will continue to develop, the company expects
to have the ability to generate low single-digit revenue growth,
and with a higher value business mix, high single-digit operating
(non-GAAP) earnings per share growth, with free cash flow reali-
zation in the 90’s percent range.
In the near term, there are a few dynamics that are inconsistent
with that longer term trajectory. Specifically, in 2016, the company
will be continuing to manage and drive the ongoing transformation
in the business. As an example, GBS continues its transition, with
strong growth in strategic imperatives offset by declines in the
more traditional areas. The company will continue to engineer this
shift. The company expects a continued impact to its software
transaction revenue growth, as many of its largest customers con-
tinue to utilize the flexibility that the company has provided, as they
commit to the company’s platform for the longer term. In addition,
while the company is fully participating in the shift to cloud, the
margins in that business are impacted by the level of investment
the company is making, and the fact that the business is not yet
at scale.
The company also expects a continued significant impact
from currency in 2016. At mid-January 2016 spot rates, the impact
to revenue growth is expected to be 2 to 3 points for the year, but,
as with all companies with a similar global business profile, with the
dollar strengthening, the company also expects that currency will
have a significant impact on its profit growth. The profit impact will
be more significant than in 2015 because of translation impact and
the year-to-year impact from prior year cash flow hedging gains.
At mid-January 2016 spot rates, the company expects currency
to impact pre-tax profit growth by approximately $1.3 billion, or at
least a dollar of earnings per share.
Overall, looking forward to 2016, the company expects to con-
tinue to grow in many areas of the business, including continued
strong growth in the strategic imperatives. The company expects
a modest expansion in gross margin, and to continue to invest at
a high level, shifting to areas that have the best opportunity. As
is typical, the company also expects over the course of 2016 to
acquire key capabilities, rebalance its workforce, resolve various
matters including tax, and return value to shareholders. This is
all taken into account in the full-year view. Overall, the company
expects GAAP earnings per share from continuing operations for
2016 to be at least $12.45. Excluding acquisition-related charges
of $0.66 per share and non-operating retirement-related items
of $0.39 per share, operating (non-GAAP) earnings per share is
expected to be at least $13.50. For the first quarter of 2016, the
company expects operating (non-GAAP) earnings per share to be
approximately 15 percent of the full-year expectation.
From a segment perspective, in 2015, mainframe revenues
increased as a result of the release of the z13, and Power improved
as it was repositioned to address broader opportunities in the
Linux environment. The company is expecting mainframe reve-
nues to decline in 2016 as it enters the back half of the product
cycle. Mainframe margins are expected to improve in the latter half
of 2016 in line with that cycle. Services backlog improved in 2015
to $121 billion with increased signings in the year, specifically in the
strategic imperatives. Both GTS and GBS increased signings for
the full year at constant currency and the company expects to con-
tinue to move clients into hybrid environments. There is continued
ability to expand margins in the globalization of service delivery.
The software annuity base, representing approximately 70 per-
cent of software revenue, continued to grow. Software renewal
rates remain high and growth from Software-as-a-Service offer-
ings is expected. Transactional mix will not be as impactful in the
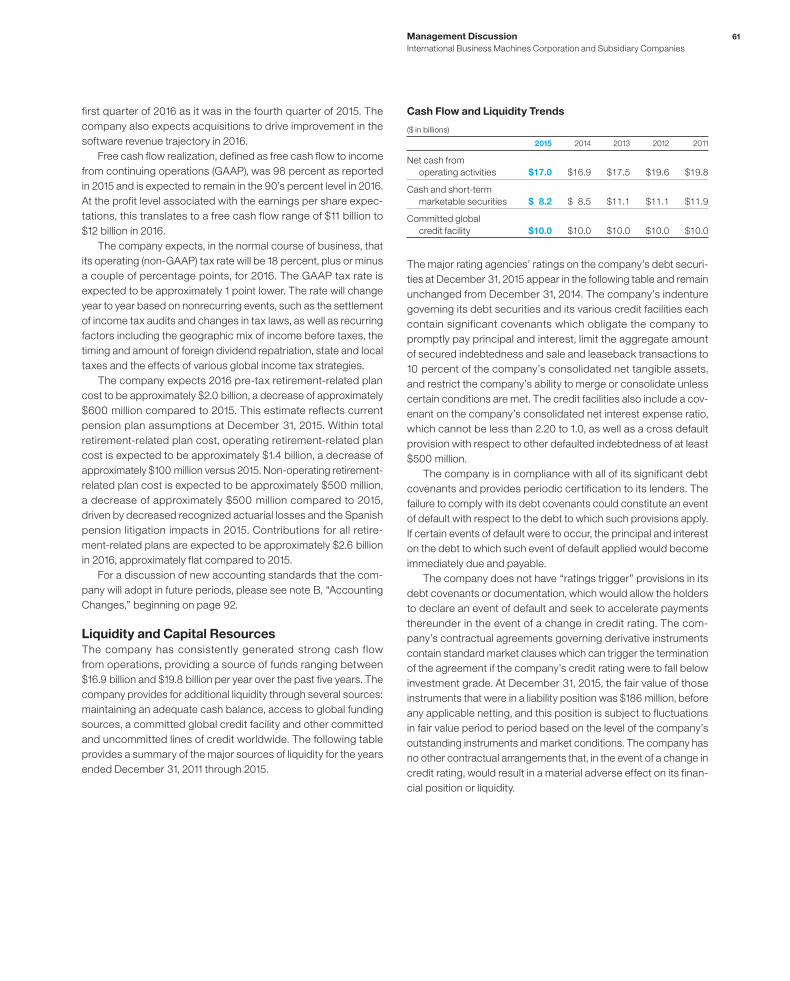
61Management Discussion
International Business Machines Corporation and Subsidiary Companies
first quarter of 2016 as it was in the fourth quarter of 2015. The
company also expects acquisitions to drive improvement in the
software revenue trajectory in 2016.
Free cash flow realization, defined as free cash flow to income
from continuing operations (GAAP), was 98 percent as reported
in 2015 and is expected to remain in the 90’s percent level in 2016.
At the profit level associated with the earnings per share expec-
tations, this translates to a free cash flow range of $11 billion to
$12 billion in 2016.
The company expects, in the normal course of business, that
its operating (non-GAAP) tax rate will be 18 percent, plus or minus
a couple of percentage points, for 2016. The GAAP tax rate is
expected to be approximately 1 point lower. The rate will change
year to year based on nonrecurring events, such as the settlement
of income tax audits and changes in tax laws, as well as recurring
factors including the geographic mix of income before taxes, the
timing and amount of foreign dividend repatriation, state and local
taxes and the effects of various global income tax strategies.
The company expects 2016 pre-tax retirement-related plan
cost to be approximately $2.0 billion, a decrease of approximately
$600 million compared to 2015. This estimate reflects current
pension plan assumptions at December 31, 2015. Within total
retirement-related plan cost, operating retirement-related plan
cost is expected to be approximately $1.4 billion, a decrease of
approximately $100 million versus 2015. Non-operating retirement-
related plan cost is expected to be approximately $500 million,
a decrease of approximately $500 million compared to 2015,
driven by decreased recognized actuarial losses and the Spanish
pension litigation impacts in 2015. Contributions for all retire-
ment-related plans are expected to be approximately $2.6 billion
in 2016, approximately flat compared to 2015.
For a discussion of new accounting standards that the com-
pany will adopt in future periods, please see note B, “Accounting
Changes,” beginning on page 92.
Liquidity and Capital ResourcesThe company has consistently generated strong cash flow
from operations, providing a source of funds ranging between
$16.9 billion and $19.8 billion per year over the past five years. The
company provides for additional liquidity through several sources:
maintaining an adequate cash balance, access to global funding
sources, a committed global credit facility and other committed
and uncommitted lines of credit worldwide. The following table
provides a summary of the major sources of liquidity for the years
ended December 31, 2011 through 2015.
Cash Flow and Liquidity Trends
($ in billions)
2015 2014 2013 2012 2011
Net cash from
operating activities $17.0 $16.9 $17.5 $19.6 $19.8
Cash and short-term
marketable securities $ 8.2 $ 8.5 $11.1 $11.1 $11.9
Committed global
credit facility $10.0 $10.0 $10.0 $10.0 $10.0
The major rating agencies’ ratings on the company’s debt securi-
ties at December 31, 2015 appear in the following table and remain
unchanged from December 31, 2014. The company’s indenture
governing its debt securities and its various credit facilities each
contain significant covenants which obligate the company to
promptly pay principal and interest, limit the aggregate amount
of secured indebtedness and sale and leaseback transactions to
10 percent of the company’s consolidated net tangible assets,
and restrict the company’s ability to merge or consolidate unless
certain conditions are met. The credit facilities also include a cov-
enant on the company’s consolidated net interest expense ratio,
which cannot be less than 2.20 to 1.0, as well as a cross default
provision with respect to other defaulted indebtedness of at least
$500 million.
The company is in compliance with all of its significant debt
covenants and provides periodic certification to its lenders. The
failure to comply with its debt covenants could constitute an event
of default with respect to the debt to which such provisions apply.
If certain events of default were to occur, the principal and interest
on the debt to which such event of default applied would become
immediately due and payable.
The company does not have “ratings trigger” provisions in its
debt covenants or documentation, which would allow the holders
to declare an event of default and seek to accelerate payments
thereunder in the event of a change in credit rating. The com-
pany’s contractual agreements governing derivative instruments
contain standard market clauses which can trigger the termination
of the agreement if the company’s credit rating were to fall below
investment grade. At December 31, 2015, the fair value of those
instruments that were in a liability position was $186 million, before
any applicable netting, and this position is subject to fluctuations
in fair value period to period based on the level of the company’s
outstanding instruments and market conditions. The company has
no other contractual arrangements that, in the event of a change in
credit rating, would result in a material adverse effect on its finan-
cial position or liquidity.

62 Management Discussion
International Business Machines Corporation and Subsidiary Companies
Standard & Poor’s
Moody’s Investors
ServiceFitch
Ratings
Senior long-term debt AA- Aa3 A+
Commercial paper A-1+ Prime-1 F1
The company prepares its Consolidated Statement of Cash Flows
in accordance with applicable accounting standards for cash flow
presentation on page 79 and highlights causes and events under-
lying sources and uses of cash in that format on page 40. For the
purpose of running its business, the company manages, monitors
and analyzes cash flows in a different format.
Management uses a free cash flow measure to evaluate the
company’s operating results, plan share repurchase levels, eval-
uate strategic investments and assess the company’s ability and
need to incur and service debt. Free cash flow is not a defined term
under GAAP and it should not be inferred that the entire free cash
flow amount is available for discretionary expenditures. The com-
pany defines free cash flow as net cash from operating activities
less the change in Global Financing receivables and net capital
expenditures, including the investment in software. A key objective
of the Global Financing business is to generate strong returns on
equity. Increasing receivables is the basis for growth in a financing
business. Accordingly, management considers Global Financing
receivables as a profit-generating investment, not as working
capital that should be minimized for efficiency. After considering
Global Financing receivables as an investment, the remaining net
operational cash flow less net capital expenditures is viewed by
the company as free cash flow.
From the perspective of how management views cash flow,
in 2015, after investing $3.8 billion in capital investments primarily
in support of the growth in the services backlog and the build
out of cloud data centers, the company generated free cash flow
of $13.1 billion, an increase of $0.7 billion compared to 2014. The
increase was driven by a reduction in cash tax payments of $3.1 bil-
lion, due primarily to a higher cash tax rate in 2014, and continued
improvement in sales cycle working capital ($1.2 billion). This was
partially offset by performance-related declines in net income and
a higher level of payments for performance-based compensation
which was accrued in 2014.
In 2015, the company continued to focus its cash utilization
on returning value to shareholders including $4.9 billion in div-
idends and $4.6 billion in gross common stock repurchases
(30.3 million shares). In addition, $3.3 billion was utilized for 14
acquisitions in 2015.
Over the past five years, the company generated over $75 bil-
lion in free cash flow. During that period, the company invested
approximately $13 billion in strategic acquisitions and returned
over $73 billion to shareholders through dividends and net share
repurchases. The company’s performance during this period
demonstrates that there is fungibility across the elements of
share repurchases, dividends and acquisitions. The amount of
prospective returns to shareholders in the form of dividends and
share repurchases will vary based upon several factors including
each year’s operating results, capital expenditure requirements,
research and development investments and acquisitions, as well
as the factors discussed below.
The company’s Board of Directors meets quarterly to consider
the dividend payment. In the second quarter of 2015, the Board
of Directors increased the company’s quarterly common stock
dividend from $1.10 to $1.30 per share.
The table below represents the way in which management
reviews cash flow as described above.
($ in billions)
For the year ended December 31: 2015 2014 2013 2012 2011
Net cash from operating activities per GAAP $17.0 $ 16.9 $ 17.5 $ 19.6 $ 19.8
Less: the change in Global Financing receivables 0.2 0.7 (1.3) (2.9) (0.8)
Net cash from operating activities, excluding
Global Financing receivables 16.9 16.2 18.8 22.5 20.7
Capital expenditures, net (3.8) (3.8) (3.8) (4.3) (4.1)
Free cash fl ow (FCF) 13.1 12.4 15.0 18.2 16.6
Acquisitions (3.3) (0.7) (3.1) (3.7) (1.8)
Divestitures (0.4) 2.4 0.3 0.6 0.0
Share repurchase (4.6) (13.7) (13.9) (12.0) (15.0)
Dividends (4.9) (4.3) (4.1) (3.8) (3.5)
Non-Global Financing debt (0.1) (1.3) 3.2 0.7 1.7
Other (includes Global Financing receivables and
Global Financing debt) 0.0 2.6 2.4 (0.8) 2.3
Change in cash, cash equivalents and short-term
marketable securities $ (0.3) $ (2.6) $ (0.1) $ (0.8) $ 0.3
FCF as percent of Income from Continuing Operations 98% 79% 89% 107% 103%

63Management Discussion
International Business Machines Corporation and Subsidiary Companies
Events that could temporarily change the historical cash flow
dynamics discussed previously include significant changes in
operating results, material changes in geographic sources of cash,
unexpected adverse impacts from litigation, future pension funding
requirements during periods of severe downturn in the capital mar-
kets or the timing of tax payments. Whether any litigation has such
an adverse impact will depend on a number of variables, which are
more completely described in note M, “Contingencies and Com-
mitments,” on pages 118 to 120. With respect to pension funding, in
2015, the company contributed $514 million to its non-U.S. defined
benefit plans versus $519 million in 2014. As highlighted in the Con-
tractual Obligations table, the company expects to make legally
mandated pension plan contributions to certain non-U.S. plans of
approximately $2.5 billion in the next five years. The 2016 contri-
butions are currently expected to be approximately $500 million.
Contributions related to all retirement-related plans is expected to
be approximately $2.6 billion in 2016, approximately flat compared
to 2015. Financial market performance could increase the legally
mandated minimum contributions in certain non-U.S. countries
that require more frequent remeasurement of the funded status.
The company is not quantifying any further impact from pension
funding because it is not possible to predict future movements in
the capital markets or pension plan funding regulations.
The Pension Protection Act of 2006 was enacted into law in
2006, and, among other things, increased the funding require-
ments for certain U.S. defined benefit plans beginning after
December 31, 2007. No mandatory contribution is required for
the U.S. defined benefit plan in 2016 as of December 31, 2015.
The company’s U.S. cash flows continue to be sufficient to fund
its current domestic operations and obligations, including invest-
ing and financing activities such as dividends and debt service.
The company’s U.S. operations generate substantial cash flows,
and, in those circumstances where the company has additional
cash requirements in the U.S., the company has several liquidity
options available. These options may include the ability to borrow
additional funds at reasonable interest rates, utilizing its commit-
ted global credit facility, repatriating certain foreign earnings and
utilizing intercompany loans with certain foreign subsidiaries.
The company does earn a significant amount of its pre-tax
income outside the U.S. The company’s policy is to indefinitely
reinvest the undistributed earnings of its foreign subsidiaries, and
accordingly, no provision for federal income taxes has been made
on accumulated earnings of foreign subsidiaries. The company
periodically repatriates a portion of these earnings to the extent
that it does not incur an additional U.S. tax liability. Quantification
of the deferred tax liability, if any, associated with indefinitely rein-
vested earnings is not practicable. While the company currently
does not have a need to repatriate funds held by its foreign sub-
sidiaries, if these funds are needed for operations and obligations
in the U.S., the company could elect to repatriate these funds
which could result in a reassessment of the company’s policy and
increased tax expense.
Contractual Obligations
($ in millions)
Total Contractual Payment Stream
Payments Due In
2016 2017–18 2019–20 After 2020
Long-term debt obligations $38,805 $ 5,266 $10,360 $ 8,504 $14,675
Interest on long-term debt obligations 9,688 1,184 1,892 1,252 5,360
Capital (fi nance) lease obligations 15 7 4 4 —
Operating lease obligations 6,435 1,347 2,338 1,761 988
Purchase obligations 3,057 764 1,093 1,154 45
Other long-term liabilities:
Minimum defi ned benefi t plan pension funding (mandated)* 2,500 500 1,000 1,000 —
Excess 401(k) Plus Plan 1,621 176 385 430 630
Long-term termination benefi ts 1,164 221 195 131 617
Tax reserves** 3,014 413
Divestiture related 1,158 692 377 66 23
Other 977 95 123 91 667
Total $68,434 $10,666 $17,767 $14,393 $23,006
* As funded status on plans will vary, obligations for mandated minimum pension payments after 2020 could not be reasonably estimated.
** These amounts represent the liability for unrecognized tax benefits. The company estimates that $413 million of the liability is expected to be settled within the next 12 months.
The settlement period for the noncurrent portion of the income tax liability cannot be reasonably estimated as the timing of the payments will depend on the progress of tax
examinations with the various tax authorities; however, it is not expected to be due within the next 12 months.
64 Management Discussion
International Business Machines Corporation and Subsidiary Companies
Total contractual obligations are reported in the previous table
excluding the effects of time value and, therefore, may not equal
the amounts reported in the Consolidated Statement of Financial
Position. Certain noncurrent liabilities are excluded from the previ-
ous table as their future cash outflows are uncertain. This includes
deferred taxes, derivatives, deferred income, disability benefits and
other sundry items. Certain obligations related to the company’s
divestitures are included.
Purchase obligations include all commitments to purchase
goods or services of either a fixed or minimum quantity that meet
any of the following criteria: (1) they are noncancelable, (2) the
company would incur a penalty if the agreement was canceled,
or (3) the company must make specified minimum payments even
if it does not take delivery of the contracted products or services
(take-or-pay). If the obligation to purchase goods or services is
noncancelable, the entire value of the contract is included in the
previous table. If the obligation is cancelable, but the company
would incur a penalty if canceled, the dollar amount of the pen-
alty is included as a purchase obligation. Contracted minimum
amounts specified in take-or-pay contracts are also included in
the table as they represent the portion of each contract that is a
firm commitment.
In the ordinary course of business, the company enters into
contracts that specify that the company will purchase all or a
portion of its requirements of a specific product, commodity or
service from a supplier or vendor. These contracts are generally
entered into in order to secure pricing or other negotiated terms.
They do not specify fixed or minimum quantities to be purchased
and, therefore, the company does not consider them to be pur-
chase obligations.
Interest on floating-rate debt obligations is calculated using the
effective interest rate at December 31, 2015, plus the interest rate
spread associated with that debt, if any.
Off-Balance Sheet Arrangements
From time to time, the company may enter into off-balance sheet
arrangements as defined by SEC Financial Reporting Release 67
(FRR-67), “Disclosure in Management’s Discussion and Analysis
about Off-Balance Sheet Arrangements and Aggregate Con-
tractual Obligations.”
At December 31, 2015, the company had no off-balance sheet
arrangements that have, or are reasonably likely to have, a material
current or future effect on financial condition, changes in financial
condition, revenues or expenses, results of operations, liquid-
ity, capital expenditures or capital resources. See the table on
page 63 for the company’s contractual obligations, and note M,
“Contingencies and Commitments,” on page 120, for detailed
information about the company’s guarantees, financial commit-
ments and indemnification arrangements. The company does not
have retained interests in assets transferred to unconsolidated
entities or other material off-balance sheet interests or instruments.
Critical Accounting EstimatesThe application of GAAP requires the company to make esti-
mates and assumptions about certain items and future events that
directly affect its reported financial condition. The accounting esti-
mates and assumptions discussed in this section are those that
the company considers to be the most critical to its financial state-
ments. An accounting estimate is considered critical if both (a) the
nature of the estimate or assumption is material due to the levels
of subjectivity and judgment involved, and (b) the impact within a
reasonable range of outcomes of the estimate and assumption
is material to the company’s financial condition. Senior manage-
ment has discussed the development, selection and disclosure of
these estimates with the Audit Committee of the company’s Board
of Directors. The company’s significant accounting policies are
described in note A, “Significant Accounting Policies,” on pages
82 to 92.
A quantitative sensitivity analysis is provided where that infor-
mation is reasonably available, can be reliably estimated and
provides material information to investors. The amounts used to
assess sensitivity (e.g., 1 percent, 10 percent, etc.) are included to
allow users of the Annual Report to understand a general direction
cause and effect of changes in the estimates and do not represent
management’s predictions of variability. For all of these estimates,
it should be noted that future events rarely develop exactly as fore-
casted, and estimates require regular review and adjustment.
Pension Assumptions
For the company’s defined benefit pension plans, the measure-
ment of the benefit obligation to employees and net periodic
pension (income)/cost requires the use of certain assumptions,
including, among others, estimates of discount rates and expected
return on plan assets.
Changes in the discount rate assumptions would impact the
(gain)/loss amortization and interest cost components of the net
periodic pension (income)/cost calculation and the projected ben-
efit obligation (PBO). The company increased the discount rate
assumption for the IBM Personal Pension Plan (PPP), a U.S.-based
defined benefit plan, by 30 basis points to 4.00 percent on Decem-
ber 31, 2015. This change will decrease pre-tax cost and expense
recognized in 2016 by an estimated $100 million. If the discount
rate assumption for the PPP had decreased by 30 basis points
on December 31, 2015, pre-tax cost and expense recognized in
2016 would have increased by an estimated $98 million. Changes
in the discount rate assumptions would impact the PBO which,
in turn, may impact the company’s funding decisions if the PBO
exceeds plan assets. A 25 basis point increase or decrease in the
discount rate would cause a corresponding decrease or increase,
respectively, in the PPP’s PBO of an estimated $1.3 billion based
upon December 31, 2015 data.

65Management Discussion
International Business Machines Corporation and Subsidiary Companies
The expected long-term return on plan assets assumption
is used in calculating the net periodic pension (income)/cost.
Expected returns on plan assets are calculated based on the
market-related value of plan assets, which recognizes changes in
the fair value of plan assets systematically over a five-year period
in the expected return on plan assets line in net periodic pension
(income)/cost. The differences between the actual return on plan
assets and the expected long-term return on plan assets are rec-
ognized over five years in the expected return on plan assets line
in net periodic pension (income)/cost and also as a component
of actuarial (gains)/losses, which are recognized over the service
lives or life expectancy of the participants, depending on the plan,
provided such amounts exceed thresholds which are based upon
the benefit obligation or the value of plan assets, as provided by
accounting standards.
To the extent the outlook for long-term returns changes such
that management changes its expected long-term return on plan
assets assumption, each 50 basis point increase or decrease in
the expected long-term return on PPP plan assets assumption
would have an estimated decrease or increase, respectively, of
$263 million on the following year’s pre-tax net periodic pension
(income)/cost (based upon the PPP’s plan assets at December 31,
2015 and assuming no contributions are made in 2016).
The company may voluntarily make contributions or be
required, by law, to make contributions to its pension plans. Actual
results that differ from the estimates may result in more or less
future company funding into the pension plans than is planned
by management. Impacts of these types of changes on the com-
pany’s pension plans in other countries worldwide would vary
depending upon the status of each respective plan.
In addition to the above, the company evaluates other pension
assumptions involving demographic factors, such as retirement
age and mortality, and updates these assumptions to reflect expe-
rience and expectations for the future. Actual results in any given
year can differ from actuarial assumptions because of economic
and other factors.
For additional information on the company’s pension plans
and the development of these assumptions, see Note S, “Retire-
ment-Related Benefits,” on pages 133 and 134.
Revenue Recognition
Application of the various accounting principles in GAAP related
to the measurement and recognition of revenue requires the
company to make judgments and estimates. Specifically, com-
plex arrangements with nonstandard terms and conditions may
require significant contract interpretation to determine the appro-
priate accounting, including whether the deliverables specified in
a multiple-deliverable arrangement should be treated as separate
units of accounting. Other significant judgments include deter-
mining whether IBM or a reseller is acting as the principal in a
transaction and whether separate contracts are considered part
of one arrangement.
Revenue recognition is also impacted by the company’s ability
to estimate sales incentives, expected returns and collectibility.
The company considers various factors, including a review of
specific transactions, the creditworthiness of the customers,
historical experience and market and economic conditions
when calculating these provisions and allowances. Evaluations
are conducted each quarter to assess the adequacy of the esti-
mates. If these estimates were changed by 10 percent in 2015,
net income would have been impacted by $77 million (excluding
Global Financing receivables).
Costs to Complete Service Contracts
The company enters into numerous service contracts through its
Global Services business. During the contractual period, revenue,
cost and profits may be impacted by estimates of the ultimate
profitability of each contract, especially contracts for which the
company uses the percentage-of-completion (POC) method
of accounting. If at any time these estimates indicate the POC
contract will be unprofitable, the entire estimated loss for the
remainder of the contract is recorded immediately in cost. The
company performs ongoing profitability analyses of its POC-
based services contracts in order to determine whether the latest
estimates require updating. Key factors reviewed by the company
to estimate the future costs to complete each contract are future
labor costs, future product costs and expected productivity effi-
ciencies. Contract loss provisions recorded as a component of
other accrued expenses and liabilities were $12 million and $13 mil-
lion at December 31, 2015 and 2014, respectively.
Income Taxes
The company is subject to income taxes in the U.S. and numerous
foreign jurisdictions. Significant judgments are required in deter-
mining the consolidated provision for income taxes.
During the ordinary course of business, there are many trans-
actions and calculations for which the ultimate tax determination is
uncertain. As a result, the company recognizes tax liabilities based
on estimates of whether additional taxes and interest will be due.
These tax liabilities are recognized when, despite the company’s
belief that its tax return positions are supportable, the company
believes that certain positions may not be fully sustained upon
review by tax authorities. The company believes that its accruals
for tax liabilities are adequate for all open audit years based on
its assessment of many factors, including past experience and
interpretations of tax law. This assessment relies on estimates
and assumptions, and may involve a series of complex judgments
about future events. To the extent that new information becomes
available which causes the company to change its judgment
regarding the adequacy of existing tax liabilities, such changes to
tax liabilities will impact income tax expense in the period in which
such determination is made.

66 Management Discussion
International Business Machines Corporation and Subsidiary Companies
Significant judgment is also required in determining any valua-
tion allowance recorded against deferred tax assets. In assessing
the need for a valuation allowance, management considers all
available evidence for each jurisdiction including past operating
results, estimates of future taxable income and the feasibility of
ongoing tax planning strategies. In the event that the company
changes its determination as to the amount of deferred tax assets
that can be realized, the company will adjust its valuation allow-
ance with a corresponding impact to income tax expense in the
period in which such determination is made.
The consolidated provision for income taxes will change period
to period based on nonrecurring events, such as the settlement
of income tax audits and changes in tax laws, as well as recurring
factors including the geographic mix of income before taxes, the
timing and amount of foreign dividend repatriation, state and local
taxes and the effects of various global income tax strategies.
To the extent that the provision for income taxes increases/
decreases by 1 percent of income from continuing operations
before income taxes, consolidated net income would have
decreased/improved by $159 million in 2015.
Valuation of Assets
The application of business combination and impairment account-
ing requires the use of significant estimates and assumptions.
The acquisition method of accounting for business combinations
requires the company to estimate the fair value of assets acquired,
liabilities assumed, and any noncontrolling interest in the acquiree
to properly allocate purchase price consideration between assets
that are depreciated and amortized from goodwill and indefi-
nite-lived intangible assets. Impairment testing for assets, other
than goodwill and indefinite-lived intangible assets, requires the
allocation of cash flows to those assets or group of assets and
if required, an estimate of fair value for the assets or group of
assets. The company’s estimates are based upon assumptions
believed to be reasonable, but which are inherently uncertain and
unpredictable. These valuations require the use of management’s
assumptions, which would not reflect unanticipated events and
circumstances that may occur.
Valuation of Goodwill
The company reviews goodwill for impairment annually and when-
ever events or changes in circumstances indicate the carrying
value of goodwill may not be recoverable. In 2015, the company
elected to perform the first step of the quantitative test to compare
the fair value of each reporting unit to its carrying value instead of
first conducting a qualitative assessment. The company deter-
mines the fair value of its reporting units based on the income
approach. Under the income approach, the company calculates
the fair value of a reporting unit based on the present value of
estimated future cash flows. If the fair value of the reporting unit
exceeds the carrying value of the net assets assigned to that unit,
goodwill is not impaired. The second step of the impairment test
is only required if the first step results in a carrying value in excess
of fair value.
Determining the fair value of a reporting unit is judgmental in
nature and involves the use of significant estimates and assump-
tions. These estimates and assumptions include revenue growth
rates and operating margins used to calculate projected future
cash flows, discount rates and future economic and market con-
ditions. The company’s estimates are based upon assumptions
believed to be reasonable, but which are inherently uncertain and
unpredictable. These valuations require the use of management’s
assumptions, which would not reflect unanticipated events and
circumstances that may occur.
The annual goodwill impairment analysis, which the company
performed during the fourth quarter of 2015, did not result in an
impairment charge. All of the company’s reporting units had fair
values that substantially exceeded their carrying values.
Loss Contingencies
The company is currently involved in various claims and legal
proceedings. At least quarterly, the company reviews the status
of each significant matter and assesses its potential financial
exposure. If the potential loss from any claim or legal proceed-
ing is considered probable and the amount can be reasonably
estimated, the company accrues a liability for the estimated loss.
Significant judgment is required in both the determination of
probability and the determination as to whether an exposure is
reasonably estimable. Because of uncertainties related to these
matters, accruals are based only on the best information available
at the time. As additional information becomes available, the com-
pany reassesses the potential liability related to its pending claims
and litigation, and may revise its estimates. These revisions in the
estimates of the potential liabilities could have a material impact on
the company’s results of operations and financial position.
Global Financing Receivables Allowance for Credit Losses
The Global Financing business reviews its financing receivables
port folio at least quarterly in order to assess collectibility. A
description of the methods used by management to estimate the
amount of uncollectible receivables is included in note A, “Signifi-
cant Accounting Policies,” on page 91. Factors that could result in
actual receivable losses that are materially different from the estim-
ated reserve include sharp changes in the economy, or a significant
change in the economic health of a particular client that represents
a concentration in Global Financing’s receivables portfolio.
To the extent that actual collectibility differs from manage-
ment’s estimates currently provided for by 10 percent, Global
Financing’s segment pre-tax income and the company’s income
from continuing operations before income taxes would be higher
or lower by an estimated $61 million depending upon whether
the actual collectibility was better or worse, respectively, than
the estimates.
67Management Discussion
International Business Machines Corporation and Subsidiary Companies
Residual Value
Residual value represents the estimated fair value of equipment
under lease as of the end of the lease. Residual value estimates
impact the determination of whether a lease is classified as oper-
ating or capital. Global Financing estimates the future fair value of
leased equipment by using historical models, analyzing the current
market for new and used equipment, and obtaining forward-look-
ing product information such as marketing plans and technological
innovations. Residual value estimates are periodically reviewed
and “other than temporary” declines in estimated future residual
values are recognized upon identification. Anticipated increases
in future residual values are not recognized until the equipment
is remarketed.
Factors that could cause actual results to materially differ from
the estimates include significant changes in the used-equipment
market brought on by unforeseen changes in technology inno-
vations and any resulting changes in the useful lives of used
equipment.
To the extent that actual residual value recovery is lower than
management’s estimates by 10 percent, Global Financing’s seg-
ment pre-tax income and the company’s income from continuing
operations before income taxes for 2015 would have been lower
by an estimated $79 million. If the actual residual value recovery is
higher than management’s estimates, the increase in income will
be realized at the end of lease when the equipment is remarketed.
Currency Rate FluctuationsChanges in the relative values of non-U.S. currencies to the U.S.
dollar affect the company’s financial results and financial position.
At December 31, 2015, currency changes resulted in assets and lia-
bilities denominated in local currencies being translated into fewer
dollars than at year-end 2014. The company uses financial hedg-
ing instruments to limit specific currency risks related to financing
transactions and other foreign currency-based transactions.
During periods of sustained movements in currency, the
marketplace and competition adjust to the changing rates. For
example, when pricing offerings in the marketplace, the company
may use some of the advantage from a weakening U.S. dollar to
improve its position competitively, and price more aggressively to
win the business, essentially passing on a portion of the currency
advantage to its customers. Competition will frequently take the
same action. Consequently, the company believes that some of
the currency-based changes in cost impact the prices charged to
clients. The company also maintains currency hedging programs
for cash management purposes which temporarily mitigate, but do
not eliminate, the volatility of currency impacts on the company’s
financial results.
The company translates revenue, cost and expense in its non-
U.S. operations at current exchange rates in the reported period.
References to “adjusted for currency” or “constant currency”
reflect adjustments based upon a simple constant currency math-
ematical translation of local currency results using the comparable
prior period’s currency conversion rate. However, this constant
currency methodology that the company utilizes to disclose this
information does not incorporate any operational actions that
management may take in reaction to fluctuating currency rates.
Currency movements impacted the company’s year-to-year reve-
nue and earnings per share growth in 2015. Based on the currency
rate movements in 2015, total revenue decreased 11.9 percent as
reported and 4.1 percent at constant currency versus 2014. On an
income from continuing operations before income taxes basis,
these translation impacts offset by the net impact of hedging activ-
ities resulted in a theoretical maximum (assuming no pricing or
sourcing actions) decrease of approximately $900 million in 2015,
on an as-reported basis and a decrease of approximately $1,000
million on an operating (non-GAAP) basis. The same mathematical
exercise resulted in a decrease of approximately $400 million in
2014 on both an as-reported and operating (non-GAAP) basis. The
company views these amounts as a theoretical maximum impact
to its as-reported financial results. Considering the operational
responses mentioned above, movements of exchange rates, and
the nature and timing of hedging instruments, it is difficult to predict
future currency impacts on any particular period, but the company
believes it could be substantially less than the theoretical maxi-
mum given the competitive pressure in the marketplace.
For non-U.S. subsidiaries and branches that operate in U.S.
dollars or whose economic environment is highly inflationary,
translation adjustments are reflected in results of operations.
Generally, the company manages currency risk in these entities
by linking prices and contracts to U.S. dollars.
The company continues to monitor the economic conditions in
Venezuela. At the December 31, 2015 SICAD rate of 13.5 Bolivar per
USD, the company’s net asset position in Venezuela was $29 mil-
lion reflecting $7 million of currency losses in the Consolidated
Statement of Earnings in 2015. In mid-February 2016, changes to
the currency exchange systems were announced. The company
will continue to monitor transactions from the various exchange
systems in Venezuela in 2016. The company’s operations in Ven-
ezuela comprised less than 1 percent of total 2015, 2014 and 2013
revenue, respectively.
In January 2014, the Argentinian government devalued its cur-
rency from 6 pesos per USD to 8 pesos per USD. On December 16,
2015, the Argentinian government announced an end to the offi-
cial controls on the foreign exchange market. At December 31,
2015 the Argentinian currency was devalued from 9.7 pesos per
USD to 12.9 pesos per USD. These devaluations did not have a
material impact given the size of the company’s operations in
Argentina (less than 1 percent of total 2015, 2014 and 2013 reve-
nue, respectively).
68 Management Discussion
International Business Machines Corporation and Subsidiary Companies
Market RiskIn the normal course of business, the financial position of the com-
pany is routinely subject to a variety of risks. In addition to the
market risk associated with interest rate and currency movements
on outstanding debt and non-U.S. dollar denominated assets and
liabilities, other examples of risk include collectibility of accounts
receivable and recoverability of residual values on leased assets.
The company regularly assesses these risks and has estab-
lished policies and business practices to protect against the
adverse effects of these and other potential exposures. As a
result, the company does not anticipate any material losses from
these risks.
The company’s debt, in support of the Global Financing busi-
ness and the geographic breadth of the company’s operations,
contains an element of market risk from changes in interest and
currency rates. The company manages this risk, in part, through
the use of a variety of financial instruments including derivatives, as
described in note D, “Financial Instruments—Derivative Financial
Instruments,” on pages 101 through 105.
To meet disclosure requirements, the company performs a
sensitivity analysis to determine the effects that market risk expo-
sures may have on the fair values of the company’s debt and other
financial instruments.
The financial instruments that are included in the sensitivity
analysis are comprised of the company’s cash and cash equiv-
alents, marketable securities, short-term and long-term loans,
commercial financing and installment payment receivables,
investments, long-term and short-term debt and derivative finan-
cial instruments. The company’s derivative financial instruments
generally include interest rate swaps, foreign currency swaps and
forward contracts.
To perform the sensitivity analysis, the company assesses
the risk of loss in fair values from the effect of hypothetical
changes in interest rates and foreign currency exchange rates
on market-sensitive instruments. The market values for interest
and foreign currency exchange risk are computed based on the
present value of future cash flows as affected by the changes
in rates that are attributable to the market risk being measured.
The discount rates used for the present value computations were
selected based on market interest and foreign currency exchange
rates in effect at December 31, 2015 and 2014. The differences in
this comparison are the hypothetical gains or losses associated
with each type of risk.
Information provided by the sensitivity analysis does not neces-
sarily represent the actual changes in fair value that the company
would incur under normal market conditions because, due to prac-
tical limitations, all variables other than the specific market risk
factor are held constant. In addition, the results of the model are
constrained by the fact that certain items are specifically excluded
from the analysis, while the financial instruments relating to the
financing or hedging of those items are included by definition.
Excluded items include short-term and long-term receivables
from sales-type and direct financing leases, forecasted foreign
currency cash flows and the company’s net investment in foreign
operations. As a consequence, reported changes in the values
of some of the financial instruments impacting the results of the
sensitivity analysis are not matched with the offsetting changes
in the values of the items that those instruments are designed to
finance or hedge.
The results of the sensitivity analysis at December 31, 2015 and
2014, are as follows:
Interest Rate Risk
At December 31, 2015, a 10 percent decrease in the levels of inter-
est rates with all other variables held constant would result in a
decrease in the fair value of the company’s financial instruments of
$69 million as compared with a decrease of $123 million at Decem-
ber 31, 2014. A 10 percent increase in the levels of interest rates
with all other variables held constant would result in an increase in
the fair value of the company’s financial instruments of $66 million
as compared to an increase of $119 million at December 31, 2014.
Changes in the relative sensitivity of the fair value of the company’s
financial instrument portfolio for these theoretical changes in the
level of interest rates are primarily driven by changes in the com-
pany’s debt maturities, interest rate profile and amount.
Foreign Currency Exchange Rate Risk
At December 31, 2015, a 10 percent weaker U.S. dollar against for-
eign currencies, with all other variables held constant, would result
in a decrease in the fair value of the company’s financial instru-
ments of $74 million as compared with an increase of $872 million
at December 31, 2014. Conversely, a 10 percent stronger U.S. dollar
against foreign currencies, with all other variables held constant,
would result in an increase in the fair value of the company’s
financial instruments of $74 million compared with a decrease of
$872 million at December 31, 2014.
Financing RisksSee the “Description of Business” on page 27 for a discussion of
the financing risks associated with the Global Financing business
and management’s actions to mitigate such risks.
CybersecurityThe company’s approach to cybersecurity draws on the depth
and breadth of its global capabilities, both in terms of its offer-
ings to clients and its internal approaches to risk management.
The company has commercial solutions that deliver identity
and access management, data security, application security,
network security and endpoint security. IBM’s solutions include
security intelligence, analytics and forensic tools that can collect

69Management Discussion
International Business Machines Corporation and Subsidiary Companies
information on customer IT security events and vulnerabilities and
provide detailed information to customers about potential threats
and security posture. The company’s services businesses offer
professional solutions for security from assessment to deploy-
ment and resource augmentation. In addition, the company offers
managed and outsourced security solutions from multiple security
operations centers around the world. Finally, security is embedded
in a multitude of IBM offerings through secure engineering pro-
cesses and by critical functions (encryption, access control, etc.)
in servers, storage, software, service, and other solutions.
From an enterprise perspective, IBM implements a multi-
faceted risk-management approach to identify and address
cybersecurity risks. The company has established policies and
procedures that provide the foundation by which IBM’s infrastruc-
ture and data are managed. IBM performs ongoing assessments
regarding its technical controls and its methods for identifying
emerging risks related to cybersecurity. The company uses a
layered approach with overlapping controls to defend against
cybersecurity attacks and threats on networks, end-user devices,
servers, applications and cloud solutions. The company also has
a global incident response process to respond to cybersecurity
threats. In addition, the company utilizes a combination of online
training, educational tools, social media and other awareness ini-
tiatives to foster a culture of security awareness and responsibility
among its workforce.
Employees and Related Workforce
Yr.-to-Yr. Percent Change
For the year ended December 31: 2015 2014 2013 2015–14 2014–13
IBM/wholly owned subsidiaries 377,757 379,592* 431,212 (0.5)% (12.0)%*
Less-than-wholly owned subsidiaries 9,577 8,862 9,018 8.1 (1.7)
Complementary 24,464 24,321 23,555 0.6 3.3
* Reflects reduction of approximately 35,000 employees (approximately 8 percent) due to divestitures.
As a globally integrated enterprise, the company operates in more
than 175 countries and is continuing to shift its business to the
higher value segments of enterprise IT. The company continues to
remix its skills and people needs to match the best opportunities
in the marketplace.
The complementary workforce is an approximation of equiv-
alent full-time employees hired under temporary, part-time and
limited-term employment arrangements to meet specific business
needs in a flexible and cost-effective manner.
GLOBAL FINANCING
Global Financing is a reportable segment that is measured as a
stand-alone entity.
In 2015, the Global Financing business remained focused on
its core competencies—providing IT financing to the company’s
clients and business partners. For the year, Global Financing deliv-
ered external revenue of $1,840 million and total revenue of $4,477
million, maintaining constant gross margins. Total pre-tax income
of $2,364 million increased 8.0 percent compared to 2014 and
return on equity was 41.5 percent.
In addition to the overall health of the economy and its impact
on corporate IT budgets, key drivers of Global Financing’s results
are interest rates and originations. Interest rates directly impact
Global Financing’s business by increasing or decreasing both
financing revenue and the associated borrowing costs. Orig-
inations, which determine the asset base of Global Financing’s
annuity-like business, are impacted by IBM’s non-Global Financing
sales and services volumes and Global Financing’s participation
rates. Participation rates are the propensity of IBM’s clients to
finance their transactions through Global Financing in lieu of paying
IBM up-front cash or financing through a third party.
Results of Operations
($ in millions)
For the year ended December 31: 2015 2014 2013
External revenue $1,840 $2,034 $2,022
Internal revenue 2,637 2,488 2,282
Total revenue 4,477 4,522 4,304
Cost 1,412 1,428 1,417
Gross profi t $3,065 $3,094 $2,888
Gross profi t margin 68.5% 68.4% 67.1%
Pre-tax income $2,364 $2,189 $2,171
After-tax income* $1,572 $1,462 $1,456
Return on equity* 41.5% 36.8% 40.6%
* See page 73 for the details of the after-tax income and return on equity calculation.
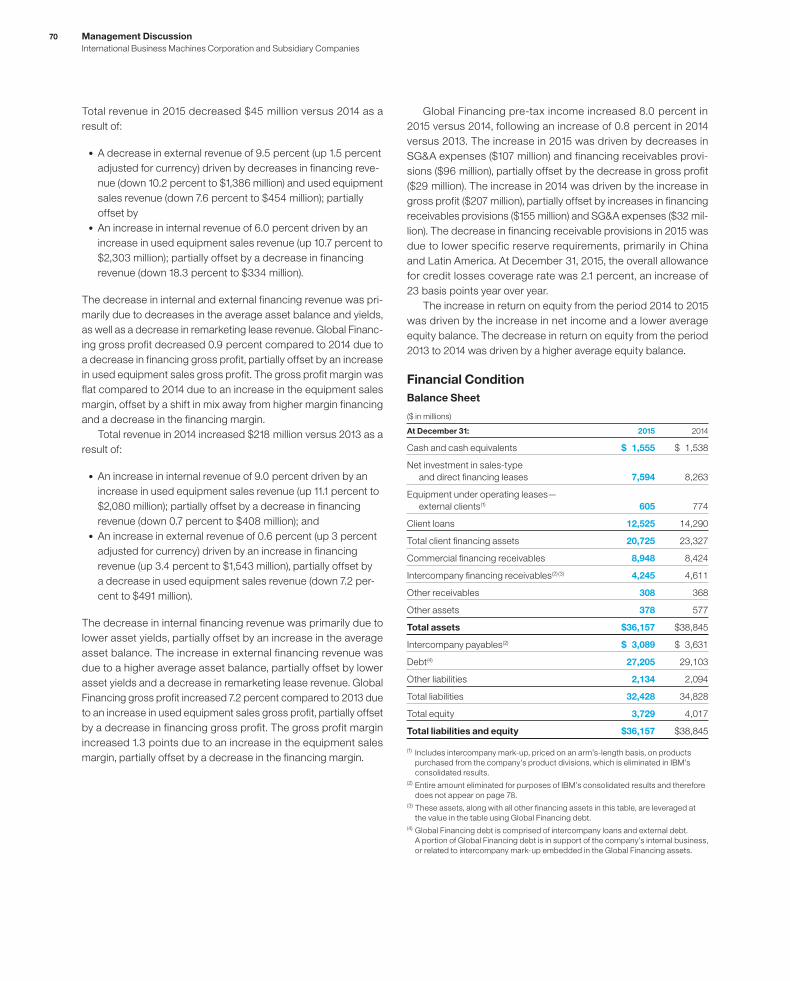
70 Management Discussion
International Business Machines Corporation and Subsidiary Companies
Total revenue in 2015 decreased $45 million versus 2014 as a
result of:
• A decrease in external revenue of 9.5 percent (up 1.5 percent
adjusted for currency) driven by decreases in financing reve-
nue (down 10.2 percent to $1,386 million) and used equipment
sales revenue (down 7.6 percent to $454 million); partially
offset by
• An increase in internal revenue of 6.0 percent driven by an
increase in used equipment sales revenue (up 10.7 percent to
$2,303 million); partially offset by a decrease in financing
revenue (down 18.3 percent to $334 million).
The decrease in internal and external financing revenue was pri-
marily due to decreases in the average asset balance and yields,
as well as a decrease in remarketing lease revenue. Global Financ-
ing gross profit decreased 0.9 percent compared to 2014 due to
a decrease in financing gross profit, partially offset by an increase
in used equipment sales gross profit. The gross profit margin was
flat compared to 2014 due to an increase in the equipment sales
margin, offset by a shift in mix away from higher margin financing
and a decrease in the financing margin.
Total revenue in 2014 increased $218 million versus 2013 as a
result of:
• An increase in internal revenue of 9.0 percent driven by an
increase in used equipment sales revenue (up 11.1 percent to
$2,080 million); partially offset by a decrease in financing
revenue (down 0.7 percent to $408 million); and
• An increase in external revenue of 0.6 percent (up 3 percent
adjusted for currency) driven by an increase in financing
revenue (up 3.4 percent to $1,543 million), partially offset by
a decrease in used equipment sales revenue (down 7.2 per-
cent to $491 million).
The decrease in internal financing revenue was primarily due to
lower asset yields, partially offset by an increase in the average
asset balance. The increase in external financing revenue was
due to a higher average asset balance, partially offset by lower
asset yields and a decrease in remarketing lease revenue. Global
Financing gross profit increased 7.2 percent compared to 2013 due
to an increase in used equipment sales gross profit, partially offset
by a decrease in financing gross profit. The gross profit margin
increased 1.3 points due to an increase in the equipment sales
margin, partially offset by a decrease in the financing margin.
Global Financing pre-tax income increased 8.0 percent in
2015 versus 2014, following an increase of 0.8 percent in 2014
versus 2013. The increase in 2015 was driven by decreases in
SG&A expenses ($107 million) and financing receivables provi-
sions ($96 million), partially offset by the decrease in gross profit
($29 million). The increase in 2014 was driven by the increase in
gross profit ($207 million), partially offset by increases in financing
receivables provisions ($155 million) and SG&A expenses ($32 mil-
lion). The decrease in financing receivable provisions in 2015 was
due to lower specific reserve requirements, primarily in China
and Latin America. At December 31, 2015, the overall allowance
for credit losses coverage rate was 2.1 percent, an increase of
23 basis points year over year.
The increase in return on equity from the period 2014 to 2015
was driven by the increase in net income and a lower average
equity balance. The decrease in return on equity from the period
2013 to 2014 was driven by a higher average equity balance.
Financial Condition
Balance Sheet
($ in millions)
At December 31: 2015 2014
Cash and cash equivalents $ 1,555 $ 1,538
Net investment in sales-type
and direct fi nancing leases 7,594 8,263
Equipment under operating leases—
external clients (1) 605 774
Client loans 12,525 14,290
Total client fi nancing assets 20,725 23,327
Commercial fi nancing receivables 8,948 8,424
Intercompany fi nancing receivables (2) (3) 4,245 4,611
Other receivables 308 368
Other assets 378 577
Total assets $36,157 $38,845
Intercompany payables (2) $ 3,089 $ 3,631
Debt (4) 27,205 29,103
Other liabilities 2,134 2,094
Total liabilities 32,428 34,828
Total equity 3,729 4,017
Total liabilities and equity $36,157 $38,845
(1) Includes intercompany mark-up, priced on an arm’s-length basis, on products
purchased from the company’s product divisions, which is eliminated in IBM’s
consolidated results. (2) Entire amount eliminated for purposes of IBM’s consolidated results and therefore
does not appear on page 78.(3) These assets, along with all other financing assets in this table, are leveraged at
the value in the table using Global Financing debt. (4) Global Financing debt is comprised of intercompany loans and external debt.
A portion of Global Financing debt is in support of the company’s internal business,
or related to intercompany mark-up embedded in the Global Financing assets.

71Management Discussion
International Business Machines Corporation and Subsidiary Companies
Sources and Uses of Funds
The primary use of funds in Global Financing is to originate client
and commercial financing assets. Client financing assets for end
users consist primarily of IBM systems, software and services, but
also include OEM equipment, software and services to meet IBM
clients’ total solutions requirements. Client financing assets are
primarily sales-type, direct financing and operating leases for sys-
tems products, as well as loans and installment plans for systems,
software and services with terms up to seven years. Global Financ-
ing’s client loans and installment payment plans are primarily for
software and services and are unsecured. These agreements are
subjected to credit analysis to evaluate the associated risk and,
when deemed necessary, actions are taken to mitigate risks, which
include covenants to protect against credit deterioration during
the life of the obligation.
Commercial financing receivables arise primarily from inventory
and accounts receivable financing for dealers and remarketers of
IBM and OEM products. Payment terms for inventory financing
and accounts receivable financing generally range from 30 to 90
days. These short-term receivables are primarily unsecured and
are also subjected to additional credit analysis in order to evaluate
the associated risk.
In addition to the actions previously described, in certain cir-
cumstances, the company may take mitigation actions to transfer
credit risk to third parties, including credit insurance, financial guar-
antees, nonrecourse borrowings, transfer of receivables recorded
as true sale in accordance with accounting guidance or sale of
equipment under operating lease.
At December 31, 2015, substantially all financing assets were IT
related assets, and approximately 55 percent of the total external
portfolio was with investment grade clients with no direct expo-
sure to consumers. The reduction in investment grade year to year
(5 points) was driven primarily by rating changes within the existing
portfolio, not by changing the company’s approach to the market.
Originations
The following are total financing originations:
($ in millions)
For the year ended December 31: 2015 2014 2013
Client fi nancing $14,444 $15,099 $15,792
Commercial fi nancing 40,571 43,664 41,027
Total $55,015 $58,762 $56,819
In 2015, cash collection of client financing assets exceeded new
financing originations while new financing originations of commer-
cial financing exceeded collections. This resulted in a net decline
in financing assets from December 2014. The decrease in orig-
inations in 2015 versus 2014 was due to declining volumes, and
the increase in 2014 versus 2013 was due to improving volumes.
Internal loan financing with Global Services is executed under a
loan facility and is not considered originations.
Cash generated by Global Financing in 2015 was deployed to
pay intercompany payables and dividends to IBM as well as busi-
ness partners and OEM suppliers.
Global Financing Receivables and Allowances
The following table presents external financing receivables exclud-
ing residual values, and the allowance for credit losses:
($ in millions)
At December 31: 2015 2014
Gross fi nancing receivables $29,086 $31,007
Specifi c allowance for credit losses 517 484
Unallocated allowance for credit losses 93 96
Total allowance for credit losses 610 580
Net fi nancing receivables $28,475 $30,427
Allowance for credit losses coverage 2.1% 1.9%
Roll Forward of Global Financing Receivables Allowance for Credit Losses
($ in millions)
January 1, 2015Allowance
Used*Additions/
(Reductions) Other**December 31,
2015
$580 $(63 ) $144 $(50 ) $610
* Represents reserved receivables, net of recoveries, that were written off during
the period.
** Primarily represents translation adjustments.
The percentage of Global Financing receivables reserved was
2.1 percent at December 31, 2015, and 1.9 percent at December 31,
2014. Specific reserves increased 7 percent from $484 million
at December 31, 2014, to $517 million at December 31, 2015.
Unallocated reserves decreased 3 percent from $96 million at
December 31, 2014, to $93 million at December 31, 2015, due to
the decrease in gross financing receivables, partially offset by
higher general reserve requirements in Latin America due to lower
credit ratings.
Global Financing’s bad debt expense was $144 million for 2015,
compared to $240 million for 2014. The year-to-year decrease in
bad debt expense was due to lower specific reserve requirements,
primarily in China and Latin America, in the current year.
Residual Value
Residual value is a risk unique to the financing business and
management of this risk is dependent upon the ability to accu-
rately project future equipment values at lease inception. Global
Financing has insight into product plans and cycles for the IBM
products under lease. Based upon this product information, Global
Financing continually monitors projections of future equipment
values and compares them with the residual values reflected in
the portfolio.

72 Management Discussion
International Business Machines Corporation and Subsidiary Companies
Global Financing optimizes the recovery of residual values by
selling assets sourced from end of lease, leasing used equipment
to new clients, or extending lease arrangements with current cli-
ents. Sales of equipment include equipment returned at the end of
a lease, surplus internal equipment, or used equipment purchased
externally. These sales represented 61.6 percent and 56.9 percent
of Global Financing’s revenue in 2015 and 2014, respectively. The
increase was due to a higher volume of used equipment sales
for internal transactions. The gross profit margins on these sales
were 66.0 percent and 64.9 percent in 2015 and 2014, respectively.
The increase in the gross profit margin was driven by a shift in mix
toward higher margin internal equipment sales, partially offset by
decreases in internal and external equipment sales margins.
The table below presents the recorded amount of unguaran-
teed residual value for sales-type, direct financing and operating
leases at December 31, 2015 and 2014. In addition, the table
presents the residual value as a percentage of the related orig-
inal amount financed and a run out of when the unguaranteed
residual value assigned to equipment on leases at December 31,
2015 is expected to be returned to the company. In addition to the
unguaranteed residual value, on a limited basis, Global Financing
will obtain guarantees of the future value of the equipment to be
returned at end of lease. While primarily focused on IBM products,
guarantees are also obtained for certain OEM products. These
third-party guarantees are included in minimum lease payments as
provided for by accounting standards in the determination of lease
classifications for the covered equipment and provide protection
against risk of loss arising from declines in equipment values for
these assets.
The residual value guarantee increases the minimum lease
payments that are utilized in determining the classification of a
lease as a sales-type lease, direct financing lease or operating
lease. The aggregate asset values associated with the guarantees
of sales-type leases were $811 million and $503 million for the
financing transactions originated during the years ended Decem-
ber 31, 2015 and December 31, 2014, respectively. In 2015, the
residual value guarantee program resulted in the company rec-
ognizing $608 million of revenue that would otherwise have been
recognized in future periods as operating lease revenue. If the
company had chosen to not participate in a residual value guar-
antee program in 2015 and prior years, the 2015 impact would be
substantially mitigated by the effect of prior year asset values being
recognized as operating lease revenue in the current year. The
aggregate asset values associated with the guarantees of direct
financing leases were $185 million and $204 million for the financ-
ing transactions originated during the years ended December 31,
2015 and 2014, respectively. The associated aggregate guaranteed
future values at the scheduled end of lease were $54 million and
$25 million for the financing transactions originated during the
years ended December 31, 2015 and 2014, respectively. The cost
of guarantees was $5 million and $2 million for the years ended
December 31, 2015 and 2014, respectively.
Unguaranteed Residual Value
($ in millions)
Total Estimated Run Out of 2015 Balance
At December 31: 2014 2015 2016 2017 20182019 and
Beyond
Sales-type and direct fi nancing leases $ 671 $ 645 $144 $172 $202 $128
Operating leases 166 144 61 46 26 11
Total unguaranteed residual value $ 837 $ 789 $205 $218 $228 $139
Related original amount fi nanced $15,636 $14,223
Percentage 5.4% 5.6%
Debt
At December 31: 2015 2014
Debt-to-equity ratio 7.3x 7.2x
The debt used to fund Global Financing assets is composed of
intercompany loans and external debt. Total debt changes gen-
erally correspond with the level of client and commercial financing
receivables, the level of cash and cash equivalents, the change
in intercompany and external payables and the change in inter-
company investment from IBM. The terms of the intercompany
loans are set by the company to substantially match the term and
currency underlying the financing receivable and are based on
arm’s-length pricing.
Global Financing provides financing predominantly for the com-
pany’s external client assets, as well as for assets under contract
by other IBM units. As previously stated, the company measures
Global Financing as a stand-alone entity, and accordingly, interest
expense relating to debt supporting Global Financing’s external
client and internal business is included in the “Global Financing
Results of Operations” on page 69 and in note T, “Segment Infor-
mation,” on pages 141 to 146.
In the company’s Consolidated Statement of Earnings, the
external debt-related interest expense supporting Global Financ-
ing’s internal financing to the company is reclassified from cost of
financing to interest expense.

73Management Discussion
International Business Machines Corporation and Subsidiary Companies
The following table provides additional information on total
company debt. In this table, intercompany activity includes inter-
nal loans and leases at arm’s-length pricing in support of Global
Services’ long-term contracts and other internal activity. The com-
pany believes these assets should be appropriately leveraged in
line with the overall Global Financing business model.
($ in millions)
December 31, 2015 December 31, 2014
Global Financing Segment $27,205 $29,103
Debt to support external clients $23,934 $25,531
Debt to support internal clients 3,271 3,572
Non-Global Financing Segments 12,684 11,619*
Debt supporting operations 15,955 15,191*
Intercompany activity (3,271) (3,572)
Total company debt $39,890 $40,722 *
* Reclassified to reflect adoption of the FASB guidance on debt issuance costs in consolidated financial statements. Refer to note B, “Accounting Changes,” for additional information.
Liquidity and Capital Resources
Global Financing is a segment of the company, and therefore, is
supported by the company’s overall liquidity position and access
to capital markets. Cash generated by Global Financing was
deployed to pay dividends to the company in order to maintain an
appropriate debt-to-equity ratio.
Return on Equity
($ in millions)
At December 31: 2015 2014
Numerator
Global Financing after-tax income (1) * $1,572 $1,462
Denominator
Average Global Financing equity (2) ** $3,785 $3,973
Global Financing return on equity (1) /(2) 41.5% 36.8%
* Calculated based upon an estimated tax rate principally based on Global Financing’s
geographic mix of earnings as IBM’s provision for income taxes is determined on
a consolidated basis.
** Average of the ending equity for Global Financing for the last five quarters.
Looking ForwardGlobal Financing’s financial position provides flexibility and fund-
ing capacity which enables the company to be well positioned
in the current environment. Global Financing’s assets and new
financing volumes are IBM and OEM products and services
financed to the company’s clients and business partners, and
substantially all financing assets are IT related assets which pro-
vide a stable base of business for future growth. Global Financing’s
offerings are competitive and available to clients as a result of the
company’s borrowing cost and access to the capital markets.
Overall, Global Financing’s originations will be dependent upon
the demand for IT products and services as well as client partic-
ipation rates.
IBM continues to access both the short-term commercial paper
market and the medium- and long-term debt markets. A protracted
period where IBM could not access the capital markets would
likely lead to a slowdown in originations.
Interest rates and the overall economy (including currency fluc-
tuations) will have an effect on both revenue and gross profit. The
company’s interest rate risk management policy, however, com-
bined with the Global Financing pricing strategy should mitigate
gross margin erosion due to changes in interest rates.
The economy could impact the credit quality of the Global
Financing receivables portfolio and therefore the level of pro-
vision for credit losses. Global Financing will continue to apply
rigorous credit policies in both the origination of new business
and the evaluation of the existing portfolio. Global Financing has
historically been able to manage residual value risk both through
insight into the company’s product cycles, as well as through its
remarketing business.
Global Financing has policies in place to manage each of the
key risks involved in financing. These policies, combined with
product and client knowledge, should allow for the prudent man-
agement of the business going forward, even during periods of
uncertainty with respect to the global economy.
74 Report of Management
International Business Machines Corporation and Subsidiary Companies
Management Responsibility for Financial InformationResponsibility for the integrity and objectivity of the financial
information presented in this Annual Report rests with IBM man-
agement. The accompanying financial statements have been
prepared in accordance with accounting principles generally
accepted in the United States of America, applying certain esti-
mates and judgments as required.
IBM maintains an effective internal control structure. It consists,
in part, of organizational arrangements with clearly defined lines
of responsibility and delegation of authority, and comprehensive
systems and control procedures. An important element of the con-
trol environment is an ongoing internal audit program. Our system
also contains self-monitoring mechanisms, and actions are taken
to correct deficiencies as they are identified.
To assure the effective administration of internal controls, we
carefully select and train our employees, develop and disseminate
written policies and procedures, provide appropriate communi-
cation channels and foster an environment conducive to the
effective functioning of controls. We believe that it is essential for
the company to conduct its business affairs in accordance with
the highest ethical standards, as set forth in the IBM Business
Conduct Guidelines. These guidelines, translated into numerous
languages, are distributed to employees throughout the world, and
reemphasized through internal programs to assure that they are
understood and followed.
The Audit Committee of the Board of Directors is composed
solely of independent, non-management directors, and is respon-
sible for recommending to the Board the independent registered
public accounting firm to be retained for the coming year, subject
to stockholder ratification. The Audit Committee meets periodically
and privately with the independent registered public accounting
firm, with the company’s internal auditors, as well as with IBM man-
agement, to review accounting, auditing, internal control structure
and financial reporting matters.
Management’s Report on Internal Control Over Financial ReportingManagement is responsible for establishing and maintaining
adequate internal control over financial reporting of the company.
Internal control over financial reporting is a process designed to
provide reasonable assurance regarding the reliability of financial
reporting and the preparation of financial statements for exter-
nal purposes in accordance with accounting principles generally
accepted in the United States of America.
The company’s internal control over financial reporting includes
those policies and procedures that (i) pertain to the maintenance
of records that, in reasonable detail, accurately and fairly reflect
the transactions and dispositions of the assets of the company;
(ii) provide reasonable assurance that transactions are recorded
as necessary to permit preparation of financial statements in
accordance with accounting principles generally accepted in the
United States of America, and that receipts and expenditures of the
company are being made only in accordance with authorizations
of management and directors of the company; and (iii) provide
reasonable assurance regarding prevention or timely detection
of unauthorized acquisition, use, or disposition of the company’s
assets that could have a material effect on the financial statements.
Because of its inherent limitations, internal control over financial
reporting may not prevent or detect misstatements. Also, pro-
jections of any evaluation of effectiveness to future periods are
subject to the risk that controls may become inadequate because
of changes in conditions, or that the degree of compliance with the
policies or procedures may deteriorate.
Management conducted an evaluation of the effectiveness of
internal control over financial reporting based on the criteria estab-
lished in Internal Control—Integrated Framework (2013) issued
by the Committee of Sponsoring Organizations of the Treadway
Commission (COSO). Based on this evaluation, management con-
cluded that the company’s internal control over financial reporting
was effective as of December 31, 2015.
PricewaterhouseCoopers LLP, an independent registered
public accounting firm, is retained to audit IBM’s Consolidated
Financial Statements and the effectiveness of the internal con-
trol over financial reporting. Its accompanying report is based on
audits conducted in accordance with the standards of the Public
Company Accounting Oversight Board (United States).
Virginia M. Rometty
Chairman, President and Chief Executive Officer
February 23, 2016
Martin J. Schroeter
Senior Vice President and Chief Financial Officer
February 23, 2016
75Report of Independent Registered Public Accounting Firm
International Business Machines Corporation and Subsidiary Companies
To the Stockholders and Board of Directors of International Business Machines Corporation:In our opinion, the accompanying Consolidated Financial State-
ments appearing on pages 76 through 146 present fairly, in all
material respects, the financial position of International Busi-
ness Machines Corporation and its subsidiaries at December 31,
2015 and 2014 and the results of their operations and their cash
flows for each of the three years in the period ended Decem-
ber 31, 2015 in conformity with accounting principles generally
accepted in the United States of America. Also in our opinion, the
Company maintained, in all material respects, effective internal
control over financial reporting as of December 31, 2015, based
on criteria established in Internal Control—Integrated Framework
(2013) issued by the Committee of Sponsoring Organ izations of the
Treadway Commission (COSO). The Company’s management is
responsible for these financial statements, for maintaining effec-
tive internal control over financial reporting and for its assessment
of the effectiveness of internal control over financial reporting,
included in the accompanying Management’s Report on Inter-
nal Control over Financial Reporting appearing on page 74. Our
responsibility is to express opinions on these financial statements
and on the Company’s internal control over financial reporting
based on our integrated audits. We conducted our audits in
accordance with the standards of the Public Company Account-
ing Oversight Board (United States). Those standards require that
we plan and perform the audits to obtain reasonable assurance
about whether the financial statements are free of material mis-
statement and whether effective internal control over financial
reporting was maintained in all material respects. Our audits of
the financial statements included examining, on a test basis, evi-
dence supporting the amounts and disclosures in the financial
statements, assessing the accounting principles used and signif-
icant estimates made by management, and evaluating the overall
financial statement presentation. Our audit of internal control over
financial reporting included obtaining an understanding of internal
control over financial reporting, assessing the risk that a material
weakness exists, and testing and evaluating the design and oper-
ating effectiveness of internal control based on the assessed risk.
Our audits also included performing such other procedures as we
considered necessary in the circumstances. We believe that our
audits provide a reasonable basis for our opinions.
A company’s internal control over financial reporting is a pro-
cess designed to provide reasonable assurance regarding the
reliability of financial reporting and the preparation of financial
statements for external purposes in accordance with generally
accepted accounting principles. A company’s internal control over
financial reporting includes those policies and procedures that (i)
pertain to the maintenance of records that, in reasonable detail,
accurately and fairly reflect the transactions and dispositions of
the assets of the company; (ii) provide reasonable assurance that
transactions are recorded as necessary to permit preparation
of financial statements in accordance with generally accepted
accounting principles, and that receipts and expenditures of the
company are being made only in accordance with authorizations
of management and directors of the company; and (iii) provide
reasonable assurance regarding prevention or timely detection
of unauthorized acquisition, use, or disposition of the company’s
assets that could have a material effect on the financial statements.
Because of its inherent limitations, internal control over financial
reporting may not prevent or detect misstatements. Also, pro-
jections of any evaluation of effectiveness to future periods are
subject to the risk that controls may become inadequate because
of changes in conditions, or that the degree of compliance with the
policies or procedures may deteriorate.
PricewaterhouseCoopers LLP
New York, New York
February 23, 2016

76 Consolidated Statement of Earnings
International Business Machines Corporation and Subsidiary Companies
($ in millions except per share amounts)
For the year ended December 31: Notes 2015 2014 2013
Revenue
Services $49,911 $55,673 $57,655
Sales 29,967 35,063 38,666
Financing 1,864 2,057 2,047
Total revenue T 81,741 92,793 98,367
Cost
Services 33,126 36,034 37,564
Sales 6,920 9,312 11,009
Financing 1,011 1,040 1,110
Total cost 41,057 46,386 49,683
Gross profi t 40,684 46,407 48,684
Expense and other (income)
Selling, general and administrative 20,430 23,180 23,451
Research, development and engineering O 5,247 5,437 5,743
Intellectual property and custom development income (682) (742) (822)
Other (income) and expense (724) (1,938) (333)
Interest expense D&J 468 484 402
Total expense and other (income) 24,740 26,421 28,440
Income from continuing operations before income taxes 15,945 19,986 20,244
Provision for income taxes N 2,581 4,234 3,363
Income from continuing operations 13,364 15,751 16,881
Loss from discontinued operations, net of tax C (174) (3,729) (398)
Net income $13,190 $12,022 $16,483
Earnings/(loss) per share of common stock
Assuming dilution
Continuing operations P $ 13.60 $ 15.59 $ 15.30
Discontinued operations P (0.18) (3.69) (0.36)
Total P $ 13.42 $ 11.90 $ 14.94
Basic
Continuing operations P $ 13.66 $ 15.68 $ 15.42
Discontinued operations P (0.18) (3.71) (0.36)
Total P $ 13.48 $ 11.97 $ 15.06
Weighted-average number of common shares outstanding
Assuming dilution 982,700,267 1,010,000,480 1,103,042,156
Basic 978,744,523 1,004,272,584 1,094,486,604
Amounts may not add due to rounding.
The accompanying notes on pages 82 through 146 are an integral part of the financial statements.

77Consolidated Statement of Comprehensive Income
International Business Machines Corporation and Subsidiary Companies
($ in millions)
For the year ended December 31: Notes 2015 2014 2013
Net income $13,190 $12,022 $16,483
Other comprehensive income/(loss), before tax
Foreign currency translation adjustments L (1,379) (1,636) (1,335)
Net changes related to available-for-sale securities L
Unrealized gains/(losses) arising during the period (54) (29) (4)
Reclassifi cation of (gains)/losses to net income 86 5 (8)
Subsequent changes in previously impaired securities arising during the period — — 4
Total net changes related to available-for-sale securities 32 (24) (8)
Unrealized gains/(losses) on cash fl ow hedges L
Unrealized gains/(losses) arising during the period 618 958 43
Reclassifi cation of (gains)/losses to net income (1,072) (97) (166)
Total unrealized gains/(losses) on cash fl ow hedges (454) 861 (123)
Retirement-related benefi t plans L
Prior service costs/(credits) 6 1 16
Net (losses)/gains arising during the period (2,963) (9,799) 5,369
Curtailments and settlements 33 24 (3)
Amortization of prior service (credits)/costs (100) (114) (114)
Amortization of net (gains)/losses 3,304 2,531 3,499
Total retirement-related benefi t plans 279 (7,357) 8,767
Other comprehensive income/(loss), before tax L (1,523) (8,156) 7,301
Income tax (expense)/benefi t related to items of other comprehensive income L (208) 1,883 (3,144)
Other comprehensive income/(loss) L (1,731) (6,274) 4,157
Total comprehensive income $11,459 $ 5,748 $20,641
Amounts may not add due to rounding.
The accompanying notes on pages 82 through 146 are an integral part of the financial statements.
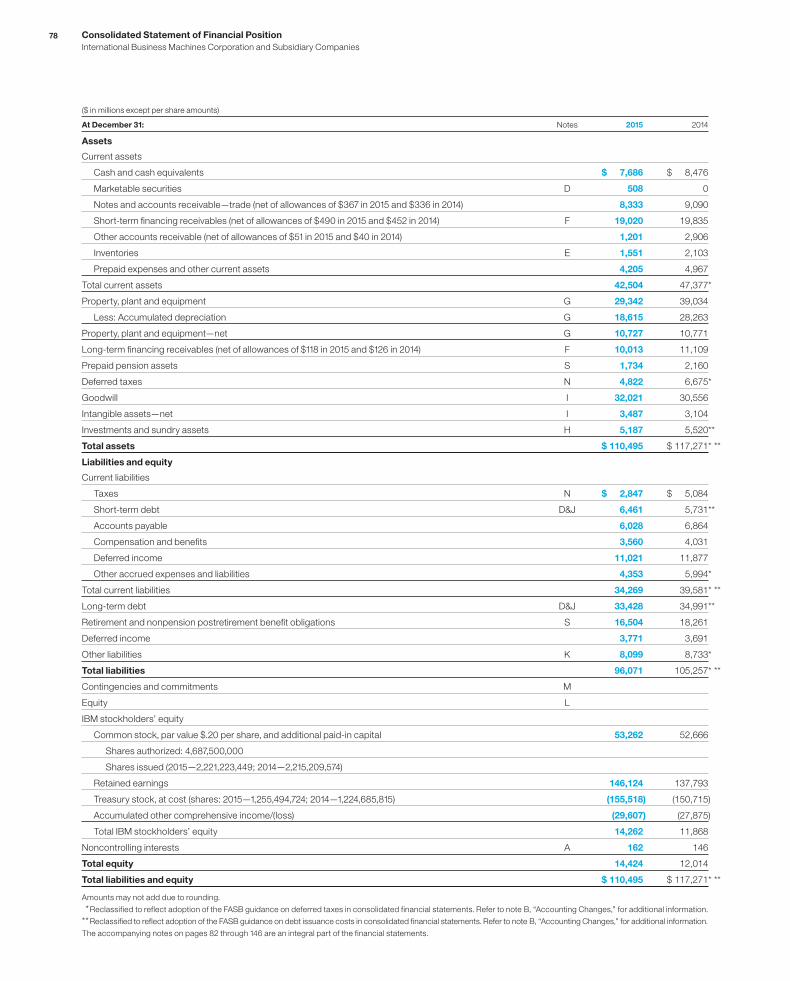
78 Consolidated Statement of Financial Position
International Business Machines Corporation and Subsidiary Companies
($ in millions except per share amounts)
At December 31: Notes 2015 2014
Assets
Current assets
Cash and cash equivalents $ 7,686 $ 8,476
Marketable securities D 508 0
Notes and accounts receivable—trade (net of allowances of $367 in 2015 and $336 in 2014) 8,333 9,090
Short-term fi nancing receivables (net of allowances of $490 in 2015 and $452 in 2014) F 19,020 19,835
Other accounts receivable (net of allowances of $51 in 2015 and $40 in 2014) 1,201 2,906
Inventories E 1,551 2,103
Prepaid expenses and other current assets 4,205 4,967
Total current assets 42,504 47,377*
Property, plant and equipment G 29,342 39,034
Less: Accumulated depreciation G 18,615 28,263
Property, plant and equipment—net G 10,727 10,771
Long-term fi nancing receivables (net of allowances of $118 in 2015 and $126 in 2014) F 10,013 11,109
Prepaid pension assets S 1,734 2,160
Deferred taxes N 4,822 6,675*
Goodwill I 32,021 30,556
Intangible assets—net I 3,487 3,104
Investments and sundry assets H 5,187 5,520**
Total assets $ 110,495 $ 117,271 * **
Liabilities and equity
Current liabilities
Taxes N $ 2,847 $ 5,084
Short-term debt D&J 6,461 5,731**
Accounts payable 6,028 6,864
Compensation and benefi ts 3,560 4,031
Deferred income 11,021 11,877
Other accrued expenses and liabilities 4,353 5,994*
Total current liabilities 34,269 39,581* **
Long-term debt D&J 33,428 34,991**
Retirement and nonpension postretirement benefi t obligations S 16,504 18,261
Deferred income 3,771 3,691
Other liabilities K 8,099 8,733*
Total liabilities 96,071 105,257* **
Contingencies and commitments M
Equity L
IBM stockholders’ equity
Common stock, par value $.20 per share, and additional paid-in capital 53,262 52,666
Shares authorized: 4,687,500,000
Shares issued (2015—2,221,223,449; 2014—2,215,209,574)
Retained earnings 146,124 137,793
Treasury stock, at cost (shares: 2015—1,255,494,724; 2014—1,224,685,815) (155,518) (150,715)
Accumulated other comprehensive income/(loss) (29,607) (27,875)
Total IBM stockholders’ equity 14,262 11,868
Noncontrolling interests A 162 146
Total equity 14,424 12,014
Total liabilities and equity $ 110,495 $ 117,271 * **
Amounts may not add due to rounding.
* Reclassified to reflect adoption of the FASB guidance on deferred taxes in consolidated financial statements. Refer to note B, “Accounting Changes,” for additional information.
** Reclassified to reflect adoption of the FASB guidance on debt issuance costs in consolidated financial statements. Refer to note B, “Accounting Changes,” for additional information.
The accompanying notes on pages 82 through 146 are an integral part of the financial statements.

79Consolidated Statement of Cash Flows
International Business Machines Corporation and Subsidiary Companies
($ in millions)
For the year ended December 31: 2015 2014 2013
Cash fl ows from operating activities
Net income $13,190 $ 12,022 $ 16,483
Adjustments to reconcile net income
to cash provided by operating activities
Depreciation 2,662 3,145 3,327
Amortization of intangibles 1,193 1,347 1,351
Stock-based compensation 468 512 614
Deferred taxes 1,387 (237) (1,610)
Net (gain)/loss on asset sales and other 481 (1,535) (236)
Loss on microelectronics business disposal 71 3,381 —
Change in operating assets and liabilities, net of acquisitions/divestitures
Receivables (including fi nancing receivables) 812 1,270 (1,407)
Retirement related (22) (655) 294
Inventories 133 (39) (57)
Other assets/other liabilities (3,448) (1,886) (747)
Accounts payable 81 (456) (529)
Net cash provided by operating activities 17,008 16,868 17,485
Cash fl ows from investing activities
Payments for property, plant and equipment (3,579) (3,740) (3,623)
Proceeds from disposition of property, plant and equipment 370 404 372
Investment in software (572) (443) (517)
Purchases of marketable securities and other investments (3,073) (2,338) (4,608)
Proceeds from disposition of marketable securities and other investments 2,842 2,493 4,873
Non-operating fi nance receivables—net (398) (1,078) (1,063)
Acquisition of businesses, net of cash acquired (3,349) (656) (3,056)
Divestiture of businesses, net of cash transferred (401) 2,357 297
Net cash used in investing activities (8,159) (3,001) (7,326)
Cash fl ows from fi nancing activities
Proceeds from new debt 5,540 8,180 16,353
Payments to settle debt (5,622) (4,644) (10,013)
Short-term borrowings/(repayments) less than 90 days—net 101 (1,753) 621
Common stock repurchases (4,609) (13,679) (13,859)
Common stock transactions—other 322 709 1,074
Cash dividends paid (4,897) (4,265) (4,058)
Net cash used in fi nancing activities (9,166) (15,452) (9,883)
Effect of exchange rate changes on cash and cash equivalents (473) (655) 28
Net change in cash and cash equivalents (790) (2,240) 304
Cash and cash equivalents at January 1 8,476 10,716 10,412
Cash and cash equivalents at December 31 $ 7,686 $ 8,476 $ 10,716
Supplemental data
Income taxes paid—net of refunds received $ 2,657 $ 5,748 $ 4,024
Interest paid on debt $ 995 $ 1,061 $ 982
Capital lease obligations $ 4 $ 2 $ 14
Amounts may not add due to rounding.
The accompanying notes on pages 82 through 146 are an integral part of the financial statements.
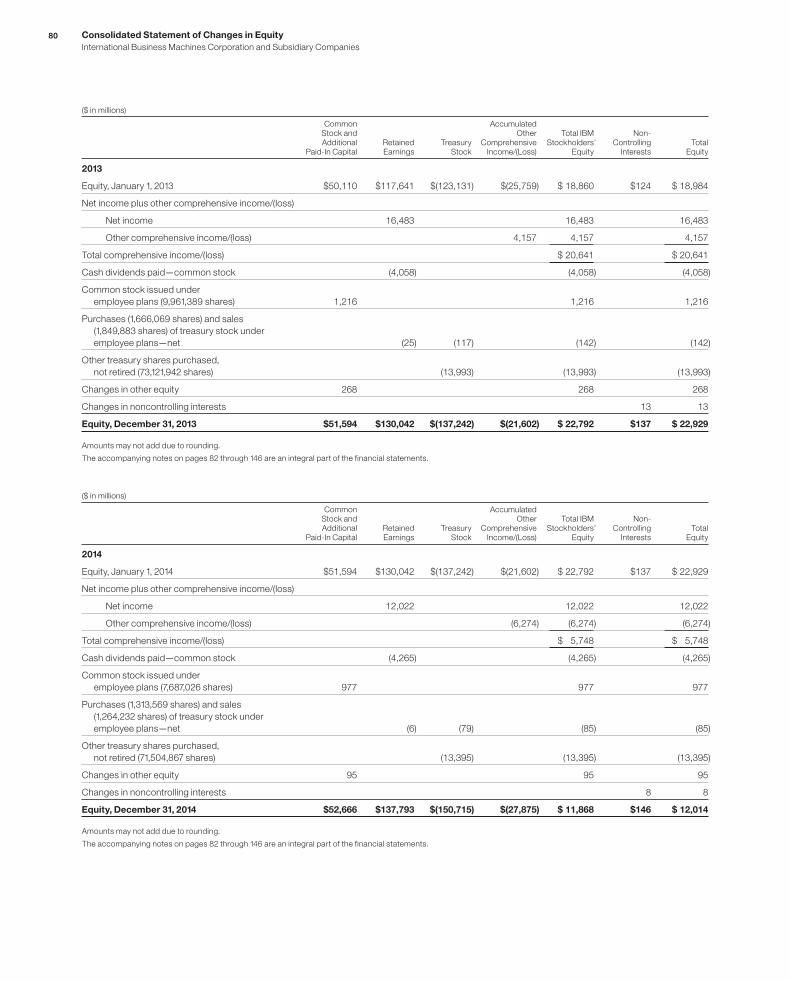
80 Consolidated Statement of Changes in Equity
International Business Machines Corporation and Subsidiary Companies
($ in millions)
Common Stock and Additional
Paid-In CapitalRetained Earnings
Treasury Stock
Accumulated Other
Comprehensive Income/(Loss)
Total IBM Stockholders
Equity’
Non-Controlling
InterestsTotal
Equity
2013
Equity, January 1, 2013 $50,110 $117,641 $(123,131) $(25,759) $ 18,860 $124 $ 18,984
Net income plus other comprehensive income/(loss)
Net income 16,483 16,483 16,483
Other comprehensive income/(loss) 4,157 4,157 4,157
Total comprehensive income/(loss) $ 20,641 $ 20,641
Cash dividends paid—common stock (4,058) (4,058) (4,058)
Common stock issued under
employee plans (9,961,389 shares) 1,216 1,216 1,216
Purchases (1,666,069 shares) and sales
(1,849,883 shares) of treasury stock under
employee plans—net (25) (117) (142) (142)
Other treasury shares purchased,
not retired (73,121,942 shares) (13,993) (13,993) (13,993)
Changes in other equity 268 268 268
Changes in noncontrolling interests 13 13
Equity, December 31, 2013 $51,594 $130,042 $(137,242) $(21,602) $ 22,792 $137 $ 22,929
Amounts may not add due to rounding.
The accompanying notes on pages 82 through 146 are an integral part of the financial statements.
($ in millions)
Common Stock and Additional
Paid-In CapitalRetained Earnings
Treasury Stock
Accumulated Other
Comprehensive Income/(Loss)
Total IBM Stockholders
Equity’
Non-Controlling
InterestsTotal
Equity
2014
Equity, January 1, 2014 $51,594 $130,042 $(137,242) $(21,602) $ 22,792 $137 $ 22,929
Net income plus other comprehensive income/(loss)
Net income 12,022 12,022 12,022
Other comprehensive income/(loss) (6,274) (6,274) (6,274)
Total comprehensive income/(loss) $ 5,748 $ 5,748
Cash dividends paid—common stock (4,265) (4,265) (4,265)
Common stock issued under
employee plans (7,687,026 shares) 977 977 977
Purchases (1,313,569 shares) and sales
(1,264,232 shares) of treasury stock under
employee plans—net (6) (79) (85) (85)
Other treasury shares purchased,
not retired (71,504,867 shares) (13,395) (13,395) (13,395)
Changes in other equity 95 95 95
Changes in noncontrolling interests 8 8
Equity, December 31, 2014 $52,666 $137,793 $(150,715) $(27,875) $ 11,868 $146 $ 12,014
Amounts may not add due to rounding.
The accompanying notes on pages 82 through 146 are an integral part of the financial statements.
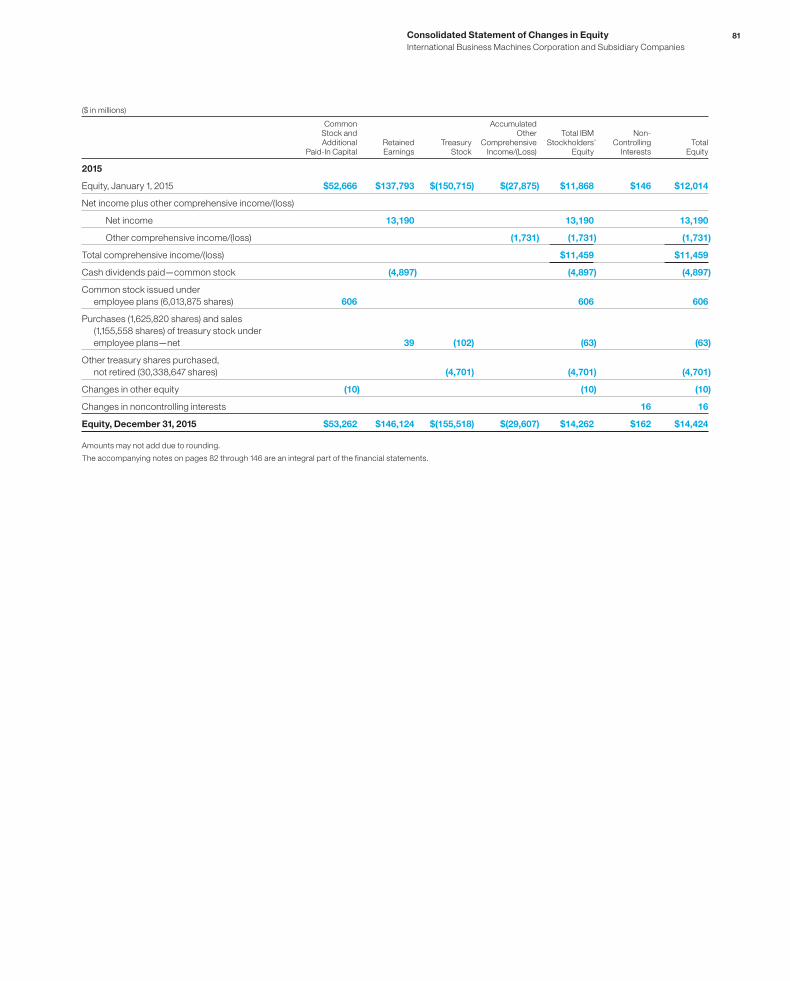
81Consolidated Statement of Changes in Equity
International Business Machines Corporation and Subsidiary Companies
($ in millions)
Common Stock and Additional
Paid-In CapitalRetained Earnings
Treasury Stock
Accumulated Other
Comprehensive Income/(Loss)
Total IBM Stockholders
Equity’
Non-Controlling
InterestsTotal
Equity
2015
Equity, January 1, 2015 $52,666 $137,793 $(150,715) $(27,875) $11,868 $146 $12,014
Net income plus other comprehensive income/(loss)
Net income 13,190 13,190 13,190
Other comprehensive income/(loss) (1,731) (1,731) (1,731)
Total comprehensive income/(loss) $11,459 $11,459
Cash dividends paid—common stock (4,897) (4,897) (4,897)
Common stock issued under
employee plans (6,013,875 shares) 606 606 606
Purchases (1,625,820 shares) and sales
(1,155,558 shares) of treasury stock under
employee plans—net 39 (102) (63) (63)
Other treasury shares purchased,
not retired (30,338,647 shares) (4,701) (4,701) (4,701)
Changes in other equity (10) (10) (10)
Changes in noncontrolling interests 16 16
Equity, December 31, 2015 $53,262 $146,124 $(155,518) $(29,607) $14,262 $162 $14,424
Amounts may not add due to rounding.
The accompanying notes on pages 82 through 146 are an integral part of the financial statements.

Notes to Consolidated Financial Statements
International Business Machines Corporation and Subsidiary Companies
82
NOTE A.
SIGNIFICANT ACCOUNTING POLICIES
Basis of PresentationThe accompanying Consolidated Financial Statements and
footnotes of the International Business Machines Corporation
(IBM or the company) have been prepared in accordance with
accounting principles generally accepted in the United States of
America (GAAP).
Within the financial statements and tables presented, cer-
tain columns and rows may not add due to the use of rounded
numbers for disclosure purposes. Percentages presented are cal-
culated from the underlying whole-dollar amounts. Certain prior
year amounts have been reclassified to conform to the current year
presentation. This is annotated where applicable.
On October 20, 2014, the company announced a definitive
agreement to divest its Microelectronics business and manu-
facturing operations to GLOBALFOUNDRIES. The assets and
liabilities of the Microelectronics business were reported as held
for sale at December 31, 2014 and the operating results of the
Microelectronics business have been reported as discontinued
operations. The transaction closed on July 1, 2015. Prior periods
have been reclassified to conform to this presentation to allow for
a meaningful comparison of continuing operations. Refer to note C,
“Acquisitions/Divestitures,” for additional information on the trans-
action. In addition, in 2015, the company renamed its Systems &
Technology segment to Systems Hardware and its System z brand
to z Systems.
Noncontrolling interest amounts of $8 million, $6 million and
$7 million, net of tax, for the years ended December 31, 2015, 2014
and 2013, respectively, are included in the Consolidated Statement
of Earnings within the other (income) and expense line item.
Principles of ConsolidationThe Consolidated Financial Statements include the accounts of
IBM and its controlled subsidiaries, which are primarily majority
owned. Any noncontrolling interest in the equity of a subsidiary
is reported in Equity in the Consolidated Statement of Financial
Position. Net income and losses attributable to the noncontrolling
interest is reported as described above in the Consolidated State-
ment of Earnings. The accounts of variable interest entities (VIEs)
are included in the Consolidated Financial Statements, if required.
Investments in business entities in which the company does not
have control, but has the ability to exercise significant influence
over operating and financial policies, are accounted for using the
equity method and the company’s proportionate share of income
or loss is recorded in other (income) and expense. The account-
ing policy for other investments in equity securities is on page 90
within “Marketable Securities.” Equity investments in non-publicly
traded entities are primarily accounted for using the cost method.
All intercompany transactions and accounts have been eliminated
in consolidation.
Use of EstimatesThe preparation of financial statements in conformity with GAAP
requires management to make estimates and assumptions that
affect the amounts of assets, liabilities, revenue, costs, expenses
and other comprehensive income/(loss) (OCI) that are reported
in the Consolidated Financial Statements and accompanying
disclosures. These estimates are based on management’s best
knowledge of current events, historical experience, actions that
the company may undertake in the future and on various other
assumptions that are believed to be reasonable under the circum-
stances. As a result, actual results may be different from these
estimates. See “Critical Accounting Estimates” on pages 64 to 67
for a discussion of the company’s critical accounting estimates.
RevenueThe company recognizes revenue when it is realized or realizable
and earned. The company considers revenue realized or realizable
and earned when it has persuasive evidence of an arrangement,
delivery has occurred, the sales price is fixed or determinable and
collectibility is reasonably assured. Delivery does not occur until
products have been shipped or services have been provided to
the client, risk of loss has transferred to the client, and either client
acceptance has been obtained, client acceptance provisions have
lapsed, or the company has objective evidence that the criteria
specified in the client acceptance provisions have been satisfied.
The sales price is not considered to be fixed or determinable until
all contingencies related to the sale have been resolved.
The company recognizes revenue on sales to solution pro-
viders, resellers and distributors (herein referred to as “resellers”)
when the reseller has: economic substance apart from the com-
pany, credit risk, title and risk of loss to the inventory; and, the fee to
the company is not contingent upon resale or payment by the end
user, the company has no further obligations related to bringing
about resale or delivery and all other revenue recognition criteria
have been met.
The company reduces revenue for estimated client returns,
stock rotation, price protection, rebates and other similar allow-
ances. (See Schedule II, “Valuation and Qualifying Accounts and
Reserves” included in the company’s Annual Report on Form
10-K). Revenue is recognized only if these estimates can be rea-
sonably and reliably determined. The company bases its estimates
on historical results taking into consideration the type of client,
the type of transaction and the specifics of each arrangement.
Payments made under cooperative marketing programs are rec-
ognized as an expense only if the company receives from the client
an identifiable benefit sufficiently separable from the product sale
whose fair value can be reasonably and reliably estimated. If the
company does not receive an identifiable benefit sufficiently sep-
arable from the product sale whose fair value can be reasonably
estimated, such payments are recorded as a reduction of revenue.
Revenue from sales of third-party vendor products or services
is recorded net of costs when the company is acting as an agent
between the client and the vendor, and gross when the company
is a principal to the transaction. Several factors are considered
Notes to Consolidated Financial Statements
International Business Machines Corporation and Subsidiary Companies
83
to determine whether the company is an agent or principal, most
notably whether the company is the primary obligor to the client, or
has inventory risk. Consideration is also given to whether the com-
pany adds meaningful value to the vendor’s product or service,
was involved in the selection of the vendor’s product or service,
has latitude in establishing the sales price or has credit risk.
The company reports revenue net of any revenue-based
taxes assessed by governmental authorities that are imposed on
and concurrent with specific revenue-producing transactions. In
addition to the aforementioned general policies, the following are
the specific revenue recognition policies for multiple-deliverable
arrangements and for each major category of revenue.
Multiple-Deliverable Arrangements
The company enters into revenue arrangements that may con-
sist of multiple deliverables of its products and services based
on the needs of its clients. These arrangements may include
any combination of services, software, hardware and/or financ-
ing. For example, a client may purchase a server that includes
operating system software. In addition, the arrangement may
include post-contract support for the software and a contract
for post-warranty maintenance service for the hardware. These
types of arrangements can also include financing provided by the
company. These arrangements consist of multiple deliverables,
with the hardware and software delivered in one reporting period
and the software support and hardware maintenance services
delivered across multiple reporting periods. In another example,
a client may outsource the running of its datacenter operations to
the company on a long-term, multiple-year basis and periodically
purchase servers and/or software products from the company to
upgrade or expand its facility. The outsourcing services are pro-
vided on a continuous basis across multiple reporting periods and
the hardware and software products are delivered in one reporting
period. To the extent that a deliverable in a multiple-deliverable
arrangement is subject to specific accounting guidance that deliv-
erable is accounted for in accordance with such specific guidance.
Examples of such arrangements may include leased hardware
which is subject to specific leasing guidance or software which
is subject to specific software revenue recognition guidance on
whether and/or how to separate multiple-deliverable arrange-
ments into separate units of accounting (separability) and how to
allocate the arrangement consideration among those separate
units of accounting (allocation). For all other deliverables in multi-
ple-deliverable arrangements, the guidance below is applied for
separability and allocation. A multiple-deliverable arrangement is
separated into more than one unit of accounting if the following
criteria are met:
• The delivered item(s) has value to the client on a stand-alone
basis; and
• If the arrangement includes a general right of return relative
to the delivered item(s), delivery or performance of the
undelivered item(s) is considered probable and substantially
in the control of the company.
If these criteria are not met, the arrangement is accounted for as
one unit of accounting which would result in revenue being rec-
ognized ratably over the contract term or being deferred until the
earlier of when such criteria are met or when the last undelivered
element is delivered. If these criteria are met for each element
and there is a relative selling price for all units of accounting in an
arrangement, the arrangement consideration is allocated to the
separate units of accounting based on each unit’s relative selling
price. The following revenue policies are then applied to each unit
of accounting, as applicable.
Revenue from the company’s cloud, analytics, mobile, secu-
rity, and cognitive offerings follow the specific revenue recognition
policies for multiple-deliverable arrangements and for each major
category of revenue depending on the type of offering which can
be comprised of services, hardware and/or software.
Services
The company’s primary services offerings include information
technology (IT) datacenter and business process outsourc-
ing, application management services, consulting and systems
integration, technology infrastructure and system maintenance,
hosting and the design and development of complex IT systems to
a client’s specifications (design and build). Many of these services
can be delivered entirely or partially through the cloud. These ser-
vices are provided on a time-and-material basis, as a fixed-price
contract or as a fixed-price per measure of output contract and
the contract terms range from less than one year to over 10 years.
Revenue from IT datacenter and business process outsourcing
contracts is recognized in the period the services are provided
using either an objective measure of output or on a straight-line
basis over the term of the contract. Under the output method, the
amount of revenue recognized is based on the services delivered
in the period.
Revenue from application management services, technology
infrastructure and system maintenance and hosting contracts is
recognized on a straight-line basis over the terms of the contracts.
Revenue from time-and-material contracts is recognized as labor
hours are delivered and direct expenses are incurred. Revenue
related to extended warranty and product maintenance contracts
is recognized on a straight-line basis over the delivery period.
Revenue from fixed-price design and build contracts is recog-
nized under the percentage-of-completion (POC) method. Under
the POC method, revenue is recognized based on the labor costs
incurred to date as a percentage of the total estimated labor costs
to fulfill the contract. If circumstances arise that change the original
estimates of revenues, costs, or extent of progress toward com-
pletion, revisions to the estimates are made. These revisions may
result in increases or decreases in estimated revenues or costs,
and such revisions are reflected in income in the period in which
the circumstances that gave rise to the revision become known
by the company.

Notes to Consolidated Financial Statements
International Business Machines Corporation and Subsidiary Companies
84
The company performs ongoing profitability analyses of its
services contracts accounted for under the POC method in order
to determine whether the latest estimates of revenues, costs and
profits require updating. If at any time these estimates indicate that
the contract will be unprofitable, the entire estimated loss for the
remainder of the contract is recorded immediately. For non-POC
method services contracts, any losses are recorded as incurred.
In some services contracts, the company bills the client prior
to recognizing revenue from performing the services. Deferred
income of $6,039 million and $6,352 million at December 31, 2015
and 2014, respectively, is included in the Consolidated Statement
of Financial Position. In other services contracts, the company
performs the services prior to billing the client. Unbilled accounts
receivable of $1,630 million and $1,833 million at December 31, 2015
and 2014, respectively, is included in notes and accounts receiv-
able-trade in the Consolidated Statement of Financial Position.
Billings usually occur in the month after the company performs
the services or in accordance with specific contractual provisions.
Unbilled receivables are expected to be billed within four months.
Hardware
The company’s hardware offerings include the sale or lease of
system servers, storage solutions and the sale of semiconductors.
The company also offers installation services for its more complex
hardware products.
Revenue from hardware sales and sales-type leases is rec-
ognized when risk of loss has transferred to the client and there
are no unfulfilled company obligations that affect the client’s final
acceptance of the arrangement. Any cost of standard warranties
and remaining obligations that are inconsequential or perfunc-
tory are accrued when the corresponding revenue is recognized.
Revenue from rentals and operating leases is recognized on a
straight-line basis over the term of the rental or lease.
Software
Revenue from perpetual (one-time charge) license software is
recognized at the inception of the license term if all revenue rec-
ognition criteria have been met. Revenue from term (recurring
license charge) license software is recognized on a straight-line
basis over the period that the client is entitled to use the license.
Revenue from post-contract support, which may include unspec-
ified upgrades on a when-and-if-available basis, is recognized
on a straight-line basis over the period such items are delivered.
Revenue from software hosting or Software-as-a-Service arrange-
ments is recognized as the service is delivered, generally on a
straight-line basis, over the longer of the term of the arrangement
or the expected period of the customer relationship. In software
hosting arrangements, the rights provided to the customer (e.g.,
ownership of a license, contract termination provisions and the
feasibility of the customer to operate the software) are consid-
ered in determining whether the arrangement includes a license.
In arrangements which include a software license, the associated
revenue is recognized according to whether the license is perpet-
ual or term, subject to the guidance above.
In multiple-deliverable arrangements that include software
that is more than incidental to the products or services as a
whole (software multiple-deliverable arrangements), software
and software-related elements are accounted for in accordance
with software revenue recognition guidance. Software-related
elements include software products and services for which a soft-
ware deliverable is essential to its functionality. Tangible products
containing software components and non-software components
that function together to deliver the tangible product’s essential
functionality are not within the scope of software revenue recog-
nition guidance and are accounted for based on other applicable
revenue recognition guidance.
A software multiple-deliverable arrangement is separated
into more than one unit of accounting if all of the following criteria
are met:
• The functionality of the delivered element(s) is not dependent
on the undelivered element(s);
• There is vendor-specific objective evidence (VSOE) of fair
value of the undelivered element(s). VSOE of fair value is based
on the price charged when the deliverable is sold separately
by the company on a regular basis and not as part of the
multiple-deliverable arrangement; and
• Delivery of the delivered element(s) represents the culmina-
tion of the earnings process for that element(s).
If any one of these criteria is not met, the arrangement is accounted
for as one unit of accounting which would result in revenue being
recognized ratably over the contract term or being deferred until
the earlier of when such criteria are met or when the last undeliv-
ered element is delivered. If these criteria are met for each element
and there is VSOE of fair value for all units of accounting in an
arrangement, the arrangement consideration is allocated to the
separate units of accounting based on each unit’s relative VSOE
of fair value. There may be cases, however, in which there is VSOE
of fair value of the undelivered item(s) but no such evidence for
the delivered item(s). In these cases, the residual method is used
to allocate the arrangement consideration. Under the residual
method, the amount of consideration allocated to the delivered
item(s) equals the total arrangement consideration less the aggre-
gate VSOE of fair value of the undelivered elements.
The company’s multiple-deliverable arrangements may have
a stand-alone software deliverable that is subject to the existing
software revenue recognition guidance. The revenue for these
multiple-deliverable arrangements is allocated to the software
deliverable and the non-software deliverables based on the rela-
tive selling prices of all of the deliverables in the arrangement using
the hierarchy: VSOE, third-party evidence (TPE) or best estimate of
selling price (BESP). In circumstances where the company cannot
determine VSOE or TPE of the selling price for all of the delivera-
bles in the arrangement, including the software deliverable, BESP
is used for the purpose of performing this allocation.

Notes to Consolidated Financial Statements
International Business Machines Corporation and Subsidiary Companies
85
Financing
Financing income attributable to sales-type leases, direct financ-
ing leases and loans is recognized on the accrual basis using the
effective interest method. Operating lease income is recognized
on a straight-line basis over the term of the lease.
Best Estimate of Selling Price
In certain instances, the company is not able to establish VSOE
for all elements in a multiple-deliverable arrangement. When VSOE
cannot be established, the company attempts to establish the sell-
ing price of each element based on TPE. TPE is determined based
on competitor prices for similar deliverables when sold separately.
When the company is unable to establish selling price using
VSOE or TPE, the company uses BESP in its allocation of arrange-
ment consideration. The objective of BESP is to determine the
price at which the company would transact a sale if the product or
service were sold on a stand-alone basis. BESP may be used, for
example, if a product is not sold on a stand-alone basis or when
the company sells a new product, for which VSOE and TPE does
not yet exist, in a multiple-deliverable arrangement prior to selling
the new product on a stand-alone basis.
The company determines BESP by considering multiple factors
including, but not limited to, overall market conditions, including
geographic or regional specific factors, competitive positioning,
competitor actions, internal costs, profit objectives and pricing
practices. The determination of BESP is a formal process that
includes review and approval by the company’s management.
In addition, the company regularly reviews VSOE and TPE for its
products and services, in addition to BESP.
Services CostsRecurring operating costs for services contracts, including costs
related to bid and proposal activities, are recognized as incurred.
For fixed-price design and build contracts, the costs of external
hardware and software accounted for under the POC method
are deferred and recognized based on the labor costs incurred
to date, as a percentage of the total estimated labor costs to fulfill
the contract. Certain eligible, nonrecurring costs incurred in the
initial phases of outsourcing contracts are deferred and subse-
quently amortized. These costs consist of transition and setup
costs related to the installation of systems and processes and
are amortized on a straight-line basis over the expected period
of benefit, not to exceed the term of the contract. Additionally,
fixed assets associated with outsourcing contracts are capital-
ized and depreciated on a straight-line basis over the expected
useful life of the asset. If an asset is contract specific, then the
depreciation period is the shorter of the useful life of the asset
or the contract term. Amounts paid to clients in excess of the fair
value of acquired assets used in outsourcing arrangements are
deferred and amortized on a straight-line basis as a reduction of
revenue over the expected period of benefit not to exceed the
term of the contract. The company performs periodic reviews to
assess the recoverability of deferred contract transition and setup
costs. This review is done by comparing the estimated minimum
remaining undiscounted cash flows of a contract to the unamor-
tized contract costs. If such minimum undiscounted cash flows
are not sufficient to recover the unamortized costs, an impairment
loss is recognized.
Deferred services transition and setup costs were $2,144 million
and $2,230 million at December 31, 2015 and 2014, respectively.
Amortization of deferred services transition and setup costs
was estimated at December 31, 2015 to be $653 million in 2016,
$522 million in 2017, $366 million in 2018, $254 million in 2019 and
$349 million thereafter.
Deferred amounts paid to clients in excess of the fair value of
acquired assets used in outsourcing arrangements were $184 mil-
lion and $64 million at December 31, 2015 and 2014, respectively.
Amortization of deferred amounts paid to clients in excess of the
fair value of acquired assets is recorded as an offset of revenue
and was estimated at December 31, 2015 to be $53 million in 2016,
$41 million in 2017, $39 million in 2018, $21 million in 2019 and
$30 million thereafter. In situations in which an outsourcing con-
tract is terminated, the terms of the contract may require the client
to reimburse the company for the recovery of unbilled accounts
receivable, unamortized deferred costs incurred to purchase
specific assets utilized in the delivery of services and to pay any
additional costs incurred by the company to transition the services.
Software CostsCosts that are related to the conceptual formulation and design of
licensed software programs are expensed as incurred to research,
development and engineering expense; costs that are incurred
to produce the finished product after technological feasibility has
been established are capitalized as an intangible asset. Capital-
ized amounts are amortized on a straight-line basis over periods
ranging up to three years and are recorded in software cost within
cost of sales. The company performs periodic reviews to ensure
that unamortized program costs remain recoverable from future
revenue. Costs to support or service licensed programs are
charged to software cost within cost of sales as incurred.
The company capitalizes certain costs that are incurred to pur-
chase or to create and implement internal-use software programs,
including software coding, installation, testing and certain data
conversions. These capitalized costs are amortized on a straight-
line basis over periods ranging up to two years and are recorded
in selling, general and administrative expense.
Product WarrantiesThe company offers warranties for its hardware products that
generally range up to three years, with the majority being either
one or three years. Estimated costs for warranty terms standard
to the deliverable are recognized when revenue is recorded for
the related deliverable. The company estimates its warranty costs
standard to the deliverable based on historical warranty claim
experience and estimates of future spending, and applies this
estimate to the revenue stream for products under warranty. Esti-
mated future costs for warranties applicable to revenue recognized
in the current period are charged to cost of sales. The warranty

Notes to Consolidated Financial Statements
International Business Machines Corporation and Subsidiary Companies
86
liability is reviewed quarterly to verify that it properly reflects the
remaining obligation based on the anticipated expenditures over
the balance of the obligation period. Adjustments are made when
actual warranty claim experience differs from estimates. Costs
from fixed-price support or maintenance contracts, including
extended warranty contracts, are recognized as incurred.
Revenue from extended warranty contracts is initially recorded
as deferred income and subsequently recognized on a straight-
line basis over the delivery period. Changes in deferred income for
extended warranty contracts, and in the warranty liability for stan-
dard warranties, which are included in other accrued expenses
and liabilities and other liabilities in the Consolidated Statement
of Financial Position, are presented in the following tables:
Standard Warranty Liability
($ in millions)
2015 2014
Balance at January 1 $ 197 $ 376
Current period accruals 173 240
Accrual adjustments to refl ect experience* 7 (120)
Charges incurred (196) (298)
Balance at December 31 $ 181 $ 197
* Includes an adjustment of $(125 million) in 2014 related to the System x business
divestiture.
Extended Warranty Liability (Deferred Income)
($ in millions)
2015 2014
Balance at January 1 $ 536 $ 579
Revenue deferred for new extended
warranty contracts 286 298
Amortization of deferred revenue* (253) (316)
Other** (31) (24)
Balance at December 31 $ 538 $ 536
Current portion $ 238 $ 254
Noncurrent portion $ 300 $ 282
* Includes an adjustment of $(21 million) in 2014 related to the System x business
divestiture.
** Other consists primarily of foreign currency translation adjustments.
Shipping and HandlingCosts related to shipping and handling are recognized as incurred
and included in cost in the Consolidated Statement of Earnings.
Expense and Other Income
Selling, General and Administrative
Selling, general and administrative (SG&A) expense is charged
to income as incurred. Expenses of promoting and selling prod-
ucts and services are classified as selling expense and include
such items as compensation, advertising, sales commissions and
travel. General and administrative expense includes such items
as compensation, legal costs, office supplies, non-income taxes,
insurance and office rental. In addition, general and administrative
expense includes other operating items such as an allowance for
credit losses, workforce rebalancing charges for contractually obli-
gated payments to employees terminated in the ongoing course
of business, acquisition costs related to business combinations,
amortization of certain intangible assets and environmental reme-
diation costs.
Advertising and Promotional Expense
The company expenses advertising and promotional costs as
incurred. Cooperative advertising reimbursements from ven-
dors are recorded net of advertising and promotional expense
in the period in which the related advertising and promotional
expense is incurred. Advertising and promotional expense, which
includes media, agency and promotional expense, was $1,290
million, $1,307 million and $1,294 million in 2015, 2014 and 2013,
respectively, and is recorded in SG&A expense in the Consolidated
Statement of Earnings.
Research, Development and Engineering
Research, development and engineering (RD&E) costs are
expensed as incurred. Software costs that are incurred to pro-
duce the finished product after technological feasibility has been
established are capitalized as an intangible asset.
Intellectual Property and Custom Development Income
The company licenses and sells the rights to certain of its intel-
lectual property (IP) including internally developed patents, trade
secrets and technological know-how. Certain IP transactions to
third parties are licensing/royalty-based and others are transac-
tion-based sales and other transfers. Licensing/royalty-based
fees involve transfers in which the company earns the income
over time, or the amount of income is not fixed or determinable
until the licensee sells future related products (i.e., variable roy-
alty, based upon licensee’s revenue). Sales and other transfers
typically include transfers of IP whereby the company has fulfilled
its obligations and the fee received is fixed or determinable at
the transfer date. The company also enters into cross-licensing
arrangements of patents, and income from these arrangements
is recorded when earned. In addition, the company earns income
from certain custom development projects for strategic technology
partners and specific clients. The company records the income
from these projects when the fee is realized and earned, is not
refundable and is not dependent upon the success of the project.
Other (Income) and Expense
Other (income) and expense includes interest income (other than
from Global Financing external transactions), gains and losses on
certain derivative instruments, gains and losses from securities
and other investments, gains and losses from certain real estate
transactions, foreign currency transaction gains and losses, gains
and losses from the sale of businesses, other than reported as
discontinued operations, and amounts related to accretion of asset
retirement obligations.

Notes to Consolidated Financial Statements
International Business Machines Corporation and Subsidiary Companies
87
Business Combinations and Intangible Assets Including GoodwillThe company accounts for business combinations using the
acquisition method and accordingly, the identifiable assets
acquired, the liabilities assumed, and any noncontrolling interest
in the acquiree are recorded at their acquisition date fair values.
Goodwill represents the excess of the purchase price over the
fair value of net assets, including the amount assigned to identifi-
able intangible assets. The primary drivers that generate goodwill
are the value of synergies between the acquired entities and the
company and the acquired assembled workforce, neither of which
qualifies as a separately identifiable intangible asset. Goodwill
recorded in an acquisition is assigned to applicable reporting
units based on expected revenues. Identifiable intangible assets
with finite lives are amortized over their useful lives. Amortization
of completed technology is recorded in Cost, and amortization of
all other intangible assets is recorded in SG&A expense. Acquisi-
tion-related costs, including advisory, legal, accounting, valuation
and other costs, are expensed in the periods in which the costs
are incurred. The results of operations of acquired businesses
are included in the Consolidated Financial Statements from the
acquisition date.
ImpairmentLong-lived assets, other than goodwill and indefinite-lived intangi-
ble assets, are tested for impairment whenever events or changes
in circumstances indicate that the carrying amount may not be
recoverable. The impairment test is based on undiscounted cash
flows and, if impaired, the asset is written down to fair value based
on either discounted cash flows or appraised values. Goodwill
and indefinite-lived intangible assets are tested annually, in the
fourth quarter, for impairment and whenever changes in circum-
stances indicate an impairment may exist. Goodwill is tested
at the reporting unit level which is the operating segment, or a
business, which is one level below that operating segment (the
“component” level) if discrete financial information is prepared and
regularly reviewed by management at the segment level. Compo-
nents are aggregated as a single reporting unit if they have similar
economic characteristics.
Depreciation and AmortizationProperty, plant and equipment are carried at cost and depreciated
over their estimated useful lives using the straight-line method. The
estimated useful lives of certain depreciable assets are as follows:
buildings, 30 to 50 years; building equipment, 10 to 20 years; land
improvements, 20 years; plant, laboratory and office equipment,
2 to 20 years; and computer equipment, 1.5 to 5 years. Leasehold
improvements are amortized over the shorter of their estimated
useful lives or the related lease term, rarely exceeding 25 years.
Capitalized software costs incurred or acquired after techno-
logical feasibility has been established are amortized over periods
ranging up to 3 years. Capitalized costs for internal-use software
are amortized on a straight-line basis over periods ranging up
to 2 years. Other intangible assets are amortized over periods
between 1 and 7 years.
EnvironmentalThe cost of internal environmental protection programs that are
preventative in nature are expensed as incurred. When a cleanup
program becomes likely, and it is probable that the company will
incur cleanup costs and those costs can be reasonably estimated,
the company accrues remediation costs for known environmental
liabilities. The company’s maximum exposure for all environmental
liabilities cannot be estimated and no amounts are recorded for
environmental liabilities that are not probable or estimable.
Asset Retirement ObligationsAsset retirement obligations (ARO) are legal obligations associ-
ated with the retirement of long-lived assets. These liabilities are
initially recorded at fair value and the related asset retirement costs
are capitalized by increasing the carrying amount of the related
assets by the same amount as the liability. Asset retirement costs
are subsequently depreciated over the useful lives of the related
assets. Subsequent to initial recognition, the company records
period-to-period changes in the ARO liability resulting from the
passage of time in interest expense and revisions to either the
timing or the amount of the original expected cash flows to the
related assets.
Defined Benefit Pension and Nonpension Postretirement Benefit PlansThe funded status of the company’s defined benefit pension plans
and nonpension postretirement benefit plans (retirement-related
benefit plans) is recognized in the Consolidated Statement of
Financial Position. The funded status is measured as the difference
between the fair value of plan assets and the benefit obligation at
December 31, the measurement date. For defined benefit pen-
sion plans, the benefit obligation is the projected benefit obligation
(PBO), which represents the actuarial present value of benefits
expected to be paid upon retirement based on employee services
already rendered and estimated future compensation levels. For
the nonpension postretirement benefit plans, the benefit obligation
is the accumulated postretirement benefit obligation (APBO), which
represents the actuarial present value of postretirement benefits
attributed to employee services already rendered. The fair value
of plan assets represents the current market value of assets held
in an irrevocable trust fund, held for the sole benefit of partici-
pants, which are invested by the trust fund. Overfunded plans, with
the fair value of plan assets exceeding the benefit obligation, are
aggregated and recorded as a prepaid pension asset equal to this
excess. Underfunded plans, with the benefit obligation exceeding
the fair value of plan assets, are aggregated and recorded as a
retirement and nonpension postretirement benefit obligation equal
to this excess.
The current portion of the retirement and nonpension postre-
tirement benefit obligations represents the actuarial present value
of benefits payable in the next 12 months exceeding the fair value
of plan assets, measured on a plan-by-plan basis. This obligation
is recorded in compensation and benefits in the Consolidated
Statement of Financial Position.

Notes to Consolidated Financial Statements
International Business Machines Corporation and Subsidiary Companies
88
Net periodic pension and nonpension postretirement ben-
efit cost/(income) is recorded in the Consolidated Statement of
Earnings and includes service cost, interest cost, expected return
on plan assets, amortization of prior service costs/(credits) and
(gains)/losses previously recognized as a component of OCI and
amortization of the net transition asset remaining in accumulated
other comprehensive income/(loss) (AOCI). Service cost rep-
resents the actuarial present value of participant benefits earned
in the current year. Interest cost represents the time value of money
cost associated with the passage of time. Certain events, such as
changes in the employee base, plan amendments and changes in
actuarial assumptions, result in a change in the benefit obligation
and the corresponding change in OCI. The result of these events
is amortized as a component of net periodic cost/(income) over
the service lives or life expectancy of the participants, depending
on the plan, provided such amounts exceed thresholds which are
based upon the benefit obligation or the value of plan assets. Net
periodic cost/(income) is recorded in Cost, SG&A and RD&E in
the Consolidated Statement of Earnings based on the employees’
respective functions.
(Gains)/losses and prior service costs/(credits) not recognized
as a component of net periodic cost/(income) in the Consolidated
Statement of Earnings as they arise are recognized as a com-
ponent of OCI in the Consolidated Statement of Comprehensive
Income. Those (gains)/losses and prior service costs/(credits) are
subsequently recognized as a component of net periodic cost/
(income) pursuant to the recognition and amortization provisions
of applicable accounting guidance. (Gains)/losses arise as a result
of differences between actual experience and assumptions or as
a result of changes in actuarial assumptions. Prior service costs/
(credits) represent the cost of benefit changes attributable to prior
service granted in plan amendments.
The measurement of benefit obligations and net periodic cost/
(income) is based on estimates and assumptions approved by the
company’s management. These valuations reflect the terms of the
plans and use participant-specific information such as compen-
sation, age and years of service, as well as certain assumptions,
including estimates of discount rates, expected return on plan
assets, rate of compensation increases, interest crediting rates
and mortality rates.
Defined Contribution PlansThe company’s contribution for defined contribution plans is
recorded when the employee renders service to the company.
The charge is recorded in Cost, SG&A and RD&E in the Consoli-
dated Statement of Earnings based on the employees’ respective
functions.
Stock-Based CompensationStock-based compensation represents the cost related to stock-
based awards granted to employees. The company measures
stock-based compensation cost at the grant date, based on the
estimated fair value of the award and recognizes the cost on a
straight-line basis (net of estimated forfeitures) over the employee
requisite service period. The company grants its employees
Restricted Stock Units (RSUs), including Retention Restricted
Stock Units (RRSUs) and Performance Share Units (PSUs). RSUs
are stock awards granted to employees that entitle the holder
to shares of common stock as the award vests, typically over a
one- to five-year period. The fair value of the awards is determined
and fixed on the grant date based on the company’s stock price,
adjusted for the exclusion of dividend equivalents. The company
estimates the fair value of stock options using a Black-Scholes
valuation model. Stock-based compensation cost is recorded in
Cost, SG&A, and RD&E in the Consolidated Statement of Earnings
based on the employees’ respective functions.
The company records deferred tax assets for awards that
result in deductions on the company’s income tax returns, based
on the amount of compensation cost recognized and the statutory
tax rate in the jurisdiction in which it will receive a deduction. Dif-
ferences between the deferred tax assets recognized for financial
reporting purposes and the actual tax deduction reported on the
income tax return are recorded in additional paid-in capital (if the
tax deduction exceeds the deferred tax asset) or in the Consol-
idated Statement of Earnings (if the deferred tax asset exceeds
the tax deduction and no additional paid-in capital exists from
previous awards).
Income TaxesIncome tax expense is based on reported income before income
taxes. Deferred income taxes reflect the tax effect of temporary
differences between asset and liability amounts that are recog-
nized for financial reporting purposes and the amounts that are
recognized for income tax purposes. These deferred taxes are
measured by applying currently enacted tax laws. Valuation allow-
ances are recognized to reduce deferred tax assets to the amount
that will more likely than not be realized. In assessing the need for a
valuation allowance, management considers all available evidence
for each jurisdiction including past operating results, estimates of
future taxable income and the feasibility of ongoing tax planning
strategies. When the company changes its determination as to the
amount of deferred tax assets that can be realized, the valuation
allowance is adjusted with a corresponding impact to income tax
expense in the period in which such determination is made.
The company recognizes tax liabilities when, despite the
company’s belief that its tax return positions are supportable,
the company believes that certain positions may not be fully sus-
tained upon review by tax authorities. Benefits from tax positions
are measured at the largest amount of benefit that is greater than
50 percent likely of being realized upon settlement. The current
portion of tax liabilities is included in taxes and the noncurrent
portion of tax liabilities is included in other liabilities in the Con-
solidated Statement of Financial Position. To the extent that new
information becomes available which causes the company to
change its judgment regarding the adequacy of existing tax liabil-
ities, such changes to tax liabilities will impact income tax expense
in the period in which such determination is made. Interest and
penalties, if any, related to accrued liabilities for potential tax
assessments are included in income tax expense.

Notes to Consolidated Financial Statements
International Business Machines Corporation and Subsidiary Companies
89
Translation of Non-U.S. Currency AmountsAssets and liabilities of non-U.S. subsidiaries that have a local
functional currency are translated to United States (U.S.) dollars
at year-end exchange rates. Translation adjustments are recorded
in OCI. Income and expense items are translated at weighted-av-
erage rates of exchange prevailing during the year.
Inventories, property, plant and equipment—net and other
non-monetary assets and liabilities of non-U.S. subsidiaries and
branches that operate in U.S. dollars are translated at the approx-
imate exchange rates prevailing when the company acquired the
assets or liabilities. All other assets and liabilities denominated
in a currency other than U.S. dollars are translated at year-end
exchange rates with the transaction gain or loss recognized in
other (income) and expense. Income and expense items are trans-
lated at the weighted-average rates of exchange prevailing during
the year. These translation gains and losses are included in net
income for the period in which exchange rates change.
Derivative Financial InstrumentsDerivatives are recognized in the Consolidated Statement of
Financial Position at fair value and are reported in prepaid
expenses and other current assets, investments and sundry
assets, other accrued expenses and liabilities or other liabilities.
Classification of each derivative as current or noncurrent is based
upon whether the maturity of the instrument is less than or greater
than 12 months. To qualify for hedge accounting, the company
requires that the instruments be effective in reducing the risk expo-
sure that they are designated to hedge. For instruments that hedge
cash flows, hedge designation criteria also require that it be prob-
able that the underlying transaction will occur. Instruments that
meet established accounting criteria are formally designated as
hedges. These criteria demonstrate that the derivative is expected
to be highly effective at offsetting changes in fair value or cash
flows of the underlying exposure both at inception of the hedging
relationship and on an ongoing basis. The method of assessing
hedge effectiveness and measuring hedge ineffectiveness is for-
mally documented at hedge inception. The company assesses
hedge effectiveness and measures hedge ineffectiveness at least
quarterly throughout the designated hedge period.
Where the company applies hedge accounting, the company
designates each derivative as a hedge of: (1) the fair value of a
recognized financial asset or liability, or of an unrecognized firm
commitment (fair value hedge attributable to interest rate or for-
eign currency risk); (2) the variability of anticipated cash flows of
a forecasted transaction, or the cash flows to be received or paid
related to a recognized financial asset or liability (cash flow hedge
attributable to interest rate or foreign currency risk); or (3) a hedge
of a long-term investment (net investment hedge) in a foreign oper-
ation. In addition, the company may enter into derivative contracts
that economically hedge certain of its risks, even though hedge
accounting does not apply or the company elects not to apply
hedge accounting. In these cases, there exists a natural hedging
relationship in which changes in the fair value of the derivative,
which are recognized currently in net income, act as an economic
offset to changes in the fair value of the underlying hedged item(s).
Changes in the fair value of a derivative that is designated as a
fair value hedge, along with offsetting changes in the fair value of
the underlying hedged exposure, are recorded in earnings each
period. For hedges of interest rate risk, the fair value adjustments
are recorded as adjustments to interest expense and cost of
financing in the Consolidated Statement of Earnings. For hedges
of currency risk associated with recorded financial assets or lia-
bilities, derivative fair value adjustments are recognized in other
(income) and expense in the Consolidated Statement of Earnings.
Changes in the fair value of a derivative that is designated as a
cash flow hedge are recorded, net of applicable taxes, in OCI, in
the Consolidated Statement of Comprehensive Income. When net
income is affected by the variability of the underlying cash flow, the
applicable offsetting amount of the gain or loss from the derivative
that is deferred in AOCI is released to net income and reported
in interest expense, cost, SG&A expense or other (income) and
expense in the Consolidated Statement of Earnings based on the
nature of the underlying cash flow hedged. Effectiveness for net
investment hedging derivatives is measured on a spot-to-spot
basis. The effective portion of changes in the fair value of net
investment hedging derivatives and other non-derivative financial
instruments designated as net investment hedges are recorded
as foreign currency translation adjustments in OCI. Changes in
the fair value of the portion of a net investment hedging derivative
excluded from the effectiveness assessment are recorded in inter-
est expense. If the underlying hedged item in a fair value hedge
ceases to exist, all changes in the fair value of the derivative are
included in net income each period until the instrument matures.
When the derivative transaction ceases to exist, a hedged asset
or liability is no longer adjusted for changes in its fair value except
as required under other relevant accounting standards.
Derivatives that are not designated as hedges, as well as
changes in the fair value of derivatives that do not effectively offset
changes in the fair value of the underlying hedged item throughout
the designated hedge period (collectively, “ineffectiveness”), are
recorded in net income for each period and are primarily reported
in other (income) and expense. When a cash flow hedging relation-
ship is discontinued, the net gain or loss in AOCI must generally
remain in AOCI until the item that was hedged affects earnings.
However, when it is probable that a forecasted transaction will not
occur by the end of the originally specified time period or within
an additional two-month period thereafter, the net gain or loss in
AOCI must be reclassified into earnings immediately.
The company reports cash flows arising from derivative finan-
cial instruments designated as fair value or cash flow hedges
consistent with the classification of cash flows from the underlying
hedged items that these derivatives are hedging. Accordingly, the
cash flows associated with derivatives designated as fair value
or cash flow hedges are classified in cash flows from operating
activities in the Consolidated Statement of Cash Flows. Cash
flows from derivatives designated as net investment hedges and
derivatives that do not qualify as hedges are reported in cash
flows from investing activities in the Consolidated Statement of
Cash Flows. For currency swaps designated as hedges of foreign
Notes to Consolidated Financial Statements
International Business Machines Corporation and Subsidiary Companies
90
currency denominated debt (included in the company’s debt risk
management program as addressed in note D, “Financial Instru-
ments,” on pages 101 through 105), cash flows directly associated
with the settlement of the principal element of these swaps are
reported in payments to settle debt in cash flows from financing
activities in the Consolidated Statement of Cash Flows.
Financial InstrumentsIn determining the fair value of its financial instruments, the com-
pany uses a variety of methods and assumptions that are based
on market conditions and risks existing at each balance sheet
date. See note D, “Financial Instruments,” on pages 100 to 101
for further information. All methods of assessing fair value result
in a general approximation of value, and such value may never
actually be realized.
Fair Value Measurement Accounting guidance defines fair value as the price that would be
received to sell an asset or paid to transfer a liability in an orderly
transaction between market participants at the measurement date.
Under this guidance, the company is required to classify certain
assets and liabilities based on the following fair value hierarchy:
• Level 1—Quoted prices (unadjusted) in active markets
for identical assets or liabilities that can be accessed at the
measurement date;
• Level 2—Inputs other than quoted prices included within
Level 1 that are observable for the asset or liability, either
directly or indirectly; and
• Level 3—Unobservable inputs for the asset or liability.
The guidance requires the use of observable market data if such
data is available without undue cost and effort.
When available, the company uses unadjusted quoted market
prices in active markets to measure the fair value and classifies
such items within Level 1. If quoted market prices are not available,
fair value is based upon internally developed models that use cur-
rent market-based or independently sourced market parameters
such as interest rates and currency rates. Items valued using inter-
nally generated models are classified according to the lowest level
input or value driver that is significant to the valuation.
The determination of fair value considers various factors includ-
ing interest rate yield curves and time value underlying the financial
instruments. For derivatives and debt securities, the company uses
a discounted cash flow analysis using discount rates commensu-
rate with the duration of the instrument.
In determining the fair value of financial instruments, the com-
pany considers certain market valuation adjustments to the “base
valuations” calculated using the methodologies described below
for several parameters that market participants would consider in
determining fair value:
• Counterparty credit risk adjustments are applied to financial
instruments, taking into account the actual credit risk of a
counterparty as observed in the credit default swap market
to determine the true fair value of such an instrument.
• Credit risk adjustments are applied to reflect the company’s
own credit risk when valuing all liabilities measured at fair
value. The methodology is consistent with that applied in
developing counterparty credit risk adjustments, but incor-
porates the company’s own credit risk as observed in the
credit default swap market.
As an example, the fair value of derivatives is derived utilizing a
discounted cash flow model that uses observable market inputs
such as known notional value amounts, yield curves, spot and
forward exchange rates as well as discount rates. These inputs
relate to liquid, heavily traded currencies with active markets which
are available for the full term of the derivative.
Certain financial assets are measured at fair value on a non-
recurring basis. These assets include equity method investments
that are recognized at fair value at the measurement date to the
extent that they are deemed to be other-than-temporarily impaired.
Certain assets that are measured at fair value on a recurring basis
can be subject to nonrecurring fair value measurements. These
assets include available-for-sale equity investments that are
deemed to be other-than-temporarily impaired. In the event of an
other-than-temporary impairment of a financial instrument, fair
value is measured using a model described above.
Accounting guidance permits the measurement of eligible
financial assets, financial liabilities and firm commitments at fair
value, on an instrument-by-instrument basis, that are otherwise not
permitted to be accounted for at fair value under other account-
ing standards. This election is irrevocable. The company has not
applied the fair value option to any eligible assets or liabilities.
Cash EquivalentsAll highly liquid investments with maturities of three months or
less at the date of purchase are considered to be cash equivalents.
Marketable SecuritiesDebt securities included in current assets represent securities that
are expected to be realized in cash within one year of the balance
sheet date. Long-term debt securities that are not expected to be
realized in cash within one year and alliance equity securities are
included in investments and sundry assets. Debt and marketable
equity securities are considered available for sale and are reported
at fair value with unrealized gains and losses, net of applicable
taxes, in OCI. The realized gains and losses for available-for-sale
securities are included in other (income) and expense in the Con-
solidated Statement of Earnings. Realized gains and losses are
calculated based on the specific identification method.
In determining whether an other-than-temporary decline in
market value has occurred, the company considers the duration
that, and extent to which, the fair value of the investment is below
its cost, the financial condition and near-term prospects of the
issuer or underlying collateral of a security; and the company’s
intent and ability to retain the security in order to allow for an antic-
ipated recovery in fair value. Other-than-temporary declines in fair
value from amortized cost for available-for-sale equity and debt
Notes to Consolidated Financial Statements
International Business Machines Corporation and Subsidiary Companies
91
securities that the company intends to sell or would more likely
than not be required to sell before the expected recovery of the
amortized cost basis are charged to other (income) and expense
in the period in which the loss occurs. For debt securities that the
company has no intent to sell and believes that it more likely than
not will not be required to sell prior to recovery, only the credit loss
component of the impairment is recognized in other (income) and
expense, while the remaining loss is recognized in OCI. The credit
loss component recognized in other (income) and expense is iden-
tified as the amount of the principal cash flows not expected to be
received over the remaining term of the debt security as projected
using the company’s cash flow projections.
InventoriesRaw materials, work in process and finished goods are stated at
the lower of average cost or market. Cash flows related to the
sale of inventories are reflected in net cash provided by operating
activities in the Consolidated Statement of Cash Flows.
Allowance for Credit LossesReceivables are recorded concurrent with billing and shipment of
a product and/or delivery of a service to customers. A reasonable
estimate of probable net losses on the value of customer receiv-
ables is recognized by establishing an allowance for credit losses.
Notes and Accounts Receivable—Trade
An allowance for uncollectible trade receivables is estimated
based on a combination of write-off history, aging analysis and
any specific, known troubled accounts.
Financing Receivables
Financing receivables include sales-type leases, direct financing
leases and loans. Leases are accounted for in accordance with
lease accounting standards. Loan receivables are financial assets
recorded at amortized cost which approximates fair value. The
company determines its allowances for credit losses on financing
receivables based on two portfolio segments: lease receivables
and loan receivables. The company further segments the portfolio
into two classes: major markets and growth markets.
When calculating the allowances, the company considers its
ability to mitigate a potential loss by repossessing leased equip-
ment and by considering the current fair market value of any other
collateral. The value of the equipment is the net realizable value.
The allowance for credit losses for capital leases, installment sales
and customer loans includes an assessment of the entire balance
of the capital lease or loan, including amounts not yet due. The
methodologies that the company uses to calculate its receivables
reserves, which are applied consistently to its different portfolios,
are as follows:
Individually Evaluated—The company reviews all financing receiv-
ables considered at risk on a quarterly basis. The review primarily
consists of an analysis based upon current information available
about the client, such as financial statements, news reports, pub-
lished credit ratings, current market-implied credit analysis, as well
as the current economic environment, collateral net of reposses-
sion cost and prior collection history. For loans that are collateral
dependent, impairment is measured using the fair value of the col-
lateral when foreclosure is probable. Using this information, the
company determines the expected cash flow for the receivable
and calculates an estimate of the potential loss and the probabil-
ity of loss. For those accounts in which the loss is probable, the
company records a specific reserve.
Collectively Evaluated—The company records an unallocated
reserve that is calculated by applying a reserve rate to its differ-
ent portfolios, excluding accounts that have been specifically
reserved. This reserve rate is based upon credit rating, probabil-
ity of default, term, characteristics (lease/loan) and loss history.
Factors that could result in actual receivable losses that are mate-
rially different from the estimated reserve include sharp changes in
the economy, or a significant change in the economic health of a
particular client that represents a concentration in the company’s
receivables portfolio.
Other Credit-Related Policies
Non-Accrual—Certain receivables for which the company has
recorded a specific reserve may also be placed on non-accrual
status. Non-accrual assets are those receivables (impaired
loans or nonperforming leases) with specific reserves and other
accounts for which it is likely that the company will be unable to
collect all amounts due according to original terms of the lease
or loan agreement. Income recognition is discontinued on these
receivables. Cash collections are first applied as a reduction to
principal outstanding. Any cash received in excess of principal
payments outstanding is recognized as interest income. Receiv-
ables may be removed from non-accrual status, if appropriate,
based upon changes in client circumstances.
Write Off—Receivable losses are charged against the allow-
ance when management believes the uncollectibility of the
receivable is confirmed. Subsequent recoveries, if any, are cred-
ited to the allowance.
Past Due—The company views receivables as past due when
payment has not been received after 90 days, measured from the
original billing date.
Impaired Loans—As stated above, the company evaluates all
financing receivables considered at-risk, including loans, for
impairment on a quarterly basis. The company considers any
loan with an individually evaluated reserve as an impaired loan.
Depending on the level of impairment, loans will also be placed
on non-accrual status as appropriate. Client loans are primarily
for software and services and are unsecured. These loans are
subjected to credit analysis to evaluate the associated risk and,
when deemed necessary, actions are taken to mitigate risks in the
loan agreements which include covenants to protect against credit
deterioration during the life of the obligation.

Notes to Consolidated Financial Statements
International Business Machines Corporation and Subsidiary Companies
92
Estimated Residual Values of Lease AssetsThe recorded residual values of lease assets are estimated at
the inception of the lease to be the expected fair value of the
assets at the end of the lease term. The company periodically
reassesses the realizable value of its lease residual values. Any
anticipated increases in specific future residual values are not rec-
ognized before realization through remarketing efforts. Anticipated
decreases in specific future residual values that are considered to
be other-than-temporary are recognized immediately upon iden-
tification and are recorded as an adjustment to the residual value
estimate. For sales-type and direct-financing leases, this reduction
lowers the recorded net investment and is recognized as a loss
charged to financing income in the period in which the estimate is
changed, as well as an adjustment to unearned income to reduce
future-period financing income.
Common StockCommon stock refers to the $.20 par value per share capital stock
as designated in the company’s Certificate of Incorporation. Trea-
sury stock is accounted for using the cost method. When treasury
stock is reissued, the value is computed and recorded using a
weighted-average basis.
Earnings Per Share of Common StockEarnings per share (EPS) is computed using the two-class method.
The two-class method determines EPS for each class of common
stock and participating securities according to dividends and
dividend equivalents and their respective participation rights
in undistributed earnings. Basic EPS of common stock is com-
puted by dividing net income by the weighted-average number
of common shares outstanding for the period. Diluted EPS of
common stock is computed on the basis of the weighted-aver-
age number of shares of common stock plus the effect of dilutive
potential common shares outstanding during the period using the
treasury stock method. Dilutive potential common shares include
outstanding stock awards, convertible notes and stock options.
NOTE B.
ACCOUNTING CHANGES
New Standards to be ImplementedIn January 2016, the Financial Accounting Standards Board (FASB)
issued guidance which addresses aspects of recognition, mea-
surement, presentation and disclosure of financial instruments.
Certain equity investments will be measured at fair value with
changes recognized in net income. The amendment also sim-
plifies the impairment test of equity investments that lack readily
determinable fair value. The guidance is effective January 1, 2018
and early adoption is not permitted except for limited provisions.
The guidance is not expected to have a material impact in the
consolidated financial results.
In September 2015, the FASB issued guidance eliminating the
requirement that an acquirer in a business combination account
for a measurement-period adjustment retrospectively. Instead, an
acquirer will recognize a measurement-period adjustment during
the period in which the amount of the adjustment is determined.
In addition, the portion of the amount recorded in current-period
earnings by line item that would have been recorded in previous
reporting periods if the adjustment to the provisional amounts had
been recognized as of the acquisition date should be presented
separately on the face of the income statement or disclosed in the
notes. The guidance was effective January 1, 2016 on a prospec-
tive basis. The guidance is not expected to have a material impact
in the consolidated financial results.
In July 2015, the FASB issued guidance which requires all inven-
tories, except those using the last-in, first-out or retail methods, to
be measured at the lower of cost and net realizable value. Net real-
izable value is the estimated selling price in the ordinary course of
business, less reasonably predictable cost of completion, disposal,
and transportation. The guidance is effective January 1, 2017 with
early adoption permitted. The guidance is not expected to have a
material impact in the consolidated financial results.
In May 2015, the FASB issued guidance which removed the
requirement to categorize within the fair value hierarchy all invest-
ments for which fair value is measured using the net asset value
per share practical expedient. The amendments also removed the
requirement to make certain disclosures for all investments that
are eligible to be measured at fair value using the net asset value
per share practical expedient. Rather, those disclosures are limited
to investments for which the entity has elected to measure the fair
value using that practical expedient. The guidance was effective
January 1, 2016. The guidance was a change in disclosure only
and will not have an impact in the consolidated financial results.
In April 2015, the FASB issued guidance about whether a
cloud computing arrangement includes a software license. If a
cloud computing arrangement includes a software license, then
the customer should account for the software license element of
the arrangement consistent with the acquisition of other software
licenses. If a cloud computing arrangement does not include a
software license, the customer should account for the arrange-
ment as a services contract. All software licenses recognized
under this guidance will be accounted for consistent with other
licenses of intangible assets. The guidance was effective Janu-
ary 1, 2016 and the company will adopt it on a prospective basis.
The guidance is not expected to have a material impact in the
consolidated financial results.

Notes to Consolidated Financial Statements
International Business Machines Corporation and Subsidiary Companies
93
In May 2014, the FASB issued guidance on the recognition of
revenue from contracts with customers. Revenue recognition will
depict the transfer of promised goods or services to customers
in an amount that reflects the consideration to which the entity
expects to be entitled in exchange for those goods or services. The
guidance also requires disclosures regarding the nature, amount,
timing and uncertainty of revenue and cash flows arising from
contracts with customers. The guidance permits two methods of
adoption: retrospectively to each prior reporting period presented,
or retrospectively with the cumulative effect of initially applying the
guidance recognized at the date of initial application (the cumula-
tive catch-up transition method). The guidance was initially effective
January 1, 2017 and early adoption was not permitted. In August
2015, the FASB issued guidance which provides for a one-year
deferral of the effective date to January 1, 2018, with an option of
applying the standard on the original effective date. The company
will adopt the guidance on January 1, 2018 and apply the cumulative
catch-up transition method. The company is continuing to evaluate
the impact of the new guidance in the consolidated financial results.
Standards ImplementedIn November 2015, the FASB issued guidance which requires
deferred tax liabilities and assets be classified as noncurrent in
the statement of financial position. The guidance was effective
January 1, 2016 with early adoption permitted. The company
adopted the guidance in the fourth quarter of 2015 on a retro-
spective basis. The company reclassified current deferred tax
assets of $2.0 billion at December 31, 2014 to deferred tax assets
and current deferred tax liabilities of $19 million at December 31,
2014 to other liabilities from other accrued expenses and liabilities
in the Consolidated Statement of Financial Position. In order to
offset deferred tax assets and liabilities for presentation as a single
noncurrent amount by tax jurisdiction, the company also reclassi-
fied $178 million at December 31, 2014 from deferred tax assets to
other liabilities in the Consolidated Statement of Financial Position.
In April 2015, the FASB issued guidance which requires debt
issuance costs related to a recognized debt liability to be presented
in the balance sheet as a direct deduction from the carrying amount
of that debt liability, consistent with debt discounts. The guidance
was effective January 1, 2016 with early adoption permitted. The
company adopted the guidance in the fourth quarter of 2015 on a
retrospective basis. At December 31, 2015 and 2014, the company
had $74 million and $83 million, respectively, in debt issuance costs.
Debt issuance costs were previously included in investments and
sundry assets in the Consolidated Statement of Financial Position.
In April 2014, the FASB issued guidance that changed the cri-
teria for reporting a discontinued operation. Only disposals of a
component that represents a strategic shift that has (or will have)
a major effect on an entity’s operations and financial results is
a discontinued operation. The guidance also requires expanded
disclosures about discontinued operations and disposals of a
significant part of an entity that does not qualify for discontinued
operations reporting. The guidance was effective January 1, 2015.
The impact to the company will be dependent on any transaction
that is within the scope of the new guidance. There were no such
transactions in 2015.
In July 2013, the FASB issued guidance regarding the presen-
tation of an unrecognized tax benefit when a net operating loss
carryforward, a similar tax loss, or a tax credit carryforward exists.
Under certain circumstances, unrecognized tax benefits should be
presented in the financial statements as a reduction to a deferred
tax asset for a net operating loss carryforward, a similar tax loss,
or a tax credit carryforward. The guidance was effective January 1,
2014. The guidance was a change in financial statement presen-
tation only and did not have a material impact in the consolidated
financial results.
In March 2013, the FASB issued guidance on when foreign cur-
rency translation adjustments should be released to net income.
When a parent entity ceases to have a controlling financial interest
in a subsidiary or group of assets that is a business within a for-
eign entity, the parent is required to release any related cumulative
translation adjustment into net income. Accordingly, the cumula-
tive translation adjustment should be released into net income
only if the sale or transfer results in the complete or substantially
complete liquidation of the foreign entity in which the subsidiary
or group of assets had resided. The guidance was effective Janu-
ary 1, 2014 and did not have a material impact in the consolidated
financial results.
In February 2013, the FASB issued guidance for the recognition,
measurement and disclosure of obligations resulting from joint
and several liability arrangements for which the total amount of the
obligation within the scope of the guidance is fixed at the report-
ing date. Examples include debt arrangements, other contractual
obligations and settled litigation matters. The guidance requires an
entity to measure such obligations as the sum of the amount that
the reporting entity agreed to pay on the basis of its arrangement
among its co-obligors plus additional amounts the reporting entity
expects to pay on behalf of its co-obligors. The guidance was
effective January 1, 2014 and did not have a material impact in the
consolidated financial results.
NOTE C.
ACQUISITIONS/DIVESTITURES
AcquisitionsPurchase price consideration for all acquisitions, as reflected in
the tables in this note, is paid primarily in cash. All acquisitions
are reported in the Consolidated Statement of Cash Flows net of
acquired cash and cash equivalents.
2015
In 2015, the company completed fourteen acquisitions at an aggre-
gate cost of $3,555 million.
Merge Healthcare, Inc. (Merge)—On October 13, 2015, the com-
pany completed the acquisition of 100 percent of Merge, a publicly
held company, for cash consideration of $1,036 million. Merge is
a leading provider of medical image handling and processing,
interoperability and clinical systems designed to advance health-
care quality and efficiency. Merge joined the company’s Watson
Health business unit, bolstering clients’ ability to analyze and

Notes to Consolidated Financial Statements
International Business Machines Corporation and Subsidiary Companies
94
cross-reference medical images against billions of data points
already in the Watson Health Cloud. Goodwill of $695 million has
been assigned to the Software segment. At the acquisition date, it
was expected that none of the goodwill would be deductible for tax
purposes. The overall weighted-average useful life of the identified
intangible assets acquired is 7.0 years.
Cleversafe, Inc. (Cleversafe)—On November 6, 2015, the company
completed the acquisition of 100 percent of Cleversafe, a privately
held company, for cash consideration of $1,309 million. Cleversafe
is a leading developer and manufacturer of object-based storage
software and appliances. Cleversafe will be integrated into the
company’s Cloud business to give clients strategic data flexibility,
simplified management and consistency with on-premise, cloud
and hybrid cloud deployment options. Goodwill of $1,000 million
has been assigned to the Global Technology Services ($590 mil-
lion) and Systems Hardware ($410 million) segments. At the
acquisition date, it was expected that none of the goodwill would
be deductible for tax purposes. The overall weighted-average
useful life of the identified intangible assets acquired is 6.9 years.
Other Acquisitions—The Software segment completed acqui-
sitions of eight privately held businesses: in the first quarter,
AlchemyAPI, Inc. (AlchemyAPI) and Blekko, Inc. (Blekko); in the
second quarter, Explorys, Inc. (Explorys) and Phytel, Inc. (Phytel); in
the third quarter, Compose, Inc. (Compose) and StrongLoop, Inc.
(StrongLoop); and in the fourth quarter, Clearleap, Inc. (Clearleap)
and IRIS Analytics. Global Technology Services (GTS) completed
acquisitions of two privately held businesses: in the second
quarter, Blue Box Group, Inc. (Blue Box); and in the fourth quarter,
Gravitant, Inc. (Gravitant). Global Business Services (GBS) com-
pleted acquisitions of two privately held businesses in the fourth
quarter, Advanced Application Corporation (AAC) and Meteorix,
LLC. (Meteorix).
Each acquisition is expected to enhance the company’s port-
folio of product and services capabilities. AlchemyAPI is a leading
provider of scalable cognitive computing application program
interface services and computing applications. Blekko technology
provides advanced Web-crawling, categorization and intelligent
filtering. Explorys provides secure cloud-based solutions for
clinical integration, at-risk population management, cost of care
measurement and pay-for-performance. Phytel is a leading pro-
vider of SaaS-based population health management offerings that
help providers identify patients at risk for care gaps and engage the
patient to begin appropriate preventative care. Blue Box provides
hosted, managed, OpenStack-based production-grade private
clouds for the enterprise and service provider markets. Compose
offers auto-scaling, production-ready databases to help software
development teams deploy data services efficiently. StrongLoop
is a leading provider of application development software that
enables software developers to build applications using applica-
tion programming interfaces. AAC engages in system integration
application development, software support and services. AAC was
an affiliate of JBCC Holdings Inc. and IBM Japan Ltd. The company
acquired all the shares of AAC which became a wholly owned
subsidiary as of October 1, 2015. Gravitant develops cloud-based
software to enable organizations to easily plan, buy and manage,
or “broker” software and computing services from multiple suppli-
ers across hybrid clouds. Meteorix offers consulting, deployment,
integration and on-going post production services for Workday
Financial Management and Human Capital Management applica-
tions. Clearleap is a provider of cloud-based video services. IRIS
Analytics provides technology and consultancy services to the
payments industry to detect electronic payment fraud.
All acquisitions were for 100 percent of the acquired companies
with the exception of the AAC acquisition.
The following table reflects the purchase price related to these
acquisitions and the resulting purchase price allocations as of
December 31, 2015.
2015 Acquisitions
($ in millions)
Amortization Life (in Years) Merge Cleversafe
Other Acquisitions
Current assets $ 94 $ 23 $ 60
Fixed assets/noncurrent assets 128 63 82
Intangible assets
Goodwill N/A 695 1,000 895
Completed technology 5–7 133 364 163
Client relationships 5–7 145 23 95
Patents/trademarks 2–7 54 11 23
Total assets acquired 1,248 1,484 1,318
Current liabilities (73) (15) (34)
Noncurrent liabilities (139) (160) (73)
Total liabilities assumed (212) (175) (107)
Total purchase price $1,036 $1,309 $1,210
N/A—Not applicable

Notes to Consolidated Financial Statements
International Business Machines Corporation and Subsidiary Companies
95
The acquisitions were accounted for as business combinations
using the acquisition method, and accordingly, the identifiable
assets acquired, the liabilities assumed, and any noncontrolling
interest in the acquired entity were recorded at their estimated fair
values at the date of acquisition. The primary items that generated
the goodwill are the value of the synergies between the acquired
businesses and IBM and the acquired assembled workforce, nei-
ther of which qualify as an amortizable intangible asset.
For the “Other Acquisitions,” the overall weighted-average life of
the identified intangible assets acquired is 6.4 years. These iden-
tified intangible assets will be amortized on a straight-line basis
over their useful lives. Goodwill of $717 million was assigned to the
Software segment, $104 million was assigned to the GTS segment,
and $74 million was assigned to the GBS segment. It is expected
that 7 percent of the goodwill will be deductible for tax purposes.
On December 17, 2015, the company announced that it had
entered into a definitive agreement with AT&T to acquire their appli-
cation and hosting services business. The acquisition is expected
to strengthen IBM’s outsourcing portfolio and will align with IBM’s
cloud strategy.
On January 21, 2016, the company announced that it had
acquired Ustream, Inc. (Ustream), a privately held company based
in San Francisco, California. Ustream provides cloud-based video
streaming to enterprises and broadcasters.
On January 29, 2016, the company announced that it had
acquired The Weather Company’s B2B, mobile and cloud-based
web-properties, weather.com, Weather Underground, The Weather
Company brand and WSI, its global business-to-business brand
for cash consideration of approximately $2 billion. The cable tele-
vision segment was not acquired by IBM, but will license weather
forecast data and analytics from IBM under a long-term contract.
On February 2, 2016, the company announced its intent to
acquire Aperto, a digital agency with headquarters in Berlin,
Germany. Aperto will join the IBM Interactive Experience (IBM iX)
team. IBM iX provides clients a unique fusion of services span-
ning strategy, analytics and systems integration for scalable digital,
commerce, mobile and wearable platforms. The transaction is
expected to close in the first quarter of 2016.
On February 3, 2016, the company announced its intent to
acquire ecx.io, a digital agency headquartered in Dusseldorf,
Germany. The proposed acquisition of ecx.io will enhance IBM iX
with new digital marketing, commerce and platform skills to accel-
erate clients’ digital transformations. The transaction is expected
to close in the first quarter of 2016.
On February 18, 2016, the company announced that it had
acquired Resource/Ammirati, a leading U.S. based digital mar-
keting and creative agency, addressing the rising demand from
businesses seeking to reinvent themselves for the digital economy.
On February 18, 2016, the company announced its intent to
acquire Truven Health Analytics (Truven), a leading provider of
healthcare analytics solutions, for estimated cash consideration
of $2.6 billion. Truven has developed proprietary analytic meth-
ods and assembled analytic content assets, creating extensive
national healthcare utilization, performance, quality, and cost data.
The transaction is expected to close in the first quarter of 2016.
At the date of issuance of the financial statements, the initial
purchase accounting for the Ustream, The Weather Company and
Resource/Ammirati transactions was not complete.
2014
In 2014, the company completed six acquisitions at an aggregate
cost of $608 million.
The Software segment completed acquisitions of five privately
held companies: in the first quarter, Aspera, Inc. (Aspera) and Clou-
dant, Inc. (Cloudant); in the second quarter, Silverpop Systems, Inc.
(Silverpop) and Cognea Group Pty LTD (Cognea); and in the third
quarter, CrossIdeas Srl (CrossIdeas). Global Technology Services
completed one acquisition in the third quarter, Lighthouse Security
Group, LLC (Lighthouse), a privately held company.
Aspera’s technology helps make cloud computing faster, more
predictable and more cost effective for big data transfers such
as enterprise storage, sharing virtual images or accessing the
cloud for increased computing capacity. Cloudant extends the
company’s mobile and cloud platform by enabling developers to
easily and quickly create next-generation mobile and web-based
applications. Silverpop is a provider of cloud-based capabilities
that deliver personalized customer engagements in highly scalable
environments. Cognea offers personalized artificial intelligence
capabilities designed to serve as an intuitive interface between
human users and data-driven information. CrossIdeas delivers
next generation identity and access governance capabilities to
help mitigate access risks and segregation of duty violations.
Lighthouse is a provider of cloud-enabled managed identity and
access management solutions.
The following table reflects the purchase price related to these
acquisitions and the resulting purchase price allocations as of
December 31, 2014.
2014 Acquisitions
($ in millions)
Amortization Life (in Years)
Total Acquisitions
Current assets $ 56
Fixed assets/noncurrent assets 39
Intangible assets
Goodwill N/A 442
Completed technology 5–7 68
Client relationships 7 77
Patents/trademarks 1–7 18
Total assets acquired 701
Current liabilities (26)
Noncurrent liabilities (67)
Total liabilities assumed (93)
Total purchase price $608
N/A—Not applicable
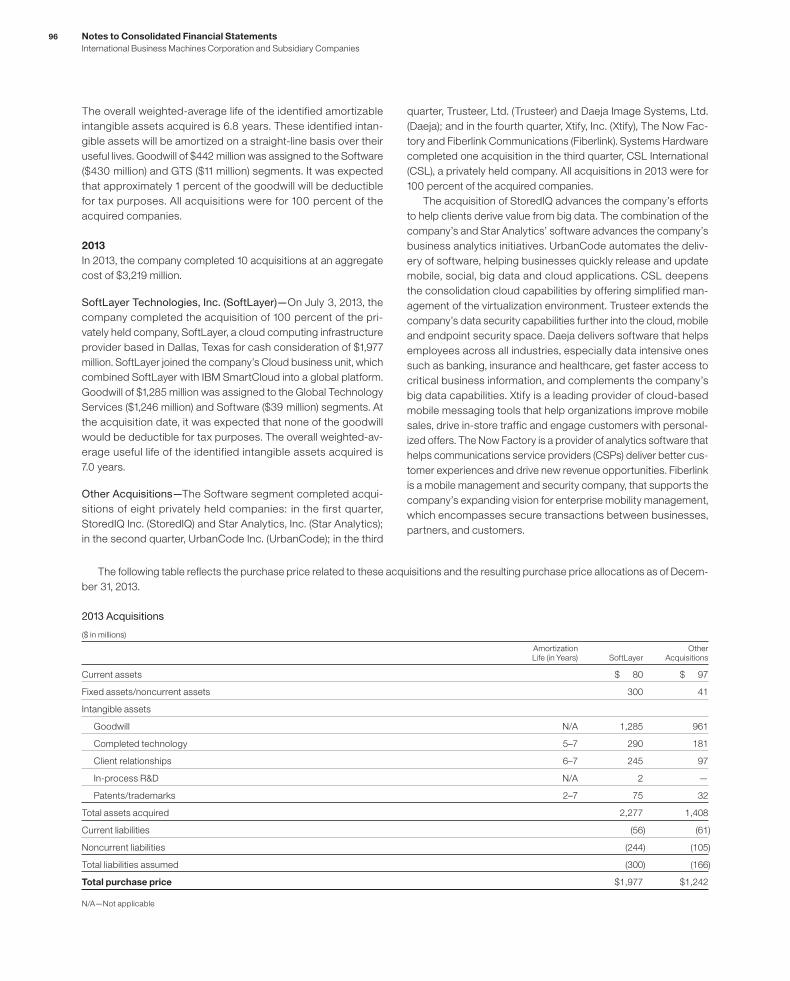
Notes to Consolidated Financial Statements
International Business Machines Corporation and Subsidiary Companies
96
The overall weighted-average life of the identified amortizable
intangible assets acquired is 6.8 years. These identified intan-
gible assets will be amortized on a straight-line basis over their
useful lives. Goodwill of $442 million was assigned to the Software
($430 million) and GTS ($11 million) segments. It was expected
that approximately 1 percent of the goodwill will be deductible
for tax purposes. All acquisitions were for 100 percent of the
acquired companies.
2013
In 2013, the company completed 10 acquisitions at an aggregate
cost of $3,219 million.
SoftLayer Technologies, Inc. (SoftLayer)—On July 3, 2013, the
company completed the acquisition of 100 percent of the pri-
vately held company, SoftLayer, a cloud computing infrastructure
provider based in Dallas, Texas for cash consideration of $1,977
million. SoftLayer joined the company’s Cloud business unit, which
combined SoftLayer with IBM SmartCloud into a global platform.
Goodwill of $1,285 million was assigned to the Global Technology
Services ($1,246 million) and Software ($39 million) segments. At
the acquisition date, it was expected that none of the goodwill
would be deductible for tax purposes. The overall weighted-av-
erage useful life of the identified intangible assets acquired is
7.0 years.
Other Acquisitions—The Software segment completed acqui-
sitions of eight privately held companies: in the first quarter,
StoredIQ Inc. (StoredIQ) and Star Analytics, Inc. (Star Analytics);
in the second quarter, UrbanCode Inc. (UrbanCode); in the third
quarter, Trusteer, Ltd. (Trusteer) and Daeja Image Systems, Ltd.
(Daeja); and in the fourth quarter, Xtify, Inc. (Xtify), The Now Fac-
tory and Fiberlink Communications (Fiberlink). Systems Hardware
completed one acquisition in the third quarter, CSL International
(CSL), a privately held company. All acquisitions in 2013 were for
100 percent of the acquired companies.
The acquisition of StoredIQ advances the company’s efforts
to help clients derive value from big data. The combination of the
company’s and Star Analytics’ software advances the company’s
business analytics initiatives. UrbanCode automates the deliv-
ery of software, helping businesses quickly release and update
mobile, social, big data and cloud applications. CSL deepens
the consolidation cloud capabilities by offering simplified man-
agement of the virtualization environment. Trusteer extends the
company’s data security capabilities further into the cloud, mobile
and endpoint security space. Daeja delivers software that helps
employees across all industries, especially data intensive ones
such as banking, insurance and healthcare, get faster access to
critical business information, and complements the company’s
big data capabilities. Xtify is a leading provider of cloud-based
mobile messaging tools that help organizations improve mobile
sales, drive in-store traffic and engage customers with personal-
ized offers. The Now Factory is a provider of analytics software that
helps communications service providers (CSPs) deliver better cus-
tomer experiences and drive new revenue opportunities. Fiberlink
is a mobile management and security company, that supports the
company’s expanding vision for enterprise mobility management,
which encompasses secure transactions between businesses,
partners, and customers.
The following table reflects the purchase price related to these acquisitions and the resulting purchase price allocations as of Decem-
ber 31, 2013.
2013 Acquisitions
($ in millions)
Amortization Life (in Years) SoftLayer
Other Acquisitions
Current assets $ 80 $ 97
Fixed assets/noncurrent assets 300 41
Intangible assets
Goodwill N/A 1,285 961
Completed technology 5–7 290 181
Client relationships 6–7 245 97
In-process R&D N/A 2 —
Patents/trademarks 2–7 75 32
Total assets acquired 2,277 1,408
Current liabilities (56) (61)
Noncurrent liabilities (244) (105)
Total liabilities assumed (300) (166)
Total purchase price $1,977 $1,242
N/A—Not applicable

Notes to Consolidated Financial Statements
International Business Machines Corporation and Subsidiary Companies
97
For the “Other Acquisitions,” the overall weighted-average life of
the identified amortizable intangible assets acquired is 6.6 years.
These identified intangible assets will be amortized on a straight-
line basis over their useful lives. Goodwill of $961 million was
assigned to the Software ($948 million) and Systems Hardware
($13 million) segments. At the acquisition dates, it was expected
that approximately 2 percent of the goodwill would be deductible
for tax purposes.
DivestituresMicroelectronics—On October 20, 2014, IBM and GLOBAL-
FOUNDRIES announced a definitive agreement in which
GLOBALFOUNDRIES would acquire the company’s Microelec-
tronics business, including existing semiconductor manufacturing
assets and operations in East Fishkill, NY and Essex Junction,
VT. The commercial OEM business to be acquired by GLOBAL-
FOUNDRIES included custom logic and specialty foundry,
manufacturing and related operations. The transaction closed on
July 1, 2015.
The transaction included a 10-year exclusive manufacturing
sourcing agreement in which GLOBALFOUNDRIES will provide
server processor semiconductor technology for use in IBM Sys-
tems. The agreement provides the company with capacity and
market-based pricing for current semiconductor nodes in produc-
tion and progression to nodes in the future for both development
and production needs. As part of the transaction, the company
provides GLOBALFOUNDRIES with certain transition services,
including IT, supply chain, packaging and test services and lab
services. The initial term for these transition services is one to three
years, with GLOBALFOUNDRIES having the ability to renew.
In the third quarter of 2014, the company recorded a pre-tax
charge of $4.7 billion related to the sale of the Microelectronics dis-
posal group, which was part of the Systems Hardware reportable
segment. The pre-tax charge reflected the fair value less the esti-
mated cost of selling the disposal group including an impairment
to the semiconductor long-lived assets of $2.4 billion, $1.5 billion
representing the cash consideration expected to be transferred
to GLOBALFOUNDRIES and $0.8 billion of other related costs.
Additional pre-tax charges of $116 million were recorded during
2015 related to the disposal. The cumulative pre-tax charge was
$4.8 billion as of December 31, 2015. Additional charges may be
recorded in future periods.
All assets and liabilities of the business, which were held for
sale at June 30, 2015, were transferred at closing. The company
transferred $515 million of net cash to GLOBALFOUNDRIES in the
third quarter of 2015. This amount included $750 million of cash
consideration, adjusted by the amount of working capital due from
GLOBALFOUNDRIES and other miscellaneous items. The remain-
ing cash consideration will be transferred over two years.
Reporting the related assets and liabilities initially as held for
sale at September 30, 2014 was based on meeting all of the criteria
for such reporting in the applicable accounting guidance. While
the company met certain criteria for held for sale reporting in prior
periods, it did not meet all of the criteria until September 30, 2014.
In addition, at September 30, 2014, the company concluded that
the Microelectronics business met the criteria for discontinued
operations reporting. The disposal group constitutes a compo-
nent under accounting guidance. The continuing cash inflows and
outflows with the discontinued component are related to the man-
ufacturing sourcing arrangement and the transition, packaging
and test services. These cash flows are not direct cash flows as
they are not significant and the company will have no significant
continuing involvement.
Summarized financial information for discontinued operations
is shown below.
($ in millions)
For the year ended December 31: 2015 2014 2013
Total revenue $ 720 $ 1,335 $1,384
Loss from discontinued operations,
before tax (175) (619) (720)
Loss on disposal, before tax (116) (4,726) —
Total loss from discontinued
operations, before income taxes (291) (5,346) (720)
Provision/(benefi t) for income taxes (117) (1,617) (322)
Loss from discontinued
operations, net of tax $(174) $(3,729 ) $ (398 )
The assets and liabilities at December 31, 2014 presented below
were classified as held for sale.
($ in millions)
At December 31: 2015 2014
Assets:
Accounts receivable $— $245
Inventory — 380
Property, plant & equipment, net — —
Other assets — 92
Total assets $— $717
Liabilities:
Accounts payable $— $177
Deferred income — 87
Other liabilities — 163
Total liabilities $— $427
Industry Standard Server—On January 23, 2014, IBM and Lenovo
Group Limited (Lenovo) announced a definitive agreement in which
Lenovo would acquire the company’s industry standard server
portfolio (System x) for an adjusted purchase price of $2.1 billion,
consisting of approximately $1.8 billion in cash, with the balance in
Lenovo common stock. The stock represented less than 5 percent
equity ownership in Lenovo. The company would sell to Lenovo
its System x, BladeCenter and Flex System blade servers and
switches, x86-based Flex integrated systems, NeXtScale and
iDataPlex servers and associated software, blade networking and
maintenance operations.

Notes to Consolidated Financial Statements
International Business Machines Corporation and Subsidiary Companies
98
IBM and Lenovo entered into a strategic relationship which
included a global OEM and reseller agreement for sales of IBM’s
industry-leading entry and midrange Storwize disk storage
systems, tape storage systems, General Parallel File System soft-
ware, SmartCloud Entry offering, and elements of IBM’s system
software, including Systems Director and Platform Computing
solutions. Effective with the initial closing of the transaction, Lenovo
assumed related customer service and maintenance operations.
IBM will continue to provide maintenance delivery on Lenovo’s
behalf for an extended period of time. In addition, as part of the
transaction agreement, the company will provide Lenovo with cer-
tain transition services, including IT and supply chain services.
The initial term for these transition services ranges from less than
one year to three years. Lenovo can renew certain services for an
additional year.
The initial closing was completed on October 1, 2014. A subse-
quent closing occurred in most other countries in which there was
a large business footprint on December 31, 2014. The remaining
countries closed on March 31, 2015 resulting in a pre-tax gain of
$16 million in the first quarter of 2015. In the second quarter of 2015,
an additional pre-tax gain of $36 million was recorded attributed to
certain adjustments resolved during the quarter. An assessment
of the ongoing contractual terms of the transaction resulted in the
recognition of a pre-tax gain of $11 million in the fourth quarter of
2015. A total pre-tax gain of $63 million was recognized in 2015.
Overall, the company expects to recognize a total pre-tax gain
on the sale of approximately $1.6 billion, which does not include
associated costs related to transition and performance-based
costs. Net of these charges, the pre-tax gain is approximately
$1.2 billion, of which $1.1 billion was recorded in the fourth quarter
of 2014. The balance of the gain is expected to be recognized in
2019 upon conclusion of the maintenance agreement.
Customer Care—On September 10, 2013, IBM and SYNNEX
announced a definitive agreement in which SYNNEX would
acquire the company’s worldwide customer care business pro-
cess outsourcing services business for $501 million, consisting
of approximately $430 million in cash, net of balance sheet
adjustments, and $71 million in SYNNEX common stock, which
represented less than 5 percent equity ownership in SYNNEX. As
part of the transaction, SYNNEX entered into a multi-year agree-
ment with the company, and Concentrix, SYNNEX’s outsourcing
business, became an IBM strategic business partner for global
customer care business process outsourcing services.
The initial closing was completed on January 31, 2014, with
subsequent closings occurring in 2014. For the full year of 2014,
the company recorded a pre-tax gain of $202 million related to
this transaction.
In the second quarter of 2015, resolution of the final balance
sheet adjustments was concluded. An assessment of the ongoing
contractual terms of the transaction resulted in the recognition of
a pre-tax gain of $7 million in 2015. Through December 31, 2015,
the cumulative pre-tax gain attributed to this transaction was
$209 million.
Retail Store Solutions—On April 17, 2012, the company announced
that it had signed a definitive agreement with Toshiba TEC for
the sale of its Retail Store Solutions business. As part of the
transaction, the company agreed to transfer the maintenance
business to Toshiba TEC within three years of the original closing
of the transaction.
The company completed the final phase of the transfer of the
maintenance workforce to Toshiba in the second quarter of 2015.
The parts and inventory transfer to Toshiba will commence in 2018.
An assessment of the ongoing contractual terms of the transaction
resulted in the recognition of a pre-tax gain of $8 million in 2015.
Overall, the company has recognized a cumulative total pre-tax
gain on the sale of $519 million.
Others—In addition to those above, the company completed the
following divestitures:
2015—In the fourth quarter of 2015, the company completed the
divestiture of its Kenexa Compensation Portfolio business to
SCMC Acquisition, LLC. and the divestiture of the Rational System
Architect and SPSS Data Collections suite of products to UNICOM.
In the second quarter of 2015, the company completed the dives-
titure of its Travel & Transportation kiosk business to Embross
North America Ltd., and the divestiture of its Telecom Expense
Management product to Tangoe, Inc. In the first quarter of 2015,
the company completed the divestiture of the Algorithmics Col-
lateral Management suite of products to SmartStream, Inc. and
the divestiture of the Commerce ILOG Supply Chain Optimization
Tools suite of products to Llamasoft, Inc.
All of the above transactions closed in 2015 and the financial
terms related to these transactions were not material. Overall, the
company recorded a pre-tax gain of $81 million related to these
transactions in 2015.
2014—In the second quarter of 2014, the company completed the
divestitures of its solidDB suite of products to UNICOM Systems,
Inc. and its Human Capital Management business line in France
to Sopra Group. In the third quarter of 2014, the company com-
pleted the divestiture of its Cognos Finance product to UNICOM
Systems, Inc., its IMS Tools Suite of products to Rocket Software,
Inc., its Sterling Transportation Management System to Kewill Inc.,
and its ILOG JViews and Elixir Visualization products to Rogue
Wave Software, Inc. In the fourth quarter of 2014, the company
completed the divestiture of its Focal Point and PurifyPlus product
suite to UNICOM Systems, Inc.
All of the above transactions closed in 2014 and the financial
terms related to these transactions were not material. Overall, the
company recorded a pre-tax gain of $132 million related to these
transactions in 2014.

99Notes to Consolidated Financial Statements
International Business Machines Corporation and Subsidiary Companies
NOTE D.
FINANCIAL INSTRUMENTS
Fair Value Measurements
Financial Assets and Liabilities Measured at Fair Value on a Recurring Basis
The following tables present the company’s financial assets and financial liabilities that are measured at fair value on a recurring basis
at December 31, 2015 and 2014.
($ in millions)
At December 31, 2015: Level 1 Level 2 Level 3 Total
Assets
Cash equivalents (1)
Time deposits and certifi cates of deposit $ — $2,856 $— $2,856
Money market funds 2,069 — — 2,069
Other securities — 18 — 18
Total 2,069 2,874 — 4,943 (6)
Debt securities—current (2) — 506 — 506 (6)
Debt securities—noncurrent (3) 1 6 — 8
Trading security investments (3) 28 — — 28
Available-for-sale equity investments (3) 192 — — 192
Derivative assets (4)
Interest rate contracts — 656 — 656
Foreign exchange contracts — 332 — 332
Equity contracts — 6 — 6
Total — 994 — 994 (7)
Total assets $2,290 $4,381 $— $6,671 (7)
Liabilities
Derivative liabilities (5)
Foreign exchange contracts $ — $ 164 $— $ 164
Equity contracts — 19 — 19
Interest rate contracts — 3 — 3
Total liabilities $ — $ 186 $— $ 186 (7)
(1) Included within cash and cash equivalents in the Consolidated Statement of Financial Position.(2) Commercial paper and certificates of deposit reported as marketable securities in the Consolidated Statement of Financial Position.(3) Included within investments and sundry assets in the Consolidated Statement of Financial Position.(4) The gross balances of derivative assets contained within prepaid expenses and other current assets, and investments and sundry assets in the Consolidated Statement
of Financial Position at December 31, 2015 were $292 million and $702 million, respectively.(5) The gross balances of derivative liabilities contained within other accrued expenses and liabilities, and other liabilities in the Consolidated Statement of Financial Position
at December 31, 2015 were $164 million and $22 million, respectively.(6) Available-for-sale securities with carrying values that approximate fair value.(7) If derivative exposures covered by a qualifying master netting agreement had been netted in the Consolidated Statement of Financial Position, the total derivative asset
and liability positions would have been reduced by $139 million each.
2013—In the first quarter of 2013, the company completed the
divestiture of its Showcase Reporting product set to Help/Sys-
tems. In the fourth quarter of 2013, the company completed two
divestitures, the Applicazioni Contabili Gestionali (ACG) business
to TeamSystem and the Cognos Application Development Tools
(ADT) business to UNICOM Systems, Inc.
Financial terms of these transactions did not have a material
impact in the consolidated financial results.

Notes to Consolidated Financial Statements
International Business Machines Corporation and Subsidiary Companies
100
($ in millions)
At December 31, 2014: Level 1 Level 2 Level 3 Total
Assets
Cash equivalents (1)
Time deposits and certifi cates of deposit $ — $3,517 $— $3,517
Commercial paper — 764 — 764
Money market funds 662 — — 662
U.S. government securities — 410 — 410
Other securities — 6 — 6
Total 662 4,697 — 5,359 (5)
Debt securities—noncurrent (2) 1 8 — 9
Trading security investments (2) 74 — — 74
Available-for-sale equity investments (2) 243 — — 243
Derivative assets (3)
Interest rate contracts — 633 — 633
Foreign exchange contracts — 775 — 775
Equity contracts — 24 — 24
Total — 1,432 — 1,432 (6)
Total assets $980 $6,138 $— $7,118 (6)
Liabilities
Derivative liabilities (4)
Foreign exchange contracts $ — $ 177 $— $ 177
Equity contracts — 19 — 19
Total liabilities $ — $ 196 $— $ 196 (6)
(1) Included within cash and cash equivalents in the Consolidated Statement of Financial Position.(2) Included within investments and sundry assets in the Consolidated Statement of Financial Position.(3) The gross balances of derivative assets contained within prepaid expenses and other current assets, and investments and sundry assets in the Consolidated Statement
of Financial Position at December 31, 2014 were $751 million and $681 million, respectively. (4) The gross balances of derivative liabilities contained within other accrued expenses and liabilities, and other liabilities in the Consolidated Statement of Financial Position
at December 31, 2014 were $165 million and $31 million, respectively. (5) Available-for-sale securities with carrying values that approximate fair value. (6) If derivative exposures covered by a qualifying master netting agreement had been netted in the Consolidated Statement of Financial Position, the total derivative asset
and liability positions would have been reduced by $97 million each.
There were no transfers between Levels 1 and 2 for the year ended
December 31, 2015. During the year ended December 31, 2014,
the company transferred trading security investments valued at
$74 million from Level 2 to Level 1 due to the expiration of certain
regulatory restrictions.
Financial Assets and Liabilities Not Measured at Fair Value
Short-Term Receivables and Payables
Notes and other accounts receivable and other investments are
financial assets with carrying values that approximate fair value.
Accounts payable, other accrued expenses and short-term debt
(excluding the current portion of long-term debt) are financial lia-
bilities with carrying values that approximate fair value. If measured
at fair value in the financial statements, these financial instruments
would be classified as Level 3 in the fair value hierarchy.
Loans and Long-Term Receivables
Fair values are based on discounted future cash flows using cur-
rent interest rates offered for similar loans to clients with similar
credit ratings for the same remaining maturities. At December 31,
2015 and 2014, the difference between the carrying amount and
estimated fair value for loans and long-term receivables was
immaterial. If measured at fair value in the financial statements,
these financial instruments would be classified as Level 3 in the
fair value hierarchy.
Long-Term Debt
Fair value of publicly traded long-term debt is based on quoted
market prices for the identical liability when traded as an asset
in an active market. For other long-term debt for which a quoted

Notes to Consolidated Financial Statements
International Business Machines Corporation and Subsidiary Companies
101
market price is not available, an expected present value technique
that uses rates currently available to the company for debt with
similar terms and remaining maturities is used to estimate fair
value. The carrying amount of long-term debt is $33,428 million
and $34,991 million and the estimated fair value is $35,220 million
and $37,524 million at December 31, 2015 and 2014, respectively. If
measured at fair value in the financial statements, long-term debt
(including the current portion) would be classified as Level 2 in the
fair value hierarchy.
Debt and Marketable Equity SecuritiesThe company’s cash equivalents and current debt securities are
considered available-for-sale and recorded at fair value, which is
not materially different from carrying value, in the Consolidated
Statement of Financial Position.
The following tables summarize the company’s noncurrent
debt and marketable equity securities which are also considered
available-for-sale and recorded at fair value in the Consolidated
Statement of Financial Position.
($ in millions)
At December 31, 2015:Adjusted
Cost
GrossUnrealized
Gains
GrossUnrealized
LossesFair
Value
Debt securities—noncurrent (1) $ 5 $3 $ — $ 8
Available-for-sale equity investments (1) $186 $6 $ 0 $192
(1) Included within investments and sundry assets in the Consolidated Statement of Financial Position.
($ in millions)
At December 31, 2014:Adjusted
Cost
GrossUnrealized
Gains
GrossUnrealized
LossesFair
Value
Debt securities—noncurrent (1) $ 7 $3 $ — $ 9
Available-for-sale equity investments (1) $272 $2 $ 31 $243
(1) Included within investments and sundry assets in the Consolidated Statement of Financial Position.
During the fourth quarter of 2014, the company acquired equity
securities in conjunction with the sale of System x business which
are classified as available-for-sale securities. Based on an evalua-
tion of available evidence as of December 31, 2015, the company
recorded an other-than-temporary impairment due to the dura-
tion and extent of the decline in fair value of these securities. The
impairment charge of $86 million was recorded in other (income)
and expense in the Consolidated Statement of Earnings. The
adjusted cost basis of these securities was $185 million as of
December 31, 2015.
Sales of debt and available-for-sale equity investments during
the period were as follows:
($ in millions)
For the year ended December 31: 2015 2014 2013
Proceeds $8 $21 $41
Gross realized gains (before taxes) 1 0 13
Gross realized losses (before taxes) 1 5 5
The after-tax net unrealized gains/(losses) on available-for-sale
debt and equity securities that have been included in other com-
prehensive income/(loss) and the after-tax net (gains)/losses
reclassified from accumulated other comprehensive income/(loss)
to net income were as follows:
($ in millions)
For the year ended December 31: 2015 2014
Net unrealized gains/(losses)
arising during the period $(33) $(18)
Net unrealized (gains)/losses
reclassifi ed to net income* 53 3
* Includes pre-tax writedowns of $86 million in 2015. There were no writedowns in 2014.
The contractual maturities of substantially all available-for-sale
debt securities are less than one year at December 31, 2015.
Derivative Financial InstrumentsThe company operates in multiple functional currencies and is
a significant lender and borrower in the global markets. In the
normal course of business, the company is exposed to the impact
of interest rate changes and foreign currency fluctuations, and to
a lesser extent equity and commodity price changes and client
credit risk. The company limits these risks by following estab-
lished risk management policies and procedures, including the
use of derivatives, and, where cost effective, financing with debt
in the currencies in which assets are denominated. For interest
rate exposures, derivatives are used to better align rate move-
ments between the interest rates associated with the company’s

Notes to Consolidated Financial Statements
International Business Machines Corporation and Subsidiary Companies
102
lease and other financial assets and the interest rates associated
with its financing debt. Derivatives are also used to manage the
related cost of debt. For foreign currency exposures, derivatives
are used to better manage the cash flow volatility arising from for-
eign exchange rate fluctuations.
As a result of the use of derivative instruments, the company
is exposed to the risk that counterparties to derivative contracts
will fail to meet their contractual obligations. To mitigate the coun-
terparty credit risk, the company has a policy of only entering
into contracts with carefully selected major financial institutions
based upon their overall credit profile. The company’s established
policies and procedures for mitigating credit risk on principal
transactions include reviewing and establishing limits for credit
exposure and continually assessing the creditworthiness of coun-
terparties. The right of set-off that exists under certain of these
arrangements enables the legal entities of the company subject
to the arrangement to net amounts due to and from the counter-
party reducing the maximum loss from credit risk in the event of
counterparty default.
The company is also a party to collateral security arrange-
ments with most of its major derivative counterparties. These
arrangements require the company to hold or post collateral (cash
or U.S. Treasury securities) when the derivative fair values exceed
contractually established thresholds. Posting thresholds can be
fixed or can vary based on credit default swap pricing or credit
ratings received from the major credit agencies. The aggregate
fair value of all derivative instruments under these collateralized
arrangements that were in a liability position at December 31, 2015
and 2014 was $28 million and $21 million, respectively, for which
no collateral was posted at either date. Full collateralization of
these agreements would be required in the event that the com-
pany’s credit rating falls below investment grade or if its credit
default swap spread exceeds 250 basis points, as applicable,
pursuant to the terms of the collateral security arrangements.
The aggregate fair value of derivative instruments in net asset
positions as of December 31, 2015 and 2014 was $994 million
and $1,432 million, respectively. This amount represents the max-
imum exposure to loss at the reporting date as a result of the
counterparties failing to perform as contracted. This exposure
was reduced by $139 million and $97 million at December 31,
2015 and 2014, respectively, of liabilities included in master netting
arrangements with those counterparties. Additionally, at Decem-
ber 31, 2015 and 2014, this exposure was reduced by $90 million
and $487 million of cash collateral and $40 million and $31 million
of non-cash collateral in U.S. Treasury securities, respectively,
received by the company. At December 31, 2015 and 2014, the net
exposure related to derivative assets recorded in the Statement
of Financial Position was $726 million and $817 million, respec-
tively. At December 31, 2015 and 2014, the net amount related to
derivative liabilities recorded in the Statement of Financial Position
was $47 million and $99 million, respectively.
In the Consolidated Statement of Financial Position, the com-
pany does not offset derivative assets against liabilities in master
netting arrangements nor does it offset receivables or payables
recognized upon payment or receipt of cash collateral against the
fair values of the related derivative instruments. No amount was
recognized in other receivables at December 31, 2015 and 2014
for the right to reclaim cash collateral. The amount recognized
in accounts payable for the obligation to return cash collateral
totaled $90 million and $487 million at December 31, 2015 and
2014, respectively. The company restricts the use of cash collateral
received to rehypothecation, and therefore, reports it in prepaid
expenses and other current assets in the Consolidated Statement
of Financial Position. No amount was rehypothecated at Decem-
ber 31, 2015 and 2014.
The company may employ derivative instruments to hedge the
volatility in stockholders’ equity resulting from changes in currency
exchange rates of significant foreign subsidiaries of the company
with respect to the U.S. dollar. These instruments, designated as
net investment hedges, expose the company to liquidity risk as
the derivatives have an immediate cash flow impact upon matu-
rity which is not offset by a cash flow from the translation of the
underlying hedged equity. The company monitors this cash loss
potential on an ongoing basis, and may discontinue some of these
hedging relationships by de-designating or terminating the deriv-
ative instrument in order to manage the liquidity risk. Although not
designated as accounting hedges, the company may utilize deriv-
atives to offset the changes in the fair value of the de-designated
instruments from the date of de-designation until maturity.
In its hedging programs, the company uses forward contracts,
futures contracts, interest-rate swaps, cross-currency swaps and
options depending upon the underlying exposure. The company
is not a party to leveraged derivative instruments.
A brief description of the major hedging programs, categorized
by underlying risk, follows.
Interest Rate Risk
Fixed and Variable Rate Borrowings
The company issues debt in the global capital markets, principally
to fund its financing lease and loan portfolio. Access to cost-ef-
fective financing can result in interest rate mismatches with the
underlying assets. To manage these mismatches and to reduce
overall interest cost, the company uses interest rate swaps to
convert specific fixed-rate debt issuances into variable-rate debt
(i.e., fair value hedges) and to convert specific variable-rate debt
issuances into fixed-rate debt (i.e., cash flow hedges). At Decem-
ber 31, 2015 and 2014, the total notional amount of the company’s
interest rate swaps was $7.3 billion and $5.8 billion, respectively.
The weighted-average remaining maturity of these instruments
at December 31, 2015 and 2014 was approximately 7.2 years and
8.7 years, respectively.

Notes to Consolidated Financial Statements
International Business Machines Corporation and Subsidiary Companies
103
Forecasted Debt Issuance
The company is exposed to interest rate volatility on future
debt issuances. To manage this risk, the company may use for-
ward-starting interest rate swaps to lock in the rate on the interest
payments related to the forecasted debt issuance. These swaps
are accounted for as cash flow hedges. The company did not have
any derivative instruments relating to this program outstanding at
December 31, 2015 and 2014.
At December 31, 2015 and 2014, net gains of less than $1 million
(before taxes), respectively, were recorded in accumulated other
comprehensive income/(loss) in connection with cash flow hedges
of the company’s borrowings. Within these amounts, less than
$1 million of gains, respectively, are expected to be reclassified
to net income within the next 12 months, providing an offsetting
economic impact against the underlying transactions.
Foreign Exchange Risk
Long-Term Investments in Foreign Subsidiaries
(Net Investment)
A large portion of the company’s foreign currency denominated
debt portfolio is designated as a hedge of net investment in for-
eign subsidiaries to reduce the volatility in stockholders’ equity
caused by changes in foreign currency exchange rates in the
functional currency of major foreign subsidiaries with respect to
the U.S. dollar. The company also uses cross-currency swaps and
foreign exchange forward contracts for this risk management pur-
pose. At December 31, 2015 and 2014, the total notional amount of
derivative instruments designated as net investment hedges was
$5.5 billion and $2.2 billion, respectively. The weighted-average
remaining maturity of these instruments at December 31, 2015 and
2014 was approximately 0.2 years for both periods.
Anticipated Royalties and Cost Transactions
The company’s operations generate significant nonfunctional cur-
rency, third-party vendor payments and intercompany payments for
royalties and goods and services among the company’s non-U.S.
subsidiaries and with the parent company. In anticipation of these
foreign currency cash flows and in view of the volatility of the cur-
rency markets, the company selectively employs foreign exchange
forward contracts to manage its currency risk. These forward con-
tracts are accounted for as cash flow hedges. The maximum length
of time over which the company is hedging its exposure to the vari-
ability in future cash flows is four years. At December 31, 2015 and
2014, the total notional amount of forward contracts designated as
cash flow hedges of forecasted royalty and cost transactions was
$8.2 billion and $9.3 billion, respectively, with a weighted-average
remaining maturity of 0.7 years for both periods.
At December 31, 2015 and 2014, in connection with cash flow
hedges of anticipated royalties and cost transactions, the company
recorded net gains of $147 million and net gains of $602 million
(before taxes), respectively, in accumulated other comprehensive
income/(loss). Within these amounts $121 million of gains and
$572 million of gains, respectively, are expected to be reclassified
to net income within the next 12 months, providing an offsetting
economic impact against the underlying anticipated transactions.
Foreign Currency Denominated Borrowings
The company is exposed to exchange rate volatility on foreign
currency denominated debt. To manage this risk, the company
employs cross-currency swaps to convert fixed-rate foreign cur-
rency denominated debt to fixed-rate debt denominated in the
functional currency of the borrowing entity. These swaps are
accounted for as cash flow hedges. The maximum length of time
over which the company hedges its exposure to the variability in
future cash flows is approximately seven years. At December 31,
2015 and December 31, 2014, no amounts were outstanding under
this program.
At December 31, 2015 and 2014, in connection with cash flow
hedges of foreign currency denominated borrowings, the company
recorded net losses of $2 million (before taxes), respectively, in
accumulated other comprehensive income/(loss). Within these
amounts, less than $1 million of losses, respectively, are expected
to be reclassified to net income within the next 12 months, provid-
ing an offsetting economic impact against the underlying exposure.
Subsidiary Cash and Foreign Currency
Asset/Liability Management
The company uses its Global Treasury Centers to manage the
cash of its subsidiaries. These centers principally use currency
swaps to convert cash flows in a cost-effective manner. In addi-
tion, the company uses foreign exchange forward contracts to
economically hedge, on a net basis, the foreign currency exposure
of a portion of the company’s nonfunctional currency assets and
liabilities. The terms of these forward and swap contracts are gen-
erally less than one year. The changes in the fair values of these
contracts and of the underlying hedged exposures are generally
offsetting and are recorded in other (income) and expense in the
Consolidated Statement of Earnings. At December 31, 2015 and
2014, the total notional amount of derivative instruments in eco-
nomic hedges of foreign currency exposure was $11.7 billion and
$13.1 billion, respectively.
Equity Risk ManagementThe company is exposed to market price changes in certain broad
market indices and in the company’s own stock primarily related to
certain obligations to employees. Changes in the overall value of
these employee compensation obligations are recorded in SG&A
expense in the Consolidated Statement of Earnings. Although not
designated as accounting hedges, the company utilizes deriva-
tives, including equity swaps and futures, to economically hedge
the exposures related to its employee compensation obligations.
The derivatives are linked to the total return on certain broad
market indices or the total return on the company’s common stock.
They are recorded at fair value with gains or losses also reported
in SG&A expense in the Consolidated Statement of Earnings. At
December 31, 2015 and 2014, the total notional amount of deriv-
ative instruments in economic hedges of these compensation
obligations was $1.2 billion and $1.3 billion, respectively.
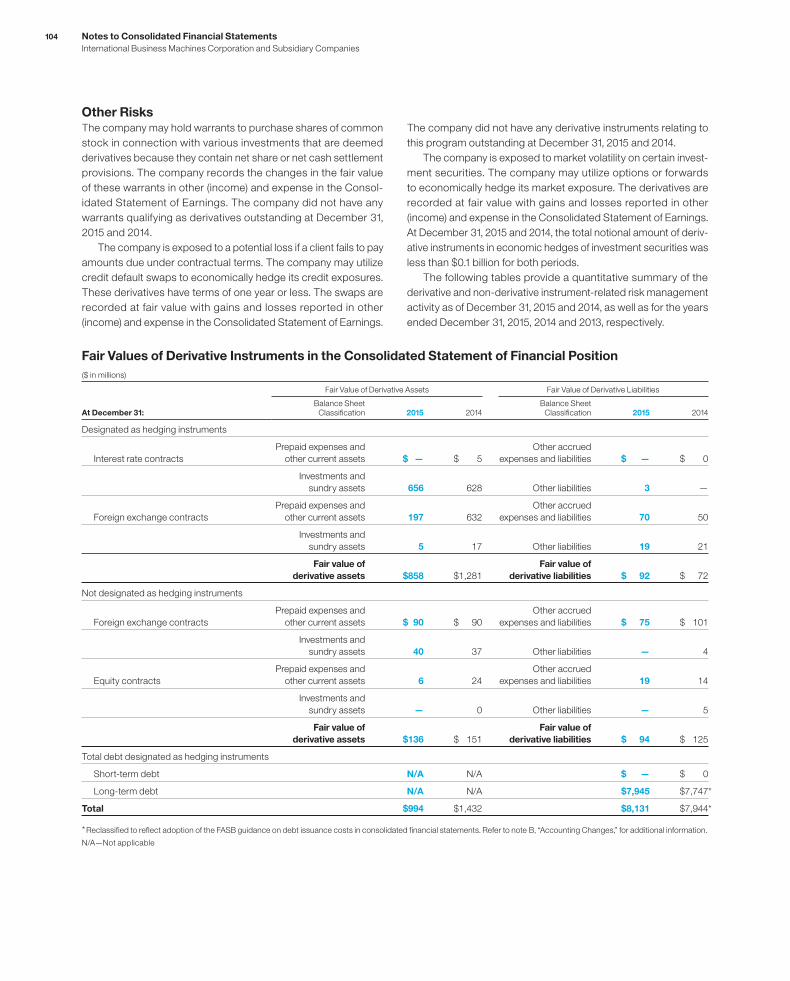
Notes to Consolidated Financial Statements
International Business Machines Corporation and Subsidiary Companies
104
Other RisksThe company may hold warrants to purchase shares of common
stock in connection with various investments that are deemed
derivatives because they contain net share or net cash settlement
provisions. The company records the changes in the fair value
of these warrants in other (income) and expense in the Consol-
idated Statement of Earnings. The company did not have any
warrants qualifying as derivatives outstanding at December 31,
2015 and 2014.
The company is exposed to a potential loss if a client fails to pay
amounts due under contractual terms. The company may utilize
credit default swaps to economically hedge its credit exposures.
These derivatives have terms of one year or less. The swaps are
recorded at fair value with gains and losses reported in other
(income) and expense in the Consolidated Statement of Earnings.
The company did not have any derivative instruments relating to
this program outstanding at December 31, 2015 and 2014.
The company is exposed to market volatility on certain invest-
ment securities. The company may utilize options or forwards
to economically hedge its market exposure. The derivatives are
recorded at fair value with gains and losses reported in other
(income) and expense in the Consolidated Statement of Earnings.
At December 31, 2015 and 2014, the total notional amount of deriv-
ative instruments in economic hedges of investment securities was
less than $0.1 billion for both periods.
The following tables provide a quantitative summary of the
derivative and non-derivative instrument-related risk management
activity as of December 31, 2015 and 2014, as well as for the years
ended December 31, 2015, 2014 and 2013, respectively.
Fair Values of Derivative Instruments in the Consolidated Statement of Financial Position
($ in millions)
Fair Value of Derivative Assets Fair Value of Derivative Liabilities
At December 31:Balance Sheet
Classifi cation 2015 2014Balance Sheet
Classifi cation 2015 2014
Designated as hedging instruments
Interest rate contracts
Prepaid expenses and
other current assets $ — $ 5
Other accrued
expenses and liabilities $ — $ 0
Investments and
sundry assets 656 628 Other liabilities 3 —
Foreign exchange contracts
Prepaid expenses and
other current assets 197 632
Other accrued
expenses and liabilities 70 50
Investments and
sundry assets 5 17 Other liabilities 19 21
Fair value of
derivative assets $858 $1,281
Fair value of
derivative liabilities $ 92 $ 72
Not designated as hedging instruments
Foreign exchange contracts
Prepaid expenses and
other current assets $ 90 $ 90
Other accrued
expenses and liabilities $ 75 $ 101
Investments and
sundry assets 40 37 Other liabilities — 4
Equity contracts
Prepaid expenses and
other current assets 6 24
Other accrued
expenses and liabilities 19 14
Investments and
sundry assets — 0 Other liabilities — 5
Fair value of
derivative assets $136 $ 151
Fair value of
derivative liabilities $ 94 $ 125
Total debt designated as hedging instruments
Short-term debt N/A N/A $ — $ 0
Long-term debt N/A N/A $7,945 $7,747*
Total $994 $1,432 $8,131 $7,944 *
* Reclassified to reflect adoption of the FASB guidance on debt issuance costs in consolidated financial statements. Refer to note B, “Accounting Changes,” for additional information.
N/A—Not applicable

Notes to Consolidated Financial Statements
International Business Machines Corporation and Subsidiary Companies
105
The Effect of Derivative Instruments in the Consolidated Statement of Earnings
($ in millions)
Gain/(Loss) Recognized in Earnings
Consolidated Statement of
Earnings Line Item
Recognized on Derivatives (1)Attributable to Risk
Being Hedged (2)
For the year ended December 31: 2015 2014 2013 2015 2014 2013
Derivative instruments in fair value hedges (5)
Interest rate contracts Cost of fi nancing $108 $ 231 $(109) $(1) $(127) $202
Interest expense 94 206 (74) (1) (114) 138
Derivative instruments not designated
as hedging instruments (1)
Foreign exchange contracts
Other (income)
and expense 127 (776) (328) N/A N/A N/A
Interest rate contracts
Other (income)
and expense (1) 34 — N/A N/A N/A
Equity contracts SG&A expense (27) 51 164 N/A N/A N/A
Other (income)
and expense (9) (9) — N/A N/A N/A
Total $291 $(263) $(347) $(1) $(241) $340
($ in millions)
Gain/(Loss) Recognized in Earnings and Other Comprehensive Income
Effective Portion Recognized in OCI
Consolidated Statement of
Earnings Line Item
Effective Portion Reclassifi ed from AOCI
Ineffectiveness and Amounts Excluded from Effectiveness Testing (3)
For the year ended December 31: 2015 2014 2013 2015 2014 2013 2015 2014 2013
Derivative instruments in
cash fl ow hedges
Interest rate contracts $ — $ — $ — Interest expense $ 0 $ (1) $ — $ — $— $—
Foreign exchange contracts 618 958 43
Other (income)
and expense 731 98 162 5 (1) 0
Cost of sales 192 (15) (34) — — —
SG&A expense 149 15 39 — — —
Instruments in net investment hedges (4)
Foreign exchange contracts 889 1,136 173 Interest expense — — — 13 0 3
Total $1,507 $2,095 $216 $1,072 $ 97 $167 $18 $ (1) $ 3
(1) The amount includes changes in clean fair values of the derivative instruments in fair value hedging relationships and the periodic accrual for coupon payments required under
these derivative contracts. (2) The amount includes basis adjustments to the carrying value of the hedged item recorded during the period and amortization of basis adjustments recorded on de-designated
hedging relationships during the period. (3) The amount of gain/(loss) recognized in income represents ineffectiveness on hedge relationships. (4) Instruments in net investment hedges include derivative and non-derivative instruments.(5) For the years ended December 31, 2015 and December 31, 2014, fair value hedges resulted in a loss of $2 million and a gain of $4 million in ineffectiveness, respectively.
There were no amounts recorded as ineffectiveness on fair value hedges for the year ended December 31, 2013.
N/A—Not applicable
For the 12 months ending December 31, 2015, 2014 and 2013, there
were no significant gains or losses recognized in earnings repre-
senting hedge ineffectiveness or excluded from the assessment
of hedge effectiveness (for fair value hedges), or associated with
an underlying exposure that did not or was not expected to occur
(for cash flow hedges); nor are there any anticipated in the normal
course of business.

Notes to Consolidated Financial Statements
International Business Machines Corporation and Subsidiary Companies
106
NOTE E.
INVENTORIES
($ in millions)
At December 31: 2015 2014
Finished goods $ 352 $ 430
Work in process and raw materials 1,199 1,674
Total $1,551 $2,103
NOTE F.
FINANCING RECEIVABLES
The following table presents financing receivables, net of allow-
ances for credit losses, including residual values.
($ in millions)
At December 31: 2015 2014
Current
Net investment in sales-type
and direct fi nancing leases $ 3,057 $ 3,781
Commercial fi nancing receivables 8,948 8,423
Client loan and installment
payment receivables (loans) 7,015 7,631
Total $19,020 $19,835
Noncurrent
Net investment in sales-type
and direct fi nancing leases $ 4,501 $ 4,449
Client loan and installment
payment receivables (loans) 5,512 6,660
Total $10,013 $11,109
Net investment in sales-type and direct financing leases relates
principally to the company’s systems products and are for terms
ranging generally from two to six years. Net investment in sales-
type and direct financing leases includes unguaranteed residual
values of $645 million and $671 million at December 31, 2015 and
2014, respectively, and is reflected net of unearned income of
$536 million and $517 million, and net of the allowance for credit
losses of $213 million and $165 million at those dates, respectively.
Scheduled maturities of minimum lease payments outstanding at
December 31, 2015, expressed as a percentage of the total, are
approximately: 2016, 44 percent; 2017, 27 percent; 2018, 18 per-
cent; 2019, 8 percent; and 2020 and beyond, 3 percent.
Commercial financing receivables, net of allowance for credit
losses of $19 million and $17 million at December 31, 2015 and
2014, respectively, relate primarily to inventory and accounts
receivable financing for dealers and remarketers of IBM and OEM
products. Payment terms for inventory and accounts receivable
financing generally range from 30 to 90 days.
Client loan and installment payment receivables (loans), net
of allowance for credit losses of $377 million and $396 million
at December 31, 2015 and 2014, respectively, are loans that are
provided primarily to clients to finance the purchase of hardware,
software and services. Payment terms on these financing arrange-
ments are generally for terms up to seven years.
Client loan and installment payment financing contracts are
priced independently at competitive market rates. The company
has a history of enforcing these financing agreements.
The company utilizes certain of its financing receivables as col-
lateral for nonrecourse borrowings. Financing receivables pledged
as collateral for borrowings were $545 million and $642 million at
December 31, 2015 and 2014, respectively. These borrowings are
included in note J, “Borrowings,” on pages 111 to 113.
The company did not have any financing receivables held for
sale as of December 31, 2015 and 2014.
Financing Receivables by Portfolio SegmentThe following tables present financing receivables on a gross
basis, excluding the allowance for credit losses and residual
value, by portfolio segment and by class, excluding commercial
financing receivables and other miscellaneous financing receiv-
ables at December 31, 2015 and 2014. The company determines
its allowance for credit losses based on two portfolio segments:
lease receivables and loan receivables, and further segments the
portfolio into two classes: major markets and growth markets.
($ in millions)
At December 31, 2015:Major
MarketsGrowth
Markets Total
Financing receivables
Lease receivables $ 5,517 $1,524 $ 7,041
Loan receivables 9,739 3,165 12,904
Ending balance $15,256 $4,689 $19,945
Collectively evaluated for impairment $15,180 $4,227 $19,406
Individually evaluated for impairment $ 76 $ 462 $ 539
Allowance for credit losses
Beginning balance at
January 1, 2015
Lease receivables $ 32 $ 133 $ 165
Loan receivables 79 317 396
Total $ 111 $ 450 $ 561
Write-offs (14) (48) (62)
Provision 20 122 141
Other (8) (43) (51)
Ending balance at
December 31, 2015 $ 109 $ 481 $ 590
Lease receivables $ 25 $ 188 $ 213
Loan receivables $ 83 $ 293 $ 377
Collectively evaluated for impairment $ 43 $ 36 $ 79
Individually evaluated for impairment $ 65 $ 445 $ 511

107Notes to Consolidated Financial Statements
International Business Machines Corporation and Subsidiary Companies
($ in millions)
At December 31, 2014:Major
MarketsGrowth
Markets Total
Financing receivables
Lease receivables $ 5,702 $1,943 $ 7,645
Loan receivables 10,049 4,639 14,687
Ending balance $15,751 $6,581 $22,332
Collectively evaluated for impairment $15,665 $6,156 $21,821
Individually evaluated for impairment $ 86 $ 425 $ 511
Allowance for credit losses
Beginning balance at
January 1, 2014
Lease receivables $ 42 $ 80 $ 123
Loan receivables 95 147 242
Total $ 137 $ 228 $ 365
Write-offs (18) (6) (24)
Provision 3 240 243
Other (12) (11) (23)
Ending balance at
December 31, 2014 $ 111 $ 450 $ 561
Lease receivables $ 32 $ 133 $ 165
Loan receivables $ 79 $ 317 $ 396
Collectively evaluated for impairment $ 42 $ 39 $ 81
Individually evaluated for impairment $ 69 $ 411 $ 480
When determining the allowances, financing receivables are
evaluated either on an individual or a collective basis. For indi-
vidually evaluated receivables, the company determines the
expected cash flow for the receivable and calculates an estimate
of the potential loss and the probability of loss. For those accounts
in which the loss is probable, the company records a specific
reserve. In addition, the company records an unallocated reserve
that is calculated by applying a reserve rate to its different portfo-
lios, excluding accounts that have been specifically reserved. This
reserve rate is based upon credit rating, probability of default, term,
characteristics (lease/loan) and loss history.
Financing Receivables on Non-Accrual StatusThe following table presents the recorded investment in financing
receivables which were on non-accrual status at December 31,
2015 and 2014.
($ in millions)
At December 31: 2015 2014
Major markets $ 2 $ 13
Growth markets 63 40
Total lease receivables $ 65 $ 53
Major markets $ 13 $ 27
Growth markets 91 151
Total loan receivables $104 $178
Total receivables $168 $231
Impaired LoansThe company considers any loan with an individually evaluated
reserve as an impaired loan. Depending on the level of impairment,
loans will also be placed on a non-accrual status. The following
tables present impaired client loan receivables at December 31,
2015 and 2014.
($ in millions)
At December 31, 2015:Recorded
InvestmentRelated
Allowance
Major markets $ 50 $ 47
Growth markets 297 284
Total $347 $331
($ in millions)
At December 31, 2014:Recorded
InvestmentRelated
Allowance
Major markets $ 54 $ 47
Growth markets 299 293
Total $353 $340
($ in millions)
For the year ended December 31, 2015:
Average Recorded
Investment
Interest Income
Recognized
Interest Income
Recognized on Cash
Basis
Major markets $ 51 $0 $—
Growth markets 315 0 —
Total $367 $0 $—
($ in millions)
For the year ended December 31, 2014:
Average Recorded
Investment
Interest Income
Recognized
Interest Income
Recognized on Cash
Basis
Major markets $ 68 $0 $—
Growth markets 208 0 —
Total $276 $0 $—

Notes to Consolidated Financial Statements
International Business Machines Corporation and Subsidiary Companies
108
Credit Quality IndicatorsThe company’s credit quality indicators, which are based on rating
agency data, publicly available information and information pro-
vided by customers, are reviewed periodically based on the relative
level of risk. The resulting indicators are a numerical rating system
that maps to Moody’s Investors Service credit ratings as shown
below. The company uses information provided by Moody’s, where
available, as one of many inputs in its determination of customer
credit rating.
The tables present the gross recorded investment for each
class of receivables, by credit quality indicator, at December 31,
2015 and 2014. Receivables with a credit quality indicator ranging
from Aaa to Baa3 are considered investment grade. All others are
considered non-investment grade. The credit quality indicators do
not reflect mitigation actions that the company may take to transfer
credit risk to third parties.
Lease Receivables
($ in millions)
At December 31, 2015:Major
MarketsGrowth
Markets
Credit rating
Aaa – Aa3 $ 538 $ 39
A1 – A3 1,324 162
Baa1 – Baa3 1,493 392
Ba1 – Ba2 1,214 352
Ba3 – B1 513 277
B2 – B3 403 215
Caa – D 33 87
Total $5,517 $1,524
Loan Receivables
($ in millions)
At December 31, 2015:Major
MarketsGrowth
Markets
Credit rating
Aaa – Aa3 $ 949 $ 80
A1 – A3 2,338 336
Baa1 – Baa3 2,635 813
Ba1 – Ba2 2,143 732
Ba3 – B1 905 576
B2 – B3 711 447
Caa – D 59 181
Total $9,739 $3,165
At December 31, 2015, the industries which made up Global
Financing’s receivables portfolio consisted of: Financial (36 per-
cent), Manufacturing (14 percent), Government (11 percent),
Services (11 percent), Retail (9 percent), Communications (7 per-
cent), Healthcare (6 percent) and Other (6 percent).
Lease Receivables
($ in millions)
At December 31, 2014:Major
MarketsGrowth
Markets
Credit rating
Aaa – Aa3 $ 563 $ 46
A1 – A3 1,384 178
Baa1 – Baa3 1,704 900
Ba1 – Ba2 1,154 272
Ba3 – B1 470 286
B2 – B3 372 176
Caa – D 55 85
Total $5,702 $1,943
Loan Receivables
($ in millions)
At December 31, 2014:Major
MarketsGrowth
Markets
Credit rating
Aaa – Aa3 $ 993 $ 110
A1 – A3 2,438 425
Baa1 – Baa3 3,003 2,148
Ba1 – Ba2 2,034 649
Ba3 – B1 827 683
B2 – B3 655 420
Caa – D 98 203
Total $10,049 $4,639
At December 31, 2014, the industries which made up Global
Financing’s receivables portfolio consisted of: Financial (40 per-
cent), Manufacturing (14 percent), Government (13 percent),
Services (9 percent), Retail (8 percent), Communications (6 per-
cent), Healthcare (5 percent) and Other (5 percent).

Notes to Consolidated Financial Statements
International Business Machines Corporation and Subsidiary Companies
109
Past Due Financing Receivables
($ in millions)
At December 31, 2015:
Total Past Due
> 90 Days* Current*
Total Financing
Receivables*
Recorded Investment > 90 Days
and Accruing
Major markets $ 5 $ 5,512 $ 5,517 $ 5
Growth markets 30 1,494 1,524 13
Total lease receivables $35 $ 7,006 $ 7,041 $19
Major markets $ 7 $ 9,732 $ 9,739 $ 7
Growth markets 31 3,134 3,165 14
Total loan receivables $38 $12,866 $12,904 $22
Total $73 $19,872 $19,945 $40
* Does not include accounts that are fully reserved.
($ in millions)
At December 31, 2014:
Total Past Due
> 90 Days* Current* **
Total Financing
Receivables* **
Recorded Investment > 90 Days
and Accruing**
Major markets $ 6 $ 5,696 $ 5,702 $ 6
Growth markets 32 1,911 1,943 14
Total lease receivables $38 $ 7,607 $ 7,645 $20
Major markets $ 9 $10,040 $10,049 $ 9
Growth markets 35 4,603 4,639 18
Total loan receivables $44 $14,643 $14,687 $27
Total $82 $22,250 $22,332 $47
* Does not include accounts that are fully reserved.
** Reclassified to conform with 2015 presentation.
Troubled Debt RestructuringsThe company assessed all restructurings that occurred on or after
January 1, 2014 and determined that there were no significant trou-
bled debt restructurings for the years ended December 31, 2014
and 2015.
NOTE G.
PROPERTY, PLANT AND EQUIPMENT
($ in millions)
At December 31: 2015 2014
Land and land improvements $ 558 $ 667
Buildings and building improvements 6,552 9,524
Plant, laboratory and offi ce equipment 21,116 27,388
Plant and other property—gross 28,226 37,578
Less: Accumulated depreciation 18,051 27,500
Plant and other property—net 10,176 10,078
Rental machines 1,115 1,456
Less: Accumulated depreciation 565 763
Rental machines—net 551 693
Total—net $10,727 $10,771
In 2015, the company retired the assets associated with the dives-
titure of the Microelectronics business impacting both plant and
other property—gross and accumulated depreciation.
Past Due Financing Receivables
($ in millions)
At December 31, 2015:
Total Past Due
> 90 Days* Current
Total Financing
Receivables
Recorded Investment > 90 Days
and Accruing
Major markets $ 5 $ 5,512 $ 5,517 $ 5
Growth markets 30 1,494 1,524 13
Total lease receivables $35 $ 7,006 $ 7,041 $19
Major markets $ 7 $ 9,732 $ 9,739 $ 7
Growth markets 31 3,134 3,165 14
Total loan receivables $38 $12,866 $12,904 $22
Total $73 $19,872 $19,945 $40
* Does not include accounts that are fully reserved.
($ in millions)
At December 31, 2014:
Total Past Due
> 90 Days* Current
Total Financing
Receivables
Recorded Investment > 90 Days
and Accruing
Major markets $ 6 $ 5,696 $ 5,702 $ 6
Growth markets 32 1,911 1,943 14
Total lease receivables $38 $ 7,607 $ 7,645 $20
Major markets $ 9 $10,040 $10,049 $ 9
Growth markets 35 4,603 4,639 18
Total loan receivables $44 $14,643 $14,687 $27
Total $82 $22,250 $22,332 $47
* Does not include accounts that are fully reserved.
Troubled Debt RestructuringsThe company assessed all restructurings that occurred on or after
January 1, 2014 and determined that there were no significant trou-
bled debt restructurings for the years ended December 31, 2014
and 2015.
NOTE G.
PROPERTY, PLANT AND EQUIPMENT
($ in millions)
At December 31: 2015 2014
Land and land improvements $ 558 $ 667
Buildings and building improvements 6,552 9,524
Plant, laboratory and offi ce equipment 21,116 27,388
Plant and other property—gross 28,226 37,578
Less: Accumulated depreciation 18,051 27,500
Plant and other property—net 10,176 10,078
Rental machines 1,115 1,456
Less: Accumulated depreciation 565 763
Rental machines—net 551 693
Total—net $10,727 $10,771
In 2015, the company retired the assets associated with the dives-
titure of the Microelectronics business impacting both plant and
other property—gross and accumulated depreciation.

Notes to Consolidated Financial Statements
International Business Machines Corporation and Subsidiary Companies
110
NOTE H.
INVESTMENTS AND SUNDRY ASSETS
($ in millions)
At December 31: 2015 2014
Deferred transition and setup costs
and other deferred arrangements* $1,624 $1,527
Derivatives—noncurrent 702 681
Alliance investments
Equity method 82 98
Non-equity method 393 496
Prepaid software 273 332
Long-term deposits 256 300
Other receivables 516 509
Employee benefi t-related 273 356
Prepaid income taxes 496 518
Other assets 571 705**
Total $5,187 $5,520 **
* Deferred transition and setup costs and other deferred arrangements are related
to Global Services client arrangements. Refer to note A, “Significant Accounting
Policies,” on page 85 for additional information.
** Reclassified to reflect adoption of the FASB guidance on debt issuance costs
in consolidated financial statements. Refer to note B, “Accounting Changes,” for
additional information.
NOTE I.
INTANGIBLE ASSETS INCLUDING GOODWILL
Intangible AssetsThe following table details the company’s intangible asset bal-
ances by major asset class.
($ in millions)
At December 31, 2015:
Gross Carrying Amount
Accumulated Amortization
Net Carrying Amount
Intangible asset class
Capitalized software $1,348 $ (581) $ 767
Client relationships 1,856 (927) 929
Completed technology 2,960 (1,397) 1,563
Patents/trademarks 335 (142) 193
Other* 44 (10) 35
Total $6,543 $(3,057) $3,487
* Other intangibles are primarily acquired proprietary and nonproprietary business
processes, methodologies and systems.
($ in millions)
At December 31, 2014:
Gross Carrying Amount
Accumulated Amortization
Net Carrying Amount
Intangible asset class
Capitalized software $1,375 $ (679) $ 696
Client relationships 2,208 (1,271) 937
Completed technology 2,831 (1,533) 1,298
Patents/trademarks 374 (214) 161
Other* 18 (6) 12
Total $6,806 $(3,702) $3,104
* Other intangibles are primarily acquired proprietary and nonproprietary business
processes, methodologies and systems.
The net carrying amount of intangible assets increased $383 mil-
lion during the year ended December 31, 2015, primarily due to
intangible asset additions resulting from acquisitions, partially
offset by amortization. There was no impairment of intangible
assets recorded in 2015 and 2014. The aggregate intangible amor-
tization expense was $1,193 million and $1,347 million for the years
ended December 31, 2015 and 2014, respectively. In addition, in
2015 and 2014, respectively, the company retired $1,809 million
and $724 million of fully amortized intangible assets, impacting
both the gross carrying amount and accumulated amortization
by this amount.
The amortization expense for each of the five succeeding years
relating to intangible assets currently recorded in the Consolidated
Statement of Financial Position is estimated to be the following at
December 31, 2015:
($ in millions)
Capitalized Software
Acquired Intangibles Total
2016 $426 $760 $1,185
2017 256 650 906
2018 85 492 577
2019 — 338 338
2020 — 240 240
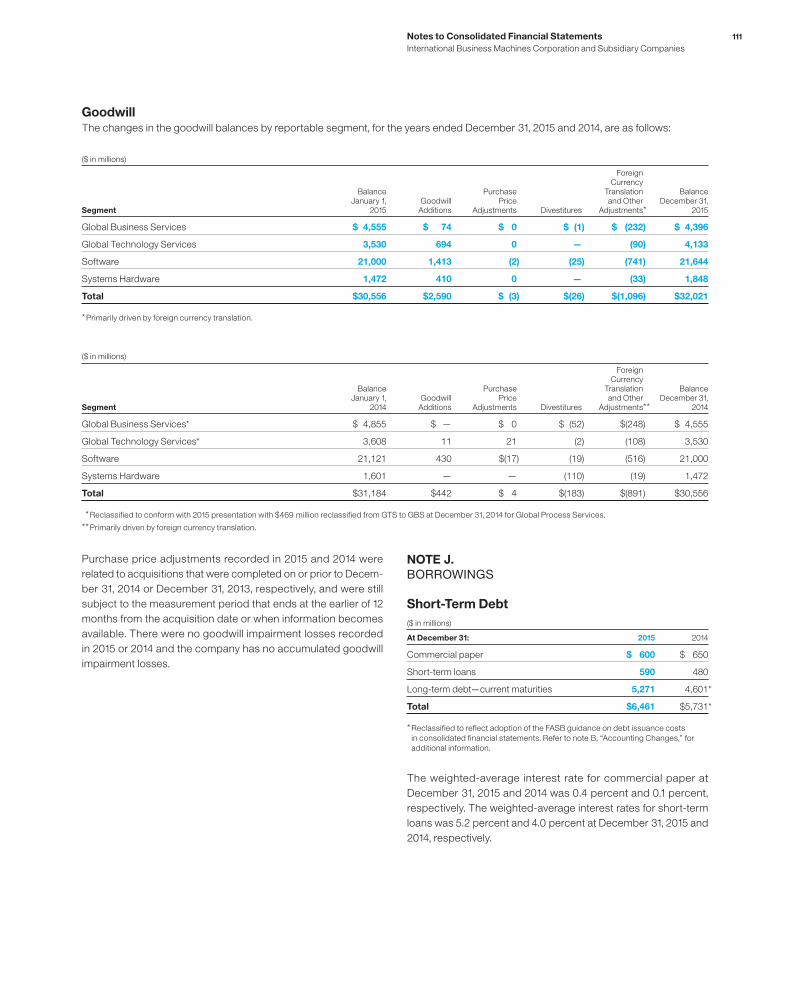
Notes to Consolidated Financial Statements
International Business Machines Corporation and Subsidiary Companies
111
GoodwillThe changes in the goodwill balances by reportable segment, for the years ended December 31, 2015 and 2014, are as follows:
($ in millions)
Segment
Balance January 1,
2015Goodwill
Additions
Purchase Price
Adjustments Divestitures
Foreign Currency
Translation and Other
Adjustments*
Balance December 31,
2015
Global Business Services $ 4,555 $ 74 $ 0 $ (1) $ (232) $ 4,396
Global Technology Services 3,530 694 0 — (90) 4,133
Software 21,000 1,413 (2) (25) (741) 21,644
Systems Hardware 1,472 410 0 — (33) 1,848
Total $30,556 $2,590 $ (3) $(26) $(1,096) $32,021
* Primarily driven by foreign currency translation.
($ in millions)
Segment
Balance January 1,
2014Goodwill
Additions
Purchase Price
Adjustments Divestitures
Foreign Currency
Translation and Other
Adjustments**
Balance December 31,
2014
Global Business Services* $ 4,855 $ — $ 0 $ (52) $(248) $ 4,555
Global Technology Services* 3,608 11 21 (2) (108) 3,530
Software 21,121 430 $(17) (19) (516) 21,000
Systems Hardware 1,601 — — (110) (19) 1,472
Total $31,184 $442 $ 4 $(183) $(891 ) $30,556
* Reclassified to conform with 2015 presentation with $469 million reclassified from GTS to GBS at December 31, 2014 for Global Process Services.
** Primarily driven by foreign currency translation.
Purchase price adjustments recorded in 2015 and 2014 were
related to acquisitions that were completed on or prior to Decem-
ber 31, 2014 or December 31, 2013, respectively, and were still
subject to the measurement period that ends at the earlier of 12
months from the acquisition date or when information becomes
available. There were no goodwill impairment losses recorded
in 2015 or 2014 and the company has no accumulated goodwill
impairment losses.
NOTE J.
BORROWINGS
Short-Term Debt
($ in millions)
At December 31: 2015 2014
Commercial paper $ 600 $ 650
Short-term loans 590 480
Long-term debt—current maturities 5,271 4,601*
Total $6,461 $5,731 *
* Reclassified to reflect adoption of the FASB guidance on debt issuance costs
in consolidated financial statements. Refer to note B, “Accounting Changes,” for
additional information.
The weighted-average interest rate for commercial paper at
December 31, 2015 and 2014 was 0.4 percent and 0.1 percent,
respectively. The weighted-average interest rates for short-term
loans was 5.2 percent and 4.0 percent at December 31, 2015 and
2014, respectively.

Notes to Consolidated Financial Statements
International Business Machines Corporation and Subsidiary Companies
112
Long-Term Debt
Pre-Swap Borrowing
($ in millions)
At December 31: Maturities 2015 2014
U.S. dollar notes and debentures (average interest rate at December 31, 2015):
2.80% 2016 – 2017 $ 9,351 $ 9,254
3.34% 2018 – 2019 7,591 6,835
1.46% 2020 –2021 3,717 6,555
2.35% 2022 1,900 1,000
3.38% 2023 1,500 1,500
3.63% 2024 2,000 2,000
7.00% 2025 600 600
6.22% 2027 469 469
6.50% 2028 313 313
5.88% 2032 600 600
8.00% 2038 83 83
5.60% 2039 745 745
4.00% 2042 1,107 1,107
7.00% 2045 27 27
7.13% 2096 316 316
30,319 31,404
Other currencies (average interest rate at December 31, 2015, in parentheses):
Euros (1.8%) 2016 – 2025 4,892 5,463
Pound sterling (2.7%) 2017 – 2022 1,555 1,176
Japanese yen (0.4%) 2017 – 2022 1,180 733
Swiss francs (6.3%) 2020 9 162
Canadian (2.2%) 2017 360 432
Other (13.8%) 2016– 2020 506 367
38,820 39,737
Less: net unamortized discount 838 853
Less: net unamortized debt issuance costs 74 83**
Add: fair value adjustment* 790 792
38,699 39,593**
Less: current maturities 5,271 4,601**
Total $33,428 $34,991 **
* The portion of the company’s fixed-rate debt obligations that is hedged is reflected in the Consolidated Statement of Financial Position as an amount equal to the sum of the
debt’s carrying value plus a fair value adjustment representing changes in the fair value of the hedged debt obligations attributable to movements in benchmark interest rates.
** Reclassified to reflect adoption of the FASB guidance on debt issuance costs in consolidated financial statements. Refer to note B, “Accounting Changes,” for additional information.

Notes to Consolidated Financial Statements
International Business Machines Corporation and Subsidiary Companies
113
The company’s indenture governing its debt securities and its
various credit facilities each contain significant covenants which
obligate the company to promptly pay principal and interest, limit
the aggregate amount of secured indebtedness and sale and
leaseback transactions to 10 percent of the company’s consol-
idated net tangible assets, and restrict the company’s ability to
merge or consolidate unless certain conditions are met. The credit
facilities also include a covenant on the company’s consolidated
net interest expense ratio, which cannot be less than 2.20 to 1.0,
as well as a cross default provision with respect to other defaulted
indebtedness of at least $500 million.
The company is in compliance with all of its significant debt
covenants and provides periodic certifications to its lenders. The
failure to comply with its debt covenants could constitute an event
of default with respect to the debt to which such provisions apply.
If certain events of default were to occur, the principal and interest
on the debt to which such event of default applied would become
immediately due and payable.
Post-Swap Borrowing (Long-Term Debt, Including Current Portion)
($ in millions)
2015 2014**
For the year ended December 31: Amount Average Rate Amount Average Rate
Fixed-rate debt $25,499 3.41% $27,180 3.09%
Floating-rate debt* 13,199 0.96% 12,412 0.82%
Total $38,699 $39,593
* Includes $7,338 million in 2015 and $5,839 million in 2014 of notional interest rate swaps that effectively convert fixed-rate long-term debt into floating-rate debt. (See note D,
“Financial Instruments,” on pages 101 through 105).
** Reclassified to reflect adoption of the FASB guidance on debt issuance costs in consolidated financial statements. Refer to note B, “Accounting Changes,” for additional information.
Pre-swap annual contractual maturities of long-term debt out-
standing at December 31, 2015, are as follows:
($ in millions)
Total
2016 $ 5,273
2017 5,674
2018 4,691
2019 4,003
2020 4,505
2021 and beyond 14,675
Total $38,820
Interest on Debt
($ in millions)
For the year ended December 31: 2015 2014 2013
Cost of fi nancing $ 540 $ 542 $ 587
Interest expense 481 484 405
Net investment derivative activity (13) 0 (3)
Interest capitalized 0 4 22
Total interest paid and accrued $1,008 $1,030 $1,011
Refer to the related discussion on page 144 in note T, “Segment
Information,” for total interest expense of the Global Financing seg-
ment. See note D, “Financial Instruments,” on pages 101 through
105 for a discussion of the use of currency and interest rate swaps
in the company’s debt risk management program.
Lines of CreditIn 2015, the company extended the term of its five-year, $10 bil-
lion Credit Agreement (the “Credit Agreement”) by one year to
November 10, 2020. The total expense recorded by the com-
pany related to this global credit facility was $5.3 million in 2015,
$5.4 million in 2014 and $5.4 million in 2013. The Credit Agreement
permits the company and its Subsidiary Borrowers to borrow up
to $10 billion on a revolving basis. Borrowings of the Subsidiary
Borrowers will be unconditionally backed by the company. The
company may also, upon the agreement of either existing lenders,
or of the additional banks not currently party to the Credit Agree-
ment, increase the commitments under the Credit Agreement
up to an additional $2.0 billion. Subject to certain terms of the
Credit Agreement, the company and Subsidiary Borrowers may
borrow, prepay and reborrow amounts under the Credit Agree-
ment at any time during the Credit Agreement. Interest rates on
borrowings under the Credit Agreement will be based on prevailing
market interest rates, as further described in the Credit Agree-
ment. The Credit Agreement contains customary representations
and warranties, covenants, events of default, and indemnification
provisions. The company believes that circumstances that might
give rise to breach of these covenants or an event of default, as
specified in the Credit Agreement, are remote. As of December 31,
2015, there were no borrowings by the company, or its subsidiaries,
under the Credit Agreement.
The company also has other committed lines of credit in some
of the geographies which are not significant in the aggregate. Inter-
est rates and other terms of borrowing under these lines of credit
vary from country to country, depending on local market conditions.

Notes to Consolidated Financial Statements
International Business Machines Corporation and Subsidiary Companies
114
NOTE K.
OTHER LIABILITIES
($ in millions)
At December 31: 2015 2014
Income tax reserves $3,150 $3,146
Excess 401(k) Plus Plan 1,445 1,658
Disability benefi ts 590 675
Derivative liabilities 22 31
Special restructuring actions 362 431
Workforce reductions 407 469
Deferred taxes 253 129**
Other taxes payable 89 17
Environmental accruals 270 240
Warranty accruals 83 91
Asset retirement obligations 134 136
Acquisition related 200 50
Divestiture related* 575 1,124
Other 519 536
Total $8,099 $8,733 **
* Primarily related to the divestiture of the Microelectronics business.
** Reclassified to reflect adoption of the FASB guidance on deferred taxes in
consolidated financial statements. Refer to note B, “Accounting Changes,” for
additional information.
In response to changing business needs, the company periodi-
cally takes workforce reduction actions to improve productivity,
cost competitiveness and to rebalance skills. The noncurrent
contractually obligated future payments associated with these
activities are reflected in the workforce reductions caption in the
previous table.
In addition, the company executed certain special restructur-
ing-related actions prior to 2006. The previous table provides the
noncurrent liabilities associated with these special actions. Current
liabilities are included in other accrued expenses and liabilities in
the Consolidated Statement of Financial Position and were imma-
terial at December 31, 2015.
The noncurrent liabilities are workforce accruals related to ter-
minated employees who are no longer working for the company
who were granted annual payments to supplement their incomes
in certain countries. Depending on the individual country’s legal
requirements, these required payments will continue until the
former employee begins receiving pension benefits or passes away.
The company employs extensive internal environmental protec-
tion programs that primarily are preventive in nature. The company
also participates in environmental assessments and cleanups at
a number of locations, including operating facilities, previously
owned facilities and Superfund sites. The company’s maximum
exposure for all environmental liabilities cannot be estimated and
no amounts have been recorded for non-ARO environmental
liabilities that are not probable or estimable. The total amounts
accrued for non-ARO environmental liabilities, including amounts
classified as current in the Consolidated Statement of Financial
Position, that do not reflect actual or anticipated insurance recov-
eries, were $283 million and $254 million at December 31, 2015
and 2014, respectively. Estimated environmental costs are not
expected to materially affect the consolidated financial position or
consolidated results of the company’s operations in future periods.
However, estimates of future costs are subject to change due to
protracted cleanup periods and changing environmental remedi-
ation regulations.
As of December 31, 2015, the company was unable to esti-
mate the range of settlement dates and the related probabilities for
certain asbestos remediation AROs. These conditional AROs are
primarily related to the encapsulated structural fireproofing that is
not subject to abatement unless the buildings are demolished and
non-encapsulated asbestos that the company would remediate
only if it performed major renovations of certain existing buildings.
Because these conditional obligations have indeterminate settle-
ment dates, the company could not develop a reasonable estimate
of their fair values. The company will continue to assess its ability
to estimate fair values at each future reporting date. The related
liability will be recognized once sufficient additional information
becomes available. The total amounts accrued for ARO liabilities,
including amounts classified as current in the Consolidated State-
ment of Financial Position were $166 million and $180 million at
December 31, 2015 and 2014, respectively.
NOTE L.
EQUITY ACTIVITY
The authorized capital stock of IBM consists of 4,687,500,000
shares of common stock with a $.20 per share par value, of which
965,728,725 shares were outstanding at December 31, 2015 and
150,000,000 shares of preferred stock with a $.01 per share par
value, none of which were outstanding at December 31, 2015.
Stock RepurchasesThe Board of Directors authorizes the company to repurchase IBM
common stock. The company repurchased 30,338,647 common
shares at a cost of $4,701 million, 71,504,867 common shares at a
cost of $13,395 million and 73,121,942 common shares at a cost
of $13,993 million in 2015, 2014 and 2013, respectively. These
amounts reflect transactions executed through December 31 of
each year. Actual cash disbursements for repurchased shares may
differ due to varying settlement dates for these transactions. At
December 31, 2015, $5,563 million of Board common stock repur-
chase authorization was available. The company plans to purchase
shares on the open market or in private transactions from time to
time, depending on market conditions.

115Notes to Consolidated Financial Statements
International Business Machines Corporation and Subsidiary Companies
Other Stock TransactionsThe company issued the following shares of common stock as part
of its stock-based compensation plans and employees stock pur-
chase plan: 6,013,875 shares in 2015, 7,687,026 shares in 2014, and
9,961,389 shares in 2013. The company issued 1,155,558 treasury
shares in 2015, 1,264,232 treasury shares in 2014 and 1,849,883
treasury shares in 2013, as a result of restricted stock unit releases
and exercises of stock options by employees of certain acquired
businesses and by non-U.S. employees. Also, as part of the
company’s stock-based compensation plans, 1,625,820 common
shares at a cost of $248 million, 1,313,569 common shares at a
cost of $236 million, and 1,666,069 common shares at a cost of
$336 million in 2015, 2014 and 2013, respectively, were remitted by
employees to the company in order to satisfy minimum statutory
tax withholding requirements. These amounts are included in the
treasury stock balance in the Consolidated Statement of Financial
Position and the Consolidated Statement of Changes in Equity.
Reclassifications and Taxes Related to Items of Other Comprehensive Income
($ in millions)
For the year ended December 31, 2015:Before Tax
AmountTax (Expense)/
Benefi tNet of Tax
Amount
Other comprehensive income/(loss)
Foreign currency translation adjustments $(1,379) $ (342) $(1,721)
Net changes related to available-for-sale securities
Unrealized gains/(losses) arising during the period $ (54) $ 21 $ (33)
Reclassifi cation of (gains)/losses to other (income) and expense 86 (33) 53
Total net changes related to available-for-sale securities $ 32 $ (12) $ 20
Unrealized gains/(losses) on cash fl ow hedges
Unrealized gains/(losses) arising during the period $ 618 $ (218) $ 399
Reclassifi cation of (gains)/losses to:
Cost of sales (192) 57 (135)
SG&A expense (149) 43 (105)
Other (income) and expense (731) 281 (451)
Interest expense 0 0 0
Total unrealized gains/(losses) on cash fl ow hedges $ (454) $ 162 $ (292)
Retirement-related benefi t plans (1)
Prior service costs/(credits) $ 6 $ (2) $ 4
Net (losses)/gains arising during the period (2,963) 1,039 (1,925)
Curtailments and settlements 33 (9) 24
Amortization of prior service (credits)/costs (100) 36 (65)
Amortization of net (gains)/losses 3,304 (1,080) 2,223
Total retirement-related benefi t plans $ 279 $ (17) $ 262
Other comprehensive income/(loss) $(1,523) $ (208) $(1,731)
(1) These AOCI components are included in the computation of net periodic pension cost. (See note S, “Retirement-Related Benefits,” for additional information.)

Notes to Consolidated Financial Statements
International Business Machines Corporation and Subsidiary Companies
116
($ in millions)
For the year ended December 31, 2014:Before Tax
AmountTax (Expense)/
Benefi tNet of Tax
Amount
Other comprehensive income/(loss)
Foreign currency translation adjustments $(1,636) $ (438) $(2,074)
Net changes related to available-for-sale securities
Unrealized gains/(losses) arising during the period $ (29) $ 11 $ (18)
Reclassifi cation of (gains)/losses to other (income) and expense 5 (2) 3
Total net changes related to available-for-sale securities $ (24) $ 9 $ (15)
Unrealized gains/(losses) on cash fl ow hedges
Unrealized gains/(losses) arising during the period $ 958 $ (341) $ 618
Reclassifi cation of (gains)/losses to:
Cost of sales 15 (7) 9
SG&A expense (15) 6 (9)
Other (income) and expense (98) 38 (60)
Interest expense 1 0 0
Total unrealized gains/(losses) on cash fl ow hedges $ 861 $ (304) $ 557
Retirement-related benefi t plans (1)
Prior service costs/(credits) $ 1 $ 0 $ 1
Net (losses)/gains arising during the period (9,799) 3,433 (6,366)
Curtailments and settlements 24 (7) 17
Amortization of prior service (credits)/costs (114) 41 (73)
Amortization of net (gains)/losses 2,531 (852) 1,678
Total retirement-related benefi t plans $(7,357) $2,615 $(4,742)
Other comprehensive income/(loss) $(8,156) $1,883 $(6,274)
(1) These AOCI components are included in the computation of net periodic pension cost. (See note S, “Retirement-Related Benefits,” for additional information.)
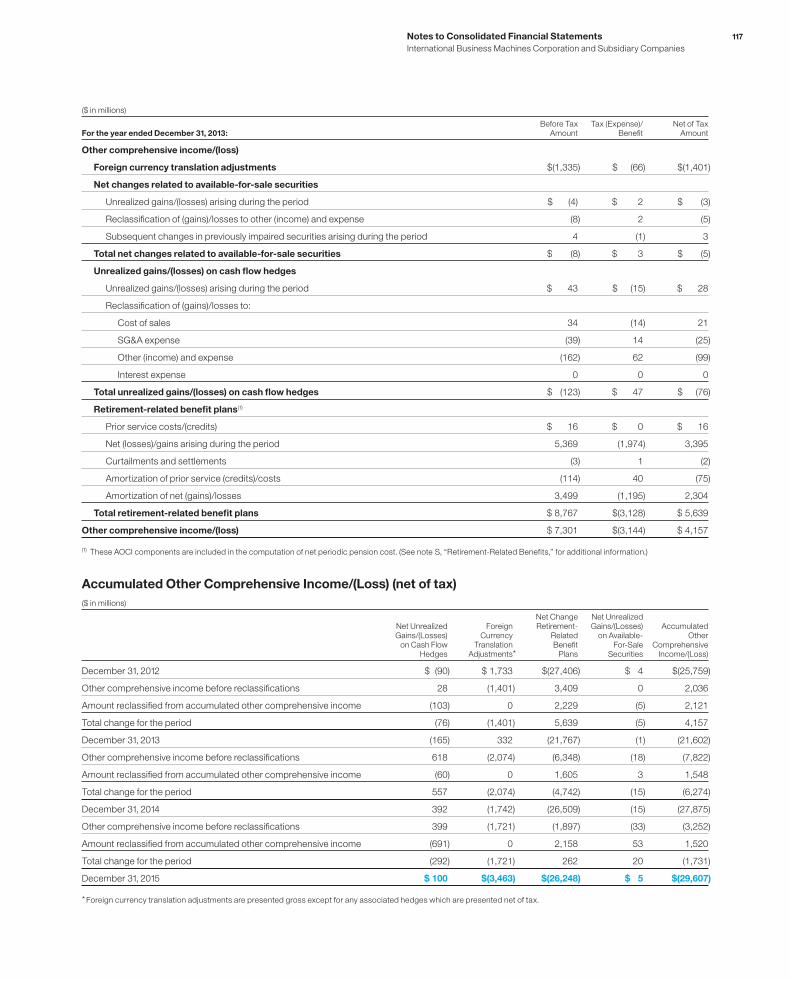
Notes to Consolidated Financial Statements
International Business Machines Corporation and Subsidiary Companies
117
($ in millions)
For the year ended December 31, 2013:Before Tax
AmountTax (Expense)/
Benefi tNet of Tax
Amount
Other comprehensive income/(loss)
Foreign currency translation adjustments $(1,335) $ (66) $(1,401)
Net changes related to available-for-sale securities
Unrealized gains/(losses) arising during the period $ (4) $ 2 $ (3)
Reclassifi cation of (gains)/losses to other (income) and expense (8) 2 (5)
Subsequent changes in previously impaired securities arising during the period 4 (1) 3
Total net changes related to available-for-sale securities $ (8) $ 3 $ (5)
Unrealized gains/(losses) on cash fl ow hedges
Unrealized gains/(losses) arising during the period $ 43 $ (15) $ 28
Reclassifi cation of (gains)/losses to:
Cost of sales 34 (14) 21
SG&A expense (39) 14 (25)
Other (income) and expense (162) 62 (99)
Interest expense 0 0 0
Total unrealized gains/(losses) on cash fl ow hedges $ (123) $ 47 $ (76)
Retirement-related benefi t plans (1)
Prior service costs/(credits) $ 16 $ 0 $ 16
Net (losses)/gains arising during the period 5,369 (1,974) 3,395
Curtailments and settlements (3) 1 (2)
Amortization of prior service (credits)/costs (114) 40 (75)
Amortization of net (gains)/losses 3,499 (1,195) 2,304
Total retirement-related benefi t plans $ 8,767 $(3,128) $ 5,639
Other comprehensive income/(loss) $ 7,301 $(3,144) $ 4,157
(1) These AOCI components are included in the computation of net periodic pension cost. (See note S, “Retirement-Related Benefits,” for additional information.)
Accumulated Other Comprehensive Income/(Loss) (net of tax)
($ in millions)
Net Unrealized Gains/(Losses)
on Cash Flow Hedges
Foreign Currency
Translation Adjustments*
Net Change Retirement-
Related Benefi t
Plans
Net Unrealized Gains/(Losses)
on Available-For-Sale
Securities
Accumulated Other
Comprehensive Income/(Loss)
December 31, 2012 $ (90) $ 1,733 $(27,406) $ 4 $(25,759)
Other comprehensive income before reclassifi cations 28 (1,401) 3,409 0 2,036
Amount reclassifi ed from accumulated other comprehensive income (103) 0 2,229 (5) 2,121
Total change for the period (76) (1,401) 5,639 (5) 4,157
December 31, 2013 (165) 332 (21,767) (1) (21,602)
Other comprehensive income before reclassifi cations 618 (2,074) (6,348) (18) (7,822)
Amount reclassifi ed from accumulated other comprehensive income (60) 0 1,605 3 1,548
Total change for the period 557 (2,074) (4,742) (15) (6,274)
December 31, 2014 392 (1,742) (26,509) (15) (27,875)
Other comprehensive income before reclassifi cations 399 (1,721) (1,897) (33) (3,252)
Amount reclassifi ed from accumulated other comprehensive income (691) 0 2,158 53 1,520
Total change for the period (292) (1,721) 262 20 (1,731)
December 31, 2015 $ 100 $(3,463) $(26,248) $ 5 $(29,607)
* Foreign currency translation adjustments are presented gross except for any associated hedges which are presented net of tax.

Notes to Consolidated Financial Statements
International Business Machines Corporation and Subsidiary Companies
118
NOTE M.
CONTINGENCIES AND COMMITMENTS
ContingenciesAs a company with a substantial employee population and with
clients in more than 175 countries, IBM is involved, either as plain-
tiff or defendant, in a variety of ongoing claims, demands, suits,
investigations, tax matters and proceedings that arise from time
to time in the ordinary course of its business. The company is a
leader in the information technology industry and, as such, has
been and will continue to be subject to claims challenging its IP
rights and associated products and offerings, including claims of
copyright and patent infringement and violations of trade secrets
and other IP rights. In addition, the company enforces its own IP
against infringement, through license negotiations, lawsuits or oth-
erwise. Also, as is typical for companies of IBM’s scope and scale,
the company is party to actions and proceedings in various juris-
dictions involving a wide range of labor and employment issues
(including matters related to contested employment decisions,
country-specific labor and employment laws, and the company’s
pension, retirement and other benefit plans), as well as actions
with respect to contracts, product liability, securities, foreign oper-
ations, competition law and environmental matters. These actions
may be commenced by a number of different parties, including
competitors, clients, current or former employees, government and
regulatory agencies, stockholders and representatives of the loca-
tions in which the company does business. Some of the actions to
which the company is party may involve particularly complex tech-
nical issues, and some actions may raise novel questions under
the laws of the various jurisdictions in which these matters arise.
The company records a provision with respect to a claim,
suit, investigation or proceeding when it is probable that a liability
has been incurred and the amount of the loss can be reasonably
estimated. Any recorded liabilities, including any changes to such
liabilities for the years ended December 31, 2015, 2014 and 2013
were not material to the Consolidated Financial Statements.
In accordance with the relevant accounting guidance, the com-
pany provides disclosures of matters for which the likelihood of
material loss is at least reasonably possible. In addition, the com-
pany also discloses matters based on its consideration of other
matters and qualitative factors, including the experience of other
companies in the industry, and investor, customer and employee
relations considerations.
With respect to certain of the claims, suits, investigations and
proceedings discussed herein, the company believes at this time
that the likelihood of any material loss is remote, given, for exam-
ple, the procedural status, court rulings, and/or the strength of
the company’s defenses in those matters. With respect to the
remaining claims, suits, investigations and proceedings discussed
in this Note, except as specifically discussed herein, the company
is unable to provide estimates of reasonably possible losses or
range of losses, including losses in excess of amounts accrued,
if any, for the following reasons. Claims, suits, investigations and
proceedings are inherently uncertain, and it is not possible to pre-
dict the ultimate outcome of these matters. It is the company’s
experience that damage amounts claimed in litigation against it
are unreliable and unrelated to possible outcomes, and as such
are not meaningful indicators of the company’s potential liability.
Further, the company is unable to provide such an estimate due
to a number of other factors with respect to these claims, suits,
investigations and proceedings, including considerations of the
procedural status of the matter in question, the presence of com-
plex or novel legal theories, and/or the ongoing discovery and
development of information important to the matters. The com-
pany reviews claims, suits, investigations and proceedings at least
quarterly, and decisions are made with respect to recording or
adjusting provisions and disclosing reasonably possible losses
or range of losses (individually or in the aggregate), to reflect the
impact and status of settlement discussions, discovery, procedural
and substantive rulings, reviews by counsel and other information
pertinent to a particular matter.
Whether any losses, damages or remedies finally determined in
any claim, suit, investigation or proceeding could reasonably have
a material effect on the company’s business, financial condition,
results of operations or cash flows will depend on a number of
variables, including: the timing and amount of such losses or dam-
ages; the structure and type of any such remedies; the significance
of the impact any such losses, damages or remedies may have
in the Consolidated Financial Statements; and the unique facts
and circumstances of the particular matter that may give rise to
additional factors. While the company will continue to defend itself
vigorously, it is possible that the company’s business, financial con-
dition, results of operations or cash flows could be affected in any
particular period by the resolution of one or more of these matters.
The following is a summary of the more significant legal matters
involving the company.
The company is a defendant in an action filed on March 6, 2003
in state court in Salt Lake City, Utah by the SCO Group (SCO v.
IBM). The company removed the case to Federal Court in Utah.
Plaintiff is an alleged successor in interest to some of AT&T’s UNIX
IP rights, and alleges copyright infringement, unfair competition,
interference with contract and breach of contract with regard to
the company’s distribution of AIX and Dynix and contribution of
code to Linux and the company has asserted counterclaims. On
September 14, 2007, plaintiff filed for bankruptcy protection, and all
proceedings in this case were stayed. The court in another suit, the
SCO Group, Inc. v. Novell, Inc., held a trial in March 2010. The jury
found that Novell is the owner of UNIX and UnixWare copyrights;
the judge subsequently ruled that SCO is obligated to recog-
nize Novell’s waiver of SCO’s claims against IBM and Sequent
for breach of UNIX license agreements. On August 30, 2011, the
Tenth Circuit Court of Appeals affirmed the district court’s ruling
and denied SCO’s appeal of this matter. In June 2013, the Federal
Court in Utah granted SCO’s motion to reopen the SCO v. IBM

Notes to Consolidated Financial Statements
International Business Machines Corporation and Subsidiary Companies
119
case, and proceedings have resumed in that case. In February
2016, the Federal Court ruled in favor of IBM on all of SCO’s remain-
ing claims.
On May 13, 2010, IBM and the State of Indiana (acting on behalf
of the Indiana Family and Social Services Administration) sued
one another in a dispute over a 2006 contract regarding the mod-
ernization of social service program processing in Indiana. The
State terminated the contract, claiming that IBM was in breach,
and the State is seeking damages. IBM believes the State’s claims
against it are without merit and is seeking payment of termina-
tion amounts specified in the contract. After six weeks of trial, on
July 18, 2012, the Indiana Superior Court in Marion County rejected
the State’s claims in their entirety and awarded IBM $52 million
plus interest and costs. On February 13, 2014, the Indiana Court
of Appeals reversed portions of the trial judge’s findings, found
IBM in material breach, and ordered the case remanded to the
trial judge to determine the State’s damages, if any. The Indiana
Court of Appeals also affirmed approximately $50 million of the trial
court’s award of damages to IBM. This matter remains pending in
the Indiana courts.
On April 16, 2014, Iusacell SA de C.V. (Iusacell) sued IBM, claim-
ing that IBM made fraudulent misrepresentations that induced
Iusacell to enter into an agreement with IBM Mexico. Iusacell claims
damages for lost profits. Iusacell’s complaint relates to a contrac-
tual dispute in Mexico, which is the subject of a pending arbitration
proceeding in Mexico initiated by IBM Mexico against Iusacell for
breach of the underlying agreement. On November 14, 2014, the
District Court in the Southern District of New York granted IBM’s
motion to stay Iusacell’s action against the company pending the
arbitration in Mexico between Iusacell and IBM Mexico.
IBM United Kingdom Limited (IBM UK) initiated legal pro-
ceedings in May 2010 before the High Court in London against
the IBM UK Pensions Trust (the UK Trust) and two representative
beneficiaries of the UK Trust membership. IBM UK is seeking a
declaration that it acted lawfully both in notifying the Trustee of the
UK Trust that it was closing its UK defined benefit plans to future
accruals for most participants and in implementing the company’s
new retirement policy. In April 2014, the High Court acknowledged
that the changes made to its UK defined benefit plans were within
IBM’s discretion, but ruled that IBM breached its implied duty of
good faith both in implementing these changes and in the manner
in which it consulted with employees. Proceedings to determine
remedies were held in July 2014, and in February 2015 the High
Court held that for IBM to make changes to accruals under the
plan would require a new consultation of the participants, but other
changes (including to early retirement policy) would not require
such consultation. IBM UK has appealed both the breach and rem-
edies judgments. If the appeal is unsuccessful, the Court’s rulings
would require IBM to reverse the changes made to the UK defined
benefit plans retroactive to their effective dates. This could result
in an estimated non-operating one-time pre-tax charge of approx-
imately $250 million, plus ongoing defined benefit related accruals.
In addition, IBM UK is a defendant in approximately 290 individual
actions brought since early 2010 by participants of the defined
benefits plans who left IBM UK. These actions, which allege con-
structive dismissal and age discrimination, are pending before the
Employment Tribunal in Southampton UK.
On March 24, 2014, in a suit brought by local Works Councils,
the Supreme Court of Spain held that IBM Spain’s Defined Con-
tribution (DC) Plan implemented in 1993 based on the voluntary
participation of its employees was null and void. The Supreme
Court also held that current employees could reinstate their rights
to a Defined Benefit (DB) Plan, although with an offset for DC con-
tributions paid to date. The Court held that IBM Spain did not
consult with the Works Councils in seeking to change the pension
scheme, and recommended that IBM Spain and the Works Coun-
cils engage in discussions over how to carry out the offset. The
Constitutional Court denied IBM Spain’s requested leave to appeal
the decision. In March 2015, the National Audience Court ruled that
the Works Council was not entitled to dictate the means by which
IBM should carry out the offset of DC contributions, but also ruled
that the Supreme Court’s judgment could be executed without the
need for individual lawsuits by employees, rejecting the position
that the judgment was declaratory only. The National Audience
Court also ruled that IBM should stop making DC contributions,
and that the company should promptly reinstate the DB Plan. IBM
Spain appealed that ruling and in May 2015, the National Audience
Court dismissed the appeal. In February 2016, IBM Spain and the
Works Councils agreed on a process to resolve their differences
relating to calculating the offset for DC contributions paid to date
and the form of a new alternative DC plan. They also agreed to a
pay reduction for current employees who elect to remain in the DB
plan and to close the DB plan to new hires.
In March 2011, the company announced that it had agreed to
settle a civil enforcement action with the Securities and Exchange
Commission (SEC) relating to alleged violations of the Foreign
Corrupt Practices Act of 1977 (FCPA). On July 25, 2013, the court
approved that 2011 settlement and required that for a two-year
period IBM make reports to the SEC and the court on certain mat-
ters, including those relating to compliance with the FCPA. The
two-year period expired in July 2015. In early 2012, IBM notified
the SEC of an investigation by the Polish Central Anti-Corruption
Bureau involving allegations of illegal activity by a former IBM
Poland employee in connection with sales to the Polish govern-
ment. IBM is cooperating with the SEC and Polish authorities in
this matter. In April 2013, IBM learned that the U.S. Department of
Justice (DOJ) is also investigating allegations related to the Poland
matter, as well as allegations relating to transactions in Argentina,
Bangladesh and Ukraine. The DOJ is also seeking information
regarding the company’s global FCPA compliance program and
its public sector business. The company is cooperating with the
DOJ in this matter.
In March 2015, putative class action litigation was commenced
in the United States District Court for the Southern District of New
York related to the company’s October 2014 announcement that
it was divesting its global commercial semiconductor technology
business. The company and three of its officers are named as

Notes to Consolidated Financial Statements
International Business Machines Corporation and Subsidiary Companies
120
defendants. Plaintiffs allege that defendants violated Sections 20(a)
and 10(b) of the Securities Exchange Act of 1934 and Rule 10b-5
thereunder. In May 2015, a related putative class action was also
commenced in the United States District Court for the Southern
District of New York based on the same underlying facts, alleging
violations of the Employee Retirement Income Security Act. The
company, management’s Retirement Plans Committee, and three
current or former IBM executives are named as defendants.
In August 2015, IBM learned that the SEC is conducting an
investigation relating to revenue recognition with respect to the
accounting treatment of certain transactions in the U.S., UK and
Ireland. The company is cooperating with the SEC in this matter.
The company is a defendant in numerous actions filed after
January 1, 2008 in the Supreme Court for the State of New York,
county of Broome, on behalf of hundreds of plaintiffs. The com-
plaints allege numerous and different causes of action, including
for negligence and recklessness, private nuisance and trespass.
Plaintiffs in these cases seek medical monitoring and claim dam-
ages in unspecified amounts for a variety of personal injuries
and property damages allegedly arising out of the presence of
groundwater contamination and vapor intrusion of groundwater
contaminants into certain structures in which plaintiffs reside
or resided, or conducted business, allegedly resulting from the
release of chemicals into the environment by the company at its
former manufacturing and development facility in Endicott. These
complaints also seek punitive damages in an unspecified amount.
The parties have settled substantially all of these cases.
The company is party to, or otherwise involved in, proceed-
ings brought by U.S. federal or state environmental agencies under
the Comprehensive Environmental Response, Compensation and
Liability Act (CERCLA), known as “Superfund,” or laws similar to
CERCLA. Such statutes require potentially responsible parties
to participate in remediation activities regardless of fault or own-
ership of sites. The company is also conducting environmental
investigations, assessments or remediations at or in the vicinity
of several current or former operating sites globally pursuant to
permits, administrative orders or agreements with country, state
or local environmental agencies, and is involved in lawsuits and
claims concerning certain current or former operating sites.
The company is also subject to ongoing tax examinations and
governmental assessments in various jurisdictions. Along with
many other U.S. companies doing business in Brazil, the com-
pany is involved in various challenges with Brazilian tax authorities
regarding non-income tax assessments and non-income tax liti-
gation matters. The total potential amount related to these matters
for all applicable years is approximately $460 million. The company
believes it will prevail on these matters and that this amount is not
a meaningful indicator of liability.
CommitmentsThe company’s extended lines of credit to third-party entities
include unused amounts of $5,477 million and $5,365 million at
December 31, 2015 and 2014, respectively. A portion of these
amounts was available to the company’s business partners to
support their working capital needs. In addition, the company has
committed to provide future financing to its clients in connection
with client purchase agreements for $2,097 million and $1,816 mil-
lion at December 31, 2015 and 2014, respectively.
The company has applied the guidance requiring a guarantor
to disclose certain types of guarantees, even if the likelihood of
requiring the guarantor’s performance is remote. The following is a
description of arrangements in which the company is the guarantor.
The company is a party to a variety of agreements pursuant
to which it may be obligated to indemnify the other party with
respect to certain matters. Typically, these obligations arise in the
context of contracts entered into by the company, under which
the company customarily agrees to hold the other party harmless
against losses arising from a breach of representations and cov-
enants related to such matters as title to assets sold, certain IP
rights, specified environmental matters, third-party performance
of nonfinancial contractual obligations and certain income taxes.
In each of these circumstances, payment by the company is
conditioned on the other party making a claim pursuant to the
procedures specified in the particular contract, the procedures of
which typically allow the company to challenge the other party’s
claims. While typically indemnification provisions do not include a
contractual maximum on the company’s payment, the company’s
obligations under these agreements may be limited in terms of time
and/or nature of claim, and in some instances, the company may
have recourse against third parties for certain payments made by
the company.
It is not possible to predict the maximum potential amount of
future payments under these or similar agreements due to the
conditional nature of the company’s obligations and the unique
facts and circumstances involved in each particular agreement.
Historically, payments made by the company under these agree-
ments have not had a material effect on the company’s business,
financial condition or results of operations.
In addition, the company guarantees certain loans and financial
commitments. The maximum potential future payment under these
financial guarantees was $34 million and $46 million at Decem-
ber 31, 2015 and 2014, respectively. The fair value of the guarantees
recognized in the Consolidated Statement of Financial Position
was immaterial.
NOTE N.
TAXES
($ in millions)
For the year ended December 31: 2015 2014 2013
Income from continuing operations
before income taxes
U.S. operations $ 5,915 $ 7,509 $ 7,577
Non-U.S. operations 10,030 12,477 12,667
Total income from
continuing operations
before income taxes $15,945 $19,986 $20,244

Notes to Consolidated Financial Statements
International Business Machines Corporation and Subsidiary Companies
121
The income from continuing operations provision for income taxes
by geographic operations is as follows:
($ in millions)
For the year ended December 31: 2015 2014 2013
U.S. operations $ 849 $2,093 $1,315
Non-U.S. operations 1,732 2,141 2,048
Total continuing operations
provision for income taxes $2,581 $4,234 $3,363
The components of the income from continuing operations provi-
sion for income taxes by taxing jurisdiction are as follows:
($ in millions)
For the year ended December 31: 2015 2014 2013
U.S. federal
Current $ (321) $ 1,134 $1,694
Deferred 553 105 (708)
232 1,239 986
U.S. state and local
Current 128 541 277
Deferred 116 (105) (330)
244 436 (53)
Non-U.S.
Current 2,101 2,825 3,067
Deferred 4 (266) (637)
2,105 2,559 2,430
Total continuing operations
provision for income taxes 2,581 4,234 3,363
Discontinued operations
provision for income taxes (117) (1,617) (322)
Provision for social security,
real estate, personal property
and other taxes 3,497 4,068 4,198
Total taxes included in net income $5,961 $ 6,685 $7,238
A reconciliation of the statutory U.S. federal tax rate to the com-
pany’s effective tax rate from continuing operations is as follows:
For the year ended December 31: 2015 2014 2013
Statutory rate 35% 35% 35%
Foreign tax differential (17) (14) (13)
State and local 1 1 0
Domestic incentives (2) (2) (3)
Other (1) 1 (2)
Effective rate 16% 21% 17%
Percentages rounded for disclosure purposes.
The significant components reflected within the tax rate reconcili-
ation labeled “Foreign tax differential” include the effects of foreign
subsidiaries’ earnings taxed at rates other than the U.S. statutory
rate, foreign export incentives, the U.S. tax impacts of non-U.S.
earnings repatriation and any net impacts of intercompany trans-
actions. These items also reflect audit settlements or changes in
the amount of unrecognized tax benefits associated with each of
these items.
In the fourth quarter of 2015, the U.S. Internal Revenue Ser-
vice (IRS) concluded its examination of the company’s income
tax returns for 2011 and 2012 and issued a final Revenue Agent’s
Report (RAR). The company has agreed with all of the adjustments
in the RAR with the exception of the proposed adjustments related
to the tax implications of an internal restructuring undertaken in
2011. The company disagrees with the IRS on this matter and
intends to protest the proposed adjustments. The company has
redetermined its unrecognized tax benefits for all open years,
based on the RAR and associated information and analysis.
The 2015 continuing operations effective tax rate decreased
5.0 points from 2014 as a result of: the completion of the 2011–2012
U.S. tax audit, including reserve redeterminations (3.9 points),
a benefit due to the geographic mix of pre-tax income in 2015
(3.5 points) and a benefit due to the 2014 tax charge related to the
divestiture of the System x business (0.9 points).
These decreases were partially offset due to the following: a
reduced benefit year to year in the utilization of foreign tax credits
(2.5 points) and the year-to-year increase in tax charges related
to intercompany payments made by foreign subsidiaries and the
intercompany licensing of certain IP (0.8 points).
The effect of tax law changes on deferred tax assets and lia-
bilities did not have a material impact on the company’s effective
tax rate.
The significant components of deferred tax assets and liabilities
recorded in the Consolidated Statement of Financial Position were:
Deferred Tax Assets
($ in millions)
At December 31: 2015 2014
Retirement benefi ts $ 4,621 $ 4,795
Share-based and other compensation 963 1,328
Domestic tax loss/credit carryforwards 1,066 858
Deferred income 762 957
Foreign tax loss/credit carryforwards 825 686
Bad debt, inventory and warranty reserves 528 529
Depreciation 329 329
Accruals 904 1,176
Other 931 1,306
Gross deferred tax assets 10,929 11,964
Less: valuation allowance 740 646
Net deferred tax assets $10,189 $11,318

Notes to Consolidated Financial Statements
International Business Machines Corporation and Subsidiary Companies
122
Deferred Tax Liabilities
($ in millions)
At December 31: 2015 2014
Depreciation $ 919 $ 487
Retirement benefi ts 252 205
Goodwill and intangible assets 1,407 1,263
Leases 916 912
Software development costs 554 421
Deferred transition costs 395 374
Other 1,177 1,111
Gross deferred tax liabilities $5,620 $4,773
For income tax return purposes, the company has foreign and
domestic loss carryforwards, the tax effect of which is $742 million,
as well as domestic and foreign credit carryforwards of $1,149 mil-
lion. Substantially all of these carryforwards are available for at
least two years or are available for 10 years or more.
The valuation allowances as of December 31, 2015, 2014 and
2013 were $740 million, $646 million and $734 million, respectively.
The amounts principally apply to certain foreign, state and local
loss carryforwards and credits that, in the opinion of management,
are more likely than not to expire unutilized. However, to the extent
that tax benefits related to these carryforwards are realized in the
future, the reduction in the valuation allowance will reduce income
tax expense.
The amount of unrecognized tax benefits at December 31, 2015
decreased by $530 million in 2015 to $4,574 million. A reconciliation
of the beginning and ending amount of unrecognized tax benefits
is as follows:
($ in millions)
2015 2014 2013
Balance at January 1 $ 5,104 $4,458 $ 5,672
Additions based on tax positions
related to the current year 464 697 829
Additions for tax positions
of prior years 569 586 417
Reductions for tax positions
of prior years (including impacts
due to a lapse in statute) (1,348) (579) (2,201)
Settlements (215) (58) (259)
Balance at December 31 $ 4,574 $5,104 $ 4,458
The additions to unrecognized tax benefits related to the current
and prior years are primarily attributable to non-U.S. issues, certain
tax incentives and credits and state issues. The settlements and
reductions to unrecognized tax benefits for tax positions of prior
years are primarily attributable to the completion of the IRS exam-
ination for 2011 and 2012, currency, non-U.S. audits and impacts
due to lapses in statutes of limitation.
In April 2010, the company appealed the determination of the
Japan Tax Authorities with respect to certain foreign tax losses.
The unrecognized tax benefit of these losses totals $997 million
as of December 31, 2015. In April 2011, the company received noti-
fication that the appeal was denied, and in June 2011, the company
filed a lawsuit challenging this decision. In May 2014, the Tokyo
District Court ruled in favor of the company. The Japanese govern-
ment appealed the ruling to the Tokyo High Court. In March 2015,
the Tokyo High Court ruled in favor of the company and, in April
2015, the Japanese government appealed the ruling to the Japan
Supreme Court. See Note U, “Subsequent Event,” for an update
on this matter.
The liability at December 31, 2015 of $4,574 million can be
reduced by $850 million of offsetting tax benefits associated with
the correlative effects of potential transfer pricing adjustments, U.S.
tax credits, state income taxes and timing adjustments. The net
amount of $3,724 million, if recognized, would favorably affect the
company’s effective tax rate. The net amounts at December 31,
2014 and 2013 were $4,229 million and $3,902 million, respectively.
Interest and penalties related to income tax liabilities are
included in income tax expense. During the year ended Decem-
ber 31, 2015, the company recognized $141 million in interest
expense and penalties; in 2014, the company recognized $216 mil-
lion in interest expense and penalties; and, in 2013, the company
recognized a benefit of $93 million in interest expense and pen-
alties. The company has $613 million for the payment of interest
and penalties accrued at December 31, 2015, and had $593 million
accrued at December 31, 2014.
Within the next 12 months, the company believes it is reason-
ably possible that the total amount of unrecognized tax benefits
associated with certain positions may be reduced as certain
foreign issues may be concluded. The company estimates that
the unrecognized tax benefits at December 31, 2015 could be
reduced by approximately $413 million excluding the Japan matter
discussed above.
The company is subject to taxation in the U.S. and various
state and foreign jurisdictions. With respect to major U.S. state
and foreign taxing jurisdictions, the company is generally no
longer subject to tax examinations for years prior to 2011. With
limited exception, the company is no longer subject to income tax
examination of its U.S. federal tax return for years prior to 2013.
The open years contain matters that could be subject to differing
interpretations of applicable tax laws and regulations related to
the amount and/or timing of income, deductions and tax credits.
Although the outcome of tax audits is always uncertain, the com-
pany believes that adequate amounts of tax and interest have been
provided for any significant adjustments that are expected to result
for these years.
In the fourth quarter of 2013, the company received a draft tax
assessment notice for approximately $866 million (approximately
$810 million at 2015 year-end currency rates) from the Indian
Tax Authorities for 2009. The company believes it will prevail on
these matters and that this amount is not a meaningful indicator

Notes to Consolidated Financial Statements
International Business Machines Corporation and Subsidiary Companies
123
of liability. At December 31, 2015, the company has recorded
$526 million as prepaid income taxes in India. A significant por-
tion of this balance represents cash tax deposits paid over time to
protect the company’s right to appeal various income tax assess-
ments made by the Indian Tax Authorities.
In the first quarter of 2016, the IRS commenced its audit of
the company’s U.S. tax returns for 2013 and 2014. The company
anticipates that this audit will be completed by the end of 2017.
The company has not provided deferred taxes on $68.1 billion
of undistributed earnings of non-U.S. subsidiaries at December 31,
2015, as it is the company’s policy to indefinitely reinvest these
earnings in non-U.S. operations. However, the company period-
ically repatriates a portion of these earnings to the extent that it
does not incur an additional U.S. tax liability. Quantification of the
deferred tax liability, if any, associated with indefinitely reinvested
earnings is not practicable.
NOTE O.
RESEARCH, DEVELOPMENT AND ENGINEERING
RD&E expense was $5,247 million in 2015, $5,437 million in 2014
and $5,743 million in 2013. In addition, RD&E expense included in
discontinued operations was $197 million in 2015, $368 million in
2014 and $483 million in 2013.
The company incurred total expense of $5,178 million, $5,595
million and $5,959 million in 2015, 2014 and 2013, respectively, for
scientific research and the application of scientific advances to
the development of new and improved products and their uses,
as well as services and their application. Within these amounts,
software-related expense was $3,064 million, $3,064 million and
$3,077 million in 2015, 2014 and 2013, respectively.
Expense for product-related engineering was $267 million,
$211 million and $267 million in 2015, 2014 and 2013, respectively.
NOTE P.
EARNINGS PER SHARE OF COMMON STOCK
The following table presents the computation of basic and diluted earnings per share of common stock.
($ in millions except per share amounts)
For the year ended December 31: 2015 2014 2013
Weighted-average number of shares on which earnings per share calculations are based
Basic 978,744,523 1,004,272,584 1,094,486,604
Add—incremental shares under stock-based compensation plans 3,037,001 4,332,155 6,751,240
Add—incremental shares associated with contingently issuable shares 918,744 1,395,741 1,804,313
Assuming dilution 982,700,267 1,010,000,480 1,103,042,156
Income from continuing operations $13,364 $15,751 $16,881
Loss from discontinued operations, net of tax (174) (3,729) (398)
Net income on which basic earnings per share is calculated $13,190 $12,022 $16,483
Income from continuing operations $13,364 $15,751 $16,881
Net income applicable to contingently issuable shares (1) (3) (1)
Income from continuing operations on which diluted earnings per share is calculated $13,363 $15,749 $16,880
Loss from discontinued operations, net of tax, on which basic and diluted earnings
per share is calculated (174) (3,729 ) (398 )
Net income on which diluted earnings per share is calculated $13,189 $12,020 $16,483
Earnings/(loss) per share of common stock
Assuming dilution
Continuing operations $ 13.60 $ 15.59 $ 15.30
Discontinued operations (0.18) (3.69) (0.36)
Total $ 13.42 $ 11.90 $ 14.94
Basic
Continuing operations $ 13.66 $ 15.68 $ 15.42
Discontinued operations (0.18) (3.71) (0.36)
Total $ 13.48 $ 11.97 $ 15.06

Notes to Consolidated Financial Statements
International Business Machines Corporation and Subsidiary Companies
124
Weighted-average stock options to purchase 41,380 common
shares in 2015, 17,420 common shares in 2014 and 8,797 common
shares in 2013 were outstanding, but were not included in the com-
putation of diluted earnings per share because the exercise price
of the options was greater than the average market price of the
common shares for the full year, and therefore, the effect would
have been antidilutive.
NOTE Q.
RENTAL EXPENSE AND LEASE COMMITMENTS
Rental expense, including amounts charged to inventories and
fixed assets, and excluding amounts previously reserved, was
$1,474 million in 2015, $1,592 million in 2014 and $1,759 million in
2013. Within these amounts, rental expense reflected in discon-
tinued operations was $29 million, $95 million and $115 million, in
2015, 2014 and 2013, respectively. Rental expense in agreements
with rent holidays and scheduled rent increases is recorded on
a straight-line basis over the lease term. Contingent rentals are
included in the determination of rental expense as accruable.
The table below depicts gross minimum rental commitments
under noncancelable leases, amounts related to vacant space
associated with infrastructure reductions, sublease income com-
mitments and capital lease commitments. These amounts reflect
activities primarily related to office space, as well as data centers.
($ in millions)
2016 2017 2018 2019 2020 Beyond 2020
Operating lease commitments
Gross minimum rental commitments
(including vacant space below) $1,347 $1,231 $1,107 $985 $776 $988
Vacant space $ 14 $ 4 $ 1 $ — $ — $ —
Sublease income commitments $ 11 $ 7 $ 5 $ 4 $ 1 $ 1
Capital lease commitments $ 7 $ 2 $ 2 $ 2 $ 1 $ —
NOTE R.
STOCK-BASED COMPENSATION
The following table presents total stock-based compensation cost
included in income from continuing operations.
($ in millions)
For the year ended December 31: 2015 2014 2013
Cost $ 100 $ 121 $ 122
Selling, general and administrative 322 350 435
Research, development
and engineering 51 54 57
Other (income) and expense* (6) (13 ) —
Pre-tax stock-based
compensation cost 468 512 614
Income tax benefi ts (156) (174) (213)
Net stock-based
compensation cost $ 312 $ 338 $ 402
* Reflects the one-time effects related to divestitures.
The amount of stock-based compensation cost included in dis-
continued operations, net of tax, was immaterial in all periods.
Total unrecognized compensation cost related to non-vested
awards at December 31, 2015 and 2014 was $871 million and
$874 million, respectively. The amount at December 31, 2015 is
expected to be recognized over a weighted-average period of
approximately 2.7 years.
There was no significant capitalized stock-based compensa-
tion cost at December 31, 2015, 2014 and 2013.
Incentive AwardsStock-based incentive awards are provided to employees under
the terms of the company’s long-term performance plans (the
“Plans”). The Plans are administered by the Executive Compen-
sation and Management Resources Committee of the Board of
Directors (the “Committee”). Awards available under the Plans
principally include restricted stock units, performance share units,
stock options or any combination thereof.
The amount of shares originally authorized to be issued under
the company’s existing Plans was 274 million at December 31,
2015. In addition, certain incentive awards granted under previ-
ous plans, if and when those awards were canceled, could be
reissued under the company’s existing Plans. As such, 66.2 million
additional awards were considered authorized to be issued under
the company’s existing Plans as of December 31, 2015. There were
111.6 million unused shares available to be granted under the Plans
as of December 31, 2015.
Under the company’s long-standing practices and policies, all
awards are approved prior to or on the date of grant. The awards
approval process specifies the individual receiving the grant, the
number of options or the value of the award, the exercise price or
formula for determining the exercise price and the date of grant.
All awards for senior management are approved by the Commit-
tee. All awards for employees other than senior management are
approved by senior management pursuant to a series of delega-
tions that were approved by the Committee, and the grants made
pursuant to these delegations are reviewed periodically with the

Notes to Consolidated Financial Statements
International Business Machines Corporation and Subsidiary Companies
125
Committee. Awards that are given as part of annual total compen-
sation for senior management and other employees are made on
specific cycle dates scheduled in advance. With respect to awards
given in connection with promotions or new hires, the company’s
policy requires approval of such awards prior to the grant date,
which is typically the date of the promotion or the date of hire.
Stock Awards
Stock awards are made in the form of Restricted Stock Units
(RSUs), including Retention Restricted Stock Units (RRSUs), or
Performance Share Units (PSUs).
The tables below summarize RSU and PSU activity under the
Plans during the years ended December 31, 2015, 2014 and 2013.
RSUs
2015 2014 2013
Weighted- Average
Grant PriceNumber of Units
Weighted- Average
Grant PriceNumber of Units
Weighted- Average
Grant PriceNumber of Units
Balance at January 1 $171 7,734,277 $166 8,635,317 $148 9,841,461
RSUs granted 143 4,230,186 172 2,525,947 189 2,541,081
RSUs released 164 (3,567,495) 157 (2,401,761) 131 (2,952,363)
RSUs canceled/forfeited 167 (869,627) 167 (1,025,226) 154 (794,862)
Balance at December 31 $159 7,527,341 $171 7,734,277 $166 8,635,317
PSUs
2015 2014 2013
Weighted- Average
Grant PriceNumber of Units
Weighted- Average
Grant PriceNumber of Units
Weighted- Average
Grant PriceNumber of Units
Balance at January 1 $185 3,140,707 $178 2,824,294 $151 3,172,201
PSUs granted at target 153 1,137,242 180 1,430,098 195 869,875
Performance adjustments* 185 (168,055) 157 29,960 118 152,069
PSUs released 185 (840,552) 157 (1,027,181) 118 (1,321,784)
PSUs canceled/forfeited 184 (340,410) 187 (116,464) 170 (48,067)
Balance at December 31** $173 2,928,932 $185 3,140,707 $178 2,824,294
* Represents the change in shares issued to employees after vesting of PSUs because final performance metrics were above or below specified targets.
** Represents the number of shares expected to be issued based on achievement of grant date performance targets. The actual number of shares issued will depend on final
performance against specified targets over the vesting period.
RSUs are stock awards granted to employees that entitle the
holder to shares of common stock as the award vests, typically
over a one- to five-year period. For RSUs, dividend equivalents
are not paid. The fair value of such RSUs is determined and fixed
on the grant date based on the company’s stock price adjusted
for the exclusion of dividend equivalents.
The remaining weighted-average contractual term of RSUs
at December 31, 2015, 2014 and 2013 is the same as the period
over which the remaining cost of the awards will be recognized,
which is approximately three years. The fair value of RSUs granted
during the years ended December 31, 2015, 2014 and 2013 was
$606 million, $434 million and $481 million, respectively. The total
fair value of RSUs vested and released during the years ended
December 31, 2015, 2014 and 2013 was $583 million, $378 mil-
lion and $386 million, respectively. As of December 31, 2015, 2014
and 2013, there was $800 million, $754 million and $871 million,
respectively, of unrecognized compensation cost related to non-
vested RSUs. The company received no cash from employees
as a result of employee vesting and release of RSUs for the years
ended December 31, 2015, 2014 and 2013.

Notes to Consolidated Financial Statements
International Business Machines Corporation and Subsidiary Companies
126
PSUs are stock awards where the number of shares ulti-
mately received by the employee depends on the company’s
performance against specified targets and typically vest over a
three-year period. For PSUs, dividend equivalents are not paid.
The fair value of each PSU is determined on the grant date, based
on the company’s stock price, adjusted for the exclusion of divi-
dend equivalents, and assumes that performance targets will be
achieved. Over the performance period, the number of shares of
stock that will be issued is adjusted upward or downward based
upon the probability of achievement of performance targets. The
ultimate number of shares issued and the related compensation
cost recognized as expense will be based on a comparison of the
final performance metrics to the specified targets. The fair value
of PSUs granted at target during the years ended December 31,
2015, 2014 and 2013 was $174 million, $257 million and $170 million,
respectively. Total fair value of PSUs vested and released during
the years ended December 31, 2015, 2014 and 2013 was $156 mil-
lion, $161 million and $156 million, respectively.
In connection with vesting and release of RSUs and PSUs, the
tax benefits realized by the company for the years ended Decem-
ber 31, 2015, 2014 and 2013 were $228 million, $222 million and
$312 million, respectively.
Stock Options
Stock options are awards which allow the employee to purchase
shares of the company’s stock at a fixed price. Stock options are
granted at an exercise price equal to the company’s average high
and low stock price on the date of grant. These awards generally
vest in four equal increments on the first four anniversaries of the
grant date and have a contractual term of 10 years.
The company estimates the fair value of stock options at the
date of grant using the Black-Scholes valuation model. Key inputs
and assumptions used to estimate the fair value of stock options
include the grant price of the award, the expected option term, vol-
atility of the company’s stock, the risk-free rate and the company’s
dividend yield. Estimates of fair value are not intended to predict
actual future events or the value ultimately realized by employees
who receive equity awards, and subsequent events are not indic-
ative of the reasonableness of the original estimates of fair value
made by the company.
During the years ended December 31, 2015, 2014 and 2013, the
company did not grant stock options.
The following table summarizes option activity under the Plans
during the years ended December 31, 2015, 2014 and 2013.
2015 2014 2013
Weighted- Average
Exercise Price
Number of Shares
Under Option
Weighted- Average
Exercise Price
Number of Shares
Under Option
Weighted- Average
Exercise Price
Number of Shares
Under Option
Balance at January 1 $ 97 1,750,949 $97 5,622,951 $94 11,389,721
Options exercised 98 (1,214,109) 97 (3,740,252) 90 (5,585,127)
Options canceled/expired 100 (57,066) 95 (131,750) 86 (181,643)
Balance at December 31 $ 94 479,774 $97 1,750,949 $97 5,622,951
Exercisable at December 31 $ 94 479,774 $97 1,750,949 $97 5,622,951
The shares under option at December 31, 2015 were in the following exercise price ranges:
Options Outstanding and Exercisable
Exercise Price Range
Weighted- Average
Exercise Price
Number of Shares
Under Option
Aggregate Intrinsic
Value
Weighted-Average Remaining
Contractual Life (in Years)
$85 and under $ 83 192,959 $10,597,402 0.3
$86 and over 101 286,815 10,376,342 1.2
$ 94 479,774 $20,973,745 0.9
Exercises of Employee Stock Options
The total intrinsic value of options exercised during the years
ended December 31, 2015, 2014 and 2013 was $74 million,
$323 million and $614 million, respectively. The total cash received
from employees as a result of employee stock option exercises for
the years ended December 31, 2015, 2014 and 2013 was approxi-
mately $119 million, $364 million and $505 million, respectively. In
connection with these exercises, the tax benefits realized by the
company for the years ended December 31, 2015, 2014 and 2013
were $26 million, $107 million and $199 million, respectively.
The company settles employee stock option exercises pri-
marily with newly issued common shares and, occasionally,
with treasury shares. Total treasury shares held at December 31,
2015 and 2014 were approximately 1,255 million and 1,225 million
shares, respectively.

Notes to Consolidated Financial Statements
International Business Machines Corporation and Subsidiary Companies
127
Acquisitions
In connection with various acquisition transactions, there was
an additional 0.4 million shares of stock-based awards, consist-
ing of stock options and restricted stock units, outstanding at
December 31, 2015, as a result of the company’s conversion of
stock-based awards previously granted by the acquired entities.
The weighted-average exercise price of these awards was $50
per share.
IBM Employees Stock Purchase PlanThe company maintains a non-compensatory Employees Stock
Purchase Plan (ESPP). The ESPP enables eligible participants
to purchase full or fractional shares of IBM common stock at a
5 percent discount off the average market price on the day of
purchase through payroll deductions of up to 10 percent of eligible
compensation. Eligible compensation includes any compensation
received by the employee during the year. The ESPP provides for
offering periods during which shares may be purchased and con-
tinues as long as shares remain available under the ESPP, unless
terminated earlier at the discretion of the Board of Directors. Indi-
vidual ESPP participants are restricted from purchasing more than
$25,000 of common stock in one calendar year or 1,000 shares
in an offering period.
Employees purchased 1.3 million, 1.3 million and 1.5 million
shares under the ESPP during the years ended December 31,
2015, 2014 and 2013, respectively. Cash dividends declared and
paid by the company on its common stock also include cash
dividends on the company stock purchased through the ESPP.
Dividends are paid on full and fractional shares and can be rein-
vested. The company stock purchased through the ESPP is
considered outstanding and is included in the weighted-average
outstanding shares for purposes of computing basic and diluted
earnings per share.
In July 2014, the “2014 ESPP Reserve” became effective and
25 million additional shares of authorized common stock were
reserved and approved for issuance. The 2014 ESPP provides for
semi-annual offerings commencing July 1, 2014, and continuing as
long as shares remain available under the ESPP, unless terminated
earlier at the discretion of the Board of Directors.
Approximately 23.1 million, 24.4 million and 2.3 million shares
were available for purchase under the ESPP at December 31, 2015,
2014 and 2013, respectively.
NOTE S.
RETIREMENT-RELATED BENEFITS
Description of PlansIBM sponsors defined benefit pension plans and defined contri-
bution plans that cover eligible regular employees, a supplemental
retention plan that covers certain U.S. executives and nonpension
postretirement benefit plans primarily consisting of retiree medical
and dental benefits for eligible retirees and dependents.
U.S. Plans
Defined Benefit Pension Plans
IBM Personal Pension Plan
IBM provides U.S. regular, full-time and part-time employees hired
prior to January 1, 2005 with noncontributory defined benefit pen-
sion benefits via the IBM Personal Pension Plan. Prior to 2008,
the IBM Personal Pension Plan consisted of a tax qualified (qual-
ified) plan and a non-tax qualified (nonqualified) plan. Effective
January 1, 2008, the nonqualified plan was renamed the Excess
Personal Pension Plan (Excess PPP) and the qualified plan is
now referred to as the Qualified PPP. The combined plan is now
referred to as the PPP. The Qualified PPP is funded by company
contributions to an irrevocable trust fund, which is held for the
sole benefit of participants and beneficiaries. The Excess PPP,
which is unfunded, provides benefits in excess of IRS limitations
for qualified plans.
Benefits provided to the PPP participants are calculated
using benefit formulas that vary based on the participant. The
first method uses a five-year, final pay formula that determines
benefits based on salary, years of service, mortality and other par-
ticipant-specific factors. The second method is a cash balance
formula that calculates benefits using a percentage of employees’
annual salary, as well as an interest crediting rate.
Benefit accruals under the IBM Personal Pension Plan ceased
December 31, 2007 for all participants.
U.S. Supplemental Executive Retention Plan
The company also sponsors a nonqualified U.S. Supplemental
Executive Retention Plan (Retention Plan). The Retention Plan,
which is unfunded, provides benefits to eligible U.S. executives
based on average earnings, years of service and age at termination
of employment.
Benefit accruals under the Retention Plan ceased Decem-
ber 31, 2007 for all participants.
Defined Contribution Plans
IBM 401(k) Plus Plan
U.S. regular, full-time and part-time employees are eligible to par-
ticipate in the IBM 401(k) Plus Plan, which is a qualified defined
contribution plan under section 401(k) of the Internal Revenue
Code. Under the IBM 401(k) Plus Plan, eligible employees receive a
dollar-for-dollar match of their contributions generally up to 6 per-
cent of eligible compensation for those hired prior to January 1,
2005, and, generally up to 5 percent of eligible compensation for
those hired on or after January 1, 2005. In addition, eligible employ-
ees generally receive automatic contributions from the company
equal to 1, 2 or 4 percent of eligible compensation based on
their eligibility to participate in the PPP as of December 31, 2007.
Employees generally receive automatic contributions and match-
ing contributions after the completion of one year of service.

Notes to Consolidated Financial Statements
International Business Machines Corporation and Subsidiary Companies
128
The company’s matching contributions vest immediately and
participants are always fully vested in their own contributions. All
contributions, including the company match, are made in cash and
invested in accordance with participants’ investment elections.
There are no minimum amounts that must be invested in com-
pany stock, and there are no restrictions on transferring amounts
out of company stock to another investment choice, other than
excessive trading rules applicable to such investments. Effec-
tive January 1, 2013, matching and automatic contributions are
made once annually at the end of the year. In order to receive
such contributions each year, a participant must be employed on
December 15 of the plan year. However, if a participant separates
from service prior to December 15, and has completed certain ser-
vice and/or age requirements, then the participant will be eligible
to receive such matching and automatic contributions following
separation from service.
IBM Excess 401(k) Plus Plan
The IBM Excess 401(k) Plus Plan (Excess 401(k)) is an unfunded,
nonqualified defined contribution plan. Employees whose eligible
compensation is expected to exceed the IRS compensation limit
for qualified plans are eligible to participate in the Excess 401(k).
The purpose of the Excess 401(k) is to provide benefits that would
be provided under the qualified IBM 401(k) Plus Plan if the com-
pensation limits did not apply.
Amounts deferred into the Excess 401(k) are record-keeping
(notional) accounts and are not held in trust for the participants.
Participants in the Excess 401(k) may invest their notional accounts
in investments which mirror the primary investment options
available under the 401(k) Plus Plan. Participants in the Excess
401(k) are also eligible to receive company match and automatic
contributions (at the same rate as under the 401(k) Plus Plan) on
eligible compensation deferred into the Excess 401(k) and on
compensation earned in excess of the Internal Revenue Code
pay limit once they have completed one year of service. Amounts
deferred into the Excess 401(k), including company contributions
are recorded as liabilities in the Consolidated Statement of Finan-
cial Position. Effective January 1, 2013, matching and automatic
contributions are recorded once annually at the end of the year.
In order to receive such contributions each year, a participant
must be employed on December 15 of the plan year. However, if
a participant separates from service prior to December 15, and
has completed certain service and/or age requirements, then the
participant will be eligible to receive such matching and automatic
contributions following separation from service.
Nonpension Postretirement Benefit Plan
U.S. Nonpension Postretirement Plan
The company sponsors a defined benefit nonpension postretire-
ment benefit plan that provides medical and dental benefits to
eligible U.S. retirees and eligible dependents, as well as life insur-
ance for eligible U.S. retirees. Effective July 1, 1999, the company
established a Future Health Account (FHA) for employees who
were more than five years from retirement eligibility. Employees
who were within five years of retirement eligibility are covered
under the company’s prior retiree health benefits arrangements.
Under either the FHA or the prior retiree health benefit arrange-
ments, there is a maximum cost to the company for retiree health
benefits. Effective January 1, 2014, the company amended the plan
to establish a Health Reimbursement Arrangement (HRA) for each
Medicare-eligible plan retiree, surviving spouse and long-term
disability plan participant who is eligible for company-subsidized
coverage and who enrolls in an individual plan under the Medi-
care Exchange. The company also amended its life insurance plan.
Employees retiring on or after January 1, 2015 are not eligible for
life insurance.
Since January 1, 2004, new hires, as of that date or later, are
not eligible for company-subsidized nonpension postretirement
benefits.
Non-U.S. Plans
Certain subsidiaries and branches outside the United States spon-
sor defined benefit and/or defined contribution plans that cover
eligible regular employees. The company deposits funds under
various fiduciary-type arrangements, purchases annuities under
group contracts or provides reserves for these plans. Benefits
under the defined benefit plans are typically based either on years
of service and the employee’s compensation (generally during a
fixed number of years immediately before retirement) or on annual
credits. The range of assumptions that are used for the non-U.S.
defined benefit plans reflect the different economic environments
within the various countries.
In addition, certain of the company’s non-U.S. subsidiaries
sponsor nonpension postretirement benefit plans that provide
medical and dental benefits to eligible non-U.S. retirees and eligible
dependents, as well as life insurance for certain eligible non-U.S.
retirees. However, most non-U.S. retirees are covered by local gov-
ernment sponsored and administered programs.
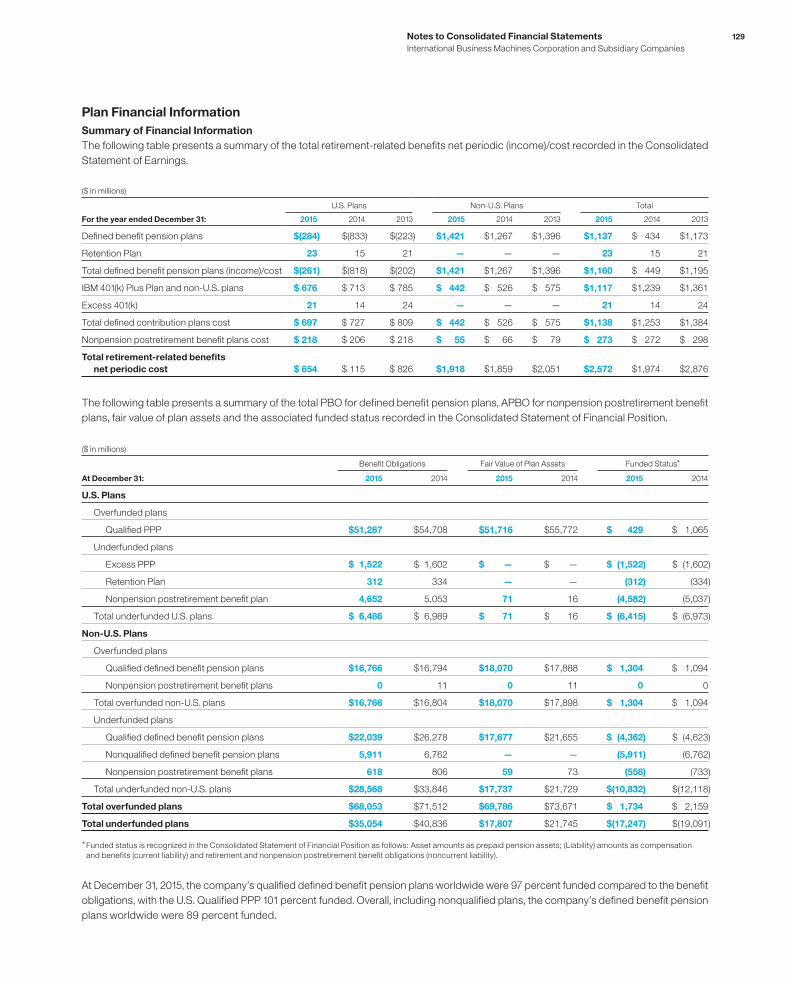
Notes to Consolidated Financial Statements
International Business Machines Corporation and Subsidiary Companies
129
Plan Financial Information
Summary of Financial Information
The following table presents a summary of the total retirement-related benefits net periodic (income)/cost recorded in the Consolidated
Statement of Earnings.
($ in millions)
U.S. Plans Non-U.S. Plans Total
For the year ended December 31: 2015 2014 2013 2015 2014 2013 2015 2014 2013
Defi ned benefi t pension plans $(284) $(833) $(223) $1,421 $1,267 $1,396 $1,137 $ 434 $1,173
Retention Plan 23 15 21 — — — 23 15 21
Total defi ned benefi t pension plans (income)/cost $(261) $(818) $(202) $1,421 $1,267 $1,396 $1,160 $ 449 $1,195
IBM 401(k) Plus Plan and non-U.S. plans $ 676 $ 713 $ 785 $ 442 $ 526 $ 575 $1,117 $1,239 $1,361
Excess 401(k) 21 14 24 — — — 21 14 24
Total defi ned contribution plans cost $ 697 $ 727 $ 809 $ 442 $ 526 $ 575 $1,138 $1,253 $1,384
Nonpension postretirement benefi t plans cost $ 218 $ 206 $ 218 $ 55 $ 66 $ 79 $ 273 $ 272 $ 298
Total retirement-related benefi ts
net periodic cost $ 654 $ 115 $ 826 $1,918 $1,859 $2,051 $2,572 $1,974 $2,876
The following table presents a summary of the total PBO for defined benefit pension plans, APBO for nonpension postretirement benefit
plans, fair value of plan assets and the associated funded status recorded in the Consolidated Statement of Financial Position.
($ in millions)
Benefi t Obligations Fair Value of Plan Assets Funded Status*
At December 31: 2015 2014 2015 2014 2015 2014
U.S. Plans
Overfunded plans
Qualifi ed PPP $51,287 $54,708 $51,716 $55,772 $ 429 $ 1,065
Underfunded plans
Excess PPP $ 1,522 $ 1,602 $ — $ — $ (1,522) $ (1,602)
Retention Plan 312 334 — — (312) (334)
Nonpension postretirement benefi t plan 4,652 5,053 71 16 (4,582) (5,037)
Total underfunded U.S. plans $ 6,486 $ 6,989 $ 71 $ 16 $ (6,415) $ (6,973)
Non-U.S. Plans
Overfunded plans
Qualifi ed defi ned benefi t pension plans $16,766 $16,794 $18,070 $17,888 $ 1,304 $ 1,094
Nonpension postretirement benefi t plans 0 11 0 11 0 0
Total overfunded non-U.S. plans $16,766 $16,804 $18,070 $17,898 $ 1,304 $ 1,094
Underfunded plans
Qualifi ed defi ned benefi t pension plans $22,039 $26,278 $17,677 $21,655 $ (4,362) $ (4,623)
Nonqualifi ed defi ned benefi t pension plans 5,911 6,762 — — (5,911) (6,762)
Nonpension postretirement benefi t plans 618 806 59 73 (558) (733)
Total underfunded non-U.S. plans $28,568 $33,846 $17,737 $21,729 $(10,832) $(12,118)
Total overfunded plans $68,053 $71,512 $69,786 $73,671 $ 1,734 $ 2,159
Total underfunded plans $35,054 $40,836 $17,807 $21,745 $(17,247) $(19,091)
* Funded status is recognized in the Consolidated Statement of Financial Position as follows: Asset amounts as prepaid pension assets; (Liability) amounts as compensation
and benefits (current liability) and retirement and nonpension postretirement benefit obligations (noncurrent liability).
At December 31, 2015, the company’s qualified defined benefit pension plans worldwide were 97 percent funded compared to the benefit
obligations, with the U.S. Qualified PPP 101 percent funded. Overall, including nonqualified plans, the company’s defined benefit pension
plans worldwide were 89 percent funded.

Notes to Consolidated Financial Statements
International Business Machines Corporation and Subsidiary Companies
130
Defined Benefit Pension and Nonpension Postretirement
Benefit Plan Financial Information
The following tables through page 132 represent financial informa-
tion for the company’s retirement-related benefit plans, excluding
defined contribution plans. The defined benefit pension plans
under U.S. Plans consists of the Qualified PPP, the Excess PPP
and the Retention Plan. The defined benefit pension plans and
the nonpension postretirement benefit plans under non-U.S. Plans
consists of all plans sponsored by the company’s subsidiaries. The
nonpension postretirement benefit plan under U.S. Plan consists
of only the U.S. Nonpension Postretirement Benefit Plan.
The tables below present the components of net periodic
(income)/cost of the retirement-related benefit plans recognized
in the Consolidated Statement of Earnings, excluding defined con-
tribution plans.
($ in millions)
Defi ned Benefi t Pension Plans
U.S. Plans Non-U.S. Plans
For the year ended December 31: 2015 2014 2013 2015 2014 2013
Service cost $ — $ — $ — $ 454 $ 449 $ 501
Interest cost 2,028 2,211 1,980 1,075 1,533 1,524
Expected return on plan assets (3,953) (4,096) (3,981) (1,919) (2,247) (2,195)
Amortization of transition assets — — — 0 0 0
Amortization of prior service costs/(credits) 10 10 10 (98) (111) (119)
Recognized actuarial losses 1,654 1,056 1,790 1,581 1,400 1,600
Curtailments and settlements — — — 35 26 0
Multi-employer plans/other costs* — — — 293 217 85
Total net periodic (income)/cost $ (261) $ (818) $ (202) $ 1,421 $ 1,267 $ 1,396
($ in millions)
Nonpension Postretirement Benefi t Plans
U.S. Plan Non-U.S. Plans
For the year ended December 31: 2015 2014 2013 2015 2014 2013
Service cost $ 24 $ 26 $ 35 $ 7 $ 7 $10
Interest cost 163 187 164 50 63 60
Expected return on plan assets 0 0 (1) (7) (9) (9)
Amortization of transition assets — — — 0 0 0
Amortization of prior service costs/(credits) (7) (7) — (5) (5) (5)
Recognized actuarial losses 39 0 21 10 11 23
Curtailments and settlements — — — 0 0 0
Total net periodic cost $218 $206 $218 $55 $66 $79
* The non-U.S. plans amount includes $233 million and $148 million related to the IBM Spain pension litigation for 2015 and 2014, respectively. See page 132 for additional information.
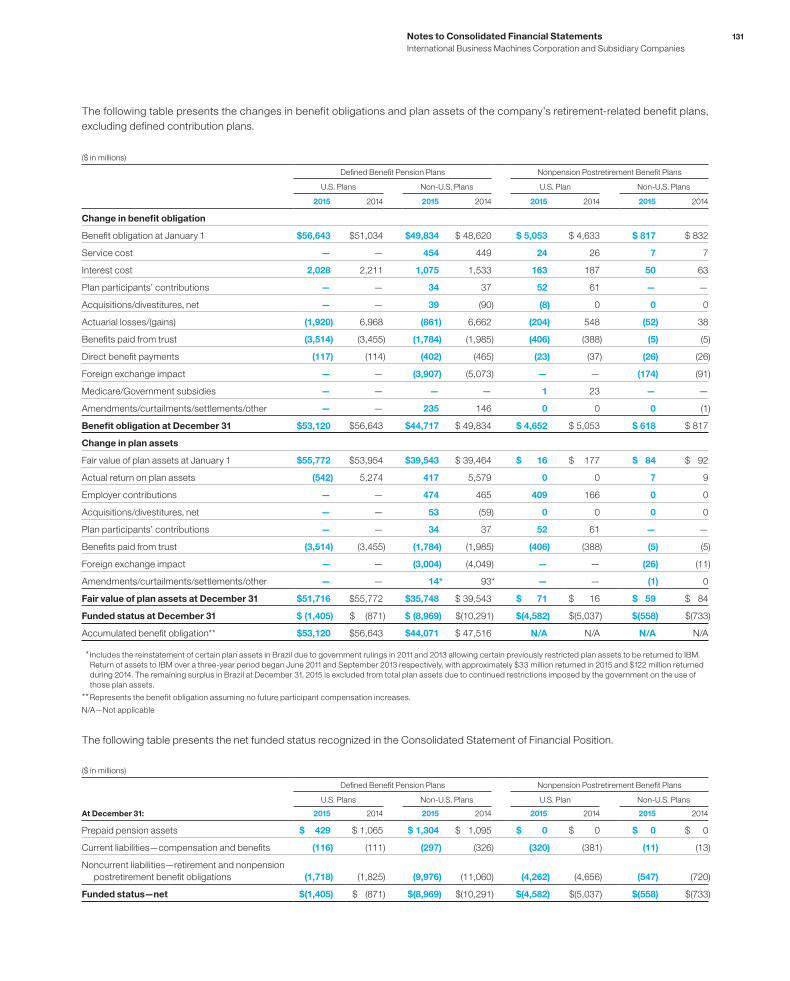
Notes to Consolidated Financial Statements
International Business Machines Corporation and Subsidiary Companies
131
The following table presents the changes in benefit obligations and plan assets of the company’s retirement-related benefit plans,
excluding defined contribution plans.
($ in millions)
Defi ned Benefi t Pension Plans Nonpension Postretirement Benefi t Plans
U.S. Plans Non-U.S. Plans U.S. Plan Non-U.S. Plans
2015 2014 2015 2014 2015 2014 2015 2014
Change in benefi t obligation
Benefi t obligation at January 1 $56,643 $51,034 $49,834 $ 48,620 $ 5,053 $ 4,633 $ 817 $ 832
Service cost — — 454 449 24 26 7 7
Interest cost 2,028 2,211 1,075 1,533 163 187 50 63
Plan participants’ contributions — — 34 37 52 61 — —
Acquisitions/divestitures, net — — 39 (90) (8) 0 0 0
Actuarial losses/(gains) (1,920) 6,968 (861) 6,662 (204) 548 (52) 38
Benefi ts paid from trust (3,514) (3,455) (1,784) (1,985) (406) (388) (5) (5)
Direct benefi t payments (117) (114) (402) (465) (23) (37) (26) (26)
Foreign exchange impact — — (3,907) (5,073) — — (174) (91)
Medicare/Government subsidies — — — — 1 23 — —
Amendments/curtailments/settlements/other — — 235 146 0 0 0 (1)
Benefi t obligation at December 31 $53,120 $56,643 $44,717 $ 49,834 $ 4,652 $ 5,053 $ 618 $ 817
Change in plan assets
Fair value of plan assets at January 1 $55,772 $53,954 $39,543 $ 39,464 $ 16 $ 177 $ 84 $ 92
Actual return on plan assets (542) 5,274 417 5,579 0 0 7 9
Employer contributions — — 474 465 409 166 0 0
Acquisitions/divestitures, net — — 53 (59) 0 0 0 0
Plan participants’ contributions — — 34 37 52 61 — —
Benefi ts paid from trust (3,514) (3,455) (1,784) (1,985) (406) (388) (5) (5)
Foreign exchange impact — — (3,004) (4,049) — — (26) (11)
Amendments/curtailments/settlements/other — — 14* 93* — — (1) 0
Fair value of plan assets at December 31 $51,716 $55,772 $35,748 $ 39,543 $ 71 $ 16 $ 59 $ 84
Funded status at December 31 $ (1,405) $ (871) $ (8,969) $(10,291) $(4,582) $(5,037) $(558) $(733)
Accumulated benefi t obligation** $53,120 $56,643 $44,071 $ 47,516 N/A N/A N/A N/A
* Includes the reinstatement of certain plan assets in Brazil due to government rulings in 2011 and 2013 allowing certain previously restricted plan assets to be returned to IBM.
Return of assets to IBM over a three-year period began June 2011 and September 2013 respectively, with approximately $33 million returned in 2015 and $122 million returned
during 2014. The remaining surplus in Brazil at December 31, 2015 is excluded from total plan assets due to continued restrictions imposed by the government on the use of
those plan assets.
** Represents the benefit obligation assuming no future participant compensation increases.
N/A—Not applicable
The following table presents the net funded status recognized in the Consolidated Statement of Financial Position.
($ in millions)
Defi ned Benefi t Pension Plans Nonpension Postretirement Benefi t Plans
U.S. Plans Non-U.S. Plans U.S. Plan Non-U.S. Plans
At December 31: 2015 2014 2015 2014 2015 2014 2015 2014
Prepaid pension assets $ 429 $ 1,065 $ 1,304 $ 1,095 $ 0 $ 0 $ 0 $ 0
Current liabilities—compensation and benefi ts (116) (111) (297) (326) (320) (381) (11) (13)
Noncurrent liabilities—retirement and nonpension
postretirement benefi t obligations (1,718) (1,825) (9,976) (11,060) (4,262) (4,656) (547) (720)
Funded status—net $(1,405) $ (871) $(8,969) $(10,291) $(4,582) $(5,037) $(558) $(733)

Notes to Consolidated Financial Statements
International Business Machines Corporation and Subsidiary Companies
132
The following table presents the pre-tax net loss and prior service costs/(credits) and transition (assets)/liabilities recognized in OCI and
the changes in the pre-tax net loss, prior service costs/(credits) and transition (assets)/liabilities recognized in AOCI for the retirement-
related benefit plans.
($ in millions)
Defi ned Benefi t Pension Plans Nonpension Postretirement Benefi t Plans
U.S. Plans Non-U.S. Plans U.S. Plan Non-U.S. Plans
2015 2014 2015 2014 2015 2014 2015 2014
Net loss at January 1 $18,442 $13,709 $21,676 $19,777 $ 852 $304 $189 $161
Current period loss/(gain) 2,576 5,789 661 3,324 (204) 548 (51) 38
Curtailments and settlements — — (33) (25) — — 0 1
Amortization of net loss included
in net periodic (income)/cost (1,654) (1,056) (1,581) (1,400) (39) 0 (10) (11)
Net loss at December 31 $19,363 $18,442 $20,724 $21,676 $ 609 $852 $128 $189
Prior service costs/(credits) at January 1 $ 110 $ 120 $ (386) $ (496) $ 23 $ 15 $ (26) $ (32)
Current period prior service costs/(credits) — — (6) (1) — — 0 0
Amortization of prior service (costs)/credits
included in net periodic (income)/cost (10) (10) 98 111 7 7 5 5
Prior service costs/(credits) at December 31 $ 101 $ 110 $ (294) $ (386) $ 30 $ 23 $ (21) $ (26)
Transition (assets)/liabilities at January 1 $ — $ — $ 0 $ 0 $ — $ — $ 0 $ 0
Amortization of transition assets/(liabilities)
included in net periodic (income)/cost — — 0 0 — — 0 0
Transition (assets)/liabilities at December 31 $ — $ — $ 0 $ 0 $ — $ — $ 0 $ 0
Total loss recognized in accumulated other
comprehensive income/(loss)* $19,464 $18,552 $20,429 $21,290 $ 639 $875 $106 $163
* See note L, “Equity Activity,” for the total change in AOCI, and the Consolidated Statement of Comprehensive Income for the components of net periodic (income)/cost, including
the related tax effects, recognized in OCI for the retirement-related benefit plans.
The following table presents the pre-tax estimated net loss, estimated prior service costs/(credits) and estimated transition (assets)/
liabilities of the retirement-related benefit plans that will be amortized from AOCI into net periodic (income)/cost in 2016.
($ in millions)
Defi ned Benefi t Pension Plans
Nonpension Postretirement Benefi t Plans
U.S. Plans Non-U.S. Plans U.S. Plan Non-U.S. Plans
Net loss $1,331 $1,361 $19 $8
Prior service costs/(credits) 10 (96) (7) (4)
Transition (assets)/liabilities — — — —
On March 24, 2014, the Supreme Court of Spain issued a ruling
against IBM Spain in litigation involving its defined benefit and
defined contribution plans. As a result of the ruling, the company
recorded pre-tax retirement-related obligations of $233 million in
2015 and $148 million in 2014 in selling, general and administrative
expense in the Consolidated Statement of Earnings. These obliga-
tions are reflected in “Non-U.S. Plans—Multi-employer plans/other
costs” in the table on page 130. See note M, “Contingencies and
Commitments,” on page 119 for additional information regarding
pension plan litigation matters.

Notes to Consolidated Financial Statements
International Business Machines Corporation and Subsidiary Companies
133
Assumptions Used to Determine Plan Financial Information
Underlying both the measurement of benefit obligations and net
periodic (income)/cost are actuarial valuations. These valuations
use participant-specific information such as salary, age and years
of service, as well as certain assumptions, the most significant of
which include estimates of discount rates, expected return on plan
assets, rate of compensation increases, interest crediting rates and
mortality rates. The company evaluates these assumptions, at a
minimum, annually, and makes changes as necessary.
The table below presents the assumptions used to measure
the net periodic (income)/cost and the year-end benefit obligations
for retirement-related benefit plans.
Defi ned Benefi t Pension Plans
U.S. Plans Non-U.S. Plans
2015 2014 2013 2015 2014 2013
Weighted-average assumptions used to measure net
periodic (income)/cost for the year ended December 31
Discount rate 3.70% 4.50% 3.60% 2.34% 3.32% 3.23%
Expected long-term returns on plan assets 7.50% 8.00% 8.00% 5.67% 6.08% 6.21%
Rate of compensation increase N/A N/A N/A 2.49% 2.52% 2.51%
Weighted-average assumptions used to measure
benefi t obligations at December 31
Discount rate 4.00% 3.70% 4.50% 2.40% 2.34% 3.32%
Rate of compensation increase N/A N/A N/A 2.40% 2.49% 2.52%
N/A—Not applicable
Nonpension Postretirement Benefi t Plans
U.S. Plan Non-U.S. Plans
2015 2014 2013 2015 2014 2013
Weighted-average assumptions used to measure net
periodic cost for the year ended December 31
Discount rate 3.40% 4.10% 3.30% 7.51% 7.78% 6.43%
Expected long-term returns on plan assets N/A N/A 0.35% 10.17% 10.22% 9.01%
Weighted-average assumptions used to measure
benefi t obligations at December 31
Discount rate 3.70% 3.40% 4.10% 7.06% 7.51% 7.78%
N/A—Not applicable
Discount Rate
The discount rate assumptions used for retirement-related ben-
efit plans accounting reflect the yields available on high-quality,
fixed-income debt instruments at the measurement date. For
the U.S. and certain non-U.S. countries, a portfolio of high-qual-
ity corporate bonds is used to construct a yield curve. The cash
flows from the company’s expected benefit obligation payments
are then matched to the yield curve to derive the discount rates.
In other non-U.S. countries, where the markets for high-quality
long-term bonds are not generally as well developed, a portfo-
lio of long-term government bonds is used as a base, to which a
credit spread is added to simulate corporate bond yields at these
maturities in the jurisdiction of each plan, as the benchmark for
developing the respective discount rates.

Notes to Consolidated Financial Statements
International Business Machines Corporation and Subsidiary Companies
134
For the U.S. defined benefit pension plans, the changes in the
discount rate assumptions impacted the net periodic (income)/
cost and the PBO. The changes in the discount rate assumptions
resulted in a decrease in 2015 net periodic income of $286 mil-
lion, an increase in 2014 net periodic income of $275 million and a
decrease in 2013 net periodic income of $162 million. The changes
in the discount rate assumptions resulted in a decrease in the PBO
of $1,621 million and an increase of $4,437 million at December 31,
2015 and 2014, respectively.
For the U.S. nonpension postretirement benefit plans, the
changes in the discount rate assumptions had no material impact
on net periodic cost for the years ended December 31, 2015, 2014
and 2013, and resulted in a decrease in the APBO of $109 million
and an increase of $256 million at December 31, 2015 and 2014,
respectively.
For all of the company’s retirement-related benefit plans, the
change in the discount rate assumptions resulted in a decrease
in the benefit obligation of approximately $2 billion at Decem-
ber 31, 2015 and an increase of approximately $11 billion at
December 31, 2014.
Expected Long-Term Returns on Plan Assets
Expected returns on plan assets, a component of net periodic
(income)/cost, represent the expected long-term returns on plan
assets based on the calculated market-related value of plan assets.
Expected long-term returns on plan assets take into account long-
term expectations for future returns and the investment policies
and strategies as described on page 135. These rates of return
are developed by the company and are tested for reasonableness
against historical returns. The use of expected long-term returns
on plan assets may result in recognized pension income that is
greater or less than the actual returns of those plan assets in any
given year. Over time, however, the expected long-term returns
are designed to approximate the actual long-term returns, and
therefore result in a pattern of income and cost recognition that
more closely matches the pattern of the services provided by the
employees. Differences between actual and expected returns are
recognized as a component of net loss or gain in AOCI, which is
amortized as a component of net periodic (income)/cost over the
service lives or life expectancy of the plan participants, depending
on the plan, provided such amounts exceed certain thresholds
provided by accounting standards. The market-related value of
plan assets recognizes changes in the fair value of plan assets
systematically over a five-year period in the expected return on
plan assets line in net periodic (income)/cost.
For the U.S. defined benefit pension plan, the expected
long-term rate of return on plan assets for the years ended
December 31, 2015, 2014 and 2013 was 7.5 percent, 8 percent and
8 percent, respectively. The change in the rate in 2015 resulted in a
decrease in 2015 net periodic income of $264 million. For 2016, the
projected long-term rate of return on plan assets is approximately
7.0 percent.
For the U.S. nonpension postretirement benefit plans, the com-
pany maintains a highly liquid trust fund balance to ensure timely
payments are made. As a result, for the years ended December 31,
2015, 2014 and 2013, the expected long-term return on plan assets
and the actual return on those assets were not material.
Rate of Compensation Increases and Mortality Rate
The rate of compensation increases is determined by the com-
pany, based upon its long-term plans for such increases. The rate
of compensation increase is not applicable to the U.S. defined
benefit pension plans as benefit accruals ceased December 31,
2007 for all participants. Mortality rate assumptions are based on
life expectancy and death rates for different types of participants.
Mortality rates are periodically updated based on actual experi-
ence. In the U.S., the Society of Actuaries released new mortality
tables in 2014 and updated them in 2015. The company utilized
these tables in its plan remeasurements at December 31, 2015 and
2014. For the U.S. retirement-related plans, the change in mortality
assumptions resulted in a decrease to the plan benefit obligations
of $0.7 billion and an increase of $2.6 billion at December 31, 2015
and 2014, respectively.
Interest Crediting Rate
Benefits for certain participants in the PPP are calculated using a
cash balance formula. An assumption underlying this formula is an
interest crediting rate, which impacts both net periodic (income)/
cost and the PBO. This assumption provides a basis for projecting
the expected interest rate that participants will earn on the ben-
efits that they are expected to receive in the following year and is
based on the average from August to October of the one-year U.S.
Treasury Constant Maturity yield plus one percent.
For the PPP, the interest crediting rate of 1.1 percent for the year
ended December 31, 2015 was unchanged from 2014 and, there-
fore, had no impact on the decrease in 2015 net periodic income.
The change in the interest crediting rate to 1.1 percent for the year
ended December 31, 2014, from 1.2 percent for the year ended
December 31, 2013, resulted in an increase in 2014 net periodic
income of $8 million. The change in the interest crediting rate to
1.2 percent for the year ended December 31, 2013, from 1.1 percent
for the year ended December 31, 2012, resulted in a decrease in
2013 net periodic income of $6 million.

Notes to Consolidated Financial Statements
International Business Machines Corporation and Subsidiary Companies
135
Healthcare Cost Trend Rate
For nonpension postretirement benefit plan accounting, the
company reviews external data and its own historical trends for
healthcare costs to determine the healthcare cost trend rates.
However, the healthcare cost trend rate has an insignificant effect
on plan costs and obligations as a result of the terms of the plan
which limit the company’s obligation to the participants. The com-
pany assumes that the healthcare cost trend rate for 2016 will be
7 percent. In addition, the company assumes that the same trend
rate will decrease to 5 percent over the next eight years. A one
percentage point increase or decrease in the assumed health-
care cost trend rate would not have had a material effect on 2015,
2014 and 2013 net periodic cost or the benefit obligations as of
December 31, 2015 and 2014.
Plan Assets
Retirement-related benefit plan assets are recognized and
measured at fair value. Because of the inherent uncertainty of
valuations, these fair value measurements may not necessarily
reflect the amounts the company could realize in current market
transactions.
Investment Policies and Strategies
The investment objectives of the Qualified PPP portfolio are
designed to generate returns that will enable the plan to meet
its future obligations. The precise amount for which these obli-
gations will be settled depends on future events, including the
retirement dates and life expectancy of the plans’ participants.
The obligations are estimated using actuarial assumptions, based
on the current economic environment and other pertinent factors
described on pages 133 through 134. The Qualified PPP portfolio’s
investment strategy balances the requirement to generate returns,
using potentially higher yielding assets such as equity securities,
with the need to control risk in the portfolio with less volatile assets,
such as fixed-income securities. Risks include, among others,
inflation, volatility in equity values and changes in interest rates that
could cause the plan to become underfunded, thereby increasing
its dependence on contributions from the company. To mitigate
any potential concentration risk, careful consideration is given to
balancing the portfolio among industry sectors, companies and
geographies, taking into account interest rate sensitivity, depen-
dence on economic growth, currency and other factors that affect
investment returns. In 2014, the company changed its investment
strategy, modifying the target asset allocation, primarily by reduc-
ing equity securities and increasing debt securities. This change
was designed to reduce the potential negative impact that equity
markets might have on the funded status of the plan. The Qualified
PPP portfolio’s target allocation is 34 percent equity securities,
56 percent fixed-income securities, 5 percent real estate and
5 percent other investments.
The assets are managed by professional investment firms
and investment professionals who are employees of the com-
pany. They are bound by investment mandates determined by
the company’s management and are measured against specific
benchmarks. Among these managers, consideration is given, but
not limited to, balancing security concentration, issuer concentra-
tion, investment style and reliance on particular active and passive
investment strategies.
Market liquidity risks are tightly controlled, with $5,219 million
of the Qualified PPP portfolio as of December 31, 2015 invested
in private market assets consisting of private equities and private
real estate investments, which are less liquid than publicly traded
securities. In addition, the Qualified PPP portfolio had $2,547 mil-
lion in commitments for future investments in private markets to be
made over a number of years. These commitments are expected
to be funded from plan assets.
Derivatives are used as an effective means to achieve
investment objectives and/or as a component of the plan’s risk
management strategy. The primary reasons for the use of deriv-
atives are fixed income management, including duration, interest
rate management and credit exposure, cash equitization and to
manage currency and commodity strategies.
Outside the U.S., the investment objectives are similar to those
described above, subject to local regulations. The weighted-av-
erage target allocation for the non-U.S. plans is 29 percent equity
securities, 58 percent fixed-income securities, 2 percent real
estate and 11 percent other investments, which is consistent with
the allocation decisions made by the company’s management.
The table on page 136 details the actual equity, fixed income,
real estate and other types of investments for non-U.S. plans. In
some countries, a higher percentage allocation to fixed income
is required to manage solvency and funding risks. In others, the
responsibility for managing the investments typically lies with a
board that may include up to 50 percent of members elected
by employees and retirees. This can result in slight differences
compared with the strategies previously described. Generally,
these non-U.S. plans do not invest in illiquid assets and their use
of derivatives is consistent with the U.S. plan and mainly for cur-
rency hedging, interest rate risk management, credit exposure and
alternative investment strategies.
The company’s nonpension postretirement benefit plans are
underfunded or unfunded. For some plans, the company main-
tains a nominal, highly liquid trust fund balance to ensure timely
benefit payments.

Notes to Consolidated Financial Statements
International Business Machines Corporation and Subsidiary Companies
136
Defined Benefit Pension Plan Assets
The following table presents the company’s defined benefit pension plans’ asset classes and their associated fair value at December 31,
2015. The U.S. Plan consists of the Qualified PPP and the non-U.S. Plans consist of all plans sponsored by the company’s subsidiaries.
($ in millions)
U.S. Plan Non-U.S. Plans
Level 1 Level 2 Level 3 Total Level 1 Level 2 Level 3 Total
Equity
Equity securities (1) $11,210 $ 1 $ — $11,211 $4,631 $ 0 $ — $ 4,631
Equity commingled/mutual funds (2) (3) 99 2,036 — 2,134 90 6,200 — 6,290
Fixed income
Government and related (4) — 9,854 — 9,854 — 7,482 16 7,499
Corporate bonds (5) — 17,088 2 17,090 — 1,896 4 1,899
Mortgage and asset-backed securities — 633 10 643 — 219 — 219
Fixed income commingled/mutual funds (2) (6) 313 192 401 907 38 9,082 — 9,120
Insurance contracts — — — — — 1,079 — 1,079
Cash and short-term investments (7) 244 2,305 — 2,549 142 467 — 610
Hedge funds — 1,419 912 2,331 — 659 — 659
Private equity (8) — — 2,790 2,790 — — 582 582
Private real estate (8) — — 2,429 2,429 — — 661 661
Derivatives (9) (82) 2 — (80) (1) 481 — 480
Other commingled/mutual funds (2) (10) — — — — 115 1,637 317 2,069
Subtotal 11,784 33,531 6,544 51,859 5,016 29,202 1,580 35,798
Other (11) — — — (143) — — — (50)
Fair value of plan assets $11,784 $33,531 $6,544 $51,716 $5,016 $29,202 $1,580 $35,748
(1) Represents U.S. and international securities. The U.S. Plan includes IBM common stock of $34 million, representing 0.1 percent of the U.S. Plan assets. Non-U.S. Plans include
IBM common stock of $14 million, representing 0.04 percent of the non-U.S. Plans assets.(2) Commingled funds represent pooled institutional investments.(3) Invests in predominantly equity securities.(4) Includes debt issued by national, state and local governments and agencies.(5) The U.S. Plan includes IBM corporate bonds of $23 million, representing 0.04 percent of the U.S. Plan assets. Non-U.S. plans include IBM corporate bonds of $1 million
representing 0.004 percent of the non-U.S. Plan assets.(6) Invests in predominantly fixed-income securities.(7) Includes cash and cash equivalents and short-term marketable securities.(8) Primarily includes limited partnerships.(9) Includes interest rate derivatives, forwards, exchange traded and other over-the-counter derivatives. (10) Invests in both equity and fixed-income securities. (11) Represents net unsettled transactions, relating primarily to purchases and sales of plan assets.
The U.S. nonpension postretirement benefit plan assets of $71 million were invested in cash, categorized as Level 1 in the fair value hier-
archy. The non-U.S. nonpension postretirement benefit plan assets of $59 million, primarily in Brazil, and, to a lesser extent, in Mexico and
South Africa, were invested primarily in government and related fixed-income securities and corporate bonds, categorized as Level 2 in
the fair value hierarchy.

Notes to Consolidated Financial Statements
International Business Machines Corporation and Subsidiary Companies
137
The following table presents the company’s defined benefit pension plans’ asset classes and their associated fair value at December 31,
2014. The U.S. Plan consists of the Qualified PPP and the non-U.S. Plans consist of all plans sponsored by the company’s subsidiaries.
($ in millions)
U.S. Plan Non-U.S. Plans
Level 1 Level 2 Level 3 Total Level 1 Level 2 Level 3 Total
Equity
Equity securities (1) $11,527 $ 1 $ — $11,528 $5,652 $ — $ — $ 5,652
Equity commingled/mutual funds (2) (3) 85 2,277 — 2,362 126 7,415 — 7,540
Fixed income
Government and related (4) — 7,883 — 7,883 — 8,159 32 8,191
Corporate bonds (5) — 18,828 4 18,832 — 2,063 1 2,063
Mortgage and asset-backed securities — 567 20 587 — 238 — 238
Fixed income commingled/mutual funds (2) (6) 312 3,118 295 3,725 87 9,715 — 9,802
Insurance contracts — — — — — 1,053 — 1,053
Cash and short-term investments (7) 345 2,304 — 2,650 158 393 — 551
Hedge funds — 1,474 889 2,362 — 745 — 745
Private equity (8) — — 3,287 3,287 — — 513 513
Private real estate (8) — — 2,942 2,942 — — 664 664
Derivatives (9) (55) 3 — (53) 2 846 — 848
Other commingled/mutual funds (2) (10) — — — — 33 1,513 220 1,766
Subtotal 12,214 36,455 7,437 56,106 6,056 32,139 1,429 39,625
Other (11) — — — (333) — — — (82)
Fair value of plan assets $12,214 $36,455 $7,437 $55,772 $6,056 $32,139 $1,429 $39,543
(1) Represents U.S. and international securities. The U.S. Plan includes IBM common stock of $55 million, representing 0.1 percent of the U.S. Plan assets. Non-U.S. Plans include
IBM common stock of $21 million, representing 0.1 percent of the non-U.S. Plans assets.(2) Commingled funds represent pooled institutional investments.(3) Invests in predominantly equity securities.(4) Includes debt issued by national, state and local governments and agencies.(5) The U.S. Plan includes IBM corporate bonds of $10 million, representing 0.02 percent of the U.S. Plan assets. Non-U.S. plans include IBM corporate bonds of $4 million
representing 0.01 percent of the non-U.S. Plan assets.(6) Invests in predominantly fixed-income securities.(7) Includes cash and cash equivalents and short-term marketable securities.(8) Primarily includes limited partnerships.(9) Includes interest rate derivatives, forwards, exchange traded and other over-the-counter derivatives. (10) Invests in both equity and fixed-income securities. (11) Represents net unsettled transactions, relating primarily to purchases and sales of plan assets.
The U.S. nonpension postretirement benefit plan assets of $16 million were invested in cash, categorized as Level 1 in the fair value hier-
archy. The non-U.S. nonpension postretirement benefit plan assets of $84 million, primarily in Brazil, and, to a lesser extent, in Mexico
and South Africa, were invested primarily in government and related fixed-income securities and corporate bonds, categorized as Level 2
in the fair value hierarchy.
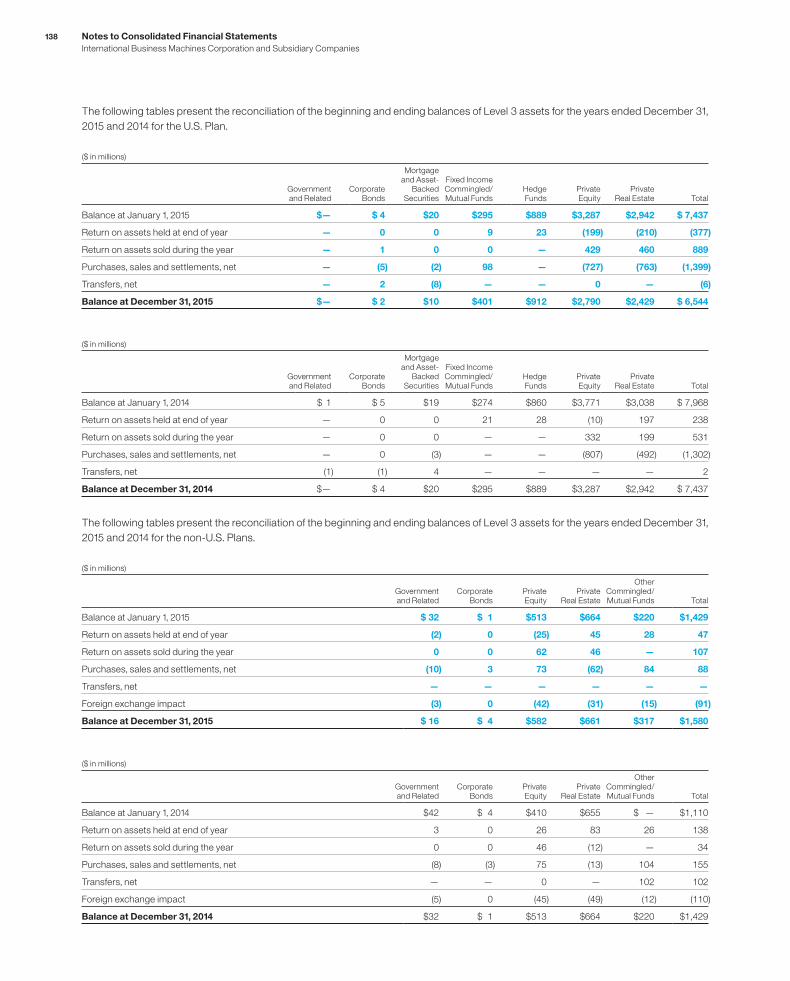
Notes to Consolidated Financial Statements
International Business Machines Corporation and Subsidiary Companies
138
The following tables present the reconciliation of the beginning and ending balances of Level 3 assets for the years ended December 31,
2015 and 2014 for the U.S. Plan.
($ in millions)
Governmentand Related
CorporateBonds
Mortgage and Asset-
Backed Securities
Fixed IncomeCommingled/Mutual Funds
HedgeFunds
Private Equity
Private Real Estate Total
Balance at January 1, 2015 $— $ 4 $20 $295 $889 $3,287 $2,942 $ 7,437
Return on assets held at end of year — 0 0 9 23 (199) (210) (377)
Return on assets sold during the year — 1 0 0 — 429 460 889
Purchases, sales and settlements, net — (5) (2) 98 — (727) (763) (1,399)
Transfers, net — 2 (8) — — 0 — (6)
Balance at December 31, 2015 $— $ 2 $10 $401 $912 $2,790 $2,429 $ 6,544
($ in millions)
Governmentand Related
CorporateBonds
Mortgage and Asset-
Backed Securities
Fixed IncomeCommingled/Mutual Funds
HedgeFunds
Private Equity
Private Real Estate Total
Balance at January 1, 2014 $ 1 $ 5 $19 $274 $860 $3,771 $3,038 $ 7,968
Return on assets held at end of year — 0 0 21 28 (10) 197 238
Return on assets sold during the year — 0 0 — — 332 199 531
Purchases, sales and settlements, net — 0 (3) — — (807) (492) (1,302)
Transfers, net (1) (1) 4 — — — — 2
Balance at December 31, 2014 $— $ 4 $20 $295 $889 $3,287 $2,942 $ 7,437
The following tables present the reconciliation of the beginning and ending balances of Level 3 assets for the years ended December 31,
2015 and 2014 for the non-U.S. Plans.
($ in millions)
Government and Related
Corporate Bonds
PrivateEquity
PrivateReal Estate
Other Commingled/ Mutual Funds Total
Balance at January 1, 2015 $ 32 $ 1 $513 $664 $220 $1,429
Return on assets held at end of year (2) 0 (25) 45 28 47
Return on assets sold during the year 0 0 62 46 — 107
Purchases, sales and settlements, net (10) 3 73 (62) 84 88
Transfers, net — — — — — —
Foreign exchange impact (3) 0 (42) (31) (15) (91)
Balance at December 31, 2015 $ 16 $ 4 $582 $661 $317 $1,580
($ in millions)
Government and Related
CorporateBonds
PrivateEquity
PrivateReal Estate
OtherCommingled/ Mutual Funds Total
Balance at January 1, 2014 $42 $ 4 $410 $655 $ — $1,110
Return on assets held at end of year 3 0 26 83 26 138
Return on assets sold during the year 0 0 46 (12) — 34
Purchases, sales and settlements, net (8) (3) 75 (13) 104 155
Transfers, net — — 0 — 102 102
Foreign exchange impact (5) 0 (45) (49) (12) (110)
Balance at December 31, 2014 $32 $ 1 $513 $664 $220 $1,429
Notes to Consolidated Financial Statements
International Business Machines Corporation and Subsidiary Companies
139
Valuation Techniques
The following is a description of the valuation techniques used
to measure plan assets at fair value. There were no changes in
valuation techniques during 2015 and 2014.
Equity securities are valued at the closing price reported on
the stock exchange on which the individual securities are traded.
IBM common stock is valued at the closing price reported on the
New York Stock Exchange. Equity commingled/mutual funds are
typically valued using the net asset value (NAV) provided by the
administrator of the fund and reviewed by the company. The NAV
is based on the value of the underlying assets owned by the fund,
minus liabilities and divided by the number of shares or units out-
standing. These assets are classified as Level 1, Level 2 or Level 3
depending on availability of quoted market prices.
The fair value of fixed-income securities is typically estimated
using pricing models, quoted prices of securities with similar char-
acteristics or discounted cash flows and are generally classified
as Level 2. If available, they are valued using the closing price
reported on the major market on which the individual securities
are traded.
Cash includes money market accounts that are valued at their
cost plus interest on a daily basis, which approximates fair value.
Short-term investments represent securities with original matur-
ities of one year or less. These assets are classified as Level 1 or
Level 2.
Private equity and private real estate partnership valuations
require significant judgment due to the absence of quoted market
prices, the inherent lack of liquidity and the long-term nature of
such assets. These assets are initially valued at cost and are
reviewed periodically utilizing available and relevant market data to
determine if the carrying value of these assets should be adjusted.
These investments are classified as Level 3. The valuation meth-
odology is applied consistently from period to period.
Exchange traded derivatives are valued at the closing price
reported on the exchange on which the individual securities are
traded, while forward contracts are valued using a mid-close
price. Over-the-counter derivatives are typically valued using
pricing models. The models require a variety of inputs, including,
for example, yield curves, credit curves, measures of volatility and
foreign exchange rates. These assets are classified as Level 1 or
Level 2 depending on availability of quoted market prices.
Expected Contributions
Defined Benefit Pension Plans
It is the company’s general practice to fund amounts for pensions
sufficient to meet the minimum requirements set forth in applicable
employee benefits laws and local tax laws. From time to time, the
company contributes additional amounts as it deems appropriate.
The company contributed $474 million in cash to non-U.S.
defined benefit pension plans and $40 million in cash to multi-em-
ployer plans for the year ended December 31, 2015. For the year
ended December 31, 2014, the company contributed $465 million
in cash to non-U.S. defined benefit pension plans and $54 mil-
lion in cash to multi-employer plans. The cash contributions to
multi-employer plans represent the annual cost included in net
periodic (income)/cost recognized in the Consolidated Statement
of Earnings. The company’s participation in multi-employer plans
has no material impact on the company’s financial statements.
In 2016, the company is not legally required to make any con-
tributions to the U.S. defined benefit pension plans. However,
depending on market conditions, or other factors, the company
may elect to make discretionary contributions to the Qualified PPP
during the year.
The Pension Protection Act of 2006 (the Act), enacted into law
in 2006, is a comprehensive reform package that, among other
provisions, increases pension funding requirements for certain U.S.
defined benefit plans, provides guidelines for measuring pension
plan assets and pension obligations for funding purposes and
raises tax deduction limits for contributions to retirement-related
benefit plans. The additional funding requirements by the Act apply
to plan years beginning after December 31, 2007. The Act was
updated by the Worker, Retiree and Employer Recovery Act of
2008, which revised the funding requirements in the Act by clar-
ifying that pension plans may smooth the value of pension plans
over 24 months. At December 31, 2015, no mandatory contribution
was required for 2016.
In 2016, the company estimates contributions to its non-U.S.
defined benefit and multi-employer plans to be approximately
$500 million, the largest of which will be contributed to defined
benefit pension plans in the UK, Japan and Spain. This amount
represents the legally mandated minimum contributions. Financial
market performance in 2016 could increase the legally mandated
minimum contribution in certain countries which require monthly
or daily remeasurement of the funded status. The company could
also elect to contribute more than the legally mandated amount
based on market conditions or other factors.

Notes to Consolidated Financial Statements
International Business Machines Corporation and Subsidiary Companies
140
Defined Contribution Plans
The company contributed $1,117 million and $1,239 million in cash
to the defined contribution plans during the years ended Decem-
ber 31, 2015 and 2014, respectively. In 2016, the company estimates
cash contributions to the defined contribution plans to be approx-
imately $1.1 billion.
Nonpension Postretirement Benefit Plans
The company contributed $408 million and $144 million to the
nonpension postretirement benefit plans during the years ended
December 31, 2015 and 2014, respectively. The $408 million
contribution consisted of $328 million in cash and $80 million in
marketable securities in the form of U.S. Treasury securities. The
contribution of marketable securities is considered a non-cash
transaction in the Consolidated Statement of Cash Flows. These
contribution amounts exclude the Medicare-related subsidy dis-
cussed on page 141.
Expected Benefit Payments
Defined Benefit Pension Plan Expected Payments
The following table presents the total expected benefit payments
to defined benefit pension plan participants. These payments
have been estimated based on the same assumptions used to
measure the plans’ PBO at December 31, 2015 and include ben-
efits attributable to estimated future compensation increases,
where applicable.
($ in millions)
Qualifi ed U.S. Plan
Payments
Nonqualifi ed U.S. Plans Payments
Qualifi ed Non-U.S. Plans
Payments
Nonqualifi ed Non-U.S. Plans
Payments
Total Expected
Benefi t Payments
2016 $ 3,513 $118 $1,756 $ 311 $ 5,698
2017 3,501 118 1,751 306 5,675
2018 3,501 120 1,780 313 5,714
2019 3,496 121 1,814 326 5,757
2020 3,548 122 1,857 341 5,868
2021–2025 17,279 604 9,855 1,888 29,625
The 2016 expected benefit payments to defined benefit pen-
sion plan participants not covered by the respective plan assets
(underfunded plans) represent a component of compensation and
benefits, within current liabilities, in the Consolidated Statement of
Financial Position.
Nonpension Postretirement Benefit Plan Expected Payments
The following table reflects the total expected benefit payments to
nonpension postretirement benefit plan participants. These pay-
ments have been estimated based on the same assumptions used
to measure the plans’ APBO at December 31, 2015.
($ in millions)
U.S. Plan
Payments
Qualifi ed Non-U.S. Plans
Payments
Nonqualifi ed Non-U.S. Plans
Payments
Total Expected
Benefi t Payments
2016 $ 393 $ 5 $ 26 $ 424
2017 399 6 30 434
2018 401 6 33 439
2019 406 7 35 448
2020 401 7 39 447
2021–2025 1,797 49 240 2,087
The 2016 expected benefit payments to nonpension postretirement benefit plan participants not covered by the respective plan assets
represent a component of compensation and benefits, within current liabilities, in the Consolidated Statement of Financial Position.

Notes to Consolidated Financial Statements
International Business Machines Corporation and Subsidiary Companies
141
Medicare Prescription Drug ActIn connection with the Medicare Prescription Drug Improvement
and Modernization Act of 2003, the company qualified to receive
a federal subsidy through 2013. Due to benefit plan changes effec-
tive January 1, 2014, the company did not qualify for the subsidy
as of that date. The company received total subsidies of $1 million
and $23 million for prescription drug-related coverage during the
years ended December 31, 2015 and 2014, respectively, to true
up the final subsidy amounts due to IBM under the Act. These
subsidies were utilized to reduce the company contributions to
the U.S. nonpension postretirement benefit plan.
Other Plan InformationThe following table presents information for defined benefit pen-
sion plans with accumulated benefit obligations (ABO) in excess
of plan assets. For a more detailed presentation of the funded
status of the company’s defined benefit pension plans, see the
table on page 131.
($ in millions)
2015 2014
At December 31:Benefi t
ObligationPlan
AssetsBenefi t
ObligationPlan
Assets
Plans with PBO in excess of plan assets $29,784 $17,677 $34,976 $21,655
Plans with ABO in excess of plan assets 29,135 17,492 33,148 20,680
Plans with assets in excess of PBO 68,053 69,786 71,501 73,660
NOTE T.
SEGMENT INFORMATION
The company’s major operations consist of five business
segments: Global Tech nol ogy Services, Global Business Ser-
vices, Software, Systems Hardware and Global Financing. The
segments represent components of the company for which
separate financial information is available that is utilized on a
regular basis by the chief executive officer in determining how
to allocate resources and evaluate performance. The segments
are determined based on several factors, including client base,
homogeneity of products, technology, delivery channels and sim-
ilar economic characteristics.
Information about each segment’s business and the products
and services that generate each segment’s revenue is located in the
“Description of Business” section on pages 25 to 27, and in “Seg-
ment Details,” on pages 29 to 34 in the Management Discussion.
Segment revenue and pre-tax income include transactions
between the segments that are intended to reflect an arm’s-length,
market-based transfer price. Systems and software that are used
by Global Technology Services in outsourcing engagements are
primarily sourced internally from Systems Hardware and Software.
For providing IT services that are used internally, Global Technol-
ogy Services and Global Business Services recover cost, as well
as a reasonable fee, that is intended to reflect the arm’s-length
value of providing the services. The Global Services segments
enter into arm’s-length loans at prices equivalent to market rates
with Global Financing to facilitate the acquisition of equipment
used in services engagements. All internal transaction prices are
reviewed annually, and reset if appropriate.
The company utilizes globally integrated support organizations
to realize economies of scale and efficient use of resources. As a
result, a considerable amount of expense is shared by all of the
segments. This shared expense includes sales coverage, certain
marketing functions and support functions such as Accounting,
Treasury, Procurement, Legal, Human Re sources and Billing and
Collections. Where practical, shared expenses are allocated based
on measurable drivers of expense, e.g., headcount. When a clear
and measurable driver cannot be identified, shared expenses are
allocated on a financial basis that is consistent with the compa-
ny’s management system, e.g., advertising expense is allocated
based on the gross profits of the segments. A portion of the shared
expenses, which are recorded in net income, are not allocated to
the segments. These expenses are associated with the elimination
of internal transactions and other miscellaneous items.

Notes to Consolidated Financial Statements
International Business Machines Corporation and Subsidiary Companies
142
The following tables reflect the results of continuing operations
of the company’s segments consistent with the management and
measurement system utilized within the company. Performance
measurement is based on pre-tax income from continuing opera-
tions. These results are used, in part, by senior management, both
in evaluating the performance of, and in allocating resources to,
each of the segments.
In January 2015, the company’s business process outsourc-
ing business, Global Process Services, which was previously
managed within Global Technology Services, was integrated
into Global Business Services, creating an end-to-end business
transformation capability for clients and to better leverage the
company’s industry knowledge. The following tables reflect this
reclassification for the prior-year periods.
Management System Segment View
($ in millions)
Global Services Segments
For the year ended December 31:
Global Technology
Services
Global BusinessServices Software
Systems Hardware
Global Financing
Total Segments
2015
External revenue $32,017 $17,166 $22,932 $ 7,581 $1,840 $ 81,535
Internal revenue 823 499 3,267 451 2,637 7,676
Total revenue $32,840 $17,664 $26,199 $ 8,032 $4,477 $ 89,211
Pre-tax income from continuing operations $ 5,002 $ 2,634 $ 9,066 $ 604 $2,364 $ 19,670
Revenue year-to-year change (9.7)% (11.9)% (9.4)% (24.5)% (1.0)% (11.3)%
Pre-tax income year-to-year change (15.7)% (22.7)% (15.3)% NM 8.0% (11.6)%
Pre-tax income margin 15.2% 14.9% 34.6% 7.5% 52.8% 22.0%
2014*
External revenue $35,442 $19,512 $25,434 $ 9,996 $2,034 $ 92,418
Internal revenue 934 543 3,496 647 2,488 8,108
Total revenue $36,376 $20,055 $28,931 $10,643 $4,522 $100,527
Pre-tax income from continuing operations $ 5,931 $ 3,408 $10,699 $ 34 $2,189 $ 22,262
Revenue year-to-year change (1.2)% (8.5)% (0.7)% (21.6)% 5.1% (4.9)%
Pre-tax income year-to-year change (10.8)% (3.9)% (3.7)% (84.1)% 0.8% (6.0)%
Pre-tax income margin 16.3% 17.0% 37.0% 0.3% 48.4% 22.1%
2013*
External revenue $35,737 $21,210 $25,932 $12,988 $2,022 $ 97,889
Internal revenue 1,063 714 3,191 593 2,282 7,843
Total revenue $36,800 $21,924 $29,123 $13,581 $4,304 $105,732
Pre-tax income from continuing operations $ 6,649 $ 3,548 $11,106 $ 213 $2,171 $ 23,687
Revenue year-to-year change (4.7)% (0.8)% 1.4% (18.7)% 5.7% (4.0)%
Pre-tax income year-to-year change (0.3)% 8.4% 2.7% (88.6)% 6.8% (3.9)%
Pre-tax income margin 18.1% 16.2% 38.1% 1.6% 50.4% 22.4%
* Reclassified to conform with 2015 presentation.
NM—Not meaningful
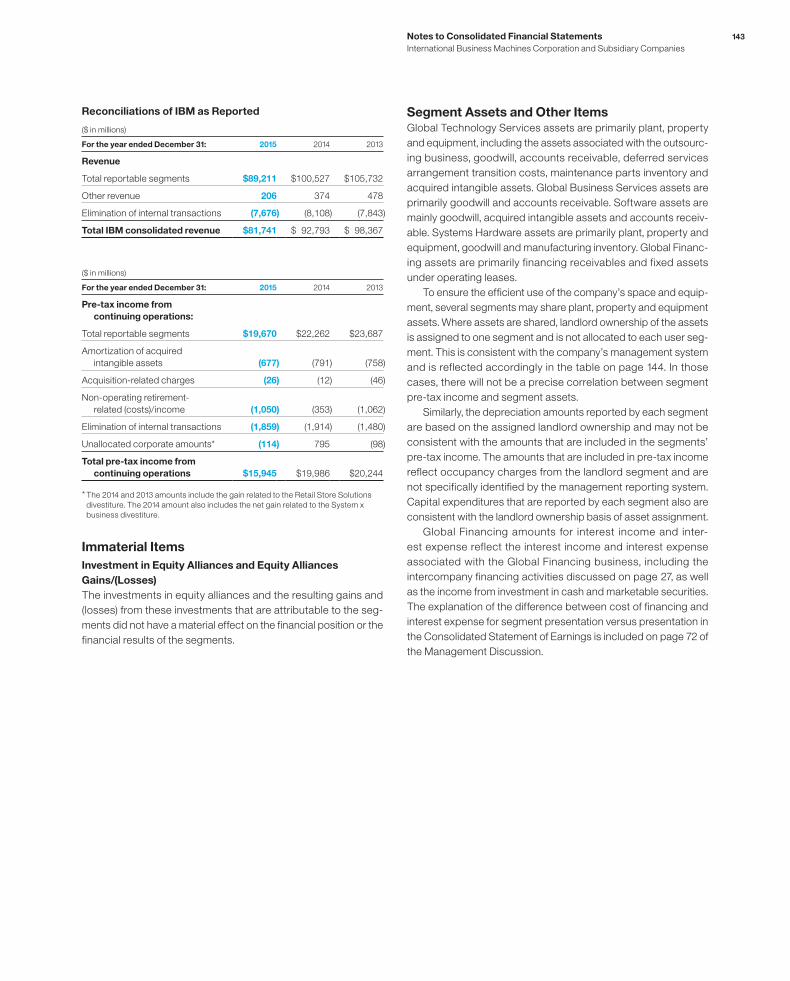
Notes to Consolidated Financial Statements
International Business Machines Corporation and Subsidiary Companies
143
Reconciliations of IBM as Reported
($ in millions)
For the year ended December 31: 2015 2014 2013
Revenue
Total reportable segments $89,211 $100,527 $105,732
Other revenue 206 374 478
Elimination of internal transactions (7,676) (8,108) (7,843)
Total IBM consolidated revenue $81,741 $ 92,793 $ 98,367
($ in millions)
For the year ended December 31: 2015 2014 2013
Pre-tax income from
continuing operations:
Total reportable segments $19,670 $22,262 $23,687
Amortization of acquired
intangible assets (677) (791) (758)
Acquisition-related charges (26) (12) (46)
Non-operating retirement-
related (costs)/income (1,050) (353) (1,062)
Elimination of internal transactions (1,859) (1,914) (1,480)
Unallocated corporate amounts* (114) 795 (98)
Total pre-tax income from
continuing operations $15,945 $19,986 $20,244
* The 2014 and 2013 amounts include the gain related to the Retail Store Solutions
divestiture. The 2014 amount also includes the net gain related to the System x
business divestiture.
Immaterial Items
Investment in Equity Alliances and Equity Alliances
Gains/(Losses)
The investments in equity alliances and the resulting gains and
(losses) from these investments that are attributable to the seg-
ments did not have a material effect on the financial position or the
financial results of the segments.
Segment Assets and Other ItemsGlobal Technology Services assets are primarily plant, property
and equipment, including the assets associated with the outsourc-
ing business, goodwill, accounts receivable, deferred services
arrangement transition costs, maintenance parts inventory and
acquired intangible assets. Global Business Services assets are
primarily goodwill and accounts receivable. Software assets are
mainly goodwill, acquired intangible assets and accounts receiv-
able. Systems Hardware assets are primarily plant, property and
equipment, goodwill and manufacturing inventory. Global Financ-
ing assets are primarily financing receivables and fixed assets
under operating leases.
To ensure the efficient use of the company’s space and equip-
ment, several segments may share plant, property and equipment
assets. Where assets are shared, landlord ownership of the assets
is assigned to one segment and is not allocated to each user seg-
ment. This is consistent with the company’s management system
and is reflected accordingly in the table on page 144. In those
cases, there will not be a precise correlation between segment
pre-tax income and segment assets.
Similarly, the depreciation amounts reported by each segment
are based on the assigned landlord ownership and may not be
consistent with the amounts that are included in the segments’
pre-tax income. The amounts that are included in pre-tax income
reflect occupancy charges from the landlord segment and are
not specifically identified by the management reporting system.
Capital expenditures that are reported by each segment also are
consistent with the landlord ownership basis of asset assignment.
Global Financing amounts for interest income and inter-
est expense reflect the interest income and interest expense
associated with the Global Financing business, including the
intercompany financing activities discussed on page 27, as well
as the income from investment in cash and marketable securities.
The explanation of the difference between cost of financing and
interest expense for segment presentation versus presentation in
the Consolidated Statement of Earnings is included on page 72 of
the Management Discussion.
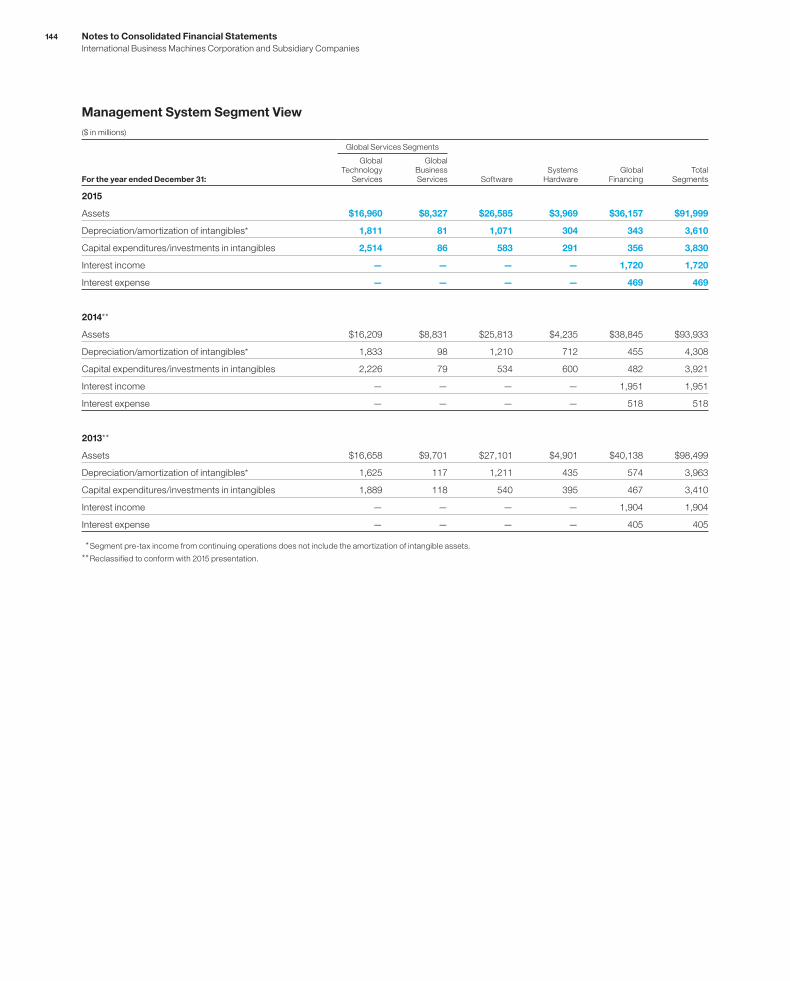
Notes to Consolidated Financial Statements
International Business Machines Corporation and Subsidiary Companies
144
Management System Segment View
($ in millions)
Global Services Segments
For the year ended December 31:
Global Technology
Services
Global BusinessServices Software
Systems Hardware
Global Financing
Total Segments
2015
Assets $16,960 $8,327 $26,585 $3,969 $36,157 $91,999
Depreciation/amortization of intangibles* 1,811 81 1,071 304 343 3,610
Capital expenditures/investments in intangibles 2,514 86 583 291 356 3,830
Interest income — — — — 1,720 1,720
Interest expense — — — — 469 469
2014**
Assets $16,209 $8,831 $25,813 $4,235 $38,845 $93,933
Depreciation/amortization of intangibles* 1,833 98 1,210 712 455 4,308
Capital expenditures/investments in intangibles 2,226 79 534 600 482 3,921
Interest income — — — — 1,951 1,951
Interest expense — — — — 518 518
2013**
Assets $16,658 $9,701 $27,101 $4,901 $40,138 $98,499
Depreciation/amortization of intangibles* 1,625 117 1,211 435 574 3,963
Capital expenditures/investments in intangibles 1,889 118 540 395 467 3,410
Interest income — — — — 1,904 1,904
Interest expense — — — — 405 405
* Segment pre-tax income from continuing operations does not include the amortization of intangible assets.
** Reclassified to conform with 2015 presentation.

Notes to Consolidated Financial Statements
International Business Machines Corporation and Subsidiary Companies
145
Reconciliations of IBM as Reported
($ in millions)
At December 31: 2015 2014 2013
Assets
Total reportable segments $ 91,999 $ 93,933 $ 98,499
Elimination of internal transactions (4,709) (5,193) (4,740)
Unallocated amounts
Cash and marketable securities 6,634 7,182 9,697
Notes and accounts receivable 2,333 4,253 2,907
Deferred tax assets 4,693 6,465* 4,030*
Plant, other property
and equipment 2,650 2,169 4,827
Pension assets 1,734 2,160 5,551
Other 5,161 6,303** 4,869**
Total IBM consolidated assets $110,495 $117,271 * ** $125,641 * **
* Reclassified to reflect adoption of the FASB guidance on deferred taxes in
consolidated financial statements. Refer to note B, “Accounting Changes,” for
additional information.
** Reclassified to reflect adoption of the FASB guidance on debt issuance costs
in consolidated financial statements. Refer to note B, “Accounting Changes,” for
additional information.
Major ClientsNo single client represented 10 percent or more of the company’s
total revenue in 2015, 2014 or 2013.
Geographic Information The following provides information for those countries that are
10 percent or more of the specific category.
Revenue*
($ in millions)
For the year ended December 31: 2015 2014 2013
United States $30,514 $32,021 $33,427
Other countries 51,227 60,772 64,941
Total IBM consolidated revenue $81,741 $92,793 $98,367
* Revenues are attributed to countries based on the location of the client.
Plant and Other Property—Net
($ in millions)
At December 31: 2015 2014 2013
United States $ 4,644 $ 4,388 $ 6,723
Other countries 5,532 5,690 6,257
Total $10,176 $10,078 $12,979
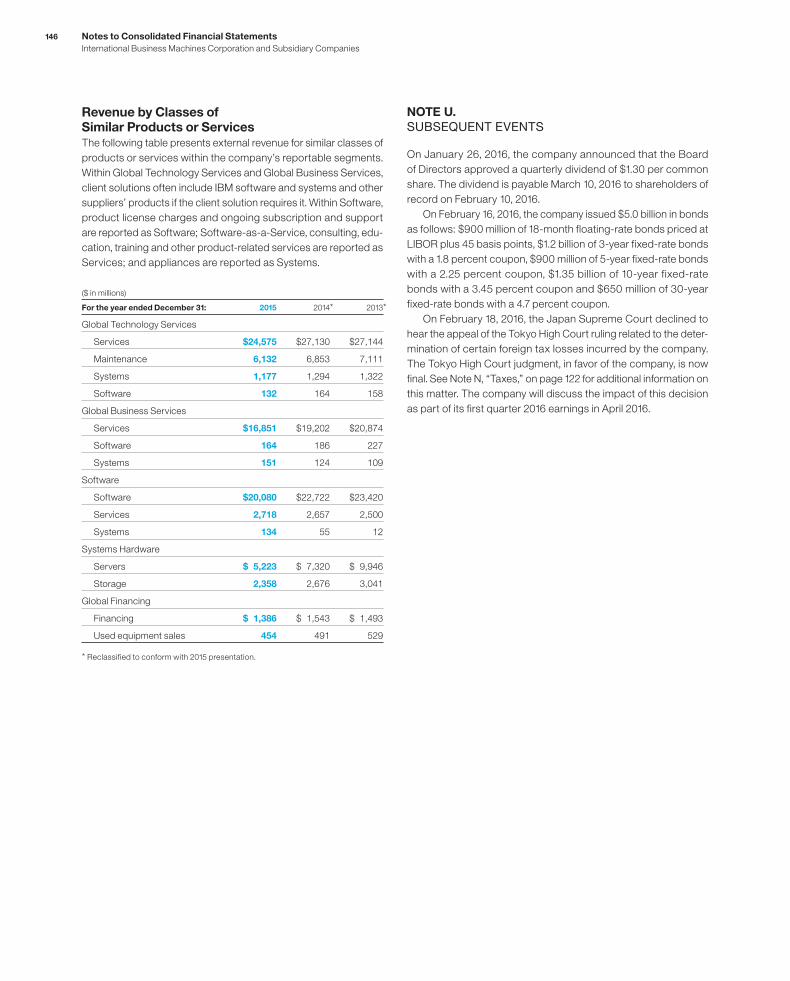
Notes to Consolidated Financial Statements
International Business Machines Corporation and Subsidiary Companies
146
Revenue by Classes of Similar Products or ServicesThe following table presents external revenue for similar classes of
products or services within the company’s reportable segments.
Within Global Technology Services and Global Business Services,
client solutions often include IBM software and systems and other
suppliers’ products if the client solution requires it. Within Software,
product license charges and ongoing subscription and support
are reported as Software; Software-as-a-Service, consulting, edu-
cation, training and other product-related services are reported as
Services; and appliances are reported as Systems.
($ in millions)
For the year ended December 31: 2015 2014* 2013*
Global Technology Services
Services $24,575 $27,130 $27,144
Maintenance 6,132 6,853 7,111
Systems 1,177 1,294 1,322
Software 132 164 158
Global Business Services
Services $16,851 $19,202 $20,874
Software 164 186 227
Systems 151 124 109
Software
Software $20,080 $22,722 $23,420
Services 2,718 2,657 2,500
Systems 134 55 12
Systems Hardware
Servers $ 5,223 $ 7,320 $ 9,946
Storage 2,358 2,676 3,041
Global Financing
Financing $ 1,386 $ 1,543 $ 1,493
Used equipment sales 454 491 529
* Reclassified to conform with 2015 presentation.
NOTE U.
SUBSEQUENT EVENTS
On January 26, 2016, the company announced that the Board
of Directors approved a quarterly dividend of $1.30 per common
share. The dividend is payable March 10, 2016 to shareholders of
record on February 10, 2016.
On February 16, 2016, the company issued $5.0 billion in bonds
as follows: $900 million of 18-month floating-rate bonds priced at
LIBOR plus 45 basis points, $1.2 billion of 3-year fixed-rate bonds
with a 1.8 percent coupon, $900 million of 5-year fixed-rate bonds
with a 2.25 percent coupon, $1.35 billion of 10-year fixed-rate
bonds with a 3.45 percent coupon and $650 million of 30-year
fixed-rate bonds with a 4.7 percent coupon.
On February 18, 2016, the Japan Supreme Court declined to
hear the appeal of the Tokyo High Court ruling related to the deter-
mination of certain foreign tax losses incurred by the company.
The Tokyo High Court judgment, in favor of the company, is now
final. See Note N, “Taxes,” on page 122 for additional information on
this matter. The company will discuss the impact of this decision
as part of its first quarter 2016 earnings in April 2016.

147Five-Year Comparison of Selected Financial Data
International Business Machines Corporation and Subsidiary Companies
($ in millions except per share amounts)
For the year ended December 31: 2015 2014 2013 2012 2011
Revenue $ 81,741 $ 92,793 $ 98,367 $102,874 $105,056
Income from continuing operations $ 13,364 $ 15,751 $ 16,881 $ 16,999 $ 16,108
Loss from discontinued operations, net of tax $ (174) $ (3,729) $ (398) $ (395) $ (253)
Net income $ 13,190 $ 12,022 $ 16,483 $ 16,604 $ 15,855
Operating (non-GAAP) earnings* $ 14,659 $ 16,702 $ 18,356 $ 18,022 $ 16,571
Earnings/(loss) per share of common stock:
Assuming dilution:
Continuing operations $ 13.60 $ 15.59 $ 15.30 $ 14.71 $ 13.27
Discontinued operations $ (0.18) $ (3.69) $ (0.36) $ (0.34) $ (0.21)
Total $ 13.42 $ 11.90 $ 14.94 $ 14.37 $ 13.06
Basic:
Continuing operations $ 13.66 $ 15.68 $ 15.42 $ 14.88 $ 13.46
Discontinued operations $ (0.18) $ (3.71) $ (0.36) $ (0.35) $ (0.21)
Total $ 13.48 $ 11.97 $ 15.06 $ 14.53 $ 13.25
Diluted operating (non-GAAP)* $ 14.92 $ 16.53 $ 16.64 $ 15.60 $ 13.65
Cash dividends paid on common stock $ 4,897 $ 4,265 $ 4,058 $ 3,773 $ 3,473
Per share of common stock 5.00 4.25 3.70 3.30 2.90
Investment in property, plant and equipment $ 3,579 $ 3,740 $ 3,623 $ 4,082 $ 4,108
Return on IBM stockholders’ equity 101.1% 72.5% 83.8% 81.6% 71.2%
At December 31: 2015 2014 2013 2012 2011
Total assets $110,495 $117,271 ** + $125,641 ** + $118,965 ** + $116,128 ** +
Net investment in property, plant and equipment $ 10,727 $ 10,771 $ 13,821 $ 13,996 $ 13,883
Working capital $ 8,235 $ 7,797** $ 9,610** $ 4,413** $ 7,347**
Total debt $ 39,890 $ 40,722+ $ 39,637+ $ 33,209+ $ 31,265+
Total equity $ 14,424 $ 12,014 $ 22,929 $ 18,984 $ 20,236
* Refer to the “GAAP Reconciliation,” on pages 63 and 151 of the company’s 2014 Annual Report for the reconciliation of non-GAAP financial information for 2012 and 2011,
respectively. Also see “GAAP Reconciliation,” on pages 41 and 59 for the reconciliation of non-GAAP financial information for 2015, 2014 and 2013.
** Reclassified to reflect adoption of the FASB guidance on deferred taxes in consolidated financial statements. Refer to note B, “Accounting Changes,” for additional information.
+ Reclassified to reflect adoption of the FASB guidance on debt issuance costs in consolidated financial statements. Refer to note B, “Accounting Changes,” for additional information.

148
($ in millions except per share amounts and stock prices)
2015 First Quarter Second Quarter Third Quarter Fourth Quarter Full Year
Revenue $19,590 $20,813 $19,280 $22,059 $81,741
Gross profi t $ 9,452 $10,390 $ 9,436 $11,407 $40,684
Income from continuing operations $ 2,415 $ 3,526 $ 2,962 $ 4,460 $13,364
Income/(loss) from discontinued operations, net of tax $ (88) $ (77) $ (12) $ 3 $ (174)
Net income $ 2,328 $ 3,449 $ 2,950 $ 4,463 $13,190
Operating (non-GAAP) earnings*** $ 2,890 $ 3,790 $ 3,272 $ 4,707 $14,659
Earnings per share of common stock*
Assuming dilution:
Continuing operations $ 2.44 $ 3.58 $ 3.02 $ 4.59 $ 13.60
Discontinued operations $ (0.09) $ (0.08) $ (0.01) $ 0.00 $ (0.18)
Total $ 2.35 $ 3.50 $ 3.01 $ 4.59 $ 13.42
Basic:
Continuing operations $ 2.45 $ 3.59 $ 3.04 $ 4.60 $ 13.66
Discontinued operations $ (0.09) $ (0.08) $ (0.01) $ 0.00 $ (0.18)
Total $ 2.36 $ 3.51 $ 3.03 $ 4.60 $ 13.48
Diluted operating (non-GAAP)*** $ 2.91 $ 3.84 $ 3.34 $ 4.84 $ 14.92
Dividends per share of common stock $ 1.10 $ 1.30 $ 1.30 $ 1.30 $ 5.00
Stock prices++
High $164.83 $174.40 $173.22 $152.39
Low $151.55 $159.18 $140.96 $131.75
($ in millions except per share amounts and stock prices)
2014 First Quarter Second Quarter Third Quarter Fourth Quarter Full Year
Revenue $22,236 $24,047 $22,397 $24,113 $92,793
Gross profi t $10,627 $12,044 $10,874 $12,862 $46,407
Income from continuing operations $ 2,530 $ 4,251 $ 3,455 $ 5,515 $15,751
Loss from discontinued operations, net of tax $ (146) $ (115) $ (3,437) $ (31) $ (3,729)
Net income $ 2,384 $ 4,137 $ 18 $ 5,484 $12,022
Operating (non-GAAP) earnings*** $ 2,790 $ 4,456 $ 3,671 $ 5,785 $16,702
Earnings per share of common stock*
Assuming dilution:
Continuing operations $ 2.43 $ 4.23 $ 3.46 $ 5.54 $ 15.59
Discontinued operations $ (0.14) $ (0.11) $ (3.44) $ (0.03) $ (3.69)
Total $ 2.29 $ 4.12 $ 0.02 $ 5.51 $ 11.90
Basic:
Continuing operations $ 2.44 $ 4.25 $ 3.48 $ 5.57 $ 15.68
Discontinued operations $ (0.14) $ (0.11) $ (3.46) $ (0.03) $ (3.71)
Total $ 2.30 $ 4.14 $ 0.02 $ 5.54 $ 11.97
Diluted operating (non-GAAP)*** $ 2.68 $ 4.43 $ 3.68 $ 5.81 $ 16.53
Dividends per share of common stock $ 0.95 $ 1.10 $ 1.10 $ 1.10 $ 4.25
Stock prices++
High $195.63 $199.21 $196.40 $190.89
Low $172.19 $179.27 $181.70 $150.50
* Earnings Per Share (EPS) in each quarter is computed using the weighted-average number of shares outstanding during that quarter while EPS for the full year is computed
using the weighted-average number of shares outstanding during the year. Thus, the sum of the four quarters’ EPS does not equal the full-year EPS.
++ The stock prices reflect the high and low prices for IBM’s common stock on the New York Stock Exchange composite tape for the periods presented.
*** Refer to page 70 of the company’s first-quarter 2015 Form 10-Q filed on April 28, 2015, page 85 of the company’s second-quarter 2015 Form 10-Q filed on July 28, 2015,
page 87 of the company’s third-quarter 2015 Form 10-Q filed on October 27, 2015, and page 48 under the heading “GAAP Reconciliation,” for the reconciliation of non-GAAP
financial information for the quarterly periods of 2015 and 2014. Also see “GAAP Reconciliation,” on pages 41 and 42 for the reconciliation of non-GAAP financial information
for full-year 2015 and 2014.
Selected Quarterly Data
International Business Machines Corporation and Subsidiary Companies
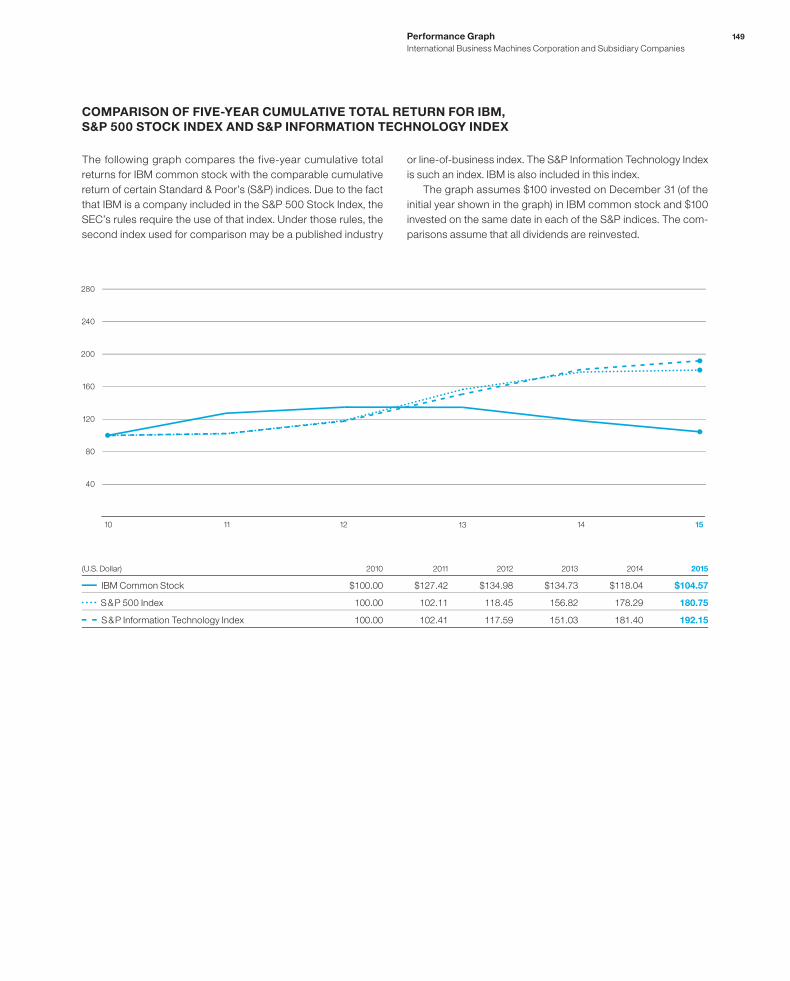
149Performance Graph
International Business Machines Corporation and Subsidiary Companies
COMPARISON OF FIVE-YEAR CUMULATIVE TOTAL RETURN FOR IBM,
S&P 500 STOCK INDEX AND S&P INFORMATION TECHNOLOGY INDEX
The following graph compares the five-year cumulative total
returns for IBM common stock with the comparable cumulative
return of certain Standard & Poor’s (S&P) indices. Due to the fact
that IBM is a company included in the S&P 500 Stock Index, the
SEC’s rules require the use of that index. Under those rules, the
second index used for comparison may be a published industry
(U.S. Dollar) 2010 2011 2012 2013 2014 2015
IBM Common Stock $100.00 $127.42 $134.98 $134.73 $118.04 $104.57
S & P 500 Index 100.00 102.11 118.45 156.82 178.29 180.75
S & P Information Technology Index 100.00 102.41 117.59 151.03 181.40 192.15
240
280
40
80
200
160
120
10 11 12 13 14 15
or line-of-business index. The S&P Information Technology Index
is such an index. IBM is also included in this index.
The graph assumes $100 invested on December 31 (of the
initial year shown in the graph) in IBM common stock and $100
invested on the same date in each of the S&P indices. The com-
parisons assume that all dividends are reinvested.

150 Board of Directors and Senior Leadership
International Business Machines Corporation and Subsidiary Companies
SENIOR LEADERSHIP
Colleen F. Arnold***
Senior Vice President
IBM Sales and Distribution
Simon J. Beaumont
Vice President
Tax and Treasurer
Michelle H. Browdy
Senior Vice President
Legal and Regulatory Affairs,
and General Counsel
Erich Clementi
Senior Vice President
IBM Sales and Distribution
Bruno V. Di Leo Allen
Senior Vice President
IBM Sales and Distribution
Diane J. Gherson
Senior Vice President
Human Resources
Jon C. Iwata
Senior Vice President
Marketing and Communications
Martin Jetter
Senior Vice President
IBM Global Technology Services
James J. Kavanaugh
Senior Vice President
Transformation and Operations
John E. Kelly III
Senior Vice President
IBM Cognitive Solutions and
IBM Research
Kenneth M. Keverian
Senior Vice President
Corporate Strategy
Arvind Krishna
Senior Vice President and Director
IBM Research
Robert J. LeBlanc
Senior Vice President
IBM Cloud
Christina M. Montgomery
Vice President
Assistant General Counsel and Secretary
Robert J. Picciano
Senior Vice President
IBM Data and Analytics Platforms
Michael D. Rhodin
Senior Vice President
IBM Watson Business Development
Virginia M. Rometty
Chairman, President and
Chief Executive Officer
Thomas W. Rosamilia
Senior Vice President
IBM Systems
Martin J. Schroeter
Senior Vice President and
Chief Financial Officer
Stanley J. Sutula III
Vice President and Controller
Bridget A. van Kralingen
Senior Vice President
IBM Global Business Services
BOARD OF DIRECTORS
Alain J.P. Belda*
Managing Director
Warburg Pincus LLC
William R. Brody*
Retired President
Salk Institute for Biological Studies
Kenneth I. Chenault
Chairman and Chief Executive Officer
American Express Company
Michael L. Eskew
Retired Chairman and
Chief Executive Officer
United Parcel Service, Inc.
David N. Farr
Chairman and Chief Executive Officer
Emerson Electric Co.
Mark Fields**
President and Chief Executive Officer
Ford Motor Company
Alex Gorsky
Chairman and Chief Executive Officer
Johnson & Johnson
Shirley Ann Jackson
President
Rensselaer Polytechnic Institute
Andrew N. Liveris
Chairman and Chief Executive Officer
The Dow Chemical Company
W. James McNerney, Jr.
Chairman and Retired
Chief Executive Officer
The Boeing Company
Hutham S. Olayan
Principal, Director and Senior Executive
The Olayan Group
James W. Owens
Retired Chairman and
Chief Executive Officer
Caterpillar Inc.
Virginia M. Rometty
Chairman, President and
Chief Executive Officer
IBM
Joan E. Spero
Adjunct Senior Research Scholar
Columbia University School of
International and Public Affairs
Sidney Taurel
Chairman
Pearson plc
Peter R. Voser
Chairman
ABB Ltd.
* Term on the Board ends on April 26, 2016
** Effective on the Board on March 1, 2016
*** Retiring from the company on March 31, 2016

151Stockholder Information
International Business Machines Corporation and Subsidiary Companies
IBM Stockholder ServicesStockholders with questions about their accounts should contact:
Computershare Trust Company, N.A., P.O. Box 43078, Providence,
Rhode Island 02940-3078 (888) IBM-6700
Investors residing outside the United States, Canada and Puerto Rico
should call (781) 575-2727.
Stockholders can also reach Computershare Trust Company, N.A.
via e-mail at: [email protected]
Hearing-impaired stockholders with access to a telecommunications
device (TDD) can communicate directly with Computershare Trust
Company, N.A., by calling (800) 490-1493. Stockholders residing outside
the United States, Canada and Puerto Rico should call (781) 575-2694.
IBM on the InternetTopics featured in this Annual Report can be found on the IBM home
page on the Internet (www.ibm.com). Financial results, news on IBM
products, services and other activities can also be found at that address.
IBM files reports with the Securities and Exchange Commission (SEC),
including the annual report on Form 10-K, quarterly reports on Form 10-Q,
current reports on Form 8-K and any other filings required by the SEC.
IBM’s website (www.ibm.com) contains a significant amount of information
about IBM, including the company’s annual report on Form 10-K, quarterly
reports on Form 10-Q, current reports on Form 8-K, and all amendments
to those reports as soon as reasonably practicable after such material
is electronically filed with or furnished to the SEC (www.ibm.com/investor).
These materials are available free of charge on or through our website.
The public may read and copy any materials the company files with the
SEC at the SEC’s Public Reference Room at 100 F Street, NE, Washington,
DC 20549. The public may obtain information on the operation of the
Public Reference Room by calling the SEC at (800) SEC-0330. The SEC
maintains an Internet site (www.sec.gov) that contains reports, proxy and
information statements, and other information regarding issuers that file
electronically with the SEC.
IBM Investor Services ProgramThe Investor Services Program brochure outlines a number of services
provided for IBM stockholders and potential IBM investors, including
the reinvestment of dividends, direct purchase and the deposit of IBM
stock certificates for safe keeping. Call (888) IBM-6700 for a copy of
the brochure. Investors residing outside the United States, Canada and
Puerto Rico should call (781) 575-2727.
Investors with other requests may write to: IBM Stockholder Relations,
New Orchard Road, M/D 325, Armonk, New York 10504
IBM StockIBM common stock is listed on the New York Stock Exchange, the
Chicago Stock Exchange, and outside the United States.
Stockholder CommunicationsStockholders can get quarterly financial results, a summary of the
Annual Meeting remarks, and voting results from the meeting by calling
(914) 499-7777, by sending an e-mail to [email protected], or by
writing to International Business Machines Corporation, New Orchard
Road, M/D 325, Armonk, New York 10504.
Annual MeetingThe IBM Annual Meeting of Stockholders will be held on Tuesday, April 26,
2016, at 10 a.m. in the Savannah International Trade & Convention Center,
Savannah, Georgia.
Literature for IBM StockholdersThe literature mentioned below on IBM is available without charge from:
Computershare Trust Company, N.A., P.O. Box 43078, Providence,
Rhode Island 02940-3078 (888) IBM-6700
Investors residing outside the United States, Canada and Puerto Rico
should call (781) 575-2727.
The company’s annual report on Form 10-K and the quarterly reports
on Form 10-Q provide additional information on IBM’s business. The 10-K
report is released by the end of February; 10-Q reports are released by
early May, August and November.
An audio recording of the 2015 Annual Report will be available for
sight-impaired stockholders in June 2016.
The IBM Corporate Responsibility Report highlights IBM’s values
and its integrated approach to corporate responsibility, including its
innovative strategies to transforming communities through global
citizenship. The full Corporate Responsibility Report is available online
at www.ibm.com/responsibility. It is also available in printed form by
downloading the report at www.ibm.com/responsibility.
General InformationStockholders of record can receive online account information and
answers to frequently asked questions regarding stockholder accounts
on the Internet (www.ibm.com/investor). Stockholders of record can
also consent to receive future IBM Annual Reports and Proxy Statements
online through this site.
For answers to general questions about IBM from within the continental
United States, call (800) IBM-4YOU. From outside the United States,
Canada and Puerto Rico, call (914) 499-1900.

International Business Machines Corporation
New Orchard Road, Armonk, New York 10504
(914) 499-1900
AlchemyAPI, Aspera, Blekko, Blue Box, Bluemix, Clearleap, Cloudant,
Daeja, Explorys, Fiberlink, FlashSystem, Gravitant, IBM, IBM Watson,
ILOG, Kenexa, OpenPOWER, Phytel, POWER, POWER8, Power Systems,
Rational, Silverpop, Smarter Commerce, SoftLayer, Star Analytics,
StoredIQ, StrongLoop, System z, Tivoli, Trusteer, UrbanCode, Ustream,
Watson, WebSphere, Xtify, z13 and z Systems are trademarks or regis-
tered trademarks of International Business Machines Corporation or its
wholly owned subsidiaries. Apple is a registered trademark of Apple, Inc.
in the United States, other countries, or both. DATAPALOOZA is a trade-
mark of AcademyHealth and is used under license. GLOBALFOUNDRIES
is a registered trademark of GLOBALFOUNDRIES Inc. Jeopardy! is a
registered trademark of Jeopardy Productions, Inc. Lenovo is a trademark
of Lenovo Group Limited in the United States, other countries, or both.
Linux is a registered trademark of Linus Torvalds in the United States,
other countries, or both. SAP is a registered trademark of SAP SE in
Germany and other countries. UNIX is a registered trademark of the Open
Group in the United States and other countries. Other company, product
and service names may be trademarks or service marks of others.
The IBM Annual Report is printed on recycled paper and is recyclable.
Printed in the U.S.A.
COL03002-USEN-06
Design: VSA
Printing: RR Donnelley


2015 IBM Annual Report
20
15 IB
M A
nn
ua
l Re
po
rt