Embed Size (px)
Citation preview
2015 Global Women Entrepreneur Leaders
Scorecard
Data and Methodology
Sponsored by
Produced by ACG Inc

2015 Global Women Entrepreneur Leaders Scorecard – Data and Methodology 1
Acknowledgements
The Global Women Entrepreneur Leaders Scorecard was developed by ACG Inc. led by Dr. Ruta Aidis and in
collaboration with Julie Weeks, President and CEO, Womenable and Katrin Anacker, Associate Professor,
School of Policy, Government and International Affairs, George Mason University. A special thank you to Sam
Moyer for his insightful research assistance. We are indebted to our expert panelists for their input and
feedback during various stages of the scorecard’s development.
Expert Panel Members Marguerite Berger - Vice President, Impact Evaluation and Monitoring, Vital Voices Yasmin Bin-Humam - Consultant, Women, Business and the Law, World Bank Lily Chu - Head of Strategy, Finance and Private Sector Development, World Bank Matthew Gamser - Head, SME Finance Forum/Women's Finance hub, IFC Heather Kipsnis - Entrepreneur Lead, Gender Secretariat, IFC Leora Klapper - Lead Economist, Finance and Private Sector Research Team, World Bank Henriette Kolb - Head, Gender Secretariat, IFC & Advisor Cherie Blair Foundation Minerva Kotei - Financial Specialist, Women’s Finance Hub, IFC Virginia Littlejohn - Co-founder, President and CEO, Quantum Leaps Luis Marquez - Consultant, Gender and Development Issues, Inter-American Development Bank Connie L. McNeely - Professor of Public Policy and Co-Director, Center for Science and Technology Policy, George Mason University Amy Millman - Co-founder and President, Springboard Enterprises Shelly Porges - Global Entrepreneurship Advocate, previously, Senior Advisor, Global Women’s Business Initiative and Global Entrepreneurship Program, US Department of State Alicia Robb - Senior Fellow, Ewing Marion Kauffman Foundation and Principal Investigator, Kauffman Firm Survey Anastasia de Santos - Economist, Microenterprise and Private Enterprise Promotion Office, USAID Greta Schettler - Senior Economic Policy Advisor, Secretary's Office of Global Women's Issues, U.S. Department of State Anne Simmons-Benton - Global Practice Lead, Trade and Regulatory Reform/Gender, DAI Joni Simpson, Head - ILO's women's entrepreneurship efforts, ILO Jackie Spedding - President, Spedding Consulting and Senior Advisor, Global Women’s Business Initiative, U.S. Department of State
2015 Global Women Entrepreneur Leaders Scorecard – Data and Methodology 2
Friederike Welter - Professor, Female Entrepreneurship Expert, Siegen University & President, IfM Bonn (SME Research Institute) Elizabeth A. Vazquez - CEO and Co-Founder, WEConnect International Maria Theresa Villaneuva - Lead Specialist, Gender and Women Economic Empowerment, Inter-American Development Bank
ACG Inc provides data-driven tailor made research and analysis for companies, government agencies and
international organizations around the globe. We compile and create measurement tools, monitor progress and
evaluate existing programs in their ability to champion diversity and create a level playing field critical for
success in the new innovation driven global economy. For more information, visit www.acgimpact.com
Dell Inc listens to customers and delivers innovative technology and services that give them the power to do
more. As the visionary outcome of a true entrepreneur, Dell is committed to help power the success of
entrepreneurs by developing technology solutions that help their businesses increase productivity and grow.
Through the Dell Women’s Entrepreneur Network, Dell supports and nurtures a community of female
entrepreneurs by providing access to knowledge, networks, and capital. Learn more
at www.dell.com/gwelscorecard
The findings, interpretations and conclusions expressed in this volume are entirely those of the authors. They do
not necessarily represent the views of Dell Inc.
The reference citation for the data provides in this report is as follows:
Aidis, Ruta, Julie Weeks and Katrin Anacker. 2015. ‘The Global Women Entrepreneur Leaders Scorecard 2015:
Data and Methodology, Report, ACG Inc.
To download the additional information regarding this report including detailed methodology, indicators and
data tables, visit www.dell.com/women
For questions or comments about this report, please contact: Ruta Aidis [email protected]
Copyright @ 2015 by ACG Inc. All rights reserved.
2015 Global Women Entrepreneur Leaders Scorecard – Data and Methodology 3
The Global Women Entrepreneur Leaders Scorecard:
Data and Methodology
I. Introduction
The 2015 Global Women Entrepreneur Leaders Scorecard, sponsored by Dell Inc., is a new
data-driven diagnostic tool that identifies the impediments to high-impact female entrepreneurship and
introduces actionable steps that can be taken to improve the conditions for high-impact female entrepreneurship
development at the country level. The Global Women Entrepreneur Leaders Scorecard incorporates both a
ranking with a rating system and provides actionable steps for governments, corporations, the media,
entrepreneur leaders and individuals to help expand the pool of high-impact female entrepreneurs. In addition,
we highlight global best practices such as policies, programs and breakthrough initiatives that jumpstart the
growth of high-impact female entrepreneurs.
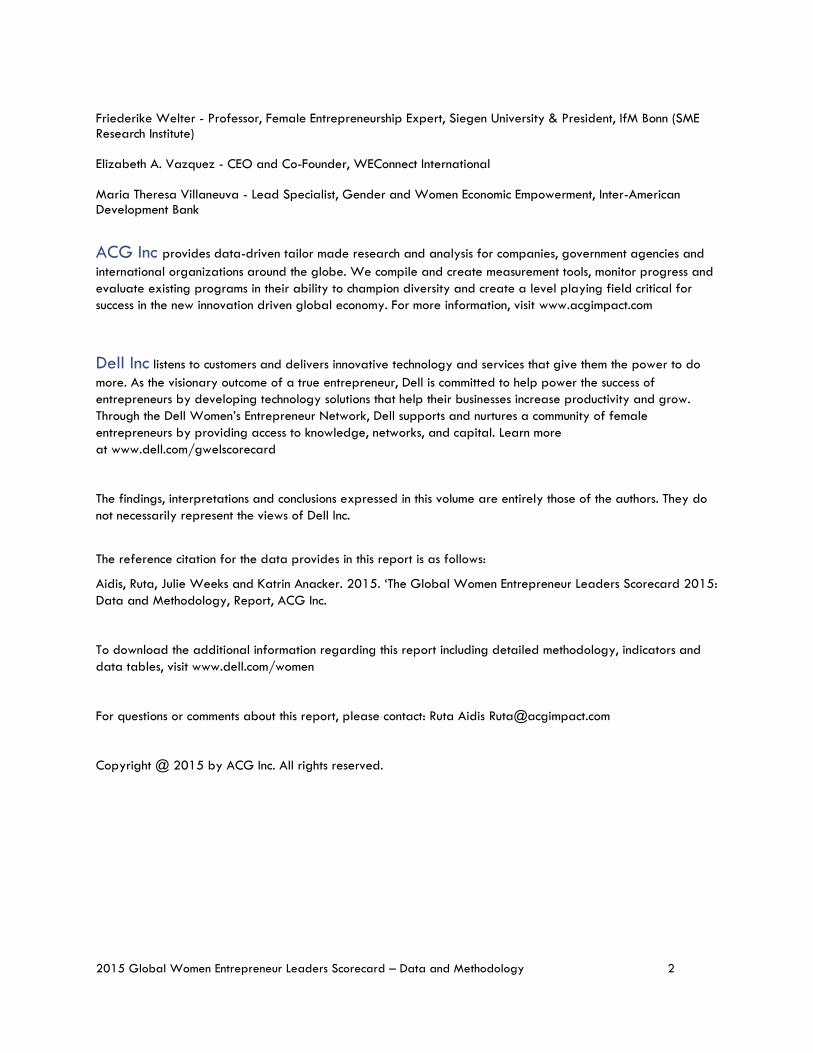
A New Model. The Global Women Entrepreneur Leaders Scorecard approach incorporates a composite index ranking with an
additional rating system. In this way, countries that perform well in the index are further assessed based on
three criteria that can be changed rapidly to improve conditions for high-impact female entrepreneurs.
Women’s access to executive leadership, Best practices and useful policies at the country level are highlighted
to stimulate inter-country learning.
Global Women Entrepreneur Leaders Scorecard (2015)
The 31 countries included in the 2015 Global Women Entrepreneur Leaders Scorecard provide diverse
regional and economic development coverage, capturing 70% of the world’s female population and 76% of
the world’s GDP. These countries shown in figure 1 include: Australia, Bangladesh, Brazil, Canada, Chile, China,

2015 Global Women Entrepreneur Leaders Scorecard – Data and Methodology 4
Egypt, France, Germany, Ghana, India, Jamaica, Japan, South Korea, Malaysia, Mexico, Nigeria, Panama,
Pakistan, Peru, Poland, Russia, South Africa, Spain, Sweden, Thailand, Tunisia, Turkey, Uganda, United Kingdom
and the United States.
Figure 1: Countries included in the 2015 Global Women Entrepreneur Leaders Scorecard
In this paper, we discuss the data and methodology used for creating the results for the Global Women
Entrepreneur Leaders Scorecard. This report is comprised of seven sections:
I. Introduction
II. Global Women Entrepreneur Leaders Scorecard Index Assessment Tool
III. Construction of the Five Category Index
IV. Ratings
V. Gender Business Growth Gap Estimations
VI. Appendices:
1) Indicators and Data Sources for the Global Women Entrepreneur Leaders Scorecard
2) Total Country Sample
3) Descriptive Statistics
4) Description of indicators used
5) Global Women Entrepreneur Leaders Scorecard Ratings Results
6) Global Women Entrepreneur Leaders Scorecard Watch List Results
II. Global Women Entrepreneur Leaders Scorecard Index Assessment Tool The index is comprised of 21 variables grouped into five categories. Gendered variables are included in four
of the five categories. The first category is 'Business Environment', which includes six variables that measure the
characteristics of the overall business environment as it affects all businesses. It includes indicators for the
regulatory environment, the prevalence of corruption, innovation and R&D investments and capital availability.

2015 Global Women Entrepreneur Leaders Scorecard – Data and Methodology 5
The second category is 'Gendered Access' and it includes four variables that measure women’s access to
education, access to the Internet, access to banks and access to SME training programs.
The third category is ‘Leadership and Rights’. This category is made up of four gendered variables that capture
women’s access to equal legal rights and freedom of movement; women’s access to leadership; acceptance of
female executives and access to professional social media.
The fourth category, ‘Pipeline for Female Entrepreneurship,’ includes four indicators that reveal the
‘entrepreneurship spirit’ amongst the female population. These measures include the percentage of the female
population that recognizes the opportunity to start a business; the percentage of the female population that sees opportunities to start businesses and know an entrepreneur. In addition it includes the overall ratio of
female to male start-ups.
The fifth and final category is called ‘Potential Entrepreneur Leaders’. This category is based on three measures
that embody the characteristics of a high impact female entrepreneur leader: they have growth oriented start-
ups that are market expanding and the female entrepreneurs are college educated. This framework is
presented in figure 3:
Figure 3: The Global Women Entrepreneur Leaders Scorecard Framework
Source: 2015 Global Women Entrepreneur Leaders Scorecard
The data used for the Global Women Entrepreneur Leaders Scorecard index are sourced from internationally recognized datasets such as those from the Global Entrepreneurship Monitor (GEM), World Economic Forum (WEF), Global Gender Gap Index (GGGI), World Bank’s Findex database, Transparency International,

2015 Global Women Entrepreneur Leaders Scorecard – Data and Methodology 6
UNESCO and others (shown fully in Appendix 1). The results of the country rankings and overall scores are shown in table 1 below. Table 1: Global Women Entrepreneur Leaders Scorecard Overall Rankings
Rank Country Score Rank Country Score Rank Country Score
1 USA 71 10-12 Jamaica 49 23 Nigeria 38
2-3 Canada 69 13 Mexico 46 24-25 Turkey 36
2-3 Australia 69 14 Peru 45 24-25 Uganda 36
4 Sweden 68 15-17 Panama 44 26 Ghana 35
5 UK 65 15-17 China 44 27 Tunisia 29
6 France 62 15-17 South Korea 44 28 Egypt 24
7 Germany 61 18-19 Brazil 43 29 India 17
8 Poland 56 18-19 Russia 43 30 Pakistan 14
9 Chile 51 20 South Africa 41 31 Bangladesh 12
10-12 Japan 49 21 Malaysia 40
10-12 Spain 49 22 Thailand 39
2015 Global Women Entrepreneur Leaders Scorecard
III. Construction of the five category index used in the Global Women Entrepreneur Leaders Scorecard
The Global Women Entrepreneur Leaders Scorecard Index is calculated with data for 40 additional countries
(see appendix 2 for full list) to improve the quality of results. The rationale for this approach is that calculations
using a larger pool of countries create more robust country ranks and scores and allow for proper
benchmarking. The 40 additional countries were selected based on regional and income level representation
but also for broad data availability for most of our indicators.
1. The selection of variables: The variables used come directly from the original sources for each
country involved in the analysis. The individual level variables (personal or business) are mainly sourced from the Global Entrepreneurship Monitor’s (GEM) Adult Population Survey, but also from other sources such as the World Bank’s Findex dataset. The institutional/environmental level are taken mainly from internationally recognized data sources such as the UNESCO, ILO, World Bank, World Economic Forum, etc. Altogether we use 21 individual and institutional variables. In 4 cases, the individual or institutional variables are composite indicators (further discussed in our indicator description document). Individual data from the GEM dataset are calculated from the pooled data from 2010 - 2012, except for India, which is from 2008. For indicator descriptive statistics see appendix 3.
2. Normalization: Variables are normalized to a range from 0 to 1 using the following formula:
x = (x - Min(x))/(Max(x) - Min(x))

2015 Global Women Entrepreneur Leaders Scorecard – Data and Methodology 7
where Min(x) and Max(x) are, respectively, the lowest and highest values for the 71 countries for any given
indicator. The normalized value is then transformed from a 0 – 1 value to a 0 - 100 score to make it directly
comparable with other indicators.
3. Calculating the Geometric Mean:
The geometric mean of a data set is given by:
This is calculated at the category level. The 21 variables that make up the Global Women Entrepreneur
Leaders Scorecard index are divided into 5 categories utilizing Principal Component Analysis (PCA) for the
initial groupings and theoretical considerations to form the final groupings.
The main advantage of using Geometric means is it reduces the substitutability between dimensions. Since 2010,
the Human Development Report’s Human Development Index has been using Geometric Means since it takes into
account differences in achievement across dimensions. Poor performance in one dimension can no longer be fully
compensated for high achievement in another dimension. Thus, a country’s attention is focused on improving
areas where it receives a low score rather than improving areas where its achievement is relatively strong.
One drawback of using geometric means is that it can only be used for positive numbers. Through normalization,
at least one country in our sample receives a 0 for each variable. We adjust the normalized zero value by
transforming it to a nominal positive value (0.001).
4. Missing Data
In a number of cases we had to contend with missing data. We addressed this by estimating values based on
data points of countries nearby or regional averages. The method used and the countries for which data was
missing are further presented in appendix 4.
IV. Global Women Entrepreneur Leaders Scorecard Rating System
The novel Global Women Entrepreneur Leaders Scorecard rating system provides cross-country insights for
three key rating areas and three important watch list criteria that have the potential to move the needle for
high-impact women entrepreneur development. The Global Women Entrepreneur Leaders Scorecard research
team compiled these two new datasets creating for the first time ever, an inventory and mechanism to
benchmark future progress.
2015 Global Women Entrepreneur Leaders Scorecard – Data and Methodology 8
Rating system explained
The Global Women Entrepreneur Leaders Scorecard rating system adds nuance to the rankings, identifying key
areas where progress is needed to leverage the environment to unleash high-impact female entrepreneurship.
Three target criteria and three ‘watch list’ criteria were used that are relatively easy to address and have the
potential to significantly move the needle for high-impact female entrepreneurship:
Target criteria:
1. The existence of a Gendered Public Procurement Policy;
2. The collection and availability of annual gendered business census;
3. The collection and availability of Gendered data for all Government funded entrepreneurship programs
(not just programs targeting women).
The country level results for the Global Women Entrepreneur Leaders Scorecard ratings are presented in
appendix 5.
Watch list criteria for a country’s largest publicly traded companies
1. Percentage of women CEOs – 10% target
2. Percentage of women senior managers – 35% target
3. Percentage of women on boards – 30% target
The country level results for the Global Women Entrepreneur Leaders Scorecard watch list criteria are
presented in appendix 6.
V. Gender Business Growth Gap
Based on the following estimations:
We use Global Entrepreneurship Monitor (GEM) for 2010 – 2012 averaged data and focus on the female and
male TEA1 startups owner’s response to the question: Do you intend to employ at least 10 people and plan to
grow more than 50 percent in five years? Those who respond ‘yes’ are considered ‘growth-oriented startups.’
We also use the data for the total sample size and total number of TEA startup owners.
For a country’s total population, we use data sourced from the United Nations Population Division, Department
of Social and Economic Affairs, World Population Prospects, 2012 Revision. The GEM surveys are based on the
1 Total Early Phase Entrepreneurial Activity denotes the percentage of 18-64 population who are either a nascent entrepreneur or owner-manager of a new business (no more than 42 months old).

2015 Global Women Entrepreneur Leaders Scorecard – Data and Methodology 9
responses of the adult population 18 to 64 years of age while the UN Population adult population data covers
a slightly more restricted adult age group: 20 – 64 years of age. The overall estimates may be lower due to
the smaller population group used.
We created two estimations using this data based on two assumptions: a) women and men who say they will
grow their startup businesses will in fact experience growth; and, b) women and men who say they will grow
their startup businesses will in fact experience growth in the form of an increase of 10 employees in the next
five years. The results for selected countries is presented in table 2.
Estimation 1: Gender Business Growth Gap: If women started growth-oriented startups at the
same rate as men
This estimation was calculated by:
1a) The difference between the percentage of growth oriented male startups and the percentage of fewer
growth oriented female startups. This provided us with the percentage of fewer growth-oriented female
startups.
1b) We calculated the percentage of the GEM survey sample of the population that would be growth oriented
female startups
1c) We multiplied the percentage for the GEM survey sample with the country’s total adult female population
to obtain get the additional total number of women who would start growth-oriented startups if women started
growth-oriented startups at the same rate as men.
Estimation 2: Gender Business Job Creation Gap: The total number of jobs created in the next 5
years (2014 – 2016) if women started growth-oriented startups at the same rate as men
This estimation was calculated using steps 1a) through 1c) for Estimation 1 and adding an additional step:
2a) We multiplied the total number of additional women who would start growth-oriented startups by 10.
Estimates were made for 12 countries where a significant difference between male and female responses were
found using independent T tests significant at the 0.05 level.

2015 Global Women Entrepreneur Leaders Scorecard – Data and Methodology 10
Table 2: Gender Business Growth Gap for Selected countries
If women were starting growth oriented startups at the same rate of men:
If women were starting growth oriented startups at the same rate of men: There would be more jobs created between 2014 - 2016
USA 1.5 million USA 15 million
Brazil 581,000 Brazil 5.8 million
Chile 200,000 Chile 2 million
China 7.4 million China 74.4 million
France 187,000 France 1.9 million
Germany 330,000 Germany 3.3 million
Ghana 204,000 Ghana 2 million
Jamaica 16,000 Jamaica 160,000
Korea 185,000 Korea 1.8 million
Spain 47,000 Spain 473,000 close to half a million
Turkey 872,000 Turkey 8.7 million
Uganda 88,000 Uganda 880,000
2015 Global Women Entrepreneur Leaders Scorecard All estimates based on 2010 country population data.

2015 Global Women Entrepreneur Leaders Scorecard – Data and Methodology 11
Appendix 1: Indicators and Data Sources for the Global Women Entrepreneur Leaders Scorecard
Indicator Name
Data Source
Monopolized Markets
World Economic Forum
Innovation Ecosystem
Global Competitiveness Index -World Economic Forum
Less Corruption Prevalence
Transparency International
R&D Investment
UNESCO
Low Business Regulations
World Bank’s Ease of doing business index
Capital Availability
Global Competitiveness Index -World Economic Forum
Access to Education
UNDP
Internet Access
International Telecommunications Union
Access to Banks
World Bank’s Financial Inclusion (Findex) database
Access to SME training programs
Economist Intelligence Unit
Freedom of Movement
OECD’s Gender and Institutions database
Equal Legal Rights
World Bank’s Women, Business and the Law database
Acceptance of Female Executives
World Values Survey
Female Leadership
Global Gender Gap Index (GGI)
Access to Professional Social Media
Based on data from Linked In
Female start-ups (Ratio) Calculated by Global Women Entrepreneur Leaders Scorecard team based on Global Entrepreneurship Monitor (GEM) data
Start-up skills Calculated by Global Women Entrepreneur Leaders Scorecard team based on Global Entrepreneurship Monitor (GEM) data
Opportunity Recognition Calculated by Global Women Entrepreneur Leaders Scorecard team based on Global Entrepreneurship Monitor (GEM) data Based on Global Entrepreneurship Monitor (GEM) data
Entrepreneur Ecosystem Calculated by Global Women Entrepreneur Leaders Scorecard team based on Global Entrepreneurship Monitor (GEM) data Based on Global Entrepreneurship Monitor (GEM) data
College Educated Start-ups Calculated by Global Women Entrepreneur Leaders Scorecard team based on Global Entrepreneurship Monitor (GEM) data Based on Global Entrepreneurship Monitor (GEM) data
Growth Oriented Start-ups Calculated by Global Women Entrepreneur Leaders Scorecard team based on Global Entrepreneurship Monitor (GEM) data Based on Global Entrepreneurship Monitor (GEM) data
Market Expanding Start-ups Calculated by Global Women Entrepreneur Leaders Scorecard team based on Global Entrepreneurship Monitor (GEM) data Based on Global Entrepreneurship Monitor (GEM) data

2015 Global Women Entrepreneur Leaders Scorecard – Data and Methodology 12
Appendix 2: Total country sample used for index construction
The 31 focus countries are highlighted in yellow
1. Algeria 2. Angola 3. Argentina 4. Australia 5. Bangladesh 6. Belgium 7. Bosnia and
Herzegovina 8. Botswana 9. Brazil 10. Canada 11. Chile 12. China 13. Colombia 14. Costa Rica 15. Croatia 16. Denmark 17. Ecuador 18. Egypt
19. Estonia 20. Ethiopia 21. Finland 22. France 23. Germany 24. Ghana 25. Greece 26. Guatemala 27. Hungary 28. India 29. Iran 30. Ireland 31. Israel 32. Italy 33. Jamaica 34. Japan 35. Korea 36. Latvia 37. Lithuania
38. Macedonia 39. Malawi 40. Malaysia 41. Mexico 42. Morocco 43. Namibia 44. Netherlands 45. Nigeria 46. Norway 47. Pakistan 48. Panama 49. Peru 50. Poland 51. Portugal 52. Romania 53. Russia 54. Singapore 55. Slovakia 56. Slovenia
57. South Africa 58. Spain 59. Sweden 60. Switzerland 61. Taiwan 62. Thailand 63. Trinidad &
Tobago 64. Tunisia 65. Turkey 66. Uganda 67. UAE 68. United
Kingdom 69. United
States 70. Uruguay 71. Zambia

2015 Global Women Entrepreneur Leaders Scorecard – Data and Methodology 13
Appendix 3: Descriptive Statistics
N Minimum Maximum Mean
Std.
Deviation Skewness Kurtosis
Statistic Statistic Statistic Statistic Statistic Statistic
Std.
Error Statistic
Std.
Error
Monopolized_Markets 71 .00 1.00 .4917 .21331 .364 .285 -.267 .563 Innovation_Ecosystem 71 .00 1.00 .4534 .25493 .704 .285 -.700 .563 Corruption_Prevalence 71 .00 1.00 .4619 .26597 .397 .285 -1.043 .563 R_D_Investment 71 .00 1.00 .2601 .24985 1.093 .285 .285 .563 Business_Regulations 71 .00 1.00 .5807 .21755 -.545 .285 -.166 .563 Capital_Availability 71 .00 1.00 .4365 .25159 .385 .285 -.641 .563 Access_to_Education 71 .00 1.00 .6169 .28523 -.409 .285 -.896 .563 Internet_Access 71 .00 1.00 .4685 .31893 -.064 .285 -1.289 .563 Access_to_Banks 71 .00 1.00 .6496 .29927 -.427 .285 -1.157 .563 Access_to_SME_programs 71 .00 1.00 .5951 .25483 -.165 .285 -.185 .563 Movements___Rights 71 .00 1.00 .7519 .24711 -1.538 .285 1.901 .563 Acceptance_Female_Executives 71 .00 1.00 .5955 .31130 -.430 .285 -1.160 .563 Female_Leadership 71 .00 1.00 .4699 .20821 -.236 .285 -.089 .563 Access_to_Professional_Social_Media 71 .00 1.00 .6468 .20905 -1.250 .285 1.082 .563 Female_Startups 71 .00 1.00 .5953 .26600 -.129 .285 -.822 .563 Startup_Skills 71 .00 1.00 .4895 .22494 .518 .285 -.391 .563 Opportunity_Recognition 71 .00 1.00 .4647 .25512 .355 .285 -.701 .563 Entrepreneur_Ecosystem 71 .00 1.00 .3557 .20558 1.188 .285 1.281 .563 College_Educated_Owners 71 .00 1.00 .3671 .24436 .599 .285 -.446 .563 Growth_Oriented_Startups 71 .00 1.00 .3280 .20144 .898 .285 .865 .563 Market_Expanding 71 .00 1.00 .4635 .25933 -.158 .285 -1.092 .563 Valid N (listwise) 71

2015 Global Women Entrepreneur Leaders Scorecard – Data and Methodology 14
Appendix 4: Categories and Indicators described
Category 1: Business Environment
Less Market Monopolies
Description This variable measures the extent of market dominance by a few business groups. If only
a few business groups dominate the market then business startup and market entry is
likely to be constrained or entirely prevented. Results are given according to a 1 – 7
scale: 7 (highest and best score) market spread among many firms; 1 (lowest and worst
score) market is dominated by a few business groups.
Source/date 2012-2013 data
Extent of Market Dominance
Global Competitiveness Index (GCI) dataset; Global ID EOSQ105
World Economic Forum
Highest value 5.73 – Japan
Lowest value 2.89 – Chile
Innovation Ecosystem
Description This variable is based on the innovation index points from the Global Competitiveness
Index (GCI): a complex measure of innovation including investment in research and
development (R&D) by the private sector, the presence of high-quality scientific
research institutions, the collaboration in research between universities and industry,
and the protection of intellectual property rights. Scores according to a 1 – 7 scale
where 7 is the best score.
Source/date 2012-2013 data
Pillar 12 - Innovation
Global Competitiveness Index (GCI) dataset; Global ID CCI.C.12
World Economic Forum
Highest value 5.54 – Japan
Lowest value 2.58 – Bangladesh
R&D Investments

2015 Global Women Entrepreneur Leaders Scorecard – Data and Methodology 15
Description Gross domestic expenditure on Research & Development as a percentage of GDP.
Source/date
Data from most recent year 2002-2012.
United Nation Educational, Scientific and Cultural Organization (UNESCO)
Highest value 3.4 – Sweden
Lowest value 0.06 – Jamaica
Low Prevalence of Corruption
Description 12 data sources were used to construct the Corruption Perceptions Index 2014:
1. African Development Bank Governance Ratings 2013
2. Bertelsmann Foundation Sustainable Governance Indicators 2014
3. Bertelsmann Foundation Transformation Index 2014
4. Economist Intelligence Unit Country Risk Ratings 2014
5. Freedom House Nations in Transit 2013
6. Global Insight Country Risk Ratings 2014
7. IMD World Competitiveness Yearbook 2014
8. Political and Economic Risk Consultancy Asian Intelligence 2014
9. Political Risk Services International Country Risk Guide 2014
10. World Bank - Country Policy and Institutional Assessment 2013
11. World Economic Forum Executive Opinion Survey (EOS) 2014
12. World Justice Project Rule of Law Index 2014
Surveys varied- an example of survey questions (Bertelsman):
To what extent are public officeholders prevented from abusing their position for
private interests?
Scores are given from a low of 1 to 2, where 'Public officeholders can exploit their
offices for private gain as they see fit without fear of legal consequences or adverse
publicity' to a high of 9 to 10, where 'Legal, political and public integrity mechanisms
effectively prevent public officeholders from abusing their positions.'
Overall Scoring:
Original Scores are given on a scale of 1 (highest level of corruption) to 10 (lowest level
of corruption). These scores are transformed using the ‘Distance from the Frontier’

2015 Global Women Entrepreneur Leaders Scorecard – Data and Methodology 16
methodology so that the highest score represents the lowest level of corruption and the
lowest score represents the highest level of corruption.
Source/date 2014 Data
Transparency International’s Corruption Perceptions Index (CPI)
http://www.transparency.org/cpi2014/in_detail
Highest value 87 – Sweden
Lowest value 25 – Bangladesh
Capital availability
Description This variable is based on a combination of three measures included in pillar 8:
Financial Market Development of the Global Competitiveness Index (GCI):
1. Ease of access to loans
2. Venture capital availability
3. Financing through local equity market
Source/date 2012 data
World Economic Forum’s 2013 -2014 Global Competitiveness Report
Highest value 4.81 – Malaysia
Lowest value 2.32 – Spain
Business Regulations
Description This is a composite measure based on the World Bank’s Ease of Doing Business Index
results. A high ease of doing business ranking means the regulatory environment is more
conducive to the starting and operation of a local firm. The rankings are determined by
sorting the aggregate distance to frontier scores on 10 topics, each consisting of several
indicators, giving equal weight to each topic. The Ease of Doing Business Index
combines the results for 10 individual sub-indicators:
1. Starting a business
2. Dealing with construction permits
3. Getting electricity
4. Registering property

2015 Global Women Entrepreneur Leaders Scorecard – Data and Methodology 17
5. Getting credit
6. Protecting minority investors
7. Paying taxes
8. Trading across borders
9. Enforcing contracts
10. Resolving insolvency
Source/date 2014 Data
World Bank’s Ease of Doing Business Index 2014
Highest value 83.40 - Korea
Lowest value 46.84 – Bangladesh
Category 2: Gendered Access
Access to Education
Description This variable is defined as the percentage of women 25 or older who have completed at
least some secondary education.
Source/date Data from most recent year 2006 – 2012
Source: United Nations Development Program (UNDP) 2014 Gender Inequality Index
Rationale Access to secondary education better reflects women’s overall access to education.
Studies have shown that once girls gain access to basic levels of education, there is a high
likelihood that they will continue onto higher levels of education.
Studies have shown that once women get access to basic levels of education, there is a
high likelihood that they seek higher levels of education. Therefore the initial access for
women to basic levels of education are essential.
Highest value 100 – Canada and UK
Lowest value 19.31 – Pakistan
Data notes Nigeria data from 2012 World’s Women database
Access to Internet

2015 Global Women Entrepreneur Leaders Scorecard – Data and Methodology 18
Description Number of female Internet Users per 100 inhabitants.
Source/date 2009 -2012 most recent data used whenever possible.
International Telecommunications Union (ITU)
Highest value 91.8 – Sweden
Lowest value 9.55 – Ghana
Data notes Bangladesh and Pakistan estimated as India
Nigeria estimated as Ghana, S. Africa and Uganda average
Access to Banks
Description This variable measures the percentage of women who have access to a bank account in a
formal institution.
Source/date 2014 data
World Bank’s 2014 Findex Database
Highest value 99.76 – Sweden
Lowest value 3.02 – Pakistan
Access to Small and Medium-sized Enterprise (SME) Programs
Description This indicator considers if training has a wide geographic availability, is accessible to
women as well as men, affordable for the majority of intended beneficiaries, if the length
of training takes into account women’s time burdens, and if it is culturally appropriate.
The results are scored according to a 6 point Likert scale as follows:
0= Training programs do not meet any of the following five conditions: they have wide
geographic availability, are accessible to women as well as men, affordable for the
majority of intended beneficiaries, culturally appropriate, and the length of training takes
into account women’s time burdens;
20 = Training programs meet one or of the following five conditions: they have wide
geographic availability, are accessible to women as well as men, affordable for the

2015 Global Women Entrepreneur Leaders Scorecard – Data and Methodology 19
majority of intended beneficiaries, culturally appropriate, and the length of training takes
into account women’s time burdens:
40 = Training programs meet two of the following five conditions: they have wide
geographic availability, are accessible to women as well as men, affordable for the
majority of beneficiaries, culturally appropriate, and the length of training takes into
account women’s time burdens;
60 = Training programs meet three of the following five conditions: they have wide
geographic availability, are accessible to women as well as men, affordable for the
majority of beneficiaries, culturally appropriate, and the length of training takes into
account women’s time burdens;
80 = Training programs meet four of the following five conditions: they have wide
geographic availability, are accessible to women as well as men, affordable for the
majority of beneficiaries, culturally appropriate, and the length of training takes into
account women’s time burdens;
100 = Training programs have wide geographic availability, are accessible to women as
well as men, affordable for the majority of beneficiaries, culturally appropriate, and the
length of training takes into account women’s time burdens.
The maximum score a country can receive is 100, where 100 = most favorable.
Source/date 2010 data
Economist Intelligence Unit (EIU) Women’s Economic Opportunity Report
Highest value 100 - Five countries: Australia, France, Sweden, UK and USA
Lowest value 20 –Pakistan
Category 3: Leadership and Rights
Equal Rights and Movement
Description This variable is a composite measure of women's equal legal rights and women’s access
to public space.
Women’s equal legal rights for married and unmarried women in terms of 'the law' (i.e.
constitutional rights) is measured according to 16 dimensions:
The 16 Equal Legal Rights Indicators are grouped as follows:

2015 Global Women Entrepreneur Leaders Scorecard – Data and Methodology 20
1) If customary law is a valid source of law, is it considered invalid if it violates
constitutional provisions on discrimination or equality (Yes = 1; No = 0)
2) If personal law is a valid source of law, is it considered invalid if it violates
constitutional provisions on discrimination or equality? (Yes = 1; No = 0)
3) Can an unmarried woman be "head of household" or "head of family" in the same way
as a man? (Yes = 1; No = 0)
4) Can a married woman be "head of household" or "head of family" in the same way as a
man? (Yes = 1; No = 0)
5) Are married women required by law to obey their husbands?
(Yes = 0; No = 1)
6) Are there special provisions governing the marital home?
(Yes = 1; No = 0)
7) Does the law provide for valuation of 1nmonetary contributions during marriage?
(Yes = 1; No = 0)
8) Do unmarried men and unmarried women have equal ownership rights to property?
(Yes = 1; No = 0)
9) Do married men and married women have equal ownership rights to property?
(Yes = 1; No = 0)
10) Do sons and daughters have equal inheritance rights to property?
(Yes = 1; No = 0)
11) Do female and male surviving spouses have equal inheritance rights to property?
(Yes = 1; No = 0)
12) Can pregnant and nursing women do the same jobs as men?
(Yes = 1; No = 0)
13) Can pregnant and nursing women work the same night hours as men?
(Yes = 1; No = 0)
14) Are there laws mandating discrimination based on gender in hiring?
(Yes = 1; No = 0)
15) Does a woman's testimony carry the same evidentiary weight in court as a man’s?
(Yes = 1; No = 0)
16) Is there a governmental office tasked with addressing sexual harassment?
(Yes = 1; No = 0)
In addition, it includes two measures for the legal restrictions or discriminatory practices
affecting women’s access to public space, for example the restrictions on women’s choice

2015 Global Women Entrepreneur Leaders Scorecard – Data and Methodology 21
of domicile, restricted ability to visit family and friends, requirements for husband’s
approval apply for a passport or widespread threats of political violence.
The Access to Public Spaces measure is calculated as follows:
2 points if: No legal restrictions and no discriminatory practice is reported.
1 point if: No legal restrictions, but discriminatory practices widely reported.
0 points if: There are legal restrictions or discriminatory practices that are widespread.
Total scoring: 0 – 18 with highest score: 18
Source/date Two data bases used :
Equal Legal Rights : 2013 data
Word Bank’s Women Business and the Law Database
Freedom of Movement: 2014 data
Organization for Economic Cooperation and Development (OECD)’s Gender, Institutions
and Development Database
Highest value 18 – Four countries: Canada, Spain, Sweden, and the UK
Lowest value 6 – Egypt
Acceptance of Female Executives
Description The World Values Survey data used measures the percent of women that respond with
“disagree” or “strongly disagree” to the question “Do Men Make Better Business
Executives than Women?”
Source/date 2014 data
World Values Survey
Highest value 92.7 – Sweden
Lowest value 25.6 – India
Data notes Jamaica estimated as Trinidad and Tobago
Canada estimated as USA

2015 Global Women Entrepreneur Leaders Scorecard – Data and Methodology 22
Panama estimated as Mexico and Chile average
Bangladesh estimated as Pakistan and India average
Uganda estimated as S. Africa
Data for UK from 2008
Data for Peru from 2012
Female Leadership
Description This variable measures the percentage of female legislators, senior officials and
managers over the male value.
Source/date 2014 data
World Economic Forum’s 2014 Global Gender Gap Index
Highest value 59 – Jamaica
Lowest value 3 – Pakistan
Data notes India 2012 data from International Labor Organization via World Bank database
Nigeria 2010 data from International Labor Organization via World Bank database
Professional Social Media Profiles
Description Percentage of female LinkedIn profiles per country of origin.
Source/date 2104 data - LinkedIn Profiles obtained from LinkedIn database
Highest value 53 – Jamaica
Lowest value 15 – Pakistan
Category 4: Pipeline for Entrepreneurship
Startup Skills
Description This variable measures the percentage of the 18-64 aged female population who believe
they have proper skills to successfully launch a business.

2015 Global Women Entrepreneur Leaders Scorecard – Data and Methodology 23
Source/date 2010 – 2012 pooled data
Based on recalculated Global Entrepreneurship Monitor (GEM) data by the Global
Women Entrepreneur Leaders Scorecard team
Highest value 0.86 – Nigeria
Lowest value 0.06 – Japan
Data notes Canada based on 2014 data; India based on 2008 data.
Opportunities for Startup
Description This variable is defined as the percentage of the 18-64 aged female population who
recognize opportunities to start a business in their environment.
Source/date 2010 – 2012 pooled data, weighted average
Based on recalculated http://www.gemconsortium.org for the GWEL Index
Highest value 0.82 – Nigeria
Lowest value 0.06 – Japan
Data notes Canada based on 2014 data.
Entrepreneur Ecosystem
Description The percentage of the 18-64 aged female adult population who personally know an
entrepreneur who started a business in the past two years.
Source/date 2010 – 2012 pooled data
Based on recalculated Global Entrepreneurship Monitor (GEM) data by the Global
Women Entrepreneur Leaders Scorecard team
Highest value 0.79 – Nigeria
Lowest value 0.10 – India

2015 Global Women Entrepreneur Leaders Scorecard – Data and Methodology 24
Data notes Canada based on 2014 data; India based on 2008 data.
Female Startups
Description The female/male ratio of Total Early Phase Entrepreneurship Activity (TEA) rates.
Based on the ideal ratio of 1:1
Note: Total Early Phase Entrepreneurial Activity (TEA) is the percentage of 18-64
population who are either a nascent entrepreneur or owner-manager of a new business
(no more than 42 months old)
Source/date 2010 – 2012 pooled data
Based on recalculated Global Entrepreneurship Monitor (GEM) data by the Global
Women Entrepreneur Leaders Scorecard team
Highest value 1.36 – Ghana
Lowest value 0.21 – Pakistan
Data notes Canada based on 2014 data; India based on 2008 data.
Category 5: Potential Entrepreneur Leaders
College Educated Owners
Description This variable is defined as the percentage of TEA female business owners who have
participated in tertiary education.
Source/date 2010 – 2012 pooled data
Based on recalculated Global Entrepreneurship Monitor (GEM) data by the Global Women
Entrepreneur Leaders Scorecard team
Highest value 0.52 – Australia
Lowest value 0.03 – Ghana

2015 Global Women Entrepreneur Leaders Scorecard – Data and Methodology 25
Data notes Canada estimated as USA; India based on 2008 data.
Growth-oriented Startups
Description This variable measures the percentage of female TEA businesses that intend to employ at
least ten people and plan to grow more than 50 percent in five years.
Source/date 2010 – 2012 pooled data
Based on recalculated Global Entrepreneurship Monitor (GEM) data by the Global Women
Entrepreneur Leaders Scorecard team
Highest value 0.32 – Egypt
Lowest value 0.003 – Panama
Data notes Canada estimated as USA; India based on 2008 data.
Expanding Markets
Description This variable is defined as the percentage of female TEA businesses where more than 1%
of customers are outside of the home country.
Source/date 2010 – 2012 pooled data
Based on recalculated Global Entrepreneurship Monitor (GEM) data by the Global Women
Entrepreneur Leaders Scorecard team
Rationale Proxy for innovative firm and a defining characteristics of high growth firms
Highest value 0.74 – USA
Lowest value 0.01-Brazil
Data notes Canada estimated as USA; India based on 2008 data.

2015 Global Women Entrepreneur Leaders Scorecard – Data and Methodology 26
Appendix 5: Global Women Entrepreneur Leaders Scorecard Ratings Rank Country Existence
Gender Procurement Policy
The collection and availability of annual gendered business census
The collection and availability of Gendered data for all Government funded entrepreneurship programs
Final Rating
Target Yes = 1 No = 0
Yes = 1 No = 0
Yes = 1 No = 0
3/3
1 USA 1 1 0 2/3
2-3 Canada 0 0 0 0/3
2-3 Australia 0 0 0 0/3
4 Sweden 0 1 0 1/3
5 UK 0 0 0 0/3
6 France 0 1 0 1/3
7 Germany 0 1 0 1/3
8 Poland 0 0 0 0/3
9 Chile 0 1 1 2/3
10- 12 Japan 0 0 0 0/3
10-12 Spain 0 0 0 0/3
10 -12 Jamaica 0 0 0 0/3
13 Mexico 0 0 1 1/3
14 Peru 0 0 0 0/3
15 - 17 Panama 0 0 0 0/3
15 - 17 China 0 0 0 0/3
15 - 17 South Korea 0 0 0 0/3
18 -19 Brazil 0 0 0 0/3
18 - 19 Russia 0 0 0 0/3
20 South Africa 1 1 0 1/3
21 Malaysia 0 0 0 0/3
22 Thailand 0 0 0 0/3
23 Nigeria 0 0 0 0/3
24-25 Turkey 0 0 0 0/3
24-25 Uganda 0 0 0 0/3
26 Ghana 0 0 0 0/3
26 Tunisia 0 0 0 0/3
28 Egypt 0 0 0 0/3
29 India 0 0 0 0/3
30 Pakistan 0 0 0 0/3
31 Bangladesh 0 0 0 0/3
Compiled by Global Women Entrepreneur Leaders Scorecard Research Team (2015). Gender Procurement Policy Data sourced from the International Trade Center (ITC), 2015 data.
Global Women Entrepreneur Leaders Scorecard Rating scale Rating Excelling High Performing Mid performing Low performing
Targets met 3/3 2/3 1/3 0/3

2015 Global Women Entrepreneur Leaders Scorecard – Data and Methodology 27
Appendix 6: Global Women Entrepreneur Leaders Scorecard Watch List Results Rank Countries Percentage Women
CEOs Percentage Women Senior Managers
Percentage Women on Boards
Targets met:
Target 10% 35% 30% 3/3
1 USA 4.6% 21% 19.2% 0/3
2-3 Canada 3% 25% 20.8% 0/3
2-3 Australia 3% 22% 19.2% 0/3
4 Sweden 4% 28% 28.8% 0/3
5 UK 2% 22% 22.8% 0/3
6 France 0% 33% 30% 1/3
7 Germany 0% 14% 24.4% 0/3
8 Poland 0% 37% 14.6% 1/3
9 Chile 3% 30% 4% 0/3
10- 12 Japan 0% 8% 3.1% 0/3
10-12 Spain 3% 26% 18.2% 0/3
10 -12 Jamaica 0% 35% 22% 1/3
13 Mexico 3% 23% 6% 0/3
14 Peru 4% 5% 7% 0/3
15 - 17 Panama 0% 12% 5% 0/3
15 - 17 China 5.6% 25% 8% 0/3
15 - 17 South Korea <1% 6% 1% 0/3
18 -19 Brazil 5% 15% 6% 0/3
18 - 19 Russia na 40% 4.6% 1/3
20 South Africa 3.6% 27% na 0/3
21 Malaysia 5% 22% 6% 0/3
22 Thailand na 27% 10.8% 0/3
23 Nigeria 8% 21% 6% 0/3
24-25 Turkey 4% 26% 11.2% 0/3
24-25 Uganda na na na 0/3
26 Ghana na na na 0/3
26 Tunisia na na na 0/3
28 Egypt na na na 0/3
29 India 4% 15% 9.5% 0/3
30 Pakistan na na na 0/3
31 Bangladesh na na na 0/3
Compiled by Global Women Entrepreneur Leaders Scorecard Research Team (2015) Key: na = not available

2015 Global Women Entrepreneur Leaders Scorecard – Data and Methodology 28
Sources and Notes for Global Women Entrepreneur Leaders Scorecard watch list results 1) USA: CEOs and Boards for S&P 500 index, source: 2014 Catalyst Census: Women Board Directors, 2014 data; Senior
Management source: Grant Thornton International Business Report (IBR) 2015 http://www.grantthornton.global/en/insights/articles/women-in-business-2015/ - 2015 data.
2) Canada: CEOs for top 100 listed companies, source: Graham S.(2015) Canada’s Top 100 highest-paid CEOs, Canadian
Business, Jan 20, 2015, http://www.canadianbusiness.com/lists-and-rankings/richest-people/top-100-highest-paid-ceos-
2015/, 2015 data; Senior Management, source: Grant Thornton IBR 2015 - 2015 data; Boards for TSX 60 index, source:
2014 Catalyst Census: Women Board Directors http://www.catalyst.org/knowledge/2014-catalyst-census-women-board-
directors, 2014 data.
3) Australia: CEOs for ASX 200 index, source: ILO (2015) Global Report: women in Business and Management: Gaining
Momentum - 2014 Data; Senior Management, source: Grant Thornton IBR 2015 - 2015 data; Boards for ASX 200 index,
source: 2014 Catalyst Census: Women Board Directors, 2014 data.
4) Sweden: CEOs for OMX30 index, source: European Commissions' database on Women and Men in Decision-making
(WMiD): http://ec.europa.eu/justice/gender-equality/gender-decision-making/database/index_en.htm, 2014 data; Senior
Management, source: Grant Thornton IBR 2015, 2015 data; Boards for OMX30 index, source: 2014 Catalyst Census:
Women Board Directors, 2014 data.
5) UK: CEOs for FTSE100 index, source: European Commissions' database on Women and Men in Decision-making
(WMiD): http://ec.europa.eu/justice/gender-equality/gender-decision-making/database/index_en.htm, 2014 data; Senior
Management, source: Grant Thornton IBR 2015, 2015 data; Boards for FTSE100 index, source: 2014 Catalyst Census:
Women Board Directors, 2014 data. In 2011, Lord Davies, former chairman of Standard Chartered set a 25% target for
female board representation by 2015. The UK 30% Club set a target for 30% female board representation. Neither target
has been reached.
6) France: CEOs for CAC40 index, source: European Commissions' database on Women and Men in Decision-making
(WMiD): http://ec.europa.eu/justice/gender-equality/gender-decision-making/database/index_en.htm, 2014 data; Senior
Management, source: Grant Thornton IBR 2015 - 2015 data; Boards for CAC40 index, source: 2014 Catalyst Census:
Women Board Directors, 2014 data
Since 2010 France has a 20% quota for women on boards which was reached in 2008.
7) Germany: CEOs for DAX30 index, source: European Commissions' database on Women and Men in Decision-making (WMiD):
http://ec.europa.eu/justice/gender-equality/gender-decision-making/database/index_en.htm, 2014 data; Senior
Management, source: Grant Thornton IBR 2015 - 2015 data; Boards for DAX30 index, source: 2014 Catalyst Census:
Women Board Directors, 2014 data. In 2015, Germany introduced a 30% quota for women on boards.
8) Poland: CEOs and Boards for WIG20 index, source: European Commissions' database on Women and Men in Decision-
making (WMiD): http://ec.europa.eu/justice/gender-equality/gender-decision-making/database/index_en.htm, 2014 data;
Senior Management, source: Grant Thornton IBR 2015 - 2015 data.
In 2013, Poland introduced a recommended target of 30% for women on boards by 2015. This target was not reached.
9) Chile: CEOs and Boards based on Osiris data for 206 listed companies: 156 companies on the Santiago Stock Exchange and
50 listed companies from La Bolsa Electronica, source: Flabbi, L., Piras, C., and S. Abrahams (2015) Female Corporate
Leadership in LAC: Representation and Firm-level Outcomes, IDB study, forthcoming, 2012-2013 data; Senior Management -
source: Grant Thornton IBR 2014 - 2014 data.
10) Japan: CEOs for NIKKEI225 index, source: Global Women Entrepreneur Leaders Scorecard team research, 2015 data;
Senior Management, Grant Thornton IBR 2015 - 2015 data; Boards for Core TOPIX30 index, source: 2014 Catalyst Census:
Women Board Directors, 2014 data.
11) Spain: CEOs and Board data for IBEX35-EU Commission Database on women and men in decision making. 2014 Data; Senior
Management, Grant Thornton IBR 2015 - 2015 data.
In 2007, Spain introduced a quota for 40% women on boards.
12) Jamaica: CEO and Boards – based on Osiris data for 30 listed companies, source: Flabbi, L., Piras, C., and S. Abrahams
(2015) Female Corporate Leadership in LAC: Representation and Firm-level Outcomes, IDB study, forthcoming, 2012-2013
data; Senior Management, source: Grant Thornton IBR 2015, 2015 data.
13) Mexico: CEOs for Expansion 100 index, source: ILO (2015) Global Report: women in Business and Management: Gaining
Momentum - 2014 Data; Senior Management, source: Grant Thornton IBR 2015 - 2015 data; Boards based on Osiris data
for 107 listed companies, source: Flabbi, L., Piras, C., and S. Abrahams (2015) Female Corporate Leadership in LAC:
Representation and Firm-level Outcomes, IDB study, forthcoming, 2012-2013 data; Senior Management, source: Grant
Thornton IBR 2015, 2015 data.
14) Peru: CEOs and Boards based on Osiris data for 144 listed companies, source: Flabbi, L., Piras, C., and S. Abrahams (2015)
Female Corporate Leadership in LAC: Representation and Firm-level Outcomes, IDB study, forthcoming, 2012-2013 data;
Senior Management, based on percentage of women in executive positions, source: same as for CEOs and Boards, 2012-
2013 data.

2015 Global Women Entrepreneur Leaders Scorecard – Data and Methodology 29
15) Panama: CEOs and Boards based on Osiris data for 9 listed companies, source: Flabbi, L., Piras, C., and S. Abrahams (2015)
Female Corporate Leadership in LAC: Representation and Firm-level Outcomes, IDB study, forthcoming, 2012-2013 data;
Senior Management, based on percentage of women in executive positions, source: same as for CEOs and Boards, 2012-
2013 data.
16) China: CEOs and Boards, source: McKinsey and Company (2012) Women Matter: An Asian Perspective, 2011 data. Senior
Management, source: Grant Thornton IBR 2015, 2015 data.
17) South Korea: CEOs, Senior Management and Board, source: McKinsey and Company (2012) Women Matter: An Asian
Perspective, 2011 data. Senior Management percentage is based on the percentage of women in mid- and senior
management.
18) Brazil: CEOs and Boards based on Osiris data for 156 listed companies on the BOVESPA index, source: Flabbi, L., Piras, C.,
and S. Abrahams (2015) Female Corporate Leadership in LAC: Representation and Firm-level Outcomes, IDB study
forthcoming, 2012-2013 data; Senior Management, source: Grant Thornton IBR 2015, 2015 data.
19) Russia: CEOs – no data. Senior Management, source: Grant Thornton IBR 2015, 2015 data. Boards for MICEX30, source:
2014 Catalyst Census: Women Board Directors, 2014 data.
20) South Africa: CEOs based on South Africa’s top 100 listed companies, source: Biznews (2014) South Africa’s top 100 CEOs
http://www.biznews.com/sa-investing/2014/12/22/south-africas-top-100-ceos/; Senior Management, source: Grant
Thornton IBR 2015, 2015 data: Boards – no data.
In 2009 South Africa introduced a quota for 50% women on boards with no deadline.
21) Malaysia: CEOs and Board, source: McKinsey and Company (2012) Women Matter: An Asian Perspective, 2011 data. Senior
Management, source: Grant Thornton IBR 2015, 2015 data.
In 2010 Malaysia introduced a quota of 30% women on boards by 2016.
22) Thailand: CEOs – no data. Senior Management, source: Grant Thornton IBR 2015, 2015 data: Boards for SET100 index,
source GMI’s Ratings Women on Boards 2013, 2013 data.
23) Nigeria: CEOs and Board for NSE 190 listed companies, source: Daily Independent (March 17, 2014)
http://dailyindependentnig.com/2014/03/73-companies-quoted-on-nse-have-no-woman-board-member-says-oteh-sec-
dg/, 2014 data; Senior Management, source: Grant Thornton IBR 2015, 2015 data.
24) Turkey: CEOs and Board for XU50 index, source: European Commissions' database on Women and Men in Decision-making
(WMiD): http://ec.europa.eu/justice/gender-equality/gender-decision-making/database/index_en.htm, 2014 data. Senior
Management, source: Grant Thornton IBR 2015, 2015 data.
25) Uganda: no data for CEO, Senior Managers and Board.
26) Ghana: no data for CEO, Senior Managers and Board.
27) Tunisia: no data for CEO, Senior Managers and Board.
28) Egypt: no data for CEO, Senior Managers and Board.
29) India: CEOs for BSE200, source: ILO (2015) Global Report: women in Business and Management: Gaining Momentum - 2014
Data; Senior Management, source: Grant Thornton IBR 2015 - 2015 data; Boards for BSE200, source: 2014 Catalyst
Census: Women Board Directors, 2014 data.
In 2014 India introduced a quota of a least 1 woman on every board of listed companies. The initial deadline was October
1, 2014 but was extended to April 1, 2015. India is the first developing country to introduce a quota for women on boards.
30) Pakistan: no data for CEO, Senior Managers and Board.
31) Bangladesh: no data for CEO, Senior Managers and Board.