Embed Size (px)
Citation preview

2015 Global chemical industry mergers and acquisitions outlook The momentum continues
January 2015

2
Contents
1 Global activity
2 Cross-border activity
3 Drivers of cross-border M&A activity
4 Shareholder activists and private equity investors
5 M&A activity by chemical segment
7 Chemical M&A activity in key markets
12 Impact of cheaper oil
13 Summary outlook for 2015 M&A activity
14 Contacts
16 Acknowledgements
2015 Global chemical industry mergers and acquisitions outlook 1
Global activity
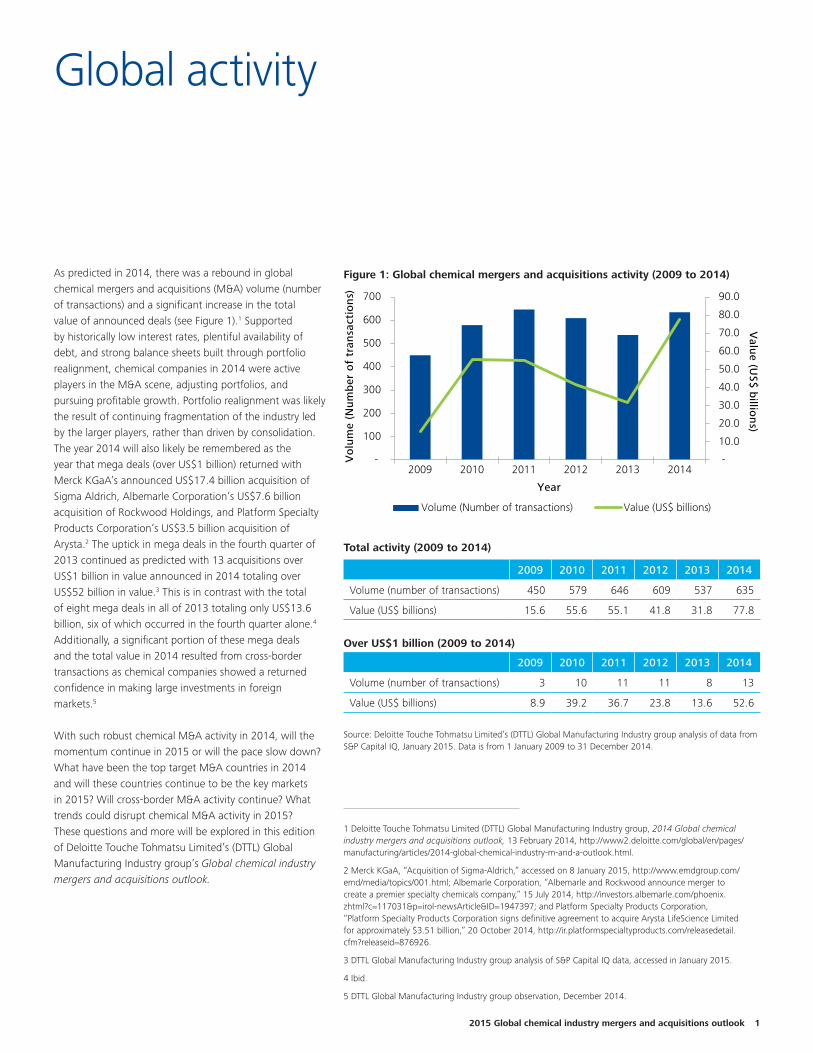
As predicted in 2014, there was a rebound in global chemical mergers and acquisitions (M&A) volume (number of transactions) and a significant increase in the total value of announced deals (see Figure 1).1 Supported by historically low interest rates, plentiful availability of debt, and strong balance sheets built through portfolio realignment, chemical companies in 2014 were active players in the M&A scene, adjusting portfolios, and pursuing profitable growth. Portfolio realignment was likely the result of continuing fragmentation of the industry led by the larger players, rather than driven by consolidation. The year 2014 will also likely be remembered as the year that mega deals (over US$1 billion) returned with Merck KGaA’s announced US$17.4 billion acquisition of Sigma Aldrich, Albemarle Corporation’s US$7.6 billion acquisition of Rockwood Holdings, and Platform Specialty Products Corporation’s US$3.5 billion acquisition of Arysta.2 The uptick in mega deals in the fourth quarter of 2013 continued as predicted with 13 acquisitions over US$1 billion in value announced in 2014 totaling over US$52 billion in value.3 This is in contrast with the total of eight mega deals in all of 2013 totaling only US$13.6 billion, six of which occurred in the fourth quarter alone.4 Additionally, a significant portion of these mega deals and the total value in 2014 resulted from cross-border transactions as chemical companies showed a returned confidence in making large investments in foreign markets.5
1 Deloitte Touche Tohmatsu Limited (DTTL) Global Manufacturing Industry group, 2014 Global chemical industry mergers and acquisitions outlook, 13 February 2014, http://www2.deloitte.com/global/en/pages/manufacturing/articles/2014-global-chemical-industry-m-and-a-outlook.html.
2 Merck KGaA, “Acquisition of Sigma-Aldrich,” accessed on 8 January 2015, http://www.emdgroup.com/emd/media/topics/001.html; Albemarle Corporation, “Albemarle and Rockwood announce merger to create a premier specialty chemicals company,” 15 July 2014, http://investors.albemarle.com/phoenix.zhtml?c=117031&p=irol-newsArticle&ID=1947397; and Platform Specialty Products Corporation, “Platform Specialty Products Corporation signs definitive agreement to acquire Arysta LifeScience Limited for approximately $3.51 billion,” 20 October 2014, http://ir.platformspecialtyproducts.com/releasedetail.cfm?releaseid=876926.
3 DTTL Global Manufacturing Industry group analysis of S&P Capital IQ data, accessed in January 2015.
4 Ibid.
5 DTTL Global Manufacturing Industry group observation, December 2014.
With such robust chemical M&A activity in 2014, will the momentum continue in 2015 or will the pace slow down? What have been the top target M&A countries in 2014 and will these countries continue to be the key markets in 2015? Will cross-border M&A activity continue? What trends could disrupt chemical M&A activity in 2015? These questions and more will be explored in this edition of Deloitte Touche Tohmatsu Limited’s (DTTL) Global Manufacturing Industry group’s Global chemical industry mergers and acquisitions outlook.
Figure 1: Global chemical mergers and acquisitions activity (2009 to 2014)
Total activity (2009 to 2014)
2009 2010 2011 2012 2013 2014
Volume (number of transactions) 450 579 646 609 537 635
Value (US$ billions) 15.6 55.6 55.1 41.8 31.8 77.8
Over US$1 billion (2009 to 2014)
2009 2010 2011 2012 2013 2014
Volume (number of transactions) 3 10 11 11 8 13
Value (US$ billions) 8.9 39.2 36.7 23.8 13.6 52.6
Source: Deloitte Touche Tohmatsu Limited’s (DTTL) Global Manufacturing Industry group analysis of data from S&P Capital IQ, January 2015. Data is from 1 January 2009 to 31 December 2014.
-
10.0
20.0
30.0
40.0
50.0
60.0
70.0
80.0
90.0
-
100
200
300
400
500
600
700
2009 2010 2011 2012 2013 2014
Valu
e (US$
billio
ns)
Vo
lum
e (N
um
ber
of
tran
sact
ion
s)
Volume (Number of transactions) Value (US$ billions)
Year

2
Cross-border activity
Globalization in the pursuit of growth to drive cross-border activityIn today’s competitive environment, senior executives are increasingly challenged to deliver continual growth to their organizations. With many observing slow growth in their home markets, chemical companies both large and small have looked to foreign markets to achieve growth, cost competitiveness, and to better serve their global customers.
Figure 2 shows cross-border activity is an important part of any robust M&A and growth strategy. Just over a quarter of the total industry M&A deals last year were cross-border in nature (168 of the 635 transactions).
It is important for chemical executives to understand what is driving the cross-border deal activity and what new risks may surface before developing a global M&A strategy and moving into foreign territories themselves. The following section addresses these topics.
Figure 2: Global chemical mergers and acquisitions activity—cross border (2009 to 2014)
2009 2010 2011 2012 2013 2014
Volume (number of transactions) 124 174 206 185 160 168
Value (US$ billions) 3.0 13.5 18.5 11.3 14.4 40.5
Note: Cross-border activity excludes private equity transactions, regardless of the location of the private equity acquirer and the seller.
Source: DTTL’s Global Manufacturing Industry group analysis of data from S&P Capital IQ, January 2015. Data is from 1 January 2009 to 31 December 2014.
-
5.0
10.0
15.0
20.0
25.0
30.0
35.0
40.0
45.0
-
50
100
150
200
250
2009 2010 2011 2012 2013 2014
Valu
e (US$
billio
ns)
Vo
lum
e (N
um
ber
of
tran
sact
ion
s)
Volume (Number of transactions) Value (US$ billions)
Year

2015 Global chemical industry mergers and acquisitions outlook 3
Drivers of cross-border M&A activity
More stable global economy reduces cross-border M&A riskIt is easy to forget, but it was not long ago that global executives were concerned about a financial collapse in the Eurozone, a technical government debt-default in the U.S., and slowing emerging economies.6 During times of such uncertainty, companies, especially small and mid-cap companies, typically stick to what they know including their local domestic markets. While global economic growth is currently not setting records and a degree of economic uncertainty and instability remains, especially outside the U.S., more chemical companies are expected to explore foreign markets to enhance their top-line growth rates.
6 Deloitte University Press, Global Economic Outlook, Q1 2013, 22 August 2013, http://dupress.com/articles/global-economic-outlook-q1-2013/; Wall Street Journal, “Default Worry Hammers Short-Term U.S. Debt,” 8 October 2013; and Wall Street Journal, “Emerging World Loses Growth Lead,” 11 August 2013.
Matching the global footprint of customers is a business imperativeA global supply chain with an effective ability to serve customers wherever they operate is no longer a strategic advantage, but rather table stakes. Matching customers’ global footprint is paramount to growing and retaining market share. Additionally, to be competitive in a local market, chemical companies need to understand the local competition and market dynamics which often times requires a local presence. This necessity has also been driving chemical companies across the value chain to expand globally and in some cases, enter into new foreign markets.
Cross-border risks considerationsDespite the opportunities and potential for growth, cross-border M&A does not come without certain unique risks that executives need to thoroughly assess before undertaking a cross-border transaction. A few of the more common issues encountered are:
• Regulatory matters (such as licensing, labor, registration, property) that can lengthen both the deal process, as well as the synergy capture period.
• Tax structuring and cash repatriation planning should be undertaken in advance of deal closing using foresight to select the most accommodating structure through which to service debt and execute the business strategy.
• Managing the exposure to foreign currency, as such exposure can have an unexpected impact on post-closing margins and income.
As the global economy continues to become more and more borderless, global chemical companies both large and small will need to further explore opportunities in new foreign markets to stay competitive and achieve growth. Successfully completing and integrating complex global acquisitions requires knowledge and experience of the unique risks and operating norms in the local markets. This usually requires involving management throughout the organization with this knowledge and experience in the deal process and enlisting professional advisors with deep technical knowledge, but also global reach and breadth to serve the needs of chemical companies anywhere in the world. Expect another strong year of cross-border transactions in 2015, albeit it would be challenging to match the cross-border transaction value generated during 2014.

4
Shareholder activists and private equity investors
Shareholder activists and private equity investors expected to continue to play key roles in driving chemical industry M&A activity in 2015Shareholder activists have taken an avid interest in the global chemical industry with results indicating a high level of divestiture activity after their involvement.7 Shareholder activists have invested in over a dozen chemical companies and clamored for change in areas such as corporate leadership and business portfolio adjustment.8 While it is difficult to differentiate a change in portfolio management by reviewing divestitures pre- and post-activist investor investment, it is easier to see that the companies in which activists invested have experienced change. Companies have been sold, many board seats have changed, and many activists have shared a perspective on adjusting the business portfolio. Although this is at present a predominantly U.S. situation as only a few European chemical companies have activist investors, it is likely that more U.S. and international hedge funds may in the future take an increasing role in European chemical companies.9
7 DTTL Global Manufacturing Industry group observation, December 2014.
8 Ibid.
9 Ibid.
Private equity investors have also continued to remain a relevant element of the chemical M&A market. They have contributed a relatively stable volume over the past few years sponsoring roughly 10 percent of the transaction volumes each year (see Figure 3).10 With debt availability plentiful and interest rates low, it is expected that the 2015 volumes will continue at a steady pace in relationship to the overall industry M&A activity.
10 DTTL Global Manufacturing Industry group analysis of data from S&P Capital IQ, January 2015. Data is from the time period of 1 January 2009 to 31 December 2014.
Figure 3: Global chemical mergers and acquisitions activity—private equity buyers (2009 to 2014)
2009 2010 2011 2012 2013 2014
Volume (number of transactions) 33 44 61 71 58 59
Value (US$ billions) 4.3 3.9 8.7 9.8 3.8 9.4
Source: DTTL’s Global Manufacturing Industry group analysis of data from S&P Capital IQ, January 2015. Data is from 1 January 2009 to 31 December 2014.
-
2.0
4.0
6.0
8.0
10.0
12.0
-
10
20
30
40
50
60
70
80
2009 2010 2011 2012 2013 2014
Valu
e (US$
bB
illion
s)
Vo
lum
e (N
um
ber
of
tran
sact
ion
s)
Volume (Number of transactions) Value (US$ billion)
Year

2015 Global chemical industry mergers and acquisitions outlook 5
M&A activity by chemical segment
Global M&A volume (the number of transactions) increased in every chemicals segment in 2014 compared with 2013, with the exception of industrial gases, which was basically flat year-over-year. This section explores M&A activity in each of the chemicals segments (designated by the target’s segment) and highlights recent transactions.
Commodities—Will continue to lead M&A activityAfter two consecutive years of volume decreases in 2012 and 2013, the commodity segment finally saw an increase in M&A volume in 2014 (see Figure 4). However, the segment deal volumes experienced the lowest percentage increase compared to the other two major chemical segments and experienced the lowest percentage increase compared to all chemical segments in terms of value. The lower growth rates are likely in part due to the dominant position that commodities M&A has within the overall chemical industry M&A activity. Significant 2014 transactions in the segment include INEOS’s US$2.6 billion acquisition of the remaining 50 percent portion of Styrolution and Flint Hills Resources’ US$2.1 billion acquisition of PetroLogistics.11 In 2015, it is likely that commodity chemical M&A activity will increase further due to continuing corporate realignment and as portfolio rationalization moves. Additionally, some leading chemical players are shifting their focus from providing commodity chemicals to developing solutions.12 However, it is expected that the volume growth rate in commodity M&A will continue to lag behind the intermediates and specialty materials chemicals, and fertilizer and agricultural segments as the tailwinds of sustainability and providing food to a growing population will continue to propel activity in these sectors.13
11 INEOS, “INEOS to acquire BASF’s share in Styrolution,” 30 June 2014, http://www.ineos.com/news/ineos-group/ineos-to-acquire-basfs-share-in-styrolution/?business=INEOS+Group; and Flint Hill Resources, “PetroLogistics LP agrees to be acquired by Flint Hills Resources, LLC,” 28 May 2014, http://ir.petrologistics.com/phoenix.zhtml?c=247151&p=irol-newsArticle&ID=1934869.
12 DTTL Global Manufacturing Industry group observation, December 2014.
13 Ibid.
Intermediates and specialty materials—M&A will further rebound Portfolio realignment was an underlying theme for intermediates and specialty materials M&A during 2014, as volumes increased by 20.5 percent in 2014 over 2013 levels (see Figure 4). Though still a little shy of the post-recession peaks in 2011 and 2012, the segment gained momentum through deals such as Albemarle Corporation’s acquisition
Figure 4: Global chemicals mergers and acquisitions activity—by target segment (2009 to 2014)
2009 2010 2011 2012 2013 2014
Commodities 301 356 376 350 340 383
Intermediates and specialty materials
113 145 174 171 132 159
Fertilizers and agricultural chemicals
26 64 69 66 43 67
Industrial gases 4 9 12 14 16 15
Diversified 6 5 15 8 6 11
Total 450 579 646 609 537 635
Source: DTTL’s Global Manufacturing Industry group analysis of data from S&P Capital IQ, January 2015. Data is from 1 January 2009 to 31 December 2014.
-
50
100
150
200
250
300
350
400
450
Commodities Intermediatesand specialty
materials
Fertilizers andagriculturalchemicals
Industrial gases Diversified
Vo
lum
e (N
um
ber
of
tran
sact
ion
s)
2009 2010 2011 2012 2013 2014
Target segment

6
of Rockwood, PPG Industries’ acquisition of Consorcio Comex, and Arkema’s announced acquisition of Bostik.14 Another trend driving M&A in the segment is the focus on biotechnology and renewables. Many manufacturers are exploring the possibilities when biotechnology is applied to their respective industrial processes and manufacturing processes. This demand for biotechnology solutions is driving portfolio realignment and many specialty chemical and material companies to further evaluate their product portfolio and fill any gaps through M&A and joint venture activity. It is likely these trends will continue in 2015 with transaction volumes at or above the levels obtained in 2011 and 2012.15
14 Albemarle Corporation, “Albemarle and Rockwood announce merger to create a premier specialty chemicals company,” 15 July 2014, http://investors.albemarle.com/phoenix.zhtml?c=117031&p=irol-newsArticle&ID=1947397; PPG Industries, “PPG completes acquisition of Comex,” 5 November 2014, http://corporate.ppg.com/Media/Newsroom/2014/PPG-completes-acquisition-of-Comex; and Arkema “Proposed acquisition of Bostik: Arkema strengthens its position in specialty chemicals,”19 September 2014, http://www.arkema.com/en/media/news/news-details/Proposed-acquisition-of-Bostik-Arkema-strengthens-its-position-in-specialty-chemicals/.
15 DTTL Global Manufacturing Industry group observation, December 2014.
Fertilizers and agriculture chemicals—Deal activity will reach new highsGlobal megatrends of global population growth and a rising middle class in the developing world have increased the need for agricultural productivity and food availability and continue to foster growing M&A activity in the segment. Fertilizers (e.g. ammonia, urea, potash) continue to be more commoditized with company’s performance being impacted by feedstock prices, primarily fossil fuel prices. M&A in fertilizers has primarily been driven by companies seeking operational synergies, further production scale, access to low-priced feedstocks, and wider distribution. Alternatively, companies within agricultural chemicals and crop sciences have been focused on providing more holistic solutions to producers and bringing new innovative products, such as agricultural biologics, to combat increasingly resistant weeds and insects. M&A in agricultural chemicals and crop sciences has been driven by companies filling gaps within their holistic solutions and acquiring new innovative technologies.
Significant deals in the fertilizer and agricultural chemicals segment include Platform Specialty Product Corporation’s US$3.51 billion pending acquisition of Arysta, and FMC’s pending US$1.8 billion acquisition of Cheminova.16
16 Platform Specialty Product Corporation, “Platform Specialty Products Corporation signs definitive agreement to acquire Arysta LifeScience Limited for approximately $3.51 billion,” 20 October 2014, http://ir.platformspecialtyproducts.com/releasedetail.cfm?releaseid=876926; and Bloomberg, “FMC buys Cheminova for $1.8 billion and revises breakup,” 8 September 2014, http://www.bloomberg.com/news/2014-09-08/fmc-to-buy-cheminova-for-1-8-billion-as-ceo-modifies-strategy.html.
Additionally, the potential mega deal between CF Industries and Yara International never reached fruition.17 While lower agricultural commodity prices present challenges to segment players, it is likely that the fertilizer and agricultural chemical segment may see the highest growth in M&A activity in 2015 compared to other segments. Additionally, further merger discussions between large players in the segment may result in M&A activity that could significantly alter the market landscape.18
17 Wall Street Journal, “CF Industries, Yara terminate merger talks,” 17 October 2014, http://www.wsj.com/articles/cf-industries-yara-terminate-merger-talks-1413498210.
18 DTTL Global Manufacturing Industry group observation, December 2014.
Industrial gases—Continued M&A market development expectedA recovering global economy, ever-growing population, and increasing industrialization in emerging countries is driving growth in the industrial gases market and attracting M&A activity. Furthermore, investor excitement regarding the potential of a hydrogen economy may drive M&A activity throughout the hydrogen and fuel cell production value chain. Additionally, the increasing scale of gas investments required for some liquid natural gas and integrated petrochemical complexes often requires larger global players. Though still a minor M&A participant, continued growth in M&A activity in this segment is expected in 2015.
Diversified—Expected to have flat volume levelsThough diversified chemical company deals tend to be larger in terms of purchase price, deal volumes in 2015 are expected to mimic prior years. Given the scale of most diversified players, it is unlikely that material variations from past activity levels will arise in 2015.

2015 Global chemical industry mergers and acquisitions outlook 7
Chemical M&A activity in key markets
United States—Portfolio realignment and shale gas drive investment M&A activity in the U.S. increased in 2014, in terms of both volume and value (see Figure 5).19 Sellers in the U.S. benefited from a combination of strong financial markets, favorable credit, and plentiful financing to drive deal volume and higher values.20 Chemical makers in the U.S. continue to realize a global strategic advantage from low-cost shale feedstock, however, the recent decreases in global oil prices could soften or eliminate much of this historical feedstock advantage.21 The recovering U.S. economy, combined with the operational cost benefits from shale feedstock have improved the profitability and balance sheets of many U.S. chemical companies and has led them to refocus their strategic plans in order to further leverage their advantaged feedstocks.22
19 DTTL Global Manufacturing Industry group analysis of data from S&P Capital IQ, December 2014. The data is from 1 January 2009 to 31 December 2014.
20 DTTL Global Manufacturing Industry group observation, December 2014.
21 DTTL Global Manufacturing Industry group observation, December 2014; and CNBC, “Crude settles at $50.04 per barrel, lowest since April 2009,” 6 January 2015, http://www.cnbc.com/id/102308102.
22 DTTL Global Manufacturing Industry group observation, December 2014.
As was the case in 2013, some chemical companies are now focused on portfolio realignment and divesting non-core operations. For example, Chemtura Corporation, The Dow Chemical Company, DuPont, and Ashland Inc. all made significant global portfolio adjustments.23 The move towards divesting non-core operations has been driven by management and corporate boards, and in some cases activist investors with a goal of delivering more value to shareholders, as well as creating a more strategically focused company. As noted earlier, this is potentially creating a more fragmented industry, offering additional investment opportunities for private equity investors, as well as supporting cross-border investment.24
23 Chemtura, “Chemtura announces agreement to sell agrochemicals business to Platform Specialty Products for approximately $1 billion,” 14 April 2014, http://investor.chemtura.com/releasedetail.cfm?releaseid=840757; Forbes, “Dow Chemical further extends divestiture plan to boost profitability,” 14 November 2014, http://www.forbes.com/sites/greatspeculations/2014/11/14/dow-chemical-further-extends-divestiture-plan-to-boost-profitability/; Business Wire, “Divestiture of the former DuPont European PVB film business,” 17 October 2014, http://www.businesswire.com/news/home/20141017005883/en/Divestiture-DuPont-European-PVB-Film-Business#.VKuoXP_wuM8; and Ashland, Inc, “Ashland Inc. signs definitive agreement to sell Ashland Water Technologies to Clayton, Dubilier & Rice for approximately $1.8 billion,” 18 February 2014, http://investor.ashland.com/releasedetail.cfm?releaseid=826273.
24 DTTL Global Manufacturing Industry group observation, December 2014.
Figure 5: Global chemical mergers and acquisitions activity—by target country (2009 to 2014)
)
2009 2010 2011 2012 2013 2014
United States (U.S.) 167 165 197 204 160 206
Germany 28 37 28 44 37 44
United Kingdom (UK) 30 35 29 37 27 35
China 26 57 50 50 48 70
Japan 14 11 20 15 14 15
Brazil 3 12 18 23 15 12
India 15 17 27 10 20 17
Other 167 245 277 226 216 236
Total 450 579 646 609 537 635
Source: DTTL’s Global Manufacturing Industry group analysis of data from S&P Capital IQ, January 2015. Data is from 1 January 2009 to 31 December 2014.
-
50
100
150
200
250
UnitedStates(U.S.)
Germany UnitedKingdom
(UK)
China Japan Brazil IndiaVo
lum
e N
um
ber
of
tran
sact
ion
s
2009 2010 2011 2012 2013 2014
Target country

8
Other chemical players are pursuing market-differentiated products through acquisitions to become more focused intermediates and specialty materials chemical companies that provide solutions to address unmet market needs. Larger deals included Eastman Chemical Company’s pending US$2.8 billion acquisition of Taminco Corporation, and Albemarle Corporation’s agreement acquisition of Rockwood Holdings, Inc. in a cash and stock transaction valued at approximately US$7.6 billion.25
25 WN.com, “Eastman completes acquisition of Taminco,” 5 December 2014, http://article.wn.com/view/2014/12/05/2014_Dec_05_Eastman_Completes_Acquisition_of_Taminco_Eastman/; and Albemarle Corporation, “Albemarle and Rockwood announce merger to create a premier specialty chemicals company,” 15 July 2014, http://investors.albemarle.com/phoenix.zhtml?c=117031&p=irol-newsArticle&ID=1947397.
The strong M&A activity in 2014 within the U.S. is likely to continue into 2015. The availability of credit may help facilitate acquisitions and drive overall U.S. deal volume and value as it did in 2014. The high level of available private equity funds and strong acquisition appetite is expected to continue in 2015 as many private equity groups remain focused and active in U.S. chemicals. However, the strong performance of U.S. equity markets in 2014 and the appreciation of the U.S. dollar could impact the attractiveness and affordability of American assets to potential foreign buyers. Despite this, M&A in 2015 is expected to continue the trend of portfolio pruning through divesting non-core operations. Intermediates and specialty materials chemical companies remain focused on expanding their portfolio of differentiated, market-leading products and should continue to look to fill out their product portfolio through focused acquisitions.
Germany—Restructuring to grow After the global economic crisis, global German chemical companies have relied less on large scale M&A plays. M&A activities were generally limited to smaller and medium sized transactions related to ongoing portfolio realignment
and related optimizations, while growth was primarily captured through organic initiatives. One exception to this trend in 2014 was Merck KGaA’s announced US$17.4 billion acquisition of Sigma Aldrich.26
26 Merck KGaA, “Acquisition of Sigma-Aldrich,” accessed on 8 January 2015, http://www.emdgroup.com/emd/media/topics/001.html.
Since mid-2014, many larger chemical companies implemented new organizational structures to improve processes to meet their customers’ ever-changing needs and tactics to become more nimble in the market. For example, Bayer MaterialScience which Bayer intends to float on the stock market as a separate company.27 Others include the transformation processes at Evonik and Lanxess to optimize organizational structures and consolidate business units with a focus on cost efficiency and flexibility.28
27 Pittsburgh Business Times, “Bayer to spin off MaterialScience division, focus on health care,” 18 September 2014, http://www.bizjournals.com/pittsburgh/blog/morning-edition/2014/09/bayer-to-spin-off-materialscience-division-focus.html.
28 Evonik, “Evonik’s corporate strategy,” accessed on 6 January 2015, http://corporate.evonik.com/en/investor-relations/company/strategy/pages/default.aspx; and Lanxess, “Our strategy,” accessed on 6 January 2015, http://lanxess.com/en/corporate/corporate-responsibility/cr-responsibility/our-strategy-sustainability/.
Higher competition, globalization, and specific regulatory trends in Germany, such as the significant increase in energy prices over the last several years, in part a result of German regulations,29 are expected to trigger further requirements by companies to capture efficiencies through portfolio realignment. This will likely contribute to higher M&A activity in the near future. Although Germany had an active M&A market in 2014, it is unclear to which extent such internal restructuring activities will create the impetus for M&A activities in 2015.
29 WSJ.com, “Germany’s expensive gamble on renewable energy,” 26 August 2014, http://www.wsj.com/articles/germanys-expensive-gamble-on-renewable-energy-1409106602.
Since new organizational structures have been implemented at some of the significant market players, this will likely positively impact the M&A market in the near term, and also may drive further transactions in the chemical industry. The majority of which are expected to include cross-border elements.
2015 Global chemical industry mergers and acquisitions outlook 9
United Kingdom (UK)—Economic improvement underpins activityThroughout 2014, the UK experienced steady levels of M&A activity. This is largely attributed to the strong economic recovery and improving outlook, together with the continuing capital market performance and healthy pipeline which is strengthening optimism. Deal volume has been primarily focused on small to mid-sized businesses, with the majority of transactions in the £50-100m range.30
30 Experian, Deal Review, and League Tables Q1 2014, accessed on 6 January 2015, http://www.experian.co.uk/assets/consumer-information/white-papers/corpfin/cf-advisor-league-tables-uk-regions-q1-2014.pdf.
Private UK businesses continue to attract international buyers looking to acquire technologies, market position, and product expertise with acquirers hailing from Europe, the U.S., and further afield. Larger notable transactions during 2014 included Merck KGaA’s completion of its acquisition of AZ Electronics in May 2014, Innovia Films being acquired by Fairfield (announced in April 2014), and the acquisition of Farrow & Ball by Ares Management in December 2014.31
31 Merck KGaA, “Merck completes acquisition of AZ Electronic Materials,” 2 May 2014, http://www.emdgroup.com/emd/media/extNewsDetail.html?newsId=26AF6017AC6A49F8C1257CCC005C6806&newsType=1; Innovia Films, “Innovia Group ownership,” 28 April 2014, http://www.innoviafilms.com/News---Events/News/Innovia-Group-Ownership.aspx; and Nasdaq, “Ares Management Private Equity Fund to acquire Farrow & Ball,” 1 December 2014, http://www.nasdaq.com/press-release/ares-management-private-equity-fund-to-acquire-farrow--ball-20141201-00339#ixzz3O2CY1YxJ.
Larger UK chemical companies continue to look for acquisitions focusing on technology-led buys, portfolio enhancements, and resource plays. INEOS has been particularly active during 2014 announcing its potential PVC joint venture with Solvay, subsequent divestment of European Commission remedy assets, and its investment into UK shale gas plays.32
32 INEOS, “Solvay and INEOS join forces to create a world-class PVC producer,” 7 May 2013, http://www.ineos.com/news/shared-news/ineos-and-solvay-join-forces/; INEOS, “European Commission clears proposed Solvay/INEOS joint venture,” 8 May 2014, http://www.ineos.com/news/ineos-group/european-commission-clears-proposed-solvay-ineos-joint-venture-/; and BBC, “Ineos to invest £640m in U.K. shale gas exploration,” 20 November 2014, http://www.bbc.com/news/business-30125028.
Looking ahead, deal flow momentum is expected to increase in 2015, with anticipated increased involvement by both private equity investors and larger private/public companies looking for acquisitions.
China—Growth in intermediates and specialty materials and agrochemical M&A anticipated In line with past years, China’s domestic M&A activity accounted for nearly three times inbound M&A in terms of total disclosed deal values in 2014 from US$10 billion versus US$3.5 billion in 2013.33 Petrochemicals, agrochemicals, and fibers were the dominant sectors for M&A activity in China during 2014.34
33 Deloitte China’s analysis of data from Mergermarket, accessed in December 2014.
34 Ibid.
Cross-border inbound M&A activity in China has primarily been focused on intermediates and specialty materials and agrochemicals. Among the major challenges for inbound M&A activity include regulatory restrictions on cross-border deals and ongoing difficulty for foreign buyers to find suitable targets. From an application perspective in China, investors are looking for growth opportunities that drive solutions for the megatrends such as mobility, health, and a growing middle class.
State-owned enterprises have focused their outbound M&A strategies on smaller size targets that bring a technology and/or application leadership edge including targets, such as laboratories that provide testing and

10
contracted research services. This trend can be observed across the coating and adhesives, food additives, and water treatment sub-sectors.35
35 Ibid.
In 2015, China is likely to continue to see M&A focus on the intermediate specialties and materials segments and related downstream applications including the formulation of fine chemicals and compounding of polymers. Additionally, following China’s rising output of feedstock and crops, buyers are expected to be very active in agrochemicals.
Japan—Consolidation to drive growth in commodity M&AIn Japan, chemical M&A activity has been robust, especially in cross-border deals. Fine and life science chemicals have been especially favorable for Japanese dealmakers.36 This the result of companies transforming their businesses towards higher margin sectors and diversifying from lower margins in commodity chemical products. This trend is likely to continue in the coming year. Cross-border transactions, especially in fine chemicals and life science segments is expected to remain at a high level in 2015.
36 Deloitte Japan’s analysis of data from Mergermarket, accessed in December 2014.
Commodity chemicals in Japan have been challenged by a number of trends. First, lowered domestic demand due to an exodus of production locations and a declining population. Secondly, the inflow of shale-borne chemical products into Asia. Finally, the self-sufficiency of coal and chemical plants newly constructed in China. However, the Japanese Ministry of Economy, Trade, and Industry is drafting a guideline to promote consolidation to increase
competitiveness in commodity chemical production (i.e. petrochemicals).37 With this support, Japanese commodity M&A deals, including domestic transactions, is likely to see growth in the near future.
37 ICIS, “Returning to a positive trend,” 27 October 2014, http://www.icis.com/resources/news/2014/10/27/9831804/returning-to-a-positive-trend/.
Brazil—Consolidation needed in an uncertain economyIn Brazil, the chemical industry shows a growing deficit on its trade balance as imports of chemical products exceeded exports by more than US$30 billion.38 This scenario, combined with the uncertainties related to the expected economic moves of the newly re-elected president to accelerate production growth in Brazil and make the local market more competitive, brings some uncertainty to the sector.39
38 Export.gov, “Chemicals,” 4 September 2014, http://www.export.gov/brazil/static/Chap4_Chemicals_Latest_eg_br_078152.pdf.
39 Bloomberg, “Rousseff deepens Brazil power cost cuts as inflation accelerates,” 23 January 2013, http://www.bloomberg.com/news/2013-01-23/rousseff-says-brazil-power-cost-cuts-to-be-bigger-sooner-1-.html.
Even considering the uncertain scenario above, M&A is still alive in the Brazilian chemical industry with acquisitions by both Braskem and Yara while others still in the initial stages and expected to advance in the next months.40 Joint ventures are being formed, such as the asphalt distribution venture formed by Greca, Betunel, and Centro Oeste.41 These consolidation processes are primarily based on the realignment of product portfolios. Also, they appear to be based on cost rationalization in order to make the operations more profitable by capturing synergies and economies of scale to offset overall economic weakness.42
40 Braskem, “Braskem records net revenue of R$41 billion in 2013,” 17 February 2014, http://www.braskem.com/site.aspx/Releases-Details-USA/Braskem-records-net-revenue-of-R41-billion-2013; and Yara International, “Yara completes acquisition of majority position in Galvani, Brazil,” 1 December 2014, http://www.yara.com/media/press_releases/1875735/press_release/201412/yara-completes-acquisition-of-majority-position-in-galvani-brazil.
41 Cypress Associates, “Antitrust watchdog greenlights creation of asphalt giant,” 7 November 2014, http://www.cypressassociates.com.br/eng/?p=19257.
42 Deloitte Brazil observation, December 2014.
It is expected that 2015 will be an exciting year in Brazil underlined by a high level of economic uncertainty and that chemical M&A market activity is likely to continue at a mild pace.

2015 Global chemical industry mergers and acquisitions outlook 11
India—Gross domestic product (GDP) growth continues to drive chemical M&A The Indian chemical industry is poised for strong growth with a potential to grow at 15 percent and reach US$290 billion by 2017 as India is expected to comprise almost 6 percent of the global chemical industry.43 The growth is propelled to some extent through increased activity in cross-border M&A and domestic industry consolidation.
43 Government of India, Planning Commission, Indian Chemical Industry, 2012–2017, accessed in December 2014, http://planningcommission.gov.in/aboutus/committee/wrkgrp12/wg_chem0203.pdf.
Significant M&A activity is occurring in commodity chemicals, intermediates and specialty materials chemicals, agrochemicals, and biotechnology including a strong element of cross-border deals. Chemical sector deals accounted for 4.4 percent of the total foreign direct investment (FDI) equity inflows in the country in 2014.44
44 Government of India, Department of Industrial Policy & Promotion, “Fact sheet on foreign direct investment (FDII), From April 2000 to August 2014”, accessed in December 2014, http://dipp.nic.in/English/Publications/FDI_Statistics/2014/india_FDI_August2014.pdf.
The Indian chemical industry outlook for 2015 appears promising as the country’s GDP is projected to grow at 6.4 percent in 2015 as compared to 5.6 percent (2014), 5 percent (2013), and 4.7 percent (2012) respectively.45 With a newly elected government holding a clear majority, the promotion of special regions like Petroleum, Chemicals, and Petrochemical Investment Regions (PCPIR), liberalized foreign direct investment policies, and increasing per capita consumption, the chemical industry is likely to demonstrate significant growth and increased cross-border and domestic M&A activities.46
45 International Monetary Fund, World Economic Outlook, October 2014, http://www.imf.org/external/pubs/ft/weo/2014/02/pdf/c1.pdf.
46 Government of India, Ministry of Statistics and Programme Implementation, “Key Indicators of Household Consumer Expenditure in India, 2011–12,” 20 June 2013, http://mospi.nic.in/Mospi_New/upload/press-release-68th-HCE.pdf; and Government of India, Ministry of Chemicals and Fertilisers, “Policy Resolution for Promotion of Petroleum, Chemicals and Petrochemical Investment Regions (PCPIRs),” accessed on 14 January 2015, http://chemicals.nic.in/PCPIRPolicy.pdf.

12
Impact of cheaper oil
Before concluding this 2015 outlook, it is worth taking note of the significant drop in oil prices (recently falling below US$50 a barrel in January 2015, see Figure 6) and the potential impact this could have on M&A activity.47 There may be a few changes in the M&A marketplace as a result, assuming that in the minds of chemical executives this is other than a short term price decline. First, petrochemical M&A deals in process may face delays as sellers try to capture the additional value that lower feedstock prices afford their margins before pricing aligns with costs. The drop in oil prices has given rise to fact that the correlation between oil prices and chemicals pricing is still evolving. Buyers on the other hand may likely be reluctant to change their investment models to model this pricing as the “new normal.” Secondly, this scenario may prompt oil producers to go further downstream in the value chain to recapture lost margins, potentially stimulating a vertical integration move in the industry. Additionally, if cheap oil serves to increase chemical company stock valuations, there may be an increase in its use as deal currency in “stock for stock” deals. Finally, if oil prices remain depressed, capital expenditures related to the fracking industry may slow, and M&A activity related to fracking may slump as players reevaluate future prospects. In conclusion, the uncertainty around oil pricing is likely not stimulating additional deals as uncertainty is generally a hurdle for robust M&A activity. Nevertheless, chemical companies will want to closely monitor oil price developments and understand how it impacts the profitability of potential acquisition targets.
47 Morning Vertical, “The price of Brent Crude has fallen to its lowest at $55 per barrel,” 5 January 2015, http://www.morningvertical.com/the-price-of-brent-crude-has-fallen-to-its-lowest-at-55-per-barrel/245443/.
Figure 6: Oil and natural gas prices (2014)
Note: Btu=British thermal unit
Source: DTTL Global Manufacturing Industry group analysis of data from the U.S. Energy Information Administration, accessed in January 2015.
$2
$3
$4
$5
$6
$7
$8
$9
$40
$50
$60
$70
$80
$90
$100
$110
$120
Nat
ura
l gas
(U
S$ p
er m
illio
n B
tu)
Oil
(US$
per
bar
rel)
Cushing, Oklahoma West Texas Intermediate spot price free on board (FOB)
Henry Hub natural gas spot price
Month 2014

2015 Global chemical industry mergers and acquisitions outlook 13
Summary outlook for 2015 M&A activity
With the tailwinds of a liquid debt market, low interest rates, and strong economic prospects in select economies, 2015 looks to be a strong year for chemical companies and private equity investors to capture value and execute their strategies through M&A. So, what could challenge the current M&A momentum? In the absence of a large negative global event, a few other developments may have a negative impact on a robust chemical M&A market in 2015. In the U.S., the Office of the Comptroller of Currency has begun to take notice of the lofty earnings before interest, taxes, depreciation, and amortization (EBITDA) lending multiples in the market and have begun to cause larger banks to back away from some of the most highly leveraged deals, potentially dampening some divestiture planning.48 Also, spin offs rather than dispositions may
reduce the amount of portfolio realignment resolved through M&A. Companies such as Bayer and DuPont have already announced spin offs of businesses to shareholders rather than via M&A transactions.49 As consolidation continues and chemical players realign their portfolios, additional scrutiny from competition and other regulatory authorities could impact deals. However, dealmakers have, for the most part, demonstrated their ability to address regulators’ concerns. Finally, recent economic developments out of the Japan, China, Brazil, and the Eurozone could call into question the strength of the world economy and ultimately could temper M&A activity in 2015.50 However, despite these potential disruptors to 2015, chemical M&A activity is expected to continue the momentum experienced in 2014.
48 U.S. Federal Government, Office of the Comptroller of the Currency, Semiannual Risk Perspective, Spring 2014, http://www.occ.gov/publications/publications-by-type/other-publications-reports/semiannual-risk-perspective/semiannual-risk-perspective-spring-2014.pdf.
49 Pittsburgh Business Times, “Bayer to spin off MaterialScience division, focus on health care,” 18 September 2014, http://www.bizjournals.com/pittsburgh/blog/morning-edition/2014/09/bayer-to-spin-off-materialscience-division-focus.html; and DuPont, “DuPont Announces Filing of Form 10 Registration Statement for Performance Chemicals Spinoff; ‘The Chemours Company’ Selected as Name of New Public Company,” 18 December 2014, http://investors.dupont.com/investor-relations/investor-news/investor-news-details/2014/DuPont-Announces-Filing-of-Form-10-Registration-Statement-for-Performance-Chemicals-Spinoff-The-Chemours-Company-Selected-as-Name-of-New-Public-Company/default.aspx.
50 Deloitte University Press, Global Economic Outlook, Q4 2014, accessed 9 January 2015, http://dupress.com/periodical/global-economic-outlook/q4-2014/?per=6218.

14
Contacts
Global
Dan SchwellerGlobal M&A Leader, Manufacturing Deloitte Touche Tohmatsu Limited [email protected]+1 312 486 2783
Duane DicksonGlobal Chemicals Sector Leader Deloitte Touche Tohmatsu Limited [email protected]
+1 203 905 2633
Asia Pacific
Yann CohenAsia/China Chemical Consulting Leader Deloitte [email protected]+86 212 312 7460
Mike BraunPartner Deloitte China [email protected]+86 21 61411605
U.S.
Philip HueberSenior Manager Deloitte United States (Deloitte & Touche LLP) [email protected]+1 312 486 5791
Rob LedfordSenior Vice PresidentDeloitte Corporate Finance LLC [email protected]+1 404 631 2073
UK
Mark J. AdamsPartner, Corporate FinanceDeloitte United Kingdom and Switzerland [email protected]+44 207 007 3624
Ross JamesPartner, Corporate Finance Deloitte United Kingdom and [email protected]+44 207 007 8192
Thomas FrankumDirector, Corporate FinanceDeloitte United Kingdom and Switzerland [email protected]+44 20 7303 6636

2015 Global chemical industry mergers and acquisitions outlook 15
Germany
Joerg NiemeyerPartnerDeloitte [email protected]+4921187723668
Christoph SohnDirectorDeloitte Germany [email protected]+4921187723566
India
Savan GodiawalaSenior Director, Corporate FinanceDeloitte India [email protected]+91 (79) 6607 3200
Japan
Yasutoki IshiguroChemicals Sector LeaderDeloitte [email protected]+818013880978
Brazil
Marcio Braga AndradeDirectorDeloitte [email protected]+55 11 5186 1828

16
Acknowledgements
The following are sincerely recognized for their tremendous contributions to the outlook including Dan Schweller, DTTL Global Manufacturing Industry group, and Phil Hueber, Deloitte United States (Deloitte & Touche LLP).
Additionally, with strong gratitude the following are acknowledged for their input to the document including Rob Ledford from Deloitte Corporate Finance LLC; John Forster from Deloitte United States (Deloitte Services LP); Yann Cohen and Mike Braun from Deloitte China; Mark J Adams, Ross James, and Thomas Frankum from Deloitte UK and Switzerland; Joerg Niemeyer and Christoph Sohn from Deloitte Germany; Yasutoki Ishiguro from Deloitte Japan; Marcio Braga Andrade from Deloitte Brazil; and Savan Godiawala from Deloitte India.
Finally, special thanks to Duane Dickson, Tim Hanley, Mimi Lee, and Jennifer McHugh from the DTTL Global Manufacturing Industry group, as well as Jim Guill from Deloitte United States (Deloitte Services LP).

This page has been intentionally left blank

About DeloitteDeloitte refers to one or more of Deloitte Touche Tohmatsu Limited, a UK private company limited by guarantee (“DTTL”), its network of member firms, and their related entities. DTTL and each of its member firms are legally separate and independent entities. DTTL (also referred to as “Deloitte Global”) does not provide services to clients. Please see www.deloitte.com/about for a more detailed description of DTTL and its member firms.
Deloitte provides audit, tax, consulting, and financial advisory services to public and private clients spanning multiple industries. With a globally connected network of member firms in more than 150 countries and territories, Deloitte brings world-class capabilities and high-quality service to clients, delivering the insights they need to address their most complex business challenges. Deloitte’s more than 200,000 professionals are committed to becoming the standard of excellence.
DTTL Global Manufacturing Industry groupThe DTTL Global Manufacturing Industry group is comprised of around 2,000 member firm partners and over 13,000 industry professionals in over 45 countries. The group’s deep industry knowledge, service line experience, and thought leadership allows them to solve complex business issues with member firm clients in every corner of the globe. Deloitte member firms attract, develop, and retain the very best professionals and instill a set of shared values centered on integrity, value to clients, and commitment to each other and strength from diversity. Deloitte member firms provide professional services to 78 percent of the manufacturing industry companies on the Fortune Global 500®. For more information about the Global Manufacturing Industry group, please visit www.deloitte.com/manufacturing.
DisclaimerThis communication contains general information only, and none of Deloitte Touche Tohmatsu Limited, its member firms, or their related entities (collectively, the “Deloitte Network”) is, by means of this communication, rendering professional advice or services. No entity in the Deloitte network shall be responsible for any loss whatsoever sustained by any person who relies on this communication.
© 2015. For more information, contact Deloitte Touche Tohmatsu Limited.