Embed Size (px)
Citation preview

2015 ANNUAL REPORT


TE’S DEUTSCH RUGGED CONNECTORS
WHEEL SPEEDSENSOR
HIGH-SPEED INPUT/OUTPUT CONNECTORS

THE CONNECTED WORLD
TE’s connectivity and sensor solutions are key enablers in our increasingly connected world. Smarter factories, connected vehicles, safer and more advanced medical devices, and data everywhere are underlying market trends creating significant opportunities for TE. Our dedication to innovation, focus on solutions for harsh environments, and commitment to delivering extraordinary customer experiences allows us to capitalize on these opportunities and more.
*Source: Gartner, “Gartner Says 6.4 Billion Connected
‘Things’ Will Be in Use in 2016, Up 30 Percent From 2015”
6.4 BILLION2016
CONNECTED THINGS*
BY 2020
20.8 BILLIONCONNECTED THINGS*
$170 BILLION *6% estimated annual market growth rate over the next 5 years
6%*
ANNUALLY
GROWING
Connectivity and Sensor Market

MESSAGE TO OUR STAKEHOLDERSThe trends making our connected world safer, greener, smarter, and more connected are driving greater demand for electronics and TE Connectivity’s leading connectivity and sensor solutions. Globally, this demand represents a $170 billion market opportunity for TE, with strong underlying growth drivers. As the world leader in connectivity and a leader in sensors, we are in a great position to capitalize on this significant and growing market opportunity.
It was a very good year for TE despite another year of global uncertainty. TE led our industry, with $12.2 billion in sales, up 4 percent on an organic basis, and up 10 percent on a constant currency basis. Adjusted earnings per share (EPS) of $3.60 were up 9 percent and up 19 percent on a constant currency basis. Adjusted operating margins exceeded 16 percent for the first time in our history, reflecting our strong portfolio mix and productivity improvements generated from our TE Operating Advantage (TEOA) business system.
We also continued our balanced and disciplined approach to capital allocation. We completed four acquisitions and returned $1.7 billion to our shareholders. We raised our dividend by 14 percent, making it the fifth consecutive year of double-digit dividend increase, and repurchased 18 million shares. Since 2007, we have reduced our outstanding share count by approximately 20 percent.
TOM
LY
NC
H, C
HA
IRM
AN
& C
EO

A World Leader in SensorsIn FY 2015, we established the company as a leading sensor supplier, with sales of approximately $750 million. With the acquisitions of Measurement Specialties and American Sensor Technologies, TE now has an unmatched range of technology in the sensor industry.
During the year, we won strategic programs across several industries. For example, TE’s sensors are designed into the next generation of thermostats to detect motion and are monitoring blood temperatures and patient safety during surgery. In our automotive business, we doubled our content opportunity in the vehicle, and leveraged our leadership position to win several new programs. And in our aerospace business, we won new customers and expanded existing relationships due to our leading sensors that measure pressure, load, and monitor flap positions in aircraft.
We expect above-market sales growth going forward, as we leverage our global leadership position across the markets we serve, our broad range of sensor technologies, and our deep industry and application expertise. Also, as customers demand more functionality in smaller packaging, we believe that integrated solutions leveraging our connector and sensor portfolios will be a competitive advantage and a significant opportunity for TE.
Delivering Extraordinary Customer Experiences
Delivering an Extraordinary Customer Experience (ECE) is our mission, and TEOA is a key driver of our performance to achieve that mission. Since its launch several years ago, TEOA enabled our industry leadership in innovation, quality, delivery, and service and support. TEOA efforts drive continuous improvements in safety, productivity, and financial performance throughout the company. Deeply entrenched across a l l businesses and functions, TEOA strengthens TE’s
A Strong PortfolioDuring Fiscal Year (FY) 2015, we continued the consistent execution of our strategy to strengthen our position as the world leader in connectivity and establish a leadership position in sensors. We strengthened our connectivity and sensor portfolio with four acquisitions and the $3 billion divestiture of the Broadband Network Solutions (BNS) business. As a result, we established TE as a leader in the very attractive sensors market and expanded our position in harsh environment applications. Today, over 90 percent of our sales are focused on connectivity and sensor solutions, and 80 percent of our portfolio addresses harsh environment applications, a 40 percent increase over five years.
The Industry Leader in Harsh Environments
TE is the industry leader in harsh environment applications – applications that cannot fail even under the most extreme conditions. For example, in our medical business, our products are used in life saving procedures and improve patient outcomes. Our customers rely on our engineering depth, breadth of high-quality products, and unique ability to work side-by-side during the design process to develop their next generation of products for these critical applications.
During the year we expanded our position in harsh environment applications with a deep pipeline of design wins across our portfolio, most notably in our automotive business. In our medical business, which is part of our Industrial Solutions segment, we broadened our business through the acquisition of AdvancedCath, giving TE an even larger position in the medical device market in the growing minimally invasive catheter applications.
90% CONNECTIVITY AND SENSOR SOLUTIONS
SALES

competitive advantage with customers as we improve on-time delivery and speed-to-market.
Innovating for Our Customers
Innovation is a TE core value, and FY 2015 was another year of progress for TE and our customers. We received several awards in FY 2015, including the prestigious Thomson Reuters Top 100 Global Innovators award for the fifth consecutive year and Best Innovation Practices from a Multinational Company recognition from the Shanghai government. We also announced a partnership with Andretti Technologies, the technology incubation and advanced engineering business of Andretti Autosport, to develop and test new technologies that perform at greater speeds and promote clean energy and sustainability for the transportation and mobility industries. Finally, in its eighth and best year yet, TE’s annual engineer conference – TEchCon – brought together over 500 TE engineers to advance innovation globally. These advancements are important for our customers and our efforts to recruit the best new talent for TE.
Our Commitment to Inclusion and Diversity
TE’s Inclusion and Diversity program surfaces the best ideas and is a key strategic commitment across the company, and our support for inclusion and diversity expands to individuals at all levels in the company.
In FY 2015, we launched several investments and efforts to accelerate our progress and increase
the representation of women in leadership and engineering. We expanded TE’s Women’s Network globally, hosted a series of Women’s Leadership Forums around the world, kicked off a sponsorship program for women called “eXcel,” and co-founded a consortium effort to focus on early- to mid-career women’s development with the launch scheduled for early 2016.
Looking Forward
The underlying trends driving growth in our markets remain strong, even as markets ebb and flow. We believe these trends will continue for a very long time. The world continues to demand safer products, cleaner environments, greater energy efficiency, and smarter, more connected technology. TE has never been better positioned to capitalize on these trends. We have the world’s leading portfolio of connectivity and sensor solutions, are the clear leader in attractive harsh environment markets, and have the financial strength to make the investments to meet our customers’ needs.
These are very exciting times for TE. I want to thank our customers and shareholders for their continued support, and our employees for their commitment to our customers and the communities in which they live.
Tom Lynch
Chairman and Chief Executive Officer
See non-GAAP measures for descriptions and reconciliations
of Organic Sales Growth, Sales in Constant Currency, Adjusted
Operating Margin, Adjusted Earnings Per Share, and Adjusted
Earnings Per Share in Constant Currency.
“We continued the consistent execution
of our strategy to strengthen our position
as the world leader in connectivity and
establish a leadership position in sensors.”
Since 2010, the percentage of women in senior leadership roles has doubled.

TE
RR
EN
CE
CU
RT
IN, P
RE
SID
EN
T
The continued acceleration of connected things creates significant opportunities for our customers to grow their businesses, drive innovation, and remain competitive. In FY 2015, we broadened our product range to capture these opportunities by aggressively expanding our sensor portfolio and making acquisitions in high-growth markets such as Medical. Demand for TE content is rising with the increasing demand for innovation and connectivity in our end markets. Some examples:
In aerospace, the demand for inflight entertainment and avionics systems that enable passengers, aircrafts, and crew to be connected is growing. In addition, composite airframes to improve fuel efficiency have increased the requirement for innovative approaches to aircraft grounding systems. Combined, these advances increase the opportunity for TE content - including our weight- and space-saving sensors, high-speed connectors, and fiber optic solutions - on emerging platforms up to 25 percent.
In our automotive business, the expansion of our sensors product line has doubled our content
opportunity per car from $200 to almost $400 per vehicle. We expect the demand for TE content to continue to rise as automotive OEMs increase their production of smarter, more fuel efficient, and semi-autonomous vehicles in the future.
In today’s factory, TE products address approximately five percent of the content in the factory. As more factories transition into digitally smart environments, we expect our content opportunity to increase to 15 percent due to the need for advanced and flexible manufacturing systems, and the increased use of sensors in robots that will drive higher levels of connections.
We believe the market opportunity is significant for TE. We expect these opportunities, coupled with our technology leadership, will lead to above market growth as TE content per application increases in the end markets we serve.
Terrence Curtin
President
CONTENT GROWTH

13,500* PATENTS granted or pending
7,000+ ENGINEERS globally
$625M invested in R&D
and Engineering
FY 15
015 THOMSON REUTERS
GLOBAL INNOVATORS
INNOVATION LEADERSHIP
20
G
2015
BEST INNOVATION
PRACTICES FROM A
MULTINATIONAL COMPANYRecognition from the Shanghai government
ENGINEERING CLOSE TO OUR CUSTOMERS
* Excludes patent information for our Circuit Protection business unit
The success of our innovation culture has led to numerous recognitions. For the fifth consecutive year, Thomson Reuters named TE Connectivity as a top global innovator. This recognition confirms the value we provide to our customers — and boosts our capacity to attract and recruit the best new engineering talent.

250MRedefining convenience, re-engineering travel. The connected car is transforming how we experience daily travel. When equipped with TE’s connectivity and sensor solutions, automobiles are using TE’s advanced technology to enhance communication, safety, and performance – within the car, between vehicles, and to other devices and machines.
TE connectors and sensors are automating anti-lock brake systems (ABS) to optimize traction and steering control. For in-vehicle electronics, our solutions help detect and report potential mechanical failures before these occur and avoid accidents by detecting vehicle surroundings. TE’s innovations are enabling automobiles to transmit information outside of the vehicle – to the connected home – enabling entirely new conveniences to the consumer. TE’s commitment to lighter, smaller, and more efficient technology makes these conveniences possible while also improving fuel efficiency and lowering emissions.
*Gartner, “Predicts 2015: The Internet of Things”
4-6%
C
Connected vehicles on
the roadways by 2020*
TE content growth
per year as a result of
electronification
CONNE

1. Wheel Speed SensorsThese sensors monitor and send speed data to the engine control system and ABS, to improve ride, handling, and safety.
2. Press-fit TechnologyThis technique mechanically connects a terminal to a printed circuit board, eliminates the solder process and provides better mechanical and electrical performance in harsh environments. Our technique offers added capacity for interconnections even when space in the vehicle is limited.
3. Mechatronic SolutionsTE helps to integrate mechanical components and electrical hardware – including sensors – into a single unit. The result is reliable, versatile vehicle applications, including ABS and crash sensor assemblies.
TE products inside: ANTI-LOCK BRAKE SYSTEM (ABS)
1.
2.
3.
ECTED

Fast, precise, and safe. Inside the always-on smart factory, people and robots collaborate to transform assembly lines into self-monitoring, adaptive learning systems. When equipped with TE’s connectivity and sensor solutions, these systems can reliably and efficiently generate and transmit – in real-time, to other machines anywhere – data, power, and signal. The result is a new level of interoperability, capable of providing customized on-demand production, while reducing manufacturing costs.
In the factory, robots make factories smarter and more efficient. In a connected factory with sensors, robots can learn tasks and predict human behavior by copying – and repeating – human action. This leads to an infrastructure which can respond to changing production volumes and needs. TE solutions for the connected factory enable industrial machines to quickly leverage vast amounts of real-time production data to immediately adjust production, in ways that strategically achieve efficiency, output, quality, and cost improvements.
FACTORY
20%
15%
*International Federation of Robotics, “World Robotics: Industrial Robotics 2015”
Efficiency improvement
expected from smart
factories
Increase in robotics
installations expected
between 2016 and 2018*
CONNE

1. ARISO Contactless ConnectivityTraditional connectors require a physical connection to transfer power. TE’s hybrid ARISO interconnection system offers fast, wireless connectivity for power, data, and signal. With more than 360° in rotational freedom, ARISO reliably delivers power, data, and signal – in harsh environments and without disruptions from water, dust, or vibration. This enables customers to position connections without physical wires and in places not previously possible.
2. Heavy Duty Connectors (HDC)HDCs offer reliable performance in the most demanding and harshest environments. Configurable to meet any combination of power and signal connections that customers require, these connectors offer power, signal, and data transmission in one connector.
3. M8/M12 Connector SystemThis M8/M12 system safely and reliably enables secure, high-speed connections in mission-critical industrial machines, operating under the harshest conditions.
TE products inside: ROBOTIC ARM
1.
2.
3.
ECTED

MEDICALSmaller devices, minimizing risk, recovery, and cost. Custom-engineered, miniaturized medical devices are transforming healthcare. Equipped with pressure sensors and kink-resistant braids, TE’s high-performance solutions for single-use catheters enable surgeons to accurately perform complex and life-saving procedures – such as replacing heart valves – with minimally invasive techniques. For patients, this means less trauma, shorter recovery time, and less risk of infection. For healthcare facilities, the result is lower operating costs and better performance in delivering critical patient services.
When an integrated catheter is engineered end-to-end by a single source, healthcare providers can seamlessly capture, record, and process critical patient data. With TE’s customized, end-to-end medical-device solutions, physicians can perform complex procedures with greater ease, speed, and precision – at a lower cost.
0.0015"
7%
CONNE
Wall thickness of TE’s
tubing for cardiovascular
applications
Market growth rate
of minimally invasive
procedures due to
increased access and
affordability

1. Custom-Calibrated SensorsFor any point in the body, from concept to production, TE custom sensors are manufactured to exact specifications. In catheters, this technology improves therapy precision and accuracy in small areas, enabling surgeons to perform complex procedures with minimally invasive techniques.
2. Custom-Manufactured Catheters and GuidewiresTE catheters and guidewires are developed using advanced technology to meet customers’ tight tolerances for a number of mechanical properties. Available in a variety of materials, our custom catheters and guidewires offer multiple tip configurations to meet extremely precise performance criteria. These enable life-saving procedures by allowing access to very narrow areas of the body.
3. Laser ProcessingAs specialists in laser welding and cutting for precision medical devices, TE can manufacture precise components for surgical instruments, catheters, connectors, and other medical devices for coronary, neurovascular, and orthopedic uses. This includes miniaturized devices designed to minimize trauma for patients, resulting in reduced recovery times, shorter hospital stays, and lower medical costs.
1.
3.
2.
TE products inside: INTEGRATED CATHETER

DATA CENTERS2.4M
Accelerating data transmission, with more reliability and less
power. In today’s data center, machines must transfer data at unprecedented speeds. TE’s connectivity solutions for the data center optimize the technology powering always-on operations, including today’s clouds and big-data applications. Our high-performance connectors increase a data center’s capacity to process, store, and transmit large volumes of data across a complex network of servers, routers, and storage devices – quickly, continuously, and efficiently.
25-56
*World Wide Web Consortium (W3C), “1 Second – Internet Live Stats”
DECIBEL (dB) OFINSERTION LOSS<1Offered in TE’s STRADA Whisper Backplane Connector
CONNE
Emails sent per second,
globally*
Gigabits per second of
data transfer with TE’s
STRADA Whisper

1. STRADA Whisper ConnectorsAs demand for data rises, so does the need for higher speeds in the data center, and backplane connectors are critical to achieving those high data-transfer speeds. STRADA Whisper backplane connectors transfer data at 25 Gigabits per second (Gbps), offering scalability up to 56 Gbps. The connectors are designed to optimize data integrity by reducing noise and other inefficiencies in the data center.
2. Power for Open Compute Project (OCP)This plug-and-play power cable assembly is the only solution fully compatible with Open Compute Project (OCP) specifications. It reduces the number of bus bar connectors in a data-center rack – and streamlines the distribution of power.
3. High-Speed Input/Output ConnectorsTE stands out in the marketplace for our broad portfolio of interconnect products that can deliver data 2.5 times faster than conventional solutions and future-proof technology that enables easier data center upgrades.
TE products inside: SERVERS, STORAGE, SWITCHING, AND ROUTERS
1.
2.
3.
ECTED

STRONG FINANCIAL PERFORMANCE
NET SALES IN US$ BILLIONS
FY 13 FY 14 FY 15
$11.4 $12.0$12.2
14.2% 15.5%
16.3%
ADJUSTED OPERATING MARGIN*
FY 15
$
FY 14
$
FY 13
$
$6.3B $3.2B $2.7B
FY 15 SALES
TE SALES BY SEGMENT
FY 13 FY 14 FY 15*See Non-GAAP Measures
COMMUNICATIONSSOLUTIONS
TRANSPORTATIONSOLUTIONS
INDUSTRIALSOLUTIONS
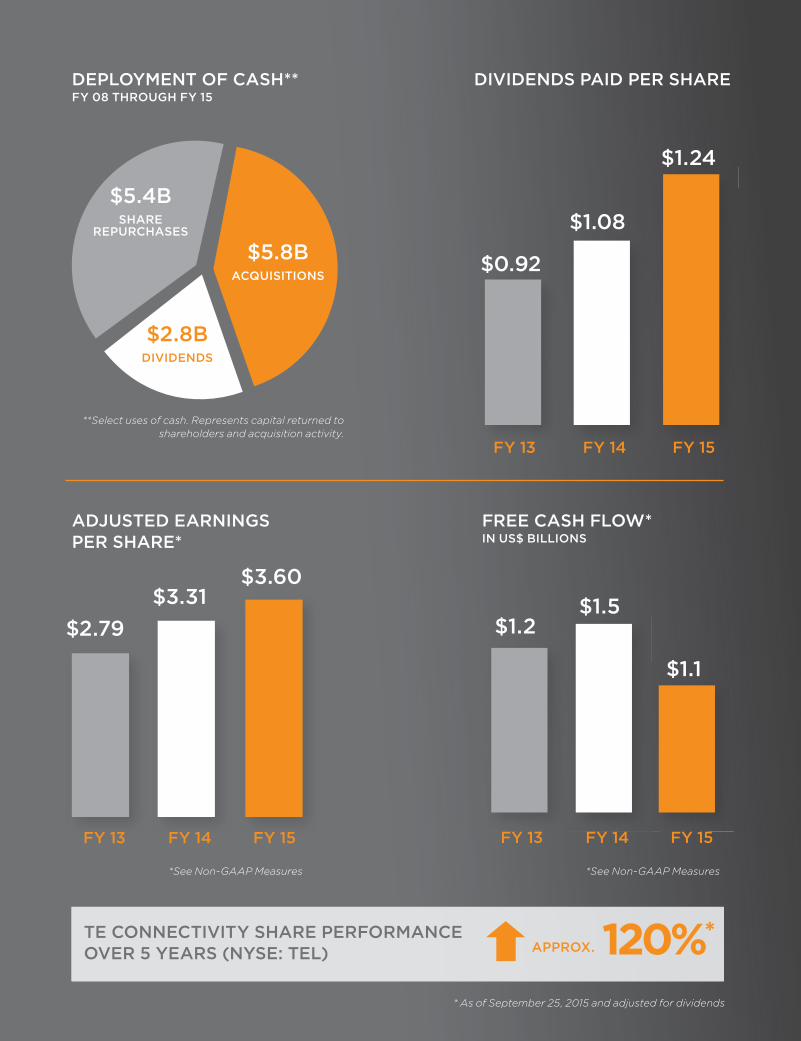
ADJUSTED EARNINGS PER SHARE*
$2.79$3.31
$3.60
FY 13 FY 14 FY 15
FREE CASH FLOW* IN US$ BILLIONS
$1.2$1.5
$1.1
FY 13 FY 14 FY 15
*See Non-GAAP Measures*See Non-GAAP Measures
120%*TE CONNECTIVITY SHARE PERFORMANCE OVER 5 YEARS (NYSE: TEL)
DIVIDENDS PAID PER SHARE
$1.24
$1.08
$0.92$
FY 13 FY 14 FY 15
APPROX.
DEPLOYMENT OF CASH**FY 08 THROUGH FY 15
**Select uses of cash. Represents capital returned to
shareholders and acquisition activity.
$5.4BSHARE
REPURCHASES
$5.8BACQUISITIONS
$2.8BDIVIDENDS
* As of September 25, 2015 and adjusted for dividends

CO U
TE is committed to building stronger communities, engaging our employees, celebrating
inclusion and diversity, and being mindful stewards of the environment. Notable TE
achievements include:
• Named one of the World’s Most Ethical Companies by The Ethisphere® Institute.
• Reduced greenhouse gas emissions 27 percent* and reduced water usage 34 percent.*
• Scored 90 out of 100 in the Human Rights Campaign Equality Index.
• Listed fourth in Assent Compliance’s “Top 100 Conflict Minerals Influence Leaders.”
• Established the Community Ambassador Program with over 100 TE employees, who
are providing local leadership with our stakeholders, including employees, government
officials, and community partners.
*FY 2010-2015, represents absolute reductions, and does not include sites related to our divested Broadband Network
Solutions business or sites related to our recent acquisition of Measurement Specialties.
TE employees are committed to making a difference in their communities. Worldwide, our employees support many
non-profit organizations and causes, such as the United Way in the United States, including its annual “Day of Caring.”
CONNE

Ethisphere® Institute’s World’s Most Ethical Companies designation recognizes those organizations that have had a material impact on the way business is conducted by fostering a culture of ethics and transparency at every level of the company. In 2015, the designation was granted to only 132 companies globally, including TE Connectivity.
2015 RECOGNITION
fourth consecutive year
INTEGRITY
ACCOUNTABILITY
TEAMWORK
INNOVATION
At TE, we believe that it takes more than
strong performance to build a great company.
It also requires an unwavering commitment to
our core values and the highest standards of
ethics and integrity.
TE employees regularly participate in fund-raising activities
for non-profit organizations, including the Special Olympics.
TE encourages problem solving in new ways, by supporting
initiatives that inspire TE engineers to innovate.
1,400 CHARITABLE
ORGANIZATIONS
SUPPORTED
ECTEDOUR CORE VALUES

UNMATCHED RESOURCES
CLOSE TO OUR CUSTOMERS
EUROPE, MIDDLE EAST,AFRICA (EMEA)
941
2,250
DESIGN CENTERS
MANUFACTURING SITES
ENGINEERS
AMERICAS
314
2,170
DESIGN CENTERS
MANUFACTURING SITES
ENGINEERS
CHINA
310
760
DESIGN CENTERS
MANUFACTURING SITES
ENGINEERS
ASIA* (EXCLUDING CHINA)
530
2,020
DESIGN CENTERS
MANUFACTURING SITES
ENGINEERS
TE designs, manufactures, and delivers connectivity and sensor solutions to customers in nearly 150 countries. Our global reach enables us to work closely with our customers, identify and meet their local needs, and advance our mission to deliver extraordi nary customer experiences.
*Including India
$4.1B
AMERICAS

EMEA
CHINA
$2.4BASIA*
(EXCLUDING CHINA)
$1.8B
$12.2BFY 15 SALES WORLDWIDE
$3.9B

NON-GAAP MEASURES
“Organic Sales Growth,” “Sales in Constant Currency,” “Adjusted
Operating Income,” “Adjusted Operating Margin,” “Adjusted
Earnings Per Share,” “Adjusted Earnings Per Share in Constant
Currency” and “Free Cash Flow” are non-GAAP measures and
should not be considered replacements for results in accordance
with accounting principles generally accepted in the U.S. (“GAAP”).
These non-GAAP measures may not be comparable to similarly-
titled measures reported by other companies. The primary
limitation of these measures is that they exclude the financial
impact of items that would otherwise either increase or decrease
our reported results. This limitation is best addressed by using
these non-GAAP measures in combination with the most directly
comparable GAAP measures in order to better understand the
amounts, character and impact of any increase or decrease in
reported amounts. The following provides additional information
regarding these non-GAAP measures:
• Organic Sales Growth – is a useful measure of our underlying
results and trends in the business. It is also a significant
component in our incentive compensation plans. The
difference between reported net sales growth (the most
comparable GAAP measure) and Organic Sales Growth
consists of the impact from foreign currency exchange rates
and acquisitions and divestitures, if any. Organic Sales Growth
is a useful measure of our performance because it excludes
items that: i) are not completely under management’s control,
such as the impact of changes in foreign currency exchange
rates; or ii) do not reflect the underlying growth of the
company, such as acquisition and divestiture activity.
• Sales in Constant Currency – represents net sales (the
most comparable GAAP measure) excluding the impact of
fluctuations in foreign currency exchange rates between
periods. We believe constant currency information provides
valuable supplemental information regarding our net sales.
• Adjusted Operating Income – represents operating income
(the most comparable GAAP measure) before special items
including charges or income related to restructuring and other
charges, acquisition related charges, impairment charges, and
other income or charges, if any. We utilize Adjusted Operating
Income to assess segment level core operating performance
and to provide insight to management in evaluating segment
operating plan execution and underlying market conditions. It
also is a significant component in our incentive compensation
plans. Adjusted Operating Income is a useful measure for
investors because it provides insight into our underlying
operating results, trends, and the comparability of these
results between periods.
• Adjusted Operating Margin – represents operating margin
(the most comparable GAAP measure) before special items
including charges or income related to restructuring and other
charges, acquisition related charges, impairment charges,
and other income or charges, if any. We present Adjusted
Operating Margin before special items to give investors a
perspective on the underlying business results. This measure
should be considered in conjunction with operating margin
calculated using our GAAP results in order to understand the
amounts, character and impact of adjustments to operating
margin.
• Adjusted Earnings Per Share – represents diluted earnings
per share from continuing operations attributable to TE
Connectivity Ltd. (the most comparable GAAP measure)
before special items, including charges or income related to
restructuring and other charges, acquisition related charges,
impairment charges, tax sharing income related to certain
proposed adjustments to prior period tax returns and other
tax items, certain significant special tax items, other income
or charges, if any, and, if applicable, the related tax effects.
We present Adjusted Earnings Per Share because we believe
that it is appropriate for investors to consider results excluding
these items in addition to results in accordance with GAAP.
We believe such a measure provides a picture of our results
that is more comparable among periods since it excludes
the impact of special items, which may recur, but tend to be
irregular as to timing, thereby making comparisons between
periods more difficult. It also is a significant component in our
incentive compensation plans.
• Adjusted Earnings Per Share in Constant Currency –
represents Adjusted Earnings Per Share excluding the impact
of fluctuations in foreign currency exchange rates between
periods. We believe constant currency information provides
valuable supplemental information regarding our earnings
per share.
• Free Cash Flow (FCF) – is a useful measure of our ability to
generate cash. The difference between net cash provided
by continuing operating activities (the most comparable
GAAP measure) and Free Cash Flow consists mainly of
significant cash outflows and inflows that we believe are
useful to identify. We believe Free Cash Flow provides
useful information to investors as it provides insight into the
primary cash flow metric used by management to monitor
and evaluate cash flows generated from our operations.
Free Cash Flow is defined as net cash provided by continuing
operating activities excluding voluntary pension contributions
and the cash impact of special items, if any, minus net capital
expenditures. Net capital expenditures consist of capital
expenditures less proceeds from the sale of property, plant,
and equipment. These items are subtracted because they
represent long-term commitments. Voluntary pension
contributions are excluded from the GAAP measure because
this activity is driven by economic financing decisions rather
than operating activity. Certain special items, including net
payments related to pre-separation tax matters, also are
considered by management in evaluating Free Cash Flow.
Free Cash Flow subtracts certain cash items that are ultimately
within management’s and the Board of Directors’ discretion to
direct and may imply that there is less or more cash available
for our programs than the most comparable GAAP measure
indicates. It should not be inferred that the entire Free Cash
Flow amount is available for future discretionary expenditures,
as our definition of Free Cash Flow does not consider certain
non-discretionary expenditures, such as debt payments. In
addition, we may have other discretionary expenditures, such
as discretionary dividends, share repurchases, and business
acquisitions, that are not considered in the calculation of Free
Cash Flow.

RECONCILIATION OF NON-GAAP FINANCIAL MEASURES TO GAAP FINANCIAL MEASURES US$ IN MILLIONS, EXCEPT PER SHARE DATA
Operating Income
Operating Margin
Diluted Earnings per Share from Continuing Operations
Attributable to TE Connectivity Ltd.
$ 1,805
15.1%
$ 3.87
U.S. GAAP
Acquisition
Related
Charges (1)
Restructuring
and Other
Charges, NetTax Items (2)
Adjusted
(Non-GAAP) (3)
$ 35
$ 0.07
$ 19
$ 0.04
$ -
$ (0.67)
$ 1,859
15.5%
$ 3.31
ADJUSTMENTS
(1) Includes $31 million of acquisition and integration costs and $4 million
of non-cash amortization associated with fair value adjustments primarily
related to acquired inventories and customer order backlog recorded in
cost of sales.
(2) Includes income tax benefits of $282 million recognized in connection
with a reduction in the valuation allowance associated with certain tax
loss carryforwards and income tax expense related to adjustments to
prior year income tax returns. In addition, includes other income related
to reimbursements by Tyco International and Covidien in connection with
pre-separation tax matters, including $18 million related to our share of
a settlement agreement entered into by Tyco International with a former
subsidiary.
(3) See description of non-GAAP measures contained in this report.
FISCAL YEAR 2014
Operating Income
Operating Margin
Diluted Earnings per Share from Continuing Operations
Attributable to TE Connectivity Ltd.
$ 1,749
14.3%
$ 3.01
U.S. GAAP
Acquisition
Related
Charges (1)
Restructuring
and Other
Charges, NetTax Items (2)
Adjusted
(Non-GAAP) (3)
$ 94
$ 0.18
$ 149
$ 0.29
$ -
$ 0.12
$ 1,992
16.3%
$ 3.60
ADJUSTMENTS
(1) Includes $55 million of acquisition and integration costs, $36 million of
non-cash amortization associated with fair value adjustments related to
acquired inventories and customer order backlog recorded in cost of sales,
and $3 million of restructuring costs.
(2) Includes $264 million of income tax benefits associated with the
settlement of audits of prior year income tax returns as well as the related
impact of $84 million to other expense pursuant to the tax sharing
agreement with Tyco International and Covidien. Also includes $216
million of income tax charges associated with the tax impacts of certain
intercompany legal entity restructurings made in connection with our
integration of Measurement Specialties, Inc. and $29 million of income tax
charges for the tax impacts of certain intercompany dividends related to
the restructuring and sale of the Broadband Network Solutions business.
(3) See description of non-GAAP measures contained in this report.
FISCAL YEAR 2015
Operating Income
Operating Margin
Diluted Earnings per Share from Continuing Operations
Attributable to TE Connectivity Ltd.
$ 1,385
12.2%
$ 2.73
U.S. GAAP
Acquisition
Related
Charges
Restructuring
and Other
Charges, NetTax Items (1)
Adjusted
(Non-GAAP) (2)
$ 14
$ 0.02
$ 222
$ 0.38
$ -
$ (0.33)
$ 1,621
14.2%
$ 2.79
ADJUSTMENTSFISCAL YEAR 2013
(1) Includes $331 million of income tax benefits associated with the
settlement of an audit of prior year income tax returns as well as the
related impact of $231 million to other expense pursuant to the tax sharing
agreement with Tyco International and Covidien. Also includes income
tax expense related to adjustments to prior year income tax returns,
income tax benefits recognized in connection with a reduction in the
valuation allowance associated with certain tax loss carryforwards, and
income tax benefits recognized in connection with the lapse of statutes of
limitations for examinations of prior year income tax returns. In addition,
includes other income related to reimbursements by Tyco International
and Covidien in connection with pre-separation tax matters.
(2) See description of non-GAAP measures contained in this report.

Net cash provided by continuing operating activities
Capital expenditures
Proceeds from sale of property, plant and equipment
Payments related to pre-separation U.S. tax matters, net
Free cash flow (1)
$ 1,775
(581)
22
28
$ 1,244
FISCAL YEAR 2015 2014 2013
This report contains certain “forward-looking statements” within
the meaning of the U.S. Private Securities Litigation Reform Act
of 1995. These statements are based on management’s current
expectations and are subject to risks, uncertainty and changes
in circumstances, which may cause actual results, performance,
financial condition or achievements to differ materially from
anticipated results, performance, financial condition or
achievements. All statements contained herein that are not clearly
historical in nature are forward-looking and the words “anticipate,”
“believe,” “expect,” “estimate,” “plan,” and similar expressions are
generally intended to identify forward-looking statements. We
have no intention and are under no obligation to update or alter
(and expressly disclaim any such intention or obligation to do
so) our forward-looking statements whether as a result of new
information, future events or otherwise, except to the extent
required by law. The forward-looking statements in this report
include statements addressing our future financial condition and
operating results. Examples of factors that could cause actual
results to differ materially from those described in the forward-
looking statements include, among others, business, economic,
competitive and regulatory risks, such as conditions affecting
demand for products, particularly in the automotive and data and
devices industries; competition and pricing pressure; fluctuations
in foreign currency exchange rates and commodity prices;
natural disasters and political, economic and military instability in
countries in which we operate; developments in the credit markets;
future goodwill impairment; compliance with current and future
environmental and other laws and regulations; the possible effects
on us of changes in tax laws, tax treaties and other legislation;
and the risk that we do not realize the anticipated benefits from
the sale of the Broadband Network Solutions business. More
detailed information about these and other factors is set forth in TE
Connectivity Ltd.’s Annual Report on Form 10-K for the fiscal year
ended Sept. 25, 2015 as well as in our Quarterly Reports on Form
10-Q, Current Reports on Form 8-K and other reports filed by us
with the U.S. Securities and Exchange Commission.
CAUTION CONCERNING FORWARD-LOOKING STATEMENTS
RECONCILIATION OF FREE CASH FLOWUS$ IN MILLIONS
$ 1,804
(635)
129
179
$ 1,477
$ 1,619
(600)
17
40
$ 1,076
(1) See description of non-GAAP measures contained in this report.
Fiscal year 2014
Impact of changes in foreign currency exchange rates
Operational performance
Fiscal year 2015
$ 3.31
(0.33)
0.62
$ 3.60
$ 11,973
(955)
1,215
$ 12,233
(1) See description of non-GAAP measures contained in this report.
(2) Includes $46 million impact of changes in foreign currency exchange rates on sales from acquisitions.
IMPACT OF CHANGES IN FOREIGN CURRENCY EXCHANGE RATESUS$ IN MILLIONS, EXCEPT PER SHARE DATA
Net Sales
Adjusted
EPS (1)
(2)
2.2%
CHANGES TO NET SALES FOR FISCAL YEAR 2015 VERSUS NET SALES FOR FISCAL YEAR 2014
RECONCILIATION OF NET SALES GROWTHUS$ IN MILLIONS
$ 260 $ 709
(1) Represents the change in net sales resulting from volume and price
changes, before consideration of acquisitions, divestitures and the impact
of changes in foreign currency exchange rates. Organic net sales growth is
a non-GAAP measure. See description of non-GAAP measures contained
in this report.
(2) Represents the change in net sales resulting from changes in foreign
currency exchange rates.
Organic(1)
Net Sales $ (909) 3.8% $ 460
Translation(2) Acquisitions Total

TE CONNECTIVITY LTD.ANNUAL REPORT
TABLE OF CONTENTS
Page
Business . . . . . . . . . . . . . . . . . . . . . . . . . . . . . . . . . . . . . . . . . . . . . . . . . . . . . . . . . . . . . . . . . 1Market for Registrant’s Common Equity, Related Stockholder Matters and Issuer Purchases of
Equity Securities . . . . . . . . . . . . . . . . . . . . . . . . . . . . . . . . . . . . . . . . . . . . . . . . . . . . . . . . . . 11Selected Financial Data . . . . . . . . . . . . . . . . . . . . . . . . . . . . . . . . . . . . . . . . . . . . . . . . . . . . . . 14Management’s Discussion and Analysis of Financial Condition and Results of Operations . . . . . . 15Quantitative and Qualitative Disclosures About Market Risk . . . . . . . . . . . . . . . . . . . . . . . . . . . 39Changes in and Disagreements with Accountants on Accounting and Financial Disclosure . . . . . . 41Controls and Procedures . . . . . . . . . . . . . . . . . . . . . . . . . . . . . . . . . . . . . . . . . . . . . . . . . . . . . 41Consolidated Financial Statements . . . . . . . . . . . . . . . . . . . . . . . . . . . . . . . . . . . . . . . . . . . . . . 43Swiss Statutory Financial Statements . . . . . . . . . . . . . . . . . . . . . . . . . . . . . . . . . . . . . . . . . . . . 113Swiss Statutory Compensation Report . . . . . . . . . . . . . . . . . . . . . . . . . . . . . . . . . . . . . . . . . . . . 129
i

SPECIAL NOTE ABOUT FORWARD-LOOKING STATEMENTS
We have made forward-looking statements in this Annual Report, including in the sections entitled‘‘Business,’’ ‘‘Management’s Discussion and Analysis of Financial Condition and Results ofOperations,’’ and ‘‘Quantitative and Qualitative Disclosures about Market Risk,’’ that are based on ourmanagement’s beliefs and assumptions and on information currently available to our management.Forward-looking statements include, among others, the information concerning our possible or assumedfuture results of operations, business strategies, financing plans, competitive position, potential growthopportunities, potential operating performance improvements, acquisitions, divestitures, the effects ofcompetition, and the effects of future legislation or regulations. Forward-looking statements include allstatements that are not historical facts and can be identified by the use of forward-looking terminologysuch as the words ‘‘believe,’’ ‘‘expect,’’ ‘‘plan,’’ ‘‘intend,’’ ‘‘anticipate,’’ ‘‘estimate,’’ ‘‘predict,’’ ‘‘potential,’’‘‘continue,’’ ‘‘may,’’ ‘‘should,’’ or the negative of these terms or similar expressions.
Forward-looking statements involve risks, uncertainties, and assumptions. Actual results may differmaterially from those expressed in these forward-looking statements. You should not put unduereliance on any forward-looking statements. We do not have any intention or obligation to updateforward-looking statements after we file this report except as required by law.
The risk factors identified in this Annual Report and those discussed in our Annual Report onForm 10-K for the fiscal year ended September 25, 2015 filed with the United States Securities andExchange Commission (the ‘‘SEC’’) could cause our results to differ materially from those expressed inforward-looking statements. There may be other risks and uncertainties that we are unable to predict atthis time or that we currently do not expect to have a material adverse effect on our business.
ii

BUSINESS
General
TE Connectivity Ltd. (‘‘TE Connectivity’’ or the ‘‘Company,’’ which may be referred to as ‘‘we,’’‘‘us,’’ or ‘‘our’’) is a global technology leader. We design and manufacture connectivity and sensorssolutions that are essential in today’s increasingly connected world. We help our customers solve theneed for intelligent, efficient, and high-performing products and solutions.
We operate through three reportable segments: Transportation Solutions, Industrial Solutions, andCommunications Solutions. Our segments manufacture and distribute our products and solutions to anumber of end markets. The table below provides a summary of our reportable segments and the keyproducts and industry end markets that we serve:
Segment Key Products Key Markets
Transportation Solutions • Terminals and connector systems • Automotive• Sensors • Commercial transportation• Relays • Sensors• Application tooling• Wire and heat shrink tubing
Industrial Solutions • Terminals and connector systems • Industrial equipment• Heat shrink tubing • Aerospace, defense, oil, and gas• Relays • Energy• Wire and cable
Communications Solutions • Terminals and connector systems • Data and devices• Undersea telecommunication systems • Subsea communications• Circuit protection devices • Appliances• Antennas• Relays• Heat shrink tubing
Our Competitive Strengths
We believe that we have the following competitive strengths:
• Portfolio of market-leading connectivity and sensors businesses. We are a leader in many of themarkets we serve, and the opportunity for growth in those markets is significant. We believe ourthree segments serve a combined market of approximately $170 billion that is expected to growat an estimated annual growth rate of approximately 6% over the next five years.
• Global leader in passive components. With net sales of $12.2 billion in fiscal 2015, we aresignificantly larger than many of our competitors. In the fragmented connector industry, whichwe estimated to be approximately $50 billion in fiscal 2015, our net sales were approximately$8.4 billion. We have established a global leadership position in the connector industry.
Our scale provides us the opportunity to accelerate our sales growth by making largerinvestments in existing and new technologies and businesses in our core markets, and to expandour presence in emerging markets. Our leadership position also provides us the opportunity tolower our purchasing costs by developing lower cost sources of supply and to maintain a flexiblemanufacturing footprint worldwide that is close to our customers’ locations.
• Strong customer relationships. As an industry leader, we have established close workingrelationships with many of our customers. These relationships allow us to better anticipate andrespond to customer needs when designing new products and new technical solutions. Byworking with our customers in developing new products and technologies, we believe we are able
1

to identify and act on trends and leverage knowledge about next-generation technology acrossour products.
• Process and product technology leadership. We employ approximately 7,200 engineers dedicated toproduct research, development, and engineering. Our investment of over $625 million in productand process engineering and development and our capital spending of $600 million in fiscal 2015enable us to consistently provide innovative, high-quality products with efficient manufacturingmethods. In fiscal 2015, we derived approximately 20% of our net sales from new products,including product extensions, introduced within the previous three fiscal years.
• Diverse product mix and customer base. We manufacture and sell a broad portfolio of products tocustomers in various industries. Our customers include many of the leaders in their respectiveindustries, and our relationships with them typically date back many years. We believe that thisdiversified customer base provides us an opportunity to leverage our skills and experience acrossmarkets and reduce our exposure to individual end markets, thereby reducing the variability ofour financial performance. Additionally, we believe that the diversity of our customer basereduces the level of cyclicality in our results and distinguishes us from our competitors.
• Global presence. We have an established manufacturing presence in over 20 countries and globalsales distribution. Our global coverage positions us near our customers’ locations and allows usto assist them in consolidating their supply base and lowering their production costs. We believeour balanced sales distribution lowers our exposure to any particular geography and improvesour financial profile.
• Strong management team and employee base. We believe our management team has theexperience necessary to effectively execute our strategy and advance our product and technologyleadership. Our chief executive officer, president, and segment leaders average approximately25 years of industry experience. They are supported by an experienced and talented managementteam who is dedicated to maintaining and expanding our position as a global leader in theindustry.
We have employees located throughout the world. We continue to emphasize employeedevelopment and training, and we embrace diversity and inclusion. Our strong employee base,along with their commitment to uncompromising values, provides the foundation of ourcompany’s success.
Segments
During fiscal 2015, we reorganized our management structure and segments to better align theorganization around our strategy. Prior period segment results have been revised to conform to thecurrent segment reporting structure. See Notes 1 and 22 to the Consolidated Financial Statements foradditional segment and geographic information relating to our business. Below is a description of ourreportable segments and the primary products sold by each segment.
Transportation Solutions
The Transportation Solutions segment is a leader in connectivity and sensor technologies. Ourproducts, which must withstand harsh conditions, are used in the automotive, commercialtransportation, and sensors markets. The following are the primary product families sold by thesegment:
• Terminals and connector systems and components. We offer an extensive range of electrical andelectronic interconnection products. These connectors include a wide variety of pin and socket,terminal, USB, coaxial, input/output, fiber optic, power, and circular connectors, as well asambient lighting assemblies, special purpose cable assemblies, sophisticated interconnection
2
products used in complex commercial equipment, and custom connectivity solutions for harshenvironment applications. This product family represents approximately 80% of the segment’snet sales.
• Sensors. We offer a customized engineered portfolio of non-contact position and speed sensortechnologies mainly for the automotive and commercial vehicle industries that include highmeasurement standards, robust housing technologies, and temperature stable designs for avariety of powertrain, safety, and chassis applications.
• Relays. Our relay products can be used in a wide range of applications in the automotive andcommercial vehicle industries, including electric sunroofs, anti-lock braking systems, and fuelinjection coils.
• Application tooling. We offer a broad portfolio of hand tools, semi-automatic bench machines,and fully-automatic machine systems for processing terminal products.
• Wire and heat shrink tubing. We provide a complete solution of reliable, cost-effective productsto seal, connect, insulate, protect, hold, and bundle high-performance electrical harnesses. Wealso provide high temperature wire for harsh environments on passenger and commercialvehicles.
Industrial Solutions
The Industrial Solutions segment is a leading supplier of products that connect and distributepower, data, and signals. Our products are used in the industrial equipment; aerospace, defense, oil,and gas; and energy markets. The following are the primary product families sold by the segment:
• Terminals and connector systems and components. We offer connector products including a widevariety of pin and socket, terminal, USB, coaxial, input/output, fiber optic, and powerconnectors, as well as sophisticated interconnection products used in equipment offered to theaerospace, defense, oil, gas, and medical industries. Additionally, we serve the aerospace,defense, oil, and gas industries by offering custom connectivity solutions for harsh environmentapplications.
• Heat shrink tubing. We provide a complete solution of reliable, cost-effective products to seal,connect, insulate, protect, hold, and bundle high-performance electrical harnesses. We alsoprovide customized harnessing design, prototype, and build services.
• Relays. Our relay products can be used in a wide range of applications in the industrial andaerospace, defense, oil, and gas industries, including high-performance applications used in harshenvironments.
• Wire and cable. We provide highly-engineered cable and wire products and a broad range ofcables suitable for use in rugged applications within the aerospace, defense, oil, and gasindustries. Additionally, we provide wire and cable for extreme environment applications,including copper and fiber optic distribution cables, shielded and unshielded twisted-pair cables,and armored cable.
Communications Solutions
The Communications Solutions segment is a top supplier of electronic components for the dataand devices and appliances markets. We are also a leader in developing, manufacturing, installing, and
3

maintaining some of the world’s most advanced subsea fiber optic communications systems. Thefollowing are the primary product families sold by the segment:
• Terminals and connector systems and components. We provide connector products including abroad range of electronic grounding, shielding, and contact; SIM memory card; terminal; USB;input/output; and a variety of board level signal and power connectors as well as memory andCPU sockets. Also, we design and manufacture power cables and cable assemblies for high datarate transmission and sophisticated interconnection products used in smartphone, computing,tablet computer, appliances, and consumer electronics OEM products.
• Undersea telecommunication systems. We design, build, maintain, and test undersea fiber opticnetworks for the telecommunication and oil and gas markets.
• Circuit protection devices. We offer a diverse range of circuit protection devices, which limit theflow of current during fault conditions and automatically reset after the fault is cleared andpower to the circuit is restored. We also offer surface-mount chip fuses, gas discharge tubes forovervoltage protection, electrostatic discharge protection devices, and hybrid protection devices.
• Antennas. We offer application specific and standard antenna products in a variety of structuresto enable our customers to complete the transmission of wireless voice and data over a fullrange of protocols.
• Relays. We provide relay products for a wide range of applications in the data and devices andappliances markets.
• Heat shrink tubing. We offer hundreds of reliable, cost-effective products to seal, connect,insulate, protect, hold, and bundle high-performance electrical harnesses.
Markets
We sell our products to manufacturers and distributors in a number of major markets. Theapproximate percentage of our total net sales by end market in fiscal 2015 was as follows:
Markets Percentage
Automotive . . . . . . . . . . . . . . . . . . . . . . . . . . . . . . . . . . . . . . . . . . . . . . 39%Data and Devices . . . . . . . . . . . . . . . . . . . . . . . . . . . . . . . . . . . . . . . . . 11Industrial Equipment . . . . . . . . . . . . . . . . . . . . . . . . . . . . . . . . . . . . . . . 11Aerospace, Defense, Oil, and Gas . . . . . . . . . . . . . . . . . . . . . . . . . . . . . 9Commercial Transportation . . . . . . . . . . . . . . . . . . . . . . . . . . . . . . . . . . 7Sensors . . . . . . . . . . . . . . . . . . . . . . . . . . . . . . . . . . . . . . . . . . . . . . . . . 6Subsea Communications . . . . . . . . . . . . . . . . . . . . . . . . . . . . . . . . . . . . . 6Energy . . . . . . . . . . . . . . . . . . . . . . . . . . . . . . . . . . . . . . . . . . . . . . . . . 6Appliances . . . . . . . . . . . . . . . . . . . . . . . . . . . . . . . . . . . . . . . . . . . . . . 5
Total . . . . . . . . . . . . . . . . . . . . . . . . . . . . . . . . . . . . . . . . . . . . . . . . . 100%
Our major markets are as follows:
• Automotive. We are one of the leading providers of advanced automobile connectivity solutions.The automotive industry uses our products in automotive technologies for body and chassissystems, convenience applications, driver information, infotainment solutions, miniaturizationsolutions, motor and powertrain applications, and safety and security systems. Hybrid andelectronic mobility solutions include in-vehicle technologies, battery technologies, and chargingsolutions.
4

• Data and devices. We deliver a range of connectivity solutions for the Internet of Things,wearables, smart phones, tablet computers, and notebooks to help our customers meet theircurrent challenges and future innovations. In addition, our products and solutions are used in avariety of equipment architectures within the networking equipment, data center equipment, andwireless infrastructure industries.
• Industrial equipment. Our products are used in factory automation and process control systemssuch as industrial controls, robotics, human machine interface, industrial communication, andpower distribution. Our intelligent building products are used to connect lighting, HVAC,elevators/escalators, and security. Our rail products are used in high-speed trains, metros, lightrail vehicles, locomotives, and signaling switching equipment. The medical industry uses ourproducts in diagnostic, therapeutic, surgical, and interventional applications. Also, our productsare used by the solar and lighting industry.
• Aerospace, defense, oil, and gas. We provide components and solutions for the commercialaerospace industry, from the initial stages of aircraft design to aftermarket support. Our defenseproducts include ruggedized electronic interconnects serving military aviation, marine, andground vehicles including electronic warfare and space systems. Our oil and gas products includecables and electronics used for harsh subsea environments in the offshore oil and gas and civilmarine industries and in shipboard, subsea, and sonar applications.
• Commercial transportation. We deliver reliable connectivity products designed to withstand harshenvironmental conditions for on- and off-highway vehicles and recreational transportation,including construction, agriculture, buses, and other recreational vehicles.
• Sensors. We offer a portfolio of intelligent, efficient, and high-performing sensor solutions thatare used by customers across multiple industries, from automotive, industrial and commercialtransportation, and aerospace and defense, to medical solutions and consumer applications.
• Subsea communications. Our products are used in undersea fiber optic telecommunicationsystems. With vertically integrated undersea communications systems and services, we supportthe telecommunications and oil and gas industries and other customers seeking marine services.
• Energy. Our products are used by OEMs and utility companies in the electrical power industryand include a wide range of solutions for the electrical power generation, transmission,distribution, and industrial markets.
• Appliances. We provide solutions to meet the daily demands of home appliances. Our productsare used in many household appliances, including washers, dryers, refrigerators, air conditioners,dishwashers, cooking appliances, water heaters, and microwaves. Our expansive range ofstandard products is supplemented by an array of custom-designed solutions.
Customers
We collaborate closely with our customers to meet their product needs. Our approach to ourcustomers is driven by our dedication to further develop our product families and ensure that we areglobally positioned to best provide our customers with sales and engineering support. We believe thatas electronic component technologies continue to proliferate, our broad product portfolio andengineering capability give us a potential competitive advantage when addressing the needs of ourglobal customers.
5

We maintain a strong local presence in each of the geographic regions in which we operate. Ournet sales by geographic region(1) as a percentage of our total net sales were as follows:
Fiscal
2015 2014 2013
Americas(2) . . . . . . . . . . . . . . . . . . . . . . . . . . . . . . . . . . . . . . . . . . 34% 30% 30%Asia–Pacific . . . . . . . . . . . . . . . . . . . . . . . . . . . . . . . . . . . . . . . . . 33 35 35Europe/Middle East/Africa (‘‘EMEA’’) . . . . . . . . . . . . . . . . . . . . . . 33 35 35
Total . . . . . . . . . . . . . . . . . . . . . . . . . . . . . . . . . . . . . . . . . . . . . 100% 100% 100%
(1) Net sales to external customers are attributed to individual countries based on the legal entity that records thesale.
(2) The Americas includes our subsea communications business.
There is no single customer that accounted for a significant amount of our net sales in fiscal 2015,2014, or 2013.
Sales, Marketing, and Distribution
We sell our products into approximately 150 countries primarily through direct selling efforts tomanufacturers. We also sell some of our products indirectly via third-party distributors. In fiscal 2015,our direct sales represented 80% of net sales.
We maintain distribution centers around the world. Products are generally delivered to thesedistribution centers by our manufacturing facilities and then subsequently delivered to the customer. Insome instances, product is delivered directly from our manufacturing facility to the customer. Wecontract with a wide range of transport providers to deliver our products via road, rail, sea, and air.
Seasonality and Backlog
We experience a slight seasonal pattern to our business. Overall, the third fiscal quarter is typicallythe strongest quarter of our fiscal year, whereas the first and fourth fiscal quarters are negativelyaffected by winter holidays and European holidays, respectively. The second fiscal quarter may beaffected by adverse winter weather conditions in some of our markets.
Certain of our end markets experience some seasonality. Our sales into the automotive market aredependent upon global automotive production, and seasonal declines in European production maynegatively impact net sales in the fourth fiscal quarter. Also, our sales into the energy market typicallyincrease in the third and fourth fiscal quarters as customer activity increases.
6

Customer orders typically fluctuate from quarter to quarter based upon business conditions andcancellation of unfilled orders prior to shipment of goods. Backlog by reportable segment was asfollows:
Fiscal Year End
2015 2014
(in millions)
Transportation Solutions . . . . . . . . . . . . . . . . . . . . . . . . . . . . . . . . . . $1,208 $ 989Industrial Solutions . . . . . . . . . . . . . . . . . . . . . . . . . . . . . . . . . . . . . . 814 850Communications Solutions(1) . . . . . . . . . . . . . . . . . . . . . . . . . . . . . . . 1,310 1,158
Total . . . . . . . . . . . . . . . . . . . . . . . . . . . . . . . . . . . . . . . . . . . . . . . $3,332 $2,997
(1) Includes our subsea communications business’ backlog of $995 million and $774 million at fiscal year end 2015 and2014, respectively.
We expect that the majority of our backlog at September 25, 2015 will be filled during fiscal 2016.
Competition
The industries in which we operate are highly competitive, and we compete with thousands ofcompanies that range from large multinational corporations to local manufacturers. Competition isgenerally on the basis of breadth of product offering, product innovation, price, quality, delivery, andservice. Our markets have generally been growing but with downward pressure on prices. The followingis a listing of our major competitors by segment:
• Transportation Solutions. This segment’s major competitors include Yazaki, Delphi, Sumitomo,Sensata, Honeywell, Molex, and Amphenol.
• Industrial Solutions. This segment competes primarily against Amphenol, Esterline, Molex,Belden, Phoenix Contact, Hubbell, and Carlisle Companies.
• Communications Solutions. This segment’s major competitors include Amphenol, Molex, FCIElectronics, JST, Korea Electric Terminal (KET), and Bourns. Also, the subsea communicationsbusiness competes against Alcatel-Lucent and NEC.
Raw Materials
We use a wide variety of raw materials in the manufacture of our products. The principal rawmaterials that we use include plastic resins for molding, precious metals such as gold and silver forplating, and other metals such as copper, aluminum, brass, and steel for manufacturing cable, contacts,and other parts that are used for cable and component bodies and inserts. Many of these raw materialsare produced in a limited number of countries around the world or are only available from a limitednumber of suppliers. The prices of these materials are driven by global supply and demand.
Research and Development
We are engaged in both internal and external research and development in an effort to introducenew products to enhance the effectiveness, ease of use, safety, and reliability of our existing products,and to expand the applications for which the uses of our products are appropriate. We continuallyevaluate developing technologies in areas where we may have technological or marketing expertise forpossible investment or acquisition.
7
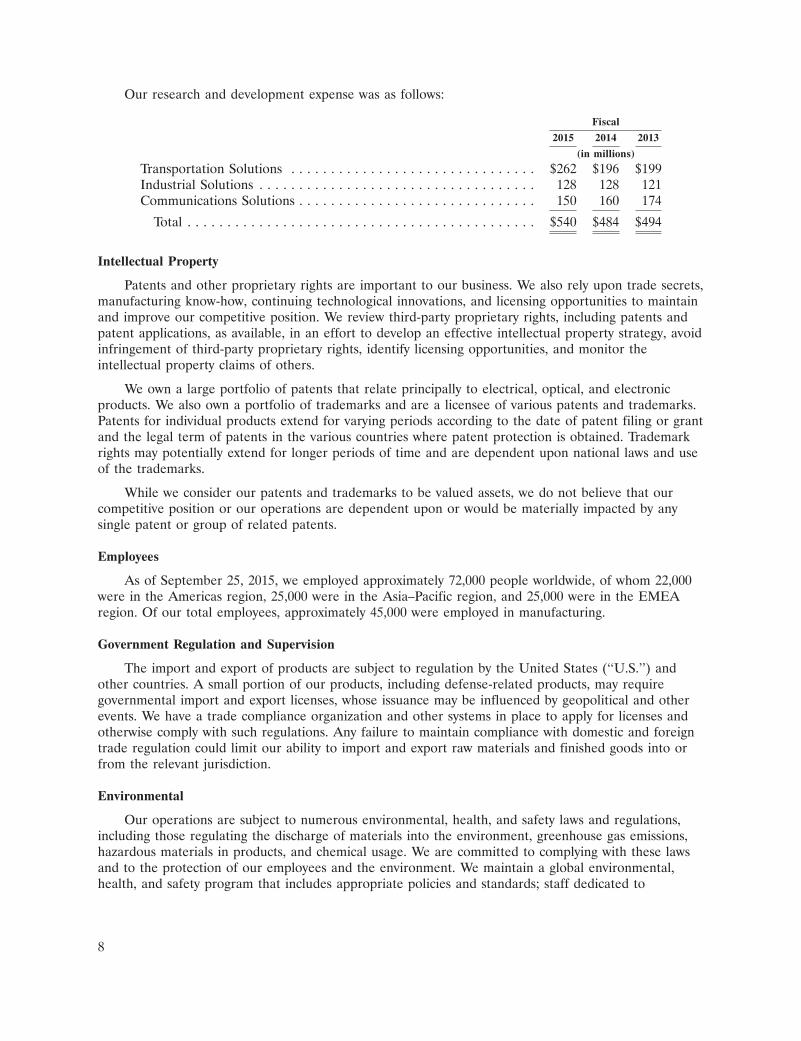
Our research and development expense was as follows:
Fiscal
2015 2014 2013
(in millions)
Transportation Solutions . . . . . . . . . . . . . . . . . . . . . . . . . . . . . . . $262 $196 $199Industrial Solutions . . . . . . . . . . . . . . . . . . . . . . . . . . . . . . . . . . . 128 128 121Communications Solutions . . . . . . . . . . . . . . . . . . . . . . . . . . . . . . 150 160 174
Total . . . . . . . . . . . . . . . . . . . . . . . . . . . . . . . . . . . . . . . . . . . . $540 $484 $494
Intellectual Property
Patents and other proprietary rights are important to our business. We also rely upon trade secrets,manufacturing know-how, continuing technological innovations, and licensing opportunities to maintainand improve our competitive position. We review third-party proprietary rights, including patents andpatent applications, as available, in an effort to develop an effective intellectual property strategy, avoidinfringement of third-party proprietary rights, identify licensing opportunities, and monitor theintellectual property claims of others.
We own a large portfolio of patents that relate principally to electrical, optical, and electronicproducts. We also own a portfolio of trademarks and are a licensee of various patents and trademarks.Patents for individual products extend for varying periods according to the date of patent filing or grantand the legal term of patents in the various countries where patent protection is obtained. Trademarkrights may potentially extend for longer periods of time and are dependent upon national laws and useof the trademarks.
While we consider our patents and trademarks to be valued assets, we do not believe that ourcompetitive position or our operations are dependent upon or would be materially impacted by anysingle patent or group of related patents.
Employees
As of September 25, 2015, we employed approximately 72,000 people worldwide, of whom 22,000were in the Americas region, 25,000 were in the Asia–Pacific region, and 25,000 were in the EMEAregion. Of our total employees, approximately 45,000 were employed in manufacturing.
Government Regulation and Supervision
The import and export of products are subject to regulation by the United States (‘‘U.S.’’) andother countries. A small portion of our products, including defense-related products, may requiregovernmental import and export licenses, whose issuance may be influenced by geopolitical and otherevents. We have a trade compliance organization and other systems in place to apply for licenses andotherwise comply with such regulations. Any failure to maintain compliance with domestic and foreigntrade regulation could limit our ability to import and export raw materials and finished goods into orfrom the relevant jurisdiction.
Environmental
Our operations are subject to numerous environmental, health, and safety laws and regulations,including those regulating the discharge of materials into the environment, greenhouse gas emissions,hazardous materials in products, and chemical usage. We are committed to complying with these lawsand to the protection of our employees and the environment. We maintain a global environmental,health, and safety program that includes appropriate policies and standards; staff dedicated to
8

environmental, health, and safety issues; periodic compliance auditing; training; and other measures.We also have a program for compliance with the European Union (‘‘EU’’) Restriction of HazardousSubstances and Waste Electrical and Electronics Equipment Directives, the China Restriction ofHazardous Substances law, the EU Registration, Evaluation, Authorization, and Restriction ofChemicals (‘‘REACH’’) Regulation, and similar laws.
Compliance with these laws has increased our costs of doing business in a variety of ways and maycontinue to do so in the future. For example, laws regarding product content and chemical registrationrequire extensive and costly data collection, management, and reporting, and laws regulatinggreenhouse gas emissions are likely to increase our costs for energy and certain materials and products.We also have projects underway at a number of current and former manufacturing facilities toinvestigate and remediate environmental contamination resulting from past operations. Based upon ourexperience, current information, and applicable laws, we believe that it is probable that we will incurremedial costs in the range of $16 million to $38 million, and that the best estimate within this range is$19 million. We do not anticipate any material capital expenditures during fiscal 2016 for environmentalcontrol facilities or other costs of compliance with laws or regulations relating to greenhouse gasemissions.
Corporate History
We are organized under the laws of Switzerland. The rights of holders of our shares are governedby Swiss law, our Swiss articles of association, and our Swiss organizational regulations.
Our business was formed principally through a series of acquisitions, from fiscal 1999 throughfiscal 2002, of established electronics companies and divisions, including AMP Incorporated, RaychemCorporation, the Electromechanical Components Division of Siemens, and the OEM Division ofThomas & Betts. These companies each had more than 50 years of history in engineering andinnovation excellence. We operated as a segment of Tyco International plc (‘‘Tyco International’’) priorto our separation.
Tyco Electronics Ltd. was incorporated in fiscal 2000 as a wholly-owned subsidiary of TycoInternational. Effective June 29, 2007, Tyco International distributed all of our shares, as well as itsshares of its former healthcare businesses (‘‘Covidien’’), to its common shareholders (referred to in thisreport as the ‘‘separation’’). We became an independent, publicly traded company owning the formerelectronics businesses of Tyco International. On January 26, 2015, Covidien was acquired and nowoperates as a subsidiary of Medtronic plc.
In March 2011, our shareholders approved an amendment to our articles of association to changeour name from ‘‘Tyco Electronics Ltd.’’ to ‘‘TE Connectivity Ltd.’’ The name change was effectiveMarch 10, 2011. Our ticker symbol ‘‘TEL’’ on the New York Stock Exchange (‘‘NYSE’’) remainedunchanged.
We acquired Measurement Specialties, Inc. (‘‘Measurement Specialties’’) and divested ourBroadband Network Solutions (‘‘BNS’’) business in fiscal 2015. See Notes 4 and 5 to the ConsolidatedFinancial Statements for additional information regarding discontinued operations and acquisitions.
Available Information
All periodic and current reports, registration filings, and other filings that we are required to filewith the SEC, including Annual Reports on Form 10-K, Quarterly Reports on Form 10-Q, CurrentReports on Form 8-K, and amendments to those reports filed or furnished pursuant to Section 13(a) or15(d) of the Securities Exchange Act of 1934 (‘‘Exchange Act’’) are available free of charge throughour internet website at www.te.com. Such documents are available as soon as reasonably practicableafter electronic filing or furnishing of the material with the SEC.
9

The public may also read and copy any document that we file, including this Annual Report, at theSEC’s Public Reference Room at 100 F Street, N.E., Washington, DC 20549. Investors may obtaininformation on the operation of the Public Reference Room by calling the SEC at 1-800-SEC-0330. Inaddition, the SEC maintains an internet site at www.sec.gov that contains reports, proxy and informationstatements, and other information regarding issuers that file electronically with the SEC, from whichinvestors can electronically access our SEC filings.
TE Connectivity and TE Connectivity (logo) are trademarks. � 2015 TE Connectivity Ltd. AllRights Reserved.
10

MARKET FOR REGISTRANT’S COMMON EQUITY, RELATED STOCKHOLDER MATTERSAND ISSUER PURCHASES OF EQUITY SECURITIES
Market Information
Our common shares are listed and traded on the NYSE under the symbol ‘‘TEL.’’ The followingtable sets forth the high and low closing sales prices of our common shares as reported by the NYSEfor the quarterly periods during the fiscal years ended September 25, 2015 and September 26, 2014.
Market Price Range
Fiscal
2015 2014
High Low High Low
First Quarter . . . . . . . . . . . . . . . . . . . . . . . . . . . . . . . . . . . $65.00 $51.47 $54.58 $49.91Second Quarter . . . . . . . . . . . . . . . . . . . . . . . . . . . . . . . . . 73.42 61.19 60.16 54.45Third Quarter . . . . . . . . . . . . . . . . . . . . . . . . . . . . . . . . . . 71.73 66.12 62.24 56.66Fourth Quarter . . . . . . . . . . . . . . . . . . . . . . . . . . . . . . . . . 64.36 55.53 64.97 58.47
The number of registered holders of our common shares at November 5, 2015 was 26,317.
Dividends and Cash Distributions to Shareholders
The following table sets forth the dividends and cash distributions to shareholders paid on ourcommon shares during the quarterly periods presented below.
Fiscal
2015 2014
First Quarter . . . . . . . . . . . . . . . . . . . . . . . . . . . . . . . . . . . $ 0.29 (CHF 0.26)(1) $ 0.25 (CHF 0.24)(1)
Second Quarter . . . . . . . . . . . . . . . . . . . . . . . . . . . . . . . . . $ 0.29 (CHF 0.26)(1) $ 0.25 (CHF 0.24)(1)
Third Quarter . . . . . . . . . . . . . . . . . . . . . . . . . . . . . . . . . . $ 0.33 (CHF 0.32)(2) $ 0.29 (CHF 0.26)(1)
Fourth Quarter . . . . . . . . . . . . . . . . . . . . . . . . . . . . . . . . . $ 0.33 (CHF 0.32)(2) $ 0.29 (CHF 0.26)(1)
(1) Payments were declared in Swiss francs (‘‘CHF’’) and paid in U.S. dollars based on a U.S. dollar/Swiss franc exchange rateshortly before shareholder approval.
(2) Payments were declared in U.S. dollars. The CHF equivalent is based on a U.S. dollar/Swiss franc exchange rate on thedate of shareholder approval.
Future dividends on our common shares or reductions of registered share capital for distribution toshareholders, if any, must be approved by our shareholders. In exercising their discretion to recommendto the shareholders that such dividends or distributions be approved, our board of directors willconsider our results of operations, cash requirements and surplus, financial condition, statutoryrequirements of applicable law, contractual restrictions, and other factors that they may deem relevant.We may from time to time enter into financing agreements that contain financial covenants andrestrictions, some of which may limit our ability to pay dividends or to distribute capital reductions.
11

9DEC201521094292
Performance Graph
Set forth below is a graph comparing the cumulative total shareholder return on our commonshares against the cumulative return on the S&P 500 Index and the Dow Jones Electrical Componentsand Equipment Index. The graph assumes the investment of $100 in our common shares and in eachindex on September 24, 2010 and assumes the reinvestment of all dividends and distributions. Thegraph shows the cumulative total return as of the fiscal years ended September 30, 2011, September 28,2012, September 27, 2013, September 26, 2014, and September 25, 2015. The comparisons in the graphbelow are based upon historical data and are not indicative of, nor intended to forecast, futureperformance of our common shares.
COMPARISON OF CUMULATIVE TOTAL RETURNAMONG TE CONNECTIVITY LTD., S&P 500 INDEX, AND
DOW JONES ELECTRICAL COMPONENTS AND EQUIPMENT INDEX
50
100
200
150
250
Fiscal 2010 Fiscal 2015Fiscal 2014Fiscal 2013Fiscal 2012Fiscal 2011
DO
LL
AR
S
TE Connectivity Ltd. S&P 500 Index Dow Jones Electrical Components and Equipment Index
Fiscal
2010(1) 2011 2012 2013 2014 2015
TE Connectivity Ltd. . . . . . . . . . . . . . . . . $100.00 $ 98.10 $121.36 $189.53 $218.52 $221.28S&P 500 Index . . . . . . . . . . . . . . . . . . . . 100.00 100.52 130.88 157.13 187.99 186.88Dow Jones Electrical Components and
Equipment Index . . . . . . . . . . . . . . . . . 100.00 95.68 126.75 174.12 194.25 178.41
(1) $100 invested on September 24, 2010 in TE Connectivity’s common shares and in indexes. Indexes calculated on month-endbasis.
12

Issuer Purchases of Equity Securities
The following table presents information about our purchases of our common shares during thequarter ended September 25, 2015:
MaximumTotal Number of Approximate
Shares Purchased Dollar Valueas Part of of Shares that May
Total Number Average Price Publicly Announced Yet Be Purchasedof Shares Paid Per Plans or Under the Plans
Period Purchased(1) Share(1) Programs(2) or Programs(2)
June 27–July 24, 2015 . . . . . . . . . . . . . 2,173,915 $62.90 2,173,200 $3,201,410,350July 25–August 28, 2015 . . . . . . . . . . . 2,679,413 61.01 2,652,400 3,039,551,253August 29–September 25, 2015 . . . . . . 5,479,859 59.96 5,475,000 2,711,277,446
Total . . . . . . . . . . . . . . . . . . . . . . . . 10,333,187 $60.85 10,300,600
(1) These columns include the following transactions which occurred during the quarter ended September 25, 2015:
(i) the acquisition of 32,587 common shares from individuals in order to satisfy tax withholding requirements inconnection with the vesting of restricted share awards issued under equity compensation plans; and
(ii) open market purchases totaling 10,300,600 common shares, summarized on a trade-date basis, in conjunction with theshare repurchase program announced in September 2007.
(2) In January 2015, our board of directors authorized a $3.0 billion increase in the share repurchase program. Our sharerepurchase program authorizes us to purchase a portion of our outstanding common shares from time to time through openmarket or private transactions, depending on business and market conditions. The share repurchase program does not havean expiration date.
13

SELECTED FINANCIAL DATA
The following table presents selected consolidated financial data. The data presented below shouldbe read in conjunction with our Consolidated Financial Statements and accompanying notes and‘‘Management’s Discussion and Analysis of Financial Condition and Results of Operations’’ includedelsewhere in this Annual Report. Our consolidated financial information may not be indicative of ourfuture performance.
As of or for Fiscal
2015(1) 2014(2) 2013(3) 2012(4) 2011
(in millions, except per share data)
Statement of Operations DataNet sales . . . . . . . . . . . . . . . . . . . . . . . . . . . . . . . . $12,233 $11,973 $11,390 $11,325 $11,754Acquisition and integration costs . . . . . . . . . . . . . . . 55 31 14 27 —Restructuring and other charges, net . . . . . . . . . . . . 152 19 222 104 88Amounts attributable to TE Connectivity Ltd.:
Income from continuing operations . . . . . . . . . . . 1,238 1,614 1,154 1,003 1,089Income from discontinued operations, net of
income taxes . . . . . . . . . . . . . . . . . . . . . . . . . . 1,182 167 122 109 156Net income . . . . . . . . . . . . . . . . . . . . . . . . . . . . . $ 2,420 $ 1,781 $ 1,276 $ 1,112 $ 1,245
Per Share DataBasic earnings per share attributable to TE
Connectivity Ltd.:Income from continuing operations . . . . . . . . . . . $ 3.06 $ 3.94 $ 2.76 $ 2.35 $ 2.48Net income . . . . . . . . . . . . . . . . . . . . . . . . . . . . . 5.98 4.34 3.05 2.61 2.84
Diluted earnings per share attributable to TEConnectivity Ltd.:Income from continuing operations . . . . . . . . . . . $ 3.01 $ 3.87 $ 2.73 $ 2.33 $ 2.46Net income . . . . . . . . . . . . . . . . . . . . . . . . . . . . . 5.89 4.27 3.02 2.59 2.81
Dividends and cash distributions paid per commonshare . . . . . . . . . . . . . . . . . . . . . . . . . . . . . . . . . $ 1.24 $ 1.08 $ 0.92 $ 0.78 $ 0.68
Balance Sheet DataTotal assets . . . . . . . . . . . . . . . . . . . . . . . . . . . . . . $20,608 $20,152 $18,461 $19,306 $17,723Long-term liabilities . . . . . . . . . . . . . . . . . . . . . . . . 7,446 7,146 6,015 7,182 6,680Total equity . . . . . . . . . . . . . . . . . . . . . . . . . . . . . . $ 9,585 $ 9,013 $ 8,386 $ 7,977 $ 7,484
(1) Fiscal 2015 results include $216 million of income tax charges associated with the tax impacts of certain intercompany legalentity restructurings made in connection with our integration of Measurement Specialties; $201 million of income taxbenefits associated with the effective settlement of all undisputed tax matters for the years 2001 through 2007 and therelated impact of $84 million to other expense pursuant to the Tax Sharing Agreement with Tyco International andCovidien; and $63 million of income tax benefits associated with the effective settlement of all undisputed tax matters forthe years 2008 through 2010. In addition, in fiscal 2015, income from discontinued operations, net of income taxes includesthe gain on the sale of our BNS business. (See Notes 4, 13, 16, and 17 to the Consolidated Financial Statements.)
(2) Fiscal 2014 results include $282 million of income tax benefits recognized in connection with a reduction in the valuationallowance associated with certain tax loss carryforwards relating to ADC Telecommunications, Inc. (‘‘ADC’’). (See Note 16to the Consolidated Financial Statements.)
(3) Fiscal 2013 results include $331 million of income tax benefits associated with the effective settlement of all undisputed taxmatters for the years 1997 through 2000 and the related impact of $231 million to other expense pursuant to the TaxSharing Agreement with Tyco International and Covidien. (See Notes 13, 16, and 17 to the Consolidated FinancialStatements.)
(4) Fiscal 2012 results include $75 million of charges from the amortization of acquisition-related fair value adjustments relatedprimarily to acquired inventories and customer order backlog associated with Deutsch Group SAS (‘‘Deutsch’’) and$107 million of income tax benefits recognized in connection with a reduction in the valuation allowance associated with taxloss carryforwards in certain non-U.S. locations.
14

MANAGEMENT’S DISCUSSION AND ANALYSIS OF FINANCIAL CONDITION AND RESULTS OFOPERATIONS
The following discussion and analysis of our financial condition and results of operations should beread in conjunction with our Consolidated Financial Statements and the accompanying notes includedelsewhere in this Annual Report. The following discussion may contain forward-looking statements thatreflect our plans, estimates, and beliefs. Our actual results could differ materially from those discussedin these forward-looking statements. Factors that could cause or contribute to these differences includethose factors discussed below and elsewhere in this Annual Report, particularly in ‘‘Forward-LookingInformation,’’ and in ‘‘Part I. Item 1A. Risk Factors’’ of our Annual Report on Form 10-K for the fiscalyear ended September 25, 2015 filed with the SEC.
Our Consolidated Financial Statements have been prepared in U.S. dollars, in accordance withaccounting principles generally accepted in the U.S. (‘‘GAAP’’).
The following discussion includes organic net sales growth and free cash flow which arenon-GAAP financial measures. We believe these non-GAAP financial measures, together with GAAPfinancial measures, provide useful information to investors because they reflect the financial measuresthat management uses in evaluating the underlying results of our operations. See ‘‘Non-GAAPFinancial Measures’’ for more information about these non-GAAP financial measures, including ourreasons for including the measures and material limitations with respect to the usefulness of themeasures.
Overview
We are a global technology leader. We design and manufacture connectivity and sensors solutionsthat are essential in today’s increasingly connected world. We help our customers solve the need forintelligent, efficient, and high-performing products and solutions.
During fiscal 2015, we reorganized our management structure and segments to better align theorganization around our strategy. We now operate through three reportable segments: TransportationSolutions, Industrial Solutions, and Communications Solutions. See Notes 1 and 22 to the ConsolidatedFinancial Statements for additional information regarding our segments. Prior period segment resultshave been restated to conform to the current segment reporting structure.
Fiscal 2015 highlights included the following:
• Overall, our net sales increased 2.2% in fiscal 2015 as compared to fiscal 2014, due to increasednet sales in the Transportation Solutions and Communications Solutions segments, partiallyoffset by sales declines in the Industrial Solutions segment.
• On an organic basis, net sales increased 3.8% during fiscal 2015 as compared to fiscal 2014. Ourorganic net sales by segment were as follows:
• Transportation Solutions—Our net sales increased 4.1% on an organic basis during fiscal2015 due primarily to increases in the automotive end market.
• Industrial Solutions—Our organic net sales were flat in fiscal 2015.
• Communications Solutions—Our organic net sales increased 8.4% in fiscal 2015, dueprimarily to sales increases in the subsea communications end market, partially offset bydeclines in the data and devices end market.
• During fiscal 2015, our shareholders approved a dividend payment to shareholders of $1.32 perissued share payable in four quarterly installments of $0.33 beginning with the third fiscalquarter of 2015 and ending in the second fiscal quarter of 2016.
• During fiscal 2015, we acquired Measurement Specialties and divested our BNS business.
15

Outlook
In the first quarter of fiscal 2016, we expect net sales to be between $2.7 billion and $2.9 billion.This reflects sales decreases in all segments relative to the first quarter of fiscal 2015. Additionalinformation regarding expectations for our reportable segments for the first quarter of fiscal 2016 is asfollows:
• Transportation Solutions—We expect our sales declines in the automotive and commercialtransportation end markets to be partially offset by sales growth in the sensors end market inthe first quarter of fiscal 2016. We expect global automotive production to decline 2% in thefirst quarter of fiscal 2016 as compared to the same period of fiscal 2015.
• Industrial Solutions—We expect our sales to decrease during the first quarter of 2016 as a resultof the slowdown in China, inventory reductions in the supply chain, and continued weakness inthe oil and gas market.
• Communications Solutions—In the first quarter of fiscal 2016, we expect our sales growth in thesubsea communications end market to be more than offset by our sales declines in the data anddevices and appliances end markets resulting from continued weakness in China, inventoryreductions in the supply chain, and the exit of certain product lines.
We expect diluted earnings per share to be in the range of $0.62 to $0.70 per share in the first quarterof fiscal 2016. This outlook reflects continued market weakness in China. Also, it reflects the negativeimpact of foreign currency exchange rates on net sales and earnings per share of approximately$167 million and $0.05 per share, respectively, in the first quarter of fiscal 2016 as compared to the firstquarter of fiscal 2015.
For fiscal 2016, which will be 53 weeks in length, we expect net sales to be between $12.0 billionand $12.8 billion, primarily reflecting sales increases in the Transportation Solutions segment offset bysales declines in the Communications Solutions segment from fiscal 2015 levels. Additional informationregarding expectations for our reportable segments for fiscal 2016 is as follows:
• Transportation Solutions—During fiscal 2016, we expect our sales to increase in the automotiveend market while we expect global automotive production to be flat as compared to fiscal 2015.Also, we expect our sales growth in the sensors end market to be partially offset by salesdeclines in the commercial transportation end market in fiscal 2016.
• Industrial Solutions—Within the aerospace, defense, oil, and gas end market, we expect our salesgrowth, primarily in the commercial aerospace market, to be offset by sales declines in the oiland gas market due to continued market weakness in fiscal 2016. We anticipate that the negativeimpact of inventory adjustments in the supply chain will continue during the first half of fiscal2016.
• Communications Solutions—In fiscal 2016, we expect our sales growth in the subseacommunications end market to be more than offset by our sales declines in the data and devicesend market resulting from the exit of certain product lines and continued weakness in China.
We expect diluted earnings per share to be in the range of $3.61 to $4.01 per share in fiscal 2016. Thisoutlook includes approximately $200 million in net sales and $0.05 earnings per share resulting fromthe additional week in fiscal 2016. Also, this outlook reflects the negative impact of foreign currencyexchange rates on net sales and earnings per share of approximately $262 million and $0.10 per share,respectively, in fiscal 2016 as compared to fiscal 2015.
The above outlook is based on foreign exchange rates and commodity prices that are consistentwith current levels.
We are monitoring the current macroeconomic environment, including the uncertain marketconditions in China, and its potential effects on our customers and the end markets we serve.Additionally, we continue to closely manage our costs in line with economic conditions. We are also
16

managing our capital resources and monitoring capital availability to ensure that we have sufficientresources to fund future capital needs. See further discussion in ‘‘Liquidity and Capital Resources.’’
Acquisition
On October 9, 2014, we acquired 100% of the outstanding shares of Measurement Specialties, aleading global designer and manufacturer of sensors and sensor-based systems, for $86.00 in cash pershare. The total value paid was approximately $1.7 billion, net of cash acquired, and included$225 million for the repayment of Measurement Specialties’ debt and accrued interest. This businesshas been reported as part of our Transportation Solutions segment from the date of acquisition. Seeadditional information regarding acquisitions in Note 5 to the Consolidated Financial Statements.
Discontinued Operations
During fiscal 2015, we sold our BNS business for $3.0 billion in cash and recognized a pre-tax gainof $1,105 million on the transaction.
The BNS business met the discontinued operations criteria and has been reported as such in allperiods presented on the Consolidated Financial Statements. Prior to reclassification to discontinuedoperations, the BNS business was a component of the former Network Solutions segment.
See Note 4 to the Consolidated Financial Statements for additional information regardingdiscontinued operations.
Planned Divestiture
On November 7, 2015, we entered into a definitive agreement to sell our Circuit ProtectionDevices (‘‘CPD’’) business for $350 million in cash, subject to a final working capital adjustment. Thetransaction is expected to close during the second quarter of fiscal 2016 pending customary closingconditions and regulatory approvals. The net assets of the CPD business were approximately$200 million at September 25, 2015. The CPD business is currently reported as part of the Data andDevices business within our Communications Solutions segment.
Results of Operations
Net Sales
The following table presents our net sales and the percentage of total net sales by segment:
Fiscal
2015 2014 2013
($ in millions)
Transportation Solutions . . . . . . . . . . . . . . . . . . . . $ 6,351 52% $ 6,090 51% $ 5,485 48%Industrial Solutions . . . . . . . . . . . . . . . . . . . . . . . . 3,179 26 3,302 28 3,100 27Communications Solutions . . . . . . . . . . . . . . . . . . . 2,703 22 2,581 21 2,805 25
Total . . . . . . . . . . . . . . . . . . . . . . . . . . . . . . . . . $12,233 100% $11,973 100% $11,390 100%
The following table provides an analysis of the change in our net sales compared to the prior fiscalyear by segment:
Fiscal
2015 2014
Change in Net Sales versus Prior Fiscal Year Change in Net Sales versus Prior Fiscal Year
AcquisitionsOrganic Translation Acquisitions Total Organic Translation (Divestitures) Total
($ in millions)Transportation Solutions . . . . . . $250 4.1% $(556) $567 $ 261 4.3% $ 570 10.4% $ 33 $ 2 $ 605 11.0%Industrial Solutions . . . . . . . . (7) (0.2) (258) 142 (123) (3.7) 161 5.2 10 31 202 6.5Communications Solutions . . . . 217 8.4 (95) — 122 4.7 (174) (6.2) (11) (39) (224) (8.0)
Total . . . . . . . . . . . . . . . . $460 3.8% $(909) $709 $ 260 2.2% $ 557 4.9% $ 32 $ (6) $ 583 5.1%
17

Net sales increased $260 million, or 2.2%, in fiscal 2015 as compared to fiscal 2014. The increasein net sales resulted from sales contributions from acquisitions of 5.9% and organic sales growth of3.8%, partially offset by the negative impact of foreign currency translation of 7.5% due to theweakening of certain foreign currencies. Measurement Specialties contributed net sales of $548 millionduring fiscal 2015.
On an organic basis, net sales increased $460 million, or 3.8%, in fiscal 2015 as compared to 2014,primarily as a result of sales increases in the Transportation Solutions and Communications Solutionssegments. Price erosion adversely affected organic sales by $208 million in fiscal 2015.
Net sales increased $583 million, or 5.1%, in fiscal 2014 as compared to fiscal 2013. The increasein net sales was primarily the result of organic growth of 4.9% and the positive impact of foreigncurrency translation of 0.3% due to the strengthening of certain foreign currencies.
On an organic basis, net sales increased $557 million, or 4.9%, during fiscal 2014 as compared tofiscal 2013 as increased net sales in the Transportation Solutions segment and, to a lesser degree, theIndustrial Solutions segment were partially offset by sales decreases in the Communications Solutionssegment. Price erosion adversely affected organic sales by $194 million in fiscal 2014.
See further discussion of organic net sales below under ‘‘Segment Results.’’
Net Sales by Geographic Region. Our business operates in three geographic regions—the Americas,Asia–Pacific, and EMEA—and our results of operations are influenced by changes in foreign currencyexchange rates. Increases or decreases in the value of the U.S. dollar, compared to other currencies,will directly affect our reported results as we translate those currencies into U.S. dollars at the end ofeach fiscal period. We sell our products into approximately 150 countries, and approximately 52% ofour net sales were invoiced in currencies other than the U.S. dollar in fiscal 2015. The percentage ofnet sales in fiscal 2015 by major currencies invoiced was as follows:
Currencies Percentage
U.S. dollar . . . . . . . . . . . . . . . . . . . . . . . . . . . . . . . . . . . . . . . . . . . . . . 48%Euro . . . . . . . . . . . . . . . . . . . . . . . . . . . . . . . . . . . . . . . . . . . . . . . . . . . 27Chinese renminbi . . . . . . . . . . . . . . . . . . . . . . . . . . . . . . . . . . . . . . . . . 9Japanese yen . . . . . . . . . . . . . . . . . . . . . . . . . . . . . . . . . . . . . . . . . . . . . 5All others . . . . . . . . . . . . . . . . . . . . . . . . . . . . . . . . . . . . . . . . . . . . . . . 11
Total . . . . . . . . . . . . . . . . . . . . . . . . . . . . . . . . . . . . . . . . . . . . . . . . . 100%
The following table presents our net sales and the percentage of total net sales by geographicregion:
Fiscal
2015 2014 2013
($ in millions)
Americas . . . . . . . . . . . . . . . . . . . . . . . . . . . . . . . $ 4,138 34% $ 3,515 30% $ 3,456 30%Asia–Pacific . . . . . . . . . . . . . . . . . . . . . . . . . . . . . 4,103 33 4,234 35 3,986 35EMEA . . . . . . . . . . . . . . . . . . . . . . . . . . . . . . . . . 3,992 33 4,224 35 3,948 35
Total . . . . . . . . . . . . . . . . . . . . . . . . . . . . . . . . . $12,233 100% $11,973 100% $11,390 100%
18

The following table provides an analysis of the change in our net sales compared to the prior fiscalyear by geographic region:
Fiscal
2015 2014
Change in Net Sales versus Prior Fiscal Year Change in Net Sales versus Prior Fiscal Year
AcquisitionsOrganic Translation Acquisitions Total Organic Translation (Divestitures) Total
($ in millions)Americas . . . . . . . . . . . . . . . . $361 10.3% $ (72) $334 $ 623 17.7% $ 58 1.7% $(33) $ 34 $ 59 1.7%Asia–Pacific . . . . . . . . . . . . . . (31) (0.7) (188) 88 (131) (3.1) 349 8.8 (67) (34) 248 6.2EMEA . . . . . . . . . . . . . . . . . 130 3.1 (649) 287 (232) (5.5) 150 3.8 132 (6) 276 7.0
Total . . . . . . . . . . . . . . . . . $460 3.8% $(909) $709 $ 260 2.2% $557 4.9% $ 32 $ (6) $583 5.1%
Cost of Sales and Gross Margin
The following table presents cost of sales and gross margin in dollars and as a percentage of netsales, as well as the changes from the prior fiscal year:
Fiscal Fiscal2015 2014Fiscal versus versus
2015 2014 2013 2014 2013
($ in millions)
Cost of sales . . . . . . . . . . . . . . . . . . . . . . . . . . . . . . . . . $8,146 $8,001 $7,739 $ 145 $ 262As a percentage of net sales . . . . . . . . . . . . . . . . . . . . 66.6% 66.8% 67.9% (0.2)% (1.1)%
Gross margin . . . . . . . . . . . . . . . . . . . . . . . . . . . . . . . . . $4,087 $3,972 $3,651 $ 115 $ 321As a percentage of net sales . . . . . . . . . . . . . . . . . . . . 33.4% 33.2% 32.1% 0.2% 1.1%
Gross margin increased $115 million in fiscal 2015 as compared to fiscal 2014. In fiscal 2015, grossmargin included charges of $36 million from the amortization of acquisition-related fair valueadjustments to acquired inventories and customer order backlog associated primarily with MeasurementSpecialties. Excluding these charges, gross margin increased in fiscal 2015 primarily as a result of highervolume and improved manufacturing productivity, partially offset by the negative impact of changes inforeign currency exchange rates and price erosion.
In fiscal 2014, gross margin increased $321 million as compared to fiscal 2013. The increase ingross margin resulted primarily from improved manufacturing productivity and, to a lesser degree,higher volume, partially offset by price erosion.
Cost of sales and gross margin are subject to variability in raw material prices, and the price ofmany of our raw materials continues to fluctuate. In fiscal 2015, we purchased approximately160 million pounds of copper, 123,000 troy ounces of gold, and 2.5 million troy ounces of silver. Thefollowing table sets forth the average prices incurred related to copper, gold, and silver.
Fiscal
Measure 2015 2014 2013
Copper . . . . . . . . . . . . . . . . . . . . . . . . . . . . . . Lb. $ 3.06 $ 3.33 $ 3.51Gold . . . . . . . . . . . . . . . . . . . . . . . . . . . . . . . Troy oz. 1,267 1,405 1,613Silver . . . . . . . . . . . . . . . . . . . . . . . . . . . . . . . Troy oz. 18.51 23.43 29.18
In fiscal 2016, we expect to purchase copper, gold, and silver in quantities similar 2015 levels.
19

Operating Expenses
The following table presents operating expenses in dollars and selling, general, and administrativeexpenses as a percentage of net sales, as well as the changes from the prior fiscal year:
Fiscal Fiscal2015 2014Fiscal versus versus
2015 2014 2013 2014 2013
($ in millions)
Selling, general, and administrative expenses . . . . . . . . . . . $1,504 $1,534 $1,440 $ (30) $ 94As a percentage of net sales . . . . . . . . . . . . . . . . . . . . . 12.3% 12.8% 12.6% (0.5)% 0.2%
Research, development, and engineering expenses . . . . . . . $ 627 $ 583 $ 590 $ 44 $ (7)Acquisition and integration costs . . . . . . . . . . . . . . . . . . . $ 55 $ 31 $ 14 $ 24 $ 17Restructuring and other charges, net . . . . . . . . . . . . . . . . $ 152 $ 19 $ 222 $ 133 $(203)
Selling, General, and Administrative Expenses. Selling, general, and administrative expensesdecreased $30 million in fiscal 2015 as compared to fiscal 2014. The decrease resulted primarily fromcost control measures and saving attributable to restructuring actions, partially offset by additionalexpenses associated with Measurement Specialties.
In fiscal 2014, selling, general, and administrative expenses increased $94 million as compared tofiscal 2013. The increase resulted primarily from increased selling expenses to support higher saleslevels, partially offset by savings attributable to restructuring actions and a gain on the sale of realestate.
Research, Development, and Engineering Expenses. Research, development, and engineeringexpenses increased $44 million in fiscal 2015 as compared to fiscal 2014 as a result of additionalexpenses related to acquisitions and growth initiatives, primarily in the Transportation Solutionssegment.
Acquisition and Integration Costs. In fiscal 2015, we incurred acquisition and integration costs of$55 million, related primarily to the acquisitions of Measurement Specialties and the SEACON Group(‘‘SEACON’’). In fiscal 2014, we incurred acquisition and integration costs of $31 million, primarily inconnection with the acquisition of SEACON. In connection with the acquisition of Deutsch, weincurred acquisition and integration costs of $14 million during fiscal 2013.
Restructuring and Other Charges, Net. We are committed to continuous productivity improvementsand consistently evaluate opportunities to simplify our global manufacturing footprint, migrate facilitiesto lower-cost regions, reduce fixed costs, and eliminate excess capacity. These initiatives are designed tohelp us maintain our competitiveness in the industry, improve our operating leverage, and position usfor future growth. During fiscal 2015, we initiated a restructuring program associated with headcountreductions and product line closures, primarily impacting the Communications Solutions and IndustrialSolutions segments. During fiscal 2014, we initiated a restructuring program associated primarily withheadcount reductions and manufacturing site and product line closures in the CommunicationsSolutions segment. During fiscal 2013, we initiated a restructuring program associated with headcountreductions and manufacturing site closures impacting all segments.
In connection with these initiatives, we recorded net restructuring charges of $93 million,$23 million, and $225 million in fiscal 2015, 2014, and 2013, respectively. We expect to incur netrestructuring charges of approximately $75 million during fiscal 2016, and we expect total spending,which will be funded with cash from operations, to be approximately $90 million in fiscal 2016.Annualized cost savings related to actions initiated in fiscal 2015 are estimated to be approximately
20

$80 million and are expected to be realized by the end of fiscal 2017. Cost savings will be reflectedprimarily in cost of sales and selling, general, and administrative expenses.
During fiscal 2015, we incurred net other charges of $59 million, primarily in connection with thedivestiture of BNS.
See Note 3 to the Consolidated Financial Statements for additional information regarding netrestructuring and other charges.
Operating Income
The following table presents operating income and operating margin, as well as the changes fromthe prior fiscal year:
Fiscal Fiscal2015 2014Fiscal versus versus
2015 2014 2013 2014 2013
($ in millions)
Operating income . . . . . . . . . . . . . . . . . . $1,749 $1,805 $1,385 $(56) $420Operating margin . . . . . . . . . . . . . . . . . 14.3% 15.1% 12.2% (0.8)% 2.9%
Operating income included the following special items:
Fiscal
2015 2014 2013
(in millions)
Acquisition related charges:Acquisition and integration costs . . . . . . . . . . . . . . . . . . . . . . $ 55 $31 $ 14Charges associated with the amortization of acquisition-
related fair value adjustments . . . . . . . . . . . . . . . . . . . . . . 36 4 —Restructuring charges related to acquisitions . . . . . . . . . . . . . 3 — —
94 35 14
Restructuring and other charges, net . . . . . . . . . . . . . . . . . . . . 149 19 222
Total . . . . . . . . . . . . . . . . . . . . . . . . . . . . . . . . . . . . . . . . . . $243 $54 $236
See further discussion of operating income below under ‘‘Segment Results.’’
Non-Operating Items
The following table presents select non-operating items, as well as the changes from the prior fiscalyear:
Fiscal Fiscal2015 2014Fiscal versus versus
2015 2014 2013 2014 2013
($ in millions)
Interest expense . . . . . . . . . . . . . . . . . . . . . . . . . . . . . . . . . . $ 136 $127 $ 139 $ 9 $ (12)Other income (expense), net . . . . . . . . . . . . . . . . . . . . . . . . . $ (55) $ 63 $(183) $ (118) $ 246
Income tax provision (benefit) . . . . . . . . . . . . . . . . . . . . . . . . $ 337 $146 $ (75) $ 191 $ 221Effective tax rate . . . . . . . . . . . . . . . . . . . . . . . . . . . . . . . 21.4% 8.3% NM(1) 13.1% NM(1)
Income from discontinued operations, net of income taxes . . . $1,182 $167 $ 122 $1,015 $ 45
(1) Not meaningful.
21

Interest Expense. The increase in interest expense of $9 million in fiscal 2015 from fiscal 2014 wasdue to higher average debt levels. The decrease of $12 million in fiscal 2014 from fiscal 2013 was dueto a lower average cost of debt.
Other Income (Expense), Net. In fiscal 2015, 2014, and 2013, we recorded net other income(expense) primarily pursuant to the Tax Sharing Agreement with Tyco International and Covidien. SeeNote 12 to the Consolidated Financial Statements for further information regarding the Tax SharingAgreement.
Net other expense in fiscal 2015 included $84 million related to the effective settlement ofundisputed tax matters for the years 2001 through 2007. Net other income in fiscal 2014 included$18 million of income related to our share of a settlement agreement entered into by TycoInternational with a former subsidiary, CIT Group Inc., which arose from a pre-separation claim forwhich we were entitled to 31% once resolved. Net other expense in fiscal 2013 included $231 millionrelated to the effective settlement of all undisputed tax matters for the years 1997 through 2000. SeeNote 13 to the Consolidated Financial Statements for additional information regarding the effectivesettlement of undisputed tax matters.
Income Taxes. The tax provision for fiscal 2015 reflects an income tax benefit of $264 millionrelated to the effective settlement of all undisputed tax matters for the years 2001 through 2010,partially offset by $216 million of income tax charges associated with the tax impacts of certainintercompany legal entity restructurings made in connection with our integration of MeasurementSpecialties. Also, the tax provision for fiscal 2015 reflects an income tax charge of $29 millionassociated with the tax impacts of certain intercompany dividends related to the restructuring and saleof BNS.
The tax provision for fiscal 2014 reflects income tax benefits of $282 million recognized inconnection with a reduction in the valuation allowance associated with certain ADC tax losscarryforwards, partially offset by an income tax charge related to adjustments to prior year income taxreturns.
In fiscal 2014, we acquired SEACON, and its U.S. operations were combined with our ADC U.S.federal consolidated tax group. In addition, the ADC U.S. tax group was combined with other U.S.legal entities and assets. We reassessed the realization of the revised ADC U.S. tax group’s tax loss andcredit carryforwards. Based upon management’s review of forecasted future taxable income of thereorganized combined tax group, we believed it was more likely than not that a tax benefit would berealized on additional U.S. federal and state net operating losses. Accordingly, we reduced thevaluation allowance and recorded a tax benefit of $282 million.
The tax benefit for fiscal 2013 reflects an income tax benefit of $331 million related to theeffective settlement of all undisputed tax matters for the years 1997 through 2000. In addition, the taxbenefit for fiscal 2013 reflects $23 million of net tax benefits consisting primarily of income tax benefitsrecognized in connection with a reduction in the valuation allowance associated with certain ADC taxloss carryforwards and income tax benefits recognized in connection with the lapse of statutes oflimitations for examinations of prior year income tax returns, partially offset by income tax expenserelated to adjustments to prior year income tax returns.
The valuation allowance for deferred tax assets of $3,237 million and $1,706 million at fiscal yearend 2015 and 2014, respectively, relates principally to the uncertainty of the utilization of certaindeferred tax assets, primarily tax loss, capital loss, and credit carryforwards in various jurisdictions.During fiscal 2015, the valuation allowance increased due primarily to tax losses of $1,381 million (taxeffected) generated in connection with the write-down of investments in subsidiaries in certainjurisdictions where future utilization is uncertain. We believe that we will generate sufficient future
22

taxable income to realize the income tax benefits related to the remaining net deferred tax assets onthe Consolidated Balance Sheet.
We have provided income taxes for earnings that are currently distributed as well as the taxesassociated with several subsidiaries’ earnings that are expected to be distributed in the future. Noadditional provision has been made for Swiss or non-Swiss income taxes on the undistributed earningsof subsidiaries or for unrecognized deferred tax liabilities for temporary differences related to basisdifferences in investments in subsidiaries, as such earnings are expected to be permanently reinvested,the investments are essentially permanent in duration, or we have concluded that no additional taxliability will arise as a result of the distribution of such earnings. As of September 25, 2015, certainsubsidiaries had approximately $19 billion of cumulative undistributed earnings that have been retainedindefinitely and reinvested in our global manufacturing operations, including working capital; property,plant, and equipment; intangible assets; and research and development activities. A liability could ariseif our intention to permanently reinvest such earnings were to change and amounts are distributed bysuch subsidiaries or if such subsidiaries are ultimately disposed. It is not practicable to estimate theadditional income taxes related to permanently reinvested earnings or the basis differences related toinvestments in subsidiaries.
Segment Results
Transportation Solutions
Net Sales. The following table presents the Transportation Solutions segment’s net sales and thepercentage of total net sales by primary industry end market(1):
Fiscal
2015 2014 2013
($ in millions)
Automotive . . . . . . . . . . . . . . . . . . . . . . . . . . . . . . . . $4,795 75% $5,011 82% $4,571 83%Commercial Transportation . . . . . . . . . . . . . . . . . . . . . 807 13 879 15 725 13Sensors . . . . . . . . . . . . . . . . . . . . . . . . . . . . . . . . . . . 749 12 200 3 189 4
Total . . . . . . . . . . . . . . . . . . . . . . . . . . . . . . . . . . . $6,351 100% $6,090 100% $5,485 100%
(1) Industry end market information is presented consistently with our internal management reporting and may be revisedperiodically as management deems necessary.
The following table provides an analysis of the change in the Transportation Solutions segment’snet sales compared to the prior fiscal year by primary industry end market:
Fiscal
2015 2014
Change in Net Sales versus Prior Fiscal Year Change in Net Sales versus Prior Fiscal Year
Organic Translation Acquisitions Total Organic Translation Acquisition Total
($ in millions)Automotive . . . . . . . . . . . . . . $256 5.1% $(472) $ — $(216) (4.3)% $413 9.0% $27 $— $440 9.6%Commercial Transportation . . . . . (9) (1.0) (63) — (72) (8.2) 153 20.8 1 — 154 21.2Sensors . . . . . . . . . . . . . . . . 3 1.5 (21) 567 549 274.5 4 1.6 5 2 11 5.8
Total . . . . . . . . . . . . . . . . . $250 4.1% $(556) $567 $ 261 4.3% $570 10.4% $33 $ 2 $605 11.0%
Net sales in the Transportation Solutions segment increased $261 million, or 4.3%, in fiscal 2015 ascompared to fiscal 2014 as a result of sales contributions from acquisitions of 9.3% and organic salesgrowth of 4.1%, partially offset by the negative impact of foreign currency translation of 9.1%.
23

Measurement Specialties contributed net sales of $548 million during fiscal 2015. Our organic net salesby primary industry end market were as follows:
• Automotive—Our organic net sales increased 5.1% in fiscal 2015 with growth of 8.2% in theAsia–Pacific region, 4.4% in the EMEA region, and 0.8% in the Americas region. Growth in theAsia–Pacific and EMEA regions and North America was driven primarily by increased contentper vehicle. This growth was partially offset by weakness in South America driven by lowerproduction volumes in Brazil.
• Commercial transportation—Our organic net sales decreased 1.0% in fiscal 2015 due to lowerdemand in the agriculture market across all regions, partially offset by growth in the heavy truckmarket in developed countries.
• Sensors—Our organic net sales increased 1.5% in fiscal 2015 due to new product launches inChina and increased volume in Japan, partially offset by market weakness in Korea and EasternEurope.
In fiscal 2014, net sales in the Transportation Solutions segment increased $605 million, or 11.0%,from fiscal 2013 primarily as a result of organic sales growth of 10.4% and the positive impact offoreign currency translation of 0.6%. Our organic net sales by primary industry end market were asfollows:
• Automotive—Our organic net sales increased 9.0% in fiscal 2014. The increase was due primarilyto growth of 11.6% in the Asia–Pacific region, 7.8% in the EMEA region, and 7.0% in theAmericas region. In the Asia–Pacific region, growth was driven by increased demand in Chinaand, to a lesser degree, Japan, partially offset by declines in certain southeastern Asia–Pacificareas. In the EMEA region, growth resulted primarily from increased demand for exports toother regions and, to a lesser degree, increased local demand. Growth in the Americas regionwas driven by strong consumer demand in North America, partially offset by weaker economicconditions in South America.
• Commercial transportation—Our organic net sales increased 20.8% in fiscal 2014 due to strongermarket conditions, strength in the North America truck market, and the acceleration ofpurchases related to emission standard changes in China and the EMEA region.
• Sensors—Our organic net sales increased 1.6% in fiscal 2014 due to growth in the Americas andEMEA regions, partially offset by a decline in the Asia–Pacific region.
Operating Income. The following table presents the Transportation Solutions segment’s operatingincome and operating margin, as well as the changes from the prior fiscal year:
Fiscal Fiscal2015 2014Fiscal versus versus
2015 2014 2013 2014 2013
($ in millions)
Operating income . . . . . . . . . . . . . . . . . . . $1,193 $1,245 $ 934 $ (52) $311Operating margin . . . . . . . . . . . . . . . . . . 18.8% 20.4% 17.0% (1.6)% 3.4%
24
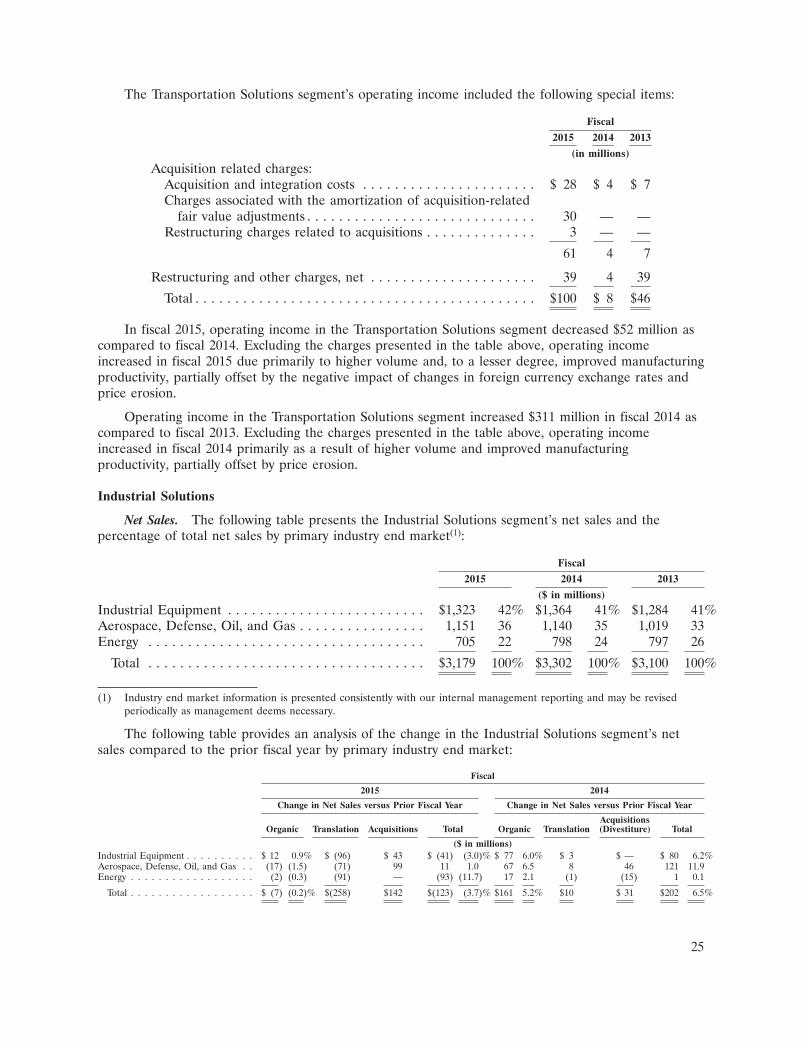
The Transportation Solutions segment’s operating income included the following special items:
Fiscal
2015 2014 2013
(in millions)
Acquisition related charges:Acquisition and integration costs . . . . . . . . . . . . . . . . . . . . . . $ 28 $ 4 $ 7Charges associated with the amortization of acquisition-related
fair value adjustments . . . . . . . . . . . . . . . . . . . . . . . . . . . . . 30 — —Restructuring charges related to acquisitions . . . . . . . . . . . . . . 3 — —
61 4 7
Restructuring and other charges, net . . . . . . . . . . . . . . . . . . . . . 39 4 39
Total . . . . . . . . . . . . . . . . . . . . . . . . . . . . . . . . . . . . . . . . . . . $100 $ 8 $46
In fiscal 2015, operating income in the Transportation Solutions segment decreased $52 million ascompared to fiscal 2014. Excluding the charges presented in the table above, operating incomeincreased in fiscal 2015 due primarily to higher volume and, to a lesser degree, improved manufacturingproductivity, partially offset by the negative impact of changes in foreign currency exchange rates andprice erosion.
Operating income in the Transportation Solutions segment increased $311 million in fiscal 2014 ascompared to fiscal 2013. Excluding the charges presented in the table above, operating incomeincreased in fiscal 2014 primarily as a result of higher volume and improved manufacturingproductivity, partially offset by price erosion.
Industrial Solutions
Net Sales. The following table presents the Industrial Solutions segment’s net sales and thepercentage of total net sales by primary industry end market(1):
Fiscal
2015 2014 2013
($ in millions)
Industrial Equipment . . . . . . . . . . . . . . . . . . . . . . . . . $1,323 42% $1,364 41% $1,284 41%Aerospace, Defense, Oil, and Gas . . . . . . . . . . . . . . . . 1,151 36 1,140 35 1,019 33Energy . . . . . . . . . . . . . . . . . . . . . . . . . . . . . . . . . . . 705 22 798 24 797 26
Total . . . . . . . . . . . . . . . . . . . . . . . . . . . . . . . . . . . $3,179 100% $3,302 100% $3,100 100%
(1) Industry end market information is presented consistently with our internal management reporting and may be revisedperiodically as management deems necessary.
The following table provides an analysis of the change in the Industrial Solutions segment’s netsales compared to the prior fiscal year by primary industry end market:
Fiscal
2015 2014
Change in Net Sales versus Prior Fiscal Year Change in Net Sales versus Prior Fiscal Year
AcquisitionsOrganic Translation Acquisitions Total Organic Translation (Divestiture) Total
($ in millions)Industrial Equipment . . . . . . . . . . $ 12 0.9% $ (96) $ 43 $ (41) (3.0)% $ 77 6.0% $ 3 $ — $ 80 6.2%Aerospace, Defense, Oil, and Gas . . (17) (1.5) (71) 99 11 1.0 67 6.5 8 46 121 11.9Energy . . . . . . . . . . . . . . . . . . (2) (0.3) (91) — (93) (11.7) 17 2.1 (1) (15) 1 0.1
Total . . . . . . . . . . . . . . . . . . $ (7) (0.2)% $(258) $142 $(123) (3.7)% $161 5.2% $10 $ 31 $202 6.5%
25

In the Industrial Solutions segment, net sales decreased $123 million, or 3.7%, in fiscal 2015 fromfiscal 2014 due primarily to the negative impact of foreign currency translation of 7.8%, partially offsetby sales contributions from acquisitions of 4.3%. Our organic net sales by primary industry end marketwere as follows:
• Industrial equipment—Our organic net sales were flat in fiscal 2015 as growth in the Asia–Pacificand EMEA regions was offset by lower demand in the Americas region.
• Aerospace, defense, oil, and gas—Our organic net sales decreased 1.5% in fiscal 2015 dueprimarily to weakness in the oil and gas market resulting from oil price declines and marketuncertainty, partially offset by continued strength in our commercial aviation business.
• Energy—Our organic net sales were flat in fiscal 2015 as growth in the Americas region wasoffset by declines in the Asia–Pacific region.
Net sales in the Industrial Solutions segment increased $202 million, or 6.5%, in fiscal 2014 ascompared to fiscal 2013 primarily as a result of organic sales growth of 5.2% and the net sales impactfrom acquisitions and a divestiture of 1.0%. Our organic net sales by primary industry end market wereas follows:
• Industrial equipment—Our organic net sales increased 6.0% in fiscal 2014 as a result of marketrecovery, particularly in the Asia–Pacific region and, to a lesser degree, the EMEA region.
• Aerospace, defense, oil, and gas—Our organic net sales increased 6.5% in fiscal 2014. Theincrease was attributable to continued strength in the commercial aviation business and growthin the oil and gas market, partially offset by continued weakness in the defense market.
• Energy—Our organic net sales increased 2.1% in fiscal 2014 primarily as a result of growth inthe Asia–Pacific and Americas regions, partially offset by a decline in the EMEA region.
Operating Income. The following table presents the Industrial Solutions segment’s operatingincome and operating margin, as well as the changes from the prior fiscal year:
Fiscal Fiscal2015 2014Fiscal versus versus
2015 2014 2013 2014 2013
($ in millions)
Operating income . . . . . . . . . . . . . . . . . . . . . $ 352 $ 431 $ 344 $ (79) $ 87Operating margin . . . . . . . . . . . . . . . . . . . 11.1% 13.1% 11.1% (2.0)% 2.0%
The Industrial Solutions segment’s operating income included the following special items:
Fiscal
2015 2014 2013
(in millions)
Acquisition related charges:Acquisition and integration costs . . . . . . . . . . . . . . . . . . . . . . . $27 $27 $ 7Charges associated with the amortization of acquisition-related
fair value adjustments . . . . . . . . . . . . . . . . . . . . . . . . . . . . . 6 4 —
33 31 7Restructuring and other charges, net . . . . . . . . . . . . . . . . . . . . . . 44 7 63
Total . . . . . . . . . . . . . . . . . . . . . . . . . . . . . . . . . . . . . . . . . . . $77 $38 $70
In fiscal 2015, operating income in the Industrial Solutions segment decreased $79 million ascompared to fiscal 2014. Excluding the charges presented in the table above, operating income
26
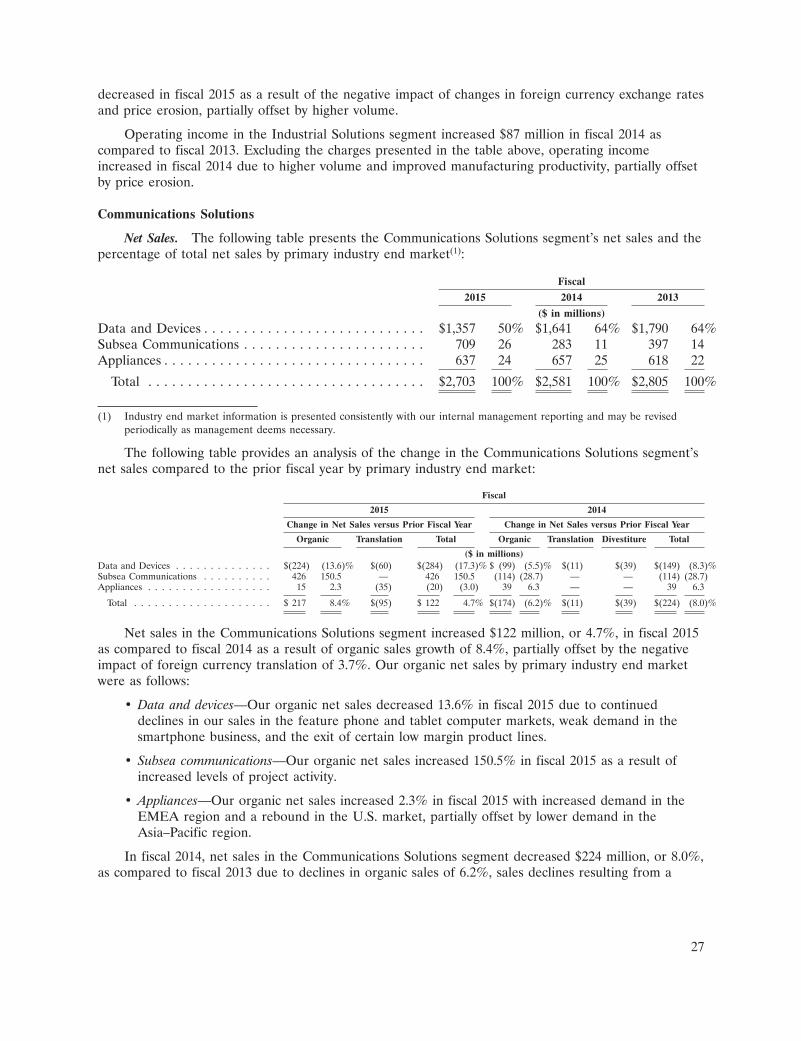
decreased in fiscal 2015 as a result of the negative impact of changes in foreign currency exchange ratesand price erosion, partially offset by higher volume.
Operating income in the Industrial Solutions segment increased $87 million in fiscal 2014 ascompared to fiscal 2013. Excluding the charges presented in the table above, operating incomeincreased in fiscal 2014 due to higher volume and improved manufacturing productivity, partially offsetby price erosion.
Communications Solutions
Net Sales. The following table presents the Communications Solutions segment’s net sales and thepercentage of total net sales by primary industry end market(1):
Fiscal
2015 2014 2013
($ in millions)
Data and Devices . . . . . . . . . . . . . . . . . . . . . . . . . . . . $1,357 50% $1,641 64% $1,790 64%Subsea Communications . . . . . . . . . . . . . . . . . . . . . . . 709 26 283 11 397 14Appliances . . . . . . . . . . . . . . . . . . . . . . . . . . . . . . . . . 637 24 657 25 618 22
Total . . . . . . . . . . . . . . . . . . . . . . . . . . . . . . . . . . . $2,703 100% $2,581 100% $2,805 100%
(1) Industry end market information is presented consistently with our internal management reporting and may be revisedperiodically as management deems necessary.
The following table provides an analysis of the change in the Communications Solutions segment’snet sales compared to the prior fiscal year by primary industry end market:
Fiscal
2015 2014
Change in Net Sales versus Prior Fiscal Year Change in Net Sales versus Prior Fiscal Year
Organic Translation Total Organic Translation Divestiture Total
($ in millions)Data and Devices . . . . . . . . . . . . . . $(224) (13.6)% $(60) $(284) (17.3)% $ (99) (5.5)% $(11) $(39) $(149) (8.3)%Subsea Communications . . . . . . . . . . 426 150.5 — 426 150.5 (114) (28.7) — — (114) (28.7)Appliances . . . . . . . . . . . . . . . . . . 15 2.3 (35) (20) (3.0) 39 6.3 — — 39 6.3
Total . . . . . . . . . . . . . . . . . . . . $ 217 8.4% $(95) $ 122 4.7% $(174) (6.2)% $(11) $(39) $(224) (8.0)%
Net sales in the Communications Solutions segment increased $122 million, or 4.7%, in fiscal 2015as compared to fiscal 2014 as a result of organic sales growth of 8.4%, partially offset by the negativeimpact of foreign currency translation of 3.7%. Our organic net sales by primary industry end marketwere as follows:
• Data and devices—Our organic net sales decreased 13.6% in fiscal 2015 due to continueddeclines in our sales in the feature phone and tablet computer markets, weak demand in thesmartphone business, and the exit of certain low margin product lines.
• Subsea communications—Our organic net sales increased 150.5% in fiscal 2015 as a result ofincreased levels of project activity.
• Appliances—Our organic net sales increased 2.3% in fiscal 2015 with increased demand in theEMEA region and a rebound in the U.S. market, partially offset by lower demand in theAsia–Pacific region.
In fiscal 2014, net sales in the Communications Solutions segment decreased $224 million, or 8.0%,as compared to fiscal 2013 due to declines in organic sales of 6.2%, sales declines resulting from a
27

divestiture of 1.4%, and the negative impact of foreign currency translation of 0.4%. Our organic netsales by primary industry end market were as follows:
• Data and devices—Our organic net sales decreased 5.5% in fiscal 2014 due to the exit of certainproduct lines and weak demand in the datacenter, mobile phone, and personal computermarkets, partially offset by increased demand and new product launches in the tablet computermarket.
• Subsea communications—Our organic net sales decreased 28.7% in fiscal 2014 due to lowerproject volume.
• Appliances—Our organic net sales increased 6.3% in fiscal 2014 due primarily to increaseddemand and share gains in the Asia–Pacific region and, to a lesser degree, the Americas region.
Operating Income. The following table presents the Communications Solutions segment’soperating income and operating margin, as well as the changes from the prior fiscal year:
Fiscal Fiscal2015 2014Fiscal versus versus
2015 2014 2013 2014 2013
($ in millions)
Operating income . . . . . . . . . . . . . . . . . . . . . . $204 $129 $107 $ 75 $ 22Operating margin . . . . . . . . . . . . . . . . . . . . . 7.5% 5.0% 3.8% 2.5% 1.2%
The Communications Solutions segment’s operating income included the following special items:
Fiscal
2015 2014 2013
(in millions)
Restructuring and other charges, net . . . . . . . . . . . . . . . . . . . . . $66 $8 $120
In fiscal 2015, operating income in the Communications Solutions segment increased $75 million ascompared to fiscal 2014. Excluding the charges presented in the table above, operating incomeincreased in fiscal 2015, due primarily to improved manufacturing productivity, partially offset by priceerosion.
Operating income in the Communications Solutions segment increased $22 million fiscal 2014 ascompared to fiscal 2013. Excluding the charges presented in the table above, operating incomedecreased in fiscal 2014 as a result of lower volume and price erosion, partially offset by improvedmanufacturing productivity.
Liquidity and Capital Resources
The following table summarizes our cash flow from operating, investing, and financing activities, asreflected on the Consolidated Statements of Cash Flows:
Fiscal
2015 2014 2013
(in millions)
Net cash provided by operating activities . . . . . . . . . . . $ 1,913 $ 2,083 $ 2,046Net cash provided by (used in) investing activities . . . . . 636 (1,075) (545)Net cash provided by (used in) financing activities . . . . (1,606) 65 (1,678)Effect of currency translation on cash . . . . . . . . . . . . . (71) (19) (9)
Net increase (decrease) in cash and cash equivalents . $ 872 $ 1,054 $ (186)
28

Our ability to fund our future capital needs will be affected by our ability to continue to generatecash from operations and may be affected by our ability to access the capital markets, money markets,or other sources of funding, as well as the capacity and terms of our financing arrangements. Webelieve that cash generated from operations and, to the extent necessary, these other sources ofpotential funding will be sufficient to meet our anticipated capital needs for the foreseeable future,including the payment of $500 million of senior floating rate notes due in January 2016. We may useexcess cash to reduce our outstanding debt, including through the possible repurchase of our debt inaccordance with applicable law, to purchase a portion of our common shares pursuant to ourauthorized share repurchase program, to pay distributions or dividends on our common shares, or toacquire strategic businesses or product lines. The cost or availability of future funding may be impactedby financial market conditions. We will continue to monitor financial markets and respond as necessaryto changing conditions.
As of September 25, 2015, our cash and cash equivalents were held in subsidiaries which arelocated in various countries throughout the world. Under current applicable laws, substantially all ofthese amounts can be repatriated to Tyco Electronics Group S.A. (‘‘TEGSA’’), our Luxembourgsubsidiary, which is the obligor of substantially all of our debt, and to TE Connectivity Ltd., our Swissparent company; however, the repatriation of these amounts could subject us to additional tax costs.We provide for tax liabilities on the Consolidated Financial Statements with respect to amounts that weexpect to repatriate; however, no tax liabilities are recorded for amounts that we consider to beretained indefinitely and reinvested in our global manufacturing operations. As of September 25, 2015,we had approximately $5.2 billion of cash, cash equivalents, and intercompany deposits, principally inour subsidiaries, that we have the ability to distribute to TEGSA, our Luxembourg subsidiary, and TEConnectivity Ltd., our Swiss parent company, but we consider to be permanently reinvested. Weestimate that up to approximately $1.7 billion of tax expense would be recognized on the ConsolidatedFinancial Statements if our intention to permanently reinvest these amounts were to change. Ourcurrent plans do not demonstrate a need to repatriate cash, cash equivalents, and intercompanydeposits that are designated as permanently reinvested in order to fund our operations, includinginvesting and financing activities.
Cash Flows from Operating Activities
Net cash provided by continuing operating activities decreased $185 million to $1,619 million infiscal 2015 as compared to $1,804 million in fiscal 2014. The decrease resulted primarily from theunfavorable effects of changes in working capital levels, partially offset by a decrease in net paymentsmade in relation to pre-separation tax matters.
Net cash provided by continuing operating activities was $1,804 million in fiscal 2014 as comparedto $1,775 million in fiscal 2013. The increase resulted primarily from higher income levels, partiallyoffset by higher accounts receivable levels and net payments made in relation to pre-separation taxmatters.
Pension and postretirement benefit contributions in fiscal 2015, 2014, and 2013 were $68 million,$89 million, and $95 million, respectively. We expect pension and postretirement benefit contributionsto be $75 million in fiscal 2016, before consideration of any voluntary contributions. There were novoluntary pension contributions in fiscal 2015, 2014, and 2013.
The amount of income taxes paid, net of refunds, during fiscal 2015, 2014, and 2013 was$350 million, $259 million, and $299 million, respectively. In fiscal 2015 and 2013, these paymentsincluded $47 million and $67 million, respectively, for tax deficiencies related to pre-separation taxmatters. Also during fiscal 2015 and 2013, we received net reimbursements of $7 million and$39 million, respectively, from Tyco International and Covidien pursuant to their indemnifications forpre-separation U.S. tax matters. During fiscal 2014, we made net payments of $179 million to Tyco
29

International and Covidien pursuant to our indemnifications for pre-separations U.S. tax matters. SeeNote 13 to the Consolidated Financial Statements for additional information related to pre-separationtax matters.
In addition to net cash provided by operating activities, we use free cash flow, a non-GAAPfinancial measure, as a useful measure of our ability to generate cash. Free cash flow was$1,076 million in fiscal 2015 as compared to $1,477 million in fiscal 2014 and $1,244 million in fiscal2013. The following table sets forth a reconciliation of net cash provided by continuing operatingactivities, the most comparable GAAP financial measure, to free cash flow.
Fiscal
2015 2014 2013
(in millions)
Net cash provided by continuing operating activities . . . . . $1,619 $1,804 $1,775Capital expenditures . . . . . . . . . . . . . . . . . . . . . . . . . . . . (600) (635) (581)Proceeds from sale of property, plant, and equipment . . . . 17 129 22Payments related to pre-separation U.S. tax matters, net . . 40 179 28
Free cash flow . . . . . . . . . . . . . . . . . . . . . . . . . . . . . . $1,076 $1,477 $1,244
Cash Flows from Investing Activities
Capital expenditures were $600 million, $635 million, and $581 million in fiscal 2015, 2014, and2013, respectively. We expect fiscal 2016 capital spending levels to be approximately 5% of net sales.We believe our capital funding levels are adequate to support new programs, and we continue to investin our manufacturing infrastructure to further enhance productivity and manufacturing capabilities.
Proceeds from the sale of property, plant, and equipment for fiscal 2014 included approximately$100 million related to the sale of real estate.
During fiscal 2015, we acquired Measurement Specialties. The total value paid for the transactionwas approximately $1.7 billion, net of cash acquired, and included $225 million for the repayment ofMeasurement Specialties’ debt and accrued interest. Also during fiscal 2015, we acquired threeadditional companies for $241 million in cash, net of cash acquired. During fiscal 2014, we acquiredfive companies for $522 million in cash, net of cash acquired. See additional information in Note 5 tothe Consolidated Financial Statements.
During fiscal 2015, we received net cash proceeds of $3.0 billion related to the sale of our BNSbusiness. See additional information in Note 4 to the Consolidated Financial Statements.
Cash Flows from Financing Activities and Capitalization
Total debt at fiscal year end 2015 and 2014 was $3,903 million and $3,858 million, respectively. SeeNote 11 to the Consolidated Financial Statements for additional information regarding debt.
During February 2015, TEGSA, our 100%-owned subsidiary, repaid, at maturity, $250 million of1.60% senior notes due 2015.
In February 2015, TEGSA issued A550 million aggregate principal amount of 1.100% senior notesdue March 1, 2023. The notes are TEGSA’s unsecured senior obligations and rank equally in right ofpayment with all existing and any future senior indebtedness of TEGSA and senior to any subordinatedindebtedness that TEGSA may incur.
TEGSA has a five-year unsecured senior revolving credit facility (‘‘Credit Facility’’) with totalcommitments of $1,500 million. The Credit Facility was amended in August 2013 primarily to extendthe maturity date from June 2016 to August 2018 and reduce borrowing costs. TEGSA had noborrowings under the Credit Facility at September 25, 2015 and September 26, 2014.
30

The Credit Facility contains a financial ratio covenant providing that if, as of the last day of eachfiscal quarter, our ratio of Consolidated Total Debt to Consolidated EBITDA (as defined in the CreditFacility) for the then most recently concluded period of four consecutive fiscal quarters exceeds 3.75 to1.0, an Event of Default (as defined in the Credit Facility) is triggered. The Credit Facility and ourother debt agreements contain other customary covenants. None of our covenants are presentlyconsidered restrictive to our operations. As of September 25, 2015, we were in compliance with all ofour debt covenants and believe that we will continue to be in compliance with our existing covenantsfor the foreseeable future.
Periodically, TEGSA issues commercial paper to U.S. institutional accredited investors andqualified institutional buyers in accordance with available exemptions from the registrationrequirements of the Securities Act of 1933 as part of our ongoing effort to maintain financial flexibilityand to potentially decrease the cost of borrowings. Borrowings under the commercial paper programare backed by the Credit Facility.
TEGSA’s payment obligations under its senior notes, commercial paper, and Credit Facility arefully and unconditionally guaranteed by its parent, TE Connectivity Ltd.
Payments of common share dividends and cash distributions to shareholders were $502 million,$443 million, and $384 million in fiscal 2015, 2014, and 2013, respectively. See Note 19 to theConsolidated Financial Statements for additional information regarding dividends and cash distributionson our common shares.
Future dividends on our common shares or reductions of registered share capital for distribution toshareholders, if any, must be approved by our shareholders. In exercising their discretion to recommendto the shareholders that such dividends or distributions be approved, our board of directors willconsider our results of operations, cash requirements and surplus, financial condition, statutoryrequirements of applicable law, contractual restrictions, and other factors that they may deem relevant.
During fiscal 2015, our board of directors authorized an increase of $3.0 billion in the sharerepurchase program. We repurchased approximately 18 million of our common shares for$1,163 million, approximately 11 million of our common shares for $604 million, and approximately20 million of our common shares for $829 million during fiscal 2015, 2014, and 2013, respectively. AtSeptember 25, 2015, we had $2.7 billion of availability remaining under our share repurchaseauthorization.
Commitments and Contingencies
The following table provides a summary of our contractual obligations and commitments for debt,minimum lease payment obligations under non-cancelable leases, and other obligations at fiscal yearend 2015:
Payments Due by Fiscal Year
Total 2016 2017 2018 2019 2020 Thereafter
(in millions)
Long-term debt, including current maturities . . . . . . . . $3,903 $ 500 $ — $718 $574 $ — $2,111Interest on long-term debt(1) . . . . . . . . . . . . . . . . . . . . 1,245 140 140 116 89 79 681Operating leases . . . . . . . . . . . . . . . . . . . . . . . . . . . . 344 98 76 59 44 30 37Purchase obligations(2) . . . . . . . . . . . . . . . . . . . . . . . . 341 300 24 3 2 2 10
Total contractual cash obligations(3)(4)(5) . . . . . . . . . . $5,833 $1,038 $240 $896 $709 $111 $2,839
(1) Interest payments exclude the impact of our interest rate swaps.
(2) Purchase obligations consist primarily of commitments for purchases of goods and services.
31

(3) The table above does not reflect unrecognized income tax benefits of $1,368 million and related accrued interest andpenalties of $1,076 million, the timing of which is uncertain. See Note 16 to the Consolidated Financial Statements foradditional information regarding unrecognized income tax benefits, interest, and penalties.
(4) The table above does not reflect pension and postretirement benefit obligations to certain employees and formeremployees. We are obligated to make contributions to our pension plans and postretirement benefit plans; however, we areunable to determine the amount of plan contributions due to the inherent uncertainties of obligations of this type, includingtiming, interest rate charges, investment performance, and amounts of benefit payments. We expect to contribute$75 million to pension and postretirement benefit plans in fiscal 2016, before consideration of voluntary contributions.These plans and our estimates of future contributions and benefit payments are more fully described in Note 15 to theConsolidated Financial Statements.
(5) Other long-term liabilities of $433 million are excluded from the table above as we are unable to estimate the timing ofpayment for these items.
Legal Proceedings
In the ordinary course of business, we are subject to various legal proceedings and claims,including patent infringement claims, product liability matters, employment disputes, disputes onagreements, other commercial disputes, environmental matters, antitrust claims, and tax matters,including non-income tax matters such as value added tax, sales and use tax, real estate tax, andtransfer tax. Although it is not feasible to predict the outcome of these proceedings, based upon ourexperience, current information, and applicable law, we do not expect that the outcome of theseproceedings, either individually or in the aggregate, will have a material effect on our results ofoperations, financial position, or cash flows. However, the proceedings discussed below in ‘‘Income TaxMatters’’ could have a material effect on our results of operations, financial position, or cash flows. See‘‘Part I. Item 3. Legal Proceedings’’ of our Annual Report on Form 10-K for the fiscal year endedSeptember 25, 2015 filed with the SEC for further information regarding legal proceedings.
As previously reported, we had a contingent purchase price commitment of $80 million related toour fiscal 2001 acquisition of Com-Net. This represented the maximum amount payable to the formershareholders of Com-Net only after the construction and installation of a communications system wascompleted for and approved by the State of Florida in accordance with guidelines set forth in thecontract. Under the terms of the purchase and sale agreement, we did not believe we had anyobligation to the sellers. However, the sellers contested our position and initiated a lawsuit in June2006 in the Court of Common Pleas in Allegheny County, Pennsylvania. Trial began in March 2015 andculminated in the entry of final judgment on October 8, 2015, in favor of the sellers and against us for$127 million plus costs. The judgment represents the $80 million contingent purchase price pluspre-judgment interest, which will continue to accrue until the judgment is paid in full. We areproceeding with an appeal. In connection with this case, we recorded a reserve and pre-tax charges of$127 million in fiscal 2015. These charges are reflected in income from discontinued operations on theConsolidated Statement of Operations as the Com-Net case was associated with our former WirelessSystems business which was sold in fiscal 2009.
Income Tax Matters
In connection with the separation from Tyco International in 2007, we entered into a Tax SharingAgreement that generally governs our, Tyco International’s, and Covidien’s respective rights,responsibilities, and obligations with respect to taxes for periods prior to and including June 29, 2007.See Note 12 to the Consolidated Financial Statements for additional information regarding the TaxSharing Agreement. Pursuant to the Tax Sharing Agreement, we entered into certain guaranteecommitments and indemnifications with Tyco International and Covidien. See ‘‘Income Tax Matters’’ inNote 13 to the Consolidated Financial Statements for further information regarding income taxmatters, including the disputed issue related to the tax treatment of certain intercompany debttransactions.
32

Off-Balance Sheet Arrangements
In certain instances, we have guaranteed the performance of third parties and provided financialguarantees for uncompleted work and financial commitments. The terms of these guarantees vary withend dates ranging from fiscal 2016 through the completion of such transactions. The guarantees wouldbe triggered in the event of nonperformance, and the potential exposure for nonperformance under theguarantees would not have a material effect on our results of operations, financial position, or cashflows.
In disposing of assets or businesses, we often provide representations, warranties, and/orindemnities to cover various risks including unknown damage to assets, environmental risks involved inthe sale of real estate, liability for investigation and remediation of environmental contamination atwaste disposal sites and manufacturing facilities, and unidentified tax liabilities and legal fees related toperiods prior to disposition. We do not expect that these uncertainties will have a material adverseeffect on our results of operations, financial position, or cash flows.
At September 25, 2015, we had outstanding letters of credit, letters of guarantee, and surety bondsin the amount of $360 million.
In the normal course of business, we are liable for contract completion and product performance.In the opinion of management, such obligations will not significantly affect our results of operations,financial position, or cash flows.
Critical Accounting Policies and Estimates
The preparation of the Consolidated Financial Statements in conformity with GAAP requiresmanagement to make estimates and assumptions that affect the reported amounts of assets andliabilities, the disclosure of contingent assets and liabilities, and the reported amounts of revenue andexpenses. Our significant accounting policies are summarized in Note 2 to the Consolidated FinancialStatements. The following accounting policies are considered to be the most critical as they requiresignificant judgments and assumptions that involve inherent risks and uncertainties. Management’sestimates are based on the relevant information available at the end of each period.
Revenue Recognition
Our revenue recognition policies are in accordance with ASC 605, Revenue Recognition. Ourrevenues are generated principally from the sale of our products. Revenue from the sale of products isrecognized at the time title and the risks and rewards of ownership pass to the customer. This generallyoccurs when the products reach the shipping point, the sales price is fixed and determinable, andcollection is reasonably assured. A reserve for estimated returns is established at the time of sale basedon historical return experience and is recorded as a reduction of sales. Other allowances includecustomer quantity and price discrepancies. A reserve for other allowances is generally established at thetime of sale based on historical experience and also is recorded as a reduction of sales.
Contract revenues for construction related projects, which are generated in the CommunicationsSolutions segment, are recorded primarily using the percentage-of-completion method. Profitsrecognized on contracts in process are based upon estimated contract revenue and related cost tocomplete. Percentage-of-completion is measured based on the ratio of actual costs incurred to totalestimated costs. Revisions in cost estimates as contracts progress have the effect of increasing ordecreasing profits in the current period. Provisions for anticipated losses are made in the period inwhich they first become determinable. In addition, provisions for credit losses related to constructionrelated projects are recorded as reductions of revenue in the period in which they first becomedeterminable.
33

Goodwill and Other Intangible Assets
Intangible assets include both indeterminable-lived residual goodwill and determinable-livedidentifiable intangible assets. Intangible assets with a determinable life primarily include intellectualproperty, consisting of patents, trademarks, and unpatented technology, as well as customerrelationships. Recoverability estimates range from 1 to 50 years and costs are generally amortized on astraight-line basis. An evaluation of the remaining useful life of determinable-lived intangible assets isperformed on a periodic basis and when events and circumstances warrant an evaluation.
We test for goodwill impairment at the reporting unit level. A reporting unit is generally anoperating segment or one level below an operating segment that constitutes a business for whichdiscrete financial information is available and regularly reviewed by segment management. At fiscalyear end 2015, we had seven reporting units, six of which contained goodwill. There are two reportingunits in each of the Transportation Solutions and Industrial Solutions segments, and three reportingunits in the Communications Solutions segment. When changes occur in the composition of one ormore reporting units, goodwill is reassigned to the reporting units affected based on their relative fairvalues. We review our reporting unit structure each year as part of our annual goodwill impairmenttest, or more frequently based on changes in our structure.
Goodwill impairment is evaluated by comparing the carrying value of each reporting unit to its fairvalue on the first day of the fourth fiscal quarter of each year or whenever we believe a triggeringevent requiring a more frequent assessment has occurred. In assessing the existence of a triggeringevent, management relies on a number of reporting-unit-specific factors including operating results,business plans, economic projections, anticipated future cash flows, transactions, and market place data.There are inherent uncertainties related to these factors and management’s judgment in applying thesefactors to the impairment analysis.
When testing for goodwill impairment, we perform a step I goodwill impairment test to identifypotential impairment by comparing the fair value of a reporting unit with its carrying amount. If thecarrying amount of a reporting unit exceeds its fair value, goodwill may be impaired and a step IIgoodwill impairment test is performed to measure the amount of impairment, if any. In the step IIgoodwill impairment test, we compare the implied fair value of reporting unit goodwill with thecarrying amount of that goodwill. If the carrying amount of reporting unit goodwill exceeds the impliedfair value of that goodwill, an impairment loss is recognized in an amount equal to the excess. Theimplied fair value of goodwill is determined in a manner consistent with how goodwill is recognized ina business combination. We allocate the fair value of a reporting unit to all of the assets and liabilitiesof that unit, including intangible assets, as if the reporting unit had been acquired in a businesscombination. Any excess of the fair value of a reporting unit over the amounts assigned to its assetsand liabilities is the implied fair value of goodwill.
Fair value estimates used in the step I goodwill impairment tests are calculated using an incomeapproach based on the present value of future cash flows of each reporting unit. The income approachgenerally has been supported by guideline analyses (a market approach). These approaches incorporatea number of assumptions including future growth rates, discount rates, income tax rates, and marketactivity in assessing fair value and are reporting unit specific. Changes in economic and operatingconditions impacting these assumptions could result in goodwill impairments in future periods.
We completed our annual goodwill impairment test in the fourth quarter of fiscal 2015 anddetermined that no impairment existed.
Income Taxes
In determining income for financial statement purposes, we must make certain estimates andjudgments. These estimates and judgments affect the calculation of certain tax liabilities and the
34

determination of the recoverability of certain deferred tax assets, which arise from temporarydifferences between the income tax return and financial statement recognition of revenue and expense.
In evaluating our ability to recover our deferred tax assets, we consider all available positive andnegative evidence including our past operating results, the existence of cumulative losses in the mostrecent years, and our forecast of future taxable income. In estimating future taxable income, wedevelop assumptions including the amount of future state, federal, and non-U.S. pre-tax operatingincome, the reversal of temporary differences, and the implementation of feasible and prudent taxplanning strategies. These assumptions require significant judgment about the forecasts of futuretaxable income and are consistent with the plans and estimates we are using to manage the underlyingbusinesses.
We currently have recorded significant valuation allowances that we intend to maintain until it ismore likely than not the deferred tax assets will be realized. Our income tax expense recorded in thefuture will be reduced to the extent of decreases in our valuation allowances. The realization of ourremaining deferred tax assets is dependent primarily on future taxable income in the appropriatejurisdictions. Any reduction in future taxable income including any future restructuring activities mayrequire that we record an additional valuation allowance against our deferred tax assets. An increase inthe valuation allowance would result in additional income tax expense in such period and could have asignificant impact on our future earnings. Any changes in a valuation allowance that was established inconnection with an acquisition will be reflected in the income tax provision.
Changes in tax laws and rates also could affect recorded deferred tax assets and liabilities in thefuture. Management is not aware of any such changes that would have a material effect on our resultsof operations, financial position, or cash flows.
In addition, the calculation of our tax liabilities includes estimates for uncertainties in theapplication of complex tax regulations across multiple global jurisdictions where we conduct ouroperations. Under the uncertain tax position provisions of ASC 740, Income Taxes, we recognizeliabilities for tax and related interest for issues in the U.S. and other tax jurisdictions based on ourestimate of whether, and the extent to which, additional taxes and related interest will be due. Inaddition, management reviews with tax counsel various issues raised by certain taxing authorities andthe adequacy of recorded amounts. These tax liabilities and related interest are reflected net of theimpact of related tax loss carryforwards, as such tax loss carryforwards will be applied against these taxliabilities and will reduce the amount of cash tax payments due upon the eventual settlement with thetax authorities. These estimates may change due to changing facts and circumstances. Due to thecomplexity of these uncertainties, the ultimate resolution may result in a settlement that differs fromour current estimate of the tax liabilities and related interest. These tax liabilities and related interestare recorded in income taxes and accrued and other current liabilities on the Consolidated BalanceSheets.
Pension and Postretirement Benefits
Our pension expense and obligations are developed from actuarial assumptions. The funded statusof our defined benefit pension and postretirement benefit plans is recognized on the ConsolidatedBalance Sheets and is measured as the difference between the fair value of plan assets and the benefitobligation at the measurement date. For defined benefit pension plans, the benefit obligation is theprojected benefit obligation, which represents the actuarial present value of benefits expected to bepaid upon retirement factoring in estimated future compensation levels. For the postretirement benefitplans, the benefit obligation is the accumulated postretirement benefit obligation, which represents theactuarial present value of postretirement benefits attributed to employee services already rendered. Thefair value of plan assets represents the current market value of cumulative company and participantcontributions made to irrevocable trust funds, held for the sole benefit of participants, which areinvested by the trustee of the funds. The benefits under pension and postretirement plans are based onvarious factors, such as years of service and compensation.
35

Net periodic pension benefit cost is based on the utilization of the projected unit credit method ofcalculation and is charged to earnings on a systematic basis over the expected average remainingservice lives of current participants.
Two critical assumptions in determining pension expense and obligations are the discount rate andexpected long-term return on plan assets. We evaluate these assumptions at least annually. Otherassumptions reflect demographic factors such as retirement, mortality, and employee turnover. Theseassumptions are evaluated periodically and updated to reflect our actual experience. Actual results maydiffer from actuarial assumptions. The discount rate represents the market rate for high-quality fixedincome investments and is used to calculate the present value of the expected future cash flows forbenefit obligations to be paid under our pension plans. A decrease in the discount rate increases thepresent value of pension benefit obligations. At fiscal year end 2015, a 25 basis point decrease in thediscount rate would have increased the present value of our pension obligations by $136 million; a 25basis point increase would have decreased the present value of our pension obligations by $122 million.We consider the current and expected asset allocations of our pension plans, as well as historical andexpected long-term rates of return on those types of plan assets, in determining the expected long-termrate of return on plan assets. A 50 basis point decrease or increase in the expected long-term return onplan assets would have increased or decreased, respectively, our fiscal 2015 pension expense by$11 million.
The long-term target asset allocation in our U.S. plans’ master trust is 10% equity and 90% fixedincome. Asset re-allocation to meet that target is occurring over a multi-year period based on thefunded status, as defined by the Pension Protection Act of 2006 (the ‘‘Pension Act Funded Status’’), ofthe U.S. plans’ master trust and market conditions. We expect to reach our target allocation when thePension Act Funded Status exceeds 105%. Based on the Pension Act Funded Status as ofSeptember 25, 2015, our target asset allocation is 45% equity and 55% fixed income.
Accounting Pronouncements
Recently Issued Accounting Pronouncements
See Note 2 to the Consolidated Financial Statements for information regarding recently issuedaccounting pronouncements.
Non-GAAP Financial Measures
Organic net sales growth and free cash flow are non-GAAP measures and should not beconsidered replacements for results in accordance with GAAP. These non-GAAP measures may not becomparable to similarly-titled measures reported by other companies. The primary limitation of thesemeasures is that they exclude the financial impact of items that would otherwise either increase ordecrease our reported results. This limitation is best addressed by using these non-GAAP measures incombination with the most directly comparable GAAP measures in order to better understand theamounts, character, and impact of any increase or decrease in reported amounts. The followingprovides additional information regarding these non-GAAP measures.
Organic Net Sales Growth
Organic net sales growth is a useful measure of our underlying results and trends in the business.It is also a significant component in our incentive compensation plans. The difference between reportednet sales growth (the most comparable GAAP measure) and organic net sales growth consists of theimpact from foreign currency exchange rates, and acquisitions and divestitures, if any. Organic net salesgrowth is a useful measure of our performance because it excludes items that are not completely undermanagement’s control, such as the impact of changes in foreign currency exchange rates, and items thatdo not reflect the underlying growth of the company, such as acquisition and divestiture activity.
36

Management uses organic net sales growth to monitor and evaluate performance. Also, managementuses organic net sales growth together with GAAP measures such as net sales growth and operatingincome in its decision making processes related to the operations of our reportable segments and ouroverall company. We believe that investors benefit from having access to the same financial measuresthat management uses in evaluating operations. The tables presented in ‘‘Results of Operations’’ and‘‘Segment Results’’ above provide reconciliations of organic net sales growth to net sales growthcalculated under GAAP.
Free Cash Flow
Free cash flow is a useful measure of our ability to generate cash. The difference between net cashprovided by continuing operating activities (the most comparable GAAP measure) and free cash flowconsists mainly of significant cash outflows and inflows that we believe are useful to identify. Webelieve free cash flow provides useful information to investors as it provides insight into the primarycash flow metric used by management to monitor and evaluate cash flows generated from ouroperations.
Free cash flow is defined as net cash provided by continuing operating activities excludingvoluntary pension contributions and the cash impact of special items, if any, minus net capitalexpenditures. Net capital expenditures consist of capital expenditures less proceeds from the sale ofproperty, plant, and equipment. These items are subtracted because they represent long-termcommitments. Voluntary pension contributions are excluded because this activity is driven by economicfinancing decisions rather than operating activity. Certain special items, including net payments relatedto pre-separation tax matters, are also considered by management in evaluating free cash flow. Webelieve investors also should consider these items in evaluating our free cash flow.
Free cash flow subtracts certain cash items that are ultimately within management’s and the boardof directors’ discretion to direct and may imply that there is less or more cash available for ourprograms than the most comparable GAAP measure indicates. It should not be inferred that the entirefree cash flow amount is available for future discretionary expenditures, as our definition of free cashflow does not consider certain non-discretionary expenditures, such as debt payments. In addition, wemay have other discretionary expenditures, such as discretionary dividends, share repurchases, andbusiness acquisitions, that are not considered in the calculation of free cash flow.
The tables presented in ‘‘Liquidity and Capital Resources’’ above provide reconciliations of freecash flow to cash flows from continuing operating activities calculated under GAAP.
Forward-Looking Information
Certain statements in this report are ‘‘forward-looking statements’’ within the meaning of the U.S.Private Securities Litigation Reform Act of 1995. These statements are based on our management’sbeliefs and assumptions and on information currently available to our management. Forward-lookingstatements include, among others, the information concerning our possible or assumed future results ofoperations, business strategies, financing plans, competitive position, potential growth opportunities,potential operating performance improvements, acquisitions, divestitures, the effects of competition,and the effects of future legislation or regulations. Forward-looking statements include all statementsthat are not historical facts and can be identified by the use of forward-looking terminology such as thewords ‘‘believe,’’ ‘‘expect,’’ ‘‘plan,’’ ‘‘intend,’’ ‘‘anticipate,’’ ‘‘estimate,’’ ‘‘predict,’’ ‘‘potential,’’‘‘continue,’’ ‘‘may,’’ ‘‘should,’’ or the negative of these terms or similar expressions.
Forward-looking statements involve risks, uncertainties, and assumptions. Actual results may differmaterially from those expressed in these forward-looking statements. You should not put unduereliance on any forward-looking statements. We do not have any intention or obligation to updateforward-looking statements after we file this report except as required by law.
37

The following and other risks, which are described in greater detail in ‘‘Part I. Item 1A. RiskFactors’’ of our Annual Report on Form 10-K for the fiscal year ended September 25, 2015 filed withthe SEC, as well as other risks described in this Annual Report, could cause our results to differmaterially from those expressed in forward-looking statements:
• conditions in the global or regional economies and global capital markets, and cyclical industryconditions;
• conditions affecting demand for products in the industries we serve, particularly the automotiveindustry;
• competition and pricing pressure;
• market acceptance of new product introductions and product innovations and product life cycles;
• raw material availability, quality, and cost;
• fluctuations in foreign currency exchange rates;
• financial condition and consolidation of customers and vendors;
• reliance on third-party suppliers;
• risks associated with current and future acquisitions and divestitures;
• global risks of business interruptions such as natural disasters and political, economic, andmilitary instability;
• risks associated with security breaches and other disruptions to our information technologyinfrastructure;
• risks related to compliance with current and future environmental and other laws andregulations;
• our ability to protect our intellectual property rights;
• risks of litigation;
• our ability to operate within the limitations imposed by our debt instruments;
• risks relating to our separation on June 29, 2007 from Tyco International;
• the possible effects on us of various U.S. and non-U.S. legislative proposals and other initiativesthat, if adopted, could materially increase our worldwide corporate effective tax rate andnegatively impact our U.S. government contracts business;
• various risks associated with being a Swiss corporation;
• the impact of fluctuations in the market price of our shares; and
• the impact of certain provisions of our articles of association on unsolicited takeover proposals.
There may be other risks and uncertainties that we are unable to predict at this time or that wecurrently do not expect to have a material adverse effect on our business.
38
QUANTITATIVE AND QUALITATIVE DISCLOSURES ABOUT MARKET RISK
In the normal course of business, our financial position is routinely subject to a variety of risks,including market risks associated with interest rate and currency movements on outstanding debt andnon-U.S. dollar denominated assets and liabilities and commodity price movements. We utilizeestablished risk management policies and procedures in executing derivative financial instrumenttransactions to manage a portion of these risks.
We do not execute transactions or hold derivative financial instruments for trading or speculativepurposes. Substantially all counterparties to derivative financial instruments are limited to majorfinancial institutions with at least an A/A2 credit rating. There is no significant concentration ofexposures with any one counterparty.
Foreign Currency Exposures
As part of managing the exposure to changes in foreign currency exchange rates, we utilize cross-currency swap contracts, foreign currency forward contracts, and foreign currency swap contracts, aportion of which are designated as cash flow hedges. The objective of these contracts is to minimizeimpacts to cash flows and profitability due to changes in foreign currency exchange rates onintercompany and other cash transactions. A 10% appreciation or depreciation of the underlyingcurrency in our cross-currency swap contracts, foreign currency forward contracts, or foreign currencyswap contracts from the September 25, 2015 market rates would have changed the unrealized value ofour contracts by $109 million. A 10% appreciation or depreciation of the underlying currency in ourforeign currency forward or swap contracts from the September 26, 2014 market rates would havechanged the unrealized value of our contracts by $16 million. Such gains or losses on these contractswould generally be offset by the gains or losses on the revaluation or settlement of the underlyingtransactions.
Interest Rate and Investment Exposures
We issue debt, as needed, to fund our operations and capital requirements. Such borrowings canresult in interest rate exposure. To manage the interest rate exposure, we use interest rate swaps toconvert a portion of fixed-rate debt into variable-rate debt. We use forward starting interest rate swapsand options to enter into interest rate swaps to manage interest rate exposure in periods prior to theanticipated issuance of fixed-rate debt. We also utilize investment swaps to manage earnings exposureon certain nonqualified deferred compensation liabilities.
Based on our floating rate debt balances of approximately $800 million at September 25, 2015 and$950 million at September 26, 2014, an increase in the levels of the U.S. dollar interest rates by 0.5%,with all other variables held constant, would have resulted in an increase of annual interest expense ofapproximately $4 million and $5 million in fiscal 2015 and 2014, respectively.
Commodity Exposures
Our worldwide operations and product lines may expose us to risks from fluctuations in commodityprices. To limit the effects of fluctuations in the future market price paid and related volatility in cashflows, we utilize commodity swap contracts designated as cash flow hedges. We continually evaluate thecommodity market with respect to our forecasted usage requirements over the next eighteen monthsand periodically enter into commodity swap contracts in order to hedge a portion of usagerequirements over that period. At September 25, 2015, our commodity hedges, which related toexpected purchases of gold, silver, and copper, were in a net loss position of $33 million and had anotional value of $260 million. At September 26, 2014, our commodity hedges, which related toexpected purchases of gold, silver, and copper, were in a net loss position of $21 million and had anotional value of $307 million. A 10% appreciation or depreciation of the price of a troy ounce of gold,
39

a troy ounce of silver, and a pound of copper, from the September 25, 2015 prices would have changedthe unrealized value of our forward contracts by $23 million. A 10% appreciation or depreciation ofthe price of a troy ounce of gold, a troy ounce of silver, and a pound of copper, from theSeptember 26, 2014 prices would have changed the unrealized value of our forward contracts by$29 million.
See Note 14 to the Consolidated Financial Statements for additional information on financialinstruments.
40

CHANGES IN AND DISAGREEMENTS WITH ACCOUNTANTS ON ACCOUNTING ANDFINANCIAL DISCLOSURE
None.
CONTROLS AND PROCEDURES
Evaluation of Disclosure Controls and Procedures
Our management, with the participation of our chief executive officer and chief financial officer,evaluated the effectiveness of our disclosure controls and procedures (as defined in Rule 13a-15(e)under the Exchange Act) as of September 25, 2015. Based on that evaluation, our chief executiveofficer and chief financial officer concluded that our disclosure controls and procedures were effectiveas of September 25, 2015.
Measurement Specialties Acquisition
We acquired Measurement Specialties on October 9, 2014. For additional information regardingthe acquisition, see Note 5 to the Consolidated Financial Statements included in this Annual Report.
SEC guidance permits management to omit an assessment of an acquired business’ internal controlover financial reporting from management’s assessment of internal control over financial reporting for aperiod not to exceed one year from the date of acquisition. We are in the process of integrating theMeasurement Specialties operations within our internal control structure. Accordingly, we haveexcluded Measurement Specialties from our annual assessment of internal control over financialreporting as of September 25, 2015.
Management’s Report on Internal Control Over Financial Reporting
Our management is responsible for establishing and maintaining adequate internal control overfinancial reporting (as defined in Rule 13a-15(f) under the Exchange Act). Management, with theparticipation of our chief executive officer and chief financial officer, evaluated the effectiveness of ourinternal control over financial reporting based on the framework in Internal Control—IntegratedFramework (2013) issued by the Committee of Sponsoring Organizations of the Treadway Commission.Based on this evaluation, management has concluded our internal control over financial reporting waseffective as of September 25, 2015.
As discussed above, management has excluded Measurement Specialties from the assessment ofinternal control over financial reporting. Measurement Specialties represented 9% of total assets and4% of total net sales on the Consolidated Financial Statements as of and for the fiscal year endedSeptember 25, 2015.
Because of its inherent limitations, internal control over financial reporting may not prevent ordetect misstatements. Also, projections of any evaluation of effectiveness to future periods are subjectto the risk that controls may become inadequate because of changes in conditions, or that the degreeof compliance with policies and procedures may deteriorate.
Deloitte & Touche LLP, an independent registered public accounting firm, has issued an attestationreport on our internal control over financial reporting as of September 25, 2015, which is included inthis Annual Report.
Changes in Internal Control Over Financial Reporting
During the quarter ended September 25, 2015, there were no changes in our internal control overfinancial reporting that have materially affected, or are reasonably likely to materially affect, ourinternal control over financial reporting.
41

(This page has been left blank intentionally.)
42

TE CONNECTIVITY LTD.
INDEX TO CONSOLIDATED FINANCIAL STATEMENTS
Page
Reports of Independent Registered Public Accounting Firm . . . . . . . . . . . . . . . . . . . . . . . . . . . . 44
Consolidated Statements of Operations for the Fiscal Years Ended September 25, 2015,September 26, 2014, and September 27, 2013 . . . . . . . . . . . . . . . . . . . . . . . . . . . . . . . . . . . . . 47
Consolidated Statements of Comprehensive Income for the Fiscal Years Ended September 25,2015, September 26, 2014, and September 27, 2013 . . . . . . . . . . . . . . . . . . . . . . . . . . . . . . . . 48
Consolidated Balance Sheets as of September 25, 2015 and September 26, 2014 . . . . . . . . . . . . . 49
Consolidated Statements of Equity for the Fiscal Years Ended September 25, 2015,September 26, 2014, and September 27, 2013 . . . . . . . . . . . . . . . . . . . . . . . . . . . . . . . . . . . . . 50
Consolidated Statements of Cash Flows for the Fiscal Years Ended September 25, 2015,September 26, 2014, and September 27, 2013 . . . . . . . . . . . . . . . . . . . . . . . . . . . . . . . . . . . . . 51
Notes to Consolidated Financial Statements . . . . . . . . . . . . . . . . . . . . . . . . . . . . . . . . . . . . . . . 52
Schedule II—Valuation and Qualifying Accounts . . . . . . . . . . . . . . . . . . . . . . . . . . . . . . . . . . . . 109
Report of the Statutory Auditor on the Consolidated Financial Statements of TEConnectivity Ltd. . . . . . . . . . . . . . . . . . . . . . . . . . . . . . . . . . . . . . . . . . . . . . . . . . . . . . . . . . 110
43

REPORT OF INDEPENDENT REGISTERED PUBLIC ACCOUNTING FIRM
To the Board of Directors and Shareholders of TE Connectivity Ltd.:
We have audited the accompanying consolidated balance sheets of TE Connectivity Ltd. andsubsidiaries (the ‘‘Company’’) as of September 25, 2015 and September 26, 2014, and the relatedconsolidated statements of operations, comprehensive income, equity, and cash flows for each of thethree fiscal years in the period ended September 25, 2015. Our audits also included the financialstatement schedule listed in the Index. These consolidated financial statements and financial statementschedule are the responsibility of the Company’s management. Our responsibility is to express anopinion on the consolidated financial statements and financial statement schedule based on our audits.
We conducted our audits in accordance with the standards of the Public Company AccountingOversight Board (United States). Those standards require that we plan and perform the audit to obtainreasonable assurance about whether the financial statements are free of material misstatement. Anaudit includes examining, on a test basis, evidence supporting the amounts and disclosures in thefinancial statements. An audit also includes assessing the accounting principles used and significantestimates made by management, as well as evaluating the overall financial statement presentation. Webelieve that our audits provide a reasonable basis for our opinion.
In our opinion, such consolidated financial statements present fairly, in all material respects, thefinancial position of the Company as of September 25, 2015 and September 26, 2014, and the results ofits operations and its cash flows for each of the three fiscal years in the period ended September 25,2015, in conformity with accounting principles generally accepted in the United States of America.Also, in our opinion, such financial statement schedule, when considered in relation to the basicconsolidated financial statements taken as a whole, presents fairly, in all material respects, theinformation set forth therein.
We have also audited, in accordance with the standards of the Public Company AccountingOversight Board (United States), the Company’s internal control over financial reporting as ofSeptember 25, 2015, based on the criteria established in Internal Control—Integrated Framework (2013)issued by the Committee of Sponsoring Organizations of the Treadway Commission and our reportdated November 10, 2015 expressed an unqualified opinion on the Company’s internal control overfinancial reporting.
/s/ Deloitte & Touche LLP
Philadelphia, PennsylvaniaNovember 10, 2015
44

REPORT OF INDEPENDENT REGISTERED PUBLIC ACCOUNTING FIRM
To the Board of Directors and Shareholders of TE Connectivity Ltd.:
We have audited the internal control over financial reporting of TE Connectivity Ltd. andsubsidiaries (the ‘‘Company’’) as of September 25, 2015, based on criteria established in InternalControl—Integrated Framework (2013) issued by the Committee of Sponsoring Organizations of theTreadway Commission. As described in Management’s Report on Internal Control Over FinancialReporting, management excluded from its assessment the internal control over financial reporting ofMeasurement Specialties, Inc. (‘‘Measurement Specialties’’), which was acquired on October 9, 2014and whose financial statements constitute 9% of total assets and 4% of total net sales of theconsolidated financial statement amounts as of and for the year ended September 25, 2015.Accordingly, our audit did not include the internal control over financial reporting at MeasurementSpecialties. The Company’s management is responsible for maintaining effective internal control overfinancial reporting and for its assessment of the effectiveness of internal control over financialreporting, included in the accompanying Management’s Report on Internal Control Over FinancialReporting. Our responsibility is to express an opinion on the Company’s internal control over financialreporting based on our audit.
We conducted our audit in accordance with the standards of the Public Company AccountingOversight Board (United States). Those standards require that we plan and perform the audit to obtainreasonable assurance about whether effective internal control over financial reporting was maintainedin all material respects. Our audit included obtaining an understanding of internal control overfinancial reporting, assessing the risk that a material weakness exists, testing and evaluating the designand operating effectiveness of internal control based on the assessed risk, and performing such otherprocedures as we considered necessary in the circumstances. We believe that our audit provides areasonable basis for our opinion.
A company’s internal control over financial reporting is a process designed by, or under thesupervision of, the company’s principal executive and principal financial officers, or persons performingsimilar functions, and effected by the company’s board of directors, management, and other personnelto provide reasonable assurance regarding the reliability of financial reporting and the preparation offinancial statements for external purposes in accordance with generally accepted accounting principles.A company’s internal control over financial reporting includes those policies and procedures that(1) pertain to the maintenance of records that, in reasonable detail, accurately and fairly reflect thetransactions and dispositions of the assets of the company; (2) provide reasonable assurance thattransactions are recorded as necessary to permit preparation of financial statements in accordance withgenerally accepted accounting principles, and that receipts and expenditures of the company are beingmade only in accordance with authorizations of management and directors of the company; and(3) provide reasonable assurance regarding prevention or timely detection of unauthorized acquisition,use, or disposition of the company’s assets that could have a material effect on the financial statements.
Because of the inherent limitations of internal control over financial reporting, including thepossibility of collusion or improper management override of controls, material misstatements due toerror or fraud may not be prevented or detected on a timely basis. Also, projections of any evaluationof the effectiveness of the internal control over financial reporting to future periods are subject to therisk that the controls may become inadequate because of changes in conditions, or that the degree ofcompliance with the policies or procedures may deteriorate.
In our opinion, the Company maintained, in all material respects, effective internal control overfinancial reporting as of September 25, 2015, based on the criteria established in Internal Control—Integrated Framework (2013) issued by the Committee of Sponsoring Organizations of the TreadwayCommission.
45

We have also audited, in accordance with the standards of the Public Company AccountingOversight Board (United States), the consolidated financial statements and financial statement scheduleof the Company as of and for the fiscal year ended September 25, 2015, and our report datedNovember 10, 2015 expressed an unqualified opinion on those consolidated financial statements andfinancial statement schedule.
/s/ Deloitte & Touche LLP
Philadelphia, PennsylvaniaNovember 10, 2015
46

TE CONNECTIVITY LTD.
CONSOLIDATED STATEMENTS OF OPERATIONS
Fiscal Years Ended September 25, 2015, September 26, 2014, and September 27, 2013
Fiscal
2015 2014 2013
(in millions, exceptper share data)
Net sales . . . . . . . . . . . . . . . . . . . . . . . . . . . . . . . . . . . . . . . . . . . . . . . $12,233 $11,973 $11,390Cost of sales . . . . . . . . . . . . . . . . . . . . . . . . . . . . . . . . . . . . . . . . . . . . 8,146 8,001 7,739
Gross margin . . . . . . . . . . . . . . . . . . . . . . . . . . . . . . . . . . . . . . . . . . 4,087 3,972 3,651Selling, general, and administrative expenses . . . . . . . . . . . . . . . . . . . . . 1,504 1,534 1,440Research, development, and engineering expenses . . . . . . . . . . . . . . . . . 627 583 590Acquisition and integration costs . . . . . . . . . . . . . . . . . . . . . . . . . . . . . . 55 31 14Restructuring and other charges, net . . . . . . . . . . . . . . . . . . . . . . . . . . . 152 19 222
Operating income . . . . . . . . . . . . . . . . . . . . . . . . . . . . . . . . . . . . . . . 1,749 1,805 1,385Interest income . . . . . . . . . . . . . . . . . . . . . . . . . . . . . . . . . . . . . . . . . . 17 19 17Interest expense . . . . . . . . . . . . . . . . . . . . . . . . . . . . . . . . . . . . . . . . . . (136) (127) (139)Other income (expense), net . . . . . . . . . . . . . . . . . . . . . . . . . . . . . . . . . (55) 63 (183)
Income from continuing operations before income taxes . . . . . . . . . . . 1,575 1,760 1,080Income tax (expense) benefit . . . . . . . . . . . . . . . . . . . . . . . . . . . . . . . . (337) (146) 75
Income from continuing operations . . . . . . . . . . . . . . . . . . . . . . . . . . 1,238 1,614 1,155Income from discontinued operations, net of income taxes . . . . . . . . . . . 1,182 167 122
Net income . . . . . . . . . . . . . . . . . . . . . . . . . . . . . . . . . . . . . . . . . . . . 2,420 1,781 1,277Less: net income attributable to noncontrolling interests . . . . . . . . . . . . . — — (1)
Net income attributable to TE Connectivity Ltd. . . . . . . . . . . . . . . . . $ 2,420 $ 1,781 $ 1,276
Amounts attributable to TE Connectivity Ltd.:Income from continuing operations . . . . . . . . . . . . . . . . . . . . . . . . . . $ 1,238 $ 1,614 $ 1,154Income from discontinued operations . . . . . . . . . . . . . . . . . . . . . . . . . 1,182 167 122
Net income . . . . . . . . . . . . . . . . . . . . . . . . . . . . . . . . . . . . . . . . . . . $ 2,420 $ 1,781 $ 1,276
Basic earnings per share attributable to TE Connectivity Ltd.:Income from continuing operations . . . . . . . . . . . . . . . . . . . . . . . . . . $ 3.06 $ 3.94 $ 2.76Income from discontinued operations . . . . . . . . . . . . . . . . . . . . . . . . . 2.92 0.41 0.29Net income . . . . . . . . . . . . . . . . . . . . . . . . . . . . . . . . . . . . . . . . . . . 5.98 4.34 3.05
Diluted earnings per share attributable to TE Connectivity Ltd.:Income from continuing operations . . . . . . . . . . . . . . . . . . . . . . . . . . $ 3.01 $ 3.87 $ 2.73Income from discontinued operations . . . . . . . . . . . . . . . . . . . . . . . . . 2.88 0.40 0.29Net income . . . . . . . . . . . . . . . . . . . . . . . . . . . . . . . . . . . . . . . . . . . 5.89 4.27 3.02
Dividends and cash distributions paid per common share . . . . . . . . . . . $ 1.24 $ 1.08 $ 0.92
Weighted-average number of shares outstanding:Basic . . . . . . . . . . . . . . . . . . . . . . . . . . . . . . . . . . . . . . . . . . . . . . . . 405 410 418Diluted . . . . . . . . . . . . . . . . . . . . . . . . . . . . . . . . . . . . . . . . . . . . . . 411 417 423
See Notes to Consolidated Financial Statements.
47

TE CONNECTIVITY LTD.
CONSOLIDATED STATEMENTS OF COMPREHENSIVE INCOME
Fiscal Years Ended September 25, 2015, September 26, 2014, and September 27, 2013
Fiscal
2015 2014 2013
(in millions)
Net income . . . . . . . . . . . . . . . . . . . . . . . . . . . . . . . . . . . . . . . . . . . . . . . . $2,420 $1,781 $1,277Other comprehensive income (loss):
Currency translation . . . . . . . . . . . . . . . . . . . . . . . . . . . . . . . . . . . . . . . . (312) (211) (28)Adjustments to unrecognized pension and postretirement benefit costs,
net of income taxes . . . . . . . . . . . . . . . . . . . . . . . . . . . . . . . . . . . . . . (46) (123) 131Gains (losses) on cash flow hedges, net of income taxes . . . . . . . . . . . . . . 2 14 (29)
Other comprehensive income (loss) . . . . . . . . . . . . . . . . . . . . . . . . . . . . . (356) (320) 74
Comprehensive income . . . . . . . . . . . . . . . . . . . . . . . . . . . . . . . . . . . . . . . 2,064 1,461 1,351Less: comprehensive income attributable to noncontrolling interests . . . . . . . — — (1)
Comprehensive income attributable to TE Connectivity Ltd. . . . . . . . . . . . . $2,064 $1,461 $1,350
See Notes to Consolidated Financial Statements.
48

TE CONNECTIVITY LTD.
CONSOLIDATED BALANCE SHEETS
As of September 25, 2015 and September 26, 2014
Fiscal Year End
2015 2014
(in millions, exceptshare data)
AssetsCurrent assets:
Cash and cash equivalents . . . . . . . . . . . . . . . . . . . . . . . . . . . . . . . . . . . . . . . . . . . . . $ 3,329 $ 2,457Accounts receivable, net of allowance for doubtful accounts of $18 and $14, respectively . . . 2,120 2,057Inventories . . . . . . . . . . . . . . . . . . . . . . . . . . . . . . . . . . . . . . . . . . . . . . . . . . . . . . . . 1,615 1,509Prepaid expenses and other current assets . . . . . . . . . . . . . . . . . . . . . . . . . . . . . . . . . . . 478 519Deferred income taxes . . . . . . . . . . . . . . . . . . . . . . . . . . . . . . . . . . . . . . . . . . . . . . . . 345 324Assets held for sale . . . . . . . . . . . . . . . . . . . . . . . . . . . . . . . . . . . . . . . . . . . . . . . . . . — 2,013
Total current assets . . . . . . . . . . . . . . . . . . . . . . . . . . . . . . . . . . . . . . . . . . . . . . . . 7,887 8,879Property, plant, and equipment, net . . . . . . . . . . . . . . . . . . . . . . . . . . . . . . . . . . . . . . . . 2,920 2,920Goodwill . . . . . . . . . . . . . . . . . . . . . . . . . . . . . . . . . . . . . . . . . . . . . . . . . . . . . . . . . . . 4,824 3,726Intangible assets, net . . . . . . . . . . . . . . . . . . . . . . . . . . . . . . . . . . . . . . . . . . . . . . . . . . 1,555 1,087Deferred income taxes . . . . . . . . . . . . . . . . . . . . . . . . . . . . . . . . . . . . . . . . . . . . . . . . . 2,144 2,047Receivable from Tyco International plc and Covidien plc . . . . . . . . . . . . . . . . . . . . . . . . . . 964 1,037Other assets . . . . . . . . . . . . . . . . . . . . . . . . . . . . . . . . . . . . . . . . . . . . . . . . . . . . . . . . 314 456
Total Assets . . . . . . . . . . . . . . . . . . . . . . . . . . . . . . . . . . . . . . . . . . . . . . . . . . . . . $20,608 $20,152
Liabilities and EquityCurrent liabilities:
Current maturities of long-term debt . . . . . . . . . . . . . . . . . . . . . . . . . . . . . . . . . . . . . . $ 500 $ 577Accounts payable . . . . . . . . . . . . . . . . . . . . . . . . . . . . . . . . . . . . . . . . . . . . . . . . . . . 1,143 1,230Accrued and other current liabilities . . . . . . . . . . . . . . . . . . . . . . . . . . . . . . . . . . . . . . 1,749 1,594Deferred revenue . . . . . . . . . . . . . . . . . . . . . . . . . . . . . . . . . . . . . . . . . . . . . . . . . . . 185 176Liabilities held for sale . . . . . . . . . . . . . . . . . . . . . . . . . . . . . . . . . . . . . . . . . . . . . . . — 416
Total current liabilities . . . . . . . . . . . . . . . . . . . . . . . . . . . . . . . . . . . . . . . . . . . . . . 3,577 3,993Long-term debt . . . . . . . . . . . . . . . . . . . . . . . . . . . . . . . . . . . . . . . . . . . . . . . . . . . . . . 3,403 3,281Long-term pension and postretirement liabilities . . . . . . . . . . . . . . . . . . . . . . . . . . . . . . . . 1,327 1,280Deferred income taxes . . . . . . . . . . . . . . . . . . . . . . . . . . . . . . . . . . . . . . . . . . . . . . . . . 329 229Income taxes . . . . . . . . . . . . . . . . . . . . . . . . . . . . . . . . . . . . . . . . . . . . . . . . . . . . . . . . 1,954 2,044Other liabilities . . . . . . . . . . . . . . . . . . . . . . . . . . . . . . . . . . . . . . . . . . . . . . . . . . . . . . 433 312
Total Liabilities . . . . . . . . . . . . . . . . . . . . . . . . . . . . . . . . . . . . . . . . . . . . . . . . . . . 11,023 11,139
Commitments and contingencies (Note 13)Equity:
TE Connectivity Ltd. shareholders’ equity:Common shares, 414,064,381 shares authorized and issued, CHF 0.57 par value, and
419,070,781 shares authorized and issued, CHF 0.57 par value, respectively . . . . . . . . . 182 184Contributed surplus . . . . . . . . . . . . . . . . . . . . . . . . . . . . . . . . . . . . . . . . . . . . . . . . 4,359 5,231Accumulated earnings . . . . . . . . . . . . . . . . . . . . . . . . . . . . . . . . . . . . . . . . . . . . . . . 6,673 4,253Treasury shares, at cost, 20,071,089 and 11,383,631 shares, respectively . . . . . . . . . . . . . . (1,256) (644)Accumulated other comprehensive loss . . . . . . . . . . . . . . . . . . . . . . . . . . . . . . . . . . . (373) (17)
Total TE Connectivity Ltd. shareholders’ equity . . . . . . . . . . . . . . . . . . . . . . . . . . . . 9,585 9,007Noncontrolling interests . . . . . . . . . . . . . . . . . . . . . . . . . . . . . . . . . . . . . . . . . . . . . . . — 6
Total Equity . . . . . . . . . . . . . . . . . . . . . . . . . . . . . . . . . . . . . . . . . . . . . . . . . . . . . 9,585 9,013
Total Liabilities and Equity . . . . . . . . . . . . . . . . . . . . . . . . . . . . . . . . . . . . . . . . . . . $20,608 $20,152
See Notes to Consolidated Financial Statements.
49

TE CONNECTIVITY LTD.
CONSOLIDATED STATEMENTS OF EQUITY
Fiscal Years Ended September 25, 2015, September 26, 2014, and September 27, 2013
TEAccumulated ConnectivityCommon Treasury Other Ltd. Non-Shares Shares Contributed Accumulated Comprehensive Shareholders’ controlling Total
Shares Amount Shares Amount Surplus Earnings Income (Loss) Equity Interests Equity
(in millions)Balance at September 28, 2012 . 439 $193 (16) $ (484) $6,837 $1,196 $ 229 $ 7,971 $ 6 $ 7,977Net income . . . . . . . . . . . . — — — — — 1,276 — 1,276 1 1,277Other comprehensive income . . — — — — — — 74 74 — 74Share-based compensation
expense . . . . . . . . . . . . . — — — — 78 — — 78 — 78Dividends approved . . . . . . . — — — 1 (413) — — (412) — (412)Exercise of share options . . . . — — 6 214 — — — 214 — 214Restricted share award vestings
and other activity . . . . . . . — — 3 11 (3) — — 8 — 8Repurchase of common shares . — — (20) (829) — — — (829) — (829)Cancellation of treasury shares . (10) (4) 10 367 (363) — — — — —Dividends to noncontrolling
interests . . . . . . . . . . . . . — — — — — — — — (1) (1)
Balance at September 27, 2013 . 429 $189 (17) $ (720) $6,136 $2,472 $ 303 $ 8,380 $ 6 $ 8,386
Net income . . . . . . . . . . . . — — — — — 1,781 — 1,781 — 1,781Other comprehensive loss . . . . — — — — — — (320) (320) — (320)Share-based compensation
expense . . . . . . . . . . . . . — — — — 84 — — 84 — 84Dividends approved . . . . . . . — — — — (473) — — (473) — (473)Exercise of share options . . . . — — 5 156 — — — 156 — 156Restricted share award vestings
and other activity . . . . . . . — — 2 125 (122) — — 3 — 3Repurchase of common shares . — — (11) (604) — — — (604) — (604)Cancellation of treasury shares . (10) (5) 10 399 (394) — — — — —
Balance at September 26, 2014 . 419 $184 (11) $ (644) $5,231 $4,253 $ (17) $ 9,007 $ 6 $ 9,013
Net income . . . . . . . . . . . . — — — — — 2,420 — 2,420 — 2,420Other comprehensive loss . . . . — — — — — — (356) (356) — (356)Share-based compensation
expense . . . . . . . . . . . . . — — — — 95 — — 95 — 95Dividends approved . . . . . . . — — — — (526) — — (526) — (526)Exercise of share options . . . . — — 3 103 — — — 103 — 103Restricted share award vestings
and other activity . . . . . . . — — 1 143 (138) — — 5 (6) (1)Repurchase of common shares . — — (18) (1,163) — — — (1,163) — (1,163)Cancellation of treasury shares . (5) (2) 5 305 (303) — — — — —
Balance at September 25, 2015 . 414 $182 (20) $(1,256) $4,359 $6,673 $(373) $ 9,585 $— $ 9,585
See Notes to Consolidated Financial Statements.
50

TE CONNECTIVITY LTD.
CONSOLIDATED STATEMENTS OF CASH FLOWS
Fiscal Years Ended September 25, 2015, September 26, 2014, and September 27, 2013
Fiscal
2015 2014 2013
(in millions)Cash Flows From Operating Activities:Net income . . . . . . . . . . . . . . . . . . . . . . . . . . . . . . . . . . . . . . . . . . . . . . . . . . . . . . . . . . $ 2,420 $ 1,781 $ 1,277
Income from discontinued operations, net of income taxes . . . . . . . . . . . . . . . . . . . . . . . . . . . . (1,182) (167) (122)
Income from continuing operations . . . . . . . . . . . . . . . . . . . . . . . . . . . . . . . . . . . . . . . . . . . 1,238 1,614 1,155Adjustments to reconcile income from continuing operations to net cash provided by operating activities:
Depreciation and amortization . . . . . . . . . . . . . . . . . . . . . . . . . . . . . . . . . . . . . . . . . . . . . 616 551 536Non-cash restructuring charges . . . . . . . . . . . . . . . . . . . . . . . . . . . . . . . . . . . . . . . . . . . . . 21 16 60Deferred income taxes . . . . . . . . . . . . . . . . . . . . . . . . . . . . . . . . . . . . . . . . . . . . . . . . . . 40 (281) 14Provision for losses on accounts receivable and inventories . . . . . . . . . . . . . . . . . . . . . . . . . . . . 36 34 39Tax sharing (income) expense . . . . . . . . . . . . . . . . . . . . . . . . . . . . . . . . . . . . . . . . . . . . . 52 (65) 181Share-based compensation expense . . . . . . . . . . . . . . . . . . . . . . . . . . . . . . . . . . . . . . . . . . 89 77 71Other . . . . . . . . . . . . . . . . . . . . . . . . . . . . . . . . . . . . . . . . . . . . . . . . . . . . . . . . . . . . 105 50 56Changes in assets and liabilities, net of the effects of acquisitions and divestitures:
Accounts receivable, net . . . . . . . . . . . . . . . . . . . . . . . . . . . . . . . . . . . . . . . . . . . . . . . (210) (182) (65)Inventories . . . . . . . . . . . . . . . . . . . . . . . . . . . . . . . . . . . . . . . . . . . . . . . . . . . . . . . (220) (98) (28)Prepaid expenses and other current assets . . . . . . . . . . . . . . . . . . . . . . . . . . . . . . . . . . . . . 36 (14) 13Accounts payable . . . . . . . . . . . . . . . . . . . . . . . . . . . . . . . . . . . . . . . . . . . . . . . . . . . (22) 71 143Accrued and other current liabilities . . . . . . . . . . . . . . . . . . . . . . . . . . . . . . . . . . . . . . . . (155) (280) (13)Deferred revenue . . . . . . . . . . . . . . . . . . . . . . . . . . . . . . . . . . . . . . . . . . . . . . . . . . . 12 113 (50)Income taxes . . . . . . . . . . . . . . . . . . . . . . . . . . . . . . . . . . . . . . . . . . . . . . . . . . . . . . (52) 167 (387)Other . . . . . . . . . . . . . . . . . . . . . . . . . . . . . . . . . . . . . . . . . . . . . . . . . . . . . . . . . . . 33 31 50
Net cash provided by continuing operating activities . . . . . . . . . . . . . . . . . . . . . . . . . . . . . 1,619 1,804 1,775Net cash provided by discontinued operating activities . . . . . . . . . . . . . . . . . . . . . . . . . . . . 294 279 271
Net cash provided by operating activities . . . . . . . . . . . . . . . . . . . . . . . . . . . . . . . . . . . . 1,913 2,083 2,046
Cash Flows From Investing Activities:Capital expenditures . . . . . . . . . . . . . . . . . . . . . . . . . . . . . . . . . . . . . . . . . . . . . . . . . . . . (600) (635) (581)Proceeds from sale of property, plant, and equipment . . . . . . . . . . . . . . . . . . . . . . . . . . . . . . . . 17 129 22Acquisition of businesses, net of cash acquired . . . . . . . . . . . . . . . . . . . . . . . . . . . . . . . . . . . . (1,725) (522) (6)Proceeds from divestiture of discontinued operations, net of cash retained by sold operations . . . . . . . . 2,957 — 14Other . . . . . . . . . . . . . . . . . . . . . . . . . . . . . . . . . . . . . . . . . . . . . . . . . . . . . . . . . . . . . 12 (10) 23
Net cash provided by (used in) continuing investing activities . . . . . . . . . . . . . . . . . . . . . . . . 661 (1,038) (528)Net cash used in discontinued investing activities . . . . . . . . . . . . . . . . . . . . . . . . . . . . . . . (25) (37) (17)
Net cash provided by (used in) investing activities . . . . . . . . . . . . . . . . . . . . . . . . . . . . . . 636 (1,075) (545)
Cash Flows From Financing Activities:Net increase (decrease) in commercial paper . . . . . . . . . . . . . . . . . . . . . . . . . . . . . . . . . . . . . . (328) (23) 50Proceeds from issuance of long-term debt . . . . . . . . . . . . . . . . . . . . . . . . . . . . . . . . . . . . . . . 617 1,322 —Repayment of long-term debt . . . . . . . . . . . . . . . . . . . . . . . . . . . . . . . . . . . . . . . . . . . . . . . (473) (360) (714)Proceeds from exercise of share options . . . . . . . . . . . . . . . . . . . . . . . . . . . . . . . . . . . . . . . . . 103 156 214Repurchase of common shares . . . . . . . . . . . . . . . . . . . . . . . . . . . . . . . . . . . . . . . . . . . . . . (1,023) (578) (844)Payment of common share dividends and cash distributions to shareholders . . . . . . . . . . . . . . . . . . . (502) (443) (384)Transfers from discontinued operations . . . . . . . . . . . . . . . . . . . . . . . . . . . . . . . . . . . . . . . . . 269 242 254Other . . . . . . . . . . . . . . . . . . . . . . . . . . . . . . . . . . . . . . . . . . . . . . . . . . . . . . . . . . . . . — (9) —
Net cash provided by (used in) continuing financing activities . . . . . . . . . . . . . . . . . . . . . . . (1,337) 307 (1,424)Net cash used in discontinued financing activities . . . . . . . . . . . . . . . . . . . . . . . . . . . . . . . (269) (242) (254)
Net cash provided by (used in) financing activities . . . . . . . . . . . . . . . . . . . . . . . . . . . . . . (1,606) 65 (1,678)
Effect of currency translation on cash . . . . . . . . . . . . . . . . . . . . . . . . . . . . . . . . . . . . . . . . . . (71) (19) (9)Net increase (decrease) in cash and cash equivalents . . . . . . . . . . . . . . . . . . . . . . . . . . . . . . . . 872 1,054 (186)Cash and cash equivalents at beginning of fiscal year . . . . . . . . . . . . . . . . . . . . . . . . . . . . . . . . 2,457 1,403 1,589
Cash and cash equivalents at end of fiscal year . . . . . . . . . . . . . . . . . . . . . . . . . . . . . . . . . . . . $ 3,329 $ 2,457 $ 1,403
Supplemental Cash Flow Information:Interest paid . . . . . . . . . . . . . . . . . . . . . . . . . . . . . . . . . . . . . . . . . . . . . . . . . . . . . . . . . $ 128 $ 118 $ 151Income taxes paid, net of refunds . . . . . . . . . . . . . . . . . . . . . . . . . . . . . . . . . . . . . . . . . . . . 350 259 299
See Notes to Consolidated Financial Statements.
51

TE CONNECTIVITY LTD.
NOTES TO CONSOLIDATED FINANCIAL STATEMENTS
1. Basis of Presentation
The Consolidated Financial Statements reflect the consolidated operations of TE Connectivity Ltd.and its subsidiaries and have been prepared in United States (‘‘U.S.’’) dollars in accordance withaccounting principles generally accepted in the U.S. (‘‘GAAP’’).
Description of the Business
TE Connectivity Ltd. (‘‘TE Connectivity’’ or the ‘‘Company,’’ which may be referred to as ‘‘we,’’‘‘us,’’ or ‘‘our’’) is a global technology leader. We design and manufacture connectivity and sensorssolutions that are essential in today’s increasingly connected world. We help our customers solve theneed for intelligent, efficient, and high-performing products and solutions.
We consist of three reportable segments:
• Transportation Solutions. The Transportation Solutions segment is a leader in connectivity andsensor technologies. Our products, which must withstand harsh conditions, are used in theautomotive, commercial transportation, and sensors markets.
• Industrial Solutions. The Industrial Solutions segment is a leading supplier of products thatconnect and distribute power, data, and signals. Our products are used in the industrialequipment; aerospace, defense, oil, and gas; and energy markets.
• Communications Solutions. The Communications Solutions segment is a top supplier ofelectronic components for the data and devices and appliances markets. We are also a leader indeveloping, manufacturing, installing, and maintaining some of the world’s most advanced subseafiber optic communications systems.
Use of Estimates
The preparation of the Consolidated Financial Statements in conformity with GAAP requiresmanagement to make estimates and assumptions that affect the reported amounts of assets andliabilities, the disclosure of contingent assets and liabilities, and the reported amounts of revenues andexpenses. Significant estimates in these Consolidated Financial Statements include restructuring andother charges, assets acquired and liabilities assumed in acquisitions, allowances for doubtful accountsreceivable, estimates of future cash flows and discount rates associated with asset impairments, usefullives for depreciation and amortization, loss contingencies, net realizable value of inventories, estimatedcontract revenue and related costs, legal contingencies, tax reserves and deferred tax asset valuationallowances, and the determination of discount and other rate assumptions for pension andpostretirement employee benefit expenses. Actual results could differ materially from these estimates.
Fiscal Year
We have a 52 or 53-week fiscal year that ends on the last Friday of September. Fiscal 2015, 2014,and 2013 were 52 weeks and ended on September 25, 2015, September 26, 2014, and September 27,2013, respectively. For fiscal years in which there are 53 weeks, the fourth quarter reporting period willinclude 14 weeks with the next occurrence taking place in fiscal 2016.
52

TE CONNECTIVITY LTD.
NOTES TO CONSOLIDATED FINANCIAL STATEMENTS (Continued)
2. Summary of Significant Accounting Policies
Principles of Consolidation
We consolidate entities in which we own or control more than 50% of the voting shares orotherwise have the ability to control through similar rights. All intercompany transactions have beeneliminated. The results of companies acquired or disposed of are included on the ConsolidatedFinancial Statements from the effective date of acquisition or up to the date of disposal.
Revenue Recognition
Our revenues are generated principally from the sale of our products. Revenue from the sale ofproducts is recognized at the time title and the risks and rewards of ownership pass to the customer.This generally occurs when the products reach the shipping point, the sales price is fixed anddeterminable, and collection is reasonably assured.
Contract revenues for construction related projects, which are generated in the CommunicationsSolutions segment, are recorded primarily using the percentage-of-completion method. Profitsrecognized on contracts in process are based upon estimated contract revenue and related cost tocomplete. Percentage-of-completion is measured based on the ratio of actual costs incurred to totalestimated costs. Revisions in cost estimates as contracts progress have the effect of increasing ordecreasing profits in the current period. Provisions for anticipated losses are made in the period inwhich they first become determinable. In addition, provisions for credit losses related to constructionrelated projects are recorded as reductions of revenue in the period in which they first becomedeterminable.
We generally warrant that our products will conform to our, or mutually agreed to, specificationsand that our products will be free from material defects in materials and workmanship for a limitedtime. We limit our warranty to the replacement or repair of defective parts, or a refund or credit of theprice of the defective product. We accept returned goods only when the customer makes a verifiedclaim and we have authorized the return. Generally, a reserve for estimated returns is established atthe time of sale based on historical return experience and is recorded as a reduction of sales.
Additionally, certain of our long-term contracts in the Communications Solutions segment havewarranty obligations. Estimated warranty costs for each contract are determined based on the contractterms and technology-specific considerations. These costs are included in total estimated contract costsand are accrued over the construction period of the respective contracts underpercentage-of-completion accounting.
We provide certain distributors with an inventory allowance for returns or scrap equal to apercentage of qualified purchases. A reserve for estimated returns and scrap allowances is establishedat the time of the sale, based on an agreed upon fixed percentage of sales to distributors, and isrecorded as a reduction of sales.
Other allowances include customer quantity and price discrepancies. A reserve for otherallowances is generally established at the time of sale based on historical experience and is recorded asa reduction of sales. We believe we can reasonably and reliably estimate the amounts of futureallowances.
53

TE CONNECTIVITY LTD.
NOTES TO CONSOLIDATED FINANCIAL STATEMENTS (Continued)
2. Summary of Significant Accounting Policies (Continued)
Inventories
Inventories are recorded at the lower of cost or market value using the first-in, first-out costmethod, except for inventoried costs incurred in the performance of long-term contracts primarily bythe Communications Solutions segment.
Property, Plant, and Equipment, Net
Property, plant, and equipment is recorded at cost less accumulated depreciation. Maintenance andrepair expenditures are charged to expense when incurred. Depreciation is calculated using thestraight-line method over the estimated useful lives of the assets, which are 10 to 20 years for landimprovements, 5 to 40 years for buildings and improvements, and 1 to 15 years for machinery andequipment.
We periodically evaluate, when events and circumstances warrant, the net realizable value ofproperty, plant, and equipment and other long-lived assets, relying on a number of factors includingoperating results, business plans, economic projections, and anticipated future cash flows. Whenindicators of potential impairment are present, the carrying values of the asset group are evaluated inrelation to the operating performance and estimated future undiscounted cash flows of the underlyingasset group. Impairment of the carrying value is recognized whenever anticipated future undiscountedcash flow estimates are less than the carrying value of the asset. Fair value estimates are based onassumptions concerning the amount and timing of estimated future cash flows and discount rates,reflecting varying degrees of perceived risk.
Goodwill and Other Intangible Assets
Intangible assets include both indeterminable-lived residual goodwill and determinable-livedidentifiable intangible assets. Intangible assets with a determinable life primarily include intellectualproperty, consisting of patents, trademarks, and unpatented technology, as well as customerrelationships. Recoverability estimates range from 1 to 50 years and costs are generally amortized on astraight-line basis. An evaluation of the remaining useful life of determinable-lived intangible assets isperformed on a periodic basis and when events and circumstances warrant an evaluation.
At fiscal year end 2015, we had seven reporting units, six of which contained goodwill. There aretwo reporting units in each of the Transportation Solutions and Industrial Solutions segments, andthree reporting units in the Communications Solutions segment. When changes occur in thecomposition of one or more reporting units, goodwill is reassigned to the reporting units affected basedon their relative fair values.
Goodwill impairment is evaluated by comparing the carrying value of each reporting unit to its fairvalue on the first day of the fourth fiscal quarter of each year or whenever we believe a triggeringevent requiring a more frequent assessment has occurred. In assessing the existence of a triggeringevent, management relies on a number of reporting-unit-specific factors including operating results,business plans, economic projections, anticipated future cash flows, transactions, and market place data.There are inherent uncertainties related to these factors and management’s judgment in applying thesefactors to the impairment analysis.
When testing for goodwill impairment, we perform a step I goodwill impairment test to identifypotential impairment by comparing the fair value of a reporting unit with its carrying amount. If the
54

TE CONNECTIVITY LTD.
NOTES TO CONSOLIDATED FINANCIAL STATEMENTS (Continued)
2. Summary of Significant Accounting Policies (Continued)
carrying amount of a reporting unit exceeds its fair value, goodwill may be impaired and a step IIgoodwill impairment test is performed to measure the amount of impairment, if any. In the step IIgoodwill impairment test, we compare the implied fair value of reporting unit goodwill with thecarrying amount of that goodwill. If the carrying amount of reporting unit goodwill exceeds the impliedfair value of that goodwill, an impairment loss is recognized in an amount equal to the excess. Theimplied fair value of goodwill is determined in a manner consistent with how goodwill is recognized ina business combination. We allocate the fair value of a reporting unit to all of the assets and liabilitiesof that unit, including intangible assets, as if the reporting unit had been acquired in a businesscombination. Any excess of the fair value of a reporting unit over the amounts assigned to its assetsand liabilities is the implied fair value of goodwill.
Fair value estimates used in the step I goodwill impairment tests are calculated using an incomeapproach based on the present value of future cash flows of each reporting unit. The income approachgenerally has been supported by guideline analyses (a market approach). These approaches incorporatea number of assumptions including future growth rates, discount rates, income tax rates, and marketactivity in assessing fair value and are reporting unit specific. Changes in economic and operatingconditions impacting these assumptions could result in goodwill impairments in future periods.
Research and Development
Research and development expenditures are expensed when incurred and are included in research,development, and engineering expenses on the Consolidated Statements of Operations. Research anddevelopment expenses include salaries, direct costs incurred, and building and overhead expenses. Theamounts expensed in fiscal 2015, 2014, and 2013 were $540 million, $484 million, and $494 million,respectively.
Income Taxes
Income taxes are computed in accordance with the provisions of Accounting StandardsCodification (‘‘ASC’’) 740, Income Taxes. Deferred tax liabilities and assets are recognized for theexpected future tax consequences of events that have been reflected on the Consolidated FinancialStatements. Deferred tax liabilities and assets are determined based on the differences between thebook and tax bases of particular assets and liabilities and operating loss carryforwards using tax rates ineffect for the years in which the differences are expected to reverse. A valuation allowance is providedto offset deferred tax assets if, based upon the available evidence, it is more likely than not that someor all of the deferred tax assets will not be realized.
The calculation of our tax liabilities includes estimates for uncertainties in the application ofcomplex tax regulations across multiple global jurisdictions where we conduct our operations. Underthe uncertain tax position provisions of ASC 740, we recognize liabilities for tax and related interest forissues in the U.S. and other tax jurisdictions based on our estimate of whether, and the extent to which,additional taxes and related interest will be due. In addition, management reviews with tax counselvarious issues raised by certain taxing authorities and the adequacy of recorded amounts. These taxliabilities and related interest are reflected net of the impact of related tax loss carryforwards, as suchtax loss carryforwards will be applied against these tax liabilities and will reduce the amount of cash taxpayments due upon the eventual settlement with the tax authorities. These estimates may change dueto changing facts and circumstances. Due to the complexity of these uncertainties, the ultimate
55

TE CONNECTIVITY LTD.
NOTES TO CONSOLIDATED FINANCIAL STATEMENTS (Continued)
2. Summary of Significant Accounting Policies (Continued)
resolution may result in a settlement that differs from our current estimate of the tax liabilities andrelated interest.
Financial Instruments
Our financial instruments consist primarily of cash and cash equivalents, accounts receivable,accounts payable, debt, and derivative financial instruments.
We account for derivative financial instrument contracts on the Consolidated Balance Sheets at fairvalue. For instruments not designated as hedges under ASC 815, Derivatives and Hedging, the changesin the instruments’ fair value are recognized currently in earnings. For instruments designated as cashflow hedges, the effective portion of changes in the fair value of a derivative is recorded in othercomprehensive income (loss) and reclassified into earnings in the same period or periods during whichthe underlying hedged item affects earnings. Ineffective portions of a cash flow hedge, includingamounts excluded from the hedging relationship, are recognized currently in earnings. Changes in thefair value of instruments designated as fair value hedges affect the carrying value of the asset orliability hedged, with changes in both the derivative instrument and the hedged asset or liability beingrecognized currently in earnings.
We determine the fair value of our financial instruments by using methods and assumptions thatare based on market conditions and risks existing at each balance sheet date. Standard marketconventions are used to determine the fair value of financial instruments, including derivatives.
The cash flows related to derivative financial instruments are reported in the operating activitiessection of the Consolidated Statements of Cash Flows.
Our derivative financial instruments present certain market and counterparty risks. Concentrationof counterparty risk is mitigated, however, by our use of financial institutions worldwide, substantiallyall of which have long-term Standard & Poor’s, Moody’s, and/or Fitch credit ratings of A/A2 or higher.In addition, we utilize only conventional derivative financial instruments. We are exposed to potentiallosses if a counterparty fails to perform according to the terms of its agreement. With respect tocounterparty net asset positions recognized at September 25, 2015, we have assessed the likelihood ofcounterparty default as remote. We currently provide guarantees from a wholly-owned subsidiary to thecounterparties to our commodity swap derivatives and exchange cash collateral with the counterpartiesto our cross-currency swap contracts. The likelihood of performance on the guarantees has beenassessed as remote. For all other derivative financial instruments, we are not required to provide, nordo we require counterparties to provide, collateral or other security.
Fair Value Measurements
ASC 820, Fair Value Measurements and Disclosures, specifies a fair value hierarchy based upon theobservable inputs utilized in valuation of certain assets and liabilities. Observable inputs (highest level)reflect market data obtained from independent sources, while unobservable inputs (lowest level) reflectinternally developed market assumptions. Fair value measurements are classified under the followinghierarchy:
• Level 1. Quoted prices in active markets for identical assets and liabilities.
56

TE CONNECTIVITY LTD.
NOTES TO CONSOLIDATED FINANCIAL STATEMENTS (Continued)
2. Summary of Significant Accounting Policies (Continued)
• Level 2. Quoted prices in active markets for similar assets and liabilities, or other inputs that areobservable for the asset or liability, either directly or indirectly, for substantially the full term ofthe asset or liability.
• Level 3. Unobservable inputs that are supported by little or no market activity and that aresignificant to the fair value of the assets and liabilities. This includes certain pricing models,discounted cash flows methodologies, and similar techniques that use significant unobservableinputs.
Financial assets and liabilities measured at fair value on a recurring basis are generally valuedusing level 2 inputs.
Financial instruments other than derivative instruments include cash and cash equivalents, accountsreceivable, accounts payable, and debt. These instruments are recorded on the Consolidated BalanceSheets at book value. For cash and cash equivalents, accounts receivable, and accounts payable, webelieve book value approximates fair value due to the short-term nature of these instruments. SeeNote 11 for disclosure of the fair value of debt. The following is a description of the valuationmethodologies used for the respective financial instruments:
• Cash and cash equivalents. Cash and cash equivalents are valued at book value, which weconsider to be equivalent to unadjusted quoted prices (level 1).
• Accounts receivable. Accounts receivable are valued based on the net value expected to berealized. The net realizable value generally represents an observable contractual agreement(level 2).
• Accounts payable. Accounts payable are valued based on the net value expected to be paid,generally supported by an observable contractual agreement (level 2).
• Long-term debt. The fair value of long-term debt, including both current and non-currentmaturities, is derived from quoted market prices or other pricing determinations based on theresults of market approach valuation models using observable market data such as recentlyreported trades, bid and offer information, and benchmark securities (level 2).
Pension and Postretirement Benefits
The funded status of our defined benefit pension and postretirement benefit plans is recognized onthe Consolidated Balance Sheets and is measured as the difference between the fair value of planassets and the benefit obligation at the measurement date. For defined benefit pension plans, thebenefit obligation is the projected benefit obligation, which represents the actuarial present value ofbenefits expected to be paid upon retirement factoring in estimated future compensation levels. For thepostretirement benefit plans, the benefit obligation is the accumulated postretirement benefitobligation, which represents the actuarial present value of postretirement benefits attributed toemployee services already rendered. The fair value of plan assets represents the current market valueof cumulative company and participant contributions made to irrevocable trust funds, held for the solebenefit of participants, which are invested by the trustee of the funds. The benefits under pension andpostretirement plans are based on various factors, such as years of service and compensation.
57

TE CONNECTIVITY LTD.
NOTES TO CONSOLIDATED FINANCIAL STATEMENTS (Continued)
2. Summary of Significant Accounting Policies (Continued)
Net periodic pension benefit cost is based on the utilization of the projected unit credit method ofcalculation and is charged to earnings on a systematic basis over the expected average remainingservice lives of current participants.
The measurement of benefit obligations and net periodic benefit cost is based on estimates andassumptions determined by our management. These valuations reflect the terms of the plans and useparticipant-specific information such as compensation, age, and years of service, as well as certainassumptions, including estimates of discount rates, expected return on plan assets, rate of compensationincreases, interest crediting rates, and mortality rates.
Share-Based Compensation
We determine the fair value of share awards on the date of grant. Share options are valued usingthe Black-Scholes-Merton valuation model; restricted share awards and performance awards are valuedusing our end-of-day share price on the date of grant. The fair value is expensed ratably over theexpected service period, with an allowance made for estimated forfeitures based on historical employeeactivity. Estimates regarding the attainment of performance criteria are reviewed periodically; thecumulative impact of a change in estimate regarding the attainment of performance criteria is recordedin the period in which that change is made.
Earnings Per Share
Basic earnings per share attributable to TE Connectivity Ltd. is computed by dividing net incomeattributable to TE Connectivity Ltd. by the basic weighted-average number of common sharesoutstanding. Diluted earnings per share attributable to TE Connectivity Ltd. is computed by dividingnet income attributable to TE Connectivity Ltd. by the weighted-average number of common sharesoutstanding adjusted for the potentially dilutive impact of share-based compensation arrangements.
Currency Translation
For our non-U.S. dollar functional currency subsidiaries, assets and liabilities are translated intoU.S. dollars using fiscal year end exchange rates. Sales and expenses are translated at average monthlyexchange rates. Foreign currency translation gains and losses are included as a component ofaccumulated other comprehensive income (loss) within equity.
Gains and losses resulting from foreign currency transactions, which are included in earnings, wereimmaterial in fiscal 2015, 2014, and 2013.
Restructuring Charges
Restructuring activities involve employee-related termination costs, facility exit costs, and assetimpairments resulting from reductions-in-force, migration of facilities or product lines from higher-costto lower-cost countries, or consolidation of facilities within countries. We recognize termination costsbased on requirements established by severance policy, government law, or previous actions. Facilityexit costs generally reflect the cost to terminate a facility lease before the end of its term (measured atfair value at the time we cease using the facility) or costs that will continue to be incurred under thefacility lease without future economic benefit to us. Restructuring activities often result in the disposal
58

TE CONNECTIVITY LTD.
NOTES TO CONSOLIDATED FINANCIAL STATEMENTS (Continued)
2. Summary of Significant Accounting Policies (Continued)
or abandonment of assets that require an acceleration of depreciation or impairment reflecting theexcess of the assets’ carrying values over fair value.
The recognition of restructuring costs require that we make certain judgments and estimatesregarding the nature, timing, and amount of costs associated with the planned exit activity. To theextent our actual results differ from our estimates and assumptions, we may be required to revise theestimated liabilities, requiring the recognition of additional restructuring costs or the reduction ofliabilities already recognized. At the end of each reporting period, we evaluate the remaining accruedbalances to ensure these balances are properly stated and the utilization of the reserves are for theirintended purpose in accordance with developed exit plans.
Acquisitions
We account for acquired businesses using the acquisition method of accounting. This methodrequires, among other things, that most assets acquired and liabilities assumed be recognized at fairvalue as of the acquisition date. We allocate the purchase price of acquired businesses to the tangibleand intangible assets acquired and liabilities assumed based on estimated fair values, or as required byASC 805, Business Combinations. The excess of the purchase price over the identifiable assets acquiredand liabilities assumed is recorded as goodwill. We may engage independent third-party appraisal firmsto assist us in determining the fair values of assets acquired and liabilities assumed. Such valuationsrequire management to make significant estimates and assumptions, especially with respect tointangible assets.
Contingent Liabilities
We record a loss contingency when the available information indicates it is probable that we haveincurred a liability and the amount of the loss is reasonably estimable. When a range of possible losseswith equal likelihood exists, we record the low end of the range. The likelihood of a loss with respectto a particular contingency is often difficult to predict, and determining a meaningful estimate of theloss or a range of loss may not be practicable based on information available. In addition, it is notuncommon for such matters to be resolved over many years, during which time relevant developmentsand new information must continuously be evaluated to determine whether a loss is probable and areasonable estimate of that loss can be made. When a loss is probable but a reasonable estimate cannotbe made, or when a loss is at least reasonably possible, disclosure is provided.
Recently Issued Accounting Pronouncements
In May 2014, the Financial Accounting Standards Board (‘‘FASB’’) issued ASC 606, Revenue fromContracts with Customers. This guidance supersedes ASC 605, Revenue Recognition, and introduces asingle, comprehensive, five-step revenue recognition model. ASC 606 also enhances disclosures relatedto revenue recognition. In August 2015, the FASB deferred the effective date of ASC 606 by one year.ASC 606 will be effective for us in the first quarter of fiscal 2019 and allows for either a fullretrospective or a modified retrospective approach at adoption. We are continuing to assess the impactof adopting ASC 606, but do not expect adoption to have a material impact on our results ofoperations or financial position.
59

TE CONNECTIVITY LTD.
NOTES TO CONSOLIDATED FINANCIAL STATEMENTS (Continued)
3. Restructuring and Other Charges, Net
Net restructuring and other charges consisted of the following:
Fiscal
2015 2014 2013
(in millions)
Restructuring charges, net . . . . . . . . . . . . . . . . . . . . . . . . . . . . $ 93 $23 $225Other charges (credits), net . . . . . . . . . . . . . . . . . . . . . . . . . . . 59 (4) (3)
$152 $19 $222
Restructuring Charges, Net
Net restructuring charges by segment were as follows:
Fiscal
2015 2014 2013
(in millions)
Transportation Solutions . . . . . . . . . . . . . . . . . . . . . . . . . . . . . . $ 6 $ 7 $ 39Industrial Solutions . . . . . . . . . . . . . . . . . . . . . . . . . . . . . . . . . . 29 7 62Communications Solutions . . . . . . . . . . . . . . . . . . . . . . . . . . . . 58 9 124
Restructuring charges, net . . . . . . . . . . . . . . . . . . . . . . . . . . . $93 $23 $225
60

TE CONNECTIVITY LTD.
NOTES TO CONSOLIDATED FINANCIAL STATEMENTS (Continued)
3. Restructuring and Other Charges, Net (Continued)
Activity in our restructuring reserves is summarized as follows:
Balance at Currency Balance atBeginning Translation Endof Fiscal Changes in Cash Non-Cash and of Fiscal
Year Charges Estimate Payments Items Other(1) Year
(in millions)Fiscal 2015 Activity:
Fiscal 2015 Actions:Employee severance . . . . . . . . . . . $ — $ 68 $ — $ (23) $ — $ — $ 45Facility and other exit costs . . . . . . . — 3 — (2) — — 1Property, plant, and equipment . . . . — 21 — — (21) — —
Total . . . . . . . . . . . . . . . . . . . . — 92 — (25) (21) — 46
Fiscal 2014 Actions:Employee severance . . . . . . . . . . . 16 — — (7) — (5) 4Facility and other exit costs . . . . . . . 1 — — (1) — — —
Total . . . . . . . . . . . . . . . . . . . . 17 — — (8) — (5) 4
Fiscal 2013 Actions:Employee severance . . . . . . . . . . . 61 — (1) (42) — (4) 14Facility and other exit costs . . . . . . . 1 2 — (3) — — —
Total . . . . . . . . . . . . . . . . . . . . 62 2 (1) (45) — (4) 14
Pre-Fiscal 2013 Actions:Employee severance . . . . . . . . . . . 14 2 (3) (5) — (2) 6Facility and other exit costs . . . . . . . 21 1 — (9) — 1 14
Total . . . . . . . . . . . . . . . . . . . . 35 3 (3) (14) — (1) 20
Total fiscal 2015 activity . . . . . . . . . . . $114 $ 97 $ (4) $ (92) $(21) $(10) $ 84
Fiscal 2014 Activity:Fiscal 2014 Actions:
Employee severance . . . . . . . . . . . $ — $ 10 $ — $ (13) $ — $ 19 $ 16Facility and other exit costs . . . . . . . — — — — — 1 1Property, plant, and equipment . . . . — 9 — — (9) — —
Total . . . . . . . . . . . . . . . . . . . . — 19 — (13) (9) 20 17
Fiscal 2013 Actions:Employee severance . . . . . . . . . . . 159 8 (10) (105) — 9 61Facility and other exit costs . . . . . . . 1 4 — (5) — 1 1Property, plant, and equipment . . . . — 7 — — (7) — —
Total . . . . . . . . . . . . . . . . . . . . 160 19 (10) (110) (7) 10 62
Pre-Fiscal 2013 Actions:Employee severance . . . . . . . . . . . 51 2 (10) (29) — — 14Facility and other exit costs . . . . . . . 26 2 1 (8) — — 21
Total . . . . . . . . . . . . . . . . . . . . 77 4 (9) (37) — — 35
Total fiscal 2014 activity . . . . . . . . . . . $237 $ 42 $(19) $(160) $(16) $ 30 $114
61

TE CONNECTIVITY LTD.
NOTES TO CONSOLIDATED FINANCIAL STATEMENTS (Continued)
3. Restructuring and Other Charges, Net (Continued)
Balance at Currency Balance atBeginning Translation Endof Fiscal Changes in Cash Non-Cash and of Fiscal
Year Charges Estimate Payments Items Other(1) Year
(in millions)Fiscal 2013 Activity:
Fiscal 2013 Actions:Employee severance . . . . . . . . . . . $ — $185 $ (8) $ (79) $ — $ 61 $159Facility and other exit costs . . . . . . . — 5 — (4) — — 1Property, plant, and equipment . . . . — 58 — — (58) — —
Total . . . . . . . . . . . . . . . . . . . . — 248 (8) (83) (58) 61 160
Pre-Fiscal 2013 Actions:Employee severance . . . . . . . . . . . 130 7 (27) (58) — (1) 51Facility and other exit costs . . . . . . . 31 2 1 (10) — 2 26Property, plant, and equipment . . . . — 2 — — (2) — —
Total . . . . . . . . . . . . . . . . . . . . 161 11 (26) (68) (2) 1 77
Total fiscal 2013 activity . . . . . . . . . . . $161 $259 $(34) $(151) $(60) $ 62 $237
(1) Includes net charges (credits) associated with discontinued operations of $(1) million, $36 million, and $65 million in fiscal2015, 2014, and 2013, respectively.
Fiscal 2015 Actions
During fiscal 2015, we initiated a restructuring program associated with headcount reductions andproduct line closures, primarily impacting the Communications Solutions and Industrial Solutionssegments. In connection with this program, during fiscal 2015, we recorded net restructuring charges of$92 million. We expect to complete all restructuring actions commenced in fiscal 2015 by the end offiscal 2016 and to incur total charges of approximately $98 million.
Fiscal 2014 Actions
During fiscal 2014, we initiated a restructuring program associated primarily with headcountreductions and manufacturing site and product line closures in the Communications Solutions segment.In connection with this program, we recorded net restructuring charges of $19 million in fiscal 2014.We do not expect to incur significant additional expense related to restructuring programs commencedin fiscal 2014.
Fiscal 2013 Actions
During fiscal 2013, we initiated a restructuring program associated with headcount reductions andmanufacturing site closures impacting all segments. In connection with this program, during fiscal 2015,2014, and 2013, we recorded net restructuring charges of $1 million, $9 million, and $240 million,respectively. We do not expect to incur significant additional expense related to restructuring programscommenced in fiscal 2013.
62

TE CONNECTIVITY LTD.
NOTES TO CONSOLIDATED FINANCIAL STATEMENTS (Continued)
3. Restructuring and Other Charges, Net (Continued)
Pre-Fiscal 2013 Actions
During fiscal 2012, we initiated a restructuring program to reduce headcount across all segments.Also, during fiscal 2012, we initiated a restructuring program in the Transportation Solutions andIndustrial Solutions segments associated with the acquisition of Deutsch Group SAS. During fiscal 2014and 2013, we recorded net restructuring credits of $5 million and $15 million, respectively, related topre-fiscal 2013 actions. We do not expect to incur any additional charges related to pre-fiscal 2013actions.
Total Restructuring Reserves
Restructuring reserves included on the Consolidated Balance Sheets were as follows:
Fiscal YearEnd
2015 2014
(in millions)
Accrued and other current liabilities . . . . . . . . . . . . . . . . . . . . . . . . . . $60 $ 83Other liabilities . . . . . . . . . . . . . . . . . . . . . . . . . . . . . . . . . . . . . . . . . 24 31
Restructuring reserves . . . . . . . . . . . . . . . . . . . . . . . . . . . . . . . . . . . $84 $114
Other Charges (Credits), Net
During fiscal 2015, in connection with the sale our Broadband Network Solutions (‘‘BNS’’)business, we incurred costs of $61 million, consisting primarily of $36 million of legal and professionalfees and $18 million of charges associated with the exit of a facility. These amounts are not directlyrelated to the business sold, and accordingly have been recorded in continuing operations. See Note 4for additional information regarding the divestiture of BNS.
4. Discontinued Operations
During fiscal 2015, we sold our BNS business for $3.0 billion in cash and recognized a pre-tax gainof $1,105 million on the transaction. In the U.S., income taxes associated with the gain on the sale ofassets were largely offset by income tax benefits realized on the sale of several subsidiaries. In certainnon-U.S. jurisdictions, the sale was exempt from income taxes.
Pre-tax income from discontinued operations for fiscal 2015 included pre-tax charges of$127 million recorded in connection with the Com-Net case related to our former Wireless Systemsbusiness which was sold in fiscal 2009. See Note 13 for additional information regarding the Com-Netcase.
63

TE CONNECTIVITY LTD.
NOTES TO CONSOLIDATED FINANCIAL STATEMENTS (Continued)
4. Discontinued Operations (Continued)
The following table presents information regarding certain components of income fromdiscontinued operations, net of income taxes:
Fiscal
2015 2014 2013
(in millions)
Net sales from discontinued operations . . . . . . . . . . . . . . $1,595 $1,939 $1,890
Pre-tax income from discontinued operations . . . . . . . . . . $ 118 $ 224 $ 167Pre-tax gain (loss) on sale of discontinued operations . . . . 1,105 — (4)Income tax expense . . . . . . . . . . . . . . . . . . . . . . . . . . . . (41) (57) (41)
Income from discontinued operations, net of income taxes $1,182 $ 167 $ 122
The following table presents balance sheet information for assets and liabilities held for sale fiscalyear end 2014; there were no such balances at fiscal year end 2015:
Fiscal Year End2014
(in millions)
Accounts receivable, net . . . . . . . . . . . . . . . . . . . . . . . . . . . . . . . . . . $ 382Inventories . . . . . . . . . . . . . . . . . . . . . . . . . . . . . . . . . . . . . . . . . . . 236Property, plant, and equipment, net . . . . . . . . . . . . . . . . . . . . . . . . . 206Goodwill . . . . . . . . . . . . . . . . . . . . . . . . . . . . . . . . . . . . . . . . . . . . . 869Intangible assets, net . . . . . . . . . . . . . . . . . . . . . . . . . . . . . . . . . . . . 242Other assets . . . . . . . . . . . . . . . . . . . . . . . . . . . . . . . . . . . . . . . . . . 78
Total assets . . . . . . . . . . . . . . . . . . . . . . . . . . . . . . . . . . . . . . . . . $2,013
Current maturities of long-term debt . . . . . . . . . . . . . . . . . . . . . . . . $ 90Accounts payable . . . . . . . . . . . . . . . . . . . . . . . . . . . . . . . . . . . . . . . 161Other liabilities . . . . . . . . . . . . . . . . . . . . . . . . . . . . . . . . . . . . . . . . 165
Total liabilities . . . . . . . . . . . . . . . . . . . . . . . . . . . . . . . . . . . . . . . $ 416
The BNS and Wireless Systems businesses met the discontinued operations criteria and have beenreported as such in all periods presented on the Consolidated Financial Statements. Prior toreclassification to discontinued operations, the BNS and Wireless Systems businesses were included inthe former Network Solutions and Wireless Systems segments, respectively.
5. Acquisitions
Measurement Specialties, Inc.
On October 9, 2014, we acquired 100% of the outstanding shares of Measurement Specialties, Inc.(‘‘Measurement Specialties’’), a leading global designer and manufacturer of sensors and sensor-basedsystems, for $86.00 in cash per share. The total value paid was approximately $1.7 billion, net of cashacquired, and included $225 million for the repayment of Measurement Specialties’ debt and accruedinterest. Measurement Specialties offers a broad portfolio of technologies including pressure, vibration,
64

TE CONNECTIVITY LTD.
NOTES TO CONSOLIDATED FINANCIAL STATEMENTS (Continued)
5. Acquisitions (Continued)
force, temperature, humidity, ultrasonics, position, and fluid sensors, for a wide range of applicationsand industries. This business has been reported as part of our Transportation Solutions segment fromthe date of acquisition.
During the second quarter of fiscal 2015, we finalized the valuation of identifiable intangible assets,fixed assets, and pre-acquisition contingencies.
The following table summarizes the allocation of the purchase price to the fair value of identifiableassets acquired and liabilities assumed at the date of acquisition, in accordance with the acquisitionmethod of accounting:
(in millions)
Cash and cash equivalents . . . . . . . . . . . . . . . . . . . . . . . . . . . . . . . . . . $ 37Accounts receivable . . . . . . . . . . . . . . . . . . . . . . . . . . . . . . . . . . . . . . . 84Inventories . . . . . . . . . . . . . . . . . . . . . . . . . . . . . . . . . . . . . . . . . . . . . 110Other current assets . . . . . . . . . . . . . . . . . . . . . . . . . . . . . . . . . . . . . . 20Property, plant, and equipment . . . . . . . . . . . . . . . . . . . . . . . . . . . . . . 95Goodwill . . . . . . . . . . . . . . . . . . . . . . . . . . . . . . . . . . . . . . . . . . . . . . . 1,064Intangible assets . . . . . . . . . . . . . . . . . . . . . . . . . . . . . . . . . . . . . . . . . 547Other non-current assets . . . . . . . . . . . . . . . . . . . . . . . . . . . . . . . . . . . 9
Total assets acquired . . . . . . . . . . . . . . . . . . . . . . . . . . . . . . . . . . . . 1,966
Current maturities of long-term debt . . . . . . . . . . . . . . . . . . . . . . . . . . 20Accounts payable . . . . . . . . . . . . . . . . . . . . . . . . . . . . . . . . . . . . . . . . 48Other current liabilities . . . . . . . . . . . . . . . . . . . . . . . . . . . . . . . . . . . . 67Long-term debt . . . . . . . . . . . . . . . . . . . . . . . . . . . . . . . . . . . . . . . . . . 203Deferred income taxes . . . . . . . . . . . . . . . . . . . . . . . . . . . . . . . . . . . . . 98Other non-current liabilities . . . . . . . . . . . . . . . . . . . . . . . . . . . . . . . . . 9
Total liabilities assumed . . . . . . . . . . . . . . . . . . . . . . . . . . . . . . . . . . 445
Net assets acquired . . . . . . . . . . . . . . . . . . . . . . . . . . . . . . . . . . . . . 1,521Cash and cash equivalents acquired . . . . . . . . . . . . . . . . . . . . . . . . . . . (37)
Net cash paid . . . . . . . . . . . . . . . . . . . . . . . . . . . . . . . . . . . . . . . . . . . $1,484
The fair values assigned to intangible assets were determined through the use of the incomeapproach, specifically the relief from royalty and the multi-period excess earnings methods. Bothvaluation methods rely on management judgment, including expected future cash flows resulting fromexisting customer relationships, customer attrition rates, contributory effects of other assets utilized inthe business, peer group cost of capital and royalty rates, and other factors. The valuation of tangibleassets was derived using a combination of the income, market, and cost approaches. Significantjudgments used in valuing tangible assets include estimated reproduction or replacement cost, usefullives of assets, estimated selling prices, costs to complete, and reasonable profit. Useful lives forintangible assets were determined based upon the remaining useful economic lives of the intangibleassets that are expected to contribute directly or indirectly to future cash flows.
65

TE CONNECTIVITY LTD.
NOTES TO CONSOLIDATED FINANCIAL STATEMENTS (Continued)
5. Acquisitions (Continued)
Intangible assets acquired consisted of the following:
Weighted-AverageAmortization
Amount Period
(in millions) (in years)
Customer relationships . . . . . . . . . . . . . . . . . . . . . . . . $370 18Developed technology . . . . . . . . . . . . . . . . . . . . . . . . . 161 9Trade names and trademarks . . . . . . . . . . . . . . . . . . . . 4 1Customer order backlog . . . . . . . . . . . . . . . . . . . . . . . 12 <1
Total . . . . . . . . . . . . . . . . . . . . . . . . . . . . . . . . . . . . $547 15
The acquired intangible assets are being amortized on a straight-line basis over their expecteduseful lives.
Goodwill of $1,064 million was recognized in the transaction, representing the excess of thepurchase price over the fair value of the tangible and intangible assets acquired and liabilities assumed.This goodwill is attributable primarily to cost savings and other synergies related to operationalefficiencies including the consolidation of manufacturing, marketing, and general and administrativefunctions. The goodwill has been allocated to the Transportation Solutions segment and is notdeductible for tax purposes. However, prior to its merger with us, Measurement Specialties completedcertain acquisitions that resulted in goodwill with an estimated value of $23 million that is deductibleprimarily for U.S. tax purposes, which we will deduct through 2030.
During fiscal 2015, Measurement Specialties contributed net sales of $548 million to ourConsolidated Statement of Operations. Due to the commingled nature of our operations, it is notpracticable to separately identify operating income of Measurement Specialties on a stand-alone basis.
The following unaudited pro forma financial information reflects our consolidated results ofoperations had the Measurement Specialties acquisition occurred at the beginning of fiscal 2014:
Pro Forma for Fiscal
2015 2014
(in millions, exceptper share data)
Net sales . . . . . . . . . . . . . . . . . . . . . . . . . . . . . . . . . . . . . . . . . $12,252 $12,429Net income attributable to TE Connectivity Ltd. . . . . . . . . . . . . 2,440 1,744Diluted earnings per share attributable to TE Connectivity Ltd. . $ 5.94 $ 4.18
The pro forma financial information is based on our final allocation of the purchase price. Thesignificant pro forma adjustments, which are described below, are net of income tax expense (benefit)at the statutory rate.
Pro forma results for fiscal 2015 were adjusted to exclude $16 million of acquisition costs,$15 million of share-based compensation expense incurred by Measurement Specialties as a result ofthe change in control of Measurement Specialties, $11 million of charges related to the fair valueadjustment to acquisition-date inventories, $7 million of charges related to acquired customer orderbacklog, $6 million of income tax expense based on the estimated impact of combining MeasurementSpecialties into our global tax position, and $1 million of charges related to the amortization of the fairvalue of acquired intangible assets. In addition, pro forma results for fiscal 2015 were adjusted toinclude $3 million of interest expense based on pro forma changes in our capital structure.
66

TE CONNECTIVITY LTD.
NOTES TO CONSOLIDATED FINANCIAL STATEMENTS (Continued)
5. Acquisitions (Continued)
Pro forma results for fiscal 2014 were adjusted to include $20 million of charges related to theamortization of the fair value of acquired intangible assets, $19 million of income tax expense based onthe estimated impact of combining Measurement Specialties into our global tax position, $14 million ofinterest expense based on pro forma changes in our capital structure, $11 million of charges related tothe fair value adjustment to acquisition-date inventories, $7 million of charges related to acquiredcustomer order backlog, and $2 million in depreciation expense.
Pro forma results do not include any anticipated synergies or other anticipated benefits of theacquisition. Accordingly, the unaudited pro forma financial information is not necessarily indicative ofeither future results of operations or results that might have been achieved had the MeasurementSpecialties acquisition occurred at the beginning of fiscal 2014.
Other Acquisitions
During fiscal 2015, we acquired three additional companies for $241 million in cash, net of cashacquired. During fiscal 2014, we acquired five companies, including the SEACON Group (‘‘SEACON’’),a leading provider of underwater connector technology and systems, for $522 million in cash, net ofcash acquired.
6. Inventories
Inventories consisted of the following:
Fiscal Year End
2015 2014
(in millions)
Raw materials . . . . . . . . . . . . . . . . . . . . . . . . . . . . . . . . . . . . . . . $ 261 $ 211Work in progress . . . . . . . . . . . . . . . . . . . . . . . . . . . . . . . . . . . . . 581 562Finished goods . . . . . . . . . . . . . . . . . . . . . . . . . . . . . . . . . . . . . . 773 736
Inventories . . . . . . . . . . . . . . . . . . . . . . . . . . . . . . . . . . . . . . . . $1,615 $1,509
7. Property, Plant, and Equipment, Net
Net property, plant, and equipment consisted of the following:
Fiscal Year End
2015 2014
(in millions)
Land and improvements . . . . . . . . . . . . . . . . . . . . . . . . . . . . . . $ 163 $ 185Buildings and improvements . . . . . . . . . . . . . . . . . . . . . . . . . . . 1,261 1,244Machinery and equipment . . . . . . . . . . . . . . . . . . . . . . . . . . . . . 6,692 6,787Construction in process . . . . . . . . . . . . . . . . . . . . . . . . . . . . . . . 521 550
Gross property, plant, and equipment . . . . . . . . . . . . . . . . . . . . . 8,637 8,766Accumulated depreciation . . . . . . . . . . . . . . . . . . . . . . . . . . . . . (5,717) (5,846)
Property, plant, and equipment, net . . . . . . . . . . . . . . . . . . . . $ 2,920 $ 2,920
Depreciation expense was $463 million, $467 million, and $456 million in fiscal 2015, 2014, and2013, respectively.
67

TE CONNECTIVITY LTD.
NOTES TO CONSOLIDATED FINANCIAL STATEMENTS (Continued)
8. Goodwill
The changes in the carrying amount of goodwill by segment were as follows(1):
Transportation Industrial CommunicationsSolutions Solutions Solutions Total
(in millions)
September 27, 2013(2) . . . . . . . . . . . . . . . . . . . . . . . $ 797 $1,919 $736 $3,452Acquisitions . . . . . . . . . . . . . . . . . . . . . . . . . . . . 46 265 — 311Currency translation and other . . . . . . . . . . . . . . . (9) (19) (9) (37)
September 26, 2014(2) . . . . . . . . . . . . . . . . . . . . . . . 834 2,165 727 3,726Acquisitions . . . . . . . . . . . . . . . . . . . . . . . . . . . . 1,066 145 — 1,211Currency translation . . . . . . . . . . . . . . . . . . . . . . (37) (57) (19) (113)
September 25, 2015(2) . . . . . . . . . . . . . . . . . . . . . . . $1,863 $2,253 $708 $4,824
(1) In connection with the realignment of certain businesses during fiscal 2015, goodwill was re-allocated to reporting unitsusing a relative fair value approach. See Note 22 for additional information regarding our current segment structure.
(2) At fiscal year end 2015, 2014, and 2013, accumulated impairment losses for the Transportation Solutions, IndustrialSolutions, and Communications Solutions segments were $2,191 million, $669 million, and $1,626 million, respectively.
During fiscal 2015, we completed the acquisition of Measurement Specialties and recognizedgoodwill of $1,064 million, which benefited the Transportation Solutions segment. See Note 5 foradditional information regarding acquisitions.
We completed our annual goodwill impairment test in the fourth quarter of fiscal 2015 anddetermined that no impairment existed.
9. Intangible Assets, Net
Intangible assets consisted of the following:
Fiscal Year End
2015 2014
Gross Net Gross NetCarrying Accumulated Carrying Carrying Accumulated CarryingAmount Amortization Amount Amount Amortization Amount
(in millions)
Intellectual property . . . . . . . . . . . . . $1,150 $(524) $ 626 $ 986 $(453) $ 533Customer relationships . . . . . . . . . . . 1,053 (148) 905 614 (83) 531Other . . . . . . . . . . . . . . . . . . . . . . . . 37 (13) 24 35 (12) 23
Total . . . . . . . . . . . . . . . . . . . . . . . $2,240 $(685) $1,555 $1,635 $(548) $1,087
During fiscal 2015, the gross carrying amount of intangible assets increased by $547 million as aresult of the Measurement Specialties acquisition. Intangible asset amortization expense was$153 million, $84 million, and $80 million for fiscal 2015, 2014, and 2013, respectively.
68

TE CONNECTIVITY LTD.
NOTES TO CONSOLIDATED FINANCIAL STATEMENTS (Continued)
9. Intangible Assets, Net (Continued)
The aggregate amortization expense on intangible assets is expected to be as follows:
(in millions)
Fiscal 2016 . . . . . . . . . . . . . . . . . . . . . . . . . . . . . . . . . . . . . . . . . . . . . $ 141Fiscal 2017 . . . . . . . . . . . . . . . . . . . . . . . . . . . . . . . . . . . . . . . . . . . . . 137Fiscal 2018 . . . . . . . . . . . . . . . . . . . . . . . . . . . . . . . . . . . . . . . . . . . . . 137Fiscal 2019 . . . . . . . . . . . . . . . . . . . . . . . . . . . . . . . . . . . . . . . . . . . . . 135Fiscal 2020 . . . . . . . . . . . . . . . . . . . . . . . . . . . . . . . . . . . . . . . . . . . . . 131Thereafter . . . . . . . . . . . . . . . . . . . . . . . . . . . . . . . . . . . . . . . . . . . . . 874
Total . . . . . . . . . . . . . . . . . . . . . . . . . . . . . . . . . . . . . . . . . . . . . . . . $1,555
10. Accrued and Other Current Liabilities
Accrued and other current liabilities consisted of the following:
Fiscal Year End
2015 2014
(in millions)
Accrued payroll and employee benefits . . . . . . . . . . . . . . . . . . . . . $ 424 $ 470Dividends payable to shareholders . . . . . . . . . . . . . . . . . . . . . . . . 260 236Income taxes payable . . . . . . . . . . . . . . . . . . . . . . . . . . . . . . . . . . 198 158Share repurchase program payable . . . . . . . . . . . . . . . . . . . . . . . . 177 37Restructuring reserves . . . . . . . . . . . . . . . . . . . . . . . . . . . . . . . . . 60 83Interest payable . . . . . . . . . . . . . . . . . . . . . . . . . . . . . . . . . . . . . . 53 50Deferred income taxes . . . . . . . . . . . . . . . . . . . . . . . . . . . . . . . . . 33 26Other . . . . . . . . . . . . . . . . . . . . . . . . . . . . . . . . . . . . . . . . . . . . . 544 534
Accrued and other current liabilities . . . . . . . . . . . . . . . . . . . . . $1,749 $1,594
69

TE CONNECTIVITY LTD.
NOTES TO CONSOLIDATED FINANCIAL STATEMENTS (Continued)
11. Debt
Debt was as follows:
Fiscal Year End
2015 2014
(in millions)
Current maturities of long-term debt:1.60% senior notes due 2015 . . . . . . . . . . . . . . . . . . . . . . . . . . . $ — $ 250Senior floating rate notes due 2016(1) . . . . . . . . . . . . . . . . . . . . . 500 —Commercial paper, at a weighted-average interest rate of 0.30%
at September 26, 2014 . . . . . . . . . . . . . . . . . . . . . . . . . . . . . . — 327
Total . . . . . . . . . . . . . . . . . . . . . . . . . . . . . . . . . . . . . . . . . . 500 577
Long-term debt:Senior floating rate notes due 2016(1) . . . . . . . . . . . . . . . . . . . . . — 5006.55% senior notes due 2017 . . . . . . . . . . . . . . . . . . . . . . . . . . . 718 7232.375% senior notes due 2018 . . . . . . . . . . . . . . . . . . . . . . . . . . 324 3242.35% senior notes due 2019 . . . . . . . . . . . . . . . . . . . . . . . . . . . 250 2504.875% senior notes due 2021 . . . . . . . . . . . . . . . . . . . . . . . . . . 263 2613.50% senior notes due 2022 . . . . . . . . . . . . . . . . . . . . . . . . . . . 511 4991.100% senior notes due 2023 . . . . . . . . . . . . . . . . . . . . . . . . . . 612 —3.45% senior notes due 2024 . . . . . . . . . . . . . . . . . . . . . . . . . . . 249 2497.125% senior notes due 2037 . . . . . . . . . . . . . . . . . . . . . . . . . . 475 475Other . . . . . . . . . . . . . . . . . . . . . . . . . . . . . . . . . . . . . . . . . . . 1 —
Total . . . . . . . . . . . . . . . . . . . . . . . . . . . . . . . . . . . . . . . . . . 3,403 3,281
Total debt(2) . . . . . . . . . . . . . . . . . . . . . . . . . . . . . . . . . . . . . . . . . $3,903 $3,858
(1) The senior floating rate notes due 2016 bear interest at a rate of three-month London interbank offered rate(‘‘LIBOR’’) plus 0.20% per year.
(2) Senior notes are presented at face amount and, if applicable, are net of unamortized discount and the effects ofinterest rate swaps designated as fair value hedges.
In February 2015, Tyco Electronics Group S.A. (‘‘TEGSA’’), our 100%-owned subsidiary, issuedA550 million aggregate principal amount of 1.100% senior notes due March 1, 2023. The notes areTEGSA’s unsecured senior obligations and rank equally in right of payment with all existing and anyfuture senior indebtedness of TEGSA and senior to any subordinated indebtedness that TEGSA mayincur.
TEGSA has a five-year unsecured senior revolving credit facility (‘‘Credit Facility’’) with totalcommitments of $1,500 million. The Credit Facility was amended in August 2013 primarily to extendthe maturity date from June 2016 to August 2018 and reduce borrowing costs. TEGSA had noborrowings under the Credit Facility at September 25, 2015 and September 26, 2014.
Borrowings under the Credit Facility bear interest at a rate per annum equal to, at the option ofTEGSA, (1) LIBOR plus an applicable margin based upon the senior, unsecured, long-term debt ratingof TEGSA, or (2) an alternate base rate equal to the highest of (i) Deutsche Bank AG New Yorkbranch’s base rate, (ii) the federal funds effective rate plus 1⁄2 of 1%, and (iii) one-month LIBOR plus1%, plus, in each case, an applicable margin based upon the senior, unsecured, long-term debt rating of
70

TE CONNECTIVITY LTD.
NOTES TO CONSOLIDATED FINANCIAL STATEMENTS (Continued)
11. Debt (Continued)
TEGSA. TEGSA is required to pay an annual facility fee ranging from 7.5 to 25.0 basis points basedupon the amount of the lenders’ commitments under the Credit Facility and the applicable creditratings of TEGSA.
The Credit Facility contains a financial ratio covenant providing that if, as of the last day of eachfiscal quarter, our ratio of Consolidated Total Debt to Consolidated EBITDA (as defined in the CreditFacility) for the then most recently concluded period of four consecutive fiscal quarters exceeds 3.75 to1.0, an Event of Default (as defined in the Credit Facility) is triggered. The Credit Facility and ourother debt agreements contain other customary covenants.
Periodically, TEGSA issues commercial paper to U.S. institutional accredited investors andqualified institutional buyers in accordance with available exemptions from the registrationrequirements of the Securities Act of 1933 as part of our ongoing effort to maintain financial flexibilityand to potentially decrease the cost of borrowings. Borrowings under the commercial paper programare backed by the Credit Facility.
TEGSA’s payment obligations under its senior notes, commercial paper, and Credit Facility arefully and unconditionally guaranteed by its parent, TE Connectivity Ltd.
The aggregate amounts of total debt maturing are as follows:
(in millions)
Fiscal 2016 . . . . . . . . . . . . . . . . . . . . . . . . . . . . . . . . . . . . . . . . . . . . . $ 500Fiscal 2017 . . . . . . . . . . . . . . . . . . . . . . . . . . . . . . . . . . . . . . . . . . . . . —Fiscal 2018 . . . . . . . . . . . . . . . . . . . . . . . . . . . . . . . . . . . . . . . . . . . . . 718Fiscal 2019 . . . . . . . . . . . . . . . . . . . . . . . . . . . . . . . . . . . . . . . . . . . . . 574Fiscal 2020 . . . . . . . . . . . . . . . . . . . . . . . . . . . . . . . . . . . . . . . . . . . . . —Thereafter . . . . . . . . . . . . . . . . . . . . . . . . . . . . . . . . . . . . . . . . . . . . . 2,111
Total . . . . . . . . . . . . . . . . . . . . . . . . . . . . . . . . . . . . . . . . . . . . . . . . $3,903
The fair value of our debt, based on indicative valuations, was approximately $4,115 million and$4,125 million at fiscal year end 2015 and 2014, respectively.
12. Guarantees
Tax Sharing Agreement
Effective June 29, 2007, we became the parent company of the former electronics businesses ofTyco International plc (‘‘Tyco International’’). On June 29, 2007, Tyco International distributed all ofour shares, as well as its shares of its former healthcare businesses (‘‘Covidien’’), to its commonshareholders (the ‘‘separation’’). On January 26, 2015, Covidien was acquired and now operates as asubsidiary of Medtronic plc.
Upon separation, we entered into a Tax Sharing Agreement, under which we share responsibilityfor certain of our, Tyco International’s, and Covidien’s income tax liabilities based on a sharing formulafor periods prior to and including June 29, 2007. We, Tyco International, and Covidien share 31%,27%, and 42%, respectively, of U.S. income tax liabilities that arise from adjustments made by taxauthorities to our, Tyco International’s, and Covidien’s U.S. income tax returns. The effect of the TaxSharing Agreement is to indemnify us for 69% of certain liabilities settled in cash by us with respect to
71

TE CONNECTIVITY LTD.
NOTES TO CONSOLIDATED FINANCIAL STATEMENTS (Continued)
12. Guarantees (Continued)
unresolved pre-separation tax matters. Pursuant to that indemnification, we have made similarindemnifications to Tyco International and Covidien with respect to 31% of certain liabilities settled incash by the companies relating to unresolved pre-separation tax matters. All costs and expensesassociated with the management of these shared tax liabilities are shared equally among the parties.
All of the tax liabilities that are associated with our businesses, including liabilities that arose priorto our separation from Tyco International, became our tax liabilities. Although we have agreed to sharecertain of these tax liabilities with Tyco International and Covidien, we remain primarily liable for all ofthese liabilities. If Tyco International and Covidien default on their obligations to us, we would beliable for the entire amount of these liabilities.
If any party to the Tax Sharing Agreement were to default in its obligation to another party to payits share of the distribution taxes that arise as a result of no party’s fault, each non-defaulting partywould be required to pay, equally with any other non-defaulting party, the amounts in default. Inaddition, if another party to the Tax Sharing Agreement that is responsible for all or a portion of anincome tax liability were to default in its payment of such liability to a taxing authority, we could belegally liable under applicable tax law for such liabilities and required to make additional tax payments.Accordingly, under certain circumstances, we may be obligated to pay amounts in excess of ouragreed-upon share of our, Tyco International’s, and Covidien’s tax liabilities.
Indemnification
Our indemnification created under the Tax Sharing Agreement qualifies as a guarantee of a thirdparty entity’s debt under ASC 460, Guarantees. In the event that we are required, due to bankruptcy orother business interruption on the part of Tyco International or Covidien, to pay more than thecontractually determined 31%, we retain the right to seek payment from the effected entity. AtSeptember 25, 2015 and September 26, 2014, we had a liability representing the indemnifications madeto Tyco International and Covidien pursuant to the Tax Sharing Agreement of $17 million and$21 million, respectively. See additional information in Note 13.
Other Matters
In disposing of assets or businesses, we often provide representations, warranties, and/orindemnities to cover various risks including unknown damage to assets, environmental risks involved inthe sale of real estate, liability for investigation and remediation of environmental contamination atwaste disposal sites and manufacturing facilities, and unidentified tax liabilities and legal fees related toperiods prior to disposition. We do not expect that these uncertainties will have a material adverseeffect on our results of operations, financial position, or cash flows.
At September 25, 2015, we had outstanding letters of credit, letters of guarantee, and surety bondsin the amount of $360 million.
In the normal course of business, we are liable for contract completion and product performance.In the opinion of management, such obligations will not significantly affect our results of operations,financial position, or cash flows.
We generally record estimated product warranty costs when contract revenues are recognizedunder the percentage-of-completion method for construction related contracts; other warranty reservesare not significant. The estimation is based primarily on historical experience and actual warranty
72

TE CONNECTIVITY LTD.
NOTES TO CONSOLIDATED FINANCIAL STATEMENTS (Continued)
12. Guarantees (Continued)
claims. Amounts accrued for warranty claims at fiscal year end 2015 and 2014 were $35 million and$29 million, respectively.
13. Commitments and Contingencies
General Matters
We have facility, land, vehicle, and equipment leases that expire at various dates. Rental expenseunder these leases was $141 million, $130 million, and $133 million for fiscal 2015, 2014, and 2013,respectively. At fiscal year end 2015, the minimum lease payment obligations under non-cancelablelease obligations were as follows:
(in millions)
Fiscal 2016 . . . . . . . . . . . . . . . . . . . . . . . . . . . . . . . . . . . . . . . . . . . . . $ 98Fiscal 2017 . . . . . . . . . . . . . . . . . . . . . . . . . . . . . . . . . . . . . . . . . . . . . 76Fiscal 2018 . . . . . . . . . . . . . . . . . . . . . . . . . . . . . . . . . . . . . . . . . . . . . 59Fiscal 2019 . . . . . . . . . . . . . . . . . . . . . . . . . . . . . . . . . . . . . . . . . . . . . 44Fiscal 2020 . . . . . . . . . . . . . . . . . . . . . . . . . . . . . . . . . . . . . . . . . . . . . 30Thereafter . . . . . . . . . . . . . . . . . . . . . . . . . . . . . . . . . . . . . . . . . . . . . 37
Total . . . . . . . . . . . . . . . . . . . . . . . . . . . . . . . . . . . . . . . . . . . . . . . . $344
Legal Proceedings
In the ordinary course of business, we are subject to various legal proceedings and claims,including patent infringement claims, product liability matters, employment disputes, disputes onagreements, other commercial disputes, environmental matters, antitrust claims, and tax matters,including non-income tax matters such as value added tax, sales and use tax, real estate tax, andtransfer tax. Although it is not feasible to predict the outcome of these proceedings, based upon ourexperience, current information, and applicable law, we do not expect that the outcome of theseproceedings, either individually or in the aggregate, will have a material effect on our results ofoperations, financial position, or cash flows. However, the proceedings discussed below in ‘‘Income TaxMatters’’ could have a material effect on our results of operations, financial position, or cash flows.
As previously reported, we had a contingent purchase price commitment of $80 million related toour fiscal 2001 acquisition of Com-Net. This represented the maximum amount payable to the formershareholders of Com-Net only after the construction and installation of a communications system wascompleted for and approved by the State of Florida in accordance with guidelines set forth in thecontract. Under the terms of the purchase and sale agreement, we did not believe we had anyobligation to the sellers. However, the sellers contested our position and initiated a lawsuit in June2006 in the Court of Common Pleas in Allegheny County, Pennsylvania. Trial began in March 2015 andculminated in the entry of final judgment on October 8, 2015, in favor of the sellers and against us for$127 million plus costs. The judgment represents the $80 million contingent purchase price pluspre-judgment interest, which will continue to accrue until the judgment is paid in full. We areproceeding with an appeal. In connection with this case, we recorded a reserve and pre-tax charges of$127 million in fiscal 2015. These charges are reflected in income from discontinued operations on the
73

TE CONNECTIVITY LTD.
NOTES TO CONSOLIDATED FINANCIAL STATEMENTS (Continued)
13. Commitments and Contingencies (Continued)
Consolidated Statement of Operations as the Com-Net case was associated with our former WirelessSystems business which was sold in fiscal 2009.
Income Tax Matters
Pursuant to the Tax Sharing Agreement, we entered into certain guarantee commitments andindemnifications with Tyco International and Covidien. See Note 12 for additional informationregarding the Tax Sharing Agreement.
Prior to separation, certain of our subsidiaries filed combined income tax returns with TycoInternational. Those and other of our subsidiaries’ income tax returns are examined periodically byvarious tax authorities. In connection with these examinations, tax authorities, including the InternalRevenue Service (‘‘IRS’’), have raised issues and proposed tax adjustments. Tyco International, as theU.S. income tax audit controlling party under the Tax Sharing Agreement, is reviewing and contestingcertain of the proposed tax adjustments. Amounts related to these tax adjustments and other taxcontingencies and related interest that management has assessed under the uncertain tax positionprovisions of ASC 740, Income Taxes, which relate specifically to our entities have been recorded on theConsolidated Financial Statements. In addition, we may be required to fund portions of TycoInternational’s and Covidien’s tax obligations. Estimates of these guarantees have also been recognizedon the Consolidated Financial Statements.
In October 2012, the IRS issued special agreement Forms 870-AD, effectively settling its audit ofall tax matters for the years 1997 through 2000, excluding one issue that remains in dispute asdescribed below. As a result of these developments, in fiscal 2013, we recognized an income tax benefitof $331 million, representing a reduction in tax reserves for the matters that were effectively settled,and other expense of $231 million, representing a reduction of associated indemnification receivables,pursuant to the Tax Sharing Agreement with Tyco International and Covidien.
The disputed issue involves the tax treatment of certain intercompany debt transactions. The IRSfield examination asserted that certain intercompany loans originated during the years 1997 through2000 did not constitute debt for U.S. federal income tax purposes and disallowed approximately$2.7 billion of related interest deductions recognized during the period on Tyco International’s U.S.income tax returns. In addition, if the IRS is ultimately successful in asserting its claim, it is likely todisallow an additional $6.6 billion of interest deductions reflected on U.S. income tax returns in yearssubsequent to fiscal 2000. Tyco International contends that the intercompany financing qualified as debtfor U.S. income tax purposes and that the interest deductions reflected on the income tax returns wereappropriate. The IRS and Tyco International were unable to resolve this matter through the IRSappeals process. On June 20, 2013, Tyco International advised us that it had received Notices ofDeficiency from the IRS for certain former U.S. subsidiaries of Tyco International increasing taxableincome by approximately $2.9 billion in connection with the audit of Tyco International’s fiscal years1997 through 2000. The Notices of Deficiency assert that Tyco International owes additional taxestotaling $778 million, associated penalties of $154 million, and withholding taxes of $105 million. Inaddition, Tyco International received Final Partnership Administrative Adjustments for certain U.S.partnerships owned by former U.S. subsidiaries with respect to which Tyco International estimates anadditional tax deficiency of approximately $30 million will be asserted. The amounts asserted by theIRS exclude any applicable deficiency interest, and do not reflect any impact to subsequent period taxliabilities in the event that the IRS were to prevail on some or all of its assertions. We understand that
74

TE CONNECTIVITY LTD.
NOTES TO CONSOLIDATED FINANCIAL STATEMENTS (Continued)
13. Commitments and Contingencies (Continued)
Tyco International strongly disagrees with the IRS position and has filed petitions in the U.S. Tax Courtcontesting the IRS’s proposed adjustments. Tyco International has advised us that it believes there aremeritorious defenses for the tax filings in question and that the IRS position with regard to this matteris inconsistent with the applicable tax laws and existing U.S. Treasury regulations.
The previously set U.S. Tax Court trial date of February 29, 2016 has been delayed at the requestof the IRS, and trial is expected to commence during October 2016. The parties remain engaged indiscovery. We do not expect any payments to the IRS with respect to this matter until it is fully andfinally resolved. In accordance with the Tax Sharing Agreement, we, Tyco International, and Covidienwould share 31%, 27%, and 42%, respectively, of any payments made in connection with this matter.
If the IRS were to prevail on its assertions, our share of the assessed tax, deficiency interest, andapplicable withholding taxes and penalties could have a material adverse impact on our results ofoperations, financial position, and cash flows. We have reviewed the Notices of Deficiency, the relevantfacts surrounding the intercompany debt transactions, relevant tax regulations, and applicable case law,and we continue to believe that we are appropriately reserved for this matter.
During fiscal 2015, the IRS issued general agreement Forms 870, effectively settling its audits oftax matters for the years 2001 through 2007, excluding the disputed issue discussed above. As a resultof these developments, we recognized an income tax benefit of $201 million, representing a reductionin tax reserves for the matters that were effectively settled, and other expense of $84 million,representing a reduction of associated indemnification receivables, pursuant to the Tax SharingAgreement with Tyco International and Covidien.
Also during fiscal 2015, the IRS issued general agreement Forms 870, effectively settling its auditsof tax matters for the years 2008 through 2010, excluding the disputed issue discussed above. As ofresult of these developments, we recognized an income tax benefit of $63 million, representing areduction in tax reserves for the matters that were effectively settled.
We made net payments of $40 million, $179 million, and $28 million related to pre-separation U.S.tax matters during fiscal 2015, 2014, and 2013, respectively.
At September 25, 2015 and September 26, 2014, we have reflected $17 million and $51 million,respectively, of income tax liabilities related to the audits of Tyco International’s and our income taxreturns in accrued and other current liabilities as certain of these matters could be resolved within thenext twelve months.
We believe that the amounts recorded on the Consolidated Financial Statements relating to thematters discussed above are appropriate. However, the ultimate resolution is uncertain and could resultin a material impact to our results of operations, financial position, or cash flows.
Environmental Matters
We are involved in various stages of investigation and cleanup related to environmentalremediation matters at a number of sites. The ultimate cost of site cleanup is difficult to predict giventhe uncertainties regarding the extent of the required cleanup, the interpretation of applicable laws andregulations, and alternative cleanup methods. As of fiscal year end 2015, we concluded that it wasprobable that we would incur remedial costs in the range of $16 million to $38 million, and that thebest estimate within this range was $19 million. We believe that any potential payment of such
75

TE CONNECTIVITY LTD.
NOTES TO CONSOLIDATED FINANCIAL STATEMENTS (Continued)
13. Commitments and Contingencies (Continued)
estimated amounts will not have a material adverse effect on our results of operations, financialposition, or cash flows.
14. Financial Instruments and Fair Value Measurements
We use derivative and non-derivative financial instruments to manage certain exposures to foreigncurrency, interest rate, investment, and commodity risks.
The effects of derivative instruments on the Consolidated Statements of Operations wereimmaterial for fiscal 2015, 2014, and 2013.
Foreign Exchange Risks and Hedges of Net Investment
As part of managing the exposure to changes in foreign currency exchange rates, we utilize cross-currency swap contracts, foreign currency forward contracts, and foreign currency swap contracts, aportion of which are designated as cash flow hedges. The objective of these contracts is to minimizeimpacts to cash flows and profitability due to changes in foreign currency exchange rates onintercompany and other cash transactions. We expect that significantly all of the balance inaccumulated other comprehensive income (loss) associated with the cash flow hedge-designatedinstruments addressing foreign exchange risks will be reclassified into the Consolidated Statements ofOperations within the next twelve months.
During fiscal 2015, we entered into cross-currency swap contracts with an aggregate notional valueof A1,000 million to reduce our exposure to foreign currency exchange risk associated with certainintercompany loans. Under the terms of these contracts, which have been designated as cash flowhedges, we will make quarterly interest payments in euros at 3.50% per annum and receive interest inU.S. dollars at a weighted-average rate of 5.33% per annum. Upon the maturities of these contracts infiscal 2022, we will pay the principal amount of the loans in euros and receive U.S. dollars from ourcounterparties.
We hedge our net investment in certain foreign operations using intercompany non-derivativefinancial instruments denominated in the same currencies. The aggregate notional value of thesehedges was $3,880 million and $2,893 million at September 25, 2015 and September 26, 2014,respectively. Foreign exchange gains of $353 million and $156 million in fiscal 2015 and 2014,respectively, were recorded as currency translation, a component of accumulated other comprehensiveincome (loss), offsetting foreign exchange losses attributable to the translation of the net investment.Foreign exchange gains and losses recorded as currency translation in fiscal 2013 were immaterial. SeeNote 20 for additional information.
Interest Rate and Investment Risk Management
We issue debt, as needed, to fund our operations and capital requirements. Such borrowings canresult in interest rate exposure. To manage the interest rate exposure, we use interest rate swaps toconvert a portion of fixed-rate debt into variable-rate debt. We use forward starting interest rate swapsand options to enter into interest rate swaps to manage interest rate exposure in periods prior to theanticipated issuance of fixed-rate debt. We also utilize investment swaps to manage earnings exposureon certain nonqualified deferred compensation liabilities.
76

TE CONNECTIVITY LTD.
NOTES TO CONSOLIDATED FINANCIAL STATEMENTS (Continued)
14. Financial Instruments and Fair Value Measurements (Continued)
Commodity Hedges
As part of managing the exposure to certain commodity price fluctuations, we utilize commodityswap contracts designated as cash flow hedges. The objective of these contracts is to minimize impactsto cash flows and profitability due to changes in prices of commodities used in production.
At September 25, 2015 and September 26, 2014, our commodity hedges had notional values of$260 million and $307 million, respectively. We expect that significantly all of the balance inaccumulated other comprehensive income (loss) associated with the commodity hedges will bereclassified into the Consolidated Statements of Operations within the next twelve months.
Fair Value Measurements
Financial instruments recorded at fair value on a recurring basis, which consist of derivativeinstruments and marketable securities, were immaterial at September 25, 2015 and September 26, 2014.
15. Retirement Plans
Defined Benefit Pension Plans
We have a number of contributory and noncontributory defined benefit retirement plans coveringcertain of our U.S. and non-U.S. employees, designed in accordance with local customs and practice.
The net periodic pension benefit cost for all U.S. and non-U.S. defined benefit pension plans wasas follows:
U.S. Plans Non-U.S. Plans
Fiscal Fiscal
2015 2014 2013 2015 2014 2013
($ in millions)
Service cost . . . . . . . . . . . . . . . . . . . . . . . . . . . . . $ 9 $ 7 $ 6 $ 45 $ 46 $ 50Interest cost . . . . . . . . . . . . . . . . . . . . . . . . . . . . 48 50 46 58 71 68Expected return on plan assets . . . . . . . . . . . . . . . (67) (63) (60) (72) (67) (65)Amortization of net actuarial loss . . . . . . . . . . . . . 25 25 36 33 23 32Other . . . . . . . . . . . . . . . . . . . . . . . . . . . . . . . . . — — — (5) (3) (18)
Net periodic pension benefit cost . . . . . . . . . . . $ 15 $ 19 $ 28 $ 59 $ 70 $ 67
Weighted-average assumptions used to determine netpension benefit cost during the fiscal year:
Discount rate . . . . . . . . . . . . . . . . . . . . . . . . . . . 4.34% 4.84% 3.98% 2.77% 3.38% 3.27%Expected return on plan assets . . . . . . . . . . . . . . . 7.20% 7.16% 6.65% 6.46% 5.96% 6.29%Rate of compensation increase . . . . . . . . . . . . . . . —% —% —% 2.86% 2.84% 2.86%
77

TE CONNECTIVITY LTD.
NOTES TO CONSOLIDATED FINANCIAL STATEMENTS (Continued)
15. Retirement Plans (Continued)
The following table represents the changes in benefit obligation and plan assets and the netamount recognized on the Consolidated Balance Sheets for all U.S. and non-U.S. defined benefitpension plans:
U.S. Plans Non-U.S. Plans
Fiscal Fiscal
2015 2014 2015 2014
($ in millions)
Change in benefit obligation:Benefit obligation at beginning of fiscal year . . . . . . . . . . . . . $1,143 $1,074 $ 2,276 $ 2,106
Service cost . . . . . . . . . . . . . . . . . . . . . . . . . . . . . . . . . . . 9 7 45 46Interest cost . . . . . . . . . . . . . . . . . . . . . . . . . . . . . . . . . . . 48 50 58 71Actuarial loss . . . . . . . . . . . . . . . . . . . . . . . . . . . . . . . . . . 42 90 87 256Benefits and administrative expenses paid . . . . . . . . . . . . . (74) (77) (71) (75)Currency translation . . . . . . . . . . . . . . . . . . . . . . . . . . . . . — — (213) (94)Other . . . . . . . . . . . . . . . . . . . . . . . . . . . . . . . . . . . . . . . . 2 (1) 6 (34)
Benefit obligation at end of fiscal year . . . . . . . . . . . . . . . . . 1,170 1,143 2,188 2,276
Change in plan assets:Fair value of plan assets at beginning of fiscal year . . . . . . . . . 978 931 1,177 1,113
Actual return on plan assets . . . . . . . . . . . . . . . . . . . . . . . (26) 123 72 97Employer contributions . . . . . . . . . . . . . . . . . . . . . . . . . . . 1 2 65 85Benefits and administrative expenses paid . . . . . . . . . . . . . (74) (77) (71) (75)Currency translation . . . . . . . . . . . . . . . . . . . . . . . . . . . . . — — (90) (32)Other . . . . . . . . . . . . . . . . . . . . . . . . . . . . . . . . . . . . . . . . — (1) 14 (11)
Fair value of plan assets at end of fiscal year . . . . . . . . . . . . . 879 978 1,167 1,177
Funded status . . . . . . . . . . . . . . . . . . . . . . . . . . . . . . . . . . $ (291) $ (165) $(1,021) $(1,099)
Amounts recognized on the Consolidated Balance Sheets:Accrued and other current liabilities . . . . . . . . . . . . . . . . . . . $ (5) $ (4) $ (19) $ (21)Long-term pension and postretirement liabilities . . . . . . . . . . (286) (161) (1,002) (1,078)
Net amount recognized . . . . . . . . . . . . . . . . . . . . . . . . . . . $ (291) $ (165) $(1,021) $(1,099)
Weighted-average assumptions used to determine pension benefitobligation at fiscal year end:
Discount rate . . . . . . . . . . . . . . . . . . . . . . . . . . . . . . . . . . . . 4.38% 4.34% 2.50% 2.77%Rate of compensation increase . . . . . . . . . . . . . . . . . . . . . . . —% —% 2.81% 2.86%
78

TE CONNECTIVITY LTD.
NOTES TO CONSOLIDATED FINANCIAL STATEMENTS (Continued)
15. Retirement Plans (Continued)
The pre-tax amounts recognized in accumulated other comprehensive income (loss) for all U.S.and non-U.S. defined benefit pension plans were as follows:
U.S. Plans Non-U.S. Plans
Fiscal Fiscal
2015 2014 2015 2014
(in millions)
Change in net loss:Unrecognized net loss at beginning of fiscal year . . . . . . . . . . . . . . . . . . $325 $320 $748 $592
Current year change recorded in accumulated other comprehensiveincome (loss) . . . . . . . . . . . . . . . . . . . . . . . . . . . . . . . . . . . . . . . . 136 30 18 180
Amortization reclassified to earnings . . . . . . . . . . . . . . . . . . . . . . . . . (25) (25) (55) (24)
Unrecognized net loss at end of fiscal year . . . . . . . . . . . . . . . . . . . . . . $436 $325 $711 $748
Change in prior service credit:Unrecognized prior service credit at beginning of fiscal year . . . . . . . . . $ — $ — $(67) $(68)
Current year change recorded in accumulated other comprehensiveincome (loss) . . . . . . . . . . . . . . . . . . . . . . . . . . . . . . . . . . . . . . . . — — (4) (4)
Amortization reclassified to earnings . . . . . . . . . . . . . . . . . . . . . . . . . — — 5 5
Unrecognized prior service credit at end of fiscal year . . . . . . . . . . . . . . $ — $ — $(66) $(67)
In fiscal 2015, unrecognized actuarial losses recorded in accumulated other comprehensive income(loss) for U.S. defined benefit pension plans are due primarily to a change in the mortality assumptionand lower than expected asset performance. Unrecognized actuarial losses recorded in accumulatedother comprehensive income (loss) for non-U.S. defined benefit pension plans in fiscal 2015 areprincipally the result of lower discount rates as compared to fiscal 2014. In fiscal 2014, unrecognizedactuarial losses recorded in accumulated other comprehensive income (loss) are primarily the result ofchanges in mortality assumptions and decreasing discount rates for U.S. defined benefit pension plansand attributable primarily to lower discount rates for non-U.S. defined benefit pension plans ascompared to fiscal 2013. Amortization of prior service credit is included in other in the above tablesummarizing the components of net periodic pension benefit cost.
The estimated amortization of actuarial losses from accumulated other comprehensive income(loss) into net periodic pension benefit cost for U.S. and non-U.S. defined benefit pension plans infiscal 2016 is expected to be $40 million and $36 million, respectively. The estimated amortization ofprior service credit from accumulated other comprehensive income (loss) into net periodic pensionbenefit cost for non-U.S. defined benefit pension plans in fiscal 2016 is expected to be $6 million.
In determining the expected return on plan assets, we consider the relative weighting of plan assetsby class and individual asset class performance expectations.
The investment strategy for the U.S. pension plans is governed by our investment committee;investment strategies for non-U.S. pension plans are governed locally. Our investment strategy for ourpension plans is to manage the plans on a going concern basis. Current investment policy is to achievea reasonable return on assets, subject to a prudent level of portfolio risk, for the purpose of enhancingthe security of benefits for participants. Projected returns are based primarily on pro forma asset
79

TE CONNECTIVITY LTD.
NOTES TO CONSOLIDATED FINANCIAL STATEMENTS (Continued)
15. Retirement Plans (Continued)
allocation, expected long-term returns, and forward-looking estimates of active portfolio and investmentmanagement.
The long-term target asset allocation in our U.S. plans’ master trust is 10% equity and 90% fixedincome. Asset re-allocation to meet that target is occurring over a multi-year period based on thefunded status, as defined by the Pension Protection Act of 2006 (the ‘‘Pension Act Funded Status’’), ofthe U.S. plans’ master trust and market conditions. We expect to reach our target allocation when thePension Act Funded Status exceeds 105%. Based on the Pension Act Funded Status as ofSeptember 25, 2015, our target asset allocation is 45% equity and 55% fixed income.
Target weighted-average asset allocation and weighted-average asset allocation for U.S. andnon-U.S. pension plans were as follows:
U.S. Plans Non-U.S. Plans
Fiscal Fiscal Fiscal FiscalYear End Year End Year End Year End
Target 2015 2014 Target 2015 2014
Asset category:Equity securities . . . . . . . . . . . . . . . . . . . . . . . 45% 45% 45% 45% 45% 45%Debt securities . . . . . . . . . . . . . . . . . . . . . . . . 55 55 55 29 29 30Insurance contracts and other investments . . . . — — — 24 24 23Real estate investments . . . . . . . . . . . . . . . . . . — — — 2 2 2
Total . . . . . . . . . . . . . . . . . . . . . . . . . . . . . . 100% 100% 100% 100% 100% 100%
Our common shares are not a direct investment of our pension funds; however, the pension fundsmay indirectly include our shares. The aggregate amount of our common shares would not beconsidered material relative to the total pension fund assets.
Our funding policy is to make contributions in accordance with the laws and customs of thevarious countries in which we operate as well as to make discretionary voluntary contributions fromtime to time. We expect to make the minimum required contributions of $5 million and $68 million toour U.S. and non-U.S. pension plans, respectively, in fiscal 2016. We may also make voluntarycontributions at our discretion.
Benefit payments, which reflect future expected service, as appropriate, are expected to be paid asfollows:
U.S. Plans Non-U.S. Plans
(in millions)
Fiscal 2016 . . . . . . . . . . . . . . . . . . . . . . . . . . . . . . . . . . . $ 71 $ 67Fiscal 2017 . . . . . . . . . . . . . . . . . . . . . . . . . . . . . . . . . . . 69 70Fiscal 2018 . . . . . . . . . . . . . . . . . . . . . . . . . . . . . . . . . . . 70 72Fiscal 2019 . . . . . . . . . . . . . . . . . . . . . . . . . . . . . . . . . . . 71 77Fiscal 2020 . . . . . . . . . . . . . . . . . . . . . . . . . . . . . . . . . . . 72 80Fiscal 2021-2025 . . . . . . . . . . . . . . . . . . . . . . . . . . . . . . . . 375 464
80

TE CONNECTIVITY LTD.
NOTES TO CONSOLIDATED FINANCIAL STATEMENTS (Continued)
15. Retirement Plans (Continued)
Set forth below is the accumulated benefit obligation for all U.S. and non-U.S. pension plans aswell as additional information related to plans with an accumulated benefit obligation in excess of planassets and plans with a projected benefit obligation in excess of plan assets.
U.S. Plans Non-U.S. Plans
Fiscal Year End Fiscal Year End
2015 2014 2015 2014
(in millions)
Accumulated benefit obligation . . . . . . . . . . . . . . . . . . . . . . . . . . . $1,170 $1,143 $2,041 $2,121Pension plans with accumulated benefit obligations in excess of
plan assets:Accumulated benefit obligation . . . . . . . . . . . . . . . . . . . . . . . . . 1,170 1,143 1,994 2,120Fair value of plan assets . . . . . . . . . . . . . . . . . . . . . . . . . . . . . . 879 978 1,119 1,177
Pension plans with projected benefit obligations in excess of planassets:Projected benefit obligation . . . . . . . . . . . . . . . . . . . . . . . . . . . . 1,170 1,143 2,188 2,276Fair value of plan assets . . . . . . . . . . . . . . . . . . . . . . . . . . . . . . 879 978 1,167 1,177
We value our pension assets based on the fair value hierarchy of ASC 820, Fair ValueMeasurements and Disclosures. Details of the fair value hierarchy are described in Note 2. The followingtable presents our defined benefit pension plans’ asset categories and their associated fair value withinthe fair value hierarchy:
Fiscal Year End 2015
U.S. Plans Non-U.S. Plans
Level 1 Level 2 Level 3 Total Level 1 Level 2 Level 3 Total
(in millions)
Equity:U.S. equity securities(1) . . . . . . . . . . . . . . $245 $ — $— $245 $ 60 $ — $— $ 60Non-U.S. equity securities(1) . . . . . . . . . . 149 — — 149 54 — — 54Commingled equity funds(2) . . . . . . . . . . — — — — — 421 — 421
Fixed income:Government bonds(3) . . . . . . . . . . . . . . . — 64 — 64 — 202 — 202Corporate bonds(4) . . . . . . . . . . . . . . . . . — 404 — 404 — 13 — 13Commingled bond funds(5) . . . . . . . . . . . — — — — — 171 — 171
Other(6) . . . . . . . . . . . . . . . . . . . . . . . . . . . — 3 — 3 — 142 84 226
Subtotal . . . . . . . . . . . . . . . . . . . . . . . . . . $394 $471 $— 865 $114 $949 $84 1,147
Items to reconcile to fair value of planassets(7) . . . . . . . . . . . . . . . . . . . . . . . 14 20
Fair value of plan assets . . . . . . . . . . . $879 $1,167
81

TE CONNECTIVITY LTD.
NOTES TO CONSOLIDATED FINANCIAL STATEMENTS (Continued)
15. Retirement Plans (Continued)
Fiscal Year End 2014
U.S. Plans Non-U.S. Plans
Level 1 Level 2 Level 3 Total Level 1 Level 2 Level 3 Total
(in millions)
Equity:U.S. equity securities(1) . . . . . . . . . . . . . . $210 $ — $— $210 $ 54 $ — $— $ 54Non-U.S. equity securities(1) . . . . . . . . . . 209 — — 209 65 — — 65Commingled equity funds(2) . . . . . . . . . . — — — — — 434 — 434
Fixed income:Government bonds(3) . . . . . . . . . . . . . . . — 87 — 87 — 211 — 211Corporate bonds(4) . . . . . . . . . . . . . . . . . — 445 — 445 — 19 — 19Commingled bond funds(5) . . . . . . . . . . . — — — — — 203 — 203
Other(6) . . . . . . . . . . . . . . . . . . . . . . . . . . . — 13 — 13 — 85 78 163
Subtotal . . . . . . . . . . . . . . . . . . . . . . . . . . $419 $545 $— 964 $119 $952 $78 1,149
Items to reconcile to fair value of planassets(7) . . . . . . . . . . . . . . . . . . . . . . . 14 28
Fair value of plan assets . . . . . . . . . . . $978 $1,177
(1) U.S. and non-U.S. equity securities are valued at the closing price reported on the stock exchange on which the individualsecurities are traded.
(2) Commingled equity funds are pooled investments in multiple equity-type securities. Fair value is calculated as the closingprice of the underlying investments, an observable market condition, divided by the number of shares of the fundoutstanding.
(3) Government bonds are marked to fair value based on quoted market prices or market approach valuation models usingobservable market data such as quotes, spreads, and data points for yield curves.
(4) Corporate bonds are marked to fair value based on quoted market prices or market approach valuation models usingobservable market data such as quotes, spreads, and data points for yield curves.
(5) Commingled bond funds are pooled investments in multiple debt-type securities. Fair value is calculated as the closing priceof the underlying investments, an observable market condition, divided by the number of shares of the fund outstanding.
(6) Other investments are composed of insurance contracts, derivatives, short-term investments, structured products such ascollateralized obligations and mortgage- and asset-backed securities, real estate investments, and hedge funds. Insurancecontracts are valued using cash surrender value, or face value of the contract if a cash surrender value is unavailable(level 2), as these values represent the amount that the plan would receive on termination of the underlying contract.Derivatives, short-term investments, and structured products are marked to fair value using models that are supported byobservable market based data (level 2). Real estate investments include investments in commingled real estate funds andare valued at net asset value which is calculated using unobservable inputs that are supported by little or no market activity(level 3). Hedge funds are valued at their net asset value which is calculated using unobservable inputs that are supportedby little or no market activity (level 3).
(7) Items to reconcile to fair value of plan assets include amounts receivable for securities sold, amounts payable for securitiespurchased, and any cash balances, considered to be carried at book value, that are held in the plans.
Changes in Level 3 assets in non-U.S. plans were primarily the result of purchases in fiscal 2015and positive returns in fiscal 2014.
82

TE CONNECTIVITY LTD.
NOTES TO CONSOLIDATED FINANCIAL STATEMENTS (Continued)
15. Retirement Plans (Continued)
Defined Contribution Retirement Plans
We maintain several defined contribution retirement plans, the most significant of which is locatedin the U.S. These plans include 401(k) matching programs, as well as qualified and nonqualified profitsharing and share bonus retirement plans. Expense for the defined contribution plans is computed as apercentage of participants’ compensation and was $60 million, $61 million, and $61 million for fiscal2015, 2014, and 2013, respectively.
Deferred Compensation Plans
We maintain nonqualified deferred compensation plans, which permit eligible employees to defer aportion of their compensation. A record keeping account is set up for each participant and theparticipant chooses from a variety of measurement funds for the deemed investment of their accounts.The measurement funds correspond to a number of funds in our 401(k) plans and the account balancefluctuates with the investment returns on those funds. Total deferred compensation liabilities were$118 million and $108 million at fiscal year end 2015 and 2014, respectively. See Note 14 for additionalinformation regarding our risk management strategy related to deferred compensation liabilities.
Postretirement Benefit Plans
In addition to providing pension and 401(k) benefits, we also provide certain health care coveragecontinuation for qualifying retirees from the date of retirement to age 65. The accumulatedpostretirement benefit obligation was $40 million and $44 million at fiscal year end 2015 and 2014,respectively, and the underfunded status of the postretirement benefit plans was included primarily inlong-term pension and postretirement liabilities on the Consolidated Balance Sheets. Activity duringfiscal 2015, 2014, and 2013 was not significant.
16. Income Taxes
Our operations are conducted through our various subsidiaries in a number of countriesthroughout the world. We have provided for income taxes based upon the tax laws and rates in thecountries in which our operations are conducted and income and loss from operations is subject totaxation.
83

TE CONNECTIVITY LTD.
NOTES TO CONSOLIDATED FINANCIAL STATEMENTS (Continued)
16. Income Taxes (Continued)
Significant components of the income tax provision (benefit) were as follows:
Fiscal
2015 2014 2013
(in millions)
Current income tax provision (benefit):U.S.:
Federal . . . . . . . . . . . . . . . . . . . . . . . . . . . . . . . . . . $ (67) $ 128 $ (296)State . . . . . . . . . . . . . . . . . . . . . . . . . . . . . . . . . . . . 12 (3) (85)
Non-U.S. . . . . . . . . . . . . . . . . . . . . . . . . . . . . . . . . . . 352 302 292
297 427 (89)
Deferred income tax provision (benefit):U.S.:
Federal . . . . . . . . . . . . . . . . . . . . . . . . . . . . . . . . . . 87 (311) 31State . . . . . . . . . . . . . . . . . . . . . . . . . . . . . . . . . . . . 5 (3) (4)
Non-U.S. . . . . . . . . . . . . . . . . . . . . . . . . . . . . . . . . . . (52) 33 (13)
40 (281) 14
Provision (benefit) for income taxes . . . . . . . . . . . . . . . . . $ 337 $ 146 $ (75)
The U.S. and non-U.S. components of income from continuing operations before income taxeswere as follows:
Fiscal
2015 2014 2013
(in millions)
U.S. . . . . . . . . . . . . . . . . . . . . . . . . . . . . . . . . . . . . . . . $ (31) $ (133) $ (354)Non-U.S. . . . . . . . . . . . . . . . . . . . . . . . . . . . . . . . . . . . . 1,606 1,893 1,434
Income from continuing operations before income taxes $1,575 $1,760 $1,080
84

TE CONNECTIVITY LTD.
NOTES TO CONSOLIDATED FINANCIAL STATEMENTS (Continued)
16. Income Taxes (Continued)
The reconciliation between U.S. federal income taxes at the statutory rate and provision (benefit)for income taxes on continuing operations was as follows:
Fiscal
2015 2014 2013
(in millions)
Notional U.S. federal income tax provision at the statutory rate . . . . . . . . . . . . $ 551 $ 616 $ 378Adjustments to reconcile to the income tax provision (benefit):
U.S. state income tax provision (benefit), net . . . . . . . . . . . . . . . . . . . . . . . 11 (4) (58)Other (income) expense—Tax Sharing Agreement . . . . . . . . . . . . . . . . . . . . 18 (23) 64Tax law changes . . . . . . . . . . . . . . . . . . . . . . . . . . . . . . . . . . . . . . . . . . . . . 10 (1) —Tax credits . . . . . . . . . . . . . . . . . . . . . . . . . . . . . . . . . . . . . . . . . . . . . . . . (9) (8) (10)Non-U.S. net earnings(1) . . . . . . . . . . . . . . . . . . . . . . . . . . . . . . . . . . . . . . . (275) (287) (256)Nondeductible charges . . . . . . . . . . . . . . . . . . . . . . . . . . . . . . . . . . . . . . . . 2 3 —Change in accrued income tax liabilities . . . . . . . . . . . . . . . . . . . . . . . . . . . (183) 112 (164)Valuation allowance . . . . . . . . . . . . . . . . . . . . . . . . . . . . . . . . . . . . . . . . . . (3) (239) (30)Legal entity restructuring . . . . . . . . . . . . . . . . . . . . . . . . . . . . . . . . . . . . . . 211 — —Other . . . . . . . . . . . . . . . . . . . . . . . . . . . . . . . . . . . . . . . . . . . . . . . . . . . . 4 (23) 1
Provision (benefit) for income taxes . . . . . . . . . . . . . . . . . . . . . . . . . . . . . . . . $ 337 $ 146 $ (75)
(1) Excludes nondeductible charges and other items which are broken out separately in the table.
The tax provision for fiscal 2015 reflects an income tax benefit of $264 million related to theeffective settlement of all undisputed tax matters for the years 2001 through 2010, partially offset by$216 million of income tax charges associated with the tax impacts of certain intercompany legal entityrestructurings made in connection with our integration of Measurement Specialties. Also, the taxprovision for fiscal 2015 reflects an income tax charge of $29 million associated with the tax impacts ofcertain intercompany dividends related to the restructuring and sale of BNS.
The tax provision for fiscal 2014 reflects income tax benefits of $282 million recognized inconnection with a reduction in the valuation allowance associated with certain tax loss carryforwardsrelating to ADC Telecommunications, Inc. (‘‘ADC’’), partially offset by an income tax charge related toadjustments to prior year income tax returns.
In fiscal 2014, we acquired SEACON, and its U.S. operations were combined with our ADC U.S.federal consolidated tax group. In addition, the ADC U.S. tax group was combined with other U.S.legal entities and assets. We reassessed the realization of the revised ADC U.S. tax group’s tax loss andcredit carryforwards. Based upon management’s review of forecasted future taxable income of thereorganized combined tax group, we believed it was more likely than not that a tax benefit would berealized on additional U.S. federal and state net operating losses. Accordingly, we reduced thevaluation allowance and recorded a tax benefit of $282 million.
The tax benefit for fiscal 2013 reflects an income tax benefit of $331 million related to theeffective settlement of all undisputed tax matters for the years 1997 through 2000. In addition, the taxbenefit for fiscal 2013 reflects $23 million of net tax benefits consisting primarily of income tax benefitsrecognized in connection with a reduction in the valuation allowance associated with certain ADC taxloss carryforwards and income tax benefits recognized in connection with the lapse of statutes of
85

TE CONNECTIVITY LTD.
NOTES TO CONSOLIDATED FINANCIAL STATEMENTS (Continued)
16. Income Taxes (Continued)
limitations for examinations of prior year income tax returns, partially offset by income tax expenserelated to adjustments to prior year income tax returns.
Deferred income taxes result from temporary differences between the amount of assets andliabilities recognized for financial reporting and tax purposes. The components of the net deferredincome tax asset were as follows:
Fiscal Year End
2015 2014
(in millions)
Deferred tax assets:Accrued liabilities and reserves . . . . . . . . . . . . . . . . . . . . . . . . $ 262 $ 262Tax loss and credit carryforwards . . . . . . . . . . . . . . . . . . . . . . 4,856 3,356Inventories . . . . . . . . . . . . . . . . . . . . . . . . . . . . . . . . . . . . . . 57 52Pension and postretirement benefits . . . . . . . . . . . . . . . . . . . . 295 282Deferred revenue . . . . . . . . . . . . . . . . . . . . . . . . . . . . . . . . . . 17 12Interest . . . . . . . . . . . . . . . . . . . . . . . . . . . . . . . . . . . . . . . . . 394 358Unrecognized income tax benefits . . . . . . . . . . . . . . . . . . . . . . 378 391Other . . . . . . . . . . . . . . . . . . . . . . . . . . . . . . . . . . . . . . . . . . 4 27
6,263 4,740
Deferred tax liabilities:Intangible assets . . . . . . . . . . . . . . . . . . . . . . . . . . . . . . . . . . (809) (835)Property, plant, and equipment . . . . . . . . . . . . . . . . . . . . . . . . (1) (10)Other . . . . . . . . . . . . . . . . . . . . . . . . . . . . . . . . . . . . . . . . . . (89) (73)
(899) (918)
Net deferred tax asset before valuation allowance . . . . . . . . . . . . 5,364 3,822Valuation allowance . . . . . . . . . . . . . . . . . . . . . . . . . . . . . . . . . (3,237) (1,706)
Net deferred tax asset . . . . . . . . . . . . . . . . . . . . . . . . . . . . . . $ 2,127 $ 2,116
During fiscal 2015, tax loss and credit carryforwards increased due primarily to tax losses of$1,381 million (tax effected) generated in connection with the write-down of investments in subsidiariesin certain jurisdictions. The valuation allowance was increased by a corresponding amount due to theuncertainty of the future realization of these tax losses.
At fiscal year end 2015, we had approximately $1,363 million of U.S. federal and $125 million ofU.S. state net operating loss carryforwards (tax effected) which will expire in future years through 2035.In addition, at fiscal year end 2015, we had approximately $194 million of U.S. federal tax creditcarryforwards, of which $63 million have no expiration and $131 million will expire in future yearsthrough 2035, and $40 million of U.S. state tax credits carryforwards which will expire in future yearsthrough 2030. Also, at fiscal year end 2015, we had were $20 million of U.S federal capital losscarryforwards (tax effected) which will expire in future years through 2020.
At fiscal year end 2015, we had approximately $3,068 million of net operating loss carryforwards(tax effected) in certain non-U.S. jurisdictions, of which $3,005 million have no expiration and$63 million will expire in future years through 2035. Also, at fiscal year end 2015, there were $1 million
86

TE CONNECTIVITY LTD.
NOTES TO CONSOLIDATED FINANCIAL STATEMENTS (Continued)
16. Income Taxes (Continued)
of non-U.S. tax credit carryforwards which have no expiration. In addition, we had approximately$45 million of non-U.S. capital loss carryforwards (tax effected), of which $38 million have noexpiration and $7 million will expire in future years through 2020.
The valuation allowance for deferred tax assets of $3,237 million and $1,706 million at fiscal yearend 2015 and 2014, respectively, relates principally to the uncertainty of the utilization of certaindeferred tax assets, primarily tax loss, capital loss, and credit carryforwards in various jurisdictions. Webelieve that we will generate sufficient future taxable income to realize the income tax benefits relatedto the remaining net deferred tax assets on the Consolidated Balance Sheet. At fiscal year end 2015,approximately $151 million of the valuation allowance relates to share-based compensation and will berecorded to equity if certain net operating losses and tax credit carryforwards are utilized.
We have provided income taxes for earnings that are currently distributed as well as the taxesassociated with several subsidiaries’ earnings that are expected to be distributed in the future. Noadditional provision has been made for Swiss or non-Swiss income taxes on the undistributed earningsof subsidiaries or for unrecognized deferred tax liabilities for temporary differences related to basisdifferences in investments in subsidiaries, as such earnings are expected to be permanently reinvested,the investments are essentially permanent in duration, or we have concluded that no additional taxliability will arise as a result of the distribution of such earnings. As of September 25, 2015, certainsubsidiaries had approximately $19 billion of cumulative undistributed earnings that have been retainedindefinitely and reinvested in our global manufacturing operations, including working capital; property,plant, and equipment; intangible assets; and research and development activities. A liability could ariseif our intention to permanently reinvest such earnings were to change and amounts are distributed bysuch subsidiaries or if such subsidiaries are ultimately disposed. It is not practicable to estimate theadditional income taxes related to permanently reinvested earnings or the basis differences related toinvestments in subsidiaries. As of September 25, 2015, we had approximately $5.2 billion of cash, cashequivalents, and intercompany deposits, principally in our subsidiaries, that we have the ability todistribute to TEGSA, our Luxembourg subsidiary, which is the obligor of substantially all of our debt,and to TE Connectivity Ltd., our Swiss parent company, but we consider to be permanently reinvested.We estimate that up to approximately $1.7 billion of tax expense would be recognized on theConsolidated Financial Statements if our intention to permanently reinvest these amounts were tochange. Our current plans do not demonstrate a need to repatriate cash, cash equivalents, andintercompany deposits that are designated as permanently reinvested in order to fund our operations,including investing and financing activities.
Uncertain Tax Position Provisions of ASC 740
As of September 25, 2015, we had total unrecognized income tax benefits of $1,368 million. Ifrecognized in future years, $1,291 million of these currently unrecognized income tax benefits wouldimpact the income tax provision and effective tax rate. As of September 26, 2014, we had totalunrecognized income tax benefits of $1,595 million. If recognized in future years, $1,450 million of
87

TE CONNECTIVITY LTD.
NOTES TO CONSOLIDATED FINANCIAL STATEMENTS (Continued)
16. Income Taxes (Continued)
these unrecognized income tax benefits would impact the income tax provision and effective tax rate.The following table summarizes the activity related to unrecognized income tax benefits:
Fiscal
2015 2014 2013
(in millions)
Balance at beginning of fiscal year . . . . . . . . . . . . . . . . . . $1,595 $1,617 $1,794Additions related to prior periods tax positions . . . . . . . 24 22 88Reductions related to prior periods tax positions . . . . . . (291) (57) (271)Additions related to current period tax positions . . . . . . 97 32 87Acquisitions . . . . . . . . . . . . . . . . . . . . . . . . . . . . . . . . — 7 —Settlements . . . . . . . . . . . . . . . . . . . . . . . . . . . . . . . . . (29) (14) (8)Reductions due to lapse of applicable statute of
limitations . . . . . . . . . . . . . . . . . . . . . . . . . . . . . . . . (28) (12) (73)
Balance at end of fiscal year . . . . . . . . . . . . . . . . . . . . . . $1,368 $1,595 $1,617
We record accrued interest as well as penalties related to uncertain tax positions as part of theprovision for income taxes. As of September 25, 2015, we had recorded $1,076 million of accruedinterest and penalties related to uncertain tax positions on the Consolidated Balance Sheet, of which$1,073 million was recorded in income taxes and the remainder was recorded in accrued and othercurrent liabilities. As of September 26, 2014, the balance of accrued interest and penalties was$1,136 million, of which $1,115 million was recorded in income taxes and the remainder was recordedin accrued and other current liabilities. During fiscal 2015, 2014, and 2013, we recognized expense of$7 million, expense of $99 million, and benefits of $247 million, respectively, related to interest andpenalties on the Consolidated Statements of Operations.
We file income tax returns on a unitary, consolidated, or stand-alone basis in multiple state andlocal jurisdictions, which generally have statutes of limitations ranging from 3 to 4 years. Various stateand local income tax returns are currently in the process of examination or administrative appeal.
Our non-U.S. subsidiaries file income tax returns in the countries in which they have operations.Generally, these countries have statutes of limitations ranging from 3 to 10 years. Various non-U.S.subsidiary income tax returns are currently in the process of examination by taxing authorities.
88

TE CONNECTIVITY LTD.
NOTES TO CONSOLIDATED FINANCIAL STATEMENTS (Continued)
16. Income Taxes (Continued)
As of September 25, 2015, under applicable statutes, the following tax years remained subject toexamination in the major tax jurisdictions indicated:
Jurisdiction Open Years
Belgium . . . . . . . . . . . . . . . . . . . . . . . . . . . . . . . . . . . . . . . . . 2014 through 2015Brazil . . . . . . . . . . . . . . . . . . . . . . . . . . . . . . . . . . . . . . . . . . . 2010 through 2015Canada . . . . . . . . . . . . . . . . . . . . . . . . . . . . . . . . . . . . . . . . . . 2008 through 2015China . . . . . . . . . . . . . . . . . . . . . . . . . . . . . . . . . . . . . . . . . . . 2005 through 2015Czech Republic . . . . . . . . . . . . . . . . . . . . . . . . . . . . . . . . . . . . 2010 through 2015France . . . . . . . . . . . . . . . . . . . . . . . . . . . . . . . . . . . . . . . . . . 2012 through 2015Germany . . . . . . . . . . . . . . . . . . . . . . . . . . . . . . . . . . . . . . . . 2008 through 2015Hong Kong . . . . . . . . . . . . . . . . . . . . . . . . . . . . . . . . . . . . . . . 2009 through 2015Hungary . . . . . . . . . . . . . . . . . . . . . . . . . . . . . . . . . . . . . . . . . 2009 through 2015India . . . . . . . . . . . . . . . . . . . . . . . . . . . . . . . . . . . . . . . . . . . 2008 through 2015Italy . . . . . . . . . . . . . . . . . . . . . . . . . . . . . . . . . . . . . . . . . . . . 2009 through 2015Japan . . . . . . . . . . . . . . . . . . . . . . . . . . . . . . . . . . . . . . . . . . . 2009 through 2015Korea . . . . . . . . . . . . . . . . . . . . . . . . . . . . . . . . . . . . . . . . . . . 2007 through 2015Luxembourg . . . . . . . . . . . . . . . . . . . . . . . . . . . . . . . . . . . . . . 2010 through 2015Mexico . . . . . . . . . . . . . . . . . . . . . . . . . . . . . . . . . . . . . . . . . . 2009 through 2015Netherlands . . . . . . . . . . . . . . . . . . . . . . . . . . . . . . . . . . . . . . 2011 through 2015Portugal . . . . . . . . . . . . . . . . . . . . . . . . . . . . . . . . . . . . . . . . . 2012 through 2015Singapore . . . . . . . . . . . . . . . . . . . . . . . . . . . . . . . . . . . . . . . . 2010 through 2015Spain . . . . . . . . . . . . . . . . . . . . . . . . . . . . . . . . . . . . . . . . . . . 2011 through 2015Switzerland . . . . . . . . . . . . . . . . . . . . . . . . . . . . . . . . . . . . . . . 2010 through 2015United Kingdom . . . . . . . . . . . . . . . . . . . . . . . . . . . . . . . . . . . 2013 through 2015U.S.—federal and state and local . . . . . . . . . . . . . . . . . . . . . . . 1997 through 2015
In most jurisdictions, taxing authorities retain the ability to review prior tax years and to adjust anynet operating loss and tax credit carryforwards from these years that are utilized in a subsequentperiod.
Although it is difficult to predict the timing or results of our worldwide examinations, we estimatethat up to approximately $60 million of unrecognized income tax benefits, excluding the impact relatingto accrued interest and penalties, could be resolved within the next twelve months. See Note 13 foradditional information regarding the status of IRS examinations.
We are not aware of any other matters that would result in significant changes to the amount ofunrecognized income tax benefits reflected on the Consolidated Balance Sheet as of September 25,2015.
17. Other Income (Expense), Net
In fiscal 2015, 2014, and 2013, we recorded net other expense of $55 million, net other income of$63 million, and net other expense of $183 million, respectively, primarily pursuant to the Tax SharingAgreement with Tyco International and Covidien. See Note 12 for further information regarding theTax Sharing Agreement. The net other expense in fiscal 2015 included $84 million related to theeffective settlement of undisputed tax matters for the years 2001 through 2007. The net other income in
89

TE CONNECTIVITY LTD.
NOTES TO CONSOLIDATED FINANCIAL STATEMENTS (Continued)
17. Other Income (Expense), Net (Continued)
fiscal 2014 included $18 million of income related to our share of a settlement agreement entered intoby Tyco International with a former subsidiary, CIT Group Inc., which arose from a pre-separationclaim for which we were entitled to 31% once resolved. The net other expense in fiscal 2013 included$231 million related to the effective settlement of all undisputed tax matters for the years 1997 through2000. See Note 13 for additional information regarding the effective settlement of undisputed taxmatters.
18. Earnings Per Share
The weighted-average number of shares outstanding used in the computation of basic and dilutedearnings per share was as follows:
Fiscal
2015 2014 2013
(in millions)
Basic . . . . . . . . . . . . . . . . . . . . . . . . . . . . . . . . . . . . . . . . . . . . . 405 410 418Dilutive impact of share-based compensation arrangements . . . . 6 7 5
Diluted . . . . . . . . . . . . . . . . . . . . . . . . . . . . . . . . . . . . . . . . . . . 411 417 423
There were one million and three million share options that were not included in the computationof diluted earnings per share for fiscal 2015 and 2013, respectively, because the instruments’ underlyingexercise prices were greater than the average market prices of our common shares and inclusion wouldbe antidilutive.
19. Equity
Common Shares
We are organized under the laws of Switzerland. The rights of holders of our shares are governedby Swiss law, our Swiss articles of association, and our Swiss organizational regulations. Accordingly,the par value of our common shares is stated in Swiss francs (‘‘CHF’’). We continue to use the U.S.dollar, however, as our reporting currency on the Consolidated Financial Statements.
Subject to certain conditions specified in our articles of association, we are authorized to increaseour conditional share capital by issuing new shares in aggregate not exceeding 50% of our authorizedshares.
Common Shares Held in Treasury
At September 25, 2015, approximately 20 million common shares were held in treasury, of which6 million were owned by one of our subsidiaries. At September 26, 2014, approximately 11 millioncommon shares were held in treasury, of which 9 million were owned by one of our subsidiaries. Sharesheld both directly by us and by our subsidiary are presented as treasury shares on the ConsolidatedBalance Sheets.
In fiscal 2015, 2014, and 2013, our shareholders approved the cancellation of five million, tenmillion, and ten million shares, respectively, purchased under our share repurchase program. Thesecapital reductions by cancellation of shares were subject to a notice period and filing with thecommercial register in Switzerland.
90

TE CONNECTIVITY LTD.
NOTES TO CONSOLIDATED FINANCIAL STATEMENTS (Continued)
19. Equity (Continued)
Contributed Surplus
Contributed surplus established for Swiss tax and statutory purposes (‘‘Swiss Contributed Surplus’’),subject to certain conditions, is a freely distributable reserve. Distributions to shareholders from SwissContributed Surplus are free from withholding tax. As of September 25, 2015 and September 26, 2014,Swiss Contributed Surplus was CHF 8,392 million and CHF 8,907 million, respectively (equivalent to$7,505 million and $8,036 million, respectively).
Dividends and Distributions to Shareholders
Under Swiss law, subject to certain conditions, distributions to shareholders made in the form of areduction of registered share capital or from reserves from capital contributions (equivalent to SwissContributed Surplus) are exempt from Swiss withholding tax. See ‘‘Contributed Surplus’’ for additionalinformation regarding our ability to make distributions free from withholding tax from contributedsurplus. Distributions or dividends on our shares must be approved by our shareholders.
Our shareholders approved the following dividends and cash distributions on our common shares:
Approval Date Payment Type Annual Payment Per Share Payment Dates
March 2012 . . . . Cash CHF 0.80 (equivalent to $0.84), Third quarter of fiscal 2012distribution(1) payable in four quarterly Fourth quarter of fiscal 2012
installments of $0.21 First quarter of fiscal 2013Second quarter of fiscal 2013
March 2013 . . . . Dividend CHF 0.96 (equivalent to $1.00), Third quarter of fiscal 2013payment out of payable in four quarterly Fourth quarter of fiscal 2013
contributed installments of $0.25 First quarter of fiscal 2014surplus Second quarter of fiscal 2014
March 2014 . . . . Dividend CHF 1.04 (equivalent to $1.16), Third quarter of fiscal 2014payment out of payable in four quarterly Fourth quarter of fiscal 2014
contributed installments of $0.29 First quarter of fiscal 2015surplus Second quarter of fiscal 2015
March 2015 . . . . Dividend $1.32 (equivalent to CHF 1.27), Third quarter of fiscal 2015payment out of payable in four quarterly Fourth quarter of fiscal 2015
contributed installments of $0.33 First quarter of fiscal 2016surplus Second quarter of fiscal 2016
(1) The cash distribution in the form of a capital reduction reduced the par value of our common shares from CHF 1.37(equivalent to $1.28) to CHF 0.57 (equivalent to $0.44).
Upon approval by the shareholders of a dividend payment or cash distribution in the form of acapital reduction, we record a liability with a corresponding charge to contributed surplus or commonshares. At September 25, 2015 and September 26, 2014, the unpaid portion of the dividends recordedin accrued and other current liabilities on the Consolidated Balance Sheets totaled $260 million and$236 million, respectively.
91

TE CONNECTIVITY LTD.
NOTES TO CONSOLIDATED FINANCIAL STATEMENTS (Continued)
19. Equity (Continued)
Share Repurchase Program
During fiscal 2015, our board of directors authorized an increase of $3.0 billion in the sharerepurchase program. Common shares repurchased under the share repurchase program were as follows:
Fiscal
2015 2014 2013
(in millions)
Number of common shares repurchased . . . . . . . . . . . . . . . . 18 11 20Amount repurchased . . . . . . . . . . . . . . . . . . . . . . . . . . . . . . $1,163 $604 $829
At September 25, 2015, we had $2.7 billion of availability remaining under our share repurchaseauthorization.
20. Accumulated Other Comprehensive Income (Loss)
The changes in each component of accumulated other comprehensive income (loss) were asfollows:
Unrecognized Gains (Losses) AccumulatedPension and on Cash Other
Currency Postretirement Flow ComprehensiveTranslation(1) Benefit Costs Hedges Income (Loss)
(in millions)
Balance at September 28, 2012 . . . . . . . . . . . $ 959 $(700) $(30) $ 229Net other comprehensive income (loss) . . . . (28) 204 (36) 140Income tax (expense) benefit . . . . . . . . . . . — (73) 7 (66)
Net other comprehensive income (loss),net of tax . . . . . . . . . . . . . . . . . . . . . . (28) 131 (29) 74
Balance at September 27, 2013 . . . . . . . . . . . 931 (569) (59) 303Other comprehensive loss before
reclassifications . . . . . . . . . . . . . . . . . . . (216) (211) (35) (462)Amounts reclassified from accumulated
other comprehensive income (loss) . . . . . 5 44 49 98Income tax benefit . . . . . . . . . . . . . . . . . . . — 44 — 44
Net other comprehensive income (loss),net of tax . . . . . . . . . . . . . . . . . . . . . . (211) (123) 14 (320)
Balance at September 26, 2014 . . . . . . . . . . . 720 (692) (45) (17)Other comprehensive loss before
reclassifications . . . . . . . . . . . . . . . . . . . (536) (147) (44) (727)Amounts reclassified from accumulated
other comprehensive income (loss) . . . . . 224(2) 75 45 344Income tax benefit . . . . . . . . . . . . . . . . . . . — 26 1 27
Net other comprehensive income (loss),net of tax . . . . . . . . . . . . . . . . . . . . . . (312) (46) 2 (356)
Balance at September 25, 2015 . . . . . . . . . . . $ 408 $(738) $(43) $(373)
(1) Includes hedges of net investment foreign exchange gains or losses which offset foreign exchange gains or losses attributableto the translation of the net investments.
92

TE CONNECTIVITY LTD.
NOTES TO CONSOLIDATED FINANCIAL STATEMENTS (Continued)
20. Accumulated Other Comprehensive Income (Loss) (Continued)
(2) Represents net currency translation reclassified as a result of the sale of BNS. This net loss is included in income fromdiscontinued operations on the Consolidated Statement of Operations. See Note 4 for additional information regarding thedivestiture of BNS.
21. Share Plans
Equity awards (primarily restricted share awards, performance share awards, and share options)granted by us are administered by the management development and compensation committee of ourboard of directors, which consists exclusively of independent directors. Our plans, of which the TEConnectivity Ltd. 2007 Stock and Incentive Plan, as amended and restated, is the primary plan, providefor the award of annual performance bonuses and long-term performance awards, including shareoptions, restricted and performance units, deferred stock units, and other share-based awards(collectively, ‘‘Awards’’) and allow for the use of unissued shares or treasury shares to be used to satisfysuch Awards. As of September 25, 2015, our plans provided for a maximum of 67 million shares to beissued as Awards, subject to adjustment as provided under the terms of the plans. A total of 19 millionshares remained available for issuance under our plans as of September 25, 2015.
Share-Based Compensation Expense
Total share-based compensation expense, which was included primarily in selling, general, andadministrative expenses on the Consolidated Statements of Operations, was as follows:
Fiscal
2015 2014 2013
(in millions)
Share-based compensation expense . . . . . . . . . . . . . . . . . . . . . . . $89 $77 $71
We recognized a related tax benefit associated with our share-based compensation arrangements of$29 million, $24 million, and $22 million in fiscal 2015, 2014, and 2013, respectively.
Restricted Share Awards
Restricted share awards, which are generally in the form of restricted share units, are grantedsubject to certain restrictions. Conditions of vesting are determined at the time of grant. All restrictionson an award will lapse upon death or disability of the employee. If the employee satisfies retirementrequirements, a portion of the award may vest, depending on the terms and conditions of the particulargrant. Recipients of restricted units have no voting rights, but do receive dividend equivalents. Forgrants that vest through passage of time, the fair value of the award at the time of the grant isamortized to expense over the period of vesting. The fair value of restricted share awards is determinedbased on the closing value of our shares on the grant date. Restricted share awards generally vest inincrements over a period of four years as determined by the management development andcompensation committee.
93

TE CONNECTIVITY LTD.
NOTES TO CONSOLIDATED FINANCIAL STATEMENTS (Continued)
21. Share Plans (Continued)
A summary of restricted share award activity is presented below:
Weighted-AverageGrant-Date
Shares Fair Value
Nonvested at September 26, 2014 . . . . . . . . . . . . . . . . 3,397,828 $40.79Granted . . . . . . . . . . . . . . . . . . . . . . . . . . . . . . . . . 1,359,144 62.45Vested . . . . . . . . . . . . . . . . . . . . . . . . . . . . . . . . . . (1,485,763) 38.80Forfeited . . . . . . . . . . . . . . . . . . . . . . . . . . . . . . . . . (480,275) 48.43
Nonvested at September 25, 2015 . . . . . . . . . . . . . . . . 2,790,934 $51.01
The weighted-average grant-date fair value of restricted share awards granted during fiscal 2015,2014, and 2013 was $62.45, $52.21, and $34.69, respectively.
The total fair value of restricted share awards that vested during fiscal 2015, 2014, and 2013 was$58 million, $52 million, and $51 million, respectively.
As of September 25, 2015, there was $87 million of unrecognized compensation cost related tononvested restricted share awards. The cost is expected to be recognized over a weighted-averageperiod of 1.6 years.
Performance Share Awards
Performance share awards, which are generally in the form of performance share units, are grantedwith pay-out subject to vesting requirements and certain performance conditions that are determined atthe time of grant. Based on our performance, the pay-out of performance share units can range from0% to 200% of the number of units originally granted. The grant-date fair value of performance shareawards is expensed over the period of performance once achievement of the performance criteria isdeemed probable. Recipients of performance share units have no voting rights but do receive dividendequivalents. Performance share awards generally vest after a period of three years as determined by themanagement development and compensation committee.
A summary of performance share award activity is presented below:
Weighted-AverageGrant-Date
Shares Fair Value
Outstanding at September 26, 2014 . . . . . . . . . . . . . . . . . 510,488 $41.53Granted . . . . . . . . . . . . . . . . . . . . . . . . . . . . . . . . . . . 220,272 61.65Vested . . . . . . . . . . . . . . . . . . . . . . . . . . . . . . . . . . . . (1,285) 34.05Forfeited . . . . . . . . . . . . . . . . . . . . . . . . . . . . . . . . . . . (28,647) 42.63
Outstanding at September 25, 2015 . . . . . . . . . . . . . . . . . 700,828 $47.32
The weighted-average grant-date fair value of performance share awards granted during fiscal2015, 2014, and 2013 was $61.65, $51.63, and $34.16, respectively.
As of September 25, 2015, there was $15 million of unrecognized compensation cost related tononvested performance share awards. The cost is expected to be recognized over a weighted-averageperiod of 1.0 years.
94

TE CONNECTIVITY LTD.
NOTES TO CONSOLIDATED FINANCIAL STATEMENTS (Continued)
21. Share Plans (Continued)
Share Options
Share options are granted to purchase our common shares at prices which are equal to or greaterthan the market price of the common shares on the date the option is granted. Conditions of vestingare determined at the time of grant. All restrictions on the award will lapse upon death or disability ofthe employee. If the employee satisfies retirement requirements, a portion of the award may vest,depending on the terms and conditions of the particular grant. Options generally vest and becomeexercisable in equal annual installments over a period of four years and expire ten years after the dateof grant.
A summary of share option award activity is presented below:
Weighted-AverageWeighted-Average Remaining Aggregate
Exercise Contractual IntrinsicShares Price Term Value
(in years) (in millions)
Outstanding at September 26, 2014 . . . . . . . 11,948,584 $35.41Granted . . . . . . . . . . . . . . . . . . . . . . . . . 1,735,750 61.70Exercised . . . . . . . . . . . . . . . . . . . . . . . . (3,072,275) 32.84Expired . . . . . . . . . . . . . . . . . . . . . . . . . (91,021) 52.93Forfeited . . . . . . . . . . . . . . . . . . . . . . . . (396,163) 46.10
Outstanding at September 25, 2015 . . . . . . . 10,124,875 $40.05 6.0 $192
Vested and expected to vest atSeptember 25, 2015 . . . . . . . . . . . . . . . . . 9,822,310 $39.79 6.0 $188
Exercisable at September 25, 2015 . . . . . . . 5,758,402 $33.71 4.6 $142
The weighted-average exercise price of share option awards granted during fiscal 2015, 2014, and2013 were $61.70, $51.78, and $34.27, respectively.
The total intrinsic value of options exercised during fiscal 2015, 2014, and 2013 was $107 million,$136 million, and $69 million, respectively. We received cash related to the exercise of options of$103 million, $156 million, and $214 million in fiscal 2015, 2014, and 2013, respectively. The relatedexcess cash tax benefit classified as a financing cash inflow on the Consolidated Statements of CashFlows for fiscal 2015, 2014, and 2013 was not material.
As of September 25, 2015, there was $39 million of unrecognized compensation cost related tononvested share options granted under our share option plans. The cost is expected to be recognizedover a weighted-average period of 1.4 years.
Share-Based Compensation Assumptions
The grant-date fair value of each share option grant was estimated using the Black-Scholes-Mertonoption pricing model. Use of a valuation model requires management to make certain assumptions withrespect to selected model inputs. We employ our historical share volatility when calculating thegrant-date fair value of our share option grants using the Black-Scholes-Merton option pricing model.Currently, we do not have exchange-traded options of sufficient duration to employ an implied volatilityassumption in the calculation and therefore rely solely on the historical volatility calculation. For fiscal2013, we calculated the grant-date fair value of our share option awards utilizing the historical sharevolatility of a composite of our peers and implied volatility derived from exchange-traded options on
95

TE CONNECTIVITY LTD.
NOTES TO CONSOLIDATED FINANCIAL STATEMENTS (Continued)
21. Share Plans (Continued)
that same composite of peers since we did not have historical share price information for a period oftime equal to our expected option life assumption. The change in methodology did not have asignificant impact on share-based compensation expense during fiscal 2015 or 2014. The averageexpected life was based on the contractual term of the option and expected employee exercise andpost-vesting employment termination behavior. The risk-free interest rate was based on U.S. Treasuryzero-coupon issues with a remaining term that approximated the expected life assumed at the date ofgrant. The expected annual dividend per share was based on our expected dividend rate. Therecognized share-based compensation expense was net of estimated forfeitures, which are based onvoluntary termination behavior as well as an analysis of actual option forfeitures.
The weighted-average grant-date fair value of options granted and the weighted-averageassumptions we used in the Black-Scholes-Merton option pricing model were as follows:
Fiscal
2015 2014 2013
Weighted-average grant-date fair value . . . . . . . . . . . . . . . $18.77 $16.81 $8.62
Assumptions:Expected share price volatility . . . . . . . . . . . . . . . . . . . . . . 36% 39% 34%Risk free interest rate . . . . . . . . . . . . . . . . . . . . . . . . . . . . 2.0% 1.8% 0.9%Expected annual dividend per share . . . . . . . . . . . . . . . . . $ 1.16 $ 1.00 $0.84Expected life of options (in years) . . . . . . . . . . . . . . . . . . . 6.0 6.0 6.0
22. Segment and Geographic Data
During fiscal 2015, we reorganized our management structure and segments to better align theorganization around our strategy. Our businesses in the former Consumer Solutions segment and ourcontinuing businesses in the former Network Solutions segment have been moved into the newlycreated Communications Solutions segment. (See Note 4 for information regarding discontinuedoperations.) In addition, the former Data Communications and Consumer Devices businesses havebeen combined to form the Data and Devices business. We now operate through three reportablesegments: Transportation Solutions, Industrial Solutions, and Communications Solutions. See Note 1 fora description of the segments in which we operate. We aggregate our operating segments intoreportable segments based upon similar economic characteristics and business groupings of products,services, and customers.
Segment performance is evaluated based on net sales and operating income. Generally, weconsider all expenses to be of an operating nature and, accordingly, allocate them to each reportablesegment. Costs specific to a segment are charged to the segment. Corporate expenses, such asheadquarters administrative costs, are allocated to the segments based on segment operating income.Intersegment sales were not material and were recorded at selling prices that approximate marketprices. Corporate assets are allocated to the segments based on segment assets.
96

TE CONNECTIVITY LTD.
NOTES TO CONSOLIDATED FINANCIAL STATEMENTS (Continued)
22. Segment and Geographic Data (Continued)
The following segment information reflects our current segment reporting structure. Prior periodsegment results have been restated to conform to the current segment reporting structure.
Net sales and operating income by segment were as follows:
Net Sales Operating Income
Fiscal Fiscal
2015 2014 2013 2015 2014 2013
(in millions)
Transportation Solutions . . . . . . . . . . . . . . . . $ 6,351 $ 6,090 $ 5,485 $1,193 $1,245 $ 934Industrial Solutions . . . . . . . . . . . . . . . . . . . . 3,179 3,302 3,100 352 431 344Communications Solutions . . . . . . . . . . . . . . 2,703 2,581 2,805 204 129 107
Total . . . . . . . . . . . . . . . . . . . . . . . . . . . . . $12,233 $11,973 $11,390 $1,749 $1,805 $1,385
No single customer accounted for a significant amount of our net sales in fiscal 2015, 2014, and2013.
As we are not organized by product or service, it is not practicable to disclose net sales by productor service.
Depreciation and amortization and capital expenditures were as follows:
Depreciation andAmortization Capital Expenditures
Fiscal Fiscal
2015 2014 2013 2015 2014 2013
(in millions)
Transportation Solutions . . . . . . . . . . . . . . . . . . . . . . . . . . $347 $285 $294 $400 $379 $325Industrial Solutions . . . . . . . . . . . . . . . . . . . . . . . . . . . . . . 123 102 92 104 143 111Communications Solutions . . . . . . . . . . . . . . . . . . . . . . . . 146 164 150 96 113 145
Total . . . . . . . . . . . . . . . . . . . . . . . . . . . . . . . . . . . . . . . $616 $551 $536 $600 $635 $581
97

TE CONNECTIVITY LTD.
NOTES TO CONSOLIDATED FINANCIAL STATEMENTS (Continued)
22. Segment and Geographic Data (Continued)
Segment assets and a reconciliation of segment assets to total assets were as follows:
Segment Assets
Fiscal Year End
2015 2014 2013
(in millions)
Transportation Solutions . . . . . . . . . . . . . . . . . . . . . . $ 3,310 $ 3,062 $ 2,983Industrial Solutions . . . . . . . . . . . . . . . . . . . . . . . . . . 1,720 1,735 1,640Communications Solutions . . . . . . . . . . . . . . . . . . . . . 1,625 1,689 1,764
Total segment assets(1) . . . . . . . . . . . . . . . . . . . . . . 6,655 6,486 6,387Other current assets . . . . . . . . . . . . . . . . . . . . . . . . . 4,152 5,313 4,243Other non-current assets . . . . . . . . . . . . . . . . . . . . . . 9,801 8,353 7,831
Total assets . . . . . . . . . . . . . . . . . . . . . . . . . . . . . . $20,608 $20,152 $18,461
(1) Segment assets are composed of accounts receivable, inventories, and property, plant, and equipment.
Net sales and net property, plant, and equipment by geographic region were as follows:
Property, Plant, andNet Sales(1) Equipment, Net
Fiscal Fiscal Year End
2015 2014 2013 2015 2014 2013
(in millions)
Americas:U.S. . . . . . . . . . . . . . . . . . . . . . . . . . . . . . $ 3,817 $ 3,119 $ 3,042 $ 887 $ 837 $ 867Other Americas . . . . . . . . . . . . . . . . . . . . . 321 396 414 87 97 49
Total Americas . . . . . . . . . . . . . . . . . . . . 4,138 3,515 3,456 974 934 916
Asia–Pacific:China . . . . . . . . . . . . . . . . . . . . . . . . . . . . 2,367 2,331 2,072 529 492 495Other Asia–Pacific . . . . . . . . . . . . . . . . . . . 1,736 1,903 1,914 461 468 490
Total Asia–Pacific . . . . . . . . . . . . . . . . . . 4,103 4,234 3,986 990 960 985
Europe/Middle East/Africa:Switzerland . . . . . . . . . . . . . . . . . . . . . . . . 2,992 3,483 3,216 55 54 54Germany . . . . . . . . . . . . . . . . . . . . . . . . . 117 126 123 313 330 346Other Europe/Middle East/Africa . . . . . . . . 883 615 609 588 642 650
Total Europe/Middle East/Africa . . . . . . . 3,992 4,224 3,948 956 1,026 1,050
Total . . . . . . . . . . . . . . . . . . . . . . . . . . . . . . $12,233 $11,973 $11,390 $2,920 $2,920 $2,951
(1) Net sales to external customers is attributed to individual countries based on the legal entity that records the sale.
98

TE CONNECTIVITY LTD.
NOTES TO CONSOLIDATED FINANCIAL STATEMENTS (Continued)
23. Quarterly Financial Data (unaudited)
Summarized quarterly financial data was as follows:
Fiscal
2015 2014
First Second Third Fourth First Second Third FourthQuarter(1) Quarter Quarter Quarter(2) Quarter Quarter Quarter Quarter(3)
(in millions, except per share data)
Net sales . . . . . . . . . . . . . . . . . . . . . $3,049 $3,082 $3,118 $2,984 $2,862 $2,964 $3,075 $3,072Gross margin . . . . . . . . . . . . . . . . . 1,020 1,051 1,048 968 945 995 1,018 1,014Acquisition and integration costs . . . 24 14 8 9 — 1 1 29Restructuring and other charges
(credits), net . . . . . . . . . . . . . . . . 25 38 19 70 6 (1) 10 4Amounts attributable to TE
Connectivity Ltd.:Income from continuing operations 435 316 351 136 313 340 347 614Income (loss) from discontinued
operations, net of income taxes . 37 283 (42) 904 40 22 56 49Net income . . . . . . . . . . . . . . . . . $ 472 $ 599 $ 309 $1,040 $ 353 $ 362 $ 403 $ 663
Basic earnings per share attributableto TE Connectivity Ltd.:Income from continuing operations $ 1.07 $ 0.78 $ 0.86 $ 0.34 $ 0.76 $ 0.83 $ 0.85 $ 1.50Net income . . . . . . . . . . . . . . . . . 1.16 1.47 0.76 2.60 0.86 0.88 0.99 1.62
Diluted earnings per shareattributable to TEConnectivity Ltd.:Income from continuing operations $ 1.05 $ 0.77 $ 0.85 $ 0.34 $ 0.75 $ 0.82 $ 0.83 $ 1.48Net income . . . . . . . . . . . . . . . . . 1.14 1.45 0.75 2.57 0.84 0.87 0.97 1.59
(1) Results for the first quarter of fiscal 2015 include $27 million of charges from the amortization of acquisition-related fairvalue adjustments to acquired inventories and customer order backlog associated primarily with Measurement Specialties.Results for the first quarter of fiscal 2015 also include $189 million of income tax benefits associated with the effectivesettlement of all undisputed tax matters for the years 2001 through 2007 and the related impact of $83 million to otherexpense pursuant to the Tax Sharing Agreement with Tyco International and Covidien.
(2) Results for the fourth quarter of fiscal 2015 include $216 million of income tax charges associated with the tax impacts ofcertain intercompany legal entity restructurings made in connection with our integration of Measurement Specialties and$63 million of income tax benefits associated with the effective settlement of all undisputed tax matters for the years 2008through 2010. In addition, in the fourth quarter of fiscal 2015, income from discontinued operations, net of income taxesincludes the gain on the sale of our BNS business.
(3) Results for the fourth quarter of fiscal 2014 include $282 million of income tax benefits recognized in connection with areduction in the valuation allowance associated with certain ADC tax loss carryforwards.
99

TE CONNECTIVITY LTD.
NOTES TO CONSOLIDATED FINANCIAL STATEMENTS (Continued)
24. Subsequent Event
On November 7, 2015, we entered into a definitive agreement to sell our Circuit ProtectionDevices (‘‘CPD’’) business for $350 million in cash, subject to a final working capital adjustment. Thetransaction is expected to close during the second quarter of fiscal 2016 pending customary closingconditions and regulatory approvals. The net assets of the CPD business were approximately$200 million at September 25, 2015. The CPD business is currently reported in our CommunicationsSolutions segment.
25. Tyco Electronics Group S.A.
Tyco Electronics Group S.A. (‘‘TEGSA’’), a Luxembourg company and our 100%-owned subsidiary,is a holding company that owns, directly or indirectly, all of our operating subsidiaries. TEGSA is theobligor under our senior notes, commercial paper, and Credit Facility, which are fully andunconditionally guaranteed by its parent, TE Connectivity Ltd. The following tables present condensedconsolidating financial information for TE Connectivity Ltd., TEGSA, and all other subsidiaries thatare not providing a guarantee of debt but which represent assets of TEGSA, using the equity methodof accounting.
100
TE CONNECTIVITY LTD.
NOTES TO CONSOLIDATED FINANCIAL STATEMENTS (Continued)
25. Tyco Electronics Group S.A. (Continued)
Condensed Consolidating Statement of OperationsFor the Fiscal Year Ended September 25, 2015
TEConnectivity Other Consolidating
Ltd. TEGSA Subsidiaries Adjustments Total
(in millions)
Net sales . . . . . . . . . . . . . . . . . . . . . . . . . . . $ — $ — $12,233 $ — $12,233Cost of sales . . . . . . . . . . . . . . . . . . . . . . . . — — 8,146 — 8,146
Gross margin . . . . . . . . . . . . . . . . . . . . . . — — 4,087 — 4,087Selling, general, and administrative expenses,
net(1) . . . . . . . . . . . . . . . . . . . . . . . . . . . . 163 835 506 — 1,504Research, development, and engineering
expenses . . . . . . . . . . . . . . . . . . . . . . . . . — — 627 — 627Acquisition and integration costs . . . . . . . . . . — — 55 — 55Restructuring and other charges, net . . . . . . . — — 152 — 152
Operating income (loss) . . . . . . . . . . . . . . (163) (835) 2,747 — 1,749Interest income . . . . . . . . . . . . . . . . . . . . . . — — 17 — 17Interest expense . . . . . . . . . . . . . . . . . . . . . . — (135) (1) — (136)Other expense, net . . . . . . . . . . . . . . . . . . . . — — (55) — (55)Equity in net income of subsidiaries . . . . . . . 1,398 2,318 — (3,716) —Equity in net income of subsidiaries of
discontinued operations . . . . . . . . . . . . . . 1,182 365 — (1,547) —Intercompany interest income (expense), net . 3 50 (53) — —
Income from continuing operations beforeincome taxes . . . . . . . . . . . . . . . . . . . . . 2,420 1,763 2,655 (5,263) 1,575
Income tax expense . . . . . . . . . . . . . . . . . . . — — (337) — (337)
Income from continuing operations . . . . . . 2,420 1,763 2,318 (5,263) 1,238Income from discontinued operations, net of
income taxes . . . . . . . . . . . . . . . . . . . . . . — 817 365 — 1,182
Net income attributable to TEConnectivity Ltd., TEGSA, or OtherSubsidiaries . . . . . . . . . . . . . . . . . . . . . 2,420 2,580 2,683 (5,263) 2,420
Other comprehensive loss . . . . . . . . . . . . . . . (356) (356) (368) 724 (356)
Comprehensive income attributable to TEConnectivity Ltd., TEGSA, or OtherSubsidiaries . . . . . . . . . . . . . . . . . . . . . $2,064 $2,224 $ 2,315 $(4,539) $ 2,064
(1) TEGSA selling, general, and administrative expenses include losses of $846 million related to intercompany transactions.These losses are offset by corresponding gains recorded by Other Subsidiaries.
101

TE CONNECTIVITY LTD.
NOTES TO CONSOLIDATED FINANCIAL STATEMENTS (Continued)
25. Tyco Electronics Group S.A. (Continued)
Condensed Consolidating Statement of OperationsFor the Fiscal Year Ended September 26, 2014
TEConnectivity Other Consolidating
Ltd. TEGSA Subsidiaries Adjustments Total
(in millions)
Net sales . . . . . . . . . . . . . . . . . . . . . . . . . . $ — $ — $11,973 $ — $11,973Cost of sales . . . . . . . . . . . . . . . . . . . . . . . . — — 8,001 — 8,001
Gross margin . . . . . . . . . . . . . . . . . . . . . — — 3,972 — 3,972Selling, general, and administrative expenses,
net(1) . . . . . . . . . . . . . . . . . . . . . . . . . . . 131 1,877 (474) — 1,534Research, development, and engineering
expenses . . . . . . . . . . . . . . . . . . . . . . . . . — — 583 — 583Acquisition and integration costs . . . . . . . . . — — 31 — 31Restructuring and other charges, net . . . . . . — — 19 — 19
Operating income (loss) . . . . . . . . . . . . . (131) (1,877) 3,813 — 1,805Interest income . . . . . . . . . . . . . . . . . . . . . — — 19 — 19Interest expense . . . . . . . . . . . . . . . . . . . . . — (126) (1) — (127)Other income (expense), net . . . . . . . . . . . . 18 (3) 48 — 63Equity in net income of subsidiaries . . . . . . . 1,729 3,672 — (5,401) —Equity in net income of subsidiaries of
discontinued operations . . . . . . . . . . . . . . 167 167 — (334) —Intercompany interest income (expense), net (2) 63 (61) — —
Income from continuing operations beforeincome taxes . . . . . . . . . . . . . . . . . . . . 1,781 1,896 3,818 (5,735) 1,760
Income tax expense . . . . . . . . . . . . . . . . . . — — (146) — (146)
Income from continuing operations . . . . . 1,781 1,896 3,672 (5,735) 1,614Income from discontinued operations, net of
income taxes . . . . . . . . . . . . . . . . . . . . . . — — 167 — 167
Net income attributable to TEConnectivity Ltd., TEGSA, or OtherSubsidiaries . . . . . . . . . . . . . . . . . . . . . 1,781 1,896 3,839 (5,735) 1,781
Other comprehensive loss . . . . . . . . . . . . . . (320) (320) (328) 648 (320)
Comprehensive income attributable to TEConnectivity Ltd., TEGSA, or OtherSubsidiaries . . . . . . . . . . . . . . . . . . . . . $1,461 $ 1,576 $ 3,511 $(5,087) $ 1,461
(1) TEGSA selling, general, and administrative expenses include losses of $1,874 million related to intercompany transactions.These losses are offset by corresponding gains recorded by Other Subsidiaries.
102

TE CONNECTIVITY LTD.
NOTES TO CONSOLIDATED FINANCIAL STATEMENTS (Continued)
25. Tyco Electronics Group S.A. (Continued)
Condensed Consolidating Statement of OperationsFor the Fiscal Year Ended September 27, 2013
TEConnectivity Other Consolidating
Ltd. TEGSA Subsidiaries Adjustments Total
(in millions)
Net sales . . . . . . . . . . . . . . . . . . . . . . . . . . . $ — $ — $11,390 $ — $11,390Cost of sales . . . . . . . . . . . . . . . . . . . . . . . . — — 7,739 — 7,739
Gross margin . . . . . . . . . . . . . . . . . . . . . . — — 3,651 — 3,651Selling, general, and administrative expenses . 156 3 1,281 — 1,440Research, development, and engineering
expenses . . . . . . . . . . . . . . . . . . . . . . . . . — — 590 — 590Acquisition and integration costs . . . . . . . . . . — — 14 — 14Restructuring and other charges, net . . . . . . . — — 222 — 222
Operating income (loss) . . . . . . . . . . . . . . (156) (3) 1,544 — 1,385Interest income . . . . . . . . . . . . . . . . . . . . . . — — 17 — 17Interest expense . . . . . . . . . . . . . . . . . . . . . . — (135) (4) — (139)Other expense, net . . . . . . . . . . . . . . . . . . . . — — (183) — (183)Equity in net income of subsidiaries . . . . . . . 1,323 1,411 — (2,734) —Equity in net income of subsidiaries of
discontinued operations . . . . . . . . . . . . . . 122 122 — (244) —Intercompany interest income (expense), net . (13) 54 (41) — —
Income from continuing operations beforeincome taxes . . . . . . . . . . . . . . . . . . . . . 1,276 1,449 1,333 (2,978) 1,080
Income tax (expense) benefit . . . . . . . . . . . . — (4) 79 — 75
Income from continuing operations . . . . . . 1,276 1,445 1,412 (2,978) 1,155Income from discontinued operations, net of
income taxes . . . . . . . . . . . . . . . . . . . . . . — — 122 — 122
Net income . . . . . . . . . . . . . . . . . . . . . . . . 1,276 1,445 1,534 (2,978) 1,277Less: net income attributable to
noncontrolling interests . . . . . . . . . . . . . . . — — (1) — (1)
Net income attributable to TEConnectivity Ltd., TEGSA, or OtherSubsidiaries . . . . . . . . . . . . . . . . . . . . . 1,276 1,445 1,533 (2,978) 1,276
Other comprehensive income . . . . . . . . . . . . 74 74 64 (138) 74
Comprehensive income attributable to TEConnectivity Ltd., TEGSA, or OtherSubsidiaries . . . . . . . . . . . . . . . . . . . . . $1,350 $1,519 $ 1,597 $(3,116) $ 1,350
103

TE CONNECTIVITY LTD.
NOTES TO CONSOLIDATED FINANCIAL STATEMENTS (Continued)
25. Tyco Electronics Group S.A. (Continued)
Condensed Consolidating Balance SheetAs of September 25, 2015
TEConnectivity Other Consolidating
Ltd. TEGSA Subsidiaries Adjustments Total
(in millions)AssetsCurrent assets:
Cash and cash equivalents . . . . . . . . . . . . . . $ — $ — $ 3,329 $ — $ 3,329Accounts receivable, net . . . . . . . . . . . . . . . — — 2,120 — 2,120Inventories . . . . . . . . . . . . . . . . . . . . . . . . — — 1,615 — 1,615Intercompany receivables . . . . . . . . . . . . . . 813 389 66 (1,268) —Prepaid expenses and other current assets . . . 4 6 468 — 478Deferred income taxes . . . . . . . . . . . . . . . . — — 345 — 345
Total current assets . . . . . . . . . . . . . . . . . . . 817 395 7,943 (1,268) 7,887Property, plant, and equipment, net . . . . . . . . . — — 2,920 — 2,920Goodwill . . . . . . . . . . . . . . . . . . . . . . . . . . . — — 4,824 — 4,824Intangible assets, net . . . . . . . . . . . . . . . . . . . — — 1,555 — 1,555Deferred income taxes . . . . . . . . . . . . . . . . . . — — 2,144 — 2,144Investment in subsidiaries . . . . . . . . . . . . . . . . 9,505 19,645 — (29,150) —Intercompany loans receivable . . . . . . . . . . . . 22 2,328 8,110 (10,460) —Receivable from Tyco International plc and
Covidien plc . . . . . . . . . . . . . . . . . . . . . . . — — 964 — 964Other assets . . . . . . . . . . . . . . . . . . . . . . . . . — 44 270 — 314
Total Assets . . . . . . . . . . . . . . . . . . . . . . . . $10,344 $22,412 $28,730 $(40,878) $20,608
Liabilities and EquityCurrent liabilities:
Current maturities of long-term debt . . . . . . $ — $ 500 $ — $ — $ 500Accounts payable . . . . . . . . . . . . . . . . . . . . 2 — 1,141 — 1,143Accrued and other current liabilities . . . . . . . 442 75 1,232 — 1,749Deferred revenue . . . . . . . . . . . . . . . . . . . . — — 185 — 185Intercompany payables . . . . . . . . . . . . . . . . 311 824 133 (1,268) —
Total current liabilities . . . . . . . . . . . . . . . . 755 1,399 2,691 (1,268) 3,577Long-term debt . . . . . . . . . . . . . . . . . . . . . . . — 3,402 1 — 3,403Intercompany loans payable . . . . . . . . . . . . . . 4 8,106 2,350 (10,460) —Long-term pension and postretirement
liabilities . . . . . . . . . . . . . . . . . . . . . . . . . . — — 1,327 — 1,327Deferred income taxes . . . . . . . . . . . . . . . . . . — — 329 — 329Income taxes . . . . . . . . . . . . . . . . . . . . . . . . . — — 1,954 — 1,954Other liabilities . . . . . . . . . . . . . . . . . . . . . . . — — 433 — 433
Total Liabilities . . . . . . . . . . . . . . . . . . . . . 759 12,907 9,085 (11,728) 11,023
Total Equity . . . . . . . . . . . . . . . . . . . . . . . . 9,585 9,505 19,645 (29,150) 9,585
Total Liabilities and Equity . . . . . . . . . . . . . $10,344 $22,412 $28,730 $(40,878) $20,608
104

TE CONNECTIVITY LTD.
NOTES TO CONSOLIDATED FINANCIAL STATEMENTS (Continued)
25. Tyco Electronics Group S.A. (Continued)
Condensed Consolidating Balance SheetAs of September 26, 2014
TEConnectivity Other Consolidating
Ltd. TEGSA Subsidiaries Adjustments Total
(in millions)AssetsCurrent assets:
Cash and cash equivalents . . . . . . . . . . . . . . . . $ — $ 1 $ 2,456 $ — $ 2,457Accounts receivable, net . . . . . . . . . . . . . . . . . — — 2,057 — 2,057Inventories . . . . . . . . . . . . . . . . . . . . . . . . . . — — 1,509 — 1,509Intercompany receivables . . . . . . . . . . . . . . . . 932 230 30 (1,192) —Prepaid expenses and other current assets . . . . . 6 3 510 — 519Deferred income taxes . . . . . . . . . . . . . . . . . . — — 324 — 324Assets held for sale . . . . . . . . . . . . . . . . . . . . — — 2,013 — 2,013
Total current assets . . . . . . . . . . . . . . . . . . . . 938 234 8,899 (1,192) 8,879Property, plant, and equipment, net . . . . . . . . . . . — — 2,920 — 2,920Goodwill . . . . . . . . . . . . . . . . . . . . . . . . . . . . . — — 3,726 — 3,726Intangible assets, net . . . . . . . . . . . . . . . . . . . . . — — 1,087 — 1,087Deferred income taxes . . . . . . . . . . . . . . . . . . . . — — 2,047 — 2,047Investment in subsidiaries . . . . . . . . . . . . . . . . . . 8,602 19,966 — (28,568) —Intercompany loans receivable . . . . . . . . . . . . . . 20 2,160 9,883 (12,063) —Receivable from Tyco International plc and
Covidien plc . . . . . . . . . . . . . . . . . . . . . . . . . — — 1,037 — 1,037Other assets . . . . . . . . . . . . . . . . . . . . . . . . . . . — 30 426 — 456
Total Assets . . . . . . . . . . . . . . . . . . . . . . . . . $9,560 $22,390 $30,025 $(41,823) $20,152
Liabilities and EquityCurrent liabilities:
Current maturities of long-term debt . . . . . . . . $ — $ 577 $ — $ — $ 577Accounts payable . . . . . . . . . . . . . . . . . . . . . . 1 — 1,229 — 1,230Accrued and other current liabilities . . . . . . . . . 282 50 1,262 — 1,594Deferred revenue . . . . . . . . . . . . . . . . . . . . . . — — 176 — 176Intercompany payables . . . . . . . . . . . . . . . . . . 260 — 932 (1,192) —Liabilities held for sale . . . . . . . . . . . . . . . . . . — — 416 — 416
Total current liabilities . . . . . . . . . . . . . . . . . . 543 627 4,015 (1,192) 3,993Long-term debt . . . . . . . . . . . . . . . . . . . . . . . . — 3,281 — — 3,281Intercompany loans payable . . . . . . . . . . . . . . . . 4 9,880 2,179 (12,063) —Long-term pension and postretirement liabilities . . — — 1,280 — 1,280Deferred income taxes . . . . . . . . . . . . . . . . . . . . — — 229 — 229Income taxes . . . . . . . . . . . . . . . . . . . . . . . . . . — — 2,044 — 2,044Other liabilities . . . . . . . . . . . . . . . . . . . . . . . . . — — 312 — 312
Total Liabilities . . . . . . . . . . . . . . . . . . . . . . . 547 13,788 10,059 (13,255) 11,139
Total Equity . . . . . . . . . . . . . . . . . . . . . . . . . 9,013 8,602 19,966 (28,568) 9,013
Total Liabilities and Equity . . . . . . . . . . . . . . . $9,560 $22,390 $30,025 $(41,823) $20,152
105
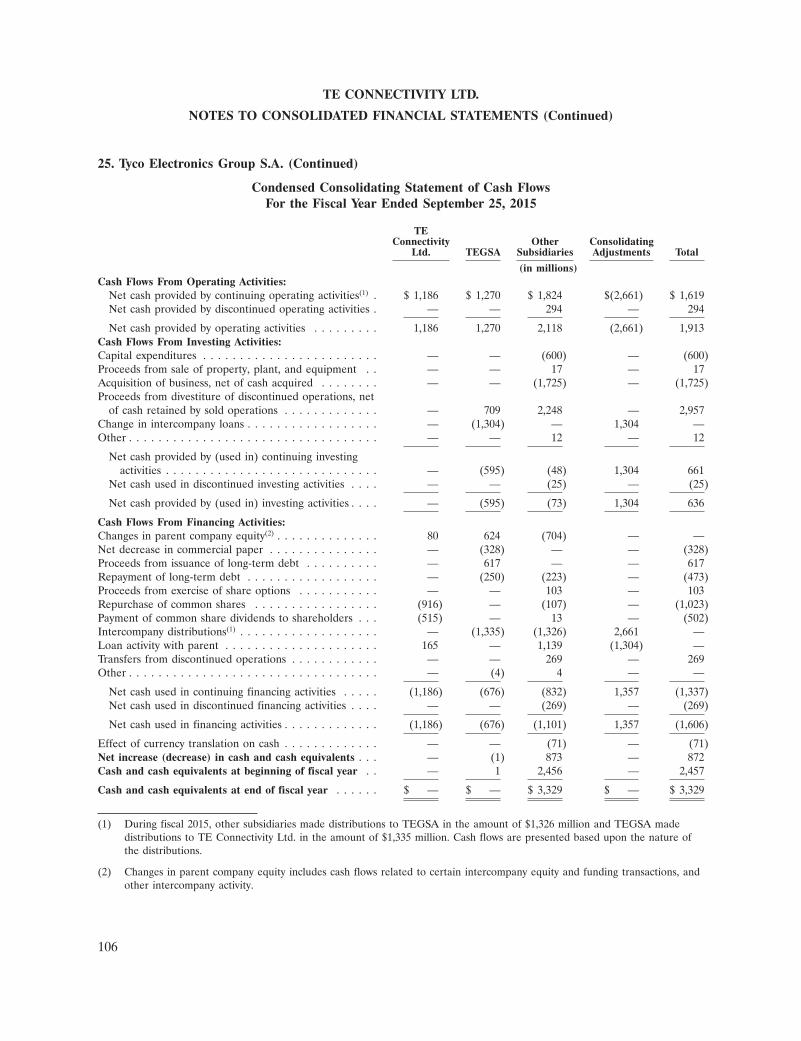
TE CONNECTIVITY LTD.
NOTES TO CONSOLIDATED FINANCIAL STATEMENTS (Continued)
25. Tyco Electronics Group S.A. (Continued)
Condensed Consolidating Statement of Cash FlowsFor the Fiscal Year Ended September 25, 2015
TEConnectivity Other Consolidating
Ltd. TEGSA Subsidiaries Adjustments Total
(in millions)Cash Flows From Operating Activities:
Net cash provided by continuing operating activities(1) . $ 1,186 $ 1,270 $ 1,824 $(2,661) $ 1,619Net cash provided by discontinued operating activities . — — 294 — 294
Net cash provided by operating activities . . . . . . . . . 1,186 1,270 2,118 (2,661) 1,913Cash Flows From Investing Activities:Capital expenditures . . . . . . . . . . . . . . . . . . . . . . . . — — (600) — (600)Proceeds from sale of property, plant, and equipment . . — — 17 — 17Acquisition of business, net of cash acquired . . . . . . . . — — (1,725) — (1,725)Proceeds from divestiture of discontinued operations, net
of cash retained by sold operations . . . . . . . . . . . . . — 709 2,248 — 2,957Change in intercompany loans . . . . . . . . . . . . . . . . . . — (1,304) — 1,304 —Other . . . . . . . . . . . . . . . . . . . . . . . . . . . . . . . . . . — — 12 — 12
Net cash provided by (used in) continuing investingactivities . . . . . . . . . . . . . . . . . . . . . . . . . . . . . — (595) (48) 1,304 661
Net cash used in discontinued investing activities . . . . — — (25) — (25)
Net cash provided by (used in) investing activities . . . . — (595) (73) 1,304 636
Cash Flows From Financing Activities:Changes in parent company equity(2) . . . . . . . . . . . . . . 80 624 (704) — —Net decrease in commercial paper . . . . . . . . . . . . . . . — (328) — — (328)Proceeds from issuance of long-term debt . . . . . . . . . . — 617 — — 617Repayment of long-term debt . . . . . . . . . . . . . . . . . . — (250) (223) — (473)Proceeds from exercise of share options . . . . . . . . . . . — — 103 — 103Repurchase of common shares . . . . . . . . . . . . . . . . . (916) — (107) — (1,023)Payment of common share dividends to shareholders . . . (515) — 13 — (502)Intercompany distributions(1) . . . . . . . . . . . . . . . . . . . — (1,335) (1,326) 2,661 —Loan activity with parent . . . . . . . . . . . . . . . . . . . . . 165 — 1,139 (1,304) —Transfers from discontinued operations . . . . . . . . . . . . — — 269 — 269Other . . . . . . . . . . . . . . . . . . . . . . . . . . . . . . . . . . — (4) 4 — —
Net cash used in continuing financing activities . . . . . (1,186) (676) (832) 1,357 (1,337)Net cash used in discontinued financing activities . . . . — — (269) — (269)
Net cash used in financing activities . . . . . . . . . . . . . (1,186) (676) (1,101) 1,357 (1,606)
Effect of currency translation on cash . . . . . . . . . . . . . — — (71) — (71)Net increase (decrease) in cash and cash equivalents . . . — (1) 873 — 872Cash and cash equivalents at beginning of fiscal year . . — 1 2,456 — 2,457
Cash and cash equivalents at end of fiscal year . . . . . . $ — $ — $ 3,329 $ — $ 3,329
(1) During fiscal 2015, other subsidiaries made distributions to TEGSA in the amount of $1,326 million and TEGSA madedistributions to TE Connectivity Ltd. in the amount of $1,335 million. Cash flows are presented based upon the nature ofthe distributions.
(2) Changes in parent company equity includes cash flows related to certain intercompany equity and funding transactions, andother intercompany activity.
106

TE CONNECTIVITY LTD.
NOTES TO CONSOLIDATED FINANCIAL STATEMENTS (Continued)
25. Tyco Electronics Group S.A. (Continued)
Condensed Consolidating Statement of Cash FlowsFor the Fiscal Year Ended September 26, 2014
TEConnectivity Other Consolidating
Ltd. TEGSA Subsidiaries Adjustments Total
(in millions)Cash Flows From Operating Activities:
Net cash provided by (used in) continuing operatingactivities(1) . . . . . . . . . . . . . . . . . . . . . . . . . . . . $(296) $ 1,829 $ 2,153 $(1,882) $ 1,804
Net cash provided by discontinued operating activities . — — 279 — 279
Net cash provided by (used in) operating activities . . . (296) 1,829 2,432 (1,882) 2,083Cash Flows From Investing Activities:Capital expenditures . . . . . . . . . . . . . . . . . . . . . . . . — — (635) — (635)Proceeds from sale of property, plant, and equipment . . — — 129 — 129Acquisition of business, net of cash acquired . . . . . . . . — — (522) — (522)Intercompany distribution receipts(1) . . . . . . . . . . . . . . — 99 — (99) —Change in intercompany loans . . . . . . . . . . . . . . . . . . — 347 — (347) —Other . . . . . . . . . . . . . . . . . . . . . . . . . . . . . . . . . . — — (10) — (10)
Net cash provided by (used in) continuing investingactivities . . . . . . . . . . . . . . . . . . . . . . . . . . . . . — 446 (1,038) (446) (1,038)
Net cash used in discontinued investing activities . . . . — — (37) — (37)
Net cash provided by (used in) investing activities . . . . — 446 (1,075) (446) (1,075)
Cash Flows From Financing Activities:Changes in parent company equity(2) . . . . . . . . . . . . . . 67 (3,259) 3,192 — —Net decrease in commercial paper . . . . . . . . . . . . . . . — (23) — — (23)Proceeds from issuance of long-term debt . . . . . . . . . . — 1,322 — — 1,322Repayment of long-term debt . . . . . . . . . . . . . . . . . . — (303) (57) — (360)Proceeds from exercise of share options . . . . . . . . . . . — — 156 — 156Repurchase of common shares . . . . . . . . . . . . . . . . . (127) — (451) — (578)Payment of common share dividends to shareholders . . . (452) — 9 — (443)Intercompany distributions(1) . . . . . . . . . . . . . . . . . . . — — (1,981) 1,981 —Loan activity with parent . . . . . . . . . . . . . . . . . . . . . 808 — (1,155) 347 —Transfers from discontinued operations . . . . . . . . . . . . — — 242 — 242Other . . . . . . . . . . . . . . . . . . . . . . . . . . . . . . . . . . — (11) 2 — (9)
Net cash provided by (used in) continuing financingactivities . . . . . . . . . . . . . . . . . . . . . . . . . . . . . 296 (2,274) (43) 2,328 307
Net cash used in discontinued financing activities . . . . — — (242) — (242)
Net cash provided by (used in) financing activities . . . 296 (2,274) (285) 2,328 65
Effect of currency translation on cash . . . . . . . . . . . . . — — (19) — (19)Net increase in cash and cash equivalents . . . . . . . . . . — 1 1,053 — 1,054Cash and cash equivalents at beginning of fiscal year . . — — 1,403 — 1,403
Cash and cash equivalents at end of fiscal year . . . . . . $ — $ 1 $ 2,456 $ — $ 2,457
(1) During fiscal 2014, other subsidiaries made distributions to TEGSA in the amount of $1,981 million. Cash flows arepresented based upon the nature of the distributions.
(2) Changes in parent company equity includes cash flows related to certain intercompany equity and funding transactions, andother intercompany activity.
107

TE CONNECTIVITY LTD.
NOTES TO CONSOLIDATED FINANCIAL STATEMENTS (Continued)
25. Tyco Electronics Group S.A. (Continued)
Condensed Consolidating Statement of Cash FlowsFor the Fiscal Year Ended September 27, 2013
TEConnectivity Other Consolidating
Ltd. TEGSA Subsidiaries Adjustments Total
(in millions)Cash Flows From Operating Activities:
Net cash provided by continuing operating activities(1) . $ 3,621 $ 1,972 $ 2,058 $(5,876) $ 1,775Net cash provided by discontinued operating activities . — — 271 — 271
Net cash provided by operating activities . . . . . . . . . 3,621 1,972 2,329 (5,876) 2,046Cash Flows From Investing Activities:Capital expenditures . . . . . . . . . . . . . . . . . . . . . . . . — — (581) — (581)Proceeds from sale of property, plant, and equipment . . 1 — 21 — 22Acquisition of business, net of cash acquired . . . . . . . . — — (6) — (6)Proceeds from divestiture of discontinued operations, net
of cash retained by sold operations . . . . . . . . . . . . . — — 14 — 14Intercompany distribution receipts(1) . . . . . . . . . . . . . . — 1,100 — (1,100) —Change in intercompany loans . . . . . . . . . . . . . . . . . . — 1,566 — (1,566) —Other . . . . . . . . . . . . . . . . . . . . . . . . . . . . . . . . . . (3) — 26 — 23
Net cash provided by (used in) continuing investingactivities . . . . . . . . . . . . . . . . . . . . . . . . . . . . . (2) 2,666 (526) (2,666) (528)
Net cash used in discontinued investing activities . . . . — — (17) — (17)
Net cash provided by (used in) investing activities . . . . (2) 2,666 (543) (2,666) (545)
Cash Flows From Financing Activities:Changes in parent company equity(2) . . . . . . . . . . . . . . (826) (174) 1,000 — —Net increase in commercial paper . . . . . . . . . . . . . . . — 50 — — 50Repayment of long-term debt . . . . . . . . . . . . . . . . . . — (714) — — (714)Proceeds from exercise of share options . . . . . . . . . . . — — 214 — 214Repurchase of common shares . . . . . . . . . . . . . . . . . (602) — (242) — (844)Payment of common share dividends and cash
distributions to shareholders . . . . . . . . . . . . . . . . . (391) — 7 — (384)Intercompany distributions(1) . . . . . . . . . . . . . . . . . . . — (3,800) (3,176) 6,976 —Loan activity with parent . . . . . . . . . . . . . . . . . . . . . (1,800) — 234 1,566 —Transfers from discontinued operations . . . . . . . . . . . . — — 254 — 254
Net cash used in continuing financing activities . . . . . (3,619) (4,638) (1,709) 8,542 (1,424)Net cash used in discontinued financing activities . . . . — — (254) — (254)
Net cash used in financing activities . . . . . . . . . . . . . (3,619) (4,638) (1,963) 8,542 (1,678)
Effect of currency translation on cash . . . . . . . . . . . . . — — (9) — (9)Net decrease in cash and cash equivalents . . . . . . . . . . — — (186) — (186)Cash and cash equivalents at beginning of fiscal year . . — — 1,589 — 1,589
Cash and cash equivalents at end of fiscal year . . . . . . $ — $ — $ 1,403 $ — $ 1,403
(1) During fiscal 2013, other subsidiaries made distributions to TEGSA in the amount of $3,176 million and TEGSA madedistributions to TE Connectivity Ltd. in the amount of $3,800 million. Cash flows are presented based upon the nature ofthe distributions.
(2) Changes in parent company equity includes cash flows related to certain intercompany equity and funding transactions, andother intercompany activity.
108
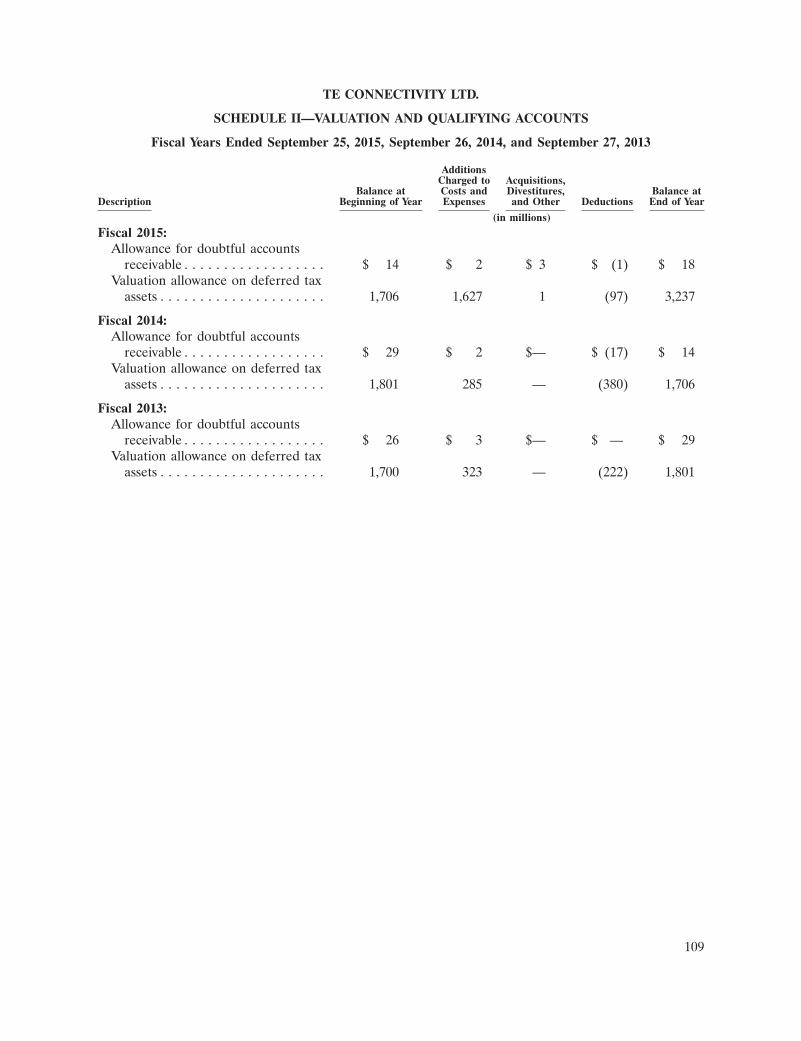
TE CONNECTIVITY LTD.
SCHEDULE II—VALUATION AND QUALIFYING ACCOUNTS
Fiscal Years Ended September 25, 2015, September 26, 2014, and September 27, 2013
AdditionsCharged to Acquisitions,
Balance at Costs and Divestitures, Balance atDescription Beginning of Year Expenses and Other Deductions End of Year
(in millions)
Fiscal 2015:Allowance for doubtful accounts
receivable . . . . . . . . . . . . . . . . . . $ 14 $ 2 $ 3 $ (1) $ 18Valuation allowance on deferred tax
assets . . . . . . . . . . . . . . . . . . . . . 1,706 1,627 1 (97) 3,237
Fiscal 2014:Allowance for doubtful accounts
receivable . . . . . . . . . . . . . . . . . . $ 29 $ 2 $— $ (17) $ 14Valuation allowance on deferred tax
assets . . . . . . . . . . . . . . . . . . . . . 1,801 285 — (380) 1,706
Fiscal 2013:Allowance for doubtful accounts
receivable . . . . . . . . . . . . . . . . . . $ 26 $ 3 $— $ — $ 29Valuation allowance on deferred tax
assets . . . . . . . . . . . . . . . . . . . . . 1,700 323 — (222) 1,801
109

REPORT OF THE STATUTORY AUDITOR ON THE CONSOLIDATED FINANCIAL STATEMENTSOF TE CONNECTIVITY LTD.
To the General meeting ofTE CONNECTIVITY LTD., SCHAFFHAUSEN
Report of the Statutory Auditor on the consolidated financial statements
As Statutory Auditor, we have audited the accompanying consolidated financial statements ofTE Connectivity Ltd. (the ‘‘Company’’), which comprise the consolidated balance sheet as ofSeptember 25, 2015, and the consolidated statement of operations, statement of comprehensive income,statement of shareholders’ equity, statement of cash flows and notes for the year then ended.
Board of Directors’ Responsibility
The Board of Directors is responsible for the preparation and fair presentation of the consolidatedfinancial statements in accordance with accounting principles generally accepted in the United States ofAmerica and the requirements of Swiss law. This responsibility includes designing, implementing andmaintaining an internal control system relevant to the preparation and fair presentation of consolidatedfinancial statements that are free from material misstatement, whether due to fraud or error. TheBoard of Directors is further responsible for selecting and applying appropriate accounting policies andmaking accounting estimates that are reasonable in the circumstances.
Auditor’s Responsibility
Our responsibility is to express an opinion on these consolidated financial statements based on ouraudit. We conducted our audit in accordance with Swiss law, Swiss Auditing Standards and auditingstandards generally accepted in the United States of America. Those standards require that we planand perform the audit to obtain reasonable assurance whether the consolidated financial statements arefree from material misstatement.
An audit involves performing procedures to obtain audit evidence about the amounts anddisclosures in the consolidated financial statements. The procedures selected depend on the auditor’sjudgment, including the assessment of the risks of material misstatement of the consolidated financialstatements, whether due to fraud or error. In making those risk assessments, the auditor considers theinternal control system relevant to the entity’s preparation and fair presentation of the consolidatedfinancial statements in order to design audit procedures that are appropriate in the circumstances, butnot for the purpose of expressing an opinion on the effectiveness of the entity’s internal control system.An audit also includes evaluating the appropriateness of the accounting policies used and thereasonableness of accounting estimates made, as well as evaluating the overall presentation of theconsolidated financial statements. We believe that the audit evidence we have obtained is sufficient andappropriate to provide a basis for our audit opinion.
Opinion
In our opinion, the consolidated financial statements for the year ended September 25, 2015present fairly, in all material respects, the financial position of the Company and the result of itsoperations and its cash flows in accordance with accounting principles generally accepted in the UnitedStates of America, and comply with Swiss law.
Report on Other Legal Requirements
We confirm that we meet the legal requirements on licensing according to the Auditor OversightAct (‘‘AOA’’) and independence (Article 728 CO and Article 11, AOA) and that there are nocircumstances incompatible with our independence.
110

In accordance with Article 728a, paragraph 1, item 3, CO, and Swiss Auditing Standard 890, weconfirm that an internal control system exists, which has been designed for the preparation of theconsolidated financial statements according to the instructions of the Board of Directors.
We recommend that the consolidated financial statements submitted to you be approved.
Deloitte AG
/s/ Martin Welser /s/ Matthias GschwendLicensed Audit Expert Licensed Audit ExpertAuditor in charge
Zurich, November 10, 2015
111

(This page has been left blank intentionally.)
112

TE CONNECTIVITY LTD.
INDEX TO SWISS STATUTORY FINANCIAL STATEMENTS
Page
Statements of Operations for the fiscal years ended September 25, 2015 and September 26, 2014 . 114Balance Sheets as of September 25, 2015 and September 26, 2014 . . . . . . . . . . . . . . . . . . . . . . . 115Notes to Swiss Statutory Financial Statements . . . . . . . . . . . . . . . . . . . . . . . . . . . . . . . . . . . . . . 116Proposed Appropriation of Available Earnings . . . . . . . . . . . . . . . . . . . . . . . . . . . . . . . . . . . . . 126Report of the Statutory Auditor on the Swiss Statutory Financial Statements of TE
Connectivity Ltd . . . . . . . . . . . . . . . . . . . . . . . . . . . . . . . . . . . . . . . . . . . . . . . . . . . . . . . . . . 127
113

TE CONNECTIVITY LTD.
SWISS STATUTORY FINANCIAL STATEMENTS
STATEMENTS OF OPERATIONS
For the fiscal years ended September 25, 2015 and September 26, 2014
September 25, 2015 September 26, 2014
U.S. dollars Swiss francs U.S. dollars Swiss francs
(in millions)
IncomeIncome from distributions made by a subsidiary
(Note 2) . . . . . . . . . . . . . . . . . . . . . . . . . . . . . . . $1,335 CHF 1,300 $ — CHF —Insurance premiums charged to subsidiaries . . . . . . . 13 13 13 12Remeasurement gain on foreign currency
transactions . . . . . . . . . . . . . . . . . . . . . . . . . . . . . 13 12 12 11Intercompany interest income . . . . . . . . . . . . . . . . . 7 6 2 1
Total income . . . . . . . . . . . . . . . . . . . . . . . . . . . . 1,368 1,331 27 24
ExpensesSalary and social costs . . . . . . . . . . . . . . . . . . . . . . . 5 4 6 5General and administrative costs . . . . . . . . . . . . . . . 4 4 4 4Legal and consulting costs . . . . . . . . . . . . . . . . . . . . 7 7 8 7Insurance premiums . . . . . . . . . . . . . . . . . . . . . . . . 16 15 17 15Pre-separation tax settlement expense, net (Note 3) . (10) (10) 186 167Expenses for services provided by subsidiaries . . . . . . 54 52 44 40Intercompany interest expense . . . . . . . . . . . . . . . . . 4 4 4 4
Total expenses . . . . . . . . . . . . . . . . . . . . . . . . . . . 80 76 269 242
Net income (loss) . . . . . . . . . . . . . . . . . . . . . . . . $1,288 CHF 1,255 $(242) CHF (218)
See Notes to Swiss Statutory Financial Statements.
114

TE CONNECTIVITY LTD.
SWISS STATUTORY FINANCIAL STATEMENTS
BALANCE SHEETS
As of September 25, 2015 and September 26, 2014
September 25, 2015 September 26, 2014
U.S. dollars Swiss francs U.S. dollars Swiss francs
(in millions, except share data)
AssetsCurrent assets:
Accounts receivable from subsidiaries (Note 3) . $ 817 CHF 798 $ 942 CHF 895Prepaid expenses and other current assets . . . . 5 5 7 7Shares held in treasury (Note 4) . . . . . . . . . . . — — 164 150
Total current assets . . . . . . . . . . . . . . . . . . . 822 803 1,113 1,052Investments in subsidiaries (Note 2) . . . . . . . . . . 9,649 10,443 9,621 10,416
Total Assets . . . . . . . . . . . . . . . . . . . . . . . . . $10,471 CHF 11,246 $10,734 CHF 11,468
Liabilities and Shareholders’ EquityCurrent liabilities:
Accounts payable . . . . . . . . . . . . . . . . . . . . . . $ 1 CHF 1 $ — CHF —Accounts payable to subsidiaries (Note 3) . . . . . 44 43 46 43Loans from subsidiaries (Note 3) . . . . . . . . . . . 272 266 230 218Accrued and other current liabilities . . . . . . . . . 186 182 50 47Approved but unpaid distributions to
shareholders (Note 4) . . . . . . . . . . . . . . . . . 264 256 242 217
Total current liabilities . . . . . . . . . . . . . . . . . 767 748 568 525Unrealized translation gains (Note 2) . . . . . . . . . — 580 — 553
Total Liabilities . . . . . . . . . . . . . . . . . . . . . . 767 1,328 568 1,078
Commitments, contingencies, and guarantees(Note 3)
Shareholders’ equity (Note 4):Share capital, 414,064,381 and 419,070,781
shares authorized and issued, CHF 0.57 parvalue . . . . . . . . . . . . . . . . . . . . . . . . . . . . . . 182 236 184 239
Statutory reserves:General reserve from earnings . . . . . . . . . . . 38 49 38 49
Free reserves:Reserves from capital contributions (Note 4) . 7,505 8,392 8,036 8,907Allocated reserves for the acquisition of
treasury shares by a subsidiary (Note 2) . . . (175) (166) (51) (45)Unappropriated accumulated earnings . . . . . . . 2,728 1,968 1,315 659Own shares held in treasury . . . . . . . . . . . . . . . (915) (875) — —Reserves for treasury shares (Note 2) . . . . . . . . 341 314 644 581
Total Shareholders’ Equity . . . . . . . . . . . . . . 9,704 9,918 10,166 10,390
Total Liabilities and Shareholders’ Equity . . . $10,471 CHF 11,246 $10,734 CHF 11,468
See Notes to Swiss Statutory Financial Statements.
115

1. Basis of Presentation
TE Connectivity Ltd. (‘‘TE Connectivity’’ or the ‘‘Company,’’ which may be referred to as ‘‘we,’’‘‘us,’’ or ‘‘our’’), incorporated in Schaffhausen, Switzerland, is the ultimate holding company ofTE Connectivity Ltd. and its subsidiaries (the ‘‘TE Group’’) with a listing on the New York StockExchange. The Company employs less than 10 full time positions. For additional information on theTE Group, see our annual report on Form 10-K filed with the United States (‘‘U.S.’’) Securities andExchange Commission (‘‘SEC’’) for the fiscal year ended September 25, 2015.
The accompanying statements of operations reflect the results of operations for the fiscal yearsended September 25, 2015 and September 26, 2014, and have been prepared in accordance with therequirements of Swiss law for companies, the Swiss Code of Obligations. The financial statementspresent the results of the holding company on a stand-alone basis and do not represent theconsolidated operations of the TE Group.
On January 1, 2013, changes in Swiss company law became effective. We adopted the requirementson September 27, 2014, the first day of fiscal 2015 (adoption was mandated by January 1, 2015). TheCompany is exempt from certain requirements for larger companies as the Company preparesconsolidated financial statements in accordance with a recognized financial reporting standard (theconsolidated financial statements of the TE Group are prepared under accounting principles generallyaccepted in the U.S.). See Note 2 for additional information on the impact of adoption.
Fiscal Year
Unless otherwise indicated, references in the financial statements to fiscal 2015 and fiscal 2014 areto our fiscal years ended September 25, 2015 and September 26, 2014. Our fiscal year is a‘‘52-53 week’’ year ending on the last Friday of September. Fiscal 2015 and 2014 were 52 week years.
2. Summary of Significant Accounting Policies
Own Shares Held in Treasury and Allocated Reserves for the Acquisition of Treasury Shares by aSubsidiary
Effective in fiscal 2015, shares held in treasury that are directly owned by us are recorded athistorical cost and presented as reductions to equity on our balance sheets. The reserves for treasuryshares reflects all treasury shares held by a subsidiary and is recorded at historical cost.
Prior to fiscal 2015 and in accordance with the then applicable law, shares held in treasury thatwere held directly by us for the purpose of retirement were presented at historical cost, and, becausewe expected to retire the shares within the next year, as current assets. Our reserves for treasury sharesrepresented all shares held in treasury, whether held by us or a subsidiary, and was recorded athistorical cost.
We established the reserves for treasury shares during fiscal 2015 and 2014 by charging, asmanagement deemed appropriate, either accumulated earnings or allocated reserves for the acquisitionof treasury shares by a subsidiary. As shares acquired by a subsidiary are re-issued for use in share-based compensation arrangements, we credit the same account impacted by initial acquisition.
Investments in Subsidiaries
Investments in subsidiaries are equity interests held on a long-term basis for the purpose of ourbusiness activities. Investments in subsidiaries are carried at a value no higher than cost lessadjustments for impairment. No impairments were recorded during fiscal 2015 or fiscal 2014.
116

2. Summary of Significant Accounting Policies (Continued)
During fiscal 2015, a subsidiary distributed $1,335 million (equivalent to CHF 1,300 million) to us.The distributions are included in income from distributions made by a subsidiary in our statements ofoperations.
Currency Translation
Our functional currency is the U.S. dollar. We present our financial statements in both U.S. dollarsand Swiss francs (‘‘CHF’’). Assets and liabilities in U.S. dollars are converted to Swiss francs forpresentation purposes using historical foreign exchange rates (for investments in subsidiaries, sharesheld in treasury, approved but unpaid distributions to shareholders payable, and equity accounts) andcurrent foreign exchange rates (for all other assets and liabilities; at fiscal year-end 2015 and 2014,exchange rates were CHF 0.9768:$1 and CHF 0.9508:$1, respectively). Revenue and expenses, excludingincome from distributions made by a subsidiary, are translated using the average exchange rates ineffect for the period presented (exchange rates were CHF 0.9558:$1 and CHF 0.8992:$1 for fiscal 2015and 2014, respectively). Income from distributions made by a subsidiary is translated using the exchangerate in effect on the date that each distribution was made to us. Net unrealized foreign currencytranslation gains are deferred in the balance sheets, while unrealized translation losses and realizedtransactional gains and losses are reflected in the statements of operations. We consider all foreigncurrency transactional gains and losses associated with current assets and liabilities, excluding sharesheld in treasury, to be realized.
Salaries and Social Charges
Salaries and social charges include cash and equity compensation paid to our directors.
Adoption of New Swiss Accounting Rules
On September 27, 2014, we prospectively adopted new Swiss accounting rules. The most significantimpact of adoption was the manner in which we account for treasury shares that we directly hold and issummarized below. Adoption did not impact our accounting for treasury shares held by a subsidiary.
Impact ofAs reported at adoption as ofSeptember 26, September 27,
2014 Adjustment 2014
(CHF Millions)
AssetsShares held in treasury(1) . . . . . . . . . . . . . . . . . . . . . . . . . . . CHF 150 CHF (150) CHF —All other assets . . . . . . . . . . . . . . . . . . . . . . . . . . . . . . . . . . 11,318 — 11,318
Total assets . . . . . . . . . . . . . . . . . . . . . . . . . . . . . . . . . . . CHF 11,468 CHF (150) CHF 11,318
Liabilities and Shareholders’ EquityTotal liabilities . . . . . . . . . . . . . . . . . . . . . . . . . . . . . . . . . CHF 1,078 CHF — CHF 1,078
Own shares held in treasury(1) . . . . . . . . . . . . . . . . . . . . . . . — (150) (150)Reserves for treasury shares held by a subsidiary(2) . . . . . . . . 581 (150) 431Unappropriated accumulated earnings . . . . . . . . . . . . . . . . . 659 150 809All other equity . . . . . . . . . . . . . . . . . . . . . . . . . . . . . . . . . 9,150 — 9,150
Total shareholders’ equity . . . . . . . . . . . . . . . . . . . . . . . . . 10,390 (150) 10,240Total liabilities and shareholders’ equity . . . . . . . . . . . . . . CHF 11,468 CHF (150) CHF 11,318
(1) On adoption, shares held in treasury of CHF 150 million was reduced to zero with a corresponding reduction in totalshareholders’ equity via the creation of shares held in treasury.
(2) Reserves for treasury shares was reduced by CHF 150 million associated with shares held directly by us via an increase inunappropriated accumulated earnings, consistent with how we currently create reserves for treasury shares.
117

2. Summary of Significant Accounting Policies (Continued)
Reclassifications
Certain prior year balances have been reclassified to conform to current year presentation.
3. Commitments, Contingencies, and Guarantees
Affiliated Debt and Loans Receivable
We have three open lines of credit, the 2012 Line, the 2011 Line, and the Schaffhausen Line, withwholly-owned subsidiaries. All lines bear interest at the 1-month London interbank offered rate(‘‘LIBOR’’) plus 0.40% (0.59% and 0.55% at September 25, 2015 and September 26, 2014,respectively). The 2012 Line has a $500 million limit (CHF 488 million) on the principal drawable andmatures in September 2017. The 2011 Line has a $200 million limit (CHF 195 million) on the principaldrawable and matures in September 2016. The Schaffhausen Line does not have a limit on the amountdrawable and matures in April 2017. At September 25, 2015 and September 26, 2014, there were nooutstanding borrowings under any of the open lines of credit.
We utilize a cash pooling relationship with a wholly-owned subsidiary (the ‘‘Cash Pool’’). The CashPool does not have an expiration date and accrues interest based on LIBOR. At September 25, 2015and September 26, 2014, our Cash Pool position was an asset of CHF 779 million andCHF 868 million, respectively, and was included in accounts receivable from subsidiaries on ourbalance sheets.
In order to minimize currency exposure related to distributions to shareholders approved in Swissfrancs and paid in U.S. dollars, we enter into arrangements with a wholly-owned subsidiary in which weborrow Swiss francs from, and simultaneously loan U.S. dollars to, the subsidiary. As distributions toshareholders are paid, both the borrowing and the loan receivable are partially settled. As ofSeptember 25, 2015 and September 26, 2014, the borrowing totaled CHF 266 million andCHF 218 million, respectively, and was reflected as loans from subsidiaries on our balance sheets. Atboth periods, the loan receivable, which approximates the borrowing, was included in the Cash Poolasset reflected in accounts receivable from subsidiaries on our balance sheets.
We have fully and unconditionally guaranteed the debt of a subsidiary, Tyco ElectronicsGroup S.A., totaling approximately CHF 3,812 million and CHF 3,668 million at September 25, 2015and September 26, 2014, respectively. As of September 25, 2015, we have not been required to performon our guarantee.
Tax Sharing Agreement
We are a party to the Tax Sharing Agreement (‘‘TSA’’) with Tyco International Ltd. (‘‘TycoInternational’’) and Covidien plc (‘‘Covidien’’, which, on January 26, 2015, was acquired and nowoperates as a subsidiary of Medtronic plc), under which we share responsibility for certain of our, TycoInternational’s, and Covidien’s income tax liabilities based on a sharing formula for periods prior toand including June 29, 2007. We, Tyco International, and Covidien share 31%, 27%, and 42%,respectively, of U.S. income tax liabilities that arise from adjustments made by tax authorities to our,Tyco International’s, and Covidien’s U.S. income tax returns. The effect of the TSA is to indemnify usfor 69% of certain liabilities settled in cash by us with respect to unresolved pre-separation tax matters.Pursuant to that indemnification, we have made similar indemnifications to Tyco International andCovidien with respect to 31% of certain liabilities settled in cash by the companies relating tounresolved pre-separation tax matters. All costs and expenses associated with the management of theseshared tax liabilities are shared equally among the parties.
118

3. Commitments, Contingencies, and Guarantees (Continued)
During fiscal 2015 and 2014, we recorded net income of CHF 10 million and net expense ofCHF 167 million, respectively, related to the TSA and tax settlements involving Tyco International,Covidien, and us. These amounts are presented in pre-separation tax settlement expense, net in ourstatements of operations.
Performance Guarantees
From time to time, we provide performance guarantees and surety bonds in favor of oursubsidiaries. At September 25, 2015 and September 26, 2014, these performance guarantees totaledCHF 451 million and CHF 497 million, respectively. In addition to these amounts, all of which arequantifiable, we have issued a parent company guarantee in behalf of a U.S.-based aerospace customerthat does not have a limit. We do not anticipate having to perform under these guarantees.
We are the leader of a Swiss value-added tax (‘‘VAT’’) group (‘‘VAT Group’’). All companies inthe VAT Group maintain primary responsibility for their own VAT liabilities. However, in the event ofnon-compliance by any company in the VAT Group, all companies within the VAT Group assume jointand several responsibility for any VAT liabilities. As VAT Group leader, we have not had to assumeresponsibility for any events of noncompliance by the other companies in the group.
119

4. Equity
Changes in Equity Accounts
The following table presents activity related to our equity accounts during fiscal 2015 and 2014 inSwiss francs.
AllocatedReserves Reservesfor the for
General Acquisition Own TreasuryReserve Reserves from of Treasury Unappropriated Shares Shares Total
Share from Capital Shares by a Accumulated Held in held by a Shareholders’Capital Earnings Contributions Subsidiary Earnings Treasury Subsidiary Equity
(in CHF millions)September 27, 2013 . CHF 244 CHF — CHF 9,342 CHF — CHF 1,094 CHF — CHF 684 CHF 11,364
Appropriation ofgeneral reserve . — 49 — — — — — 49
Approved dividends — — (435) — — — — (435)Retirement of
treasury shares . . (5) — — — 5 — (373) (373)Transfer of reserves
for treasuryshares and other — — — (45) (222) — 270 3
Net loss . . . . . . . — — — — (218) — — (218)
September 26, 2014 . 239 49 8,907 (45) 659 — 581 10,390Adoption of Swiss
accounting rules . — — — — 150 (150) (150) (150)Correction related
to appropriationof generalreserve(1) . . . . . — — — — (49) — — (49)
Approved dividends — — (515) — — — — (515)Retirement of
treasury shares . . (3) — — — (283) 286 — —Acquisition of
treasury shares . . — — — — — (1,011) — (1,011)Transfer of reserves
for treasuryshares and other — — — (121) 236 — (117) (2)
Net income . . . . . — — — — 1,255 — — 1,255
September 25, 2015 . CHF 236 CHF 49 CHF 8,392 CHF (166) CHF 1,968 CHF (875) CHF 314 CHF 9,918
(1) Reflects a correction to the appropriation of the general reserve in fiscal 2014.
120

4. Equity (Continued)
The following table presents activity related to our equity accounts during fiscal 2015 and 2014 inU.S. dollars.
AllocatedReserves Reservesfor the for
General Acquisition Own TreasuryReserve Reserves from of Treasury Unappropriated Shares Shares Total
Share from Capital Shares by a Accumulated Held in held by a Shareholders’Capital Earnings Contributions Subsidiary Earnings Treasury Subsidiary Equity
(in USD millions)September 27, 2013 . . . $189 $— $8,520 $ — $1,858 $ — $ 723 $11,290
Appropriation ofgeneral reserve . . . — 38 — — (38) — — —
Approved dividends . . — — (484) — — — — (484)Retirement of treasury
shares . . . . . . . . . (5) — — — 5 — (398) (398)Transfer of reserves
for treasury sharesand other . . . . . . . — — — (51) (268) — 319 —
Net loss . . . . . . . . . — — — — (242) — — (242)
September 26, 2014 . . . 184 38 8,036 (51) 1,315 — 644 10,166Adoption of Swiss
accounting rules . . . — — — — 164 (164) (164) (164)Approved dividends . . — — (531) — — — — (531)Retirement of treasury
shares . . . . . . . . . (2) — — — (303) 305 — —Acquisition of treasury
shares . . . . . . . . . — — — — — (1,056) — (1,056)Transfer of reserves
for treasury sharesand other . . . . . . . — — — (124) 264 — (139) 1
Net income . . . . . . . — — — — 1,288 — — 1,288
September 25, 2015 . . . $182 $38 $7,505 $(175) $2,728 $ (915) $ 341 $ 9,704
Conditional Share Capital
Subject to certain conditions specified in our articles of association, we are authorized to increaseour conditional share capital by issuing new shares in aggregate not exceeding 50% of our authorizedshares. As of September 25, 2015, no conditional shares had been issued.
Own Shares Held in Treasury and Treasury Shares held by a Subsidiary
During the fiscal years ended September 25, 2015 and September 26, 2014, activity related tocommon shares held in treasury by us was as follows:
Number ofShares Total Cost
(in millions) (in CHF millions)
Common shares held as of September 27, 2013 . . . . . . 9 CHF 373Additions . . . . . . . . . . . . . . . . . . . . . . . . . . . . . . . . 3 150Shareholder-approved retirements . . . . . . . . . . . . . . (10) (373)
Common shares held as of September 26, 2014 . . . . . . 2 150Additions . . . . . . . . . . . . . . . . . . . . . . . . . . . . . . . . 17 1,011Shareholder-approved retirements . . . . . . . . . . . . . . (5) (286)
Common shares held as of September 25, 2015 . . . . . . 14 CHF 875
121

4. Equity (Continued)
In fiscal 2015 and 2014, our shareholders approved the cancellation of five million and ten millionshares, respectively, purchased under our share repurchase program. These capital reductions bycancellation of shares were subject to a notice period and filing with the commercial register inSwitzerland.
We acquire treasury shares with the intent to retire them using a virtual secondary trading line(‘‘Secondary Line’’). Pursuant to this Secondary Line, we acquired 17 million shares at a historical costof CHF 1,011 million in fiscal 2015 and 3 million shares at a historical cost of CHF 150 million in fiscal2014.
Treasury shares held by us and a subsidiary at September 25, 2015 totaled 14 million and 6 million,respectively, with a combined historical cost of CHF 1,189 million. Treasury shares held by us and asubsidiary at September 26, 2014 totaled 2 million and 9 million, respectively, with a combinedhistorical cost of CHF 581 million.
During fiscal 2015 and 2014, our board of directors authorized increases of $3 billion and$1 billion, respectively in the share repurchase program. We and our subsidiary repurchasedapproximately 18 million of our common shares for $1,163 million (equivalent to CHF 1,115 million)and approximately 11 million of our common shares for $604 million (equivalent to CHF 544 million)during fiscal 2015 and 2014, respectively. At September 25, 2015, we had $2,711 million of availabilityremaining under our share repurchase authorization. Purchases made both pursuant to the SecondaryLine and by a subsidiary are subject to this authorization.
Reserves from Capital Contributions
Reserves from capital contributions, subject to certain conditions, are freely distributable reserves.As of September 25, 2015 and September 26, 2014, reserves from capital contributions wereCHF 8,392 million (equivalent to $7,505 million) and CHF 8,907 million (equivalent to $8,036 million),respectively.
General Reserve from Earnings
To comply with the Swiss Code of Obligations, 5% of annual net income must be appropriated toour general reserve until the general reserve, a non-distributable reserve, equals 20% of share capital.In March 2014, our shareholders approved an appropriation for the general reserve in an amount ofCHF 49 million. This appropriation satisfies the requirements of the Swiss Code of Obligations withrespect to the general reserve.
Distributions to Shareholders
Under current Swiss tax law, subject to certain conditions, distributions to shareholders made inthe form of a reduction of registered share capital or from reserves from capital contributions areexempt from Swiss withholding tax.
During the quarters ended December 27, 2013, and March 28, 2014, we paid the third and fourthinstallments of the dividend originally approved in March 2013 at a rate of $0.25 per installment.
In March 2014, our shareholders approved a dividend payment to shareholders of CHF 1.04(equivalent to $1.16) per share out of reserves from capital contributions, payable in four quarterlyinstallments beginning in the third quarter of fiscal 2014 through the second quarter of fiscal 2015. Wepaid the installments of the dividend at a rate of $0.29 per share during each of the quarters endedJune 27, 2014, September 26, 2014, December 26, 2014, and March 27, 2015.
122

4. Equity (Continued)
In March 2015, our shareholders approved a dividend payment to shareholders of $1.32(approximately CHF 1.27, based on the exchange rate on the date of approval) per share out ofreserves from capital contributions, payable in four quarterly installments beginning in the third quarterof fiscal 2015 through the second quarter of fiscal 2016. We paid the installments of the dividend at arate of $0.33 per share during each of the quarters ended June 26, 2015 and September 25, 2015. Wehave reflected a liability related to the unpaid distributions in approved but unpaid distributions toshareholders on our balance sheets.
5. Non-Employee Director and Executive Compensation
For information regarding non-employee director and executive compensation, see our SwissStatutory Compensation Report.
6. Security Ownership of Board of Directors and Executive Officers
Board of Directors
The following table sets forth the shares, options and stock units held as of September 25, 2015and September 26, 2014 by each member of our board of directors serving on our Board atSeptember 25, 2015. The share ownership of Mr. Lynch, our Chairman and Chief Executive Officer, isset forth in Executive Management below.
SharesYear Held DSUs Held(1)
Board of Directors:Pierre Brondeau . . . . . . . . . . . . . . . . . . . . . . . . . . . 2015 19,646 12,334
2014 17,539 12,102Juergen Gromer . . . . . . . . . . . . . . . . . . . . . . . . . . . 2015 77,477 38,512
2014 77,477 34,978William Jeffrey . . . . . . . . . . . . . . . . . . . . . . . . . . . . 2015 9,106 —
2014 6,999 —Yong Nam . . . . . . . . . . . . . . . . . . . . . . . . . . . . . . . 2015 9,106 —
2014 6,999 —Daniel Phelan . . . . . . . . . . . . . . . . . . . . . . . . . . . . . 2015 18,151 12,334
2014 16,044 12,102Paula Sneed . . . . . . . . . . . . . . . . . . . . . . . . . . . . . . 2015 19,351 15,140
2014 17,244 14,855David Steiner . . . . . . . . . . . . . . . . . . . . . . . . . . . . . 2015 18,151 12,334
2014 16,044 12,102John Van Scoter(2) . . . . . . . . . . . . . . . . . . . . . . . . . . 2015 23,247 6,605
2014 18,640 6,481Laura Wright . . . . . . . . . . . . . . . . . . . . . . . . . . . . . 2015 3,329 —
2014 1,222 —
(1) Directors hold DSUs. The DSUs are vested upon issuance, generally will be settled in shares on a one-for-onebasis within 30 days following the director’s termination, and receive dividend equivalent units.
(2) Includes 400 shares held by Mr. Van Scoter’s spouse as of September 25, 2015.
123

6. Security Ownership of Board of Directors and Executive Officers (Continued)
Executive Management
The following table sets forth the shares, options and stock units held as of September 25, 2015and September 26, 2014 by each member of our executive management serving in such position as ofSeptember 25, 2015.
Shares Options Options Fiscal Years RSUs PSUsYear Held Held Exercise Price(1) of Expiration Held(2) Held(3)
Executive Management:Thomas Lynch(4) . . . . 2015 332,639 3,386,552 $24.60–$61.50 2017–2025 91,484 157,417
2014 339,421 3,574,469 $14.56–$51.61 2017–2024 112,067 109,680Terrence Curtin . . . . . 2015 40,181 581,800 $33.73–$72.13 2021–2025 29,817 51,828
2014 40,181 553,750 $24.60–$51.61 2020–2024 34,731 35,082Joseph Donahue . . . . 2015 25,178 295,150 $34.05–$61.50 2021–2025 41,281 48,106
2014 17,272 323,713 $33.73–$51.61 2021–2024 33,653 35,082Robert Hau . . . . . . . 2015 34,626 217,200 $34.05–$61.50 2023–2025 33,411 39,315
2014 21,690 158,650 $34.05–$51.61 2023–2024 45,012 28,037John S. Jenkins, Jr. . . 2015 2,558 102,600 $34.05–$61.50 2023–2025 16,709 23,716
2014 2,708 92,550 $34.05–$51.61 2023–2024 17,160 16,421Jane Leipold . . . . . . . 2015 17,210 221,752 $24.60–$61.50 2017–2025 8,927 15,250
2014 27,121 432,550 $24.60–$51.61 2017–2024 15,847 15,250Steven Merkt . . . . . . 2015 1,600 178,876 $34.05–$61.50 2021–2025 46,134 34,158
2014 1,390 275,681 $14.11–$51.61 2017–2024 18,732 24,036James O’Toole . . . . . 2015 4,929 154,076 $34.05–$61.50 2021–2025 31,137 31,364
2014 7,035 216,839 $19.09–$51.61 2019–2024 19,032 22,875Kevin Rock(5) . . . . . . 2015 20,725 115,450 $34.05–$72.13 2022–2025 15,662 12,687Robert Shaddock . . . . 2015 18,570 367,950 $29.15–$61.50 2018–2025 40,096 34,194
2014 13,595 456,750 $14.11–$51.61 2018–2024 21,575 24,332Joan Wainwright . . . . 2015 36,164 96,888 $34.05–$61.50 2022–2025 10,880 18,815
2014 32,839 118,788 $33.73–$51.61 2021–2024 14,263 13,722
(1) Each option provides the right to purchase one share at the exercise price. Subject to acceleration upon certain events, thestock options are exercisable in equal installments on anniversaries of the grant dates.
(2) Executive management holds RSUs. Subject to acceleration upon certain events, the RSUs vest over time on anniversariesof the grant dates, are settled in shares upon vesting on a one-for-one basis, and receive dividend equivalent units.
(3) The PSU amounts in the table above assume achievement of target level of performance including target dividendequivalent units through September 26, 2014 and September 25, 2015, respectively. Under the terms of the PSUs, shares ofstock are reserved based on the company’s earnings per share growth relative to the Standard & Poor’s 500 Non-FinancialCompanies Index over a three-year performance cycle, subject to various conditions, and the PSUs earn dividend equivalentunits. Subject to acceleration upon certain events, vesting of reserved PSUs occurs when the management development andcompensation committee certifies year three results following the close of the three-year performance cycle. PSU awardswere granted on November 12, 2012, November 14, 2013 and November 10, 2014. Year one certification results relating tothe November 12, 2012 grant occurred on December 3, 2013 and the following shares were reserved: (Mr. Lynch—29,836;Mr. Curtin—9,804; Mr. Donahue—9,804; Mr. Hau—7,670; Mr. Jenkins—4,262; Ms. Leipold—2,345; Mr. Merkt—6,392;Mr. O’Toole—6,392; Mr. Rock—2,129; Mr. Shaddock—6,392; and Ms. Wainwright—3,835). Year two certification resultsrelating to the November 12, 2012 grant occurred on December 8, 2014 and the following shares were reserved:(Mr. Lynch—35,972; Mr. Curtin—11,820; Mr. Donahue—11,820; Mr. Hau—9,248; Mr. Jenkins—5,139; Ms. Leipold—2,827;Mr. Merkt—7,706; Mr. O’Toole—7,706; Mr. Rock—2,567; Mr. Shaddock—7,706; and Ms. Wainwright—4,624). Year Onecertification results relating to the November 14, 2013 grant occurred on December 8, 2014 and the following shares werereserved: (Mr. Lynch—24,281; Mr. Curtin—7,446; Mr. Donahue—7,446; Mr. Hau—6,154; Mr. Jenkins—3,888;Ms. Leipold—2,508; Mr. Merkt—5,503; Mr. O’Toole—4,857; Mr. Rock—1,620; Mr. Shaddock—5,666; andMs. Wainwright—2,912).
124

6. Security Ownership of Board of Directors and Executive Officers (Continued)
(4) Mr. Lynch is chairman of the board of directors and chief executive officer.
(5) Includes 18,676 shares held in a family trust over which Mr. Rock has dispositive power. Mr. Rock became a member ofexecutive management in March 2015.
For additional information regarding share-based compensation arrangements, see the TE Group’sconsolidated financial statements and our Swiss Statutory Compensation Report.
7. Significant Shareholders
The following table sets forth the information indicated for persons or groups known to us to bebeneficial owners of more than 5% of our outstanding shares beneficially owned as of September 25,2015.
Number PercentageName and Address of Beneficial Owner of Shares of Class
Dodge & Cox(1) . . . . . . . . . . . . . . . . . . . . . . . . . . . . . . . . . . . . . . . . . . . . . . . 38,427,408 9.8%555 California Street, 40th FloorSan Francisco, CA 94104
Harris Associates L.P.(2) . . . . . . . . . . . . . . . . . . . . . . . . . . . . . . . . . . . . . . . . . 29,889,444 7.6%111 S. Wacker Drive, Suite 4600Chicago, IL 60606
The Vanguard Group(3) . . . . . . . . . . . . . . . . . . . . . . . . . . . . . . . . . . . . . . . . . 20,865,708 5.3%100 Vanguard Blvd.Malvern, PA 19355
(1) This information is based on a Schedule 13G/A filed with the SEC on February 13, 2015 by Dodge & Cox, which reportedsole voting power and sole dispositive power as follows: sole voting power—37,105,132 and sole dispositive power—38,427,408.
(2) This information is based on a Schedule 13G/A filed with the SEC on February 11, 2015 by Harris Associates L.P. and itsgeneral partner, Harris Associates Inc., which reported sole voting power and sole dispositive power as follows: sole votingpower—28,275,611 and sole dispositive power—28,275,611. As a result of advisory and other relationships with persons whoown the shares, Harris Associates L.P. may be deemed to be the beneficial owner of the shares.
(3) This information is based on a Schedule 13G filed with the SEC on February 11, 2015 by The Vanguard Group, whichreported sole voting power, sole dispositive power and shared dispositive power as follows: sole voting power—647,947, soledispositive power—20,252,296, and shared dispositive power—613,412.
125

8. Subsidiaries of the Company
We are the ultimate holding company of all subsidiaries of the TE Group. Our direct subsidiariesand significant subsidiaries of the TE Group, as determined based on net sales or total assets and all ofwhich are wholly-owned indirectly by us, were as follows as of September 25, 2015:
Direct or Indirect NominalEntity Name Jurisdiction Holding(1) Capital(2) Purpose(3)
Tyco Electronics Group S.A. . . . . . . . . . . . . Luxembourg Direct $1 FTyco Electronics Holdings (Bermuda)
No. 7 Limited . . . . . . . . . . . . . . . . . . . . . Bermuda Direct $— FTyco Electronics Verwaltungs GmbH . . . . . . . Germany Direct EUR— FTE Connectivity HK Limited. . . . . . . . . . . . Hong Kong Indirect $380 STE Connectivity Holding
International II S.a r.l. . . . . . . . . . . . . . . . Luxembourg Indirect $— FTE Connectivity Solutions GmbH . . . . . . . . . Switzerland Indirect CHF— STyco Electronics (Shanghai) Co., Ltd. . . . . . . China Indirect CNY 6 MTE Connectivity Germany GmbH . . . . . . . . . Germany Indirect EUR 78 MTyco Electronics AMP Korea Co., Ltd. . . . . . South Korea Indirect KRW 6,000 MTyco Electronics Corporation . . . . . . . . . . . . United States Indirect $625 MTyco Electronics Holding S.a r.l. . . . . . . . . . Luxembourg Indirect $592 FTyco Electronics Japan G.K. . . . . . . . . . . . . Japan Indirect JPY 21,776 MTyco Electronics Singapore Pte Ltd. . . . . . . . Singapore Indirect $183 STyco Electronics Subsea
Communications LLC . . . . . . . . . . . . . . . . United States Indirect $— M
(1) All subsidiaries labelled as ‘‘direct’’ are wholly-owned by the Company.
(2) Nominal capital is presented in millions for the currencies noted as of September 25, 2015. Nominal capital denoted with a‘‘—’’ is insignificant.
(3) ‘‘F’’ denotes the primary purpose as a holding or financing company; ‘‘M’’ denotes the primary purpose as manufacturingand production; ‘‘S’’ denotes the primary purpose as sales and distribution.
9. Subsequent Events
The Company has evaluated subsequent events through November 10, 2015, the date the SwissStatutory Financial Statements were issued.
On November 7, 2015, the TE Group entered into a definitive agreement to sell its CircuitProtection Devices (‘‘CPD’’) business for $350 million in cash, subject to a final working capitaladjustment. The transaction is expected to close during the second quarter of fiscal 2016 pendingcustomary closing conditions and regulatory approvals. The net assets of the CPD business wereapproximately $200 million at September 25, 2015. No other significant subsequent events haveoccurred through this date requiring adjustment to the Swiss Statutory Financial Statements ordisclosures.
Proposed Appropriation of Available Earnings
Our board of directors will propose, in conjunction with our annual general meeting, that we carryforward unappropriated accumulated earnings of CHF 1,968 million as included in our balance sheet asof September 25, 2015.
126

REPORT OF THE STATUTORY AUDITOR ON THE SWISS STATUTORYFINANCIAL STATEMENTS OF TE CONNECTIVITY LTD.
To the General meeting ofTE CONNECTIVITY LTD., SCHAFFHAUSEN
Report of the Statutory Auditor on the financial statements
As Statutory Auditor, we have audited the accompanying financial statements of TEConnectivity Ltd. (the ‘‘Company’’), which comprise the balance sheet as of September 25, 2015, andthe statement of operations and notes for the year then ended.
Board of Directors’ Responsibility
The Board of Directors is responsible for the preparation of the financial statements in accordancewith the requirements of Swiss law and the Company’s articles of association. This responsibilityincludes designing, implementing, and maintaining an internal control system relevant to thepreparation of financial statements that are free from material misstatement, whether due to fraud orerror. The Board of Directors is further responsible for selecting and applying appropriate accountingpolicies and making accounting estimates that are reasonable in the circumstances.
Auditor’s Responsibility
Our responsibility is to express an opinion on these financial statements based on our audit. Weconducted our audit in accordance with Swiss law and Swiss Auditing Standards. Those standardsrequire that we plan and perform the audit to obtain reasonable assurance whether the financialstatements are free from material misstatement.
An audit involves performing procedures to obtain audit evidence about the amounts anddisclosures in the financial statements. The procedures selected depend on the auditor’s judgment,including the assessment of the risks of material misstatement of the financial statements, whether dueto fraud or error. In making those risk assessments, the auditor considers the internal control systemrelevant to the entity’s preparation of the financial statements in order to design audit procedures thatare appropriate in the circumstances, but not for the purpose of expressing an opinion on theeffectiveness of the entity’s internal control system. An audit also includes evaluating theappropriateness of the accounting policies used and the reasonableness of accounting estimates made,as well as evaluating the overall presentation of the financial statements. We believe that the auditevidence we have obtained is sufficient and appropriate to provide a basis for our audit opinion.
Opinion
In our opinion, the financial statements for the year ended September 25, 2015 comply with Swisslaw and the Company’s articles of association.
Report on Other Legal Requirements
We confirm that we meet the legal requirements on licensing according to the Auditor OversightAct (‘‘AOA’’) and independence (Article 728, CO, and Article 11, AOA) and that there are nocircumstances incompatible with our independence.
In accordance with Article 728a, paragraph 1, item 3, CO, and Swiss Auditing Standard 890, weconfirm that an internal control system exists, which has been designed for the preparation of financialstatements according to the instructions of the Board of Directors.
127

We further confirm that the proposed appropriation of accumulated earnings complies with Swisslaw and the Company’s articles of association. We recommend that the financial statements submittedto you be approved.
Deloitte AG
/s/ Martin Welser /s/ Matthias GschwendLicensed Audit Expert Licensed Audit ExpertAuditor in charge
Zurich, November 10, 2015
128

TE Connectivity Ltd.
Swiss Statutory Compensation Report
as of September 25, 2015
129

A General
Under the new Swiss ordinance against excessive pay in stock exchange listed companies (the‘‘Minder Ordinance’’) we are now required to prepare a separate Swiss Statutory Compensation Reporteach year that contains specific items in a presentation format determined by these regulations. Thisreport must be included in the materials made available to our shareholders each year.
Our executive management (as defined under Swiss law) consists of Thomas Lynch, Chairman andChief Executive Officer; Terrence Curtin, President; Joseph Donahue, Executive Vice President andChief Operating Officer; Robert Hau, Executive Vice President and Chief Financial Officer; John S.Jenkins, Jr., Executive Vice President and General Counsel; Jane Leipold, Senior Vice President,Global Human Resources; Steven Merkt, President, Transportation Solutions; James O’Toole, President,Communications Solutions; Kevin Rock, President, Industrial Solutions; Robert Shaddock, ExecutiveVice President and Chief Technology Officer; and Joan Wainwright, President, Channel and CustomerExperience.
The following sets forth the compensation for the years ended September 25, 2015 andSeptember 26, 2014, of the members of the Board of Directors and Executive Management for all ofthe functions that they have performed for TE Connectivity.
For more detailed information about compensation for our Board of Directors and ExecutiveManagement, please review our Definitive Proxy Statement for our 2016 Annual Meeting ofShareholders. You may access this report on the Investor Relations section of our website athttp://investors.te.com/financial-reports/annual-reports/default.aspx.
B. Compensation of the Board of Directors
Compensation paid during fiscal 2015 and 2014 to each director who is not our salaried employeeor an employee of our subsidiaries was based on the following fee structures:
Fee Structure Fee Structure EffectiveEffective March, through February,
2015(1) 2015(1)
Cash Equity Cash Equity
Annual retainer . . . . . . . . . . . . . . . . . . . . . . . . . . . . . . . . . . . . $90,000 $160,000 $ 90,000 $160,000Additional annual retainers:
Lead Director . . . . . . . . . . . . . . . . . . . . . . . . . . . . . . . . . . . . $30,000 $100,000 $ 60,000Audit Committee Chair . . . . . . . . . . . . . . . . . . . . . . . . . . . . . $25,000 $ 25,000Audit Committee Member . . . . . . . . . . . . . . . . . . . . . . . . . . . $10,000 $ 10,000Nominating, Governance & Compliance Committee Chair . . . . $15,000 $ 15,000Management, Development & Compensation Committee
Chair . . . . . . . . . . . . . . . . . . . . . . . . . . . . . . . . . . . . . . . . $20,000 $ 15,000
(1) The new fee structure became effective March, 2015. The table above reflects full year fee structure.
In addition to the compensation described above, our board governance principles encouragedirectors to attend certain continuing education courses that are related to their duties as directors, andprovide that we will reimburse the costs associated with attending one course every two years.TE Connectivity will also provide company matching gift contributions on behalf of certain directorsunder TE Connectivity’s matching gift program up to a maximum of $10,000 per year.
Our board members also receive non-compensatory reimbursement for expenses incurred inattending board and committee meetings or performing other services for us in their capacities asdirectors. Such expenses include food, lodging, and transportation. Directors who are employees of us
130

B. Compensation of the Board of Directors (Continued)
or our subsidiaries, including our current chairman of the board, do not receive any compensation fortheir services as directors.
Each non-employee director received the equity component of their compensation in the form of agrant of common shares of TE Connectivity Ltd., with the exception of Dr. Gromer, who received theequity component of his compensation in the form of deferred stock units (‘‘DSUs’’). Under currentU.S. tax law, our U.S.-based non-employee directors cannot defer any portion of their compensation,including DSUs, and therefore, they were issued common shares (which are immediately taxable) inlieu of DSUs. Because Dr. Gromer is a German citizen, he receives his equity compensation in theform of DSUs.
DSUs awarded to Dr. Gromer vested immediately upon grant, and will be paid in common shareswithin 30 days following termination (subject to the previously-existing option of deferring the payout).Dividend equivalents or additional DSUs are credited to a non-employee director’s DSU account whendividends or distributions are paid on our common shares.
The following table discloses the cash and equity awards paid to each of our non-employeedirectors during fiscal 2015 and 2014.
Table 1—(2015 Audited) (2014 Unaudited)
Fees Earnedor Paid in Stock All Other
Cash Awards Compensation TotalName Fiscal Year ($)(1) ($)(2) ($)(3) ($)
Pierre Brondeau . . . . . . . . . . . . . . . . . . . 2015 $120,417 $172,815 $25,135 $318,3672014 $100,000 $157,256 $22,895 $280,151
Juergen Gromer . . . . . . . . . . . . . . . . . . . 2015 $100,000 $172,815 $47,238 $320,0532014 $100,000 $157,256 $37,339 $294,595
William Jeffrey . . . . . . . . . . . . . . . . . . . . 2015 $ 90,000 $172,815 $ 0 $262,8152014 $ 90,000 $157,256 $ 1,000 $248,256
Yong Nam . . . . . . . . . . . . . . . . . . . . . . . . 2015 $ 90,000 $172,815 $ 0 $262,8152014 $ 90,000 $157,256 $ 3,450 $250,706
Daniel Phelan . . . . . . . . . . . . . . . . . . . . . 2015 $101,667 $172,815 $31,008 $305,4902014 $ 90,000 $157,256 $22,895 $270,151
Frederic Poses(5) . . . . . . . . . . . . . . . . . . . 2015 $ 85,417 $118,818 $ 7,932 $212,1672014 $205,000 $216,246 $24,468 $445,714
Lawrence Smith(6) . . . . . . . . . . . . . . . . . . 2015 $ 68,750 $172,815 $19,822 $261,3872014 $125,000 $157,256 $27,461 $309,717
Paula Sneed . . . . . . . . . . . . . . . . . . . . . . 2015 $ 90,000 $172,815 $28,595 $291,4102014 $ 90,000 $157,256 $25,810 $273,066
David Steiner . . . . . . . . . . . . . . . . . . . . . 2015 $100,417 $172,815 $25,135 $298,3672014 $105,000 $157,256 $22,895 $285,151
John Van Scoter . . . . . . . . . . . . . . . . . . . 2015 $ 90,000 $172,815 $ 9,091 $271,9062014 $ 90,000 $157,256 $ 8,388 $255,644
Laura Wright(4) . . . . . . . . . . . . . . . . . . . . 2015 $108,750 $172,815 $10,000 $291,5652014 $ 58,333 $ 96,089 $60,000 $214,422
(1) The amounts shown represent the amount of cash compensation earned in fiscal 2015 and 2014 for Board and committeeservices. Dr. Brondeau received additional fees for his work as lead independent director for fiscal year 2015 (startingMarch, 2015) and Mr. Poses received additional fees for his work as lead independent director for fiscal year 2014 andfiscal year 2015 until his retirement in March, 2015. Effective March, 2015 Dr. Brondeau, Mr. Phelan and Ms. Wright each
131

B. Compensation of the Board of Directors (Continued)
received additional fees for their roles as chairs of the nominating, governance and compliance committee, the managementdevelopment and compensation committee and the audit committee, respectively. Dr. Brondeau and Ms. Wright eachreceived an additional audit committee cash retainer for serving on the committee until March, 2015. Mr. Steiner receivedan additional audit committee cash retainer for serving on the committee for two months during quarter three, andMr. Gromer received an additional audit committee cash retainer for serving on the committee for fiscal 2015. For fiscal2014 Messrs. Poses, Smith, and Steiner each received additional fees for their roles as chair of the nominating, governanceand compliance committee, the management development and compensation committee, and the audit committeerespectively. Dr. Brondeau, Dr. Gromer, and Mr. Smith each received for the full year the additional audit committee cashretainer for serving on the committee. Ms. Wright received an additional audit committee cash retainer for serving on theaudit committee for the last month of quarter two and the last two full quarters of fiscal year 2014.
(2) On November 10, 2014, Dr. Brondeau, Dr. Jeffrey, Mr. Nam, Mr. Phelan, Mr. Smith, Ms. Sneed, Mr. Steiner, Mr. VanScoter and Ms. Wright each received a grant of 2,810 common shares. Dr. Gromer received an award of 2,810 DSUs. Indetermining the number of common shares and DSUs to be issued, we used the average daily closing price for the 20-dayperiod prior to the grant date ($56.94 per share), the same methodology used to determine employee equity awards. Thegrant date fair value of these awards, as shown above for fiscal year 2015, was calculated by using the closing price ofTE Connectivity Ltd. common shares on the date of grant ($61.50 per share). As of September 25, 2015, the aggregatenumber of DSUs outstanding for each non-employee director was as follows: Dr. Brondeau—12,334; Dr. Gromer—38,512;Mr. Phelan—12,334; Ms. Sneed—15,140; Mr. Steiner—12,334; Mr. Van Scoter—6,605. On November 14, 2013,Dr. Brondeau, Dr. Jeffrey, Mr. Nam, Mr. Phelan, Mr. Poses, Mr. Smith, Ms. Sneed, Mr. Steiner and Mr. Van Scoter eachreceived a grant of 3,047 common shares. Dr. Gromer received an award of 3,047 DSUs. Mr. Poses received an additional1,143 shares in equity compensation for serving as lead independent director for fiscal 2014. In fiscal 2014, in determiningthe number of common shares and DSUs to be issued, we used the average daily closing price for the 20 day period priorto the grant date ($52.51 per share), the same methodology used to determine employee equity awards. The grant date fairvalue of these awards, as shown above for fiscal 2014, was calculated by using the closing price of TE Connectivity Ltd.common shares on the date of grant ($51.61 per share). On March 5, 2014, Ms. Wright received a grant of 1,630 commonshares. In determining the number of common shares and DSUs to be issued, we used the average daily closing price forthe 20-day period prior to the grant date ($57.26 per share), the same methodology used to determine employee equityawards. The grant date fair value of these awards, as shown above for fiscal 2014, was calculated by using the closing priceof TE Connectivity Ltd. common shares on the date of grant ($58.95 per share). The common shares and DSUs vestedimmediately and non-employee directors receive dividend equivalents in connection with any DSU award granted to them.
(3) Amounts shown represent the value of dividend equivalent units earned on current and prior DSU awards calculated usingthe market value on the date of the dividend, company matching gift contributions made on behalf of certain directorsunder TE Connectivity’s matching gift program, and amounts reimbursed to Mr. Phelan in fiscal 2015 and Mr. Smith infiscal 2014 for expenses incurred when attending continuing education courses. The $47,238 and $37,339 amounts reportedin fiscal 2015 and 2014, respectively, for Dr. Gromer are the dividend equivalent unit amount earned on his DSU awards.The $60,000 amount reported for Ms. Wright in fiscal 2014 is for fees paid for consulting services performed prior to herbeing elected to the board.
(4) On March 4, 2014, Ms. Wright was elected to our Board of Directors. Cash compensation for Ms. Wright was pro-rated forher service during fiscal 2014
(5) On November 10, 2015, Mr. Poses received a fiscal 2015 stock award of 1,405 common shares and an additional 527common shares for serving as lead independent director and Mr. Poses retired from the Board effective March 3, 2015. Thenumber of common shares issued to Mr. Poses was determined in the same manner applied to all grants on November 10,2014 and reflects a pro-ration of his service during fiscal 2015. Cash compensation for Mr. Poses was pro-rated for hisservice during fiscal 2015.
(6) Cash compensation for Mr. Smith was pro-rated for his service during fiscal 2015.
c. Compensation of Executive Management
The following table presents information concerning Executive Management’s 2015 and 2014compensation.
132

c. Compensation of Executive Management (Continued)
Table 2—(2015 Audited) (2014 Unaudited)
Change inPension
Value andNonqualified
Non-Equity DeferredStock Option Incentive Plan Compensation All Other
Name and Principal Salary(3) Bonus Awards(4) Awards(5) Compensation(6) Earnings(7) Compensation(8) TotalPosition Year ($) ($) ($) ($) ($) ($) ($) ($)
Thomas J. Lynch, Chief . . 2015 $1,200,000 — $ 4,590,360 $4,682,416 $1,080,000 — $ 612,301 $12,165,077Executive Officer 2014 $1,172,308 — $ 3,685,986 $3,828,213 $2,512,800 — $ 417,675 $11,616,982
All Other ExecutiveManagement(1) . . . . . . 2015 $6,014,607 — $14,921,633 $9,549,126 $3,216,328 $ 90,816 $2,516,976 $36,309,486
2014(2) $5,599,496 — $ 7,494,805 $7,782,888 $5,930,442 $143,712 $2,821,372 $29,772,715
(1) The executive management team for Swiss reporting purposes includes Mr. Hau, Mr. Curtin, Mr. Donahue, Mr. Jenkins, Ms. Leipold,Mr. Merkt, Mr. O’Toole, Mr. Rock, Mr. Shaddock, Ms. Wainwright and Mr. Gambill until his last day of work in March, 2015.
(2) 2014 total compensation does not include Mr. Rock as he was not a member of the executive management team for Swiss reporting purposesin fiscal 2014.
(3) Amounts shown are not reduced to reflect the named executive officers’ elections, if any, to defer receipt of salary into the SSRP.
(4) This amount represents the grant date fair value of restricted stock units (RSUs) and performance stock units (PSUs) calculated using theprovisions of Accounting Standards Codification (‘‘ASC’’) 718, Compensation—Stock Compensation. The value of PSUs included in the tableassumes target performance. All dividend equivalent units earned on unvested RSUs and PSUs are reported in the All Other Compensationcolumn.
(5) This amount represents the grant date fair value of stock options calculated using the provisions of ASC 718.
(6) Represents amounts earned under the TE Connectivity Ltd. annual incentive program. Amounts shown are not reduced to reflect the namedexecutive officers’ elections, if any, to defer receipt of awards into the SSRP.
(7) Represents the aggregate change in actuarial present value of the accumulated benefits for four executives in 2015 and three executives in2014 under the frozen pension plan.
(8) See the All Other Compensation table below for a breakdown of amounts shown in column (i) which include perquisites, the company’s401(k) plan and nonqualified defined contribution plan, dividend equivalent units and other amounts. The amounts reflected in the table forperquisites are our incremental cost. We also provide group life, health, hospitalization and medical reimbursement plans which do notdiscriminate in scope, terms or operation in favor of officers and are available to all full-time employees; the values of the benefits are notshown in the table.
All Other Compensation
DollarValue of
Dividends Payment fornot factored unusedinto Grant Company ESPP vacation/ Total
Insurance Date Fair Contributions Company personal All OtherPerquisites(a) Premiums(b) Value(c) to DC plans(d) Match(e) time(f) Severance(g) Compensation
Name Year ($) ($) ($) ($) ($) ($) ($) ($)
Thomas J. Lynch . . . . . . 2015 $ 84,569 — $304,964 $222,768 — — — $ 612,3012014 $ 17,353 — $236,767 $163,555 — — — $ 417,675
All Other ExecutiveManagement . . . . . . . 2015 $ 576,830 $620 $710,646 $800,683 $1,950 $17,371 $408,876 $2,516,976
2014 $1,551,944 $568 $509,777 $735,948 $1,950 $21,185 — $2,821,372
(a) Perquisites consisting of the following:
• Amounts in fiscal 2015 for Mr. Lynch and five other executives reflect an attendance gift provided to all attendees at a certain businessmeeting. Amounts in fiscal 2015 and 2014 include the incremental cost to us of Mr. Lynch’s non-business use of our aircraft. Mr. Lynch ispermitted to use the corporate aircraft for business and non-business purposes. The incremental cost to us during fiscal year 2015 and2014 includes the direct variable cost and value of the lost corporate tax benefit associated with Mr. Lynch’s travel to attend ThermoFisher Scientific Inc. and Cummins Inc. board meetings, as Mr. Lynch is a member of the board of directors of both companies, andoccasional personal use. Amounts in fiscal 2015 also include the incremental cost to us of non-business travel after the conclusion of abusiness trip for two executives. Executive officers have limited access to the use of the corporate aircraft for non-business purposes.
• Amounts reflect a cash perquisite paid for the first two quarters of fiscal 2015 for one executive under the executive perquisites allowanceprogram which provides a cash allowance of 10% of base salary for executives whose employment is based in the United States.
133
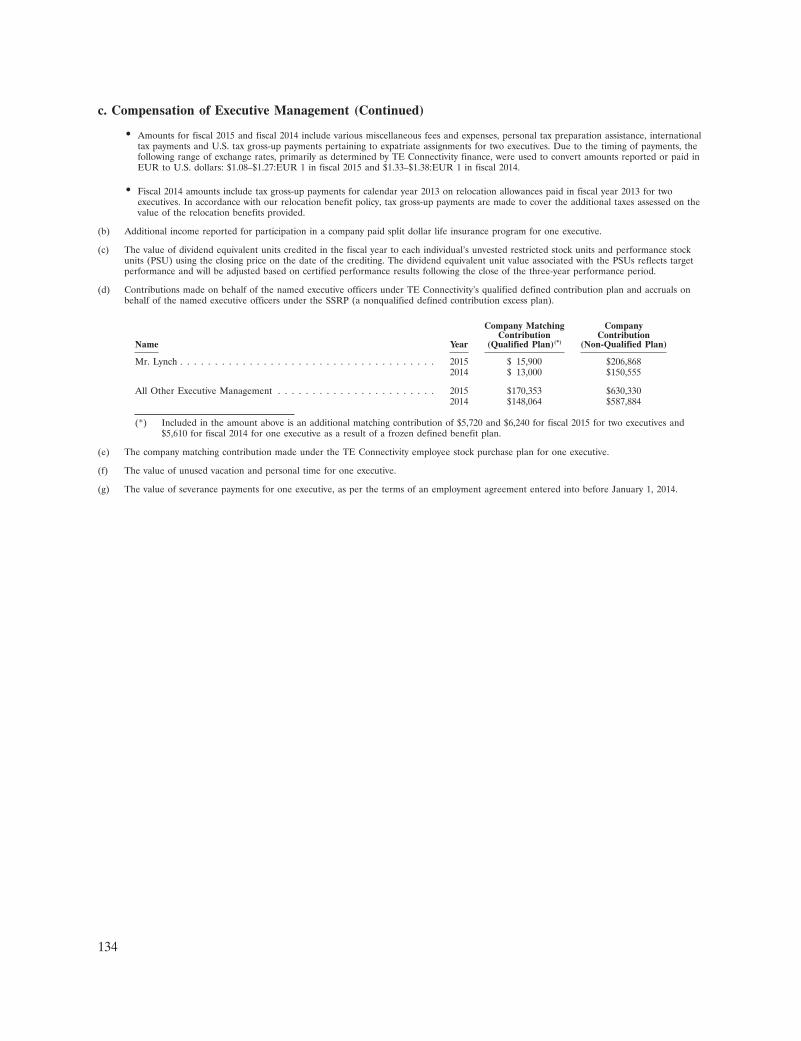
c. Compensation of Executive Management (Continued)
• Amounts for fiscal 2015 and fiscal 2014 include various miscellaneous fees and expenses, personal tax preparation assistance, internationaltax payments and U.S. tax gross-up payments pertaining to expatriate assignments for two executives. Due to the timing of payments, thefollowing range of exchange rates, primarily as determined by TE Connectivity finance, were used to convert amounts reported or paid inEUR to U.S. dollars: $1.08–$1.27:EUR 1 in fiscal 2015 and $1.33–$1.38:EUR 1 in fiscal 2014.
• Fiscal 2014 amounts include tax gross-up payments for calendar year 2013 on relocation allowances paid in fiscal year 2013 for twoexecutives. In accordance with our relocation benefit policy, tax gross-up payments are made to cover the additional taxes assessed on thevalue of the relocation benefits provided.
(b) Additional income reported for participation in a company paid split dollar life insurance program for one executive.
(c) The value of dividend equivalent units credited in the fiscal year to each individual’s unvested restricted stock units and performance stockunits (PSU) using the closing price on the date of the crediting. The dividend equivalent unit value associated with the PSUs reflects targetperformance and will be adjusted based on certified performance results following the close of the three-year performance period.
(d) Contributions made on behalf of the named executive officers under TE Connectivity’s qualified defined contribution plan and accruals onbehalf of the named executive officers under the SSRP (a nonqualified defined contribution excess plan).
Company Matching CompanyContribution Contribution
Name Year (Qualified Plan)(*) (Non-Qualified Plan)
Mr. Lynch . . . . . . . . . . . . . . . . . . . . . . . . . . . . . . . . . . . . . 2015 $ 15,900 $206,8682014 $ 13,000 $150,555
All Other Executive Management . . . . . . . . . . . . . . . . . . . . . . . 2015 $170,353 $630,3302014 $148,064 $587,884
(*) Included in the amount above is an additional matching contribution of $5,720 and $6,240 for fiscal 2015 for two executives and$5,610 for fiscal 2014 for one executive as a result of a frozen defined benefit plan.
(e) The company matching contribution made under the TE Connectivity employee stock purchase plan for one executive.
(f) The value of unused vacation and personal time for one executive.
(g) The value of severance payments for one executive, as per the terms of an employment agreement entered into before January 1, 2014.
134

REPORT OF THE STATUTORY AUDITOR ON THE SWISS STATUTORY COMPENSATIONREPORT OF TE CONNECTIVITY LTD.
To the General meeting ofTE CONNECTIVITY LTD., SCHAFFHAUSEN
We have audited Tables 1 and 2 within the accompanying compensation report of TEConnectivity Ltd. for the year ended September 25, 2015.
Board of Directors’ Responsibility
The Board of Directors is responsible for the preparation and overall fair presentation of thecompensation report in accordance with Swiss law and the Ordinance against Excessive Compensationin Stock Exchange Listed Companies (the ‘‘Ordinance’’). The Board of Directors is also responsible fordesigning the compensation system and defining individual compensation packages.
Auditor’s Responsibility
Our responsibility is to express an opinion on the accompanying compensation report. Weconducted our audit in accordance with Swiss Auditing Standards. Those standards require that wecomply with ethical requirements and plan and perform the audit to obtain reasonable assurance aboutwhether the compensation report complies with Swiss law and articles 14–16 of the Ordinance.
An audit involves performing procedures to obtain audit evidence on the disclosures made in thecompensation report with regard to compensation, loans and credits in accordance with articles 14–16of the Ordinance. The procedures selected depend on the auditor’s judgment, including the assessmentof the risks of material misstatements in the compensation report, whether due to fraud or error. Thisaudit also includes evaluating the reasonableness of the methods applied to value components ofremuneration, as well as assessing the overall presentation of the compensation report.
We believe that the audit evidence we have obtained is sufficient and appropriate to provide abasis for our opinion.
Opinion
In our opinion, the compensation report of TE Connectivity Ltd. for the year ended September 25,2015 complies with Swiss law and articles 14–16 of the Ordinance.
Deloitte AG
/s/ Martin Welser /s/ Matthias GschwendMartin Welser Matthias GschwendLicensed audit expert Licensed audit expertAuditor in charge
Zurich, December 18, 2015
135


BOARD OF DIRECTORS
LEADERSHIP TEAM AND OFFICERS
Thomas J. Lynch Chairman & Chief Executive Officer, TE Connectivity Ltd.
Dr. Pierre R. Brondeau* President, Chairman, & Chief Executive Officer, FMC Corporation
Dr. Juergen W. Gromer Retired President, Tyco Electronics
Dr. William A. JeffreyChief Executive Officer & President,SRI International
Yong NamAdvisor to the CEO,Daelim Industrial Co. Ltd.Former Chief Executive Officer,LG Electronics Inc.
Daniel J. Phelan Retired Chief of Staff, GlaxoSmithKline plc
Paula A. Sneed Chair & Chief Executive Officer, Phelps Prescott Group, LLCRetired Executive Vice President, Kraft Foods Inc.
David P. Steiner President, Chief Executive Officer, & Director, Waste Management, Inc.
John C. Van Scoter President, Chief Executive Officer, & Director, eSolar, Inc.
Laura H. Wright Founder,GSB AdvisorsRetired Chief Financial Officer,Southwest Airlines Co.
Thomas J. Lynch Chairman & Chief Executive Officer
Terrence R. CurtinPresident,TE Connectivity
Mario CalastriSenior Vice President,Treasurer
Que DallaraSenior Vice President,Corporate Strategy
Joseph B. DonahueExecutive Vice President,Chief Operating Officer
Joseph F. Eckroth, Jr.Senior Vice President,Chief Information Officer
Robert W. HauExecutive Vice President,Chief Financial Officer
John S. Jenkins, Jr.Executive Vice President,General Counsel
Jane A. LeipoldSenior Vice President,Global Human Resources
Steven T. Merkt President, Transportation Solutions
Minoru OkamotoSenior Advisor to the CEO
James O’ToolePresident, Communications Solutions
Robert J. OttSenior Vice President,Corporate Controller
Jeanne QuirkSenior Vice President,Mergers & Aquisitions
Eric J. ReschSenior Vice President,Chief Tax Officer
Kevin N. RockPresident,Industrial Solutions
Robert N. ShaddockExecutive Vice President,Chief Technology Officer
Amy B. ShahSenior Vice President,Chief Marketing Officer
Joan E. WainwrightPresident, Channel & Customer Experience
* Lead Independant Director of the TE Connectivity Ltd. Board of Directors

This document was printed using soy–based inks and paper containing 30% postconsumer
recycled fiber. The paper was produced by a Forest Stewardship Council® (FSC®) Chain of
Custody supplier. Printing was done according to ISO workflow procedures.
© 2016 TE Connectivity Ltd. All Rights Reserved.
001-AR-FY2015
TE Connectivity and TE Connectivity (logo) are trademarks. Other logos, product and/or
company names may be trademarks of TE Connectivity Ltd., its affiliates or unrelated parties.
CORPORATE DATA
REGISTERED & PRINCIPAL
EXECUTIVE OFFICE
TE Connectivity Ltd.
Rheinstrasse 20
CH-8200 Schaffhausen
Switzerland
+41.0.52.633.66.61
INDEPENDENT AUDITORS
Deloitte & Touche LLP
1700 Market Street
Philadelphia, PA 19103
Deloitte AG
General Guisan-Quai 38
CH-8022 Zurich
Switzerland
STOCK EXCHANGE
The company’s common shares are traded on
the New York Stock Exchange (NYSE) under
the ticker symbol TEL.
FORM 10-K
Copies of the company’s Annual Report on
Form 10-K for the fiscal year ended September
25, 2015 may be obtained by shareholders
without charge upon written request to
TE Connectivity Ltd., Rheinstrasse 20,
CH-8200 Schaffhausen, Switzerland.
The Annual Report on Form 10-K is also
available on the company’s website at
www.te.com
SHAREHOLDER SERVICES
Registered shareholders (shares held in your
own name with our transfer agent) with
requests such as change of address or dividend
checks should contact TE Connectivity’s
transfer agent at:
Wells Fargo Shareowner Services
1110 Centre Pointe Curve, Suite 101
Mendota Heights, MN 55120-4100
866.258.4745
www.shareowneronline.com
Beneficial shareholders (shares held with
a bank or broker) should contact the bank
or brokerage holding their shares with their
requests.
Other shareholder inquiries may be directed
to TE Connectivity Shareholder Services at the
company’s registered and principal executive
office above.
www.te.com