Embed Size (px)
Citation preview

EURASIP Journal on WirelessEURASIP Journal on WirelessCommunications and NetworkingCommunications and Networking
This Provisional PDF corresponds to the article as it appeared upon acceptance. Fully formattedPDF and full text (HTML) versions will be made available soon.
A femtocell location strategy for improving adaptive traffic sharing inheterogeneous LTE networks
EURASIP Journal on Wireless Communications and Networking Sample
doi:10.1186/s13638-015-0246-0
José María Ruiz Avilés ([email protected])Matías Toril ([email protected])
Salvador Luna-Ramírez ([email protected])
Sample
ISSN 1687-1499
Article type Research
Submission date 30 June 2014
Acceptance date 6 January 2015
Article URL http://dx.doi.org/10.1186/s13638-015-0246-0
This peer-reviewed article can be downloaded, printed and distributed freely for any purposes (seecopyright notice below).
For information about publishing your research in EURASIP Journal on Wireless Communications andNetworking go to
http://jwcn.eurasipjournals.com/authors/instructions/
For information about other SpringerOpen publications go to
http://www.springeropen.com
© 2015 Ruiz Avilés et al.; licensee Springer.This is an open access article distributed under the terms of the Creative Commons Attribution License (http://creativecommons.org/licenses/by/4.0), which
permits unrestricted use, distribution, and reproduction in any medium, provided the original work is properly credited.
(2015) 2015:38

A femtocell location strategy for improvingadaptive traffic sharing in heterogeneous LTEnetworks
José María Ruiz Avilés1∗,†
∗Corresponding authorEmail: [email protected]
Matías Toril1†
Email: [email protected]
Salvador Luna-Ramírez1†
Email: [email protected]
1Communications Engineering Department, University of Málaga, 29071, Málaga, Spain
† Equal contributors.
Abstract
Femtocells have been suggested as a promising solution for the provision of indoor coverageand capacity. In this paper, a new planning strategy for placing femtocell access points so asto make the most of automatic traffic sharing algorithms is proposed for a long-term evolution(LTE) heterogeneous network. The aim of the proposed method is to increase overlapping betweenfemtocells by increasing the percentage of area with low dominance of the serving femtocell. Methodassessment is carried out by simulating classical traffic sharing algorithms in a three-dimensionaloffice scenario with femtocell location plans designed based on different network performance criteria.Results show that location plans with a larger low dominance ratio achieve better network performanceafter sharing traffic than plans designed for maximum coverage or connection quality.
Keywords
Femtocell; Antenna; Placement; Overlapping
1 Introduction
Recent advances in radio access technologies have paved the way for mobile broadband services. Inparallel, operator revenues keep decreasing as a result of flat rate subscriptions. Thus, the successof future mobile communication systems will largely depend on their ability to provide an adequatequality of service at a lower cost per bit. In this context, a major challenge for cost-effectiveness inmobile networks is the provision of indoor coverage. Recent surveys have shown that more than 80% ofmobile traffic is originated at home or work, but nearly half of the houses and premises have poor indoorcoverage [1,2]. This problem was solved in the past by increasing the number of base stations, but suchan approach is not viable anymore due to lack of scalability.
Alternatively, massive femtocell deployment has been proposed to deal with indoor traffic [2].Femtocells supply indoor coverage following an easy-to-install paradigm with limited networkplanning (e.g., no site location or power planning) in contrast to macro/micro cellular network

deployments. However, such a limited planning is also a potential source of problems, namely, poorcoverage, poor signal quality, or traffic congestion [3,4]. In such a complex heterogeneous structure,self-organizing network (SON) [5] techniques must be used to solve these problems without humanintervention.
Mobility (or handover-based) load balancing has been identified as a relevant SON use case by theindustry [6,7] and standardization bodies [8]. Load balancing capability is included to deal with unevenand/or changing traffic distribution, which might cause network congestion problems. These congestionproblems are commonplace in femtocell networks due to a high user concentration and the lack ofa careful analysis of user trends. Therefore, improving load sharing capabilities is key to ensuringadequate performance in these heterogeneous scenarios.
In the literature, many advanced radio resource management (RRM) algorithms can be found forredistributing traffic between neighbor cells to solve localized congestion problems. Some of themreallocate users by changing antenna settings (e.g., remote electrical tilt [9]), while others adjust RRMparameters in traffic management schemes (e.g., cell re-selection offsets and/or handover (HO)margins [10]). Initial studies on load sharing are focused on macrocellular scenarios in different radioaccess technologies (e.g., time division multiple access/frequency division multiple access -TDMA/FDMA [10], wideband code division multiple access - WCDMA [11], and orthogonalfrequency division multiple access - OFDMA [12,13]). Recently, the analysis has been extended toheterogeneous office scenarios with open-access femtocells [14]. Results presented there showed thattraffic sharing in OFDMA femtocell networks is a challenging task due to the full frequency reusecurrently used by operators.
Any traffic sharing algorithm relies on the existence of some overlapping between adjacent cells. Thedegree of cell overlapping depends on propagation conditions and site locations. Thus, a good loadsharing capability in a heterogeneous network can be reached by a careful design of femtocell locationsthat ensures an appropriate overlapping between cells. However, femtocell locations are usuallydesigned for purposes other than maximizing load sharing capabilities. Several works have studied theimpact of site locations on cellular network performance in terms of coverage and/orsignal-to-interference plus noise ratio (SINR). Thus, many different methods have been proposed tofind the best location for macrocellular sites to improve network coverage, user connection quality,and/or network capacity [15-21]. Similar methods have been used for optimal location of wirelessaccess points (APs) in indoor environments [22-30]. All these approaches construct a system model,over which a classical optimization algorithm is applied to find the position of base stations thatmaximize some overall network performance indicator. However, to the authors’ knowledge, no studyhas evaluated the influence of positions of base stations on the effectiveness of traffic sharing schemes.In this paper, the problem of locating femtocell access points to aid automatic traffic sharing algorithmsin long-term evolution (LTE) is studied. A preliminary analysis, based on static system-levelsimulations, aims to find some basic rules to locate femtocells in an office building in terms of differentnetwork performance criteria. Unlike previous studies, cell overlapping is also considered as a designcriterion. Then, a comprehensive performance analysis of classical traffic sharing algorithms withdifferent femtocell locations is carried out in a dynamic system-level simulator. Such an analysis showsthe positive impact of increasing cell overlapping in traffic sharing in LTE.
1.1 Previous work
The antenna placement problem (APP) can be formulated as a discrete optimization problem, wherethe design variables are the (discrete) base station coordinates and the objective function may be anycombination of different overall network performance indicators. For computational reasons, thiscombinatorial optimization problem is often solved by heuristic approaches. Previous contributions can

be classified by the scenario under analysis, the design criteria for the site location, and the algorithmused to solve the optimization problem.
A first group of references try to find the best site locations in outdoor scenarios. Anderson et al. [15]use simulated annealing to solve the base station location problem in a TDMA/FDMA microcellenvironment, based on SINR and pathloss indicators. In [16], WCDMA site selection is formulated asan integer linear programming problem, which is solved by tabu search. In [17], the APP is formulatedso as to find the minimum number of antennas for a desired coverage level. In [18], several geneticalgorithms are proposed for the APP to maximize coverage in Global System for Mobilecommunication (GSM) while still satisfying a minimum SINR requirement. In [20] and [21], aperformance sensitivity analysis is carried out to investigate the impact of site location and antenna tiltangles on the pole capacity in a WCDMA network with uneven traffic distribution. In [19], tworandomized greedy procedures and a tabu search algorithm are proposed to solve the APP in order tojointly optimize installation costs, signal quality, and traffic coverage in WCDMA.
A second group of references apply the previous methods to indoor scenarios. In some of them, theAPP is formulated to minimize pathloss (or maximize coverage) and later solved by a general-purposeoptimization algorithm (e.g., genetic algorithm [22], direct search method [23], simulatedannealing [31], or heuristic algorithm [32]). Similarly to [17], [24] proposes a binary integerprogramming approach to find the minimum number of APs guaranteeing a minimum SINR in thescenario. In [25], a heuristic method is proposed to place APs in a WCDMA indoor scenario withconstraints on iplink (UL) and downlink (DL) SINR performance. All recent studies focus on SINRoptimization by different methods (e.g., brute force enumeration in WCDMA [33] and LTE [34],particle swarm in WCDMA [28], and reduction approximation in WCDMA [29]).
In [35], a method for femtocell base station placement is proposed to minimize transmit power ofmobile users. Alternatively, [36,37] propose methods to find the best Wi-Fi AP placement for optimallocalization of mobile users in indoor environments.
1.2 Contribution of this work
In most of the abovementioned references, the focus has been on the computational efficiency of themethod used to find the optimal locations of base stations. However, the properties of the site locationplan resulting from the optimization process have not been analyzed in detail. Thus, no basic ruleshave been proposed to build near-optimal solutions without the need for the optimization process inreal scenarios. Moreover, to the authors’ knowledge, no study has evaluated the impact of femtocellpositions on the performance of automatic traffic sharing algorithms in a heterogeneous LTE network.
The main contributions of this work are a) the definition of a network performance indicator to quantifycell overlapping, easy to measure and interpret, from which to estimate a priori the effectiveness oftraffic sharing in LTE femtocell scenarios, b) the identification of some basic rules for placing femtocellsin a building to maximize cell overlapping, or some other network performance indicator (e.g., coverageor connection quality), and c) a performance comparison of different femtocell placement strategies withclassical traffic sharing schemes in a heterogeneous LTE office scenario with congestion problems due touneven traffic distribution. Results prove the value of the proposed overlapping indicator and femtocelllocation technique, since the femtocell layout designed for maximizing that indicator boosts femtocelltraffic sharing capability and, as a consequence, network performance, even for slightly uneven spatialtraffic distributions. Also importantly, the analysis presented here explains why traffic sharing schemesmodifying both transmit power and HO margins outperform those that only change HO margins.
The rest of the paper is organized as follows. Section 2 formulates the different design criteria that

can be used for placing femtocells. Section 3 presents a preliminary analysis showing the propertiesof femtocell location plans constructed by solving the APP with different design criteria in an officebuilding. Section 4 outlines several classical traffic sharing schemes proposed in the literature. Section 5presents a comprehensive performance analysis of the traffic sharing schemes introduced in Section 4with the femtocell locations plans designed in Section 3. Finally, conclusions are presented in Section 6.
2 Formulation of design criteria for placing femtocells
In this work, four design criteria are used to select femtocells positions in the network planning stage. Afirst criterion is based on pathloss, as proposed in [22,23,31,32]. Two other criteria are based on SINRstatistics, taken from [24,25,28,29,33,34]. A fourth new criterion based on cell overlapping is proposedin this paper.
2.1 Minimum average pathloss
The average pathloss, PL, is used as a measure of network coverage obtained by a femtocell locationplan. Such an indicator is calculated by averaging the minimum pathloss provided by the servingfemtocell in each point of the scenario, as
PL = Avgj
(mini
(PL(i, j))) , (1)
where PL(i, j) is the pathloss (in dB) from femtocell i to point j in the scenario, which depends onfemtocell positions and propagation environment.
2.2 Maximum worst connection quality
The tenth percentile of the overall DL SINR distribution is used as a measure of network connectionquality problems with a femtocell location plan. Assuming that all cells have the same transmit powerand system bandwidth, and noise floor is negligible, the DL SINR for each point j in the scenario (indB) can be approximated as:
SINRDL(j) ' −PL(s(j), j) + 10 · log∑
∀i 6=s(j)
Pcol(s(j), i) · 10−
PL(i,j)10 , (2)
where s(j) is the serving cell in point j (i.e., that providing minimum pathloss) and Pcol(s(j), i) isthe probability that cell s(j) collides in the air interface with cell i. In most network planning tools,Pcol(s(j), i) is approximated by the estimated physical resource block (PRB) utilization ratio. Once theoverall SINR distribution is constructed by aggregating all points in the scenario, the tenth percentile ofDL SINR, L10%,DLSINR, is the SINR value exceeded by 90% of points in the scenario. Such a valuedepends on femtocell positions, propagation environment, and PRB utilization ratios.
2.3 Maximum average connection quality
The average DL SINR in the scenario, SINRDL, is used as a measure of average network connectionquality obtained by a femtocell location plan. Such an indicator is calculated by averaging the DLSINR value in all points in the scenario provided by (2), which is also given by femtocell positions,propagation environment and PRB utilization ratios.

2.4 Maximum cell overlapping
The size of low dominance areas is used to quantify the degree of cell overlapping with a femtocelllocation plan. A point j is in a low dominance area when:
mink
(PL(k, j)− PL(s(j), j)) ≤ ∆PL ∀ k 6= s(j) , (3)
where s(j) is the serving cell in point j and ∆PL is the low dominance threshold. Thus, cell overlappingis quantified by the low dominance ratio, LDR, defined as the share of points in low dominance areas. Inthis work, ∆PL = 3 dB. Maximum cell overlapping is obtained by maximizing low dominance ratios,which is only influenced by femtocell positions and propagation conditions.
3 Preliminary analysis of femtocell location strategies
The aim of this section is to build several femtocell location plans in a three-dimensional office scenariowith the design criteria described in the previous section. These location plans are used later in Section 5to check the impact of femtocell locations on traffic sharing algorithms. This preliminary analysis iscarried out in a static system-level simulator that computes pathloss, DL SINR, and low dominanceratios in a grid of points. For clarity, the analysis setup is described first, and the results are presentedlater.
3.1 Analysis setup
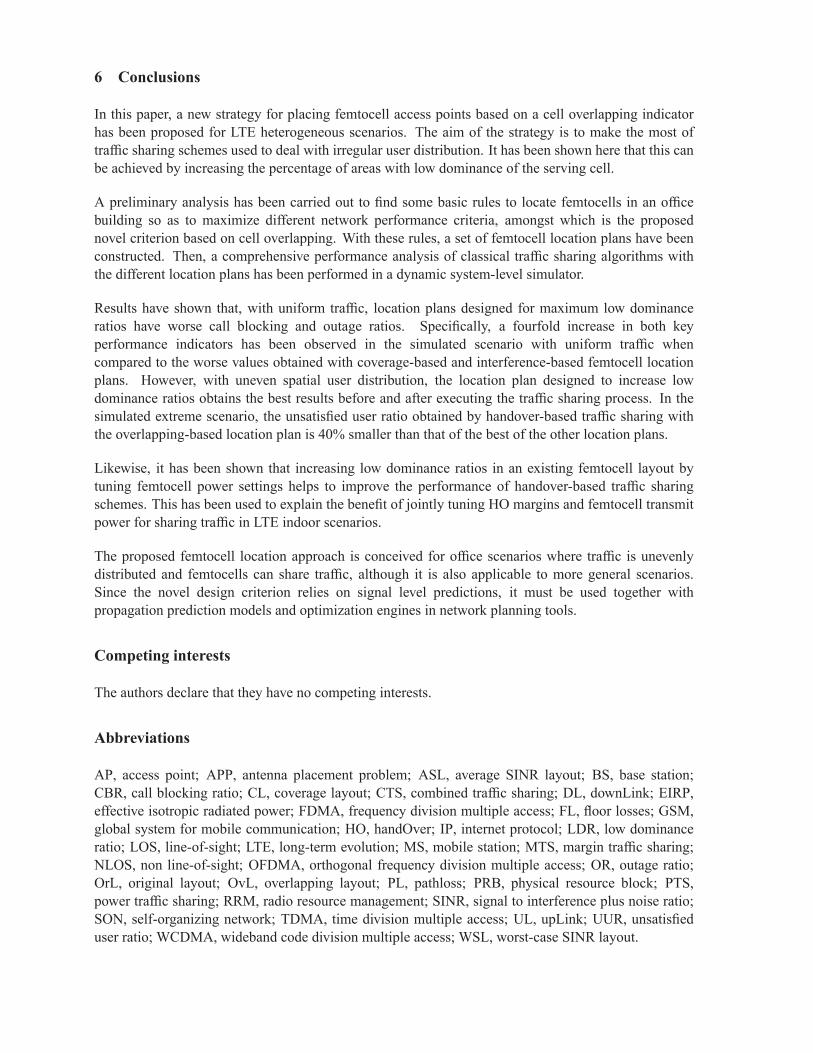
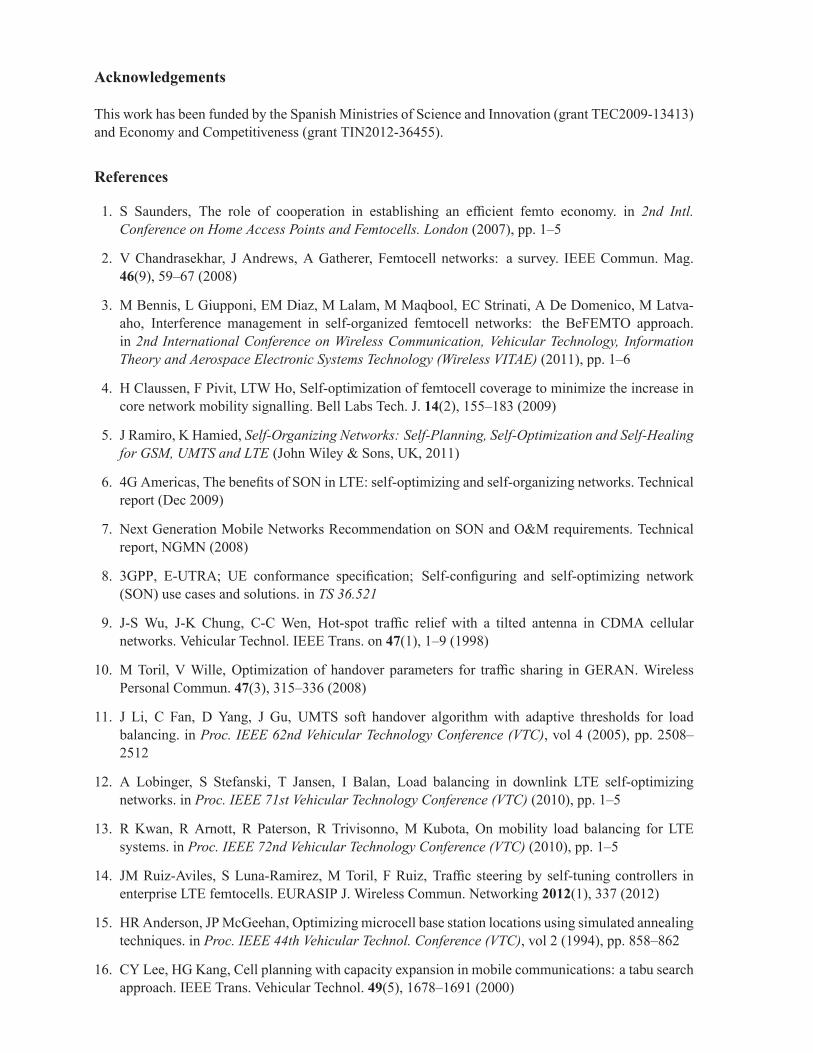
Figure 1 shows the layout of the considered heterogeneous scenario, which is the one presented in [14].The simulation scenario covers an area of 3 × 2.6 km served by three co-sited trisectorized macrocells(black hexagons). An office building (blue square) is included in one of the macrocells, 500 m awayfrom the macrocellular site. To avoid border effects, a wrap-around technique is used to create multiplereplicas of the main scenario (blue hexagons). The building consists of five floors of 50 × 50 m, eachwith four symmetrical offices. As a constraint of the femtocell location plan, 1 femtocell is included peroffice (i.e., 4 femtocells per floor, for a total of 20 femtocells in the building). Figure 2 shows the floorlayout. Lines in the figure represent walls. Blue circles reflect femtocell positions for a specific layoutused as benchmark (hereafter referred to as original layout, OrL). Other layouts may have differentfemtocell locations.
Figure 1 Layout of macrocell scenario.
Figure 2 Layout of one floor in the office building.
Propagation models in the scenario are those proposed in the WINNER II project [38]. Differentmodels are used depending on the transmitter and receiver environments, including indoor-indoor,indoor-outdoor, outdoor-indoor, and outdoor-outdoor cases and also depending on their line-of-sight(LOS) or non-LOS conditions. In all cases, PL is calculated as:
PL [dB] = A · log(d [m]) +B + C · log(f [GHz]/5) +X , (4)
where A, B, and C values depend on the propagation environment and X includes the attenuation effectof walls and diffraction. Table 1 details the WINNER II propagation models [38], where hBS and hMS
are macrocell and mobile station heights, respectively, FL is the attenuation due to propagation across
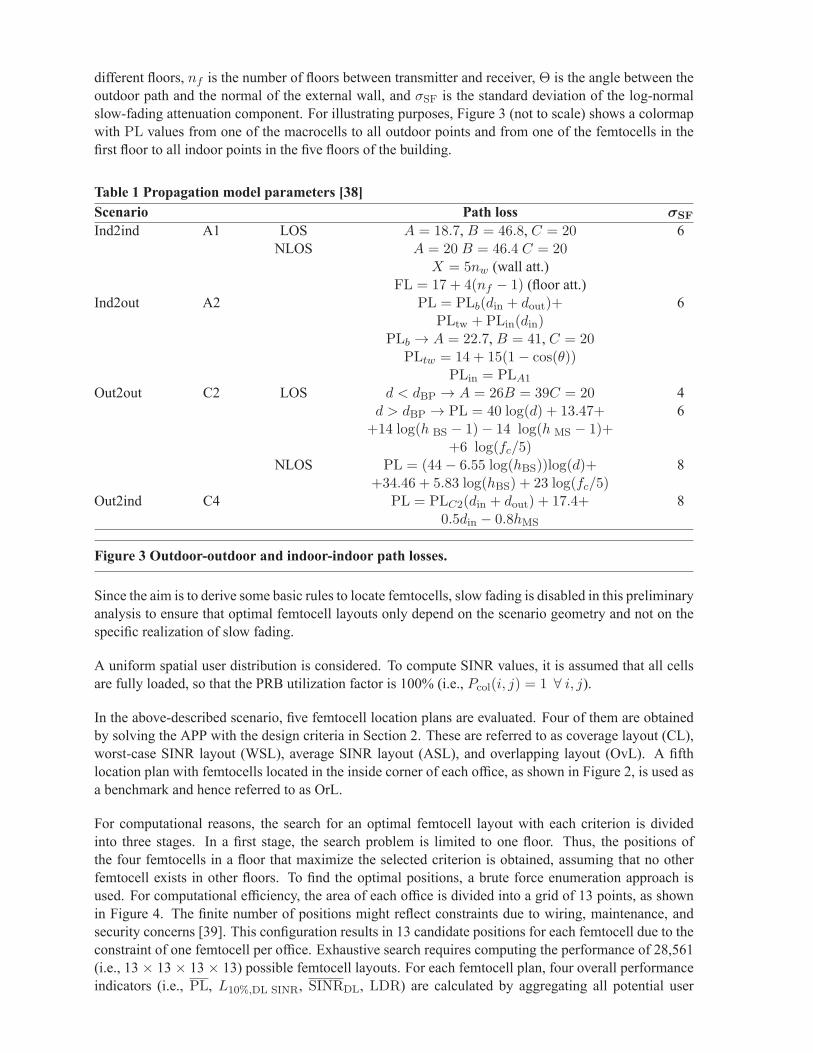
different floors, nf is the number of floors between transmitter and receiver, Θ is the angle between theoutdoor path and the normal of the external wall, and σSF is the standard deviation of the log-normalslow-fading attenuation component. For illustrating purposes, Figure 3 (not to scale) shows a colormapwith PL values from one of the macrocells to all outdoor points and from one of the femtocells in thefirst floor to all indoor points in the five floors of the building.
Table 1 Propagation model parameters [38]Scenario Path loss σSF
Ind2ind A1 LOS A = 18.7, B = 46.8, C = 20 6NLOS A = 20 B = 46.4 C = 20
X = 5nw (wall att.)FL = 17 + 4(nf − 1) (floor att.)
Ind2out A2 PL = PLb(din + dout)+ 6PLtw + PLin(din)
PLb → A = 22.7, B = 41, C = 20PLtw = 14 + 15(1− cos(θ))
PLin = PLA1
Out2out C2 LOS d < dBP → A = 26B = 39C = 20 4d > dBP → PL = 40 log(d) + 13.47+ 6
+14 log(h BS − 1)− 14 log(h MS − 1)++6 log(fc/5)
NLOS PL = (44− 6.55 log(hBS))log(d)+ 8+34.46 + 5.83 log(hBS) + 23 log(fc/5)
Out2ind C4 PL = PLC2(din + dout) + 17.4+ 80.5din − 0.8hMS
Figure 3 Outdoor-outdoor and indoor-indoor path losses.
Since the aim is to derive some basic rules to locate femtocells, slow fading is disabled in this preliminaryanalysis to ensure that optimal femtocell layouts only depend on the scenario geometry and not on thespecific realization of slow fading.
A uniform spatial user distribution is considered. To compute SINR values, it is assumed that all cellsare fully loaded, so that the PRB utilization factor is 100% (i.e., Pcol(i, j) = 1 ∀ i, j).
In the above-described scenario, five femtocell location plans are evaluated. Four of them are obtainedby solving the APP with the design criteria in Section 2. These are referred to as coverage layout (CL),worst-case SINR layout (WSL), average SINR layout (ASL), and overlapping layout (OvL). A fifthlocation plan with femtocells located in the inside corner of each office, as shown in Figure 2, is used asa benchmark and hence referred to as OrL.
For computational reasons, the search for an optimal femtocell layout with each criterion is dividedinto three stages. In a first stage, the search problem is limited to one floor. Thus, the positions ofthe four femtocells in a floor that maximize the selected criterion is obtained, assuming that no otherfemtocell exists in other floors. To find the optimal positions, a brute force enumeration approach isused. For computational efficiency, the area of each office is divided into a grid of 13 points, as shownin Figure 4. The finite number of positions might reflect constraints due to wiring, maintenance, andsecurity concerns [39]. This configuration results in 13 candidate positions for each femtocell due to theconstraint of one femtocell per office. Exhaustive search requires computing the performance of 28,561(i.e., 13 × 13 × 13 × 13) possible femtocell layouts. For each femtocell plan, four overall performanceindicators (i.e., PL, L10%,DL SINR, SINRDL, LDR) are calculated by aggregating all potential user

positions, defined by a regular grid of 50 × 50 points covering the four offices (offices 1 to 4) with 1 mresolution.
Figure 4 Floor layout and possible femtocell positions.
In a second stage, the analysis is extended to a second floor. For this purpose, a new floor with fournew offices (denoted as offices 5 to 8) is added on top of the original floor. The aims are a) to analyzethe impact of femtocells in an upper (lower) floor on femtocells in a lower (upper) floor and, moreimportantly, b) to check if the addition of femtocells in other floors modifies the optimal location patternfor a single floor. The inclusion of four new femtocells introduces 4 new degrees of freedom, eachwith 13 new possible positions (i.e., the number of possible combinations is now 138). To reduce thecomputational load, the size of the solution space is reduced by fixing the position of femtocells in oneof the floors (offices 1 to 4) to their positions in the optimal solution for one floor, so that only femtocellsin offices 5 to 8 can move. Thus, only 134 combinations have to be tested in this stage. The price to bepaid is the inability to find the optimal solution for two floors. Throughout this stage, the area whereperformance indicators are calculated covers the two floors (offices 1 to 8).
At this stage, some basic rules will have been defined to design femtocell layouts in simplified one-flooror two-floor scenarios. From this knowledge, in a third stage, the complete femtocell layout for theglobal scenario (i.e., five floors, four femtocells per floor) is constructed for each design criteria. Theperformance of each femtocell plan is evaluated considering all potential user positions in the building. Itshould be pointed out that, unlike the solutions obtained in one-floor or two-floor scenarios, the completelayouts are not the result of an optimization process. Thus, there is no guarantee that the completesolutions lead to the optimum of the selected design criteria. Note that finding the best position for 5× 4 = 20 femtocells requires evaluating the performance of 1320 location plans by computing the fourperformance indicators in all user locations in the building. Obviously, this is a very time-consumingtask. Moreover, it must also be taken into account for the design of the complete femtocell layout thatthe final solution should not favor any particular office at the expense of others, even if this improvesthe selected overall performance metric. Such a fairness constraint, added to the design criteria, is usedto discard unfair solutions. A posteriori, it is confirmed that, in spite of these two issues, the proposedsolutions ensure a very good value of the selected design criteria, which is enough for the assessment oftraffic sharing strategies.
3.2 Analysis results
Firstly, the structure of femtocell location plans obtained with different design criteria is analyzedqualitatively. Then, the performance of the different plans is compared quantitatively.
3.2.1 Coverage layout (CL)
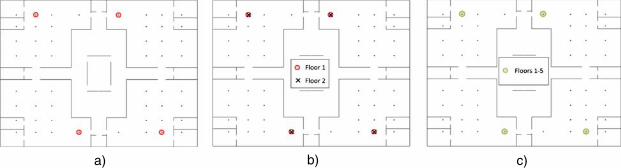
Figure 5a,b,c shows the femtocell layout that minimizes PL (i.e., CL) for one, two, and five floors,respectively. Figure 5a illustrates CL for one floor. It is shown that, to minimize average pathloss in asingle floor, femtocell APs (red circles) have to be placed in a centered position in each office. Figure 5bshows CL when two floors are analyzed. It is observed that the solution that minimizes pathloss for twofloors is exactly the same as that for one floor. This result is logical, since pathloss only depends on theserving cell, which hardly ever changes with new floors due to the large attenuation between floors (i.e.,FL = 17 dB in Table 1 [38]). Figure 5c presents CL for five floors, designed for minimizing PL in thewhole scenario, where femtocells are placed at the center of every office in all floors of the building.
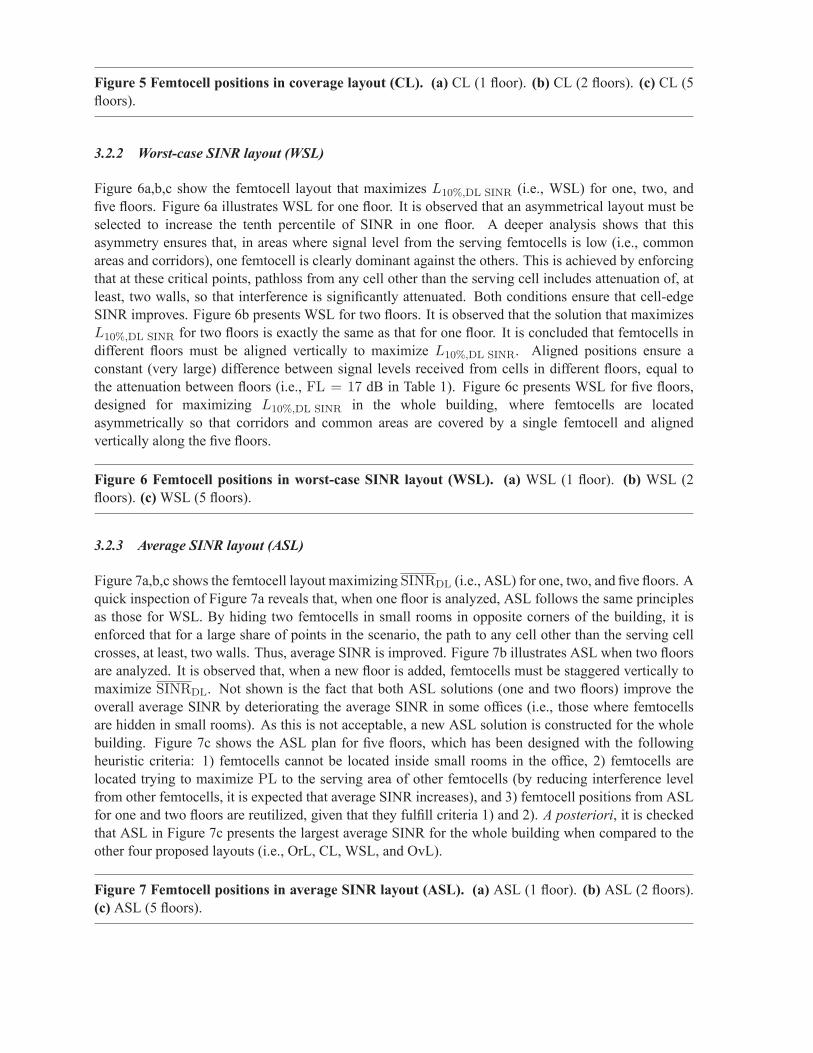
Figure 5 Femtocell positions in coverage layout (CL). (a) CL (1 floor). (b) CL (2 floors). (c) CL (5floors).
3.2.2 Worst-case SINR layout (WSL)
Figure 6a,b,c show the femtocell layout that maximizes L10%,DL SINR (i.e., WSL) for one, two, andfive floors. Figure 6a illustrates WSL for one floor. It is observed that an asymmetrical layout must beselected to increase the tenth percentile of SINR in one floor. A deeper analysis shows that thisasymmetry ensures that, in areas where signal level from the serving femtocells is low (i.e., commonareas and corridors), one femtocell is clearly dominant against the others. This is achieved by enforcingthat at these critical points, pathloss from any cell other than the serving cell includes attenuation of, atleast, two walls, so that interference is significantly attenuated. Both conditions ensure that cell-edgeSINR improves. Figure 6b presents WSL for two floors. It is observed that the solution that maximizesL10%,DL SINR for two floors is exactly the same as that for one floor. It is concluded that femtocells indifferent floors must be aligned vertically to maximize L10%,DL SINR. Aligned positions ensure aconstant (very large) difference between signal levels received from cells in different floors, equal tothe attenuation between floors (i.e., FL = 17 dB in Table 1). Figure 6c presents WSL for five floors,designed for maximizing L10%,DL SINR in the whole building, where femtocells are locatedasymmetrically so that corridors and common areas are covered by a single femtocell and alignedvertically along the five floors.
Figure 6 Femtocell positions in worst-case SINR layout (WSL). (a) WSL (1 floor). (b) WSL (2floors). (c) WSL (5 floors).
3.2.3 Average SINR layout (ASL)
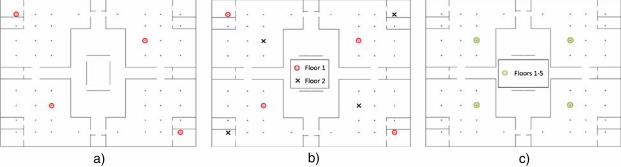
Figure 7a,b,c shows the femtocell layout maximizing SINRDL (i.e., ASL) for one, two, and five floors. Aquick inspection of Figure 7a reveals that, when one floor is analyzed, ASL follows the same principlesas those for WSL. By hiding two femtocells in small rooms in opposite corners of the building, it isenforced that for a large share of points in the scenario, the path to any cell other than the serving cellcrosses, at least, two walls. Thus, average SINR is improved. Figure 7b illustrates ASL when two floorsare analyzed. It is observed that, when a new floor is added, femtocells must be staggered vertically tomaximize SINRDL. Not shown is the fact that both ASL solutions (one and two floors) improve theoverall average SINR by deteriorating the average SINR in some offices (i.e., those where femtocellsare hidden in small rooms). As this is not acceptable, a new ASL solution is constructed for the wholebuilding. Figure 7c shows the ASL plan for five floors, which has been designed with the followingheuristic criteria: 1) femtocells cannot be located inside small rooms in the office, 2) femtocells arelocated trying to maximize PL to the serving area of other femtocells (by reducing interference levelfrom other femtocells, it is expected that average SINR increases), and 3) femtocell positions from ASLfor one and two floors are reutilized, given that they fulfill criteria 1) and 2). A posteriori, it is checkedthat ASL in Figure 7c presents the largest average SINR for the whole building when compared to theother four proposed layouts (i.e., OrL, CL, WSL, and OvL).
Figure 7 Femtocell positions in average SINR layout (ASL). (a) ASL (1 floor). (b) ASL (2 floors).(c) ASL (5 floors).
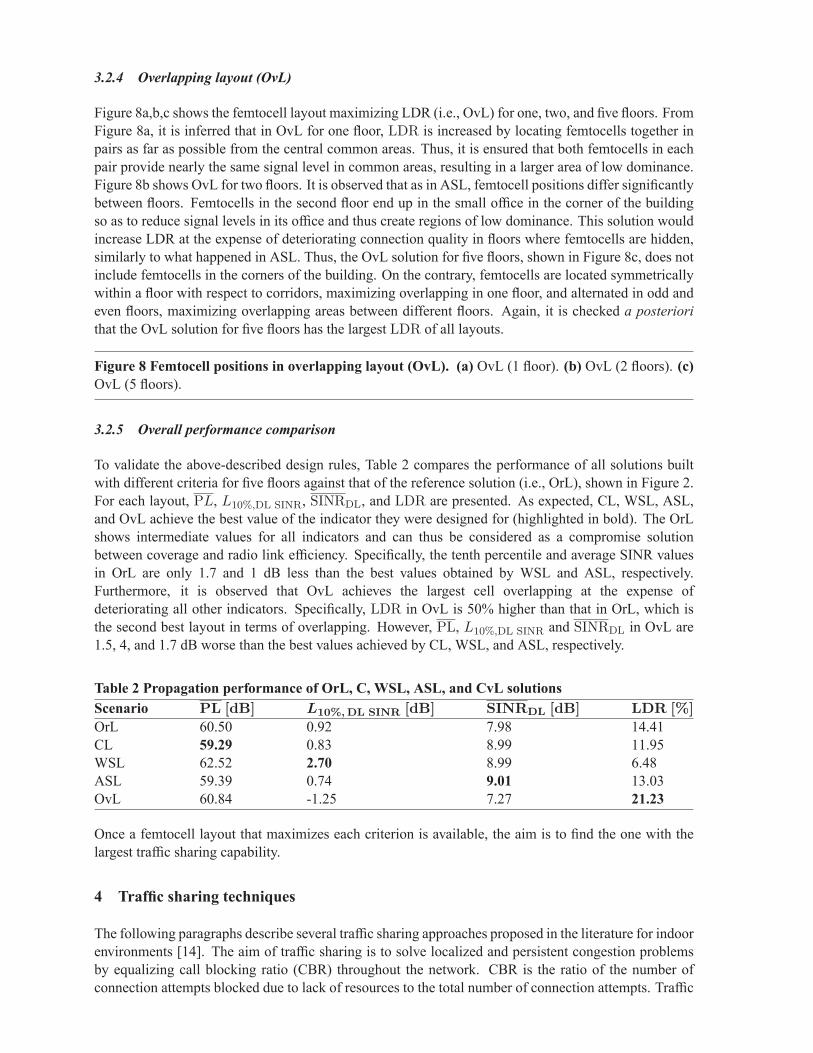
3.2.4 Overlapping layout (OvL)
Figure 8a,b,c shows the femtocell layout maximizing LDR (i.e., OvL) for one, two, and five floors. FromFigure 8a, it is inferred that in OvL for one floor, LDR is increased by locating femtocells together inpairs as far as possible from the central common areas. Thus, it is ensured that both femtocells in eachpair provide nearly the same signal level in common areas, resulting in a larger area of low dominance.Figure 8b shows OvL for two floors. It is observed that as in ASL, femtocell positions differ significantlybetween floors. Femtocells in the second floor end up in the small office in the corner of the buildingso as to reduce signal levels in its office and thus create regions of low dominance. This solution wouldincrease LDR at the expense of deteriorating connection quality in floors where femtocells are hidden,similarly to what happened in ASL. Thus, the OvL solution for five floors, shown in Figure 8c, does notinclude femtocells in the corners of the building. On the contrary, femtocells are located symmetricallywithin a floor with respect to corridors, maximizing overlapping in one floor, and alternated in odd andeven floors, maximizing overlapping areas between different floors. Again, it is checked a posteriorithat the OvL solution for five floors has the largest LDR of all layouts.
Figure 8 Femtocell positions in overlapping layout (OvL). (a) OvL (1 floor). (b) OvL (2 floors). (c)OvL (5 floors).
3.2.5 Overall performance comparison
To validate the above-described design rules, Table 2 compares the performance of all solutions builtwith different criteria for five floors against that of the reference solution (i.e., OrL), shown in Figure 2.For each layout, PL, L10%,DL SINR, SINRDL, and LDR are presented. As expected, CL, WSL, ASL,and OvL achieve the best value of the indicator they were designed for (highlighted in bold). The OrLshows intermediate values for all indicators and can thus be considered as a compromise solutionbetween coverage and radio link efficiency. Specifically, the tenth percentile and average SINR valuesin OrL are only 1.7 and 1 dB less than the best values obtained by WSL and ASL, respectively.Furthermore, it is observed that OvL achieves the largest cell overlapping at the expense ofdeteriorating all other indicators. Specifically, LDR in OvL is 50% higher than that in OrL, which isthe second best layout in terms of overlapping. However, PL, L10%,DL SINR and SINRDL in OvL are1.5, 4, and 1.7 dB worse than the best values achieved by CL, WSL, and ASL, respectively.
Table 2 Propagation performance of OrL, C, WSL, ASL, and CvL solutionsScenario PL [dB] L10%,DL SINR [dB] SINRDL [dB] LDR [%]
OrL 60.50 0.92 7.98 14.41CL 59.29 0.83 8.99 11.95WSL 62.52 2.70 8.99 6.48ASL 59.39 0.74 9.01 13.03OvL 60.84 -1.25 7.27 21.23
Once a femtocell layout that maximizes each criterion is available, the aim is to find the one with thelargest traffic sharing capability.
4 Traffic sharing techniques
The following paragraphs describe several traffic sharing approaches proposed in the literature for indoorenvironments [14]. The aim of traffic sharing is to solve localized and persistent congestion problemsby equalizing call blocking ratio (CBR) throughout the network. CBR is the ratio of the number ofconnection attempts blocked due to lack of resources to the total number of connection attempts. Traffic
sharing is performed by modifying cell service areas, which can be achieved by tuning two femtocellparameters: HO margin, MarginHO, which is defined on per-adjacency basis and femtocell transmitpower, PTX, which is defined on a per-cell basis.
Automatic adjustment (or self-tuning) of network parameters is often implemented as an iterativeprocess, where parameters are gradually changed with a certain period (referred to as optimizationloop) based on network performance statistics. Parameter changes continue until the difference in CBRbetween adjacent cells is negligible. Since the goal is to solve persistent congestion problems, and nottemporary fluctuations of traffic demand, input statistics are collected for a sufficiently long time period(e.g., 1 h). The traffic sharing approaches considered in this work are as follows [14]:
• Margin traffic sharing (MTS): HO margins are modified on a per-adjacency basis (i.e.,MarginHO(i, j)) with the aim of balancing CBR between adjacent cells i and j. Changes of thesame amplitude and opposite signs are performed in margins of both directions of the adjacencyto maintain cell overlapping, i.e.:
MarginHO(i, j) +MarginHO(j, i) = Hyst , (5)
where Hyst is a constant defining the hysteresis value. In this work, Hyst = 6 dB and the defaultvalue of MarginHO(i, j) is 3 dB. Margins are restricted to a limited interval between -7 and 13dB to avoid connection quality problems [14].
• Power traffic sharing (PTS): Femtocell transmit power is modified on a per-cell basis (i.e.,PTX(i)) with the aim of balancing CBR of cell i compared to the average CBR of its neighbors.A femtocell decreases (increases) power if its CBR is larger (smaller) than that of its neighbors.It is assumed that both data and pilot power are jointly tuned. Thus, traffic steering is effectivenot only for connected users but also for idle users, since it has an impact on both cell reselectionand HO processes.
• Combined traffic sharing (CTS): CTS modifies both PTX and MarginHO parameters. Byalternating both changes, the limits inherent to individual approaches (i.e., MTS and PTS) areovercome. First, MarginHO settings are modified while PTX settings remain unchanged. Onlywhen all MarginHO(i, j) values in cell i have reached their limits, PTX(i) is modified. As aresult, traffic sharing in cell i is achieved with minimal deviation of transmit power from defaultvalues (and, hence, minimal impact on network coverage) [14].
5 Analysis of traffic sharing schemes for different femtocell location plans
In Section 3, multiple femtocell layouts for a building in an LTE heterogeneous network have beenpresented. Each layout is designed to maximize some coverage, interference, or overlapping indicator.In this section, those layouts are tested in a dynamic system-level simulator implementing a highlyloaded and extremely unbalanced indoor scenario, where traffic sharing must be carried out. The aimof the analysis is to find the layout with the best network performance after traffic sharing. For clarity,simulation setup is first discussed and results are presented later.
5.1 Simulation setup
The heterogeneous network scenario described in Section 3 has been included in a dynamic LTE system-level simulator [40]. Table 3 shows the main simulation features and parameters. A regular spatial userdistribution is considered in macrocells, whereas user distribution inside the building may be eitherregular or irregular. In the latter case, severe congestion problems occur in some femtocells without

traffic sharing. A random way point mobility model is used for indoor users. Changes of floor are notconsidered. For simplicity, voice-over-IP service is simulated.
Table 3 Simulation parametersSimulation parameters and features
Time resolution 100 msPropagation models Indoor-indoor Winner II A1
Indoor-outdoor Winner II A2Outdoor-outdoor Winner II C2Outdoor-indoor Winner II C4
BS model EIRP BSfemto = 13 dBmBSmacro = 43 dBm
Directivity femto: omnidirectionalmacro: tri-sectorial
Access macro/femto: open accessMS model Noise figure 9 dB
Noise spectral density -174 dBm/HzTraffic model Arrival process Poisson
(avg. 0.42calls / (user×hour))
Call duration exponential (avg. 180 s)Mobility model Outdoor 3 km/h, random direction and
wrap-aroundIndoor Random waypoint
Service model Voice over IP 16 kbpsRRM model 6 PRBs (1.4 MHz)
Cell reselection C1-C2Access control Directed retry
Handover Power budgetScheduler: Time: round-robin
Frequency: best channel
Two experiments are carried out. In a first experiment, all femtocell layouts (OrL, CL, WSL, ASL,and OvL) are tested with a uniform user spatial distribution. The aim is to evaluate the performanceof femtocell layouts in an interference-limited indoor scenario under uniform traffic distribution. Forthis purpose, user population is configured so that average PRB utilization ratio is 50% in all cells. Dueto the uniform user distribution, there is no point in sharing traffic between femtocells, and only oneoptimization loop is simulated.
In a second experiment, an extremely uneven user spatial distribution is configured in the scenario. Thedistribution is designed to model a worst-case scenario, where: a) most users are located in one office,causing severe congestion problems in the corresponding femtocell (and hence the need for sharingtraffic with other cells) and b) the remaining users are concentrated on adjacent femtocells, either onthe same floor or in the upper/lower floor, which makes traffic sharing more difficult and increasesinterference levels. Specifically, 87% of users start their connections in one office of the middle floor,12% in other offices of the middle floor and the other 1% are distributed in other floors. With thisuneven user spatial distribution, PRB utilization varies from less than 1% (femtocells of floors 1 and 5)up to 85% (femtocell in office 3, floor 3) with the default network parameter settings. Traffic sharingis therefore needed to reduce congestion in overloaded femtocells. To check the impact of femtocellpositions on traffic sharing, 25 optimization loops of MTS are simulated with each femtocell layout.

Having identified in previous experiments that cell overlapping improves traffic sharing, in a thirdexperiment, it is shown that cell overlapping of an existing femtocell layout can be modified in theoperational stage by changing network parameters. Note that an already existing layout might have notbeen designed with the overlapping criterion, and thus, any traffic sharing technique increasing celloverlapping is of interest. MTS does not modify cell overlapping, and it is therefore limited by thequality of the femtocell location plan. In contrast, PTS dynamically changes femtocell transmit power,which has an impact on the overlapping between femtocells and, consequently, on traffic sharing. Forthis purpose, 50 loops of CTS (i.e., combination of MTS and PTS) are simulated in the reference layout(i.e., OrL, which is not designed for maximum overlapping) with the uneven user distribution.
Two key performance indicators are used to assess femtocell layouts and traffic sharing schemes: a)CBR, as a measure of network capacity and b) outage ratio, OR, defined as the ratio of unservedconnection time due to temporary lack of resources or bad SINR of users, as a measure of networkconnection quality. For ease of analysis, CBR and OR are aggregated into a single figure of merit, theunsatisfied user ratio, UUR, computed as UUR = CBR + OR · (1 − CBR). All these indicators arecollected in each optimization loop, consisting of 1 h of network time. Also for simplicity, dropped callsare disabled in the simulation.
5.2 Simulation results
Table 4 shows the values of CBR, OR, and UUR obtained by different femtocell location plans withuniform traffic distribution. In the last column, it is observed that the lowest values of UUR areobtained for the reference solution (OrL) and the coverage-based solution (CL). As observed in thesecond column, this is mainly due to their lowest OR. WSL and ASL perform slightly worse in thesenetwork conditions. Finally, OvL is the worst layout in terms of CBR, OR, and UUR. This is due tothe fact that increasing cell overlapping leads to a higher inter-cell interference level, which degradesconnection quality and increases radio resource utilization due to adaptive modulation and codingschemes in LTE. It can thus be concluded that, when user distribution is uniform, a femtocell layoutdesigned for maximizing cell overlapping is worse than layouts designed for better coverage or SINR.
Table 4 Network performance with uniform traffic distributionScenario CBR [%] OR [%] UUR [%]
OrL 0.08 0.41 0.49CL (minimum pathloss) 0.02 0.49 0.51WSL (maximum 10th percentile of SINR) 0.13 0.67 0.79ASL (maximum SINR average) 0.04 0.68 0.72OvL (maximum overlapping) 0.44 2.32 2.74
Network performance changes dramatically with uneven traffic distribution. Table 5 presents UURvalues obtained by MTS for the different femtocell layouts. Note that all traffic sharing schemes aresequential processes, starting with an initial network configuration, which is later modified untilequilibrium is reached. Table 5 details the UUR after the first simulation loop (i.e., before changingHO margins), UUR(1), and UUR at the end of the traffic sharing process (i.e., after 25 optimizationloops), UUR(25). For clarity, a third column shows the relative UUR improvement, UURimpr, defined
as UURimpr =UUR(1)−UUR(25)
UUR(1) .
By comparing the values in the second column, which show UUR with the default HO margin settings,it is observed that, unlike the first experiment, OvL achieves the best network performance even whentraffic sharing has not started. Specifically, UUR(1) = 14% for OvL, whereas UUR(1) = 15.55% forthe best of the other methods (i.e., OrL). More importantly, MTS provides the best results for OvL at the

Table 5 Performance of margin traffic sharing with uneven traffic distributionScenario UUR(1) [%] UUR(25) [%] UURimpr [%]
OrL 17.20 12.30 28.48CL (minimum pathloss) 15.55 10.55 32.14WSL (maximum 10th-percentile of SINR) 18.18 12.86 29.27ASL (maximum SINR average) 17.68 12.45 29.54OvL (maximum overlapping) 14.00 5.67 59.49
end of the tuning process. Specifically, UUR(25) = 5.67% for OvL, which is nearly half that achievedby MTS in the best of other layouts (i.e., 10.55% for CL). From these results, it can be concludedthat, even if OvL performs slightly worse than the other layouts for a uniform traffic distribution, OvLperforms significantly better than the other layouts with uneven traffic distribution.
Results presented so far are obtained for an extremely uneven spatial user distribution. An importantissue is whether OvL also outperforms the other techniques for less uneven distributions. A simulationcampaign has been run for the same scenario and different spatial user distributions according to anon-uniformity parameter, x. For x = 0 , the spatial user distribution is the regular one used in thefirst experiment. For x = 1, the spatial user distribution is the extreme one simulated in the secondexperiment. For other values of x, the number of users in each office is a weighted average between thevalues in the regular and extremely irregular distributions. Results (not shown here for brevity) provethat OvL is the best technique for x ≥ 0.2. It can thus be concluded that OvL has the best results evenfor slightly uneven distributions.
Having identified that cell overlapping is a desirable property in indoor scenarios with congestionproblems, it makes sense to investigate other traffic sharing strategies that increase cell overlapping inan already existing femtocell layout. Again, recall that MTS does not change cell overlapping. Incontrast, PTS (and CTS) modifies coverage areas by changing PTX values, which has an impact on celloverlapping that could overcome the limitations of an existing femtocell layout. At the same time, PTSchanges cell service areas, sending users from congested cells (whose power is increased) to emptycells (whose power is decreased).
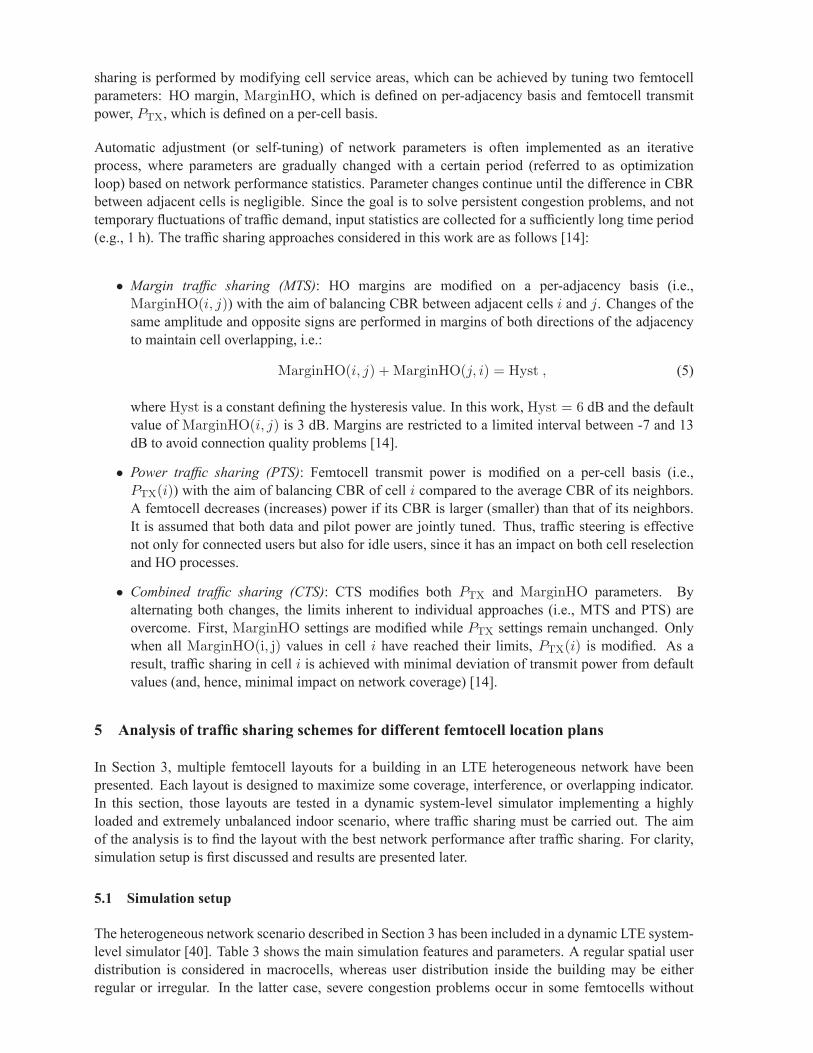
To check the capability of PTS to improve traffic sharing by increasing cell overlapping, CTS issimulated in the reference layout (OrL, not designed for maximum overlapping) with the same uneventraffic distribution. Figure 9 compares the evolution of UUR and LDR across iterations with MTS andCTS for the most loaded femtocell in the scenario (i.e., office 3 in the third floor). For comparisonpurposes, the evolution of UUR in 25 loops of MTS is superimposed. It is observed that MTSstagnates after the fifth loop, when UUR(5) = 12%. A closer analysis (not included here) shows thatMTS stops after all users in overlapping areas have been sent to neighbor cells. With MTS, overlappingareas are small, which can be inferred from its low value of LDR (i.e., LDR = 5% for MTS in alliterations). This is the reason why MTS has limited traffic sharing capability with the reference layout.In contrast, CTS (i.e., the combination of MTS and PTS) decreases UUR from 17.2% up to 8%. InCTS, changes of femtocell transmit power performed by PTS (loops 5, 6, 7, and 27) cause that LDRincreases in this scenario. Specifically, LDR increases from 5% up to 57% with CTS. Thus, PTScreates new overlapping areas in the reference layout where traffic can be shared between neighborcells. Thus, the ability of MTS to steer traffic is enhanced by PTS in CTS. A deeper analysis provesthat abrupt changes in LDR coincide with changes in PTX.
Figure 9 UUR and LDR for MTS and CTS techniques.
6 Conclusions
In this paper, a new strategy for placing femtocell access points based on a cell overlapping indicatorhas been proposed for LTE heterogeneous scenarios. The aim of the strategy is to make the most oftraffic sharing schemes used to deal with irregular user distribution. It has been shown here that this canbe achieved by increasing the percentage of areas with low dominance of the serving cell.
A preliminary analysis has been carried out to find some basic rules to locate femtocells in an officebuilding so as to maximize different network performance criteria, amongst which is the proposednovel criterion based on cell overlapping. With these rules, a set of femtocell location plans have beenconstructed. Then, a comprehensive performance analysis of classical traffic sharing algorithms withthe different location plans has been performed in a dynamic system-level simulator.
Results have shown that, with uniform traffic, location plans designed for maximum low dominanceratios have worse call blocking and outage ratios. Specifically, a fourfold increase in both keyperformance indicators has been observed in the simulated scenario with uniform traffic whencompared to the worse values obtained with coverage-based and interference-based femtocell locationplans. However, with uneven spatial user distribution, the location plan designed to increase lowdominance ratios obtains the best results before and after executing the traffic sharing process. In thesimulated extreme scenario, the unsatisfied user ratio obtained by handover-based traffic sharing withthe overlapping-based location plan is 40% smaller than that of the best of the other location plans.
Likewise, it has been shown that increasing low dominance ratios in an existing femtocell layout bytuning femtocell power settings helps to improve the performance of handover-based traffic sharingschemes. This has been used to explain the benefit of jointly tuning HO margins and femtocell transmitpower for sharing traffic in LTE indoor scenarios.
The proposed femtocell location approach is conceived for office scenarios where traffic is unevenlydistributed and femtocells can share traffic, although it is also applicable to more general scenarios.Since the novel design criterion relies on signal level predictions, it must be used together withpropagation prediction models and optimization engines in network planning tools.
Competing interests
The authors declare that they have no competing interests.
Abbreviations
AP, access point; APP, antenna placement problem; ASL, average SINR layout; BS, base station;CBR, call blocking ratio; CL, coverage layout; CTS, combined traffic sharing; DL, downLink; EIRP,effective isotropic radiated power; FDMA, frequency division multiple access; FL, floor losses; GSM,global system for mobile communication; HO, handOver; IP, internet protocol; LDR, low dominanceratio; LOS, line-of-sight; LTE, long-term evolution; MS, mobile station; MTS, margin traffic sharing;NLOS, non line-of-sight; OFDMA, orthogonal frequency division multiple access; OR, outage ratio;OrL, original layout; OvL, overlapping layout; PL, pathloss; PRB, physical resource block; PTS,power traffic sharing; RRM, radio resource management; SINR, signal to interference plus noise ratio;SON, self-organizing network; TDMA, time division multiple access; UL, upLink; UUR, unsatisfieduser ratio; WCDMA, wideband code division multiple access; WSL, worst-case SINR layout.
Acknowledgements
This work has been funded by the Spanish Ministries of Science and Innovation (grant TEC2009-13413)and Economy and Competitiveness (grant TIN2012-36455).
References
1. S Saunders, The role of cooperation in establishing an efficient femto economy. in 2nd Intl.Conference on Home Access Points and Femtocells. London (2007), pp. 1–5
2. V Chandrasekhar, J Andrews, A Gatherer, Femtocell networks: a survey. IEEE Commun. Mag.46(9), 59–67 (2008)
3. M Bennis, L Giupponi, EM Diaz, M Lalam, M Maqbool, EC Strinati, A De Domenico, M Latva-aho, Interference management in self-organized femtocell networks: the BeFEMTO approach.in 2nd International Conference on Wireless Communication, Vehicular Technology, InformationTheory and Aerospace Electronic Systems Technology (Wireless VITAE) (2011), pp. 1–6
4. H Claussen, F Pivit, LTW Ho, Self-optimization of femtocell coverage to minimize the increase incore network mobility signalling. Bell Labs Tech. J. 14(2), 155–183 (2009)
5. J Ramiro, K Hamied, Self-Organizing Networks: Self-Planning, Self-Optimization and Self-Healingfor GSM, UMTS and LTE (John Wiley & Sons, UK, 2011)
6. 4G Americas, The benefits of SON in LTE: self-optimizing and self-organizing networks. Technicalreport (Dec 2009)
7. Next Generation Mobile Networks Recommendation on SON and O&M requirements. Technicalreport, NGMN (2008)
8. 3GPP, E-UTRA; UE conformance specification; Self-configuring and self-optimizing network(SON) use cases and solutions. in TS 36.521
9. J-S Wu, J-K Chung, C-C Wen, Hot-spot traffic relief with a tilted antenna in CDMA cellularnetworks. Vehicular Technol. IEEE Trans. on 47(1), 1–9 (1998)
10. M Toril, V Wille, Optimization of handover parameters for traffic sharing in GERAN. WirelessPersonal Commun. 47(3), 315–336 (2008)
11. J Li, C Fan, D Yang, J Gu, UMTS soft handover algorithm with adaptive thresholds for loadbalancing. in Proc. IEEE 62nd Vehicular Technology Conference (VTC), vol 4 (2005), pp. 2508–2512
12. A Lobinger, S Stefanski, T Jansen, I Balan, Load balancing in downlink LTE self-optimizingnetworks. in Proc. IEEE 71st Vehicular Technology Conference (VTC) (2010), pp. 1–5
13. R Kwan, R Arnott, R Paterson, R Trivisonno, M Kubota, On mobility load balancing for LTEsystems. in Proc. IEEE 72nd Vehicular Technology Conference (VTC) (2010), pp. 1–5
14. JM Ruiz-Aviles, S Luna-Ramirez, M Toril, F Ruiz, Traffic steering by self-tuning controllers inenterprise LTE femtocells. EURASIP J. Wireless Commun. Networking 2012(1), 337 (2012)
15. HR Anderson, JP McGeehan, Optimizing microcell base station locations using simulated annealingtechniques. in Proc. IEEE 44th Vehicular Technol. Conference (VTC), vol 2 (1994), pp. 858–862
16. CY Lee, HG Kang, Cell planning with capacity expansion in mobile communications: a tabu searchapproach. IEEE Trans. Vehicular Technol. 49(5), 1678–1691 (2000)

17. AJ Nebro, F Chicano, F Luna, Optimal antenna placement using a new multi-objective CHCalgorithm. in Numerical Methods and Applications: 6th International Conference (2007)
18. L Raisanen, R Whitaker, Comparison and evaluation of multiple objective genetic algorithms forthe antenna placement problem. Mobile Networks App. 10(1-2), 79–88 (2005)
19. E Amaldi, A Capone, F Malucelli, Planning UMTS base station location: optimization models withpower control and algorithms. IEEE Trans. Wireless Commun. 2(5), 939–952 (2003)
20. MJ Nawrocki, TW Wieckowski, Optimal site and antenna location for UMTS output results of 3Gnetwork simulation software. in 14th International Conference on Microwaves, Radar and WirelessCommunications., vol 3 (2002), pp. 890–893
21. J Niemelä, J Lempiäinen, Impact of base station locations and antenna orientations on UMTS radionetwork capacity and coverage evolution. in IEEE 6th Int. Symp. on Wireless Personal MultimediaCommunications Conf., Yokosuka, vol 2 (2003), pp. 82–86
22. L Nagy, L Farkas, Indoor base station location optimization using genetic algorithms. in The 11thIEEE International Symposium on Personal, Indoor and Mobile Radio Communications, vol 2(2000), pp. 843–846
23. Z Ji, TK Sarkar, B-H Li, Methods for optimizing the location of base stations for indoor wirelesscommunications. IEEE Trans. Antennas Propagation 50(10), 1481–1483 (2002)
24. JKL Wong, AJ Mason, MJ Neve, KW Sowerby, Base station placement in indoor wireless systemsusing binary integer programming. IEE Proc. Commun. 153(5), 771–778 (2006)
25. Y Ngadiman, YH Chew, BS Yeo, A new approach for finding optimal base stations configurationfor CDMA systems jointly with uplink and downlink constraints. in IEEE 16th InternationalSymposium on Personal, Indoor and Mobile Radio Communications, vol 4 (2005), pp. 2751–2755
26. T Fruhwirth, P Brisset, Placing base stations in wireless indoor communication networks. Intell.Syst. Appl. IEEE 15(1), 49–53 (2000)
27. SJ Fortune, DM Gay, BW Kernighan, O Landron, RA Valenzuela, MH Wright, Wise design ofindoor wireless systems: practical computation and optimization. Comput. Sci. Eng. IEEE 2(1),58–68 (1995)
28. M Talau, ECG Wille, HS Lopes, Solving the base station placement problem by means of swarmintelligence. in 2013 IEEE Symposium on Computational Intelligence for Communication Systemsand Networks (2013), pp. 39–44
29. L Pujji, K Sowerby, M Neve, Development of a hybrid algorithm for efficient optimisation of basestation placement for indoor wireless communication systems. Wireless Personal Commun. 69(1),471–486 (2013)
30. MA Abd Rahman, M Dashti, J Zhang, Localization of unknown indoor wireless transmitter. inInternational Conference on Localization and GNSS (2013), pp. 1–6
31. L Nagy, Z Szalay, Global optimization of indoor radio coverage. in Conference ProceedingsICECom (2010), pp. 1–4
32. SF Rodd, A Prof, AH Kulkarni, Optimization algorithms for access point deployment in wirelessnetworks. J. Comput. Appl. 2(1), 2–2 (2009)
33. LK Pujji, KW Sowerby, MJ Neve, A new algorithm for efficient optimisation of base stationplacement in indoor wireless communication systems. in Communication Networks and ServicesResearch Conference, 2009 (2009), pp. 425–427

34. S Wang, W Guo, T O’Farrell, Optimising femtocell placement in an interference limited network:theory and simulation. in IEEE 76th Vehicular Technology Conference (VTC) (2012), pp. 1–6
35. J Liu, Q Chen, HD Sherali, Algorithm design for femtocell base station placement in commercialbuilding environments. in Proceedings IEEE INFOCOM (2012), pp. 2951–2955
36. C Sharma, Y-F Wong, W-S Soh, W-C Wong, Access point placement for fingerprint-basedlocalization. in IEEE International Conference on Communication Systems (2010), pp. 238–243
37. K Farkas, A Huszák, G Gódor, Optimization of Wi-Fi access point placement for indoorlocalization. IEEE 6th Symp. On Wireless Personal Multimedia Com. Conference 1, 28–33 (2013)
38. D1.1.2. WINNER II channel models. part II. radio channel measurement and analysis results. v1.0.Technical report, WINNER II IST project (2007)
39. JKL Wong, MJ Neve, KW Sowerby, Optimisation of a multi-code CDMA in-buildingcommunication system. in Proc. IEEE 63rd Vehicular Technology Conference (VTC), vol 2 (2006),pp. 846–850
40. JM Ruiz-Aviles, S Luna-Ramirez, M Toril, F Ruiz, I de la Bandera Cascales, P Muñoz, R Barco,P Lazaro, V Buenestado, Design of a computationally efficient dynamic system-level simulator forenterprise LTE femtocell scenarios. J. Electrical Comput. Eng. 2012(1), 14 (2012)


[dB]

a) b) c)
a) b) c)
a) b) c)

a) b) c)

0
10
20
30
40
50
60
0
2
4
6
8
10
12
14
16
18
20
1 8 15 22 29 36 43 50
LD
R [
%]
UU
R [
%]
Loop
CTS (UUR)
MTS (UUR)
CTS (LDR)
MTS (LDR)