Embed Size (px)
Citation preview
ミャンマー国全国運輸交通プログラム形成準備調査
2014年7月24日
Presented by Junji Shibata, P.E. Japan, Oriental Consultants Co., Ltd.

Mya
nmar
Nat
iona
l Tra
nspo
rt D
evel
opm
ent M
aste
r Pl
an
Contents
1. MYT‐Plan Objectives2. Transport Vision, Policy, Strategy and Actions3. Corridor‐based Transport Infrastructure Development4. Financing5. Feasibility Studies6. Appendix
2

Mya
nmar
Nat
iona
l Tra
nspo
rt D
evel
opm
ent M
aste
r Pl
an
1. MYT-Plan Objectives
3

Mya
nmar
Nat
iona
l Tra
nspo
rt D
evel
opm
ent M
aste
r Pl
an
1. MYT-Plan Objectives
MYT-Plan is designed to provide guidance for a long-term investmentframework that will help the Government achieve its economic growth targetsby 2030.
MYT-Plan to provide guidelines that are adaptable to other industrial sectorsand to private investment, to assist with investment planning and decisionmaking for a variety of transport sector projects.
MYT-Plan to inform the transport sector’s development vision, by presenting aset of comprehensive policies and development strategies relevant to all modesof transport, and corresponding actions (projects) for specific modes bydevelopment corridor.
MYT-Plan is designed to be read in conjunction with Myanmar’s National Comprehensive Development Plan (NCDP).
MYT-Plan will be updated in conjunction with the achievement of national development objectives, guided by the NCDP.
4
Mya
nmar
Nat
iona
l Tra
nspo
rt D
evel
opm
ent M
aste
r Pl
an
2. Transport Vision, Policy, Strategy and Actions
5

Mya
nmar
Nat
iona
l Tra
nspo
rt D
evel
opm
ent M
aste
r Pl
an
2. Transport Vision, Policy, Strategy and Actions
‘To develop an efficient, modern, safe, and environmentally-
friendly transportation system in a coordinated and
sustainable manner that embraces all transport modes for
the benefit of the country and people of Myanmar’.
The National Transport Vision
6
Mya
nmar
Nat
iona
l Tra
nspo
rt D
evel
opm
ent M
aste
r Pl
an
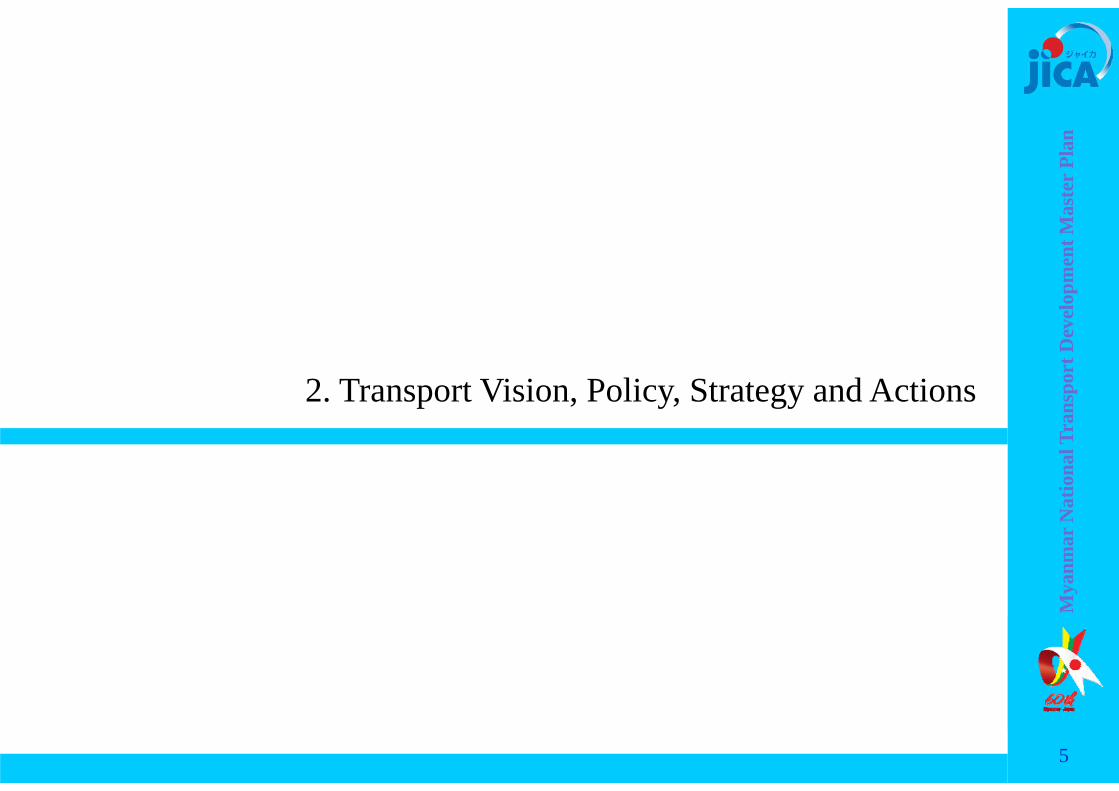
National Transport Vision
Road Sub-sector Vision
Rail sub-sectorVision
Maritime and Inland Water Transport Sub-sector Vision
Civil Aviation Sub-sectorVision
7
2. Transport Vision, Policy, Strategy and Actions

Mya
nmar
Nat
iona
l Tra
nspo
rt D
evel
opm
ent M
aste
r Pl
an
Implementation of the Policies – Strategic objective, Strategies, and Actions
Policy Statement
Strategic Objective
Strategy
Action (short-term)
Vision Statement
8
2. Transport Vision, Policy, Strategy and Actions
Mya
nmar
Nat
iona
l Tra
nspo
rt D
evel
opm
ent M
aste
r Pl
an
3. Corridor-based Transport Infrastructure Development
9

Mya
nmar
Nat
iona
l Tra
nspo
rt D
evel
opm
ent M
aste
r Pl
an
3. Corridor-based Transport Infrastructure Development
10
i. Existing Context
Mya
nmar
Nat
iona
l Tra
nspo
rt D
evel
opm
ent M
aste
r Pl
an
1a
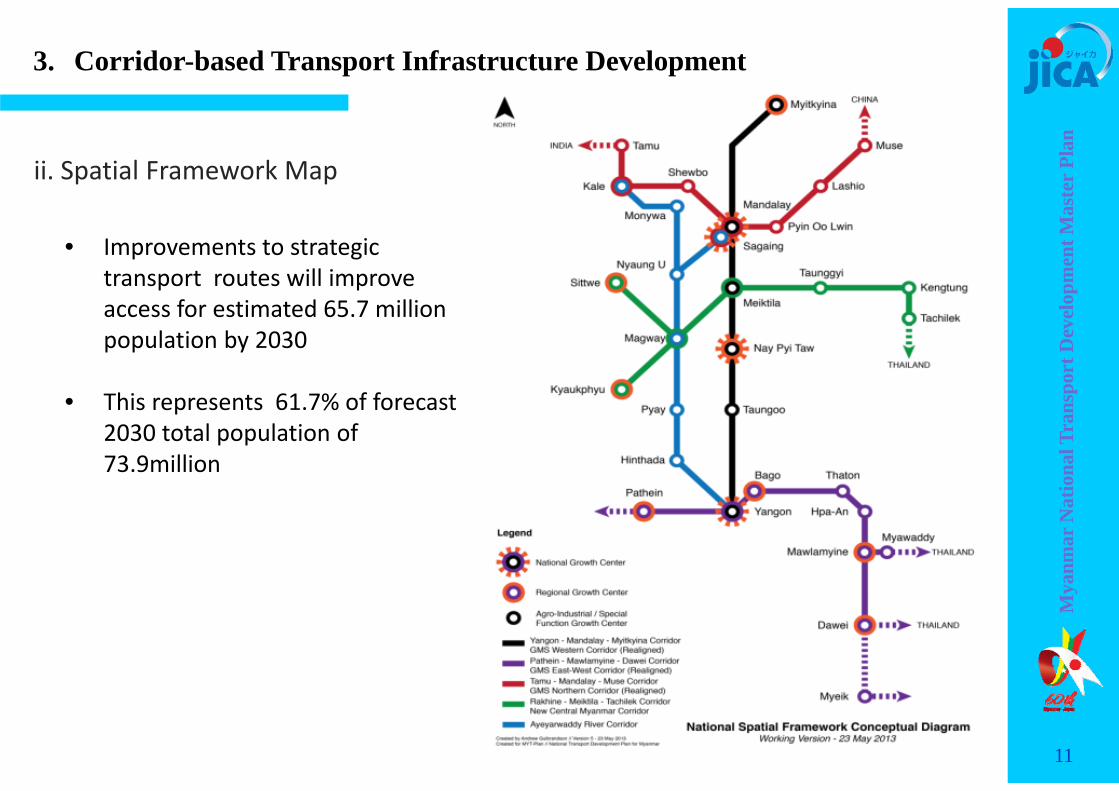
ii. Spatial Framework Map
• Improvements to strategic transport routes will improve access for estimated 65.7 million population by 2030
• This represents 61.7% of forecast 2030 total population of 73.9million
11
3. Corridor-based Transport Infrastructure Development

Mya
nmar
Nat
iona
l Tra
nspo
rt D
evel
opm
ent M
aste
r Pl
an
1a
iii. Consistency with DHSHD Concept
Multi‐Centric Balanced Development Strategy
National Growth Centers: Nay Pyi Taw, Yangon, Mandalay/Sagaing
Regional Growth Centers: Myitkyina, Sittwe/Kyaukphyu, Pathein, Bago(Hanthawaddy), Mawlamyine, Dawei
Agro‐industrial Centers: Lashio, Shwebo, Kale, Monywa, Meiktila, Taunggyi, Taungoo , Magway, Pyay, Hinthada, Thaton, Hpa‐an
Special Function Growth Centers: Muse, Tamu, Nyaung‐U, Kengtung, Tachileik, Myawaddy, Myeik
3. Corridor-based Transport Infrastructure Development
12

Mya
nmar
Nat
iona
l Tra
nspo
rt D
evel
opm
ent M
aste
r Pl
anThis National Spatial Framework should be:
Complementary with the National Transport Master Plan for Myanmar
Consistent with the MOC Department of Human Settlements and Housing Development Concept of Concentrated and Decentralized Development Strategy
Balanced in terms of enabling growth in urban and rural regions and states
Focused on key growth centers to optimize investment funds and community benefits
Multi‐centric to improve access to a range of employment opportunities and social and community facilities
3. Corridor-based Transport Infrastructure Development
13

Mya
nmar
Nat
iona
l Tra
nspo
rt D
evel
opm
ent M
aste
r Pl
an
A
B
C
D
E
G
H
J
K
L
10 Major Corridors
A Central North‐South Corridor
B East ‐West Corridor
C Northern Corridor
D Mandalay ‐ Tamu Corridor
E Second East ‐West Corridor
G East ‐West Bridging Corridor
H Delta Area Network
J Southern Area Development Corridor
K Western North‐South Corridor
L Eastern North ‐ South Corridor
Priority corridors for urgentinvestment
14
3. Corridor-based Transport Infrastructure Development

Mya
nmar
Nat
iona
l Tra
nspo
rt D
evel
opm
ent M
aste
r Pl
an
Development Corridor Section Code2012
Population (,000)
% against National
Population by corridor
2012 GDP(Kyat
billion)
% against National GDP by corridor
Central North-South CorridorYangon-Nay Pyi Taw A1 11,714
41%13,170
50%Nay Pyi Taw- Mandalay A2 6,323 4,457Mandalay - Myitkyna A3 7,035 5,648
GMS East - West Corridor Yangon - Hpa-An - Myawaddy B1 14,052 28% 14,543 35%Mawlamyine - Dawei B2 2,753 2,039GMS Northern Corridor Mandalay - Muse C1 6,042 10% 4,503 10%
Mandalay - Tamu Corridor Mandalay - Tamu D1 8,722 14% 6,992 15%New East - West Corridor Tachilek - Meiktila - Kyaukpyu E1 10,636 17% 6,938 15%
East - West Bridging Corridor Hpasawing - Pyay G1 2,664 12% 1,727 11%Loikaw - Magway G2 4,767 3,214
Delta Area Network Yangon - Pathein H1 8,992 21% 10,076 27%Pathein - Hinthada H2 3,766 2,651
Southern Area Development Corridor
Thanbyuzayat - Hpayarthonesu J1 2,5378%
1,4828%Dawai - Thai Border J2 811 781
Dawei - Kawthaung J3 1,756 1,679
Western North-South Corridor Yangon - Pyay - Magway K1 12,810 33% 14,388 42%Magway - Mandalay K2 7,096 5,468
Eastern North - South Corridor Bilin - Loikaw L1 3,896 12% 2,550 9%Loikaw - Nawnghko L2 3,247 1,900
15
3.1 Corridor Analysis – population and GDP

Mya
nmar
Nat
iona
l Tra
nspo
rt D
evel
opm
ent M
aste
r Pl
an
Development Corridor Section Code
2013 Traffic
demand (ton-km)
Composition Modal Share
Total 2013 Road Rail River
Central North-South CorridorYangon-Nay Pyi Taw A1 23.3 27% 93% 7% 0%Nay Pyi Taw- Mandalay A2 15.4 18% 92% 8% 0%Mandalay - Myitkyna A3 2.6 3% 67% 13% 20%
GMS East - West Corridor Yangon - Hpa-An - Myawaddy B1 10.0 12% 95% 5% 0%Mawlamyine - Dawei B2 0.4 0% 92% 8% 0%
GMS Northern Corridor Mandalay - Muse C1 11.1 13% 98% 2% 0%Mandalay - Tamu Corridor Mandalay - Tamu D1 1.4 2% 75% 7% 18%New East - West Corridor Tachilek - Meiktila - Kyaukpyu E1 2.4 3% 97% 3% 0%
East - West Bridging Corridor Hpasawing - Pyay G1 0.1 0% 100% 0% 0%Loikaw - Magway G2 1.0 1% 100% 0% 0%
Delta Area Network Yangon - Pathein H1 1.4 2% 52% 0% 48%Pathein - Hinthada H2 0.2 0% 97% 3% 0%
Southern Area Development Corridor
Thanbyuzayat - Hpayarthonesu J1 0.0 0% - - -Dawai - Thai Border J2 0.0 0% 100% 0% 0%Dawei - Kawthaung J3 0.1 0% 100% 0% 0%
Western North-South Corridor Yangon - Pyay - Magway K1 8.8 10% 61% 6% 33%Magway - Mandalay K2 2.1 2% 12% 8% 80%
Eastern North - South Corridor Bilin - Loikaw L1 0.2 0% 100% 0% 0%Loikaw - Nawnghko L2 0.1 0% 97% 3% 0%
3.1 Corridor Analysis – Freight transport demand in 2013
16

Mya
nmar
Nat
iona
l Tra
nspo
rt D
evel
opm
ent M
aste
r Pl
an
Corridor Name Section Code2013 Traffic demand (person-km) Composition
Total Air Car IWT Rail Bus 2013
Central North-South Corridor
Yangon-Nay Pyi Taw A1 23.4 0% 13% 0% 3% 83% 30%Nay Pyi Taw- Mandalay A2 16.0 0% 14% 0% 6% 79% 20%
Mandalay - Myitkyna A3 4.1 13% 15% 12% 51% 9% 5%
GMS East - West Corridor Yangon - Hpa-An - Myawaddy B1 9.1 0% 19% 0% 7% 74% 12%Mawlamyine - Dawei B2 0.5 0% 19% 0% 5% 76% 1%
GMS Northern Corridor Mandalay - Muse C1 3.7 0% 49% 0% 8% 43% 5%Mandalay - Tamu Corridor Mandalay - Tamu D1 3.0 1% 15% 0% 5% 79% 4%New East - West Corridor Tachilek - Meiktila - Kyaukpyu E1 4.3 5% 25% 0% 10% 59% 6%
East - West Bridging Corridor
Hpasawing - Pyay G1 0.0 0% 0% 0% 0% 100% 0%Loikaw - Magway G2 2.3 0% 15% 0% 30% 55% 3%
Delta Area Network Yangon - Pathein H1 3.6 1% 24% 18% 0% 57% 5%Pathein - Hinthada H2 0.6 0% 23% 0% 18% 59% 1%
Southern Area Development Corridor
Thanbyuzayat - Hpayarthonesu J1 0.0 0% 100% 0% 0% 0% 0%Dawai - Thai Border J2 0.0 0% 40% 0% 0% 60% 0%Dawei - Kawthaung J3 0.9 87% 8% 0% 0% 5% 1%
Western North-South Corridor
Yangon - Pyay - Magway K1 4.3 0% 29% 0% 21% 50% 5%Magway - Mandalay K2 1.5 1% 12% 0% 39% 49% 2%
Eastern North - South Corridor
Bilin - Loikaw L1 0.1 0% 0% 0% 0% 100% 0%Loikaw - Nawnghko L2 0.2 0% 13% 0% 82% 4% 0%
3.1 Corridor Analysis – Passenger transport demand in 2013
17
Mya
nmar
Nat
iona
l Tra
nspo
rt D
evel
opm
ent M
aste
r Pl
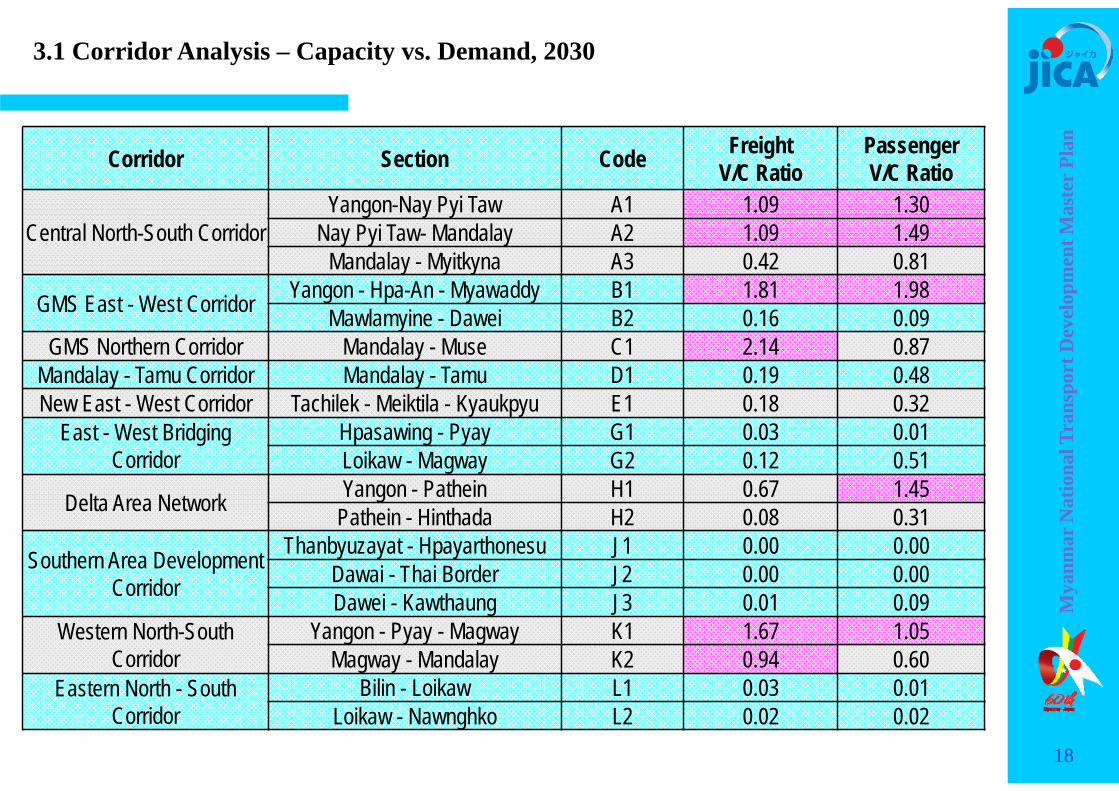
anCorridor Section Code FreightV/C Ratio
PassengerV/C Ratio
Central North-South CorridorYangon-Nay Pyi Taw A1 1.09 1.30
Nay Pyi Taw- Mandalay A2 1.09 1.49Mandalay - Myitkyna A3 0.42 0.81
GMS East - West Corridor Yangon - Hpa-An - Myawaddy B1 1.81 1.98Mawlamyine - Dawei B2 0.16 0.09
GMS Northern Corridor Mandalay - Muse C1 2.14 0.87Mandalay - Tamu Corridor Mandalay - Tamu D1 0.19 0.48New East - West Corridor Tachilek - Meiktila - Kyaukpyu E1 0.18 0.32
East - West Bridging Corridor
Hpasawing - Pyay G1 0.03 0.01Loikaw - Magway G2 0.12 0.51
Delta Area Network Yangon - Pathein H1 0.67 1.45Pathein - Hinthada H2 0.08 0.31
Southern Area Development Corridor
Thanbyuzayat - Hpayarthonesu J1 0.00 0.00Dawai - Thai Border J2 0.00 0.00Dawei - Kawthaung J3 0.01 0.09
Western North-South Corridor
Yangon - Pyay - Magway K1 1.67 1.05Magway - Mandalay K2 0.94 0.60
Eastern North - South Corridor
Bilin - Loikaw L1 0.03 0.01Loikaw - Nawnghko L2 0.02 0.02
3.1 Corridor Analysis – Capacity vs. Demand, 2030
18

Mya
nmar
Nat
iona
l Tra
nspo
rt D
evel
opm
ent M
aste
r Pl
anTraffic Volume between YNG ‐MDL
Road NH1 NH2 Expressway MC 56 39 -
Small Vehicles 794 126 2,037 Small Bus 265 134 60
Bus 135 74 367 Small Truck 146 45 -Large Truck 1,464 274 -
Total 2,860 692 2,464
・ UH1 + Expressway5,000 ~ 5,500 vehicles /day (=10,000 pcu)
・ UH1Large Truck: 1,500 Vehicles/day (51% of total)
・ ExpresswayCar: 2,000 Vehicles / day Bus: 370 Buses / day
*Daily Average Traffic Volume at Toll Gates*NH1: YNG‐NPT‐MDL Rd. NH2: YNG – PYAY‐MDL *Source: MOC
3.2 Corridor Analysis – A: Central North-South Corridor
19

Mya
nmar
Nat
iona
l Tra
nspo
rt D
evel
opm
ent M
aste
r Pl
an
0
10000
20000
30000
40000
50000
60000
70000
2010 2015 2020 2025 2030 2035
Year
PCU Traffic Volume
Truck
Road Traffic Demand Forecast along Yangon – Mandalay Corridor
Capacity of NH1
Truck demand exceeds the design capacity of NH1 open expressway for trucks
Capacity increase should be considered
Capacity of NH1 + Expressway
20
3.2 Corridor Analysis – Expressway

Mya
nmar
Nat
iona
l Tra
nspo
rt D
evel
opm
ent M
aste
r Pl
an
4. Financing
21

Mya
nmar
Nat
iona
l Tra
nspo
rt D
evel
opm
ent M
aste
r Pl
an
1,155
5,251
2,164 3,3
71
0
10,000
20,000
30,000
40,000
50,000
60,000
201420
1520
1620
1720
1820
1920
2020
2120
2220
2320
2420
2520
2620
2720
2820
2920
30Gov Expenditure
National Total FCF
Transport
Unit: billion Kyat at 2013 constant prices
Necessary Investment in the Transport Sector under Scenario 2,including national, urban, and rural transport systems,mostly by the public sector, but including investment by the private sector.
1389 billion KyatIn 2015
2164 billion Kyatin2020
5251 billion KyatIn 2030
4. Financing
22
Mya
nmar
Nat
iona
l Tra
nspo
rt D
evel
opm
ent M
aste
r Pl
an
4. Financing
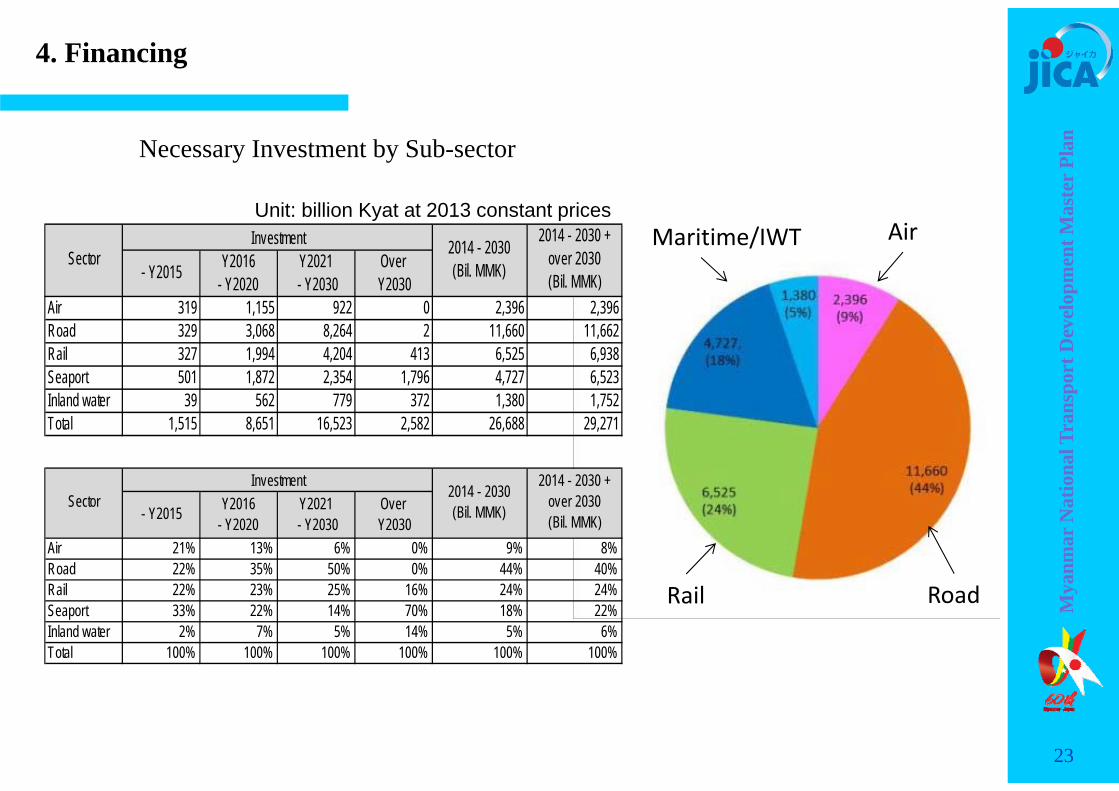
Unit: billion Kyat at 2013 constant prices
Necessary Investment by Sub-sector
Air
RoadRail
Maritime/IWT
23
- Y2015 Y2016- Y2020
Y2021 - Y2030
Over Y2030
Air 319 1,155 922 0 2,396 2,396Road 329 3,068 8,264 2 11,660 11,662Rail 327 1,994 4,204 413 6,525 6,938Seaport 501 1,872 2,354 1,796 4,727 6,523Inland water 39 562 779 372 1,380 1,752Total 1,515 8,651 16,523 2,582 26,688 29,271
2014 - 2030(Bil. MMK)
2014 - 2030 +over 2030(Bil. MMK)
SectorInvestment
- Y2015 Y2016- Y2020
Y2021 - Y2030
Over Y2030
Air 21% 13% 6% 0% 9% 8%Road 22% 35% 50% 0% 44% 40%Rail 22% 23% 25% 16% 24% 24%Seaport 33% 22% 14% 70% 18% 22%Inland water 2% 7% 5% 14% 5% 6%Total 100% 100% 100% 100% 100% 100%
2014 - 2030(Bil. MMK)Sector
Investment 2014 - 2030 +over 2030(Bil. MMK)

Mya
nmar
Nat
iona
l Tra
nspo
rt D
evel
opm
ent M
aste
r Pl
an
2014 – 2020 – Focused Investment to the Trunk Systems• 10,166 billion Kyat (at 2013 constant prices) for national transport systems.• This is about 87% of the total capital formation in the transport sector (11,700
billion Kyat).• The remaining 13% (1,534 billion Kyat) is allocated to urban and rural transport
systems.
2020 – 2030 – Well balanced funding• 16,523 billion Kyat (at 2013 constant prices) for trunk transport systems• This is about 45% of the total capital formation in the transport sector (36,390
billion Kyat)• The remaining 55% is allocated to urban and rural transport systems
24
4. Financing

Mya
nmar
Nat
iona
l Tra
nspo
rt D
evel
opm
ent M
aste
r Pl
an
5. Feasibility Studies
25

The Survey Program ForThe National Transport Development Plan in The Republic of The Union of Myanmar
Rehabilitation and Modernization of Yangon – Mandalay Railway
Presented by Junji Shibata, P.E. Japan, Oriental Consultants Co., Ltd.
Mya
nmar
Nat
iona
l Tra
nspo
rt D
evel
opm
ent M
aste
r Pl
an
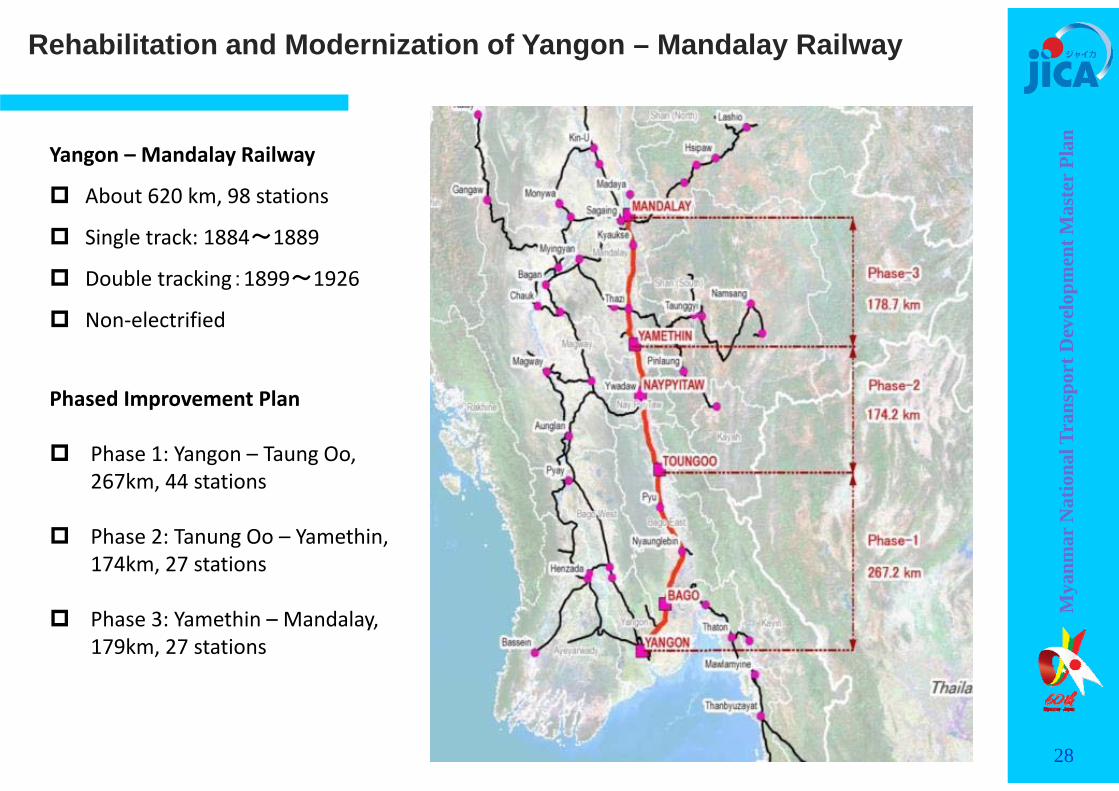
Phased Improvement Plan
Phase 1: Yangon – Taung Oo, 267km, 44 stations
Phase 2: Tanung Oo – Yamethin, 174km, 27 stations
Phase 3: Yamethin – Mandalay, 179km, 27 stations
Yangon – Mandalay Railway
About 620 km, 98 stations
Single track: 1884~1889
Double tracking:1899~1926
Non‐electrified
Rehabilitation and Modernization of Yangon – Mandalay Railway
28
The Survey Program ForThe National Transport Development Plan in The Republic of The Union of Myanmar
Inland Water Transport Facilities Improvement and Development in Mandalay

Mya
nmar
Nat
iona
l Tra
nspo
rt D
evel
opm
ent M
aste
r Pl
an
1a
Jetty 90m x 2 = 180mQuay Depth = - 2.0m
Access BridgeNorth 160mSouth 240m
Cargo Yard3 ha
Access Road304m
Mandalay Port Plan
30
The Survey Program ForThe National Transport Development Plan in The Republic of The Union of MyanmarPre‐Feasibility Study: The East‐West Economic Corridor Road Improvement Project
Mya
nmar
Nat
iona
l Tra
nspo
rt D
evel
opm
ent M
aste
r Pl
an
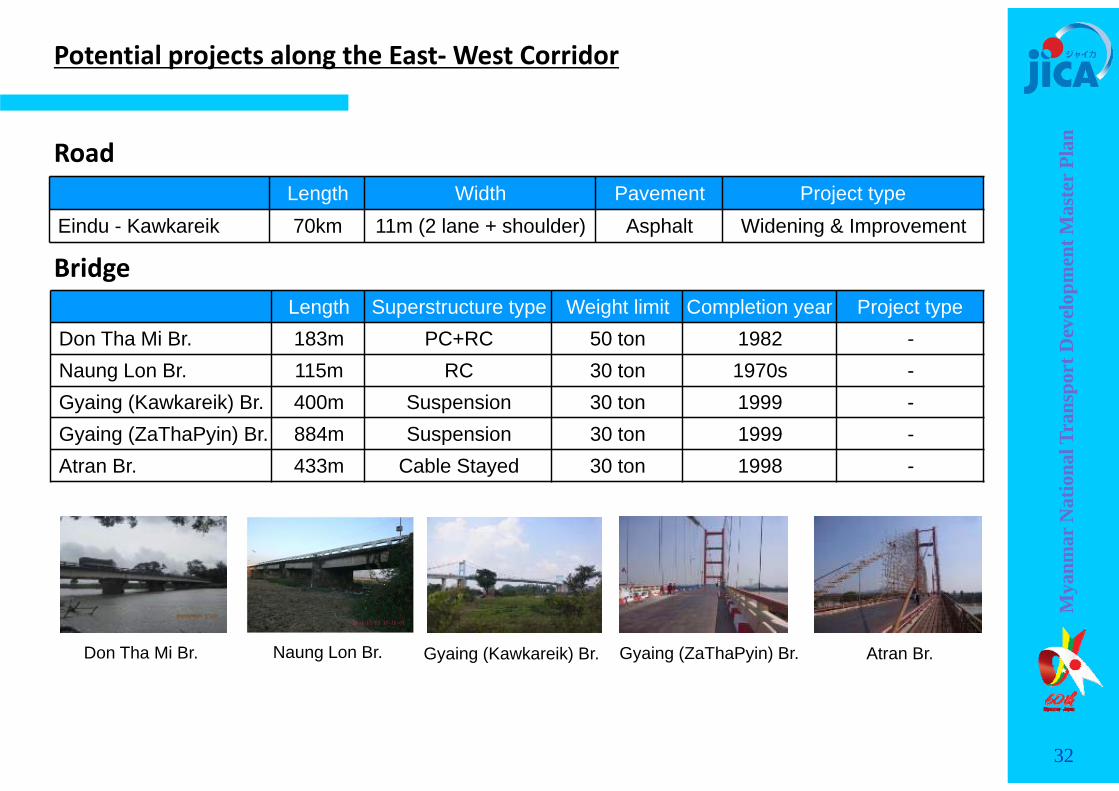
Gyaing (Kawkareik) Br.Don Tha Mi Br. Naung Lon Br. Gyaing (ZaThaPyin) Br. Atran Br.
Length Superstructure type Weight limit Completion year Project typeDon Tha Mi Br. 183m PC+RC 50 ton 1982 -Naung Lon Br. 115m RC 30 ton 1970s -Gyaing (Kawkareik) Br. 400m Suspension 30 ton 1999 -Gyaing (ZaThaPyin) Br. 884m Suspension 30 ton 1999 -Atran Br. 433m Cable Stayed 30 ton 1998 -
Potential projects along the East‐West Corridor
Length Width Pavement Project typeEindu - Kawkareik 70km 11m (2 lane + shoulder) Asphalt Widening & Improvement
Road
Bridge
32
Mya
nmar
Nat
iona
l Tra
nspo
rt D
evel
opm
ent M
aste
r Pl
an
Appendix: Frameworks for National Transport Planning
33
Mya
nmar
Nat
iona
l Tra
nspo
rt D
evel
opm
ent M
aste
r Pl
an
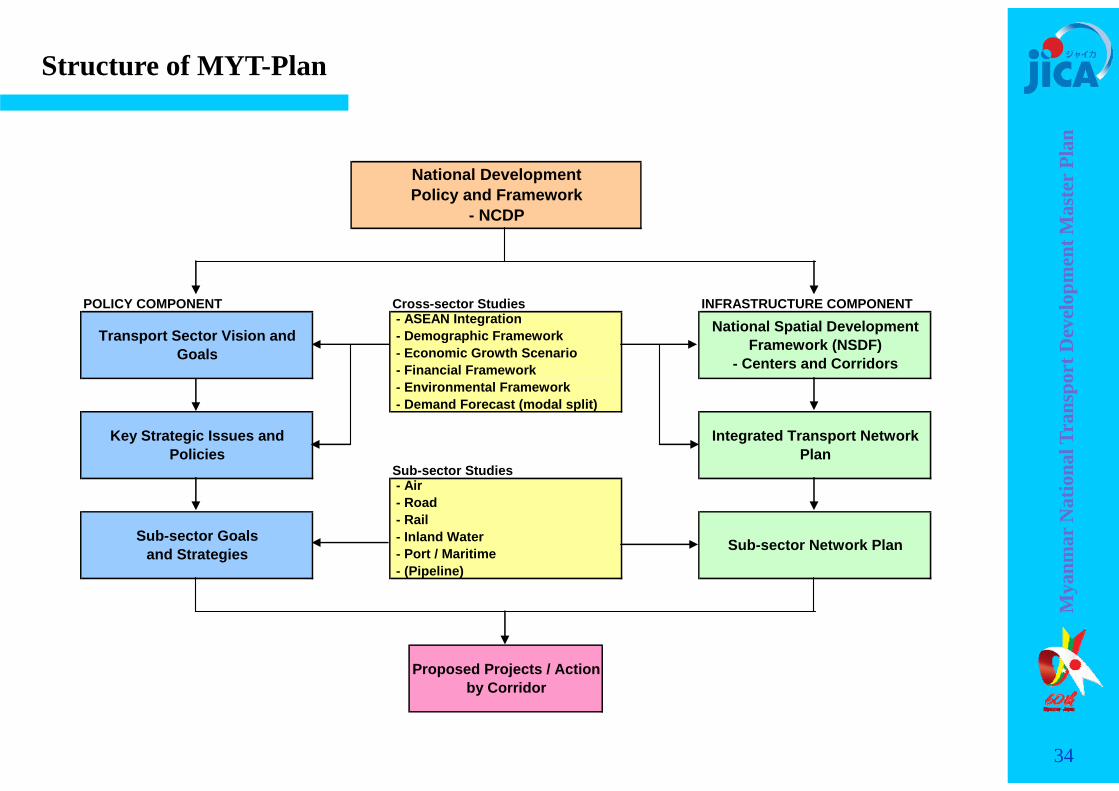
POLICY COMPONENT Cross-sector Studies INFRASTRUCTURE COMPONENT
Sub-sector Studies
Proposed Projects / Actionby Corridor
Key Strategic Issues andPolicies
Integrated Transport NetworkPlan
- Air - Road - Rail - Inland Water - Port / Maritime - (Pipeline)
Sub-sector Goalsand Strategies Sub-sector Network Plan
National DevelopmentPolicy and Framework
- NCDP
Transport Sector Vision andGoals
- ASEAN Integration - Demographic Framework - Economic Growth Scenario - Financial Framework - Environmental Framework - Demand Forecast (modal split)
National Spatial DevelopmentFramework (NSDF)
- Centers and Corridors
Structure of MYT-Plan
34
Mya
nmar
Nat
iona
l Tra
nspo
rt D
evel
opm
ent M
aste
r Pl
an
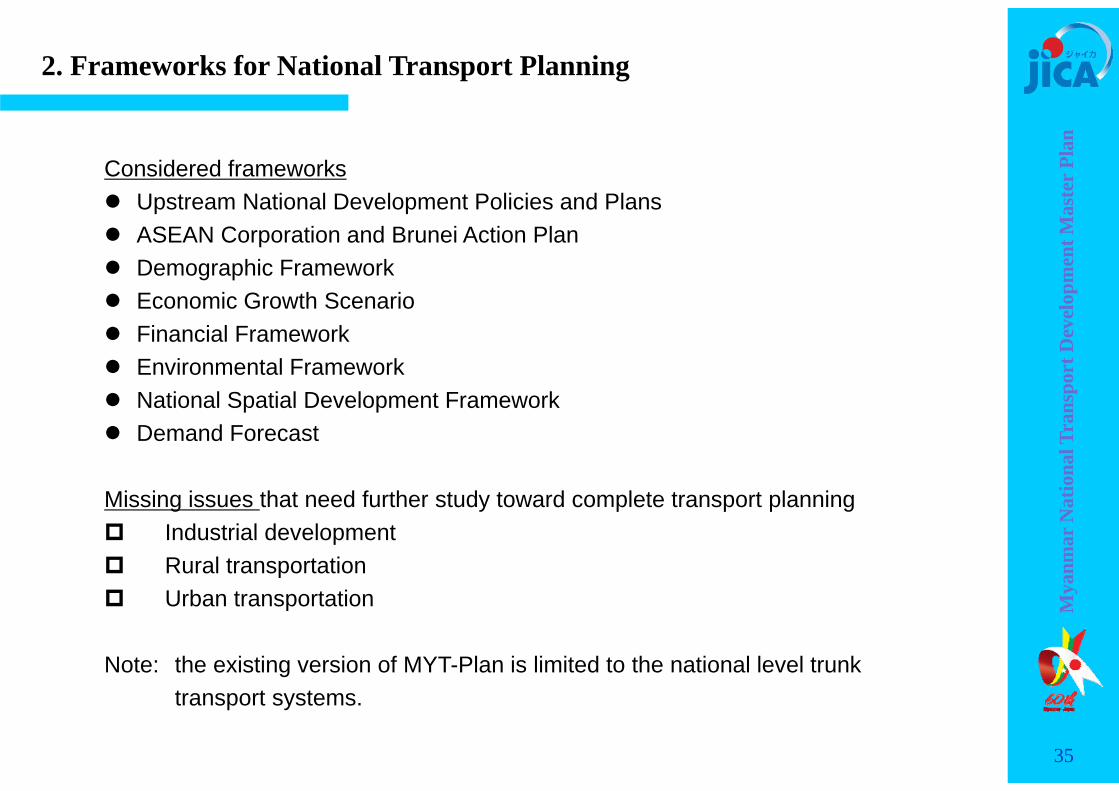
Considered frameworks Upstream National Development Policies and Plans ASEAN Corporation and Brunei Action Plan Demographic Framework Economic Growth Scenario Financial Framework Environmental Framework National Spatial Development Framework Demand Forecast
Missing issues that need further study toward complete transport planning Industrial development Rural transportation Urban transportation
Note: the existing version of MYT-Plan is limited to the national level trunk transport systems.
2. Frameworks for National Transport Planning
35

Mya
nmar
Nat
iona
l Tra
nspo
rt D
evel
opm
ent M
aste
r Pl
an
5 year plan (2011‐15): 7.7% annual growth (real term) target (Address by H.E. President U Thein Sein in June 2012)
Framework for Economic and Social Reforms (FESR): policy priorities for 2012‐2015 towards the long‐term goals of the national comprehensive development plan (NCDP) –“macroeconomic stability,” “inclusive development,” “quick win” and “sustainability”
National Comprehensive Development Plan (NCDP): Long term plan up to 2030; expected to be completed in July 2014
Myanmar Comprehensive Development Vision (MCDV): Long term development vision up to 2035; Collaboration with ERIA
Spatial Structure Development Concept by DHSHD
36
1. Upstream National Development Policies and Plans

Mya
nmar
Nat
iona
l Tra
nspo
rt D
evel
opm
ent M
aste
r Pl
an
Year 2010 2015 2020 2025 2030 2035 2040
High 59.8 63.8 67.8 71.6 75.0 78.0 80.7
Moderate 59.8 63.6 66.9 69.8 71.9 73.3 73.8
Low 59.8 63.4 66.5 68.9 70.3 70.9 70.4
Unit: million persons
55,000
60,000
65,000
70,000
75,000
80,000
85,000
2010 2015 2020 2025 2030 2035 2040
Population (000 persons)
Year
High Middle Low
Source: MYT‐Plan JICA Study Team
Likelygrowth scenario
3 Demographic Framework
37
Mya
nmar
Nat
iona
l Tra
nspo
rt D
evel
opm
ent M
aste
r Pl
an
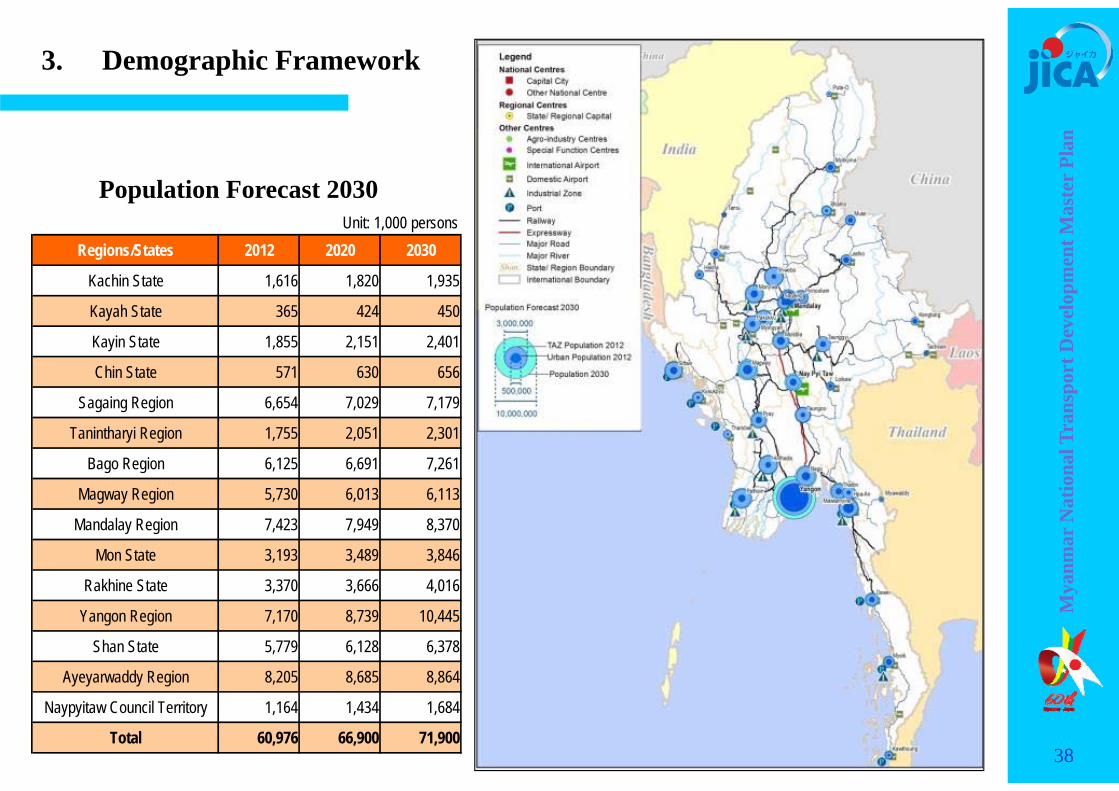
Population Forecast 2030Unit: 1,000 persons
Regions/States 2012 2020 2030
Kachin State 1,616 1,820 1,935
Kayah State 365 424 450
Kayin State 1,855 2,151 2,401
Chin State 571 630 656
Sagaing Region 6,654 7,029 7,179
Tanintharyi Region 1,755 2,051 2,301
Bago Region 6,125 6,691 7,261
Magway Region 5,730 6,013 6,113
Mandalay Region 7,423 7,949 8,370
Mon State 3,193 3,489 3,846
Rakhine State 3,370 3,666 4,016
Yangon Region 7,170 8,739 10,445
Shan State 5,779 6,128 6,378
Ayeyarwaddy Region 8,205 8,685 8,864
Naypyitaw Council Territory 1,164 1,434 1,684
Total 60,976 66,900 71,900
3. Demographic Framework
38

Mya
nmar
Nat
iona
l Tra
nspo
rt D
evel
opm
ent M
aste
r Pl
an
0
100
200
300
400
500
600
700
Index (2010=100
)Scenario 1 Scenario 2 Scenario 3
Economic Growth Scenarios: 7.7% GDP growth target from 2011 to 2015 (Myanmar Government)7 to 8 % GDP growth until 2030 (“Myanmar in Transition”, ADB)6.0 times
5.4 times
4.3 times
Source: MYT‐Plan JICA Study Team
Scenario 17.7% GDP growth during 2015‐35; Average growth rate of 7.5% from 2011 to 2035
Scenario 2 (recommended)7.2% GDP growth during 2013‐35; Average growth rate of 7.0% from 2011 to 2035
Scenario 36.0% GDP growth during 2014‐35; Debt sustainability analysis by IMF; trend growth
Growth of economy (real GDP)
39
4. Economic Growth Scenario
Mya
nmar
Nat
iona
l Tra
nspo
rt D
evel
opm
ent M
aste
r Pl
an
0
100
200
300
400
500
600
700
GDP(Starting year =
100)
Year
Japan Korea, Rep. Thailand Malaysia
Indonesia Lao PDR Vietnam
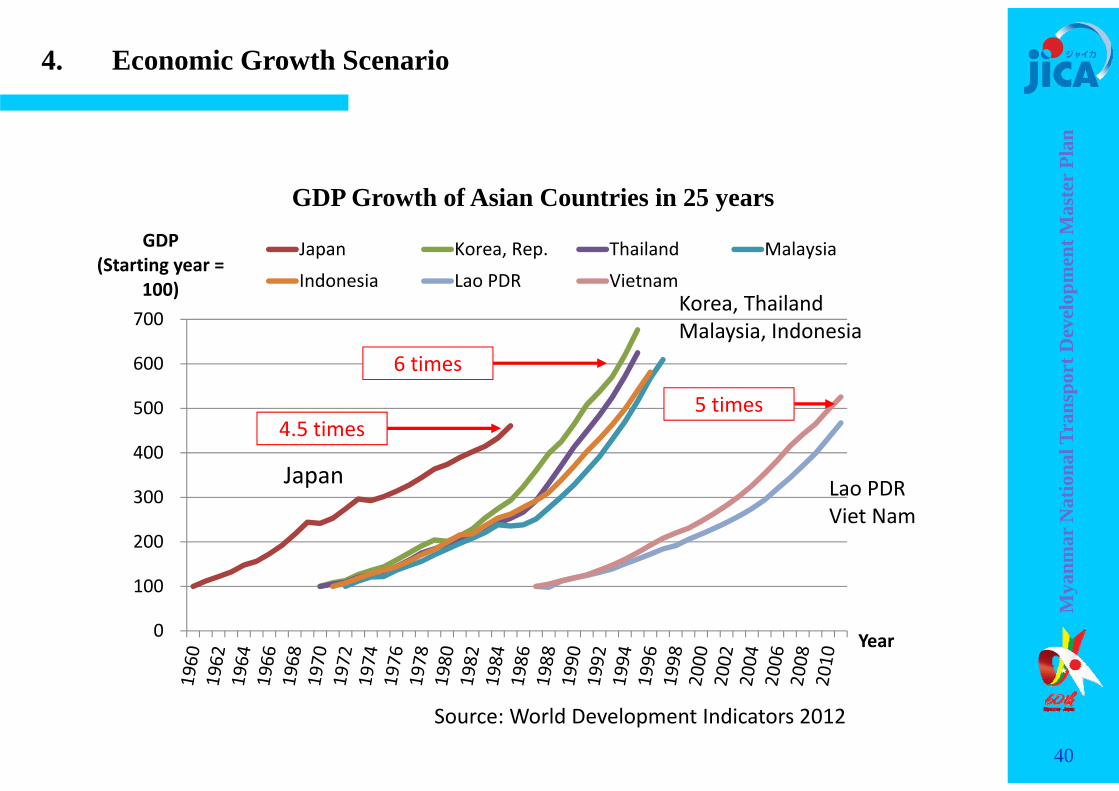
GDP Growth of Asian Countries in 25 years
6 times
5 times
Lao PDRViet Nam
Japan
4.5 times
Korea, ThailandMalaysia, Indonesia
Source: World Development Indicators 2012
40
4. Economic Growth Scenario
Mya
nmar
Nat
iona
l Tra
nspo
rt D
evel
opm
ent M
aste
r Pl
an
0
10,000
20,000
30,000
40,000
50,000
60,000
70,000
billion Kyat Scenario 1 Scenario 2 Scenario 3
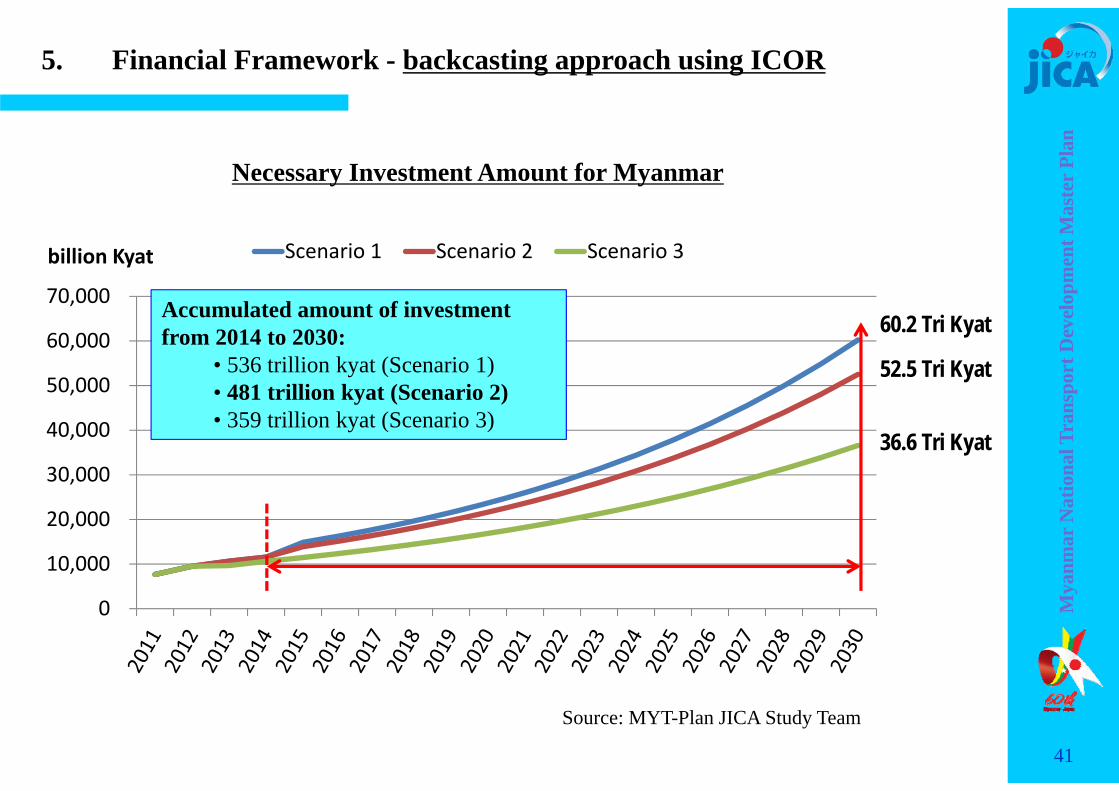
Necessary Investment Amount for Myanmar
Source: MYT-Plan JICA Study Team
60.2 Tri Kyat
36.6 Tri Kyat
52.5 Tri Kyat
Accumulated amount of investmentfrom 2014 to 2030:
• 536 trillion kyat (Scenario 1)• 481 trillion kyat (Scenario 2)• 359 trillion kyat (Scenario 3)
5. Financial Framework - backcasting approach using ICOR
41
Mya
nmar
Nat
iona
l Tra
nspo
rt D
evel
opm
ent M
aste
r Pl
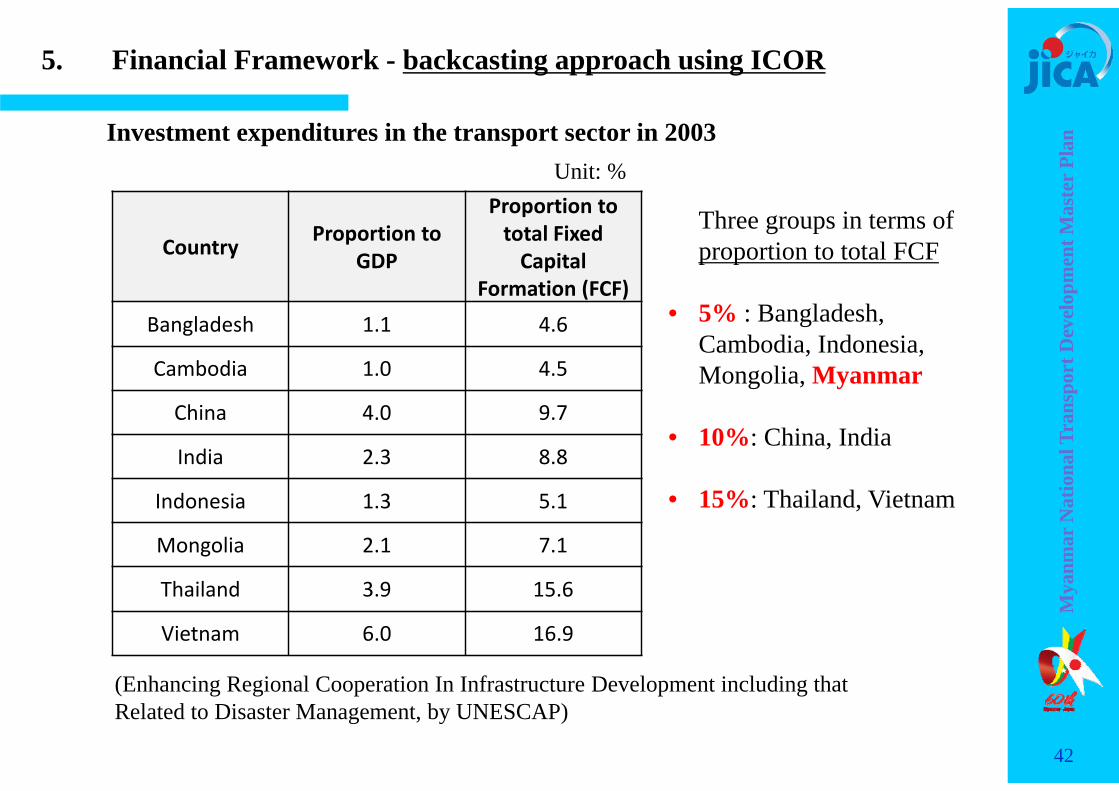
anInvestment expenditures in the transport sector in 2003
Country Proportion to GDP
Proportion to total Fixed Capital
Formation (FCF)Bangladesh 1.1 4.6
Cambodia 1.0 4.5
China 4.0 9.7
India 2.3 8.8
Indonesia 1.3 5.1
Mongolia 2.1 7.1
Thailand 3.9 15.6
Vietnam 6.0 16.9
Unit: %
(Enhancing Regional Cooperation In Infrastructure Development including that Related to Disaster Management, by UNESCAP)
Three groups in terms of proportion to total FCF
• 5% : Bangladesh, Cambodia, Indonesia, Mongolia, Myanmar
• 10%: China, India
• 15%: Thailand, Vietnam
42
5. Financial Framework - backcasting approach using ICOR

Mya
nmar
Nat
iona
l Tra
nspo
rt D
evel
opm
ent M
aste
r Pl
an
Unit: %Investment expenditures in the transport sector in Myanmar
Note 1: Higher level investment in 2004/05 and 2005/06 is due to Yangon – Mandalay Expressway and Nay Pyi Taw development.
Note 2: Transport capital expenditure: Union government budget + State administrative organization budget + state economic enterprises, calculated by MYT-Plan JICA Study Team from Myanmar Data CD-ROM 2010 and 2011
Fiscal YearProportion to Total
Fixed Capital Formation
Proportion to Total Government Capital
Expenditure
2004‐05 12.8 21.0
2005‐06 14.4 29.7
2006‐07 7.5 14.0
2007‐08 6.9 13.5
2008‐09 4.8 12.0
2009‐10 5.3 13.4
2010‐11 3.5 9.9
43
5. Financial Framework - backcasting approach using ICOR
Mya
nmar
Nat
iona
l Tra
nspo
rt D
evel
opm
ent M
aste
r Pl
an
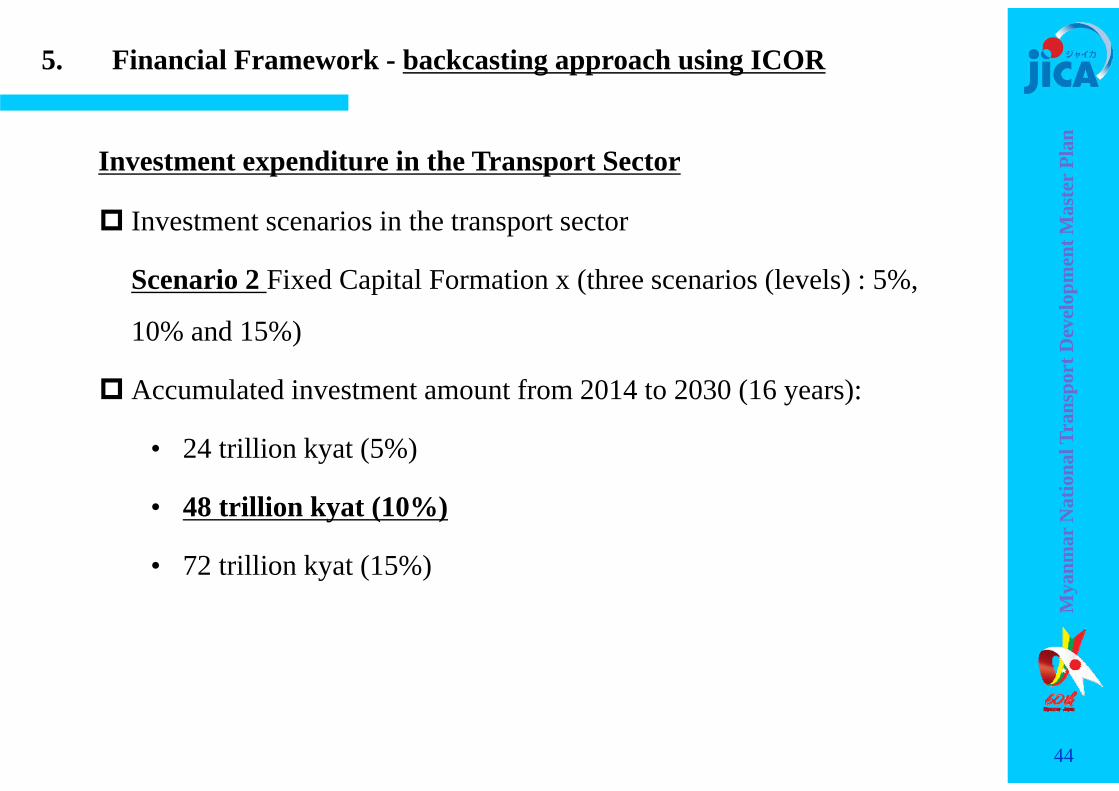
Investment expenditure in the Transport Sector
Investment scenarios in the transport sector
Scenario 2 Fixed Capital Formation x (three scenarios (levels) : 5%,
10% and 15%)
Accumulated investment amount from 2014 to 2030 (16 years):
• 24 trillion kyat (5%)
• 48 trillion kyat (10%)
• 72 trillion kyat (15%)
44
5. Financial Framework - backcasting approach using ICOR

Mya
nmar
Nat
iona
l Tra
nspo
rt D
evel
opm
ent M
aste
r Pl
anInvestment expenditure scenarios in the transport sector
01,0002,0003,0004,0005,0006,0007,0008,000
Investment in the transport sector (Kyat
billion)
5% of total fixed capital formation 10% of total ifixed capital formation15% of total fixed capital formation
695 billion Kyat
2084 billion Kyat
1389 billion Kyat
Note: 1 billion Kyat = 1.14 million USD (1 USD=880Kyat) = 1.08 Oku Yen (1USD=95Yen)
1082 billion Kyat
3246 billion Kyat
2164 billion Kyat2084 billion Kyat
7877 billion Kyat
5251 billion Kyat
45
5. Financial Framework - backcasting approach using ICOR
Mya
nmar
Nat
iona
l Tra
nspo
rt D
evel
opm
ent M
aste
r Pl
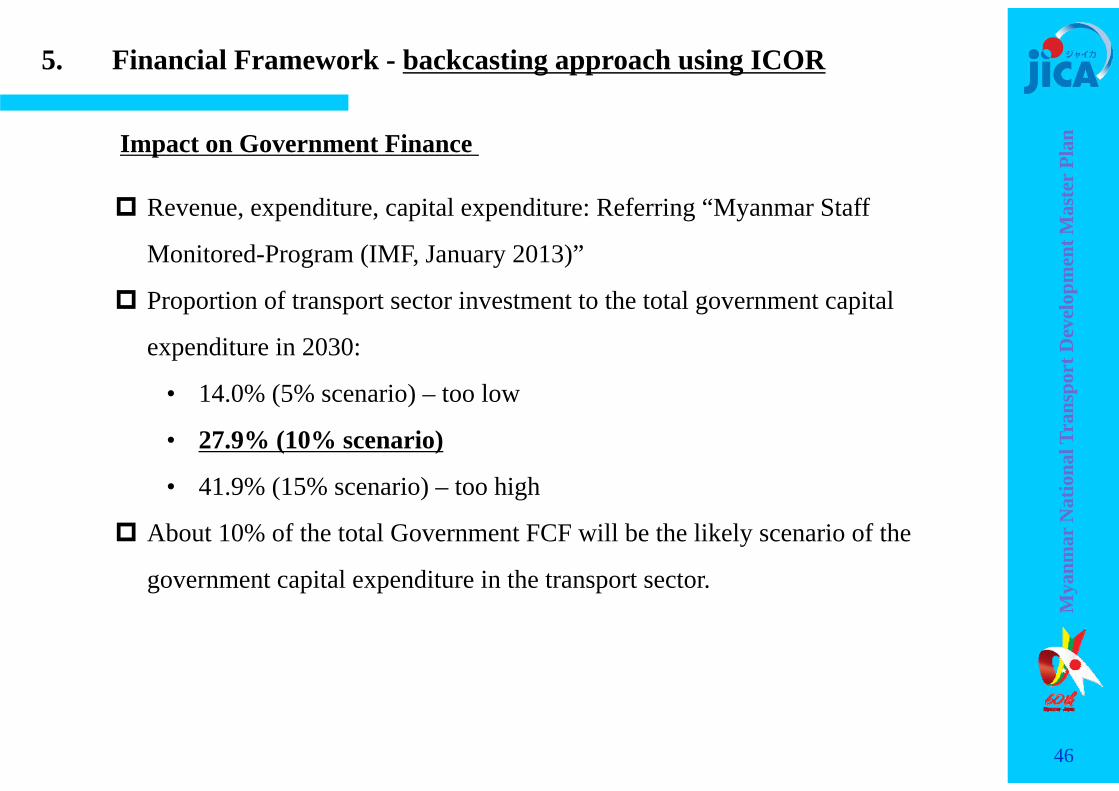
anImpact on Government Finance
Revenue, expenditure, capital expenditure: Referring “Myanmar Staff
Monitored-Program (IMF, January 2013)”
Proportion of transport sector investment to the total government capital
expenditure in 2030:
• 14.0% (5% scenario) – too low
• 27.9% (10% scenario)
• 41.9% (15% scenario) – too high
About 10% of the total Government FCF will be the likely scenario of the
government capital expenditure in the transport sector.
46
5. Financial Framework - backcasting approach using ICOR
Mya
nmar
Nat
iona
l Tra
nspo
rt D
evel
opm
ent M
aste
r Pl
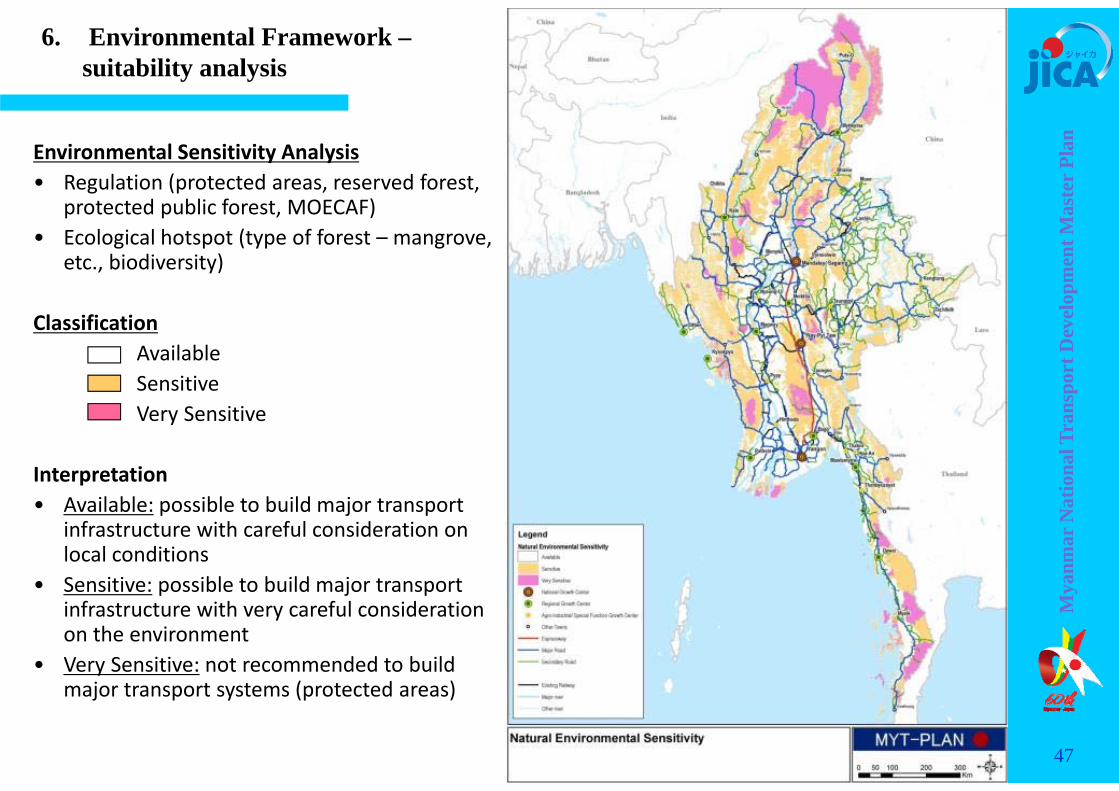
anEnvironmental Sensitivity Analysis• Regulation (protected areas, reserved forest,
protected public forest, MOECAF)• Ecological hotspot (type of forest – mangrove,
etc., biodiversity)
ClassificationAvailableSensitiveVery Sensitive
Interpretation• Available: possible to build major transport
infrastructure with careful consideration on local conditions
• Sensitive: possible to build major transport infrastructure with very careful consideration on the environment
• Very Sensitive: not recommended to build major transport systems (protected areas)
6. Environmental Framework –suitability analysis
47

Mya
nmar
Nat
iona
l Tra
nspo
rt D
evel
opm
ent M
aste
r Pl
anRisk Analysis on Natural Disaster• Flood‐prone areas (days in flood) • Landslide‐prone areas (slope, rainfall,
geology, distance from active faults)• Earthquake (seismic areas in the past)• Cyclone (route, frequency)
ClassificationLowMediumHigh
Interpretation• Low: major (trunk) transport system can be
developed safely• Medium: Disaster preventive measures are
needed.• High: not recommended to build major
systems other than local systems
6. Environmental Framework –suitability analysis
48
Mya
nmar
Nat
iona
l Tra
nspo
rt D
evel
opm
ent M
aste
r Pl
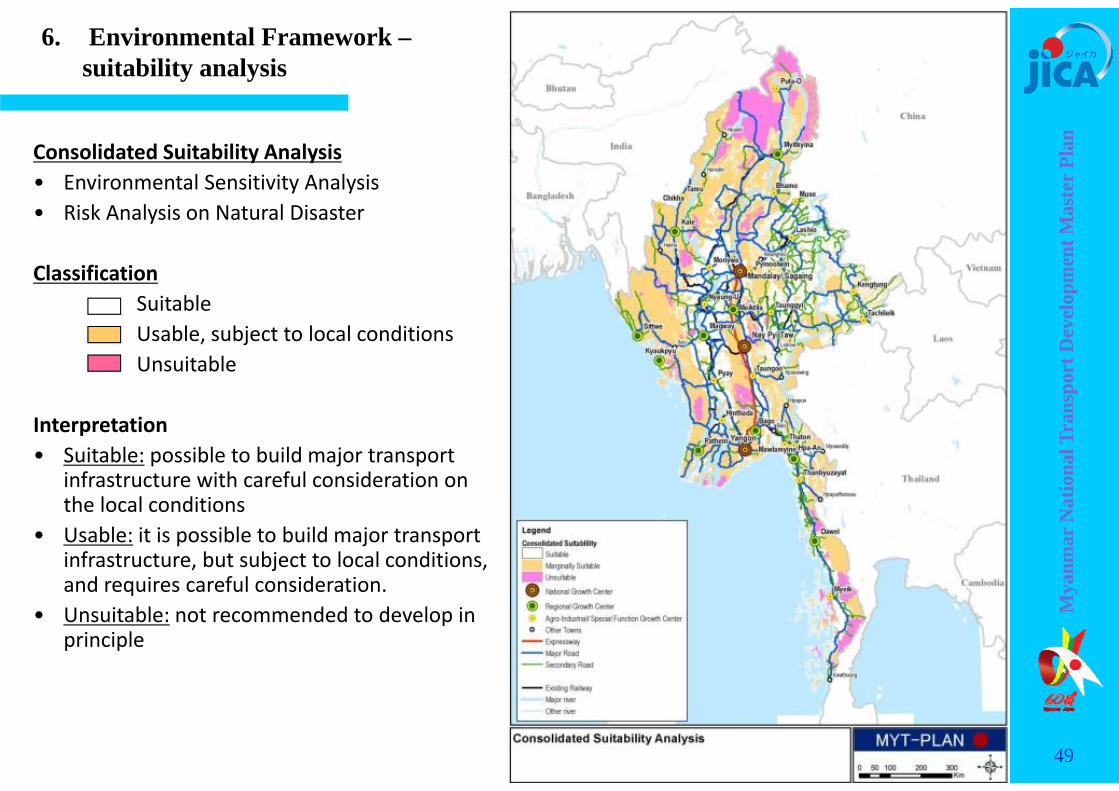
anConsolidated Suitability Analysis• Environmental Sensitivity Analysis• Risk Analysis on Natural Disaster
ClassificationSuitableUsable, subject to local conditionsUnsuitable
Interpretation• Suitable: possible to build major transport
infrastructure with careful consideration on the local conditions
• Usable: it is possible to build major transport infrastructure, but subject to local conditions, and requires careful consideration.
• Unsuitable: not recommended to develop in principle
49
6. Environmental Framework –suitability analysis

Mya
nmar
Nat
iona
l Tra
nspo
rt D
evel
opm
ent M
aste
r Pl
an
National Growth Centers: Nay Pyi Taw, Yangon, Mandalay / Sagaing
Regional Growth Centers: Myitkyina, Sittwe/Kyaukphyu, Pathein, Bago(Hanthawaddy), Mawlamyine, Dawei
Agro‐industrial Centers: Lashio, Shwebo, Kale, Monywa, Meiktila, Taunggyi, Taungoo , Magway, Pyay, Hinthada, Thaton, Hpa‐an
Special Function Growth Centers: Muse, Tamu, Nyaung‐U, Kengtung, Tachileik, Myawaddy, Myeik
MYT‐Plan NSDF Concept ofMulti‐Centric Balanced Development Strategy
7. National Spatial Development Framework (NSDF)
50

Mya
nmar
Nat
iona
l Tra
nspo
rt D
evel
opm
ent M
aste
r Pl
an
1a
Consistency with DHSHD Concept
Capital City(Administrative, Transport & Logistic Hub)
National Economic Growth Center(SEZ, Port, Int’l Airport, Trading, Financial)
Other Growth Center(Town with more than 50,000 inhabitants)
Secondary Regional Growth Center(Administrative, Transport & Logistic Hub)
7. National Spatial Development Framework (NSDF)
51

Mya
nmar
Nat
iona
l Tra
nspo
rt D
evel
opm
ent M
aste
r Pl
an
8. Transport Demand – passenger movement
2013 2030 52

Mya
nmar
Nat
iona
l Tra
nspo
rt D
evel
opm
ent M
aste
r Pl
an
8. Transport Demand – freight movement
2013 2030 53

Mya
nmar
Nat
iona
l Tra
nspo
rt D
evel
opm
ent M
aste
r Pl
an
9. Summary of Transport Sub‐sector in Myanmar
AIR TRANSPORT INLAND WATER ROAD RAILWAY MARITIME
OWNERSHIP - Ministry Min. of Transport (MOT) Min. of Transport (MOT) Min. of Construction (MOC) Min. of Rail Transport
(MORT)Min. of Transport (MOT)
- Infrastructure Dept of Civil Aviation Directorate of WaterResources & Improvementof River Systems (DWIR)
Department of PublicWorks (DPW)
Myanma Railways Co. Myanma Port Authority(MPA)
- Services Myanma Airways (domestic& international)
Inland Water Transport(IWT)
Road Transport Enterprise Myanma Railways Co. Myanma Five Star Line
6 other domestic carriers,e.g. Air Bagan, YangonAirways
Several private operators Other shipping lines, e.g.,Myanmar-Taiwan Co.Anawar Shipping
REGULATORY - Crew Flight Standard Division DMA DMA - Vehicle/Vessel Airworthiness Division DMA Vehicle & Driver licensing
by Road TransportAdministration, under
Directorate of MarineAdministration (DMA)
- Terminal/Port Aerodrome Standards &Safety Division
DWIR MPA
54

Mya
nmar
Nat
iona
l Tra
nspo
rt D
evel
opm
ent M
aste
r Pl
an
AIR TRANSPORT INLAND WATER ROAD RAILWAY MARITIME
DEMAND - Pax 3.5m domestic (2012);
2.0m international22m pax in 2011 2,028 million pax-km
(2011)67.6m pax in 2011; using248 pax-trains/day
No data. Likely to beinsignificant
- Freight negligible 4.7m tons of cargo in 2011 25.2m tons carried ontrucks (2011)
3.3m tons in 2011; using21 freight trains/day
22m MT in 2012
SUPPLY 27 Domestic Airports(paved)
6,650 km of navigable rivers;5 river network
142,395km of roads; ofwhich 18,740 are national
About 5,865km routelength
9 ports under MPA
28 unpaved airports More than 400 rivercraftsowned by IWT
39,241 km under the MOC 386 locomotives
3 International Airports, butonly 2 have int'l flights
Two jetties: Yangon &Pathein. No fixed structure inother riverports
432,504 vehicles + 1.9mMCs in 2011
1,252 pax coaches
Buses of various sizes,mostly private operated
3,311 freight wagons
REGULATORY - Crew Flight Standard Division DMA DMA - Vehicle/Vessel Airworthiness Division DMA Vehicle & Driver licensing
by Road TransportAdministration, under
Directorate of MarineAdministration (DMA)
- Terminal/Port Aerodrome Standards &Safety Division
DWIR MPA
9. Summary of Transport Sub‐sector in Myanmar (continued)
55
Mya
nmar
Nat
iona
l Tra
nspo
rt D
evel
opm
ent M
aste
r Pl
an
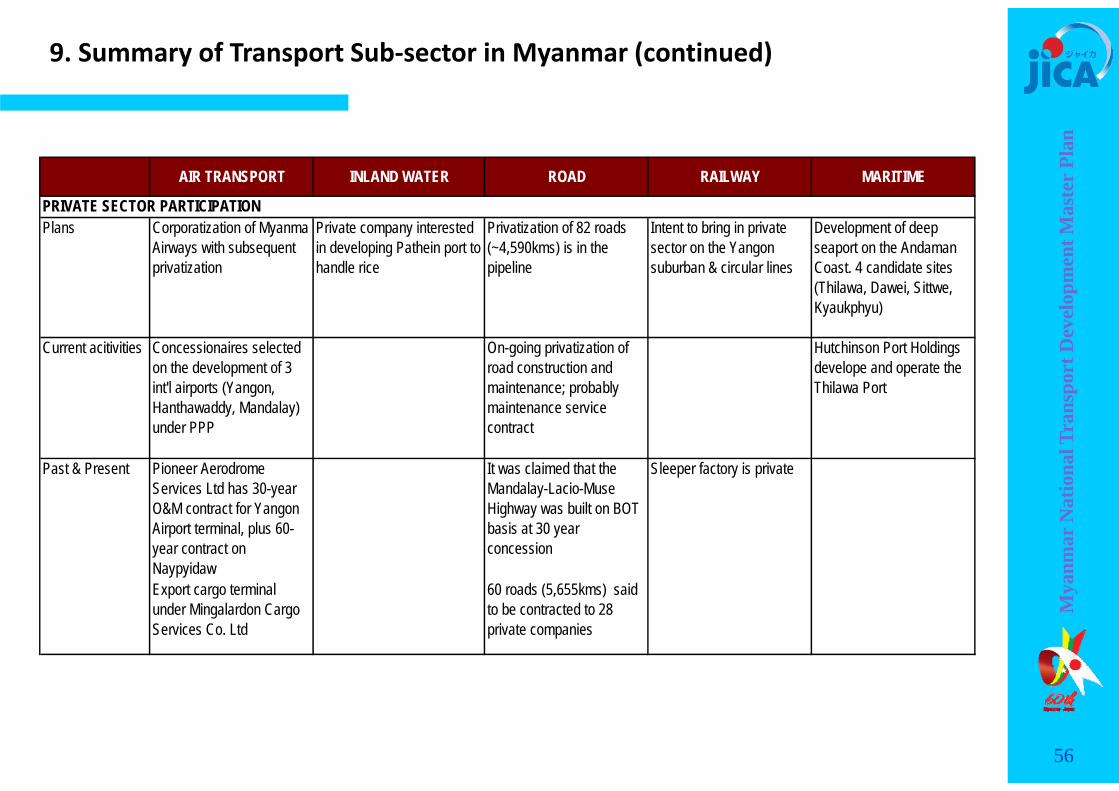
AIR TRANSPORT INLAND WATER ROAD RAILWAY MARITIME
Plans Corporatization of MyanmaAirways with subsequentprivatization
Private company interestedin developing Pathein port tohandle rice
Privatization of 82 roads(~4,590kms) is in thepipeline
Intent to bring in privatesector on the Yangonsuburban & circular lines
Development of deepseaport on the AndamanCoast. 4 candidate sites(Thilawa, Dawei, Sittwe,Kyaukphyu)
Current acitivities Concessionaires selectedon the development of 3int'l airports (Yangon,Hanthawaddy, Mandalay)under PPP
On-going privatization ofroad construction andmaintenance; probablymaintenance servicecontract
Hutchinson Port Holdingsdevelope and operate theThilawa Port
Past & Present Pioneer AerodromeServices Ltd has 30-yearO&M contract for YangonAirport terminal, plus 60-year contract onNaypyidaw
It was claimed that theMandalay-Lacio-MuseHighway was built on BOTbasis at 30 yearconcession
Sleeper factory is private
Export cargo terminalunder Mingalardon CargoServices Co. Ltd
60 roads (5,655kms) saidto be contracted to 28private companies
PRIVATE SECTOR PARTICIPATION
9. Summary of Transport Sub‐sector in Myanmar (continued)
56