Embed Size (px)
Citation preview
2014–15 BUDGET PAPER 3
Budget Statement
BUDGET PAPER 1 | BUDGET OVERVIEW
BUDGET PAPER 2 | BUDGET SPEECH
BUDGET PAPER 3 | BUDGET STATEMENT
BUDGET PAPER 4 | AGENCY STATEMENTS — VOLUMES 1, 2, 3, 4
BUDGET PAPER 5 | CAPITAL INVESTMENT STATEMENT
BUDGET PAPER 6 | BUDGET MEASURES STATEMENT
Published 19 June 2014ISSN 1440-8589
AcknowledgementsThis publication is printed on FSC certified paper.
Content from this publication may be reproduced with appropriate acknowledgement, as permitted under the Copyright Act 1968.
© Government of South Australia 2014
2014–15 BUDGET PAPERS

Budget Paper 3
2014–15 Budget Statement
Presented by The Honourable Tom Koutsantonis MP
Treasurer of South Australia on the Occasion of the Budget
for 2014–15

General enquiries regarding budget papers should be directed to:
The Under Treasurer Department of Treasury and Finance State Administration Centre 200 Victoria Square Adelaide SA 5000
Copies may be obtained from:
SERVICE SA Government Legislation Outlet Ground Floor EDS Centre 108 North Terrace Adelaide SA 5000
Website: www.treasury.sa.gov.au www.statebudget.sa.gov.au

Contents
Chapter 1: Budget context, strategy and outlook Budget context ................................................................................................................................... 3 Budget overview ................................................................................................................................ 3 Attachment: Variations since the 2013–14 Budget and the 2013–14 MYBR ............................... 15
Chapter 2: Expenditure New initiatives .................................................................................................................................. 22 General government operating expenditure ................................................................................... 30 General government investing expenditure .................................................................................... 38 Expenses by function (ABS Government Purpose Classifications)................................................ 40
Chapter 3: Revenue Overview .......................................................................................................................................... 41 General government sector revenue............................................................................................... 44 Taxation ........................................................................................................................................... 45 South Australia’s relative tax effort .................................................................................................. 53 Grant revenue .................................................................................................................................. 55 Sales of goods and services ........................................................................................................... 61 Interest income ................................................................................................................................ 62 Dividend and income tax equivalent income ................................................................................... 63 Other revenue .................................................................................................................................. 64 Annual fee and rate setting ............................................................................................................. 65 Developments in Commonwealth–state relations ........................................................................... 66
Chapter 4: Managing the state’s assets and liabilities Overview .......................................................................................................................................... 73 General government sector financial position ................................................................................. 74 Non-financial public sector financial position .................................................................................. 81 Management of assets and liabilities .............................................................................................. 84
Chapter 5: Government businesses Overview .......................................................................................................................................... 87 Financial arrangements and policy framework ............................................................................... 88 Public non-financial corporations — performance .......................................................................... 92 Capital investment ........................................................................................................................... 97 Net debt ........................................................................................................................................... 98 Public financial corporations............................................................................................................ 99 Full-time equivalents ..................................................................................................................... 100
2014–15 Budget Statement 1

Chapter 6: Risk statement Overview ........................................................................................................................................ 101 Revenue risks ................................................................................................................................ 101 Expenditure risks ........................................................................................................................... 107 Contingent liabilities ...................................................................................................................... 111
Chapter 7: South Australian economy Overview ........................................................................................................................................ 113 Recent economic performance ..................................................................................................... 114 Economic outlook .......................................................................................................................... 117
Chapter 8: Regional South Australia Overview ........................................................................................................................................ 119 Charter for stronger regional policy ............................................................................................... 119 Regional South Australia Cabinet Committee ............................................................................... 120 Regions South Australia ................................................................................................................ 121 Regional Statement for South Australia ........................................................................................ 121 South Australia’s Strategic Plan .................................................................................................... 121 Regional development portfolio programs .................................................................................... 122 Regional boundaries ..................................................................................................................... 123 Regional economic conditions ...................................................................................................... 123 Regional economic strategic priorities .......................................................................................... 124 Population and unemployment ...................................................................................................... 126 Regional economic profile ............................................................................................................. 127 Exports........................................................................................................................................... 128 2014–15 Budget — New Initiatives ............................................................................................... 129 Regional Capital Projects .............................................................................................................. 133
Appendices Appendix A: Uniform presentation framework ............................................................................. 137 Appendix B: General government and non-financial public sector financial
statistics time series ................................................................................................ 159 Appendix C: Consolidated Account ............................................................................................. 169 Appendix D: South Australian state public sector organisations ................................................. 177 Appendix E: Tax expenditure statement ...................................................................................... 181 Glossary of terms used in the budget statement .......................................................................... 189
2 2014–15 Budget Statement

Chapter 1: Budget context, strategy and outlook
Budget context
The 2014–15 Budget has again been framed in the context of the ongoing economic challenge arising from domestic and international economic fluctuations, along with the specific need to respond to the fiscal challenge posed by Commonwealth Government budget cuts.
International economic conditions have improved since the 2013–14 Budget with the world output growth forecast to reach 3.6 per cent in 2014 with above trend growth in the United States of America and continuing support from China, albeit with a moderating growth outlook.
The Australian economy has been relatively resilient through the protracted downturn in world economic conditions but growth is likely to remain below trend in 2014–15. Continuing low interest rates are expected to facilitate the transition from resource drivers of growth to housing and consumption led growth.
Housing construction activity in South Australia improved in 2013, supported by the government’s temporary construction grant. Overseas goods exports have recently reached record highs in value terms, and retail spending has shown signs of improvement. However the unemployment rate has risen over the year and the economy continues to have spare capacity.
The elevated level of the Australian dollar has had a dampening influence on investment opportunities in non-mining sectors of the economy. The announcement by GM Holden Ltd and Toyota Motor Corporation that they will cease manufacturing in Australia in 2017 will impact South Australia’s economy and employment. The government’s ‘Our Jobs Plan’ has been developed to assist those impacted by the impending closures in adapting to the new economic realities being experienced in South Australia and in other parts of the country.
Budget overview
A combination of the above economic context, commitments made in the March 2014 State Election, new budget initiatives and parameter updates to revenue and expenditure estimates, has required the government to take modest ongoing measures to ensure that the budget remains sustainable.
Announcements made in the 2014–15 Commonwealth Budget have imposed a range of unprecedented pressures on the South Australian budget. A clear strategy of the Commonwealth Government’s budget has been to transfer much of the hard work to the states.
Unless the Commonwealth Government reverses its position the government will need to implement a range of measures to prevent a major impact on the fiscal outlook.
The impact and proposed response to the Commonwealth Government decisions are set out below.
The budget continues the payroll tax reduction measures and stamp duty initiatives previously announced.
2014–15 Budget Statement 3

The 2014–15 Budget also includes measures to change the capital structure of SA Water, resulting in decreased general government sector net debt, along with changes in arrangements for the provision of Compulsory Third Party (CTP) insurance.
The final position of the 2014–15 Budget is outlined in table 1.1.
Table 1.1: Budget outlook — final budget position
2013–14 Estimated
Result 2014–15 Budget
2015–16 Estimate
2016–17 Estimate
2017–18 Estimate
Net operating balance ($m) -1 232 - 479 406 776 883
Net lending/borrowing ($m) -1 808 - 380 -2 587 814 617
Net debt ($m) 6 887 4 511 7 146 5 839 5 269
Net debt/revenue (%) 45.1% 28.1% 41.4% 32.3% 28.2%
The government has also initiated measures set to relieve business costs through a reduction in workers’ compensation levy costs. The government is currently consulting on draft legislation to better assist injured workers return to work and save registered businesses in South Australia in the order of $180 million per year through targeting an average premium rate of 1.5 per cent to 2 per cent (down from 2.75 per cent).
Budget impacts prior to the Commonwealth Government budget cuts
The state government is committed to ensuring the impact of its own decisions and other general economic conditions are reflected in the budget, and to take any necessary measures to maintain a fiscally responsible budget position.
In the lead up to the 2014 State Election, a number of expenditure commitments were made by the government. All election commitments have been funded and a number of additional initiatives are also announced as part of this budget.
Further details of all new expenditure initiatives in the 2014–15 Budget are set out in Chapter 2.
On the revenue side, key state taxation revenue (before policy measures) has been revised down by $313 million over the forward estimates driven by lower payroll tax, conveyance duty and gambling tax revenue forecasts. This is offset by increases in GST receipts of $355 million across the forward estimates, with the Commonwealth Government forecasting a larger pool — however, a slightly lower population share and relativity estimates partially offset this gain.
In order to maintain a sustainable fiscal path, the government has taken measures to fund budget initiatives and offset the impact of parameter adjustments.
Savings measures adopted to maintain the fiscal position include:
• additional efficiency dividends on agencies
• a pay freeze in 2014–15 for parliamentarians, executives and ministerial advisors
• public transport cost recovery for major events
• an increase to the extractive minerals royalty rate
The outcomes of future wage negotiations will be crucial in determining whether expenditure forward estimates in this budget can be achieved.
The government will limit future wage growth to 2.5 per cent per annum.
Chapter 1: Budget context, strategy and outlook
4 2014–15 Budget Statement
Any increases above this limit will need to be offset by productivity improvements or other cost reduction measures. If real wage restraint cannot be achieved, further FTE reductions and savings will be required in future budgets to maintain the fiscal position.
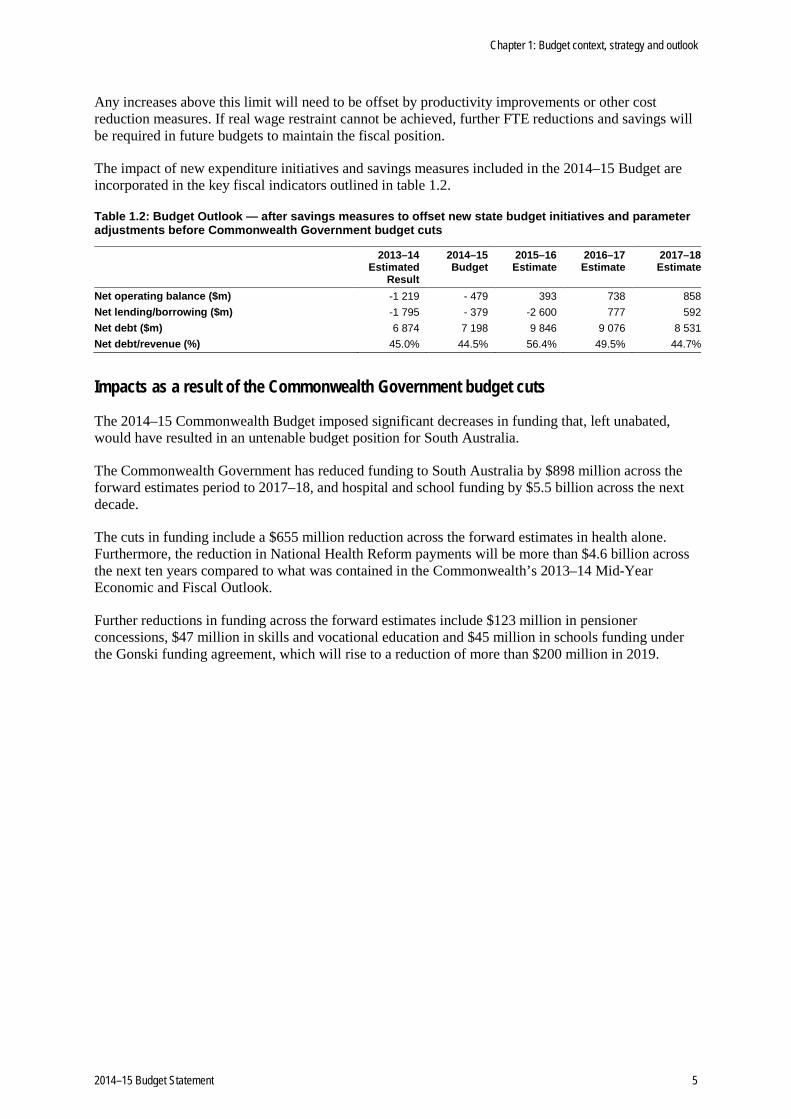
The impact of new expenditure initiatives and savings measures included in the 2014–15 Budget are incorporated in the key fiscal indicators outlined in table 1.2.
Table 1.2: Budget Outlook — after savings measures to offset new state budget initiatives and parameter adjustments before Commonwealth Government budget cuts
2013–14 Estimated
Result
2014–15 Budget
2015–16 Estimate
2016–17 Estimate
2017–18 Estimate
Net operating balance ($m) -1 219 - 479 393 738 858 Net lending/borrowing ($m) -1 795 - 379 -2 600 777 592 Net debt ($m) 6 874 7 198 9 846 9 076 8 531 Net debt/revenue (%) 45.0% 44.5% 56.4% 49.5% 44.7%
Impacts as a result of the Commonwealth Government budget cuts
The 2014–15 Commonwealth Budget imposed significant decreases in funding that, left unabated, would have resulted in an untenable budget position for South Australia.
The Commonwealth Government has reduced funding to South Australia by $898 million across the forward estimates period to 2017–18, and hospital and school funding by $5.5 billion across the next decade.
The cuts in funding include a $655 million reduction across the forward estimates in health alone. Furthermore, the reduction in National Health Reform payments will be more than $4.6 billion across the next ten years compared to what was contained in the Commonwealth’s 2013–14 Mid-Year Economic and Fiscal Outlook.
Further reductions in funding across the forward estimates include $123 million in pensioner concessions, $47 million in skills and vocational education and $45 million in schools funding under the Gonski funding agreement, which will rise to a reduction of more than $200 million in 2019.
Chapter 1: Budget context, strategy and outlook
2014–15 Budget Statement 5

Table 1.3 Commonwealth Government budget cuts
2013–14 Estimate
2014–15 Budget
2015–16 Estimate
2016–17 Estimate
2017–18 Estimate
Net debt
Health funding National Health Reform Agreement — - 37.4 - 73.9 - 116.0 - 217.0 National Partnership Agreement on Improving Public Hospital Services
— - 7.9 - 28.0 - 42.0 - 42.0
National Partnership Agreement on Financial Assistance for Long Stay Older Patients
— - 10.6 - 10.6 - 10.6 - 10.6
Health National Partnership reward payments — - 6.9 - 6.9 - 12.1 — Other national partnerships National Partnership Agreement on Preventative Health
— - 3.9 - 3.9 - 3.9 - 3.9
National Partnership Agreement on Indigenous Early Childhood Development
— - 1.8 - 1.8 - 1.8 - 1.8
Total Health related funding — - 68.6 - 125.1 - 186.4 - 275.3 - 655.4 Other impacts
National Education Reform Agreement (NERA) — — — — - 45.0 National Partnership Agreement on Skills Reform — — — — - 38.4 National Partnership Agreement on Training Places for Single and Teenage Parents
— - 2.2 - 2.2 - 2.2 - 2.2
National Partnership Agreement on Certain Concessions for Pensioner Concession Card and Seniors Card Holders
— - 29.2 - 30.5 - 31.4 - 32.1
Northern Expressway - 12.8 — — — — National Partnership Agreement to Deliver a Seamless National Economy
- 8.1 — — — —
Other Commonwealth Budget impacts(a) 8.4 - 1.0 - 2.5 - 4.0 - 6.8 Total other impacts - 12.5 - 32.5 - 35.2 - 37.5 - 124.6 - 242.2 Total Commonwealth Budget cuts - 12.5 - 101.1 - 160.3 - 223.9 - 399.9 - 897.6
(a) Minor adjustments to specific purpose payments and other agreements.
Table 1.4 outlines the impact of the Commonwealth Government budget on the state budget’s key fiscal parameters.
Table 1.4: Budget outlook — after Commonwealth Government budget cuts
2013–14 Estimated 2014–15 2015–16 2016–17 2017–18 Result Budget Estimate Estimate Estimate
Net operating balance ($m) -1 232 - 581 227 499 426 Net lending/borrowing ($m) -1 808 - 482 -2 767 538 160 Net debt ($m) 6 887 7 314 10 128 9 597 9 484 Net debt/revenue (%) 45.1% 45.5% 58.6% 53.0% 50.8%
The government maintains that the Commonwealth Government should reverse those funding cuts, and will continue to advocate for this outcome. However, given the Commonwealth Government’s current position, South Australia has been forced to find a way to accommodate the transfer to the state of the Commonwealth Government’s budget repair program.
It has been necessary to respond to the funding cuts contained in the Commonwealth Government budget by implementing measures to mitigate their impact on South Australia. These budget response measures have been unavoidable in the context of maintaining a sustainable budget path into the future.
The budget response measures adopted in reply to the funding cuts contained in the 2014–15 Commonwealth Budget include:
Chapter 1: Budget context, strategy and outlook
6 2014–15 Budget Statement

• removing Emergency Services Levy (ESL) general remissions on fixed and mobile property to save $357 million (net of administration costs) over the forward estimates
• identifying reductions in hospital beds or other health service reductions to save $332 million over the forward estimates
• no longer providing concessions on local government rates from 1 July 2015 saving $98 million over the forward estimates
• reducing funding to schools by $45 million in 2017–18 to reflect changes to Commonwealth Government funding under the National Education Reform Agreement. There is no change to the state government’s commitment under the Agreement
• responding to the discontinuation of National Partnerships on Preventative Health, Indigenous Early Childhood Development, Skills Reform, and Training Places for Single and Teenage Parents by reducing associated expenditure.
These measures are required to offset the Commonwealth Government budget impacts on the net debt position by 30 June 2018.
Table 1.5 Commonwealth Budget cut response measures
2013–14 Estimate
2014–15 Budget
2015–16 Estimate
2016–17 Estimate
2017–18 Estimate
Net debt
Fixed property ESL — remove general remissions (includes administration costs)
— 85.2 78.5 79.0 79.5
Mobile property ESL — remove general remissions — 7.3 9.0 9.1 9.3 Health system response — — 45.0 107.0 180.0 Remove local government rate concession — — 32.4 32.7 33.1 Flow through of expenditure reductions — National Partnership Agreement on Preventative Health
— 3.9 3.9 3.9 3.9
Flow through of expenditure reductions — National Partnership Agreement on Indigenous Early Childhood Development
— 1.8 1.8 1.8 1.8
Flow through of expenditure reductions — NERA — — — — 45.0 Flow through of expenditure reductions — Skills Reform
— — — — 38.4
Flow through of expenditure reductions — National Partnership Agreement on Training Places for Single and Teenage Parents
— 2.2 2.2 2.2 2.2
Flow through of other expenditure changes(a) — -1.6 -1.6 -1.6 0.2 Total measures — 98.8 171.2 234.1 393.4 897.5
(a) Adjustment for funding flows under the Project Agreement for Independent Public Schools Initiative and other agreements.
In addition, given the significant reductions to health funding in the 2014–15 Commonwealth Budget there is a need to re-assess the areas of capital expenditure to ensure the most efficient and appropriate use of health facilities. Consequently three projects: The Queen Elizabeth Hospital stage 3A, Modbury Hospital and Noarlunga Health Service stage 2A redevelopments have been suspended. The funding previously allocated to these projects plus funding to redevelop the Flinders Medical Centre announced in the 2014 State Election have been redirected into a Health Capital Reconfiguration Fund.
Table 1.6: Budget outlook — after response measures to the 2014–15 Commonwealth Budget cuts
2013–14 Estimated 2014–15 2015–16 2016–17 2017–18 Result Budget Estimate Estimate Estimate
Net operating balance ($m) -1 232 - 482 403 748 852 Net lending/borrowing ($m) -1 808 - 382 -2 590 787 586 Net debt ($m) 6 887 7 214 9 851 9 071 8 533 Net debt/revenue (%) 45.1% 44.6% 56.7% 49.8% 45.5%
Chapter 1: Budget context, strategy and outlook
2014–15 Budget Statement 7

Other Budget impacts
The 2014–15 Budget also includes the impact of two other factors.
Motor accident insurance
The government has decided to open the provision of Compulsory Third Party (CTP) insurance to the private sector in South Australia from 1 July 2016.
As part of this initiative, the Motor Accident Commission (MAC) will end its role as the sole provider of CTP insurance in South Australia and this will allow MAC to cease writing new CTP insurance policies and run off its claims against policies issued up to and including 30 June 2016.
Consequently, this will allow MAC to pay $500 million in 2016–17 from its surplus net assets into the Highways Fund to invest in improving the safety of roads in South Australia.
SA Water gearing
The government has determined to change SA Water’s debt to asset gearing ratio to bring it into line with its interstate statutory water corporation counterparts. Further detail on this change can be found in Chapters 4 and 5.
This will bring SA Water’s debt to asset ratio up from around 27 per cent to around 45 per cent, comparable to many of its interstate water utility peers. The adjustment in balance sheet structure for SA Water will have no impact on the pricing to water consumers as the level of actual debt held by SA Water plays no part in water pricing determinations by the Essential Services Commission of South Australia (ESCOSA).
The increase in SA Water’s debt to asset ratio will reduce reported profits and make comparisons with interstate statutory water corporations more relevant. It will also make state level general government net debt ratios more comparable.
The impact on the budget of those changes is shown in the final budget position below.
Table 1.7: Budget outlook — final budget position after motor accident insurance decision and SA Water gearing level adjustment
2013–14 Estimated 2014–15 2015–16 2016–17 2017–18 Result Budget Estimate Estimate Estimate
Net operating balance ($m) -1 232 - 479 406 776 883 Net lending/borrowing ($m) -1 808 - 380 -2 587 814 617 Net debt ($m) 6 887 4 511 7 146 5 839 5 269 Net debt/revenue (%) 45.1% 28.1% 41.4% 32.3% 28.2%
There is a reduction in general government indebtedness resulting from the MAC contribution and regearing of SA Water.
The impact of the MAC contribution is a reduction of $500 million in 2016–17 and results in an underlying reduction in the general government net debt to revenue ratio of around 2.8 percentage points. The SA Water gearing level change will reduce net debt by a further $2.7 billion per annum from 2014–15, and will result in a further underlying reduction of around 15 per cent in the general government net debt to revenue ratio.
On this basis the government has resolved to reduce the net debt to revenue target to 35 per cent to preserve the integrity of the fiscal targets. There is no change in the Non-Financial Public Sector net debt position from the restructuring of SA Water gearing levels.
Chapter 1: Budget context, strategy and outlook
8 2014–15 Budget Statement

Fiscal targets
To achieve the fiscal strategy, the government is committed to the following fiscal targets set out in table 1.8 below.
Table 1.8: Fiscal targets
Target 1 a net operating surplus by the end of the forward estimates
Target 2 once surplus is achieved, operating expenditure growth will be limited to trend growth in household income
Target 3 achieve a level of general government net debt that remains affordable over the forward estimates — a maximum ration of net debt to revenue of 35 per cent
Underpinning the general government debt target the government continues its commitments that:
• consistent with the government’s obligations under the Competition Principles Agreement, operations of public corporations that cannot be paid for from their own revenue streams will be funded from the budget
• the defined benefit unfunded superannuation liability will be fully funded by 2034.
For the reasons set out above, the following fiscal outlook discussion focuses on the general government sector.
Target 1 reflects the government’s commitment to funding operating expenditures from operating revenues during the expansionary phase of the economic cycle and once the recovery phase is underway. The 2014–15 Budget provides net operating balance surpluses from 2015–16.
Once surplus is achieved, Target 2 limits the growth in operating expenditure in order to maintain a pattern of sustainable growth, irrespective of the growth in revenues during the expansionary phase of the cycle. The 2014–15 Budget continues the emphasis on expenditure restraint to restore the overall fiscal position. Refer to Chapter 2 for more details on expenditure.
Target 3 facilitates, in conjunction with the preceding targets, the maintenance of a reasonable debt level that allows for investment in key infrastructure without the burden being placed on future generations.
In previous budgets, Target 3 has been set at 50 per cent. However, to reflect the change in the gearing level of SA Water, the maximum net debt to revenue ratio has been reduced to 35 per cent from 2014–15 onwards. This change in gearing results in a reduction of net debt in the general government sector with a corresponding increase in the public non-financial corporations sector. The net debt of the total non-financial public sector remains changed. More information on this is contained in Chapter 4.
This target will not be met in 2015–16 due to the recognition of the finance lease liability for the new Royal Adelaide Hospital on the state’s balance sheet. However, the government considers this a unique situation and necessary in order to provide state-of-the-art hospital and health care facilities for current and future generations of South Australians.
If the change in the gearing of SA Water did not occur, the outcomes for Target 3 would be the same and are outlined in table 1.9.
In addition to the fiscal target on debt, the government continues to provide funding from the budget to public corporations for non-commercial operations that form part of government policy. An example of this is the Community Service Obligations (CSO) that SA Water undertakes for the government for
Chapter 1: Budget context, strategy and outlook
2014–15 Budget Statement 9

items such as works in remote communities. Further information on public corporations can be found in Chapter 5.
The government is also on target to fully fund the state’s defined benefit superannuation liability by 2034. Further information on the state’s unfunded superannuation liability can be found in Chapter 4.
Table 1.9 provides the outcome for the fiscal targets based on the 2014–15 Budget estimates.
Table 1.9: Fiscal targets outcomes — 2014–15 Budget estimates
2013–14 Estimated 2014–15 2015–16 2016–17 2017–18 Result Budget Estimate Estimate Estimate
Target 1: net operating balance surplus Target To be in surplus by the end of the forward estimates 2014–15 Budget estimate ($m) -1 232 - 479 406 776 883
Target 2: operating expenditure growth Target (%) n/a n/a <4.5% <4.5% <4.5% 2014–15 Budget estimate ($m) 1.3% 0.4% 1.8% 2.7% 2.7%
Target 3: net debt to revenue ratio Target (%) <50% <35% <35% <35% <35% 2014–15 Budget estimate ($m) 45.1% 28.1% 41.4% 32.3% 28.2%
Target 3: net debt to revenue ratio (not including change to SA Water gearing level) Target (%) <50% <50% <50% <50% <50% 2014–15 Budget estimate (%) 45.1% 44.6% 56.7% 47.0% 42.6%
Chapter 1: Budget context, strategy and outlook
10 2014–15 Budget Statement

Summary of key fiscal indicators
Table 1.10 sets out the expected budget outcomes for 2013–14 and across the forward estimates for a number of key fiscal indicators.
Table 1.10: Summary of key general government sector budget indicators
2013–14 2012–13 Estimated 2014–15 2015–16 2016–17 2017–18 Actual Result Budget Estimate Estimate Estimate
Operating statement Net operating balance ($m) - 948 -1 232 - 479 406 776 883 Net lending ($m) -1 003 -1 808 - 380 -2 587 814 617
Revenue and expenses Revenue real growth (%) -5.5 -3.2 2.8 4.8 2.3 0.6 Expenses real growth (%) -1.3 -1.5 -2.1 -0.6 0.2 0.2
Balance sheet Net debt ($m) 5 227 6 887 4 511 7 146 5 839 5 269 Net debt to revenue (%) 34.1 45.1 28.1 41.4 32.3 28.2 Unfunded superannuation ($m) 11 085 10 506 10 360 10 189 9 990 9 762
Note: Real-terms calculations use the Adelaide Consumer Price Index.
Operating statement
Net operating balance
Net operating deficits are still expected in 2013–14 and 2014–15, before the budget returns to surplus in 2015–16.
Figure 1.1 illustrates that the general government sector net operating balance was in surplus from 2002–03 until the onset of the GFC pushed the budget into deficit in 2008–09. A net operating surplus was again achieved for 2009–10, primarily as a result of the nature and timing of Commonwealth Government grants and expenditure carryovers into 2010–11. Since then, pressures on expenditure and shortfalls in revenue have made the budget environment extremely difficult to achieve operating surpluses.
Chapter 1: Budget context, strategy and outlook
2014–15 Budget Statement 11
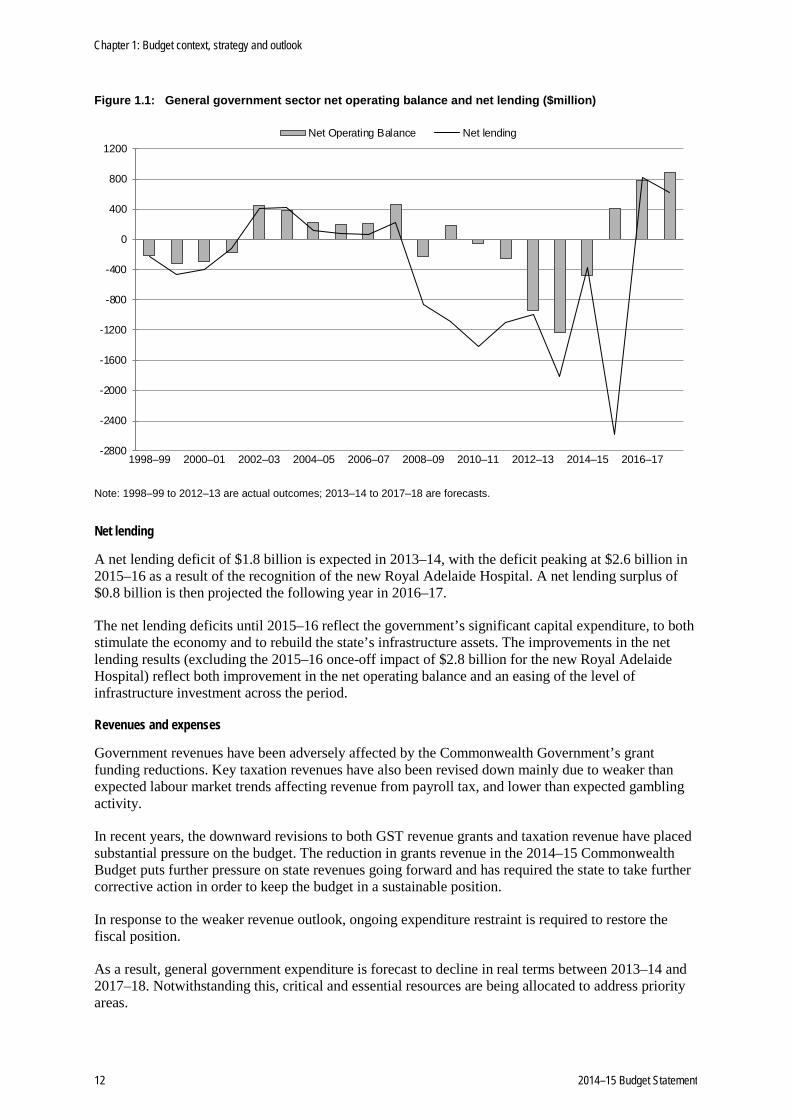
Figure 1.1: General government sector net operating balance and net lending ($million)
-2800
-2400
-2000
-1600
-1200
-800
-400
0
400
800
1200
1998–99 2000–01 2002–03 2004–05 2006–07 2008–09 2010–11 2012–13 2014–15 2016–17
Net Operating Balance Net lending
Note: 1998–99 to 2012–13 are actual outcomes; 2013–14 to 2017–18 are forecasts.
Net lending
A net lending deficit of $1.8 billion is expected in 2013–14, with the deficit peaking at $2.6 billion in 2015–16 as a result of the recognition of the new Royal Adelaide Hospital. A net lending surplus of $0.8 billion is then projected the following year in 2016–17.
The net lending deficits until 2015–16 reflect the government’s significant capital expenditure, to both stimulate the economy and to rebuild the state’s infrastructure assets. The improvements in the net lending results (excluding the 2015–16 once-off impact of $2.8 billion for the new Royal Adelaide Hospital) reflect both improvement in the net operating balance and an easing of the level of infrastructure investment across the period.
Revenues and expenses
Government revenues have been adversely affected by the Commonwealth Government’s grant funding reductions. Key taxation revenues have also been revised down mainly due to weaker than expected labour market trends affecting revenue from payroll tax, and lower than expected gambling activity.
In recent years, the downward revisions to both GST revenue grants and taxation revenue have placed substantial pressure on the budget. The reduction in grants revenue in the 2014–15 Commonwealth Budget puts further pressure on state revenues going forward and has required the state to take further corrective action in order to keep the budget in a sustainable position.
In response to the weaker revenue outlook, ongoing expenditure restraint is required to restore the fiscal position.
As a result, general government expenditure is forecast to decline in real terms between 2013–14 and 2017–18. Notwithstanding this, critical and essential resources are being allocated to address priority areas.
Chapter 1: Budget context, strategy and outlook
12 2014–15 Budget Statement
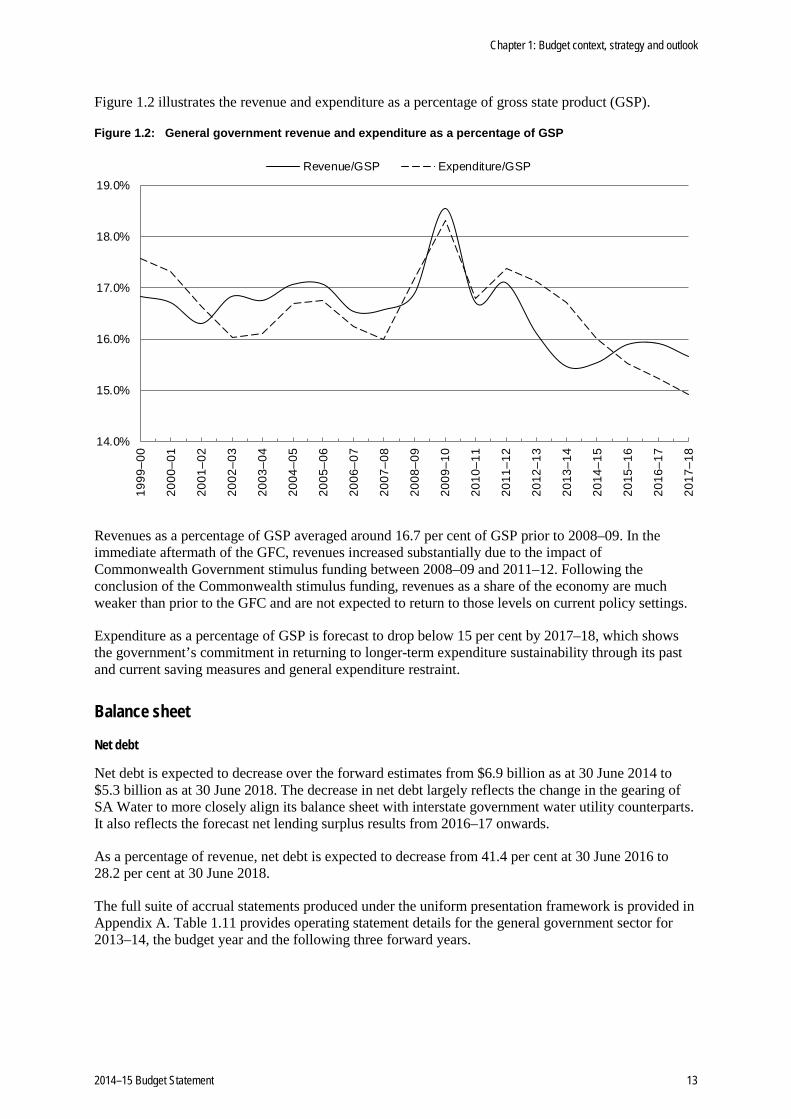
Figure 1.2 illustrates the revenue and expenditure as a percentage of gross state product (GSP).
Figure 1.2: General government revenue and expenditure as a percentage of GSP
14.0%
15.0%
16.0%
17.0%
18.0%
19.0%
1999
–00
2000
–01
2001
–02
2002
–03
2003
–04
2004
–05
2005
–06
2006
–07
2007
–08
2008
–09
2009
–10
2010
–11
2011
–12
2012
–13
2013
–14
2014
–15
2015
–16
2016
–17
2017
–18
Revenue/GSP Expenditure/GSP
Revenues as a percentage of GSP averaged around 16.7 per cent of GSP prior to 2008–09. In the immediate aftermath of the GFC, revenues increased substantially due to the impact of Commonwealth Government stimulus funding between 2008–09 and 2011–12. Following the conclusion of the Commonwealth stimulus funding, revenues as a share of the economy are much weaker than prior to the GFC and are not expected to return to those levels on current policy settings.
Expenditure as a percentage of GSP is forecast to drop below 15 per cent by 2017–18, which shows the government’s commitment in returning to longer-term expenditure sustainability through its past and current saving measures and general expenditure restraint.
Balance sheet
Net debt
Net debt is expected to decrease over the forward estimates from $6.9 billion as at 30 June 2014 to $5.3 billion as at 30 June 2018. The decrease in net debt largely reflects the change in the gearing of SA Water to more closely align its balance sheet with interstate government water utility counterparts. It also reflects the forecast net lending surplus results from 2016–17 onwards.
As a percentage of revenue, net debt is expected to decrease from 41.4 per cent at 30 June 2016 to 28.2 per cent at 30 June 2018.
The full suite of accrual statements produced under the uniform presentation framework is provided in Appendix A. Table 1.11 provides operating statement details for the general government sector for 2013–14, the budget year and the following three forward years.
Chapter 1: Budget context, strategy and outlook
2014–15 Budget Statement 13

Table 1.11: General government sector operating statement — 2013–14 to 2017–18 ($million)
2013–14 2013–14 Estimated 2014–15 2015–16 2016–17 2017–18 Budget Result Budget Estimate Estimate Estimate
Revenue Taxation revenue 4 206 4 121 4 524 4 795 5 020 5 236 Grants GST revenue grants 4 595 4 618 4 956 5 315 5 814 6 063 Other grants 3 288 3 236 3 313 3 748 3 807 3 805 Sales of goods and services 2 077 2 199 2 282 2 353 2 441 2 513 Interest income 102 33 32 35 37 39 Dividend and income tax equivalent income 328 375 256 298 261 271 Other 669 673 704 713 711 732 Total revenue 15 265 15 254 16 067 17 258 18 090 18 659 less Expenses Employee expenses 7 155 7 258 7 268 7 271 7 347 7 554 Superannuation expenses Superannuation interest cost 434 468 443 436 429 420 Other superannuation expenses 754 781 796 798 807 820 Depreciation and amortisation 895 864 927 990 1 065 1 084 Interest expenses 379 304 232 319 465 462 Other property expenses — — — — — — Other operating expenses 3 975 4 210 4 254 4 396 4 470 4 579 Grants 2 585 2 601 2 626 2 642 2 732 2 858 Total expenses 16 176 16 487 16 547 16 852 17 315 17 776 equals Net operating balance - 911 -1 232 - 479 406 776 883 plus
Other economic flows 337 1 077 395 474 564 630 equals Comprehensive result — total change in net worth
- 574 - 155 - 84 880 1 340 1 513
Net operating balance - 911 -1 232 - 479 406 776 883 less Net acquisition of non-financial assets Purchases of non-financial assets 1 858 1 567 1 217 4 067 1 125 1 374 less Sales of non-financial assets 419 127 389 84 99 25 less Depreciation 895 864 927 990 1 065 1 084 plus Change in inventories — — — — — — plus Other movements in non-financial assets
— — — — — —
equals Total net acquisition of non-financial assets
544 576 - 99 2 993 - 39 266
equals Net lending/borrowing -1 455 -1 808 - 380 -2 587 814 617
Note: Totals may not add due to rounding.
The attachment to this chapter summarises the variations since the 2013–14 Budget to the general government net operating balance (table 1.12) and net lending estimates (table 1.13).
The attachment also summarises the variations to revenue, expenses and capital investment expenditure since the 2013–14 Mid-Year Budget Review (MYBR) (table 1.14), together with some commentary on those variations.
Chapter 1: Budget context, strategy and outlook
14 2014–15 Budget Statement

Attachment: Variations since the 2013–14 Budget and the 2013–14 MYBR
Table 1.12: Net operating balance — policy and parameter variations since the 2013–14 Budget ($million)
2013–14 2014–15 2015–16 2016–17
Estimate at 2013–14 Budget -911 -431 375 661
Parameter and other variations Revenue — taxation 12 -25 -63 -114 Revenue — other 114 46 7 31 Operating expenses -32 -6 59 60
Net effect of parameter and other variations 95 15 3 - 23
Policy measures Revenue measures — taxation — -1 -2 -2 Revenue measures — other -1 — — — Revenue offsets 16 51 78 100 Operating expenses -173 -153 -156 -127 Use of provisions 18 8 5 6
Net effect of policy measures - 139 - 96 - 75 - 24
Estimate at 2013–14 Mid-Year Budget Review - 955 - 511 303 614
Parameter and other variations Revenue — taxation - 97 - 21 - 40 - 60 Revenue — other - 35 - 81 - 196 - 330 Operating expenses - 71 214 209 318
Net effect of parameter and other variations -203 111 -27 -72
Policy measures up to the 2014–15 Budget Revenue measures — taxation — — — — Revenue measures — other — — — — Revenue offsets — taxation — — — — Revenue offsets -0 8 -2 -2 Operating expenses - 40 - 51 - 38 - 34
Net effect of policy measures up to the 2014–15 Budget -40 -43 -39 -35
Policy measures in the 2014–15 Budget Revenue measures — taxation — 93 88 88 Revenue measures — other - 21 - 93 - 149 - 211 Revenue offsets — 66 118 136 Operating expenses - 13 - 101 113 255 Use of provisions — — — —
Net effect of policy measures in the 2014–15 Budget -34 -36 169 268
Estimate at 2014–15 Budget -1 232 - 479 406 776
Note: Totals may not add due to rounding.
Chapter 1: Budget context, strategy and outlook
2014–15 Budget Statement 15

Table 1.13: Net lending ― policy and parameter variations since the 2013–14 Budget ($million)
2013–14 2014–15 2015–16 2016–17
Estimate at 2013–14 Budget -1 455 - 118 -2 306 744
Net effect of operating variations to 2013–14 MYBR - 44 - 80 - 72 - 47
Investing variations(a) Parameter variations - 43 - 159 - 167 - 32 Policy variations 36 107 31 - 5 Use of specific provisions to offset policy variations 1 1 — —
Total investing variations - 6 - 51 - 136 - 37
Estimate at 2013–14 MYBR -1 505 - 249 -2 514 660
Net effect of operating variations - 277 32 103 161
Investing variations(a) Parameter variations - 21 - 51 14 134 Policy variations up to the 2014–15 Budget - 5 - 53 - 24 3 Policy variations in the 2014–15 Budget — - 68 - 179 - 181 Use of specific provisions to offset policy variations — 9 13 37
Total investing variations - 26 - 163 - 176 - 7
Estimate at 2014–15 Budget -1 808 - 380 -2 587 814
Note: Totals may not add due to rounding.
(a) Investing variations relate to movements in the net acquisition of non-financial assets.
Chapter 1: Budget context, strategy and outlook
16 2014–15 Budget Statement

Table 1.14: Revenue, expense and capital investment expenditure variations (parameter and other) since the 2013–14 MYBR ($million)
2013–14 2014–15 2015–16 2016–17 Revenue — taxation Payroll tax -42 -48 -60 -75 Conveyances -48 -16 -15 -24 Land tax — private -0 2 2 2 Land tax — public -5 -4 -4 -4 Other property tax 2 30 33 33 Insurance taxes 4 22 12 12 Gambling taxes -10 -8 -6 -3 Motor vehicle taxes 3 1 -0 -1 Total taxation revenue -97 -21 -40 -60
Revenue — other GST revenue grants 11 8 -6 -41 Commonwealth specific purpose and national partnership grants - SPP grants -28 7 14 18 - NP grants -30 12 -88 -107 Other contributions and grants -0 3 2 2 Sales of goods and services 69 87 92 96 Dividends and income tax equivalents 18 -115 -79 -114 Interest income -68 -83 -119 -148 Royalties 14 18 16 2 Other revenue -19 -19 -28 -37 Total other revenue -35 -81 -196 -330
Operating expenses Nominal superannuation interest expense — 10 10 10 Interest Expense 73 193 251 305 Depreciation 35 52 53 51 Carryovers (net of provision for slippage) - 85 90 - 4 - 1 Other Variations - 93 - 131 - 101 - 48 Total expenses - 71 214 209 318
Net capital investment expenditure Depreciation - 35 - 52 - 53 - 51 Carryovers (net of provision for slippage) 114 - 68 5 - 50 Other Variations - 101 69 62 235 Total net capital investment expenditure -21 -51 14 134
Note: Totals may not add due to rounding.
Chapter 1: Budget context, strategy and outlook
2014–15 Budget Statement 17

Variations in revenue estimates (parameter and other)
Since the 2013–14 Mid-Year Budget Review (MYBR) taxation revenues have been revised down in all years mainly reflecting year to date experience as well as a more modest labour market outlook from 2015–16, in light of recent decisions to cease manufacturing passenger vehicles in Australia.
Payroll tax revenues have been softer than expected in the first half of 2014, with lower than expected payroll tax revenues in 2013–14 flowing through as a base effect in future years. From 2015–16, expectations for employment and wages growth have been revised down reflecting a more moderate growth outlook for employment given the decision by GM Holden Ltd and Toyota Motor Corporation to close their vehicle manufacturing operations in Australia.
Conveyance duty revenue has been revised down by $48 million in 2013–14, and by smaller amounts across the forward estimates mainly due to a lower than expected number of non-residential property transfers. Revenue from large conveyance duty transactions was strong in the first few months of the year but there have been fewer large conveyance duty transactions than expected since that time. Consequently, expected revenue from large transactions has been revised down in 2013–14 only.
Residential property transfers have grown strongly from the relatively low levels experienced in recent years, but non-residential property transfers are expected to be only slightly higher than those recorded in 2012–13. Total real property market turnover is still expected to return to long term trend levels by 2016–17.
More modest growth for household income in the out years as a result of GM Holden Ltd’s decision to cease local vehicle manufacturing is expected to impact on property prices in 2016–17 and 2017–18. Property prices are expected to grow by 3.0 per cent in those years compared to 3.5 per cent assumed in the MYBR.
Slightly higher residential land value growth forecasts relevant to 2014–15 land tax collections result in a small upward revision to private sector land tax revenue from 2014–15. The downward revision to public sector land tax revenue in 2013–14 primarily reflects updated advice on the land tax liabilities of government corporations in 2013–14. This flows through as a base effect across the forward estimates.
Other property taxes have been revised up mainly due to higher guarantee fee revenue from 2014–15 following the $2.7 billion increase in SA Water’s debt.
Revenue from insurance duty has been revised up in 2013–14 based on year to date experience which flows through as a base effect into future years. The upward revision in 2013–14 is partially offset by the timing of back payments of duty relating to life insurance riders, with some back payments now expected in 2014–15.
Gambling tax receipts have been revised down in all years primarily reflecting lower than expected growth in gaming machine net gambling revenue in 2013–14 which flows through as a base effect into future years. This impact is offset in part over the forward years by higher expected gambling tax revenues from SA Lotteries as well as reforms to gaming machine regulations.
South Australia’s GST revenue grants have been revised up in 2013–14 and 2014–15 but revised down in the remaining years. Expected growth in the national GST pool was revised up in all years in the Commonwealth’s 2014–15 Budget reflecting higher than expected consumption and the reintroduction of the fuel excise indexation. This impact is partially offset in 2014–15 and more than offset from 2015–16 by downward revisions to South Australia’s estimated population share and revisions to South Australia’s share of the GST pool to incorporate a range of factors, including the Commonwealth Grants Commission 2014 Update.
Chapter 1: Budget context, strategy and outlook
18 2014–15 Budget Statement

Commonwealth specific purpose payment (SPP) grants have been revised down in 2013–14 mainly due to the timing of a budget neutrality adjustment for the Disability Services SPP relating to 2012–13, which was made by the Commonwealth Government in 2013–14. Upward revisions to SPPs from 2014–15 mainly relate to an increase in funding for non-government schools (which is on-passed in full), offset in part by reduced funding for health and disability services.
Commonwealth national partnership (NP) grants have been revised down in 2013–14 and up in 2014–15 mainly due to the re-profiling of grant funding related to sub-acute health services, with some of these funds now expected to be received in 2014–15.
This timing impact offsets a number of downward revisions to NPs from 2014–15, with these downward revisions also impacting the out years. Downward revisions have been made to NPs relating to trade training centres, dental services and Local Government Financial Assistance Grants following the Commonwealth's decision to pause indexation for three years commencing 1 July 2014. Some disability aged care grant revenue has also been reclassified to sales of goods and services revenue. The government had specific revenue provisions factored into the budget for the Commonwealth Government’s Infrastructure Investment Programme (previously referred to as Nation Building 2). With funding for the North–South Corridor upgrade at Darlington announced in the Commonwealth Government’s 2014–15 Budget, this provision has been removed and the measure presented as a policy initiative in the budget papers. This treatment also contributes to the downward parameter revisions to NP grants from 2015–16.
The upward revision to sales of goods and services revenue in all years is mainly due to the reclassification of local health network revenue from other revenue as well as the reclassification of revenue for disability aged care from grant funding. Commonwealth contributions relating to the Pharmaceutical Benefits Scheme have also been revised up in all years.
Dividend and income tax equivalent revenue has been revised up in 2013–14 mainly due to the South Australian Government Financing Authority (SAFA) achieving better than estimated operating results and making a special dividend payment from Playford Capital as well as SA Water having lower than expected depreciation expenses. These upward revisions are partially offset by a downward revision to Renewal SA’s dividend due to the delay in commercial property sales.
A reduction in SA Water’s budgeted profit as a result of additional interest and guarantee fee expense following SA Water’s $2.7 billion increase in debt and changes in the forecast timing of proposed land and commercial property sales by Renewal SA are the main factors contributing to a downward revision to distributions over the forward years.
Interest income had been revised down significantly across the forward estimates reflecting the impact of netting off the Treasurer’s funds held on deposit with SAFA against the Treasurer’s borrowings. This set-off, pursuant to an agreement between the Treasurer and SAFA, better reflects the true borrowing position, and thus borrowing costs.
Royalty revenue has been revised up in 2013–14 due mainly to increased sales of crude oil, with additional petroleum fields having commenced production. Upward revisions to royalty revenue over the forward years mainly reflect higher petroleum production forecasts as well as higher gas prices from renewed sales contracts.
The downward revision to other revenues in all years mainly reflects the reclassification of local health network revenue to sales of goods and services.
Chapter 1: Budget context, strategy and outlook
2014–15 Budget Statement 19
Variations in expense and capital investment expenditure estimates (parameter and other)
The nominal superannuation interest expense in 2013–14 is expected to be $467.7 million, consistent with forecasts in the 2013–14 MYBR. The expense from 2014–15 is lower, reflecting the impact of a decline in the long-term Commonwealth bond rate, which is a key determinant of the expense.
Interest expenses for 2013–14 are broadly in line with the forecast at the time of the 2013–14 MYBR. Across the forward estimates there is a reduction in interest expenses largely reflecting the SA Water gearing level change which will reduce general government net debt by $2.7 billion in 2014–15.
Depreciation expenditure has been revised downwards largely due to a realignment of depreciation and amortisation budgets in the Department for Health and Ageing based on the current asset register, its current capital program and expected completion dates. Depreciation rates for multiple major projects have increased from 20 years to 40 years.
Carryover expenditure reflects under expenditure by agencies in 2013–14, which will now be incurred in later years. Operating carryovers from 2013–14 to 2014–15 and future years are $65 million. The 2014–15 Budget also includes adjustments to the provision for operating slippage over the forward estimates based on the recent average level of carryovers applied to the revised operating expenditure budget in each year.
The movements in the ‘other variations’ category in 2013–14 are largely due to:
• an $80 million increase in provisions for targeted voluntary separation package (TVSP) payments in 2013–14, largely reflecting an increase in activity in the lead up to the reduced TVSP offer that will apply from 1 July 2014
• a $14 million (indexed) increase per annum from 2013–14 aligning state expenditure with Commonwealth Government reimbursements under the Pharmaceutical Benefits Scheme.
Variations across the forward estimates include transactions that have no net budget impact but both expenses and revenue vary and the reclassification of some transactions in accordance with accounting standards.
The carryover of investing expenditure in 2013–14 reflects delays in project expenditure. Where appropriate, an estimate of expenditure for these projects has been carried forward into future years. Investing carryovers from 2013–14 to 2014–15 and future years are $254 million. The 2014–14 Budget also includes adjustments to the provision for project slippage over the forward estimates based on the recent average level of carryovers applied to the revised investing expenditure budget in each year.
The large movements in the Net Capital Investment Expenditure ‘other variations’ category are due to re-profiles of capital project expenditure across the forward estimates and revised timing of asset sales. It also reflects the removal of provisions held for major projects now presented as policy initiatives within the budget papers, such as the North–South Corridor upgrade at Darlington.
Chapter 1: Budget context, strategy and outlook
20 2014–15 Budget Statement
Chapter 2: Expenditure
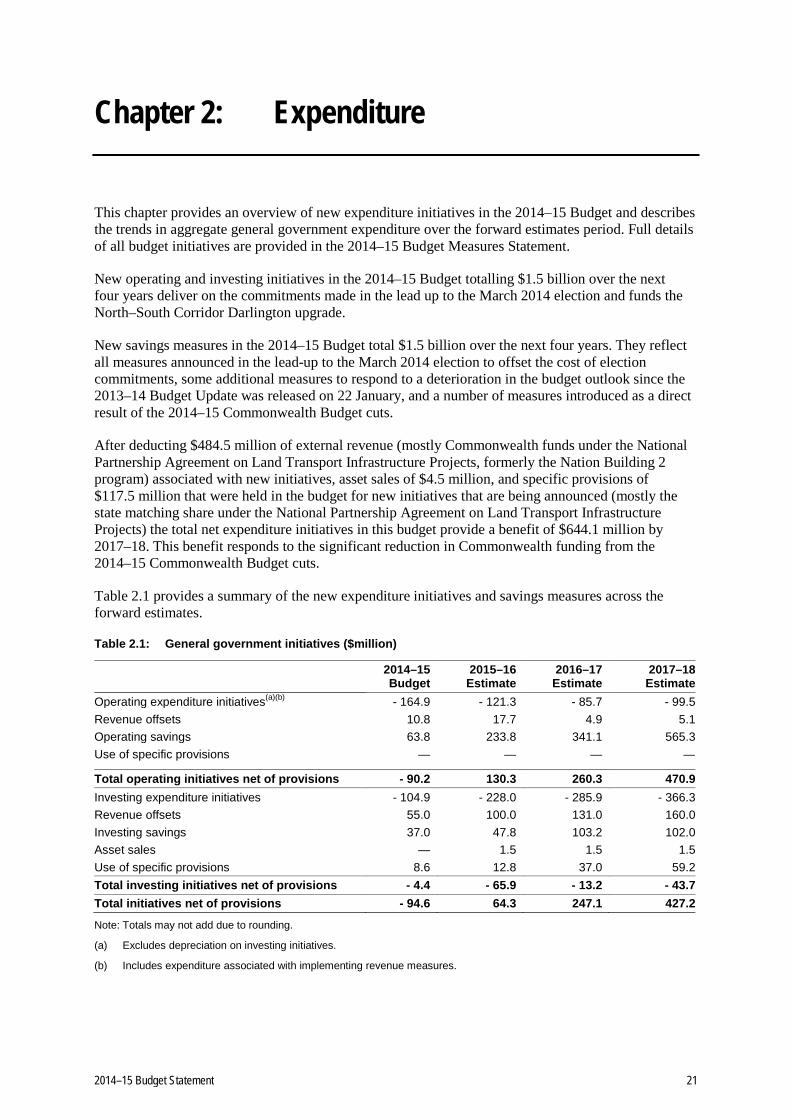
This chapter provides an overview of new expenditure initiatives in the 2014–15 Budget and describes the trends in aggregate general government expenditure over the forward estimates period. Full details of all budget initiatives are provided in the 2014–15 Budget Measures Statement.
New operating and investing initiatives in the 2014–15 Budget totalling $1.5 billion over the next four years deliver on the commitments made in the lead up to the March 2014 election and funds the North–South Corridor Darlington upgrade.
New savings measures in the 2014–15 Budget total $1.5 billion over the next four years. They reflect all measures announced in the lead-up to the March 2014 election to offset the cost of election commitments, some additional measures to respond to a deterioration in the budget outlook since the 2013–14 Budget Update was released on 22 January, and a number of measures introduced as a direct result of the 2014–15 Commonwealth Budget cuts.
After deducting $484.5 million of external revenue (mostly Commonwealth funds under the National Partnership Agreement on Land Transport Infrastructure Projects, formerly the Nation Building 2 program) associated with new initiatives, asset sales of $4.5 million, and specific provisions of $117.5 million that were held in the budget for new initiatives that are being announced (mostly the state matching share under the National Partnership Agreement on Land Transport Infrastructure Projects) the total net expenditure initiatives in this budget provide a benefit of $644.1 million by 2017–18. This benefit responds to the significant reduction in Commonwealth funding from the 2014–15 Commonwealth Budget cuts.
Table 2.1 provides a summary of the new expenditure initiatives and savings measures across the forward estimates.
Table 2.1: General government initiatives ($million)
2014–15 2015–16 2016–17 2017–18 Budget Estimate Estimate Estimate
Operating expenditure initiatives(a)(b) - 164.9 - 121.3 - 85.7 - 99.5 Revenue offsets 10.8 17.7 4.9 5.1 Operating savings 63.8 233.8 341.1 565.3 Use of specific provisions — — — —
Total operating initiatives net of provisions - 90.2 130.3 260.3 470.9 Investing expenditure initiatives - 104.9 - 228.0 - 285.9 - 366.3 Revenue offsets 55.0 100.0 131.0 160.0 Investing savings 37.0 47.8 103.2 102.0 Asset sales — 1.5 1.5 1.5 Use of specific provisions 8.6 12.8 37.0 59.2 Total investing initiatives net of provisions - 4.4 - 65.9 - 13.2 - 43.7 Total initiatives net of provisions - 94.6 64.3 247.1 427.2
Note: Totals may not add due to rounding.
(a) Excludes depreciation on investing initiatives.
(b) Includes expenditure associated with implementing revenue measures.
2014–15 Budget Statement 21

New initiatives
New operating initiatives in the general government sector total $471.4 million over the next four years and deliver on commitments given in the lead up to the March 2014 election. Major initiatives include:
• $70.0 million over four years to establish a Jobs Accelerator Fund to support job creation in regional areas and increase the funding available to the Regional Development Fund and Regional Development Australia to $15.0 million per annum and $3.0 million per annum respectively
• $52.0 million over two years (in addition to $11.0 million in 2013–14) in additional resources towards the Skills for All initiative, to ensure industry training needs are met while supporting the state's economic priorities
• $41.7 million over four years to provide for a $50 increase in the annual energy and medical heating and cooling concession paid to eligible recipients from 1 July 2014
• $18.0 million over four years in additional resources to maintain the level of service for employment and volunteer screening applications to ensure full and thorough assessments under the Children’s Protection Act 1993
• $15.0 million in 2014–15 for discretionary payments to some teachers whose long service leave entitlements will be reduced following amendments to the Education Act 1972
• $15.0 million per annum from 2017–18 for the operating costs of the expanded neonatal unit at the Flinders Medical Centre
• $14.0 million over two years to introduce an $8500 grant for people over 60 years of age who want to right-size their principal place of residence and purchase a new home to live in
• $13.7 million over four years for additional Family Services Coordinators and Allied Health Officers to provide for expanded services in existing children’s centres
• $9.7 million over three years to provide increased payments from the Victims of Crime Fund
• $9.0 million over three years to establish Green Industries SA to work with the business, government and the environmental sector to realise the full potential of the green economy, help business to find overseas markets for their waste management knowledge and skills and reduce business costs through more efficient use of raw materials, water and energy
• $8.9 million over four years for GPS-based electronic monitoring bracelets for the intensive monitoring of serious violent offenders and child sex offenders
• $8.4 million over four years (in addition to $600 000 of investing expenditure in 2014–15) to establish an independent Mental Health Commission in South Australia. The Commission will monitor and provide advice on programs and services across-government, including those in education, employment and housing, that impact on people with a mental illness.
A summary of the operating initiatives by agency is shown in table 2.2.
Chapter 2: Expenditure
22 2014–15 Budget Statement

Table 2.2: Operating initiatives by agency ($million)(a)
Agency 2014–15 Budget
2015–16 Estimate
2016–17 Estimate
2017–18 Estimate
Attorney-General - 18.7 - 6.7 - 6.1 - 6.2 Communities and Social Inclusion - 25.1 - 21.4 - 16.9 - 16.8 Correctional Services - 2.3 - 2.2 - 2.2 - 2.3 Courts — — — — Defence SA — — - 0.5 - 0.5 Education and Child Development - 7.2 - 6.4 - 5.9 - 5.2 Electoral Commission — — — — Emergency Services — CFS — — — — Emergency Services — MFS — — — — Emergency Services — SAFECOM - 0.2 - 0.1 - 0.1 - 0.1 Emergency Services — SES — — — — Environment, Water and Natural Resources - 3.7 - 5.9 - 6.5 - 6.1 Environment Protection Authority - 0.1 — — — Health and Ageing - 9.6 - 8.7 - 11.6 - 26.7 Planning, Transport and Infrastructure - 1.5 - 2.5 - 2.8 - 3.2 Police - 1.0 - 1.0 - 1.0 - 1.0 Premier and Cabinet - 12.5 - 4.4 - 4.1 - 3.6 Primary Industries and Regions - 28.4 - 18.7 - 17.2 - 17.0 State Development - 40.7 - 28.2 - 5.9 - 6.0 Tourism - 1.5 - 2.5 - 2.0 - 2.5 Treasury and Finance - 0.9 - 0.9 - 0.2 - 0.2 Zero Waste — — — — Across Government
Compulsory third party insurance reforms - 2.5 - 2.5 - 0.5 — Additional ministerial office - 2.1 - 2.2 - 2.2 - 2.3 Seniors Housing Grant — introduction - 7.0 - 7.0 — —
Total operating initiatives - 164.9 - 121.3 - 85.7 - 99.5
Note: Totals may not add due to rounding.
(a) Includes administered items of agencies.
New investing initiatives in the general government sector total $985.1 million over the next four years.
The initiatives include two joint state and Commonwealth Government funded projects under the National Partnership Agreement on Land Transport Infrastructure Projects.
The government had specific provisions for the national partnership in the budget (both revenue from the Commonwealth Government and the state matching share) based on an estimate of the state’s share of the program. As projects are confirmed these provisions are removed and the projects presented as initiatives within the budget papers.
The two national partnership projects announced in this budget have a total cost of $647.0 million, with $547.0 million of new project funds being spent over the next four years.
• $620.0 million ($520.0 million of which will be spent over the next four years) for the joint Commonwealth Government and state funded North–South Corridor Darlington upgrade, including construction of 2.3 kilometres of road between Southern Expressway and Ayliffes Road at Darlington, improvements to the intersections of Marion Road and Sturt Road, South Road and Daws Road and localised upgrading of South Road through Edwardstown.
Chapter 2: Expenditure
2014–15 Budget Statement 23
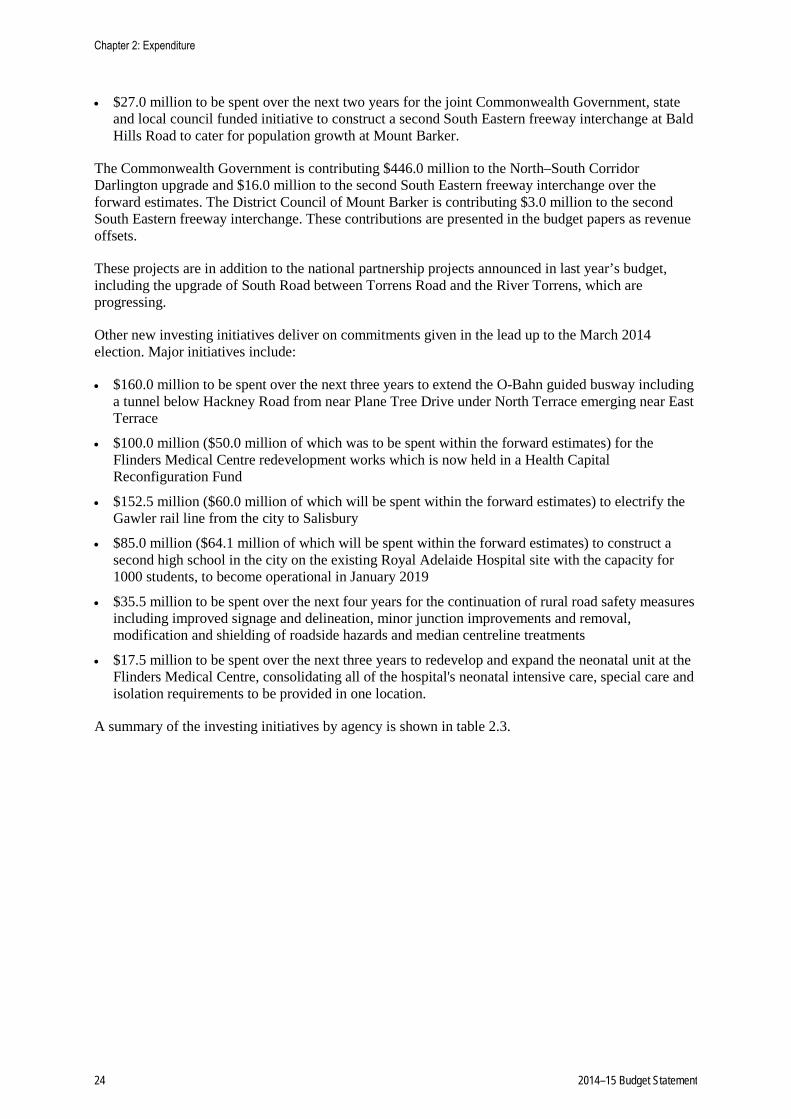
• $27.0 million to be spent over the next two years for the joint Commonwealth Government, state and local council funded initiative to construct a second South Eastern freeway interchange at Bald Hills Road to cater for population growth at Mount Barker.
The Commonwealth Government is contributing $446.0 million to the North–South Corridor Darlington upgrade and $16.0 million to the second South Eastern freeway interchange over the forward estimates. The District Council of Mount Barker is contributing $3.0 million to the second South Eastern freeway interchange. These contributions are presented in the budget papers as revenue offsets.
These projects are in addition to the national partnership projects announced in last year’s budget, including the upgrade of South Road between Torrens Road and the River Torrens, which are progressing.
Other new investing initiatives deliver on commitments given in the lead up to the March 2014 election. Major initiatives include:
• $160.0 million to be spent over the next three years to extend the O-Bahn guided busway including a tunnel below Hackney Road from near Plane Tree Drive under North Terrace emerging near East Terrace
• $100.0 million ($50.0 million of which was to be spent within the forward estimates) for the Flinders Medical Centre redevelopment works which is now held in a Health Capital Reconfiguration Fund
• $152.5 million ($60.0 million of which will be spent within the forward estimates) to electrify the Gawler rail line from the city to Salisbury
• $85.0 million ($64.1 million of which will be spent within the forward estimates) to construct a second high school in the city on the existing Royal Adelaide Hospital site with the capacity for 1000 students, to become operational in January 2019
• $35.5 million to be spent over the next four years for the continuation of rural road safety measures including improved signage and delineation, minor junction improvements and removal, modification and shielding of roadside hazards and median centreline treatments
• $17.5 million to be spent over the next three years to redevelop and expand the neonatal unit at the Flinders Medical Centre, consolidating all of the hospital's neonatal intensive care, special care and isolation requirements to be provided in one location.
A summary of the investing initiatives by agency is shown in table 2.3.
Chapter 2: Expenditure
24 2014–15 Budget Statement

Table 2.3: Investing initiatives by agency ($million)(a)
Agency 2014–15 Budget
2015–16 Estimate
2016–17 Estimate
2017–18 Estimate
Attorney-General — — — — Communities and Social Inclusion — — — — Correctional Services — — — — Courts — — — — Defence SA — — — — Education and Child Development - 4.1 - 6.8 - 19.3 - 42.5 Electoral Commission — — — — Emergency Services — CFS - 0.1 — — — Emergency Services — MFS — — — — Emergency Services — SAFECOM — — — — Emergency Services — SES — — — — Environment, Water and Natural Resources - 0.5 - 2.5 - 3.5 - 2.0 Environment Protection Authority — — — — Health and Ageing - 10.0 - 17.1 - 15.6 - 40.0 Planning, Transport and Infrastructure - 86.2 - 198.0 - 247.5 - 281.8 Police - 3.9 - 3.7 - 0.0 - 0.0 Premier and Cabinet — — — — Primary Industries and Regions — — — — State Development — — — — Tourism — — — — Treasury and Finance — — — — Zero Waste — — — — Total investing initiatives - 104.9 - 228.0 - 285.9 - 366.3
Note: Totals may not add due to rounding.
(a) Includes administered items of agencies.
Savings
New operating and investing savings initiatives in the 2014–15 Budget total $1.5 billion over the next four years.
Savings initiatives of $665.2 million over four years were announced in the lead up to the March 2014 election, including:
• $200.0 million over four years by reducing unallocated provisions for major capital projects
• $189.0 million over three years by reforming procurement arrangements undertaken by agencies which may include moving to whole of government procurement strategies. The allocation of this saving to agencies will be undertaken during 2014–15
• $86.2 million over four years by reducing expenditure on non-service consultants and contractors, government advertising and travel and associated costs
• $42.9 million over four years by freezing executive numbers for two years. Agencies will not be permitted to fill executive vacancies that occur during 2014–15 and 2015–16 except in special circumstances
• $19.5 million over four years from merging the Department of Further Education, Employment, Science and Technology and the Department for Manufacturing, Innovation, Trade, Resources and Energy to create the Department of State Development and other efficiencies following the merger
Chapter 2: Expenditure
2014–15 Budget Statement 25

• $12.0 million of unallocated expenditure held in the South Australian Housing Trust's (SAHT) Affordable Housing Program in 2014–15 is being redirected to meet other housing priorities including the installation of solar hot water systems on SAHT properties and the construction of a city disability respite facility
• $12.0 million over four years from the merger and rationalisation of public sector functions currently performed by the Office for Public Sector Renewal, Office for Public Employment and Review and Public Sector Workforce Relations division.
Additional savings measures of $280.2 million over four years have also been introduced to respond to the current budget outlook.
• Additional efficiency dividend — an additional efficiency dividend of 1.0 per cent of the net cost of services in 2015–16 ($61.4 million) and a further 1.0 per cent per annum from 2017–18 ($65.2 million). Consistent with the previous efficiency dividends this excludes the judicial areas of courts, police officers and frontline emergency services staff, prison operations, disabilities and schools.
• Executives and ministerial office contract staff salary freeze — $4.7 million per annum through freezing executive and ministerial office contract staff salaries at current levels for 12 months over the period 1 July 2014 to 30 June 2015
• Natural Resource Management Boards — reduce support by $1.0 million per annum from 2014–15.
• Parliamentarian salary freeze — $630 000 per annum through freezing parliamentary salaries at current levels for 12 months over the period 1 July 2014 to 30 June 2015. Parliamentary salaries are linked to the salaries of Commonwealth Government parliamentarians and other public office holders which are to be frozen, subject to a final determination by the Commonwealth Remuneration Tribunal.
Other savings measures totalling $548.7 million over four years have been introduced in response to the 2014–15 Commonwealth Budget cuts.
• National Health Agreements — the 2014–15 Commonwealth Budget reduced funding to South Australia by $655.4 million over the forward estimates. Given the state budget does not have the capacity to replace the funding withdrawn by the Commonwealth Government, three measures have been introduced.
– Removing Emergency Services Levy (ESL) remissions on fixed and mobile property. This measure is discussed in Chapter 3.
– In the absence of any reversal of the Commonwealth Government decision to cut funding, the government will identify reductions in hospital beds or other health service reductions to save $332.0 million over the forward estimates.
– As a response to the discontinuation of the national partnership agreements on Preventative Health and Indigenous Early Childhood Development, associated expenditure will be reduced by $5.7 million per annum from 2014–15.
• Concessions for Pensioner Concession Card and Seniors Card Holders — the government will cease providing concessions on local government rates from 1 July 2015 saving $32.4 million per annum (indexed) from 2015–16 in response to the Commonwealth Government’s decision to abolish the national partnership.
• National Education Reform Agreement — Commonwealth Government support will be maintained at agreed levels until the end of the 2017 calendar year, after which indexation will reduce to CPI and enrolment growth. This is inconsistent with the signed funding arrangement, and results in a reduction of $45.0 million in school funding and associated expenditure in 2017–18.
• Skills Reform — the 2014–15 Commonwealth Budget ceased funding for the continuation of the national partnership from 2017–18. The national partnership assists in providing access to
Chapter 2: Expenditure
26 2014–15 Budget Statement

Vocational Education and Training programs for working age people. As a result, funding and associated expenditure will be reduced by an estimated amount of $38.4 million in 2017–18.
• Training Places for Single and Teenage Parents — the Commonwealth Government has ceased the existing national partnership a year earlier than budgeted and will not renew it. This agreement provided training places at the Certificate II level or above for single and teenage parents to improve their skills. As a result funding and associated expenditure will be reduced by $2.2 million per annum from 2014–15.
The government had previously announced funding of $184.1 million for three projects: The Queen Elizabeth Hospital stage 3A, Modbury Hospital and Noarlunga Health Service stage 2A redevelopments. Following the significant cuts to health funding in the 2014–15 Commonwealth Budget the state needs to re-assess the areas of capital expenditure to ensure the most efficient and appropriate use of health facilities. As a result these three projects have been suspended. The funding for these projects, along with $100.0 million announced during the election to redevelop the Flinders Medical Centre have been redirected into a Health Capital Reconfiguration Fund ($234.1 million of which has been allocated over the next four years).
A summary of the operating savings initiatives by agency is shown in table 2.4. The effect of the savings measures on each agency’s FTE numbers is detailed in table 2.12.
Table 2.4: Operating savings by agency ($million)(a)
Agency 2014–15 Budget
2015–16 Estimate
2016–17 Estimate
2017–18 Estimate
Attorney-General 1.1 3.0 3.0 4.0 Communities and Social Inclusion 14.0 6.7 6.9 11.8 Correctional Services 0.2 1.1 1.1 1.8 Courts — 0.1 0.1 0.2 Defence SA — 0.1 0.1 0.2 Education and Child Development 3.4 13.0 13.4 67.6 Electoral Commission — — — — Emergency Services — CFS — — — — Emergency Services — MFS — 0.1 0.1 0.3 Emergency Services — SAFECOM — 0.1 0.1 0.2 Emergency Services — SES — — — — Environment, Water and Natural Resources 2.1 4.3 4.4 6.5 Environment Protection Authority — — — — Health and Ageing 17.5 94.4 157.2 263.6 Planning, Transport and Infrastructure 2.0 5.8 5.9 8.8 Police 0.9 2.2 2.2 3.5 Premier and Cabinet 4.6 7.8 8.0 10.6 Primary Industries and Regions 0.5 1.7 1.8 2.7 State Development 9.6 15.8 15.9 60.1 Tourism 0.2 0.7 0.7 1.3 Treasury and Finance 1.4 2.3 2.4 3.2 Zero Waste — — — — Across Government
Executives and ministerial office contract staff salary freeze 4.7 4.8 4.9 5.0
Information technology efficiencies — 0.7 1.5 2.0 Major projects review 1.0 1.0 1.0 1.0 Parliamentarian salary freeze 0.6 0.6 0.7 0.7 Procurement efficiencies — 35.0 77.0 77.0 Remove Local Government rate concessions — 32.4 32.7 33.1
Total operating savings 63.8 233.8 341.1 565.3
Note: Totals may not add due to rounding.
(a) Includes administered items of agencies.
A summary of the total investing savings initiatives by agency is shown in table 2.5.
Chapter 2: Expenditure
2014–15 Budget Statement 27

Table 2.5: Investing savings by agency ($million)(a)
Agency 2014–15 Budget
2015–16 Estimate
2016–17 Estimate
2017–18 Estimate
Attorney-General — — — — Communities and Social Inclusion — — — — Correctional Services — — — — Courts — — — — Defence SA — — — — Education and Child Development 6.0 1.5 30.4 23.8 Electoral Commission — — — — Emergency Services — CFS — — — — Emergency Services — MFS — — — — Emergency Services — SAFECOM — — — — Emergency Services — SES — — — — Environment, Water and Natural Resources 6.0 6.3 7.8 8.1 Environment Protection Authority — — — — Health and Ageing — — — — Planning, Transport and Infrastructure — — — — Police — — — — Premier and Cabinet — — — — Primary Industries and Regions — — — — State Development — — — — Tourism — — — — Treasury and Finance — — — — Zero Waste — — — — Across government
Major Projects 25.0 40.0 65.0 70.0 Total investing savings 37.0 47.8 103.2 102.0
Note: Totals may not add due to rounding.
(a) Includes administered items of agencies.
In addition to the investing savings the government will sell Crown lands that are surplus to requirements to generate $1.5 million per annum from 2015–16.
The size of the operating savings and revenue measures introduced since the 2008–09 Mid-Year Budget Review, including the new measures announced in the 2014–15 Budget, is set out in table 2.6.
Table 2.6: Operating savings and revenue measures since the 2008–09 MYBR
$million Delivered in 2009–10 37 Delivered in 2010–11 200 Delivered in 2011–12 352 Delivered in 2012–13 122 Delivered in 2013–14 estimate 282 To commence in 2014–15 276 To commence in 2015–16 313 To commence in 2016–17 208 To commence in 2017–18 286
Since the 2013–14 Mid-Year Budget Review the government has decided not to proceed with cuts to Education Adelaide and has provided $900 000 per annum (indexed) from 2015–16 to allow Education Adelaide to continue operations as a destination marketing entity for international students.
Chapter 2: Expenditure
28 2014–15 Budget Statement

Measures approved after the 2013–14 Mid-Year Budget Review
In addition to measures approved in the 2014–15 Budget, several initiatives were approved in the period following the 2013–14 MYBR. These initiatives are shown as memorandum items in the 2014–15 Budget Measures Statement and include:
• $54.0 million over four years (in addition to $6.1 million in 2013–14) in operating expenditure for a range of measures to revitalise and rebuild the state economy following the decision by GM Holden Ltd to close its vehicle manufacturing operations in Australia by 2017
• $34.6 million over two years (in addition to $8.9 million in 2013–14) in investing expenditure and $4.3 million in 2014–15 in operating expenditure for road safety initiatives. Total funding of $100 million was provided by the Motor Accident Commission (MAC) in the 2013–14 Budget, which has already funded road safety initiatives worth $52.3 million
• $25.6 million over two years (in addition to $6.7 million in 2013–14) in investing expenditure for a new State Drill Core Reference Library at Tonsley Park, partially funded from the sale of current facilities and re-allocation of funds from the Brukunga Mine project
• $16.5 million in 2015–16 in investing expenditure for proposed building and auxiliary works to interface the Adelaide Festival Theatre with the proposed redevelopment of the Adelaide Festival Centre Car Park and Plaza. The government will also sub-lease 400 car park spaces at a cost of $30 million over 30 years
• $14.2 million over four years in operating expenditure to extend the current provision of counsellors in category 1 to 5 primary schools to also include category 6 and 7 primary schools
• $9.3 million over four years in operating expenditure for the expansion of the Patient Assistance Transport Scheme (PATS) including the redesign of the PATS database
• $8.9 million in 2014–15 in state matching expenditure to enable the continuation of services provided under the National Partnership Agreement on Homelessness for one year. These services include early intervention, medium-term accommodation options and home based support to sustain the transition to independent living.
Chapter 2: Expenditure
2014–15 Budget Statement 29
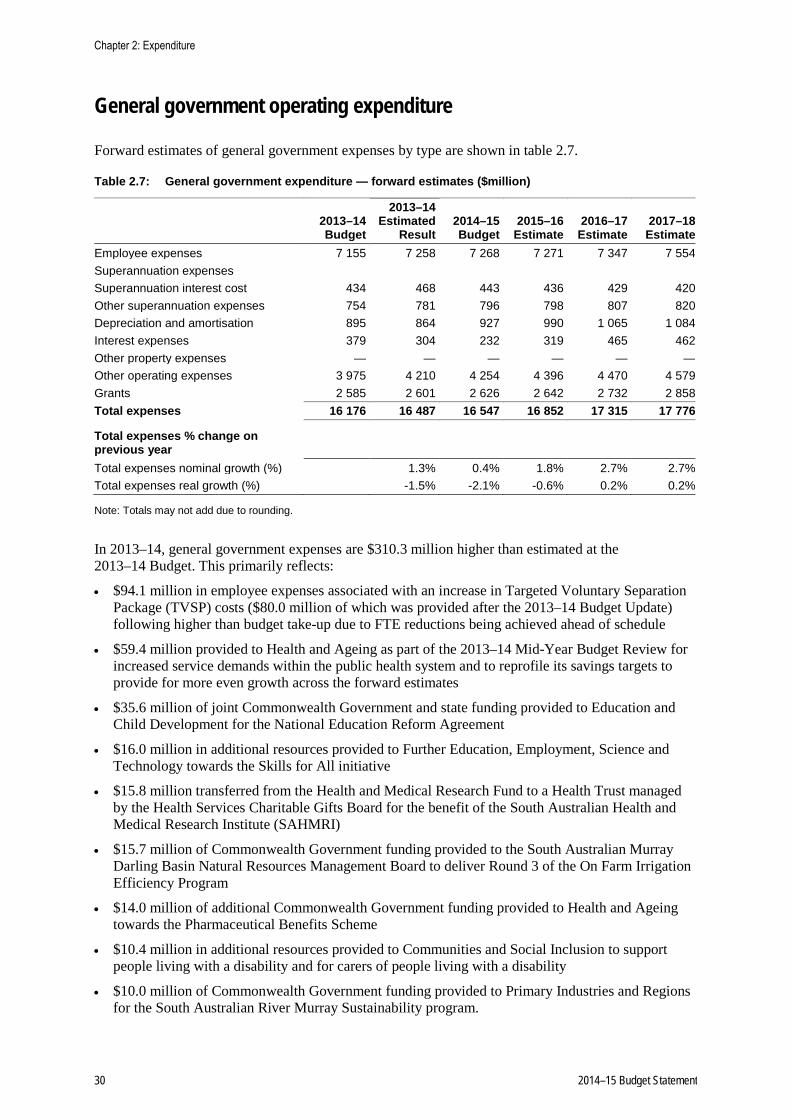
General government operating expenditure
Forward estimates of general government expenses by type are shown in table 2.7.
Table 2.7: General government expenditure — forward estimates ($million)
2013–14 2013–14 Estimated 2014–15 2015–16 2016–17 2017–18 Budget Result Budget Estimate Estimate Estimate
Employee expenses 7 155 7 258 7 268 7 271 7 347 7 554 Superannuation expenses Superannuation interest cost 434 468 443 436 429 420 Other superannuation expenses 754 781 796 798 807 820 Depreciation and amortisation 895 864 927 990 1 065 1 084 Interest expenses 379 304 232 319 465 462 Other property expenses — — — — — — Other operating expenses 3 975 4 210 4 254 4 396 4 470 4 579 Grants 2 585 2 601 2 626 2 642 2 732 2 858 Total expenses 16 176 16 487 16 547 16 852 17 315 17 776
Total expenses % change on previous year
Total expenses nominal growth (%) 1.3% 0.4% 1.8% 2.7% 2.7% Total expenses real growth (%) -1.5% -2.1% -0.6% 0.2% 0.2%
Note: Totals may not add due to rounding.
In 2013–14, general government expenses are $310.3 million higher than estimated at the 2013–14 Budget. This primarily reflects:
• $94.1 million in employee expenses associated with an increase in Targeted Voluntary Separation Package (TVSP) costs ($80.0 million of which was provided after the 2013–14 Budget Update) following higher than budget take-up due to FTE reductions being achieved ahead of schedule
• $59.4 million provided to Health and Ageing as part of the 2013–14 Mid-Year Budget Review for increased service demands within the public health system and to reprofile its savings targets to provide for more even growth across the forward estimates
• $35.6 million of joint Commonwealth Government and state funding provided to Education and Child Development for the National Education Reform Agreement
• $16.0 million in additional resources provided to Further Education, Employment, Science and Technology towards the Skills for All initiative
• $15.8 million transferred from the Health and Medical Research Fund to a Health Trust managed by the Health Services Charitable Gifts Board for the benefit of the South Australian Health and Medical Research Institute (SAHMRI)
• $15.7 million of Commonwealth Government funding provided to the South Australian Murray Darling Basin Natural Resources Management Board to deliver Round 3 of the On Farm Irrigation Efficiency Program
• $14.0 million of additional Commonwealth Government funding provided to Health and Ageing towards the Pharmaceutical Benefits Scheme
• $10.4 million in additional resources provided to Communities and Social Inclusion to support people living with a disability and for carers of people living with a disability
• $10.0 million of Commonwealth Government funding provided to Primary Industries and Regions for the South Australian River Murray Sustainability program.
Chapter 2: Expenditure
30 2014–15 Budget Statement

The low nominal growth in operating expenses in 2014–15 reflects:
• low growth in employee expenses attributed to higher TVSP costs in 2013–14, wage restraint and ongoing reductions in FTEs associated with savings measures
• a fall in general government interest expenses in 2014–15 which reflects the SA Water gearing change that will reduce general government net debt by $2.7 billion.
Expenditure growth from 2015–16 to 2017–18 is influenced by amortisation and interest expenses for the new Royal Adelaide Hospital, which commence in the last part of 2015–16 with the first full year impact recognised in 2016–17.
Table 2.8 shows total operating expenses across the forward estimates for selected agencies.
Table 2.8: Operating expenses — selected agencies(a)
2013 –142013 –14 Estimated 2014–15 2015–16 2016–17 2017–18Budget Result Budget Estimate Estimate Estimate
Agency(b) $m $m $m $m $m $mAttorney-General(c) 193 200 234 233 233 236Auditor-General 16 15 16 17 17 17Communities and Social Inclusion(d) 1 225 1 175 1 198 1 234 1 272 1 399Correctional Services 236 243 246 254 259 263Courts 99 98 94 92 93 94Defence SA 21 35 22 21 22 22Education and Child Development 3 098 3 235 3 223 3 249 3 320 3 360Electoral Commission 14 15 8 4 5 17Emergency Services — CFS 67 75 67 68 69 71Emergency Services — MFS 125 125 126 128 129 131Emergency Services — SAFECOM 15 21 18 12 12 12Emergency Services — SES 13 14 13 14 14 14Environment, Water and Natural Resources
304 348 298 269 253 252
Environment Protection Authority 49 54 51 54 57 59Further Education, Employment, Science and Technology(e)(f) 567 622 — — — —
Health and Ageing 5 025 5 186 5 212 5 252 5 463 5 501Manufacturing, Innovation, Trade, Resources and Energy(e)(f) 115 134 — — — —
Planning, Transport and Infrastructure(g) 1 463 1 535 1 532 1 540 1 560 1 600Police 794 798 825 834 853 873Premier and Cabinet(c)(e) 449 495 295 283 280 279Primary Industries and Regions(f) 164 188 268 268 247 208State Development(e) — — 800 763 736 735Tourism 58 60 58 58 57 58Treasury and Finance(d) 105 120 94 91 91 91Zero Waste 9 10 7 4 4 4Total operating expenses — selected agencies 14 221 14 801 14 703 14 742 15 045 15 294
Note: Totals may not add due to rounding.
(a) Data in this table reflects total expenses on a GFS basis and therefore will not equal total expenses as presented in 2014–15 Agency Statements which are presented on a basis that is consistent with Australian Accounting Standards. The 2013–14 Budget data in this table has been updated accordingly.
(b) Excludes administered items of agencies.
(c) From 1 July 2014, Safework SA within Premier and Cabinet will transfer to the Attorney-General’s Department.
(d) From 1 July 2014, Veterans’ Affairs within Treasury and Finance will transfer to Communities and Social Inclusion.
Chapter 2: Expenditure
2014–15 Budget Statement 31

(e) From 1 July 2014, Further Education, Employment, Science and Technology (DFEEST), Manufacturing, Innovation, Trade Resources and Energy (DMITRE) and multiple functions within Premier and Cabinet including Arts SA, Aboriginal Affairs and Reconciliation and the Office of the Economic Board will merge to become the Department of State Development.
(f) From 1 July 2014, the South East Forestry Partnership Program (within DMITRE) and the High Value Food Manufacturing Centre (within DFEEST) will move to Primary Industries and Regions.
(g) Includes South Australian Government Employee Residential Properties.
To abstract from the machinery of government changes implemented from 1 July 2014, the following analysis compares changes in expenses from 2014–15 to 2017–18. The major changes in operating expenses over that period are in the following agencies:
• Communities and Social Inclusion — projected to increase by $201.5 million primarily due to substantial new expenditure being provided for disability clients over the forward estimates and an increase in the profile of grants to SAHT in 2017–18 relating to the relief of $320 million on its balance sheet in 2013–14 and associated reduction in grants over four years from 2013–14 to 2016–17
• Correctional Services — projected to increase by $16.7 million primarily due to additional funding provided for additional prison beds to be commissioned over the forward estimates
• Education and Child Development — projected to increase by $136.6 million primarily due to increased Commonwealth Government and state funding under the National Education Reform Agreement
• South Australian Fire and Emergency Services Commission (SAFECOM) ― projected to decrease by $6.5 million primarily due to the budget for the Natural Disaster Resilience Grant program being reflected in 2014–15 only. Actual expenditure levels under this program in future years will depend on the outcome of the renegotiation of the National Partnership Agreement
• Environment, Water and Natural Resources — projected to decrease by $45.1 million primarily due to reduced expenditure relating to projects completed in conjunction with the Commonwealth Government under the Murray Futures program and the implementation of savings measures
• Environment Protection Authority — projected to increase by $8.1 million primarily due to the on-payment of the increased solid waste levy to the Waste to Resources Fund
• Health and Ageing — projected to increase by $288.4 million, primarily due to the first full year of finance charges and amortisation expense associated with the new Royal Adelaide Hospital occurring in 2016–17
• Police — projected to increase by $47.9 million primarily due to the employment of additional police officers under the Recruit 300 initiative
• Premier and Cabinet — projected to decrease by $16.0 million primarily due to a once-off grant payment in 2014–15 to establish a privately built and operated Motorsport Park at Tailem Bend, capable of potentially hosting a second V8 Supercar race in the state and the profile of expenditure provided as part of a range of measures to revitalise and rebuild the state economy following the decision by GM Holden Ltd to close its vehicle manufacturing operations in Australia by 2017
• Primary Industries and Regions — projected to decrease by $59.5 million primarily due to declining expenditure under various grant programs including the South Australian River Murray Sustainability Program and the implementation of savings measures
• State Development — projected to decrease by $64.5 million primarily due to the profile of additional funding provided for the Skills for All program.
The following sections provide further details on the key components of expenses.
Chapter 2: Expenditure
32 2014–15 Budget Statement

Employee expenses
Table 2.9: General government employee expenses — forward estimates
2013–14 Estimated 2014–15 2015–16 2016–17 2017–18 Result Budget Estimate Estimate Estimate
Employee expenses ($m) 7 258 7 268 7 271 7 347 7 554 Nominal growth (%) 2.2% 0.1% 0.0% 1.0% 2.8% Real growth (%) -0.6% -2.3% -2.4% -1.4% 0.3%
Employee expenses decline in real terms across the forward estimates, reflecting reductions in general government sector employment numbers.
Full-time equivalents (FTEs)
FTE estimates for general government sector agencies are based on their FTE caps. These caps are established to be consistent with the salaries and wages budget for each agency and are adjusted in line with changes to their budgets. Actual FTEs are monitored on a regular basis with agencies required to explain any significant variations from their FTE cap.
The estimated aggregate workforce levels in the general government sector across the forward estimates are shown in table 2.10.
Table 2.10: General government sector employment numbers
Full-time equivalent employees as at 30 June 2013
Actual 2014
Estimate 2015
Estimate 2016
Estimate 2017
Estimate 2018
Estimate As at 2013–14 Budget 79 484 77 643 76 995 76 554 n.a. As at 2013–14 Mid-Year Budget Review 81 473 79 591 78 317 77 909 n.a. As at 2014–15 Budget 81 724 81 516 80 018 78 214 77 619 77 437
FTEs in the general government sector are estimated to decrease by 4080 between 30 June 2014 and 30 June 2018. This reflects the cumulative impact of savings measures partially offset by new expenditure measures. During the 2014 State Election it was stated that there would be reductions of up to 4000 FTEs from 30 June 2013 to 30 June 2017. That number is now 4105 FTEs, reflecting an underlying 3905 FTE reduction and an additional 200 FTE as a result of the necessary flow on of cuts announced in the 2014–15 Commonwealth Budget.
As outlined in the 2013–14 MYBR, general government sector FTE levels over the forward estimates are higher than those forecast at the time of the 2013–14 Budget. The main factors in this increase were a correction in the Department for Health and Ageing’s FTE cap reflecting improved information on staffing levels, and an increase in the FTE cap of the Department of Education and Child Development to reflect a shift to in-house provision of Families SA children in care services for a period of up to four years from 2012–13.
Since the 2013–14 MYBR there has been an increase to FTE levels in 2014–15, with FTE numbers decreasing from 2015–16. The net impact of 2014–15 Budget initiatives on general government sector FTEs over the forward estimates period is shown in table 2.11.
Chapter 2: Expenditure
2014–15 Budget Statement 33

Table 2.11: Full-time equivalent impacts of 2014–15 Budget measures as at 30 June each year
2013–14 2014–15 2015–16 2016–17 2017–18 Expenditure initiatives 12 631 464 228 326 Savings Measures — - 70 - 567 - 737 -1 166 Total FTE impact of budget measures 12 561 -103 -509 -840
Note: Totals may not add due to rounding.
Table 2.12 shows the net effect of the new expenditure initiatives and savings measures in the 2014–15 Budget on each agency’s FTE levels as at 30 June 2018.
Table 2.12: Full-time equivalent impacts of new initiatives and savings measures as at 30 June 2018
Agency Expenditure
initiatives Savings
measures Attorney-General 9.0 - 21.0 Auditor-General — — Communities and Social Inclusion 31.8 - 65.0 Correctional Services 21.0 - 11.0 Courts — - 2.0 Defence SA — - 2.0 Education and Child Development 40.6 - 132.0 Electoral Commission — — Emergency Services — CFS — — Emergency Services — MFS — - 2.0 Emergency Services — SAFECOM — - 2.0 Emergency Services — SES — — Environment, Water and Natural Resources 23.0 - 31.0 Environment Protection Authority — — Health and Ageing 158.9 - 639.0 Planning, Transport and Infrastructure — - 45.0 Police 6.0 - 18.0 Premier and Cabinet 6.5 - 55.0 Primary Industries and Regions 4.0 - 15.0 State Development 23.2 - 107.0 Tourism — - 6.0 Treasury and Finance 2.0 - 13.0 Zero Waste — — Total 326.0 -1 166.0
Note: Totals may not add due to rounding.
A TVSP scheme has been in operation since November 2010 to assist agencies in the delivery of their FTE reduction requirements. TVSPs are available (at the discretion of chief executives) to persons whose positions are abolished as part of savings measures and organisational restructures.
Between 1 November 2010 and 30 April 2014, a total of 2325 TVSPs (2138.8 FTEs) have been delivered through the scheme at a cost of $267.9 million. In addition, 73 separations (72.6 FTEs) have been achieved through the early termination of executive contracts at a cost of $11.6 million. This is shown in table 2.13.
Chapter 2: Expenditure
34 2014–15 Budget Statement

Table 2.13: Employee separations
2010–11 2011–12 2012–13 2013–14(a) Total
separations Total
cost ($m) TVSPs Separations centrally funded 405.0 543.0 668.0 699.0 2 315.0 267.0 Separations funded by agencies 4.0 2.0 3.0 1.0 10.0 0.9 Total separations through TVSPs 409.0 545.0 671.0 700.0 2 325.0 267.9 Executive contract termination payments centrally funded
21.0 26.0 13.0 13.0 73.0 11.6
(a) Year to 30 April 2014
From 1 July 2014 the maximum TVSP payout will be reduced to 52 weeks pay (calculated as 10 weeks base plus two weeks per year of service). It is noted that FTE reductions are also achieved in other ways (for example, natural attrition, not filling vacancies and not renewing contracts).
After 30 June 2014, a public sector employee who has been identified by their agency as having been excess and has been unsuccessful in finding alternative public sector employment will be able to be separated with an appropriate financial package having regard to applicable legislation and industrial provisions.
Enterprise Agreements
In 2013–14 enterprise agreements have been finalised for salaried medical officers and clinical academics, nurses and midwives, firefighters and the wages parity weekly paid group and Assistants to the Members of Parliament.
Enterprise bargaining negotiations are continuing for the trades group (building, metal and plumbing trades) and have commenced for police and the wages parity salaried and weekly paid groups.
During 2014–15, enterprise bargaining negotiations are also expected to commence for TAFE SA lecturers, teachers and staff in schools and pre-schools, ambulance officers and visiting medical specialists.
The outcomes of future wage negotiations will be crucial in determining whether expenditure forward estimates in this budget can be achieved. If public sector-wide wage outcomes for new enterprise agreements vary by 1.0 per cent per annum from allowances in the forward estimates, the budget impact is estimated to be around $260 million in 2017–18.
Consequently the government will limit future wage growth to 2.5 per cent per annum. Any increases above this limit will need to be offset by productivity improvements or other cost reduction measures. If real wage restraint cannot be achieved, further FTE reductions and savings will be required in future budgets to maintain the fiscal position.
Superannuation expenses
Table 2.14: General government superannuation expenses — forward estimates
2013–14 Estimated
Result
2014–15 Budget
2015–16 Estimate
2016–17 Estimate
2017–18 Estimate
Superannuation expenses ($m) Superannuation interest cost 468 443 436 429 420 Other superannuation expenses 781 796 798 807 820 Nominal growth (%) 26.3% -0.8% -0.4% 0.1% 0.3% Real growth (%) 22.9% -3.2% -2.8% -2.4% -2.1%
Chapter 2: Expenditure
2014–15 Budget Statement 35

The estimated nominal superannuation interest expense represents the increase during the year in the defined benefit superannuation obligations due to them being one year closer to settlement, less the expected earnings on superannuation assets. The nominal superannuation interest expense for each year is calculated based on the unfunded superannuation liability at the end of the preceding financial year. Further discussion on that liability can be found in Chapter 4.
The nominal superannuation interest expense for 2013–14 is $468 million, consistent with estimates at the 2013–14 MYBR.
Other superannuation expenses represent the employer contribution made for the employees’ accruing superannuation entitlement associated with their service during the year. In real terms other superannuation expenses decline at a higher rate than salary and wages expenditure as a consequence of a reduction in the number of active contributors to the closed defined benefit schemes as they leave the public service.
Depreciation and amortisation
Table 2.15: General government depreciation and amortisation — forward estimates
2013–14 Estimated 2014–15 2015–16 2016–17 2017–18 Result Budget Estimate Estimate Estimate
Depreciation ($m) Buildings and improvements 353 371 396 412 423 Plant, equipment and vehicles 202 209 230 231 243 Road network 200 223 223 225 226 Rail and bus tracks 41 53 54 54 54 Water, sewer and drainage 6 6 7 7 7 Harbour and port facilities 7 7 7 7 7 Total depreciation 808 870 917 936 960 Amortisation 56 57 72 129 123 Total depreciation and amortisation 864 927 990 1 065 1 084 Nominal growth (%) 13.3% 7.3% 6.7% 7.7% 1.7% Real growth (%) 10.3% 4.7% 4.1% 5.0% -0.8%
Note: Totals may not add due to rounding.
The main asset types comprising general government depreciation across the forward estimates are building and improvements, plant, equipment and vehicles and road network.
Significant growth in depreciation is projected to 2016–17 as projects are completed in line with the program of significant investment in the state’s infrastructure.
The completion of a number of building projects from 2013–14 to 2016–17 including the Adelaide Oval Redevelopment, the Lyell McEwin Hospital Stage C Redevelopment, Glenside Campus Redevelopment and prison infrastructure contribute to the rise in buildings and improvements and plant, equipment and vehicles depreciation.
The step up in depreciation relating to the road network in 2014–15 is due to a large amount of work being completed for a range of projects up to 2014–15, the most notable of which are the South Road Superway and the duplication of the Southern Expressway.
The increase in depreciation relating to rail and bus tracks in 2014–15 is due to the completion of the Noarlunga Line Electrification and other rail revitalisation and public transport projects in 2013–14 and 2014–15.
Chapter 2: Expenditure
36 2014–15 Budget Statement

The large increase in amortisation from 2015–16 is due to the commencement of amortisation of the finance lease for the new Royal Adelaide Hospital in the last part of 2015–16. The first full-year amortisation associated with the new Royal Adelaide Hospital will occur in 2016–17.
Interest expenses
Table 2.16: General government interest expenses — forward estimates
2013–14 Estimated 2014–15 2015–16 2016–17 2017–18 Result Budget Estimate Estimate Estimate
Interest expenses ($m) 304 232 319 465 462 Nominal growth (%) -21.2% -23.8% 37.6% 45.6% -0.6% Real growth (%) -23.3% -25.7% 34.2% 42.0% -3.0%
Interest expenses comprise interest paid by the Treasurer to the South Australian Government Financing Authority (SAFA) on government borrowings and interest expenses of agencies related to finance leases.
The 2013–14 estimated result is $74.3 million less than projected in the 2013–14 Budget, largely reflecting the impact of netting off the Treasurer’s funds held on deposit with the South Australian Government Financing Authority (SAFA) against Treasurer’s borrowings. This set-off, pursuant to an agreement between the Treasurer and SAFA better reflects the true borrowing position, and thus borrowing cost.
The reduction in the interest expense from the 2013–14 Estimated Result to the 2014–15 Budget reflects the SA Water gearing change that will reduce general government net debt by $2.7 billion.
Interest expenses then rise over the forward estimates reflecting the growth in borrowings, primarily resulting from the commencement of the new Royal Adelaide Hospital finance lease agreement during 2015–16.
Other operating (non-employee) expenses
Table 2.17: General government other operating (non-employee) expenses forward estimates
2013–14Estimated 2014–15 2015–16 2016–17 2017–18
Result Budget Estimate Estimate EstimateOther operating (non-employee) expenses ($m) 4 210 4 254 4 396 4 470 4 579
Nominal growth (%) -2.4% 1.0% 3.3% 1.7% 2.4%Real growth (%) -5.0% -1.4% 0.8% -0.8% -0.1%
General government other operating (non-employee) expenses for 2014–15 are estimated to be $4.3 billion. This is largely made up of:
• supplies and services ($2.5 billion) predominantly within Health and Ageing ($1.1 billion), Education and Child Development ($435.4 million) and State Development ($156.1 million)
• consultancies and contractors ($539.0 million) predominantly within Planning, Transport and Infrastructure ($277.5 million) mainly due to bus and road maintenance contracts, Health and Ageing ($110.0 million) and Education and Child Development ($40.4 million). During 2013–14, the Department of Health and Ageing reclassified $90.0 million mainly from grants expense lines to contractor expenses to reflect actual payment arrangements as the result of an external consultancy review
Chapter 2: Expenditure
2014–15 Budget Statement 37

• repairs and maintenance expenses ($295.5 million) predominantly within Planning, Transport and Infrastructure ($96.8 million), Education and Child Development ($89.1 million) and Health and Ageing ($63.7 million)
• computer and communications charges ($233.6 million) predominantly within Health and Ageing ($56.3 million), Premier and Cabinet ($47.4 million) and Education and Child Development ($24.7 million)
• concessions payments ($194.4 million) predominantly within Communities and Social Inclusion
• operating leases ($175.4 million) predominantly within Planning, Transport and Infrastructure for office accommodation across government.
Other operating (non-employee) expenses decline in real terms across the forward estimates mainly reflecting implementation of savings measures in the general government sector.
Grants
Table 2.18: General government grant expenses — forward estimates
2013–14 Estimated 2014–15 2015–16 2016-17 2017-18 Result Budget Estimate Estimate Estimate
Grants ($m) 2 601 2 626 2 642 2 732 2 858 Nominal growth (%) -4.6% 1.0% 0.6% 3.4% 4.6% Real growth (%) -7.1% -1.5% -1.9% 0.9% 2.0%
General government sector grant payments in 2014–15 are forecast to be $2.6 billion, which is $25.2 million higher than the estimated result in 2013–14. Grant payments include grants to non-government schools, local government, industry, the South Australian Housing Trust (SAHT) and community service obligation payments to SA Water and ForestrySA.
The increase in grant payments in 2014–15 is largely due to an increase in grants associated with the South Australian River Murray Sustainability Program for water recovery and industry assistance.
The increase in grant payments from 2015–16 to 2017–18 is mainly due to the growth in Communities and Social Inclusion grants, largely reflecting increased support for disability services and an increase in grants to SAHT in 2017–18 relating to the relief of $320 million on its balance sheet in 2013–14 and associated reduction in grants over four years ceasing in 2016–17.
General government investing expenditure
Purchases of property, plant and equipment
Table 2.19: General government investing expenditure — forward estimates ($million)
2013–14Estimated 2014–15 2015–16 2016–17 2017–18
Result Budget Estimate Estimate EstimateGeneral government investing expenditure 1 567 1 217 4 067 1 125 1 374
Purchases of property, plant and equipment are expected to be $1.2 billion in 2014–15, compared with the estimated result for 2013–14 of $1.6 billion. The forward estimates contain a major infrastructure investment program of $7.8 billion in the general government sector over four years. This reflects continued investment by the government mainly in transport, health and education infrastructure.
Chapter 2: Expenditure
38 2014–15 Budget Statement

Significant investments being undertaken by the government include:
• $2.9 billion ($1.3 billion of which will be spent over the next four years) in partnership with the Commonwealth Government for road projects to improve traffic flow along the North–South Road Corridor between Gawler and Old Noarlunga. Significant projects include the South Road Upgrade from Torrens Road to the River Torrens, South Road Superway, Darlington Upgrade and duplication of the Southern Expressway
• $906.3 million ($295.7 million of which will be spent over the next four years) for major public transport projects, which in the forward estimates period will include the commencement of electrification of the Gawler Rail Line from the city to Salisbury, purchase of new rail cars, and the extension of the O-Bahn into the city
• $667.9 million ($283.1 million of which will be spent over the next four years) for redevelopment of major metropolitan and regional hospitals including works at the new Royal Adelaide Hospital, Lyell McEwin Hospital, Women’s and Children’s Hospital and Mount Gambier and Districts Health Service
• $562.9 million ($166.3 million of which will be spent over the next four years) on education projects including a new city high school, Adelaide High School, Brighton Secondary School, Marryatville High School, Glenunga International High School and Eastern Fleurieu R–12 School; as well as the upgrade and relocation of preschools
• $366.5 million ($166.1 million of which will be spent over the next four years) to expand and redevelop the Adelaide Convention Centre and upgrade the surrounding Riverbank Precinct.
For further detail on the capital program refer to the 2014–15 Capital Investment Statement.
There is a decline in general government investing expenditure in 2014–15, as significant projects including the South Road Superway, Southern Expressway Duplication, Adelaide Oval Redevelopment and Seaford rail electrification projects near completion. Investing expenditure returns to more sustainable levels after the significant infrastructure stimulus period.
The large increase in 2015–16 is due to the recognition of a $2.8 billion finance lease liability for the new Royal Adelaide Hospital. The new hospital is due to be completed in 2016 and will have 800 beds (700 multi-day beds and 100 same-day beds) with 100 per cent of overnight patient rooms being single bed.
Under a 35-year public-private contract, which includes the provision of maintenance and non-clinical support services, the SA Health Partnership has been commissioned to design and construct the hospital at a fixed price to meet the state’s service specifications. Table 2.20 outlines the estimated profile of construction costs ($1.8 billion) in the non-government sector. The public-private contract is recorded as a finance lease liability in the general government sector in 2015–16 ($2.8 billion) comprising the net present value of design and construction costs, lifecycle payments, interest and other project costs.
Table 2.20: Estimated non-government investing expenditure — new Royal Adelaide Hospital ($million)
2010–11 2011–12 2012–13 2013–14 2014–15 2015–16 Non-government investing expenditure 25.1 288.0 467.7 551.0 462.6 55.4
Table 2.21 shows general government investing expenditure excluding the recognition of the finance lease liability for the new Royal Adelaide Hospital but including the estimated profile of construction costs of the hospital in the non-government sector.
Chapter 2: Expenditure
2014–15 Budget Statement 39

Table 2.21: Investing expenditure including new Royal Adelaide Hospital construction costs ($million)
2013–14Estimated 2014–15 2015–16 2016–17 2017–18
Result Budget Estimate Estimate EstimateInvesting expenditure 2 118 1 679 1 302 1 125 1 374
Expenses by function (ABS Government Purpose Classification)
Expenses by function are shown in table 2.22 according to the Australian Bureau of Statistics’ (ABS) Government Purpose Classification. Health (31.4 per cent) and education (25.6 per cent) each account for a significant component of general government sector expenses and together represent over half of all expenses.
Three categories have large percentage reductions in expenditure in 2014–15 compared to 2013–14.
• Fuel and Energy — efficiencies in the newly created Department of State Development in 2014–15
• Mining and mineral resources (other than fuels), manufacturing and construction — expenditure in 2013–14 including the decommissioning of Hewlett Packard House after the expiry of the head lease in March 2014
• Other purposes — a reduction in general government interest expenses in 2014–15 which reflects the SA Water gearing change that will reduce general government net debt by $2.7 billion.
Table 2.22: Estimate of expenses by function(a)
2014–15
2012–13 2013–14 2013–14
Estimated 2014–15 change on
2013–14 Outcome Budget Result Budget Estimate $m $m $m $m %
General public services 318 366 384 383 -0.2 Defence(b) — — — — — Public order and safety 1 523 1 565 1 559 1 578 1.3 Education 4 095 4 132 4 219 4 240 0.5 Health 5 087 5 084 5 119 5 203 1.7 Social security and welfare 1 131 1 282 1 312 1 314 0.2 Housing and community amenities 1 068 944 1 058 1 092 3.2 Recreation and culture 390 337 368 357 -3.1 Fuel and energy 53 56 47 43 -8.4 Agriculture, forestry, fishing and hunting 156 193 197 207 5.2 Mining and mineral resources (other than fuels), manufacturing and construction
60 71 82 76 -7.9
Transport and communications 1 007 1 022 1 038 1 043 0.5 Other economic affairs 231 238 257 270 5.1 Other purposes 1 164 887 847 740 -12.7 Total expenses 16 282 16 176 16 487 16 547 0.4
Note: Totals may not add due to rounding. (a) Expenses by function data is derived from information submitted by government departments and agencies. The
processes for deriving this data are subject to ongoing refinements. Consequently the data may be subject to future revisions.
(b) The ABS defines ‘defence’ as expenditure on military and civil defence affairs, foreign military aid and defence research. The expenditure of Defence SA is included in other economic affairs.
Chapter 2: Expenditure
40 2014–15 Budget Statement
Chapter 3: Revenue
Overview
This chapter provides an overview of new revenue measures introduced as part of the 2014–15 Budget and summarises movements in government revenues over the period 2013–14 to 2017–18.
Since the budget update released in January 2014, taxation revenues have been impacted by soft employment market conditions as well as lower than expected spending on gambling activities. These downward revisions have been offset by upwards revisions to GST revenue grants, mainly due to stronger than expected growth in national consumption.
Government revenues have been significantly impacted by funding cuts announced in the Commonwealth Government’s 2014–15 Budget. The Commonwealth Government has delivered total funding cuts to South Australia of $898 million over the period 2013–14 to 2017–18, with hospitals and schools funding cuts totalling around $5.5 billion over the next decade.
Compared to the information published in the Commonwealth Government’s 2013–14 Mid-Year Economic and Fiscal Outlook (MYEFO), South Australia will receive $444 million less funding across the forward estimates from the Commonwealth Government reneging on the National Health Reform Agreement. The Commonwealth Government has also eliminated or reduced funding for a number of health-related National Partnership agreements, including agreements for improving public hospitals, financial assistance for long-stay patients and other health initiatives, removing a further $212 million in grant funding over the forward estimates.
In addition, National Partnership grant funding for pensioner concessions has been abolished, funding for the continuation of the National Partnership on skills reform programs will cease from 2017–18 and the Commonwealth Government has amended its school funding commitment from 2017.
Table 3.1 summarises the cuts to grant funding announced in the 2014–15 Commonwealth Budget.
2014–15 Budget Statement 41

Table 3.1: Revenue cuts imposed by the Commonwealth Government ($million)
2013–14 2014–15 2015–16 2016–17 2017–18 Total Health funding National Health Reform Agreement — - 37.4 - 73.9 - 116.0 - 217.0 -444.3 National Partnership Agreement on Improving Public Hospital Services
— - 7.9 - 28.0 - 42.0 - 42.0 -119.9
National Partnership Agreement on Financial Assistance for Long Stay Older Patients
— - 10.6 - 10.6 - 10.6 - 10.6 -42.4
Health National Partnership reward payments
— - 6.9 - 6.9 - 12.1 — -26.0
Other national partnerships National Partnership Agreement on Preventative Health
— - 3.9 - 3.9 - 3.9 - 3.9 -15.4
National Partnership Agreement on Indigenous Early Childhood Development
— - 1.8 - 1.8 - 1.8 - 1.8 -7.4
Other funding National Education Reform Agreement — — — — - 45.0 -45.0 National Partnership Agreement on Skills Reform
— — — — - 38.4 -38.4
National Partnership Agreement on Training Places for Single and Teenage Parents
— - 2.2 - 2.2 - 2.2 - 2.2 -8.8
National Partnership Agreement on Certain Concessions for Pensioner Concession Card and Seniors Card Holders
— - 29.2 - 30.5 - 31.4 - 32.1 -123.2
Northern Expressway - 12.8 — — — — -12.8 National Partnership Agreement to Deliver a Seamless National Economy
- 8.1 — — — — -8.1
Other Commonwealth Budget impacts 8.4 - 1.0 - 2.5 - 4.0 - 6.8 -5.9 Total -12.5 -101.1 -160.3 -223.9 -399.9 -897.6
The government has adopted a number of revenue measures in this budget, which are intended to address, in part, the impact that the Commonwealth Government’s grant funding cuts have had on the state budget position.
However, the government will continue to provide relief to small to medium businesses in 2014–15 through the continuation of its small business payroll tax concession. The concession provides relief to eligible employers of up to $9800.
The government will also continue to provide a stamp duty concession on eligible off-the-plan apartments in the inner metropolitan region and it will introduce a Seniors Housing Grant of up to $8500 for people over 60 years of age who want to right-size their principal place of residence and purchase a new home to live in.
New initiatives
The 2014–15 Budget contains two taxation measures to help support the budget position. These measures are required to provide capacity for the budget to address the significant reduction in health funding announced in the Commonwealth Government’s 2014–15 Budget.
In 2013–14, property owners are contributing through the emergency services levy (ESL) less than half of the total costs incurred in providing emergency services in the state. The government is funding the remainder of the cost, including by providing substantial general remissions on fixed and mobile property. However, with the government needing to meet the significant health funding shortfalls
Chapter 3: Revenue
42 2014–15 Budget Statement

imposed on it by the Commonwealth Government, it is no longer able to provide the same level of ESL remissions in the future.
The government will remove general remissions provided on the fixed property ESL from 1 July 2014.
However, the ESL for eligible pensioners and self-funded retirees who hold a Commonwealth Seniors Health Card will effectively not change on their principal place of residence. The government will continue to provide a remission on the fixed property ESL on those properties.
Over 650 000 properties, including residential, commercial and industrial properties, will be impacted by the change. For a median-valued residential property in Adelaide, the estimated increase in the ESL liability in 2014–15 will be around $150.
The government will also remove remissions provided on ESL rates for cars, larger motor cycles and historic vehicles from 1 August 2014. This change will result in increases to mobile property ESL liabilities for over 1 million vehicles.
The ESL for passenger vehicles will increase by $8 in 2014–15.
Table 3.2 shows the value of taxation and other revenue measures announced in the budget across the forward estimates. Further details on all revenue measures included in the budget are provided in the 2014–15 Budget Measures Statement.
Chapter 3: Revenue
2014–15 Budget Statement 43

Table 3.2: Revenue measures announced in the 2014–15 Budget ($million)
2013–14 2014–15 2015–16 2016–17 2017–18 Estimate Budget Estimate Estimate Estimate
Revenue — taxation Fixed property ESL — remove general remissions — 85.2 78.6 78.4 78.9 Mobile property ESL — remove general remissions — 7.3 9.0 9.1 9.3
Total revenue measures — taxation — 92.5 87.6 87.5 88.2
Revenue — non-taxation Communities and Social Inclusion Screening services — 3.2 3.5 3.6 3.7 Planning, Transport and Infrastructure Six month boat registrations for certain recreational boats and jet skis
— -1.5 -1.5 -1.6 -1.6
Public transport cost recovery — special events — 1.7 3.9 4.0 4.2 State Development Revised royalty arrangements — extractives and private mines
— 3.2 3.2 3.2 3.2
Commonwealth Government funding cuts National Health Reform Agreement — - 37.4 - 73.9 - 116.0 - 217.0 National Partnership Agreement on Improving Public Hospital Services
— - 7.9 - 28.0 - 42.0 - 42.0
National Partnership Agreement on Financial Assistance for Long Stay Older Patients
— - 10.6 - 10.6 - 10.6 - 10.6
Health National Partnership reward payments — - 6.9 - 6.9 - 12.1 — Other national partnerships — Health — - 5.7 - 5.7 - 5.7 - 5.7 National Education Reform Agreement — — — — - 45.0 National Partnership Agreement on Skills Reform — — — — - 38.4 National Partnership Agreement on Training Places for Single and Teenage Parents
— - 2.2 - 2.2 - 2.2 - 2.2
National Partnership Agreement on Certain Concessions for Pensioner Concession Card and Seniors Card Holders
— - 29.2 - 30.5 - 31.4 - 32.1
Northern Expressway - 12.8 — — — — National Partnership Agreement to Deliver a Seamless National Economy
- 8.1 — — — —
Total revenue measures — non-taxation -20.9 -93.4 -148.7 -210.7 -383.6 Total revenue measures -20.9 -0.9 -61.1 -123.1 -295.5
Note: Totals may not add due to rounding.
General government sector revenue
Total general government sector operating revenues are projected to increase by 2.8 per cent in real terms in 2014–15, following a real-terms decrease of 3.2 per cent in 2013–14.
Operating revenues are expected to grow modestly in real terms from 2014–15, with growth in revenues primarily reflecting projected increases in South Australia’s share of the national GST pool in response to changes in state shares of Commonwealth Government non-GST payments, and an expected continued recovery in revenues from property taxes. Lower growth in operating revenues in the out years reflects a decline in Commonwealth Government grant funding (excluding GST) in real terms in those years.
Total general government sector revenues are provided in table 3.3.
Chapter 3: Revenue
44 2014–15 Budget Statement
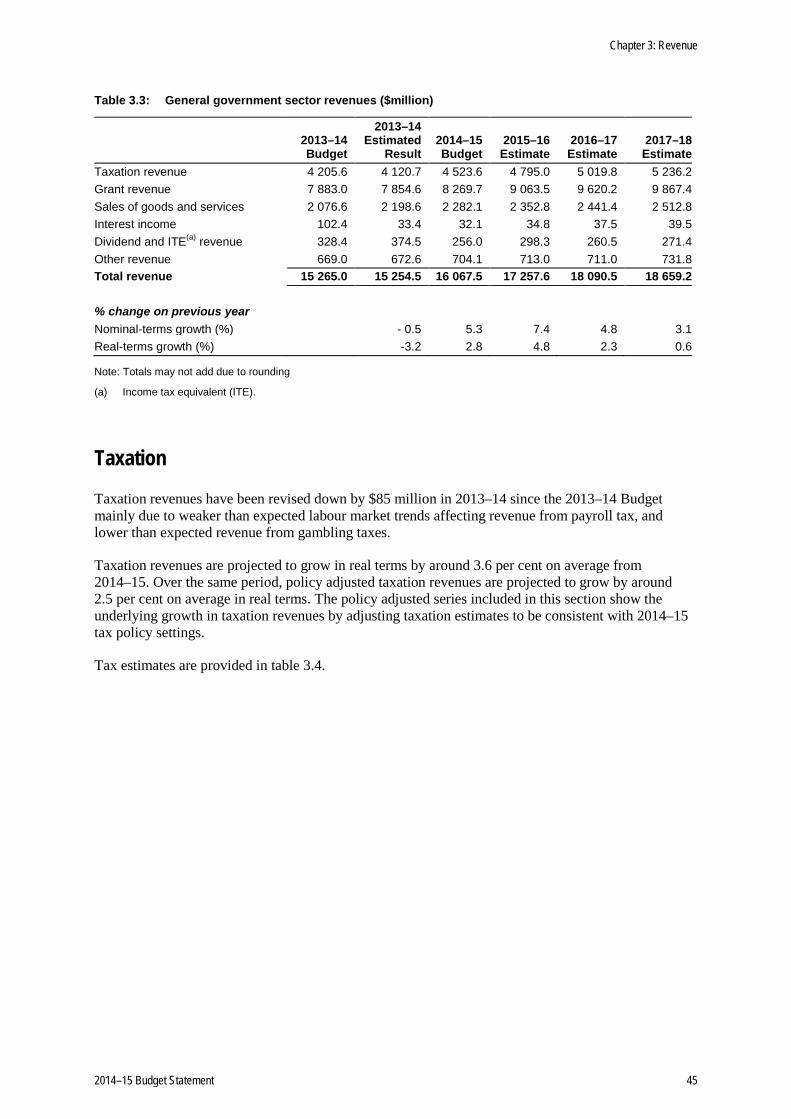
Table 3.3: General government sector revenues ($million)
2013–14 2013–14 Estimated 2014–15 2015–16 2016–17 2017–18 Budget Result Budget Estimate Estimate Estimate
Taxation revenue 4 205.6 4 120.7 4 523.6 4 795.0 5 019.8 5 236.2 Grant revenue 7 883.0 7 854.6 8 269.7 9 063.5 9 620.2 9 867.4 Sales of goods and services 2 076.6 2 198.6 2 282.1 2 352.8 2 441.4 2 512.8 Interest income 102.4 33.4 32.1 34.8 37.5 39.5 Dividend and ITE(a) revenue 328.4 374.5 256.0 298.3 260.5 271.4 Other revenue 669.0 672.6 704.1 713.0 711.0 731.8 Total revenue 15 265.0 15 254.5 16 067.5 17 257.6 18 090.5 18 659.2
% change on previous year Nominal-terms growth (%) - 0.5 5.3 7.4 4.8 3.1 Real-terms growth (%) -3.2 2.8 4.8 2.3 0.6
Note: Totals may not add due to rounding
(a) Income tax equivalent (ITE).
Taxation
Taxation revenues have been revised down by $85 million in 2013–14 since the 2013–14 Budget mainly due to weaker than expected labour market trends affecting revenue from payroll tax, and lower than expected revenue from gambling taxes.
Taxation revenues are projected to grow in real terms by around 3.6 per cent on average from 2014–15. Over the same period, policy adjusted taxation revenues are projected to grow by around 2.5 per cent on average in real terms. The policy adjusted series included in this section show the underlying growth in taxation revenues by adjusting taxation estimates to be consistent with 2014–15 tax policy settings.
Tax estimates are provided in table 3.4.
Chapter 3: Revenue
2014–15 Budget Statement 45

Table 3.4: Taxation ($million)
2012–13 2013–14 2013–14 2014–15 2015–16 2016–17 2017–18 Outcome Budget Estimated Budget Estimate Estimate Estimate Result
Payroll tax 1 077 1 158 1 097 1 172 1 253 1 323 1 400 Property taxes Conveyance duty(a) 778 805 809 925 1 037 1 109 1 158 Land tax — private 347 355 345 352 364 379 390 Land tax — public 215 221 222 226 234 243 250 Emergency services levy on fixed property
103 103 103 190 186 189 193
Natural resources management levies
42 43 45 46 46 47 47
Save the River Murray Levy 26 26 24 25 26 27 28 Guarantee fees 75 77 76 107 113 115 118 Share duty 41 4 5 5 5 6 6 Gaming machine surcharge — — 1 1 1 1 1 Transport development levy — — — 29 30 31 31 All other(b) 5 9 5 9 9 9 9 1 631 1 643 1 636 1 915 2 052 2 155 2 231 Gambling taxes Gaming machines 287 300 290 296 311 310 319 SA Lotteries(c) 106 69 70 74 77 82 85 Casino 22 26 22 28 30 42 54 SA TAB(d) 4 3 4 4 4 1 1 Other(e) 3 3 3 3 3 3 3 422 402 388 404 424 437 461 Insurance taxes General insurance 296 323 315 315 325 339 355 CTP renewal certificate 64 67 69 70 71 72 73 CTP insurance 63 52 53 49 50 52 54 Life insurance 7 7 7 7 7 7 7 429 449 443 440 453 471 490 Motor vehicle taxes Motor vehicle registration fees 364 369 369 380 394 408 422 Stamp duty on registration transfers
149 153 155 160 165 169 174
Emergency services levy on mobile property
31 32 32 39 42 42 43
LSS levy — — — 13 14 15 15 545 554 556 592 614 634 654 Total taxation 4 104 4 206 4 121 4 524 4 795 5 020 5 236 Policy adjusted(f) 4 170 n.a. 4 244 4 526 4 772 4 985 5 179 % change on previous year Total taxation Nominal growth 0.4 9.8 6.0 4.7 4.3 Real growth -2.3 7.1 3.4 2.1 1.8 Policy adjusted Nominal growth 1.8 6.7 5.4 4.5 3.9 Real growth -1.0 4.1 2.8 1.9 1.4
Note: Totals may not add due to rounding. (a) Includes voluntary conveyances.
(b) Includes Agents Indemnity Fund and the Hindmarsh Island Levy collections.
(c) 2012–13 includes tax on lottery net gambling revenue and dividend payments. From 2013–14 this line no longer includes dividends.
(d) SA TAB will continue to pay wagering tax only on its sports betting turnover from 2016–17 and this is expected to be small.
(e) Includes revenue from small lotteries and soccer pools.
(f) The policy adjusted series shows the underlying growth in tax revenues by adjusting tax estimates to be consistent with 2014–15 policy settings. For comparability with future years, the policy adjusted figure for 2014–15 assumes a full-year impact of 2014–15 policy measures.
Chapter 3: Revenue
46 2014–15 Budget Statement

Payroll tax
The outlook for payroll tax revenue is provided in table 3.5.
Table 3.5: Payroll tax
2013–14 Estimated 2014–15 2015–16 2016–17 2017–18 Result Budget Estimate Estimate Estimate
Total payroll tax ($m) 1 097.2 1 171.8 1 252.6 1 323.2 1 400.2 Nominal growth (%) 1.9 6.8 6.9 5.6 5.8 Real growth (%) - 0.8 4.2 4.3 3.1 3.2 Policy adjusted underlying revenue ($m) 1 099.9 1 171.8 1 240.8 1 310.8 1 387.1 Nominal growth (%) 2.7 6.5 5.9 5.6 5.8 Real growth (%) 0.0 3.9 3.3 3.1 3.2
Payroll tax receipts have been revised down by $61 million since the 2013–14 Budget reflecting a lower than budgeted outcome for 2012–13 and softer than expected employment conditions in 2013–14. Growth in both employment and hours worked is expected to be weaker than originally estimated.
Growth in payroll tax revenue in 2013–14 is impacted by the temporary small business payroll tax concession, which is available in 2013–14 and 2014–15. Growth in payroll tax revenue of between 4.3 per cent and 3.1 per cent in real terms is expected over the forward estimates consistent with the outlook for employment and wages growth.
Although growth in employment and wages is expected across the forward years, employment and wages growth assumptions from 2015–16 are affected by the planned cessation of vehicle manufacturing operations by GM Holden Ltd and Toyota Motor Corporation.
Property taxes
Property taxes include stamp duties (including on the conveyance of property and transfers of non-quoted marketable securities), land tax, the ESL on fixed property, the Save the River Murray Levy, regional natural resources management levies, guarantee fees, the transport development levy from 1 July 2014, and other minor taxes.
Property taxes are expected to grow in real terms by 14.2 per cent in 2014–15. This growth reflects the commencement of the transport development levy and the removal of ESL remissions from 1 July 2014, increases in revenue from guarantee fees following SA Water’s $2.7 billion increase in debt as well as the expected continued recovery in the property market.
The outlook for property tax revenue is provided in table 3.6.
Chapter 3: Revenue
2014–15 Budget Statement 47
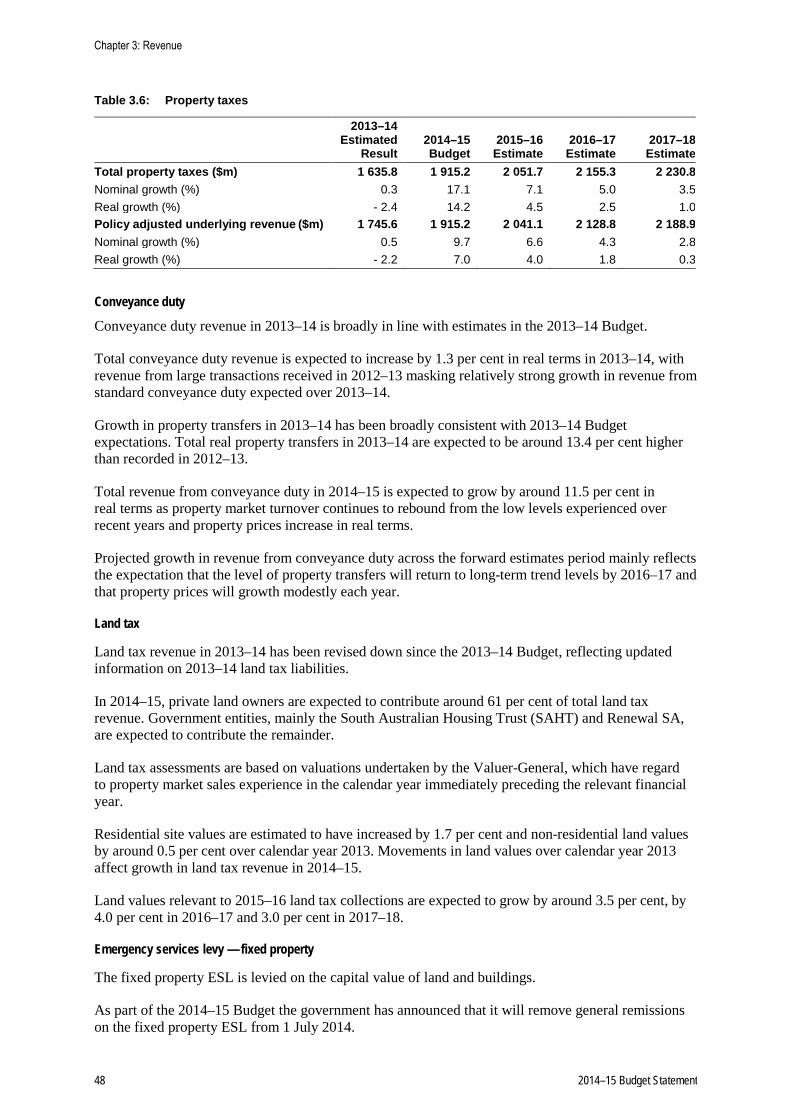
Table 3.6: Property taxes
2013–14 Estimated 2014–15 2015–16 2016–17 2017–18 Result Budget Estimate Estimate Estimate
Total property taxes ($m) 1 635.8 1 915.2 2 051.7 2 155.3 2 230.8 Nominal growth (%) 0.3 17.1 7.1 5.0 3.5 Real growth (%) - 2.4 14.2 4.5 2.5 1.0 Policy adjusted underlying revenue ($m) 1 745.6 1 915.2 2 041.1 2 128.8 2 188.9 Nominal growth (%) 0.5 9.7 6.6 4.3 2.8 Real growth (%) - 2.2 7.0 4.0 1.8 0.3
Conveyance duty
Conveyance duty revenue in 2013–14 is broadly in line with estimates in the 2013–14 Budget.
Total conveyance duty revenue is expected to increase by 1.3 per cent in real terms in 2013–14, with revenue from large transactions received in 2012–13 masking relatively strong growth in revenue from standard conveyance duty expected over 2013–14.
Growth in property transfers in 2013–14 has been broadly consistent with 2013–14 Budget expectations. Total real property transfers in 2013–14 are expected to be around 13.4 per cent higher than recorded in 2012–13.
Total revenue from conveyance duty in 2014–15 is expected to grow by around 11.5 per cent in real terms as property market turnover continues to rebound from the low levels experienced over recent years and property prices increase in real terms.
Projected growth in revenue from conveyance duty across the forward estimates period mainly reflects the expectation that the level of property transfers will return to long-term trend levels by 2016–17 and that property prices will growth modestly each year.
Land tax
Land tax revenue in 2013–14 has been revised down since the 2013–14 Budget, reflecting updated information on 2013–14 land tax liabilities.
In 2014–15, private land owners are expected to contribute around 61 per cent of total land tax revenue. Government entities, mainly the South Australian Housing Trust (SAHT) and Renewal SA, are expected to contribute the remainder.
Land tax assessments are based on valuations undertaken by the Valuer-General, which have regard to property market sales experience in the calendar year immediately preceding the relevant financial year.
Residential site values are estimated to have increased by 1.7 per cent and non-residential land values by around 0.5 per cent over calendar year 2013. Movements in land values over calendar year 2013 affect growth in land tax revenue in 2014–15.
Land values relevant to 2015–16 land tax collections are expected to grow by around 3.5 per cent, by 4.0 per cent in 2016–17 and 3.0 per cent in 2017–18.
Emergency services levy — fixed property
The fixed property ESL is levied on the capital value of land and buildings.
As part of the 2014–15 Budget the government has announced that it will remove general remissions on the fixed property ESL from 1 July 2014.
Chapter 3: Revenue
48 2014–15 Budget Statement
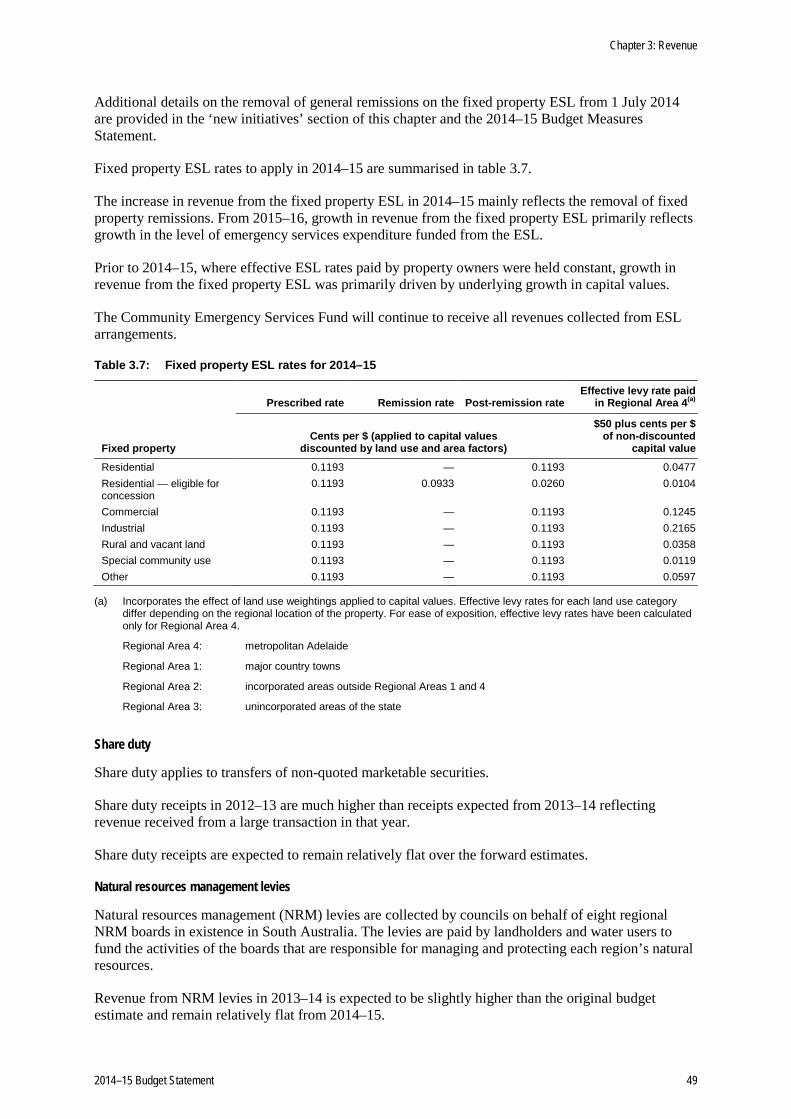
Additional details on the removal of general remissions on the fixed property ESL from 1 July 2014 are provided in the ‘new initiatives’ section of this chapter and the 2014–15 Budget Measures Statement.
Fixed property ESL rates to apply in 2014–15 are summarised in table 3.7.
The increase in revenue from the fixed property ESL in 2014–15 mainly reflects the removal of fixed property remissions. From 2015–16, growth in revenue from the fixed property ESL primarily reflects growth in the level of emergency services expenditure funded from the ESL.
Prior to 2014–15, where effective ESL rates paid by property owners were held constant, growth in revenue from the fixed property ESL was primarily driven by underlying growth in capital values.
The Community Emergency Services Fund will continue to receive all revenues collected from ESL arrangements.
Table 3.7: Fixed property ESL rates for 2014–15
Prescribed rate Remission rate Post-remission rate
Effective levy rate paid in Regional Area 4(a)
Fixed property Cents per $ (applied to capital values
discounted by land use and area factors)
$50 plus cents per $ of non-discounted
capital value
Residential 0.1193 — 0.1193 0.0477 Residential — eligible for concession
0.1193 0.0933 0.0260 0.0104
Commercial 0.1193 — 0.1193 0.1245 Industrial 0.1193 — 0.1193 0.2165 Rural and vacant land 0.1193 — 0.1193 0.0358 Special community use 0.1193 — 0.1193 0.0119 Other 0.1193 — 0.1193 0.0597
(a) Incorporates the effect of land use weightings applied to capital values. Effective levy rates for each land use category differ depending on the regional location of the property. For ease of exposition, effective levy rates have been calculated only for Regional Area 4.
Regional Area 4: metropolitan Adelaide
Regional Area 1: major country towns
Regional Area 2: incorporated areas outside Regional Areas 1 and 4
Regional Area 3: unincorporated areas of the state
Share duty
Share duty applies to transfers of non-quoted marketable securities.
Share duty receipts in 2012–13 are much higher than receipts expected from 2013–14 reflecting revenue received from a large transaction in that year.
Share duty receipts are expected to remain relatively flat over the forward estimates.
Natural resources management levies
Natural resources management (NRM) levies are collected by councils on behalf of eight regional NRM boards in existence in South Australia. The levies are paid by landholders and water users to fund the activities of the boards that are responsible for managing and protecting each region’s natural resources.
Revenue from NRM levies in 2013–14 is expected to be slightly higher than the original budget estimate and remain relatively flat from 2014–15.
Chapter 3: Revenue
2014–15 Budget Statement 49

Save the River Murray Levy
Funds raised from the Save the River Murray Levy are used to fund specific measures aimed at improving the long-term security and quality of South Australia’s water supply.
Levy rates are indexed annually to movements in the Adelaide Consumer Price Index (CPI). SA Water collects the levy.
Revenue from the levy is expected to be lower in 2013–14 than in 2012–13 following changes to the Water Industry Act 2012 that amended the application of the levy so that it no longer applies to properties where the property’s water supply system is not connected to the River Murray.
Revenue from the levy is expected to grow modestly from 2014–15 in line with inflation and growth in SA Water’s customer base.
Guarantee fees
Government guarantees on borrowed funds reduce borrowing costs for government authorities. Guarantee fees are charged for this funding cost advantage.
Guarantee fees are determined each year based on estimated credit margins (spreads) between the cost at which lower-rated entities or entities that have no assigned credit rating could borrow at on a stand-alone basis and the cost at which they can borrow through the Government of South Australia.
Revenue from guarantee fees is expected to be slightly lower than the original budget estimate in 2013–14 due to lower than expected borrowings by HomeStart.
Guarantee fee revenue is expected to grow by $31 million in 2014–15 reflecting SA Water’s $2.7 billion increase in debt.
Transport development levy
In the 2012–13 Mid-Year Budget Review (MYBR) the government announced that it would introduce a transport development levy on certain off-street and ticketed on-street car parks in the Adelaide central business district from 1 July 2014.
The levy will be set at $750 per car park space in 2014–15 and will be indexed annually to movements in the Adelaide CPI.
Funds raised from the transport development levy will be used to fund improvements to transport services.
Gambling taxes
Gambling taxes include taxes on gaming machines in hotels and clubs, a tax on the net gambling revenue of SA Lotteries, casino duty and tax on net wagering revenue of the SA TAB.
The outlook for gambling tax revenue is provided in table 3.8.
Chapter 3: Revenue
50 2014–15 Budget Statement
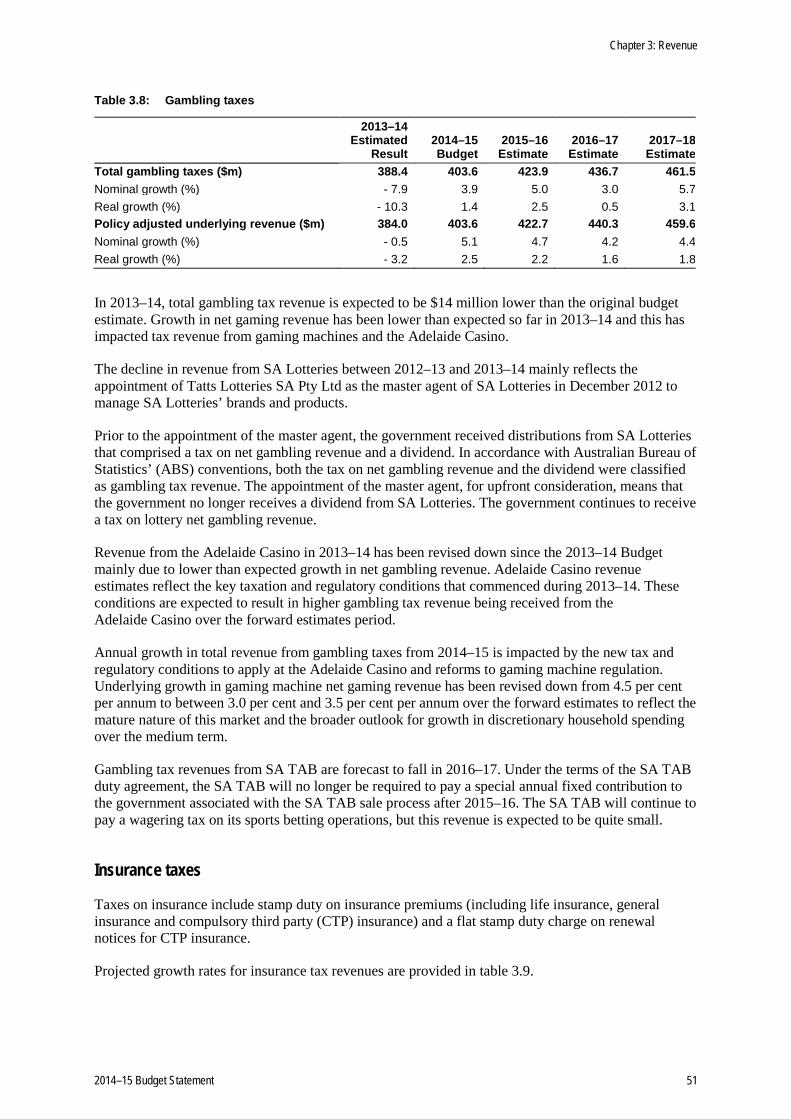
Table 3.8: Gambling taxes
2013–14 Estimated 2014–15 2015–16 2016–17 2017–18 Result Budget Estimate Estimate Estimate
Total gambling taxes ($m) 388.4 403.6 423.9 436.7 461.5 Nominal growth (%) - 7.9 3.9 5.0 3.0 5.7 Real growth (%) - 10.3 1.4 2.5 0.5 3.1 Policy adjusted underlying revenue ($m) 384.0 403.6 422.7 440.3 459.6 Nominal growth (%) - 0.5 5.1 4.7 4.2 4.4 Real growth (%) - 3.2 2.5 2.2 1.6 1.8
In 2013–14, total gambling tax revenue is expected to be $14 million lower than the original budget estimate. Growth in net gaming revenue has been lower than expected so far in 2013–14 and this has impacted tax revenue from gaming machines and the Adelaide Casino.
The decline in revenue from SA Lotteries between 2012–13 and 2013–14 mainly reflects the appointment of Tatts Lotteries SA Pty Ltd as the master agent of SA Lotteries in December 2012 to manage SA Lotteries’ brands and products.
Prior to the appointment of the master agent, the government received distributions from SA Lotteries that comprised a tax on net gambling revenue and a dividend. In accordance with Australian Bureau of Statistics’ (ABS) conventions, both the tax on net gambling revenue and the dividend were classified as gambling tax revenue. The appointment of the master agent, for upfront consideration, means that the government no longer receives a dividend from SA Lotteries. The government continues to receive a tax on lottery net gambling revenue.
Revenue from the Adelaide Casino in 2013–14 has been revised down since the 2013–14 Budget mainly due to lower than expected growth in net gambling revenue. Adelaide Casino revenue estimates reflect the key taxation and regulatory conditions that commenced during 2013–14. These conditions are expected to result in higher gambling tax revenue being received from the Adelaide Casino over the forward estimates period.
Annual growth in total revenue from gambling taxes from 2014–15 is impacted by the new tax and regulatory conditions to apply at the Adelaide Casino and reforms to gaming machine regulation. Underlying growth in gaming machine net gaming revenue has been revised down from 4.5 per cent per annum to between 3.0 per cent and 3.5 per cent per annum over the forward estimates to reflect the mature nature of this market and the broader outlook for growth in discretionary household spending over the medium term.
Gambling tax revenues from SA TAB are forecast to fall in 2016–17. Under the terms of the SA TAB duty agreement, the SA TAB will no longer be required to pay a special annual fixed contribution to the government associated with the SA TAB sale process after 2015–16. The SA TAB will continue to pay a wagering tax on its sports betting operations, but this revenue is expected to be quite small.
Insurance taxes
Taxes on insurance include stamp duty on insurance premiums (including life insurance, general insurance and compulsory third party (CTP) insurance) and a flat stamp duty charge on renewal notices for CTP insurance.
Projected growth rates for insurance tax revenues are provided in table 3.9.
Chapter 3: Revenue
2014–15 Budget Statement 51

Table 3.9: Insurance taxes
2013–14 Estimated 2014–15 2015–16 2016–17 2017–18 Result Budget Estimate Estimate Estimate
Total insurance taxes ($m) 443.2 440.5 452.8 470.6 489.6 Nominal growth (%) 3.2 - 0.6 2.8 3.9 4.0 Real growth (%) 0.4 - 3.0 0.3 1.4 1.5 Policy adjusted underlying revenue ($m) 435.8 440.5 452.8 470.6 489.6 Nominal growth (%) 6.5 1.1 2.8 3.9 4.0 Real growth (%) 3.6 - 1.4 0.3 1.4 1.5
Revenue from insurance taxes has been revised down in 2013–14 compared to the original budget estimate mainly due to a change in the timing of back payments associated with the treatment of life insurance riders.
The 2013–14 Budget assumed that these payments would be received in 2013–14. While a number of back payments have been received in 2013–14, some payments were received in late 2012–13 and some are now expected to be paid in 2014–15. Underlying insurance duty revenue has been revised up in 2013–14 to reflect year to date experience and this flows through as a base effect to future years.
Growth in insurance duty revenue in 2013–14 and 2014–15 is impacted by the government’s CTP reform measures as well as the receipt of back payments over the period 2012–13 to 2014–15.
Revenue from stamp duty on CTP insurance premiums is expected to fall by $4 million in 2014–15, primarily reflecting the second stage of the government’s CTP reform measures. In 2014–15 a new Lifetime Support Scheme (LSS) levy will commence which will be subject to stamp duty. Revenue from stamp duty on the LSS levy is included in motor vehicle taxes.
Excluding the impact of the back payment of taxes and the government’s CTP reform measures, underlying growth in stamp duty on insurance premiums in 2014–15 reflects expected growth of around 4.4 per cent in the total value of domestic and commercial insurance premiums.
From 2015–16, underlying revenue from insurance duty is expected to grow modestly, reflecting expected growth in premiums.
Motor vehicle taxes
Motor vehicle taxes include registration fees, stamp duty on new registrations and ownership transfers, the ESL on mobile property and, from 1 July 2014, stamp duty on LSS levy contributions.
The growth rates for motor vehicle tax revenues are provided in table 3.10.
Table 3.10: Motor vehicle taxes
2013–14 Estimated 2014–15 2015–16 2016–17 2017–18 Result Budget Estimate Estimate Estimate
Total motor vehicle taxes ($m) 556.2 592.5 614.1 634.1 654.2 Nominal growth (%) 2.0 6.5 3.6 3.3 3.2 Real growth (%) - 0.7 3.9 1.1 0.7 0.7 Policy adjusted underlying revenue ($m) 578.3 595.1 614.1 634.1 654.2 Nominal growth (%) 2.0 2.9 3.2 3.3 3.2 Real growth (%) - 0.7 0.4 0.7 0.7 0.7
Chapter 3: Revenue
52 2014–15 Budget Statement

Revenue from motor vehicle taxes in 2013–14 is expected to be around $2 million higher than the original budget estimate due to higher revenue from stamp duty on motor vehicle registration transfers.
From 2014–15, a new levy will commence to fund the LSS, and stamp duty of 11 per cent will apply to LSS levy revenues. Relatively stronger growth in total motor vehicle taxes in 2014–15 compared to subsequent years reflects the commencement of duty payments on LSS levy revenues.
As part of the 2014–15 Budget, the government has announced that it will remove general remissions on the mobile property ESL rates for cars, larger motor cycles and historically registered vehicles from 1 August 2014.
Additional details on the removal of general remissions on mobile property ESL from 1 August 2014 are provided in the ‘new initiatives’ section of this chapter and the 2014–15 Budget Measures Statement.
The increase in revenue raised from the ESL on mobile property in 2014–15 mainly reflects the removal of mobile property general remissions. From 2015–16, revenue from the ESL on mobile property is expected to grow in line with growth in the stock of registered vehicles reflecting that ESL charges on motor vehicles are flat dollar amounts.
Growth in revenue from motor vehicle taxes from 2015–16 reflects the annual indexation of motor vehicle fees, growth in the stock of registered vehicles, and modest growth in revenue from stamp duty on motor vehicle registration transfers and stamp duty revenue on the LSS levy.
South Australia’s relative tax effort
In terms of tax revenue per capita, South Australia is a relatively low tax jurisdiction (third lowest in 2013–14 based on state and territory estimates published in 2013–14 mid-year budget publications).
Details are provided in table 3.11.
Table 3.11: Per capita taxation by jurisdiction ($)(a)
2012–13(b)(c)
2013–14 MYBR(c)(d)
Western Australia 3 405 3 533 Australian Capital Territory 3 291 3 378 New South Wales 3 002 3 123 Victoria 2 750 2 847 Queensland 2 392 2 537 South Australia 2 367 2 405 Northern Territory 2 078 2 112 Tasmania 1 806 1 860 All states and territories 2 783 2 896
(a) Taxation revenues for South Australia have been adjusted to remove land tax paid by SAHT.
(b) Based on published outcomes for all states and territories.
(c) Population figures for 2012–13 have been sourced from ABS’s publications and 2013–14 population estimates have been sourced from Commonwealth Government Treasury estimates.
(d) Based on taxation revenue estimates published in 2013–14 mid-year budget publications.
Chapter 3: Revenue
2014–15 Budget Statement 53

Each year the Commonwealth Grants Commission (CGC) releases an assessment of relative tax effort for all states and territories as part of its annual relativity update. The tax effort measure by the CGC reflects the use made of selected tax bases not their size, providing an indication of how a state’s effective level of tax differs to the effective level of all states and territories.
In March 2014, the CGC published its Report on GST Revenue Sharing Relativities — 2014 Update. Based on the information provided by the CGC, South Australia’s total tax effort has increased from 9.1 per cent above average in 2011–12 to 9.7 per cent above average in 2012–13.
Details of tax effort assessments are provided in table 3.12.
Table 3.12: Tax effort ratios by jurisdiction
2011–12 2012–13 CGC(a) CGC(a)
New South Wales 106.0 106.9 Victoria 102.6 101.4 Queensland 90.1 88.6 Western Australia 93.0 95.4 South Australia 109.1 109.7 Tasmania 90.4 92.4 Australian Capital Territory 104.5 99.3 Northern Territory 77.5 83.5
(a) Tax effort ratios published as supporting information to the CGC’s Report on GST Revenue Sharing Relativities ― 2014 Update.
Pitcher Partners recently released its 2013–14 state tax review. The review compares key government taxes and charges for a hypothetical representative business in each state. The review found that South Australia has a very competitive business taxation regime, with South Australia having the lowest total taxes and charges for a larger representative business (in annual payroll terms) and the second lowest charges for a smaller business.
Chapter 3: Revenue
54 2014–15 Budget Statement

Grant revenue
Table 3.13: Grant revenue ($million)
2013–14 2013–14 Estimated 2014–15 2015–16 2016–17 2017–18 Budget Result Budget Estimate Estimate Estimate
Current grant revenue Current grants from the Commonwealth GST revenue grants 4 595.0 4 618.2 4 956.3 5 315.2 5 813.6 6 062.9 National Partnership grants 438.8 450.1 346.0 312.7 320.3 212.0 National Partnership grants for on-passing 115.2 113.4 155.6 154.0 153.2 158.9 Specific purpose grants 1 476.0 1 485.7 1 636.4 1 752.6 1 875.2 1 965.1 Specific purpose grants for on-passing 717.7 729.6 764.3 811.1 861.2 901.3 Total current grants from the Commonwealth
7 342.8 7 397.0 7 858.6 8 345.6 9 023.5 9 300.2
Other contributions and grants 247.3 245.1 141.7 140.9 141.7 142.0 Total current grant revenue 7 590.1 7 642.1 8 000.3 8 486.5 9 165.2 9 442.2 Capital grant revenue Capital grants from the Commonwealth National Partnership grants 133.3 68.8 154.9 462.5 341.5 310.8 Specific purpose grants 116.6 103.6 91.6 92.4 93.3 94.3 Specific purpose grants for on-passing 13.8 11.4 — — — — Other Commonwealth grants 4.8 4.2 4.9 3.1 3.1 3.1 Total capital grants from the Commonwealth 268.4 188.0 251.4 558.0 438.0 408.2 Other capital contributions and grants 24.6 24.5 18.0 19.0 17.0 17.0 Total capital grant revenue 293.0 212.5 269.4 577.0 455.0 425.2
Total grant revenue 7 883.0 7 854.6 8 269.7 9 063.5 9 620.2 9 867.4
% change on previous year GST revenue grants Nominal growth (%) 2.8 7.3 7.2 9.4 4.3 Real growth (%) 0.1 4.7 4.6 6.7 1.7 Current revenue grants (excl GST) from the Commonwealth
Nominal growth (%) 1.7 4.4 4.4 5.9 0.9 Real growth (%) - 1.1 1.9 1.9 3.3 - 1.6 Capital revenue grants from the Commonwealth
Nominal growth (%) - 39.9 33.7 122.0 - 21.5 - 6.8 Real growth (%) - 41.5 30.4 116.6 - 23.4 - 9.1
Note: Totals may not add due to rounding.
GST revenue grants
GST revenue grants to South Australia in 2013–14 are estimated to be $23.2 million higher than the original budget estimate, mainly due to an upward revision to the national GST pool estimate.
The national GST pool is expected to increase by around 5.5 per cent in 2013–14, compared with the Commonwealth Government’s original estimate in its 2013–14 Budget for growth of 5.3 per cent. In total, the Commonwealth Government has revised up its estimate of the 2013–14 GST pool by around $470 million since its 2013–14 Budget.
The Commonwealth Government has estimated that the total GST pool will grow by around 5.9 per cent in 2014–15, 6.2 per cent in 2015–16, 6.0 per cent in 2016–17 and 5.6 per cent in 2017–18.
Chapter 3: Revenue
2014–15 Budget Statement 55

Over the same period, South Australia’s GST revenue grants are anticipated to grow by 7.3 per cent, 7.2 per cent, 9.4 per cent and 4.3 per cent respectively.
South Australia’s GST revenue grants are anticipated to grow at rates that vary from growth in the GST pool reflecting changes in South Australia’s projected share of the GST pool. Factors contributing to changes in South Australia’s share of the GST pool include a declining population share and movements in South Australia’s projected relativities (which are particularly impacted by the distribution of Commonwealth Government National Partnership agreement funding amongst the states as well as growth in royalties and taxation revenue relative to other states).
Commonwealth Grants Commission’s 2014 Update
The Intergovernmental Agreement on Federal Financial Relations (the IGA) includes a specific provision that GST revenue grants will be distributed in accordance with the principles of horizontal fiscal equalisation (HFE). The principle of HFE is to ensure that each state has the capacity to provide public services at a similar standard and level of efficiency as the other states for a comparable revenue raising effort.
It is the responsibility of the Commonwealth Grants Commission (CGC), an independent Commonwealth statutory authority, to recommend an appropriate distribution of GST revenue to achieve this outcome.
The CGC provides an annual recommendation to the Commonwealth Treasurer on the share of GST revenue to be distributed to each state. This recommendation is based on a detailed assessment of the economic, social or demographic factors influencing each jurisdiction’s relative ability to raise revenue and the impact of such factors on service delivery costs.
In March 2014, the CGC released its Report on GST Revenue Sharing Relativities — 2014 Update of per capita relativities for the distribution of Commonwealth Government GST revenue grants to the states in 2014–15.
The CGC recommended increased relativities for New South Wales, Queensland, South Australia, Tasmania, the Northern Territory and the Australian Capital Territory and lower relativities for Victoria and Western Australia.
South Australia’s relativity increased to 1.28803 in the 2014 Update compared with 1.26167 in the 2013 Update. In 2014–15, South Australia will receive 9.2 per cent of the GST pool compared to 9.1 per cent in 2013–14.
The main factors that produced the improvement for South Australia were:
• a decrease in the share of Commonwealth Government payments to South Australia. This reflects the decline in the influence of Commonwealth funding provided for the Adelaide Desalination Plant (Water for the Future) and road and rail infrastructure projects
• a lower relative share of stamp duty on conveyances for South Australia including non-real property stamp-duty transactions
• an increase in South Australia’s need to provide public health services due to below average growth in non-state health services provision from Medicare and privately funded health services.
These gains were partially offset by
• below average population growth which reduced South Australia’s assessed need for infrastructure
• the use of new 2011 Census data that resulted in South Australia having a lower share of the Australian population living in remote areas compared to the 2006 Census and a lower relative share of the low socio-economic status population.
Chapter 3: Revenue
56 2014–15 Budget Statement
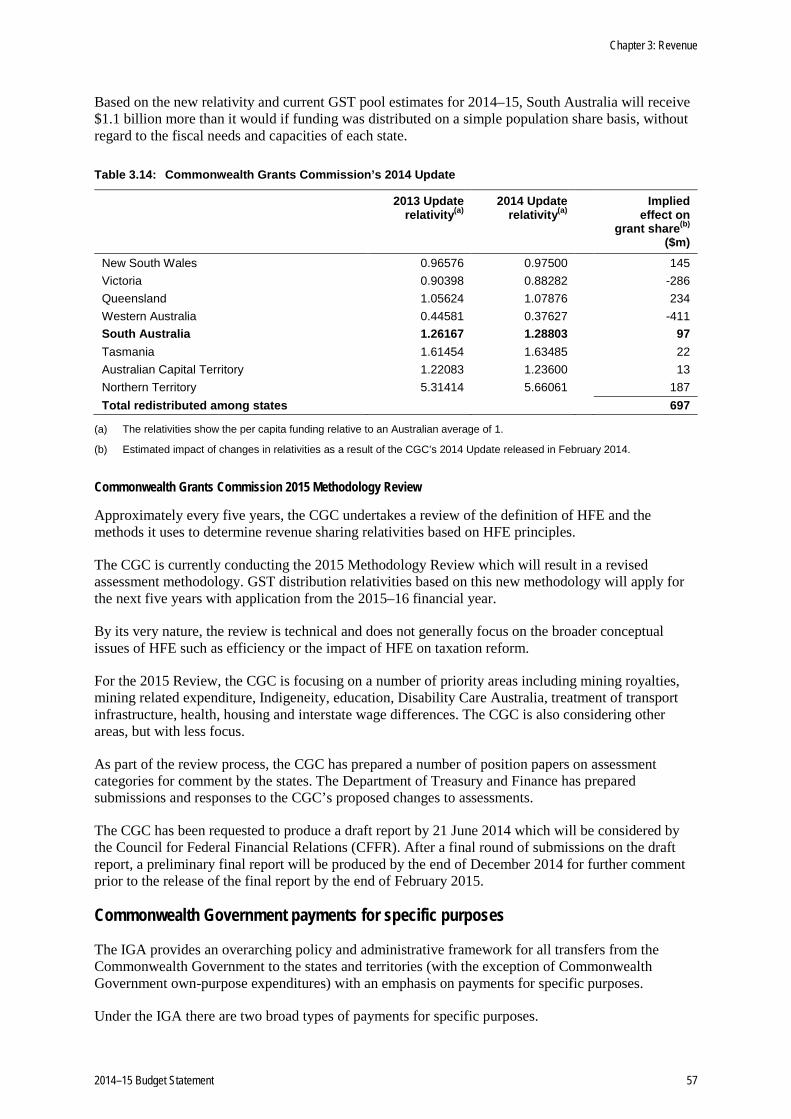
Based on the new relativity and current GST pool estimates for 2014–15, South Australia will receive $1.1 billion more than it would if funding was distributed on a simple population share basis, without regard to the fiscal needs and capacities of each state.
Table 3.14: Commonwealth Grants Commission’s 2014 Update
2013 Update relativity(a)
2014 Update relativity(a)
Implied effect on
grant share(b) ($m)
New South Wales 0.96576 0.97500 145 Victoria 0.90398 0.88282 -286 Queensland 1.05624 1.07876 234 Western Australia 0.44581 0.37627 -411 South Australia 1.26167 1.28803 97 Tasmania 1.61454 1.63485 22 Australian Capital Territory 1.22083 1.23600 13 Northern Territory 5.31414 5.66061 187 Total redistributed among states 697
(a) The relativities show the per capita funding relative to an Australian average of 1.
(b) Estimated impact of changes in relativities as a result of the CGC’s 2014 Update released in February 2014.
Commonwealth Grants Commission 2015 Methodology Review
Approximately every five years, the CGC undertakes a review of the definition of HFE and the methods it uses to determine revenue sharing relativities based on HFE principles.
The CGC is currently conducting the 2015 Methodology Review which will result in a revised assessment methodology. GST distribution relativities based on this new methodology will apply for the next five years with application from the 2015–16 financial year.
By its very nature, the review is technical and does not generally focus on the broader conceptual issues of HFE such as efficiency or the impact of HFE on taxation reform.
For the 2015 Review, the CGC is focusing on a number of priority areas including mining royalties, mining related expenditure, Indigeneity, education, Disability Care Australia, treatment of transport infrastructure, health, housing and interstate wage differences. The CGC is also considering other areas, but with less focus.
As part of the review process, the CGC has prepared a number of position papers on assessment categories for comment by the states. The Department of Treasury and Finance has prepared submissions and responses to the CGC’s proposed changes to assessments.
The CGC has been requested to produce a draft report by 21 June 2014 which will be considered by the Council for Federal Financial Relations (CFFR). After a final round of submissions on the draft report, a preliminary final report will be produced by the end of December 2014 for further comment prior to the release of the final report by the end of February 2015.
Commonwealth Government payments for specific purposes
The IGA provides an overarching policy and administrative framework for all transfers from the Commonwealth Government to the states and territories (with the exception of Commonwealth Government own-purpose expenditures) with an emphasis on payments for specific purposes.
Under the IGA there are two broad types of payments for specific purposes.
Chapter 3: Revenue
2014–15 Budget Statement 57

• National specific purpose payments (SPPs) that provide ongoing funding to the states for service delivery in the core areas of health, education, housing, skills and workforce development and disability services.
• National Partnerships (NPs) that fall into two broad categories — to support the delivery of specific projects (including infrastructure) and to facilitate the implementation or reward the delivery of national reforms. A further category of NP has been created called project agreements, which is a vehicle for funding low value or low risk projects.
Table 3.15 summarises expected national SPP and NP grants to South Australia by category.
Table 3.15: Commonwealth Government payments for specific purposes by category ($million)(a)
Agreement
2013–14 Estimated
Result 2014–15 Budget
2015–16 Estimate
2016–17 Estimate
2017–18 Estimate
Health
National Health Reform funding 1 006.4 1 077.7 1 168.1 1 263.9 — Public hospitals funding(b) — — — — 1 316.0 National Partnerships 107.6 109.2 39.4 41.4 46.0
Education and Early Childhood
National Schools SPP (government schools) 152.5 — — — — National Schools SPP (non-government schools)(c) 375.0 — — — — Students First — A fairer funding agreement for schools (government schools) 181.6 379.1 401.3 424.3 457.8 Students First — A fairer funding agreement for schools (non-government schools)(c)
366.0
764.3
811.1
861.2
901.3
National Partnerships 84.0 46.8 37.8 35.8 34.1 Skills and Workforce Development
National Skills and Workforce Development SPP 102.3 102.4 103.4 104.5 105.6 National Partnerships 26.0 30.1 28.9 39.0 1.5
Community Services
Disability Services SPP(d) 52.5 75.5 78.2 80.9 84.1 National Partnerships 87.1 4.3 12.4 21.2 23.7
Housing National Affordable Housing SPP 94.0 93.2 94.0 95.0 96.0 National Partnerships 52.7 36.6 27.8 23.7 25.2
Infrastructure National Partnerships 73.4 158.1 496.6 378.8 348.1
Environment National Partnerships 77.8 101.5 117.1 106.6 28.6
Other National Partnerships 21.4 17.3 17.6 17.8 18.1 Local government financial assistance 102.4 152.5 151.7 150.8 156.4
Total Commonwealth Government payments for specific purposes 2 962.6 3 148.8 3 585.3 3 644.7 3 642.4
Note: Totals may not add due to rounding.
(a) NP amounts are the maximum amount of funding available thereby assuming that all necessary performance requirements are met in each agreement.
Chapter 3: Revenue
58 2014–15 Budget Statement

(b) National Health Reform funding is replaced by public hospitals funding from 2017–18. At the time of the budget update released in January 2014, National Health Reform funding was estimated to be $1.533 billion in 2017–18. As a result of the 2014–15 Commonwealth Government Budget, replacement funding (for public hospitals) will be reduced by $217 million in 2017–18.
(c) Funding amounts for non-government schools are GST inclusive.
(d) Amounts under the Disability Services SPP have been adjusted to reflect changes in responsibility for the provision of basic community care and support services for older Australians in accordance with the National Health Reform agenda. The changed roles and responsibilities of the Commonwealth Government and states and territories under the National Health Reform Agreement are to occur on a budget neutral basis. In 2012–13, the adjustment to achieve budget neutrality was not made by the Commonwealth Government. In 2013–14, net funding for the Disability Services SPP reflects the budget neutrality adjustment for both 2012–13 and 2013–14.
National specific purpose payments (current)
National SPPs are provided by the Commonwealth Government to support states to achieve the outcomes contained in National Agreements that cover the major service delivery areas agreed by the Council of Australian Governments (COAG). States and territories are required to spend the funding received under each national SPP in the relevant sector but have the flexibility to allocate funds within that sector to meet agreed objectives.
When originally agreed, the IGA provided for five national SPPs covering health, schools, disability, housing, and skills and workforce development. Following a five-year transition period, funding for National SPPs will be distributed between the states on a per capita basis based on ABS’s population estimates from 2014–15.
Since the introduction of the IGA, two former national SPPs have been superseded.
The National Healthcare SPP was replaced by National Health Reform funding from 1 July 2012 and comprised base funding equivalent to the previous National Healthcare SPP and, from 1 July 2014, was also to incorporate efficient growth funding. The Commonwealth Government announced in its 2014–15 Budget that these arrangements would not be ongoing.
National Health Reform funding in 2013–14 is equivalent to what would have been provided through the former National Healthcare SPP with indexation for health inflation, weighted population growth and an allowance for technology. From 1 July 2014 to June 2017, National Health Reform funding will be determined by the level of services delivered by public hospitals. Each state’s entitlement will be directly linked to the growth in public hospital activity. The Commonwealth Government announced in its 2014–15 Budget that all funding guarantees previously agreed in the National Health Reform Agreement will cease, including the $16.4 billion national guarantee.
From 1 July 2017, funding will no longer be provided under the National Health Reform Agreement. Instead, the Commonwealth Government will provide funding for public hospitals and index its contribution by the Consumer Price Index (CPI) and adjust for population growth. Growth in health costs is significantly higher than the CPI and demand grows faster than population growth due to the aging demographic impacts.
Compared to the information published in the Commonwealth Government’s 2013–14 MYEFO, South Australia will receive $444 million less funding across the forward estimates as a result of the Commonwealth Government’s decision not to retain funding arrangements in the National Health Reform Agreement.
From 1 January 2014, the National Schools SPP was replaced by funding under the Students First program and these arrangements will continue up to and including the 2017 school year. Under these arrangements, funding will be based on a new needs-based funding model for schools using a Schooling Resource Standard. A base amount of funding will be provided for each student, supplemented by additional loadings for relative disadvantage.
Chapter 3: Revenue
2014–15 Budget Statement 59

From the 2018 school year onwards, total recurrent funding for schools will be indexed by the CPI with an allowance for changes in enrolments. As a consequence, South Australia will receive $45 million less funding in 2017–18 when compared to the information published in the Commonwealth Government’s 2013–14 MYEFO, and this will increase to more than $200 million in the 2019 school year.
In 2014–15, South Australia will receive an estimated $2.4 billion of funding in national SPPs for recurrent purposes. Over the forward estimates national SPP growth incorporates the impact of the Commonwealth Government’s decisions to remove the growth funding guarantee that was a key element of the National Health Reform Agreement and, from 1 July 2017 to index its contribution to public hospitals by the CPI.
Estimates for the Disability Services SPP include an adjustment to reflect the change in responsibility for the provision of aged care and disability services between the states and the Commonwealth Government under the National Health Reform Agreement. This change in roles and responsibilities is intended to be budget neutral. In 2013–14, estimates for the Disability Services SPP are lower compared to other years as estimates for 2013–14 include budget neutrality adjustments for both 2012–13 and 2013–14. In 2012–13, the budget neutrality adjustment was not made by the Commonwealth Government.
National SPPs provided to the state for on-passing mainly comprise funding for non-government schools. Estimates for 2017–18 reflect the Commonwealth Government’s decision to commence indexation of funding for schools by the CPI for the 2018 school year.
National Partnerships (current)
NPs are time limited agreements to fund specific projects and to facilitate and/or reward states that deliver nationally significant reforms.
In 2014–15, South Australia will receive an estimated $346.0 million of funding in NPs for recurrent purposes. This is a decrease of 23.1 per cent compared to the $450.1 million estimated for 2013–14.
NPs to the state decline significantly in 2014–15 and 2015–16 largely reflecting the Commonwealth Government’s decision to cease funding a number of long-standing programs. These include the following NPs (with funding losses over the forward estimates):
• certain concessions for Pension Card and Seniors Card Holders ($123 million)
• improving public hospital services ($120 million)
• financial assistance for long stay older patients ($42 million)
• skills reform ($38 million)
• preventative health ($15 million)
• training places for single and teenage parents ($9 million)
• reward payments for seamless national economy reforms ($8 million).
NPs for on-passing increase in 2014–15 reflecting the Commonwealth Government’s decision to pay a significant proportion of 2013–14 local government financial assistance grants in 2012–13. A full year’s funding is being provided for local government financial assistance grants in 2014–15. The Commonwealth Government also announced in its 2014–15 Budget that there will be a three-year pause on indexation for local government financial assistance grants.
Other contributions and grants (current)
Other contributions and grants mainly take the form of donations, bequests, industrial research and sponsorship grants.
Chapter 3: Revenue
60 2014–15 Budget Statement
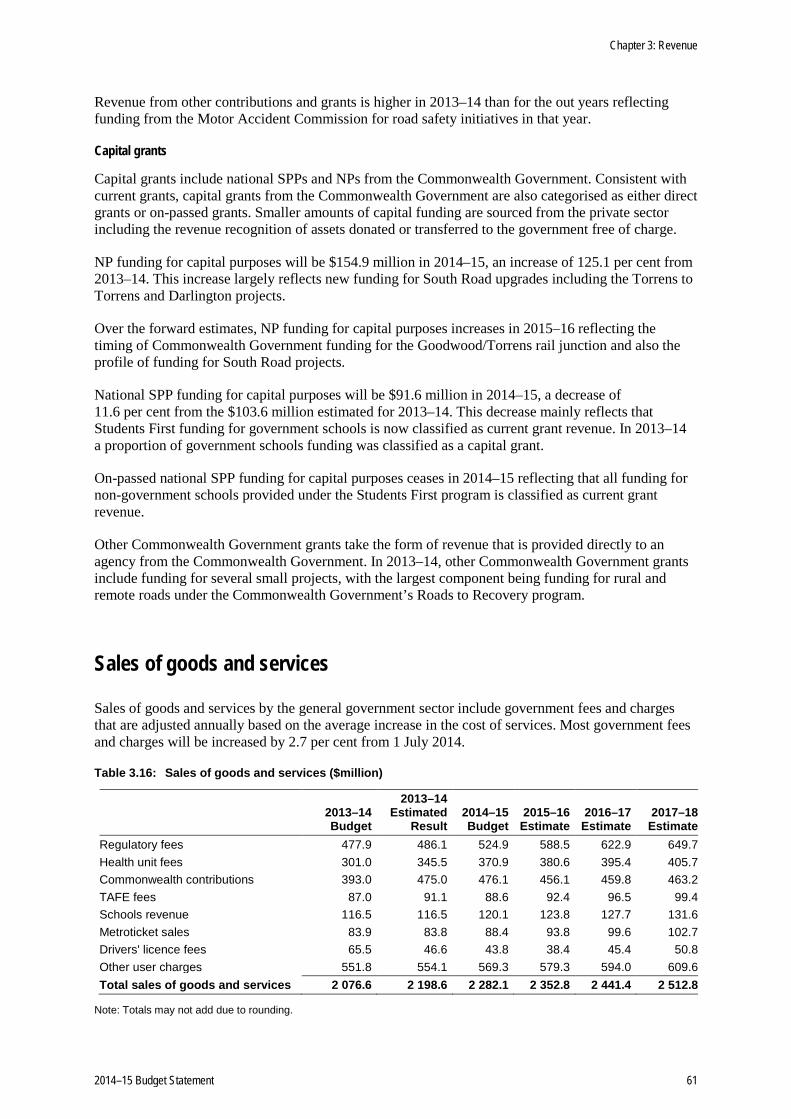
Revenue from other contributions and grants is higher in 2013–14 than for the out years reflecting funding from the Motor Accident Commission for road safety initiatives in that year.
Capital grants
Capital grants include national SPPs and NPs from the Commonwealth Government. Consistent with current grants, capital grants from the Commonwealth Government are also categorised as either direct grants or on-passed grants. Smaller amounts of capital funding are sourced from the private sector including the revenue recognition of assets donated or transferred to the government free of charge.
NP funding for capital purposes will be $154.9 million in 2014–15, an increase of 125.1 per cent from 2013–14. This increase largely reflects new funding for South Road upgrades including the Torrens to Torrens and Darlington projects.
Over the forward estimates, NP funding for capital purposes increases in 2015–16 reflecting the timing of Commonwealth Government funding for the Goodwood/Torrens rail junction and also the profile of funding for South Road projects.
National SPP funding for capital purposes will be $91.6 million in 2014–15, a decrease of 11.6 per cent from the $103.6 million estimated for 2013–14. This decrease mainly reflects that Students First funding for government schools is now classified as current grant revenue. In 2013–14 a proportion of government schools funding was classified as a capital grant.
On-passed national SPP funding for capital purposes ceases in 2014–15 reflecting that all funding for non-government schools provided under the Students First program is classified as current grant revenue.
Other Commonwealth Government grants take the form of revenue that is provided directly to an agency from the Commonwealth Government. In 2013–14, other Commonwealth Government grants include funding for several small projects, with the largest component being funding for rural and remote roads under the Commonwealth Government’s Roads to Recovery program.
Sales of goods and services
Sales of goods and services by the general government sector include government fees and charges that are adjusted annually based on the average increase in the cost of services. Most government fees and charges will be increased by 2.7 per cent from 1 July 2014.
Table 3.16: Sales of goods and services ($million)
2013–14 2013–14 Estimated 2014–15 2015–16 2016–17 2017–18 Budget Result Budget Estimate Estimate Estimate
Regulatory fees 477.9 486.1 524.9 588.5 622.9 649.7 Health unit fees 301.0 345.5 370.9 380.6 395.4 405.7 Commonwealth contributions 393.0 475.0 476.1 456.1 459.8 463.2 TAFE fees 87.0 91.1 88.6 92.4 96.5 99.4 Schools revenue 116.5 116.5 120.1 123.8 127.7 131.6 Metroticket sales 83.9 83.8 88.4 93.8 99.6 102.7 Drivers' licence fees 65.5 46.6 43.8 38.4 45.4 50.8 Other user charges 551.8 554.1 569.3 579.3 594.0 609.6 Total sales of goods and services 2 076.6 2 198.6 2 282.1 2 352.8 2 441.4 2 512.8
Note: Totals may not add due to rounding.
Chapter 3: Revenue
2014–15 Budget Statement 61
Revenue from sales of goods and services in 2013–14 is expected to be $122 million higher than estimated at the time of the 2013–14 Budget, mainly due to upward revisions to Commonwealth Government contributions and the reclassification of some health unit fees from other revenue.
Commonwealth Government contributions have been revised up by $82 million in 2013–14 compared to the original budget for various reasons, including for a range of environmental programs as well increased revenue relating to the Pharmaceutical Benefits Scheme.
Revenue from Commonwealth Government contributions is projected to fall slightly over the forward estimates as some projects are completed.
The expected improvement in the property market conditions along with the annual indexation of most government fees and charges contributes to the growth in regulatory fees across the forward estimates.
Drivers’ licence fees are lower than expected in 2013–14 reflecting a change in the preference of people renewing their licence for one year rather than 10 years. The pattern for drivers’ licence fee revenue across the forward estimates reflects the expected renewal cycle for these licences.
Interest income
Interest income is estimated using projections of interest rates applicable to financial assets. The 2013–14 estimated result has been reduced by $69 million mainly reflecting the impact of netting off the Treasurer’s funds held on deposit with the South Australian Government Financing Authority (SAFA) against Treasurer’s borrowings. This set-off, pursuant to an agreement between the Treasurer and SAFA better reflects the true borrowing position, and thus borrowing cost.
Interest income is projected to increase from 2014–15 to 2017–18 as a result of expected increases in total deposits.
Chapter 3: Revenue
62 2014–15 Budget Statement

Dividend and income tax equivalent income
Dividend and income tax equivalent (ITE) revenue is received from public non-financial corporations (PNFCs) and public financial corporations (PFCs).
Table 3.17: Dividend and income tax equivalent income ($million)
2013–14 2013–14 Estimated 2014–15 2015–16 2016–17 2017–18 Budget Result Budget Estimate Estimate Estimate
Dividend and ITE income from PNFCs 282.4 296.9 219.1 271.4 233.8 244.3 Dividend and ITE income from PFCs 44.8 76.4 35.7 25.7 25.6 25.9 Other dividend income 1.2 1.2 1.2 1.2 1.2 1.2 Total dividend and ITE revenue 328.4 374.5 256.0 298.3 260.5 271.4
Dividend and ITE from PNFCs comprise SA Water 270.1 291.5 195.7 263.0 228.1 227.8 Renewal SA 9.5 2.1 20.8 5.5 2.5 13.5 Other 2.8 3.3 2.6 3.0 3.1 3.1 Total 282.4 296.9 219.1 271.4 233.8 244.3
Dividend and ITE from PFCs comprise HomeStart Finance 11.8 11.3 12.7 12.7 12.6 12.9 SAFA 33.0 65.1 23.0 13.0 13.0 13.0 Total 44.8 76.4 35.7 25.7 25.6 25.9
Note: Totals may not add due to rounding.
In 2013–14, total dividend and ITE revenue is expected to be $46.1 million higher than the original budget estimate mainly due to upward revisions to distributions from SA Water and SAFA.
Distributions from SA Water have been revised up in 2013–14 mainly due lower than expected depreciation expenditure.
SA Water’s distribution is expected to decrease in 2014–15 due to additional interest and guarantee fee expense following SA Water’s $2.7 billion increase in debt. Distributions are higher in 2015–16, primarily due to the recognition of revenue following the completion of a significant project with Rex Minerals in the Yorke Peninsula, and the cumulative effect of the operating expenditure efficiency targets for 2013–14 to 2015–16 imposed by the Essential Services Commission of South Australia (ESCOSA) in its first revenue determination.
Renewal SA’s distributions have been revised down in 2013–14 mainly due to the deferral of the sale of a commercial property. Distributions from Renewal SA in 2014–15 are impacted by the sale of 150 hectares of land at Gillman. Renewal SA’s distributions fluctuate across the forward estimates reflecting the forecast timing of commercial property sales.
SAFA’s 2013–14 distributions are estimated to be $32.1 million higher than budgeted primarily due to the payment of higher income tax equivalents from better than estimated operating results in 2012–13 and 2013–14 and a special dividend from Playford Capital Pty Ltd.
SAFA’s distribution is also expected to be higher in 2013–14 as it includes a special dividend of $20 million from the return of excess capital in SAFA’s fleet business.
Distributions from PFCs are expected to remain relatively flat over the forward estimates period.
Chapter 3: Revenue
2014–15 Budget Statement 63

Other revenue
Table 3.18: Other revenue ($million)
2013–14 2013–14 Estimated 2014–15 2015–16 2016–17 2017–18 Budget Result Budget Estimate Estimate Estimate
Royalties 276.8 295.2 323.1 330.3 329.6 341.2 Fines and penalties 125.8 113.1 130.5 136.8 139.5 143.6 Schools revenue 33.5 33.5 34.5 35.6 36.7 37.8 Other 232.9 230.8 216.1 210.4 205.2 209.2 Total other revenue 669.0 672.6 704.1 713.0 711.0 731.8
Note: Totals may not add due to rounding.
Total other revenue is expected to be broadly in line with 2013–14 Budget estimates, with an upward revision to royalty revenue partially offset by lower than expected revenue from fines and penalties.
Royalty revenue in 2013–14 is expected to be $18.4 million higher than the original budget mainly due to increased sales of crude oil with additional oil fields commencing production during the year. Royalty revenue is expected to grow moderately over the forward estimates, with the end of some new mine concessional royalty rates, the commencement of new mines and higher extractive royalty rates from 1 July 2014.
Fines and penalties revenue in 2013–14 is expected to be $12.7 million lower reflecting delays in the installation of fixed and average speed safety cameras. Revenue is expected to increase in 2014–15, as the new cameras become operational.
School revenue includes fundraising, canteen revenue, excursion fees, out of school-hours care fees and Commonwealth Government grants paid directly to schools.
Other revenue in 2013–14 is broadly in line with estimates in the 2013–14 Budget. Other revenue is projected to fall in 2014–15 largely reflecting the once-off $20 million variation payment made by the Adelaide Casino in 2013–14 on the unconditional operation of the variations to the Approved Licencing Agreement and the Casino Duty Agreement.
Chapter 3: Revenue
64 2014–15 Budget Statement

Annual fee and rate setting
Fees and charges
Table 3.19 sets out the increase in fees and charges in 2014–15 for major government services. These increases take effect from 1 July 2014.
Table 3.19: 2014–15 increase in selected agency fees and charges
2013–14
$ 2014–15
$ Increase
% Public transport
Single trip tickets — all times and zones 5.00 5.10 2.0 MetroCard single fare ― all times and zones 3.29 3.39 3.0 Regular 28 Day pass 114.00 117.00 2.6
Motor vehicle charges Registration fee — motor vehicles:
Four cylinders or less 112.00 115.00 2.7 Five or six cylinders 231.00 237.00 2.6 Seven or more cylinders 334.00 343.00 2.7
Registration fee — light commercial vehicles: Mass between 1001 kg and 1500 kg 248.00 255.00 2.8 Mass greater than 1500 kg 425.00 436.00 2.6
Drivers’ licence renewals Five years 195.00 200.00 2.6 Ten years 390.00 400.00 2.6
Speeding fines Exceeding the speed limit by:
Less than 10 km/h 155.00 159.00 2.6 By 10 km/h but less than 20 km/h 340.00 349.00 2.6 By 20 km/h but less than 30 km/h 690.00 709.00 2.8 By 30 km/h but less than 45 km/h 824.00 846.00 2.7 By 45 km/h and above 927.00 952.00 2.7
Water — residential Average residential bill(a) 772.10 793.60 2.8 Annual water service availability (supply) charge 274.80 282.80 2.9 Water usage charge per kilolitre supplied:
Up to and including 120 kilolitres per year 2.26 2.32 2.7 In excess of 120 kilolitres but less than 520 kilolitres per year 3.23 3.32 2.8 In excess of 520 kilolitres per year 3.49 3.59 2.9
Motor vehicle charges(b) Compulsory third party premium — passenger vehicles:
Standard premium 408.00 370.00 -9.3 Input tax credit entitled premium 420.00 381.00 -9.3
Lifetime Support Scheme Levy — passenger vehicles n.a. 106.00 n.a.
(a) The average metropolitan household uses about 190 kilolitres of water per year.
(b) For metropolitan postcodes.
The annual indexation factor for fees and charges has been set at 2.7 per cent for 2014–15 reflecting the average increase in the cost of providing the relevant services. Fees and charges are typically adjusted by the indexation factor and then rounded to an administratively convenient amount. This results in the increase of some fees and charges being smaller or greater than the indexation factor.
Chapter 3: Revenue
2014–15 Budget Statement 65
Not all fees and charges are increased through the annual adjustment process. Adjustments to certain fees and charges are determined as a consequence of specific policy decisions.
Water prices for 2014–15 have been prepared on a consistent basis with ESCOSA’s Final Revenue Determination of SA Water’s water and sewerage retail services for three years from 1 July 2013 to 30 June 2016. The government has announced that for SA Water customers drinking water charges will increase by 2.9 per cent on average in 2014–15, metropolitan sewerage charges will rise on average by 2.9 per cent and country sewerage charges will rise on average by 3.4 per cent.
The government introduced reforms to the CTP scheme from 1 July 2014 to improve the affordability of the scheme while at the same time providing better care and support for those who suffer serious injuries in vehicle accidents which require lifetime treatment, care and support.
CTP insurance premiums will decline by 9.3 per cent in 2014–15, including a reduction of around $38 for those who registered or renewed a passenger vehicle in the metropolitan area (Class 1 registration) for a 12 month period. CTP premiums will fall in 2014–15 as some of the cover previously provided under the CTP scheme will move to the new Lifetime Support Scheme (LSS) that will commence from 1 July 2014.
A new LSS levy will commence in 2014–15 to fund the LSS. The reforms are saving the average motorist $140 over two years on their registration.
Developments in Commonwealth-state relations
Impact of 2014–15 Commonwealth Government Budget on South Australia
The 2014–15 Commonwealth Government Budget delivered on 13 May 2014 makes significant downward revisions to Commonwealth Government payments to the states. This is a major threat to the federation as the Commonwealth Government is effectively placing more expenditure responsibilities on the states without providing them with adequate revenue to fund them. In summary, Commonwealth Government cuts to state funding will have significant adverse financial impacts for South Australia.
Figure 3.1 illustrates the relative decline in Commonwealth Government payments to the states since the introduction of the GST.
Chapter 3: Revenue
66 2014–15 Budget Statement

Figure 3.1: Total Commonwealth Government grant funding to the states as a proportion of GDP
Total GST revenue grants as a proportion of gross domestic product (GDP) have declined since the introduction of the GST. If the 2017–18 projection of GST revenue grants as a proportion of GDP was consistent with the proportion in 2001–02, an additional $3 billion in GST revenue grants would be available to the states.
Non-GST Commonwealth Government grants to the states as a proportion of GDP have been volatile since 2001–02 due to economic stimulus and infrastructure funding. Nonetheless, if the 2017–18 projection of non-GST Commonwealth Government grants to the states as a proportion of GDP was consistent with the proportion in 2001–02, an additional $11 billion in funding would be available to the states.
In the 2014–15 Commonwealth Government Budget funding to South Australia for hospitals and schools has been cut by around $5.5 billion over the next decade.
Chapter 3: Revenue
2014–15 Budget Statement 67

Figure 3.2: Commonwealth Government funding cuts to hospitals and schools ($million)
2 000
2 500
3 000
3 500
4 000
4 50020
14–1
5
2015
–16
2016
–17
2017
–18
2018
–19
2019
–20
2020
–21
2021
–22
2022
–23
2023
–24
2024
–25
Original funding New funding
$5.5 billion loss over 10 years
The Commonwealth Government budget makes significant reductions to National Health Reform payments. Compared to the Commonwealth Government’s 2013–14 MYEFO, South Australia will receive $444 million less funding across the forward estimates from the Commonwealth Government reneging on the National Health Reform Agreement — including $217 million in 2017–18.
The changes result from the removal of the $16.4 billion National Health Reform guarantee and reduced annual growth in funding from 2017–18 to 4 per cent — that is significantly less than average growth in hospital costs of 8 per cent per annum.
The Commonwealth Government has also eliminated or reduced funding for a number of National Partnership agreements including agreements for improving public hospitals, financial assistance for long-stay patients and other health initiatives. The total reduction is $212 million over the forward estimates.
The impact of the new $7 Medicare co-payment on hospital emergency departments is also likely to place additional pressure on public hospital emergency departments.
The Commonwealth Government will maintain funding under the current National Education Reform Agreement until the end of the 2017 calendar year. After 2017, the Commonwealth Government will revert back to indexation at CPI plus enrolment growth.
All funding under the National Partnership Agreement on Certain Concessions for Pensioner Concession Card and Seniors Card Holders will cease from 2014–15 with an adverse budget impact of almost $30 million per annum. This National Partnership Agreement contributes to concessions for local government, energy, water and public transport.
The 2014–15 Commonwealth Budget ceased funding for the continuation of the Skills Reform National Partnership for vocational education and training programs from 2017–18. This will result in a loss of Commonwealth Government revenue in 2017–18 of around $38 million and a reduction in the level of training places available in South Australia.
In relation to infrastructure, the Commonwealth Government Budget provides a contribution for both the Torrens to Torrens and Darlington projects on the North–South Corridor.
Chapter 3: Revenue
68 2014–15 Budget Statement

Other measures in the Commonwealth Government Budget that will impact on South Australia include:
• the loss of additional local government road funding of $17.8 million per annum from 2014–15
• no indexation of Local Government Financial Assistance Grants for three years from 2014–15
• a reduction in Seamless National Economy reward payments from $12.2 million to $4.1 million in 2013–14.
National Commission of Audit
On 1 May 2014, the National Commission of Audit (the Commission) released its report on the scope for efficiency and productivity improvements across all areas of Commonwealth Government expenditure.
The report identified structural weaknesses in the Commonwealth Government’s budget position in future years as expenditure on programs is expected to increase faster than revenue receipts.
A number of the Commission’s recommendations, if implemented, would have significant impacts on funding arrangements to the states in the key areas of health, education and infrastructure investment.
The Commission was of the view that the “current operation of Australia’s Federation poses particular challenges to the delivery of good, responsible government” (The Report of the National Commission of Audit, Phase 1, Chapter 6, page 68).
The Commission made several recommendations including recommendations to reform current HFE arrangements, clarifying the roles and responsibilities of the different levels of government, addressing vertical fiscal imbalance and reform of the Intergovernmental Agreement on Federal Financial Relations.
Horizontal fiscal equalisation
In relation to HFE, the Commission has recommended moving to a model where there is minimal redistribution between the current donor states (New South Wales, Victoria and Western Australia) plus Queensland (which is currently a recipient state) and there is targeted distribution to the current recipient states.
This would be achieved by each state initially receiving a per capita distribution of the GST revenue pool with the Commonwealth Government providing ‘top-up’ payments (provided from its own revenue base) to the recipient states. This would effectively result in an increase to the equalisation pool.
The CGC would retain a role in determining the additional equalisation payments for the recipient states but it is not clear what process they would adopt to determine the annual quantum of payments.
This recommendation is the proposal put forward by the four large states in submissions to the recent GST Distribution Review.
The Government of South Australia does not support this proposal as it represents a move away from full fiscal equalisation and will produce a divided system for distributing GST revenue grants between the states. South Australia suffers relative fiscal disadvantage compared to the larger states due to a lack of mining resources, an older age population, the socioeconomic status of our population and the diseconomies of scale in service delivery faced by smaller states. The distribution arrangements proposed by the Commission is unlikely to allocate sufficient GST revenue grants to reflect these relative disadvantages.
Chapter 3: Revenue
2014–15 Budget Statement 69

Other federal financial relations issues
The Commission was of the view that duplication of service delivery needs to be reduced along with the development of clear roles and responsibilities. It has recommended that the definition of roles should be determined based on two key principles — subsidiarity and sovereignty.
The Commission noted the high level of vertical fiscal imbalance (VFI) in the Australian Federation and recommended that the degree of VFI be substantially reduced by the Commonwealth Government lowering personal income tax rates and allowing states to levy their own income tax surcharge. By reducing the degree of VFI, the Commission was of the view that there would be a beneficial impact on efficiency, effectiveness and accountability of governments as there would be a clear link between taxing and spending decisions.
The Commission also sees merit in re-examining the rate and base of the GST as part of broader taxation reform.
The Commission has recommended that immediate steps be taken to reduce the large number of Commonwealth-state agreements (e.g. National Partnerships and Project Agreements) in order to reduce red tape and excessive reporting requirements.
The Government of South Australia believes that all of the recommendations relating to the operation of the federation should be considered in the White Paper on the Reform of the Federation and taxation reform proposals should be considered in the White Paper on Taxation currently being prepared by the Commonwealth Government with input from the states and territories. There is further discussion below on the two White Papers.
Council of Australian Governments
In 2013–14, the Council of Australian Governments (COAG) met on two occasions with its main focus being on infrastructure, deregulation, improving outcomes for Indigenous Australians, the National Disability Insurance Scheme (NDIS), reform of taxation and the federation and industry investment and competitiveness.
Infrastructure
COAG recognised that investment in infrastructure that improves productivity is a priority for all governments. All governments signed a new National Partnership Agreement on Asset Recycling which will see the Commonwealth Government providing incentive payments to states and territories that privatise assets and reinvest the proceeds into new infrastructure. Incentive payments will not be available to states and territories that privatise assets and use the proceeds to retire debt.
Deregulation
Reducing red tape remains an ongoing priority for COAG, especially easing the burden on small business.
COAG agreed that jurisdictions will develop reforms to reduce regulation in the following business sectors: housing and commercial building, road freight, exporters, food and dairy manufacturing, fish processing, agriculture, tourism business licensing, cafes and restaurants, clothing retail, eco-lodge and marine tour operators and native title in mining, gas and exploration. COAG will consider reforms to these sectors at its next meeting.
COAG also agreed to remove duplicate reporting requirements in the higher education sector, noted progress on the one-stop-shop for environmental approvals and agreed to look closely at improving the performance of regulators and the benefits of consolidating regulatory functions.
Chapter 3: Revenue
70 2014–15 Budget Statement
Improving outcomes for Indigenous Australians
COAG agreed a new five-year target of Closing the Gap between Indigenous and non-Indigenous school attendance. Specifically, COAG agreed to develop the following strategies:
• to improve school attendance where attendance rates for Indigenous children are below 80 per cent
• agreed that each state and territory would monitor Indigenous attendance rates monthly where they are below 80 per cent
• agreed to undertake on-the-spot audits of school attendance information
• agreed to public reporting of school attendance information.
National Disability Insurance Scheme (NDIS)
Throughout 2013–14, COAG reviewed the progress of the NDIS trial sites in various states and territories with the aim of improving implementation strategies and ensuring that the scheme operates to deliver positive outcomes in a financially sustainable way.
All governments remained committed to the full scheme roll-out and COAG agreed to NDIS implementation being a standing item for all future meetings.
White Papers on the Reform of the Federation and Reform of Australia’s Tax System.
In 2013, the Commonwealth Government made an undertaking to develop a White Paper on the Reform of the Federation (Federation White Paper) and a White Paper on the Reform of Australia’s Tax System (Tax Reform White Paper).
For both White Papers, the Commonwealth Government has committed to work with the states and territories in considering reform options.
The objectives of the Federation White Paper include reducing duplication between different levels of government, achieving a more efficient and effective federation and making interaction with government simpler for citizens.
The White Paper will consider the current system of HFE in Australia and it is likely that the larger jurisdictions will argue for changes in this area that, if implemented, would potentially undermine the equity objectives of HFE.
The Government of South Australia will continue to argue for a comprehensive system of HFE that ensures all states and territories are in a position to deliver a consistent level of services to its citizens.
Issues papers will be prepared in the second half of 2014. A Green Paper will be released in the first half of 2015 and the final White Paper by the end of 2015.
The Tax Reform White Paper will examine the Australian tax system as a whole, and seek to improve tax settings to improve productivity, international competitiveness and growth. Revenue raising by all levels of government will be considered, so there will be links with the Federation White Paper.
The Tax Reform White Paper will not have a formal Terms of Reference and is being guided by several key themes. These include simplification, reducing compliance costs, enhancing productivity, improving incentives to work, improving incentives to save, examining the way governments consider changes to the tax system and ensuring sustainability of tax revenue across all levels of Australian government.
This White Paper is also due for completion by the end of 2015.
Chapter 3: Revenue
2014–15 Budget Statement 71
Industry, investment and competitiveness
COAG noted the ongoing collaboration between the Commonwealth Government, Victorian and South Australian governments and industry to establish and deliver support to affected workers and businesses associated with the automotive manufacturing industry. COAG also noted the increased funding from the Commonwealth Government to the $155 million Growth Fund to address impacts from the withdrawal of automotive manufacturing.
Chapter 3: Revenue
72 2014–15 Budget Statement

Chapter 4: Managing the state’s assets and liabilities
Overview
The government’s investment in infrastructure impacts on the state’s balance sheet, affecting both the asset base and the debt raised to finance the investment.
General government sector purchases of non-financial assets are estimated to be $1.2 billion in 2014–15 and $7.8 billion over the four years to 2017–18.
As a result, the value of land and other fixed assets in that sector, including the state’s transport, education and health infrastructure, increases from $38.2 billion in 2014 to $41.5 billion in 2018.
General government sector net debt is expected to be $6.9 billion at 30 June 2014, increasing to $7.1 billion in 2015–16, before reducing to $5.3 billion as at 30 June 2018.
The government has decided to restructure its balance sheet in 2014–15 by transferring debt to the public non-financial corporation (PNFC) sector (SA Water) from the general government sector. This transfer in debt will result in SA Water having a capital structure comparable to other government-owned water entities interstate.
There is no impact from this change on total non-financial public sector (NFPS) net debt, however general government sector net debt reduces by $2.7 billion. The general government sector fiscal target of a maximum net debt to revenue ratio of 50 per cent has also been reduced to 35 per cent consistent with this restructuring (see Chapter 1 for more detail).
Additionally, the government has decided to open the provision of Compulsory Third Party (CTP) vehicle insurance to the private sector in South Australia from 1 July 2016. As part of this initiative, the Motor Accident Commission (MAC) will end its role as the sole provider of CTP insurance in South Australia. This initiative is anticipated to allow MAC to pay $500 million in surplus net assets to the government by the end of 2016–17, therefore reducing the government’s net debt to revenue ratio by around 2.7 percentage points.
Over the forward estimates the ratio of net debt to revenue is expected to peak at 41.4 per cent as at 30 June 2016, largely as a result of the increase in net debt associated with the new Royal Adelaide Hospital. By 30 June 2018 the ratio of net debt to revenue is expected to fall to 28.2 per cent.
Operating surpluses and moderation in the level of investment spending act to reduce debt in 2016–17 and 2017–18.
NFPS net debt reflects the combined debt of the general government and the PNFC sectors.
NFPS net debt is expected to increase from an estimated $10.9 billion at 30 June 2014 to $14.3 billion at 30 June 2016 before improving in 2017–18 ($12.5 billion). These movements are primarily as a result of the movements in general government sector net debt.
2014–15 Budget Statement 73

As at 30 June 2014, the state’s unfunded superannuation liability is estimated to be $10.5 billion. This is $242 million higher than the estimate at the time of the 2013–14 Mid-Year Budget Review (MYBR), but $1.3 billion lower than the estimate published in the 2013–14 Budget. This volatility is primarily the result of changes in the discount rate used to value the liability.
General government sector financial position
Table 4.1 summarises key balance sheet indicators for the general government sector.
Table 4.1: Key balance sheet indicators — general government sector
2014 2013 Estimated 2015 2016 2017 2018
As at 30 June Actual Result Estimate Estimate Estimate Estimate Net debt $m 5 227 6 887 4 511 7 146 5 839 5 269 % of total revenue 34.1 45.1 28.1 41.4 32.3 28.2
Net financial liabilities $m 19 079 20 456 18 121 20 687 19 346 18 707 % of total revenue 124.4 134.1 112.8 119.9 106.9 100.3
Net financial worth $m 1 742 986 958 -1 205 128 1 332 % of total revenue 11.4 6.5 6.0 -7.0 0.7 7.1
Net worth $m 39 363 39 208 39 124 40 003 41 343 42 856 % of total revenue 256.7 257.0 243.5 231.8 228.5 229.7
Net debt
General government sector net debt is expected to reduce from $6.9 billion at 30 June 2014 to $5.3 billion at 30 June 2018.
The government’s public private partnership arrangements are generally recognised as finance leases on the balance sheet and consequently have an impact on net debt and net financial liabilities.
In the 2014–15 Budget the government has determined to adjust the level of debt held by SA Water (in the PNFC sector) as the structure of SA Water’s balance sheet was not consistent with that of other government-owned water utilities interstate. At June 2013 SA Water had a debt to assets ratio of around 27 per cent, substantially less than other jurisdictions’ water utilities. A $2.7 billion adjustment to the gearing level of SA Water results in a debt to assets ratio of around 45 per cent and a capital structure comparable to its interstate peers as shown in table 4.2.
Table 4.2 Comparison of selected interstate government-owned water utilities
Water Utility State Debt to assets ratio 2013 (%) Melbourne Water Victoria 58% Unitywater Queensland 47% Yarra Valley Water Victoria 45% SA Water (adjusted) South Australia 45% Sydney Water Corporation New South Wales 42% Hunter Valley Corporation New South Wales 37% Water Corporation (Perth) Western Australia 33% SA Water South Australia 27% Barwon Water Victoria 24%
Chapter 4: Managing the state's assets and liabilities
74 2014–15 Budget Statement

This balance sheet restructure will have the effect of reducing the level of distributions payable to government. The impact will be an expected reduction in 2014–15 distributions of $139 million per annum ($95.8 million dividends and $43.2 million tax equivalent payments), but will also decrease general government interest payments by $117 million and increase guarantee fee revenue received by the government by $27 million. This change will have no impact on the pricing to water consumers.
Although this adjustment has no effect on total NFPS debt it will reduce recorded levels of net debt in the general government sector, and thus, the general government net debt to revenue ratio. Prior to the above transaction, the general government net debt to revenue ratio at 30 June 2015 was estimated to be 44.6 per cent, reflecting an increase of 0.5 percentage points since the 2013–14 Budget estimate of 44.1 per cent. Net debt as a percentage of revenue was expected to increase to 42.6 per cent by 30 June 2018, down from a peak of 56.7 per cent at 30 June 2016.
As a result of this debt restructure, the net debt to revenue ratio at 30 June 2015 is now estimated to be 28.1 per cent. The estimated increase in net debt in 2015–16 incorporates the recognition of the financial obligations for the new Royal Adelaide Hospital on the state’s balance sheet, which increases net debt by $2.8 billion. The impact of net operating surpluses from 2015–16 onwards and moderation in the level of investment spending, results in reductions in net debt in 2016–17 and 2017–18.
Table 4.3: Impact of SA Water gearing on general government net debt and net debt to revenue ratio
2013–14 Estimated 2014–15 2015–16 2016–17 2017–18 Result Budget Estimate Estimate Estimate
Prior to SA Water gearing adjustment: Net debt ($m) 6 887 7 216 9 856 8 554 7 989 Net debt/revenue (%) 45.1 44.6 56.7 47.0 42.6
Adjustment to general government net debt ($m)
— 2 705 2 710 2 715 2 720
After SA Water gearing adjustment: Net debt ($m) 6 887 4 511 7 146 5 839 5 269 Net debt/revenue (%) 45.1 28.1 41.4 32.3 28.2
Additionally, the government has decided to open the provision of CTP insurance to the private sector in South Australia from 1 July 2016, as already occurs in New Zealand, New South Wales and Queensland. As part of this initiative, MAC will end its role as the sole provider of CTP insurance in South Australia and this will allow MAC to cease writing new CTP insurance policies and run off its claims against policies issued up to and including 30 June 2016. This initiative is anticipated to allow MAC to pay $500 million in surplus net assets to the government by the end of 2016–17, therefore reducing the government’s net debt to revenue ratio by around 2.7 percentage points.
As a percentage of our economy, general government sector net debt remains relatively modest, at 4.4 per cent of Gross State Product (GSP) as at 30 June 2015, rising to 6.6 per cent at 30 June 2016 before falling back to 4.4 per cent in 2017–18.
Unfunded superannuation liability
All public sector employees are covered by some form of superannuation scheme. These schemes include member contributory schemes designed to provide employees with pension or defined lump sum benefits upon retirement.
The provision by the government of defined benefit superannuation schemes for its employees creates a liability for the government to pay future benefits to scheme members in accordance with the terms of the schemes. The main defined benefit schemes were closed to new members in 1994.
Chapter 4: Managing the state's assets and liabilities
2014–15 Budget Statement 75

The state’s unfunded superannuation liability makes up the largest component of net financial liabilities, and is estimated to be $10.5 billion as at 30 June 2014 reducing to $9.8 billion in 2018.
The projected unfunded superannuation liability has decreased since the 2013–14 Budget but increased since the 2013–14 MYBR.
As at 30 June 2014, the unfunded superannuation liability is estimated to be $1.3 billion lower than estimated in the 2013–14 Budget. This decrease is due to the impact of the higher discount rate used to value the liability, together with higher than expected earnings on superannuation assets since the 2013–14 Budget.
Table 4.4 summarises the change in the unfunded superannuation liability since the 2013–14 Budget.
Table 4.4: Unfunded superannuation liability ($million)
As at 30 June 2014 2015 2016 2017 2018
Estimate as at 2013–14 Budget 11 802 11 635 11 438 11 210 10 949
Impact of revised discount rate assumptions used to value superannuation liabilities at the 2013–14 MYBR compared with 2013–14 Budget assumptions(a)
-1 570 -1 525 -1 475 -1 422 -1 365
Impact of lower than expected returns on superannuation assets in 2012–13 as at 2013–14 MYBR compared with 2013–14 Budget assumptions(b)
158 158 158 157 156
Impact of higher than expected returns on superannuation assets in 2013–14 as at 2013–14 MYBR compared with 2013–14 Budget assumptions(c)
-304 -304 -302 -300 -297
Other 178 168 158 147 137
Estimate as at 2013–14 MYBR 10 264 10 133 9 976 9 792 9 580
Impact of revised discount rate assumptions used to value superannuation liabilities at the 2014–15 Budget compared with 2013–14 MYBR(d)
410 397 382 366 350
Impact of expected higher returns on superannuation assets in 2013–14 compared with 2013–14 MYBR assumptions(e)
-101 -107 -112 -119 -125
Impact of updated member data - 68 - 63 - 57 - 50 - 42
Estimate as at 2014–15 Budget 10 506 10 360 10 189 9 990 9 762
Note: Totals may not add due to rounding.
(a) The discount rate at the time of the 2013–14 MYBR was 4.5 per cent compared with 3.7 per cent assumed in the 2013–14 Budget.
(b) The actual earnings rate for 2012–13 was 16.5 per cent compared with 19.6 per cent assumed at the time of the 2013–14 Budget.
(c) The assumed earnings rate for 2013–14 at the time of the 2013–14 MYBR was 12.3 per cent compared with 7.0 per cent assumed in the 2013–14 Budget.
(d) The discount rate at the time of the 2014–15 Budget is 4.3 per cent compared with 4.5 per cent assumed in the 2013–14 MYBR.
(e) The assumed earnings rate for 2013–14 is 14.1 per cent for the 2014–15 Budget compared with 12.3 per cent assumed in the 2013–14 MYBR.
Earnings
The estimate of the unfunded superannuation liability as at 30 June 2014 reflects an estimated Funds SA earnings rate of 14.1 per cent for 2013–14. This is more than the long-term assumed earnings rate of 7.0 per cent and the assumed earnings for 2013–14 in the 2013–14 MYBR of 12.3 per cent.
Chapter 4: Managing the state's assets and liabilities
76 2014–15 Budget Statement
Discount rate
The unfunded superannuation liability is estimated at a point in time by discounting future superannuation benefit payments. The discount rate reflects the risk-free interest rate and is set on the basis of the Commonwealth Government nominal bond rate that reflects the average maturity of the liability.
A discount rate of 4.3 per cent (effective annual rate) has been used for the 2014–15 Budget, compared with 3.7 per cent used for the 2013–14 Budget and 4.5 per cent for the 2013–14 MYBR.
The discount rate changes in response to the economy and financial market conditions. Small changes in the long-term bond rate have a material impact on the reported liability, with a 1.0 percentage point reduction in the bond rate increasing the liability by approximately $2.3 billion.
The Commonwealth Government, and some other state governments, use a 6.0 per cent discount rate on the grounds that it is a long-term average, and that using a constant rate allows comparisons from budget to budget. This is not consistent with accounting standards.
Prior to the adoption of the Commonwealth Government bond rate, in anticipation of the new accounting standard in the 2003–04 MYBR, a rate of 7.5 per cent was used.
Table 4.5 sets out the impact different discount rates have on the unfunded superannuation liability.
Table 4.5: Sensitivity of unfunded superannuation liability to discount rates ($million)
2013–14 Discount Estimated 2014–15 2015–16 2016–17 2017–18 Rate Result Budget Estimate Estimate Estimate 4.3 10 506 10 360 10 189 9 990 9 762 6.0 7 505 7 453 7 382 7 291 7 178 7.5 5 558 5 555 5 540 5 511 5 465
The unfunded superannuation liability is a long-term liability. While financial market volatility in the recent past has resulted in multi-billion dollar revisions to the value of the liability recorded on the balance sheet, there has been no material change in the actual expected payments to beneficiaries underlying the liability.
Funding the liability
A program began in 1994–95 to fully fund all employer superannuation liabilities, with the aim to have the defined benefit schemes fully funded by 2034. The government remains committed to achieving this target.
Table 4.6 shows estimated cash contributions towards the state’s unfunded superannuation liability to achieve that commitment.
Table 4.6: Estimates of past service superannuation liability cash payments ($million)
2013–14 2014–15 2015–16 2016–17 2017–18 422 417 433 451 469
Table 4.5 shows the unfunded superannuation liability is projected to decline across the forward estimates period. This is partly because the annual increase of the defined benefit obligation, as a result of benefits being one year closer, is more than offset by the annual cash payments made as part of the government’s target to fully fund all superannuation liabilities by 2034.
Chapter 4: Managing the state's assets and liabilities
2014–15 Budget Statement 77

The relative stability across the forward estimates also reflects an assumed return to the expected long-term earnings rate of 7.0 per cent.
Figure 4.1 shows the reduction in the unfunded superannuation liability together with the increase in superannuation assets over the next 20 years.
Figure 4.1: Unfunded superannuation liability and assets ($million)
0
2,000
4,000
6,000
8,000
10,000
12,000
2014
2015
2016
2017
2018
2019
2020
2021
2022
2023
2024
2025
2026
2027
2028
2029
2030
2031
2032
2033
2034
Unfunded superannuation liability Superannuation assets
As required by the Superannuation Act 1988, a triennial review of the South Australian Superannuation Scheme was undertaken by an independent actuary at 30 June 2013. Details of this review are in the process of being finalised.
Net financial liabilities
Net financial liabilities are forecast to fall from $20.5 billion as at 30 June 2014 to $18.7 billion as at 30 June 2018, due mainly to the reductions in net debt.
As previously mentioned, the unfunded superannuation liability is the largest single component of net financial liabilities.
Other employee benefits, including long service leave, are estimated to be $2.5 billion as at 30 June 2014 and are forecast to increase to $2.9 billion as at 30 June 2018. This is a result of general increases in remuneration levels and accruing entitlements for long service leave.
It is projected that the remaining components of net financial liabilities will remain relatively stable from 30 June 2014 to 30 June 2018.
Net financial worth
Net financial worth is a broader measure than net financial liabilities as it incorporates equity interests in PNFCs and public financial corporations (PFCs). General government net financial worth is expected to decrease from $986 million as at 30 June 2014 to negative $1.2 billion as at
Chapter 4: Managing the state's assets and liabilities
78 2014–15 Budget Statement
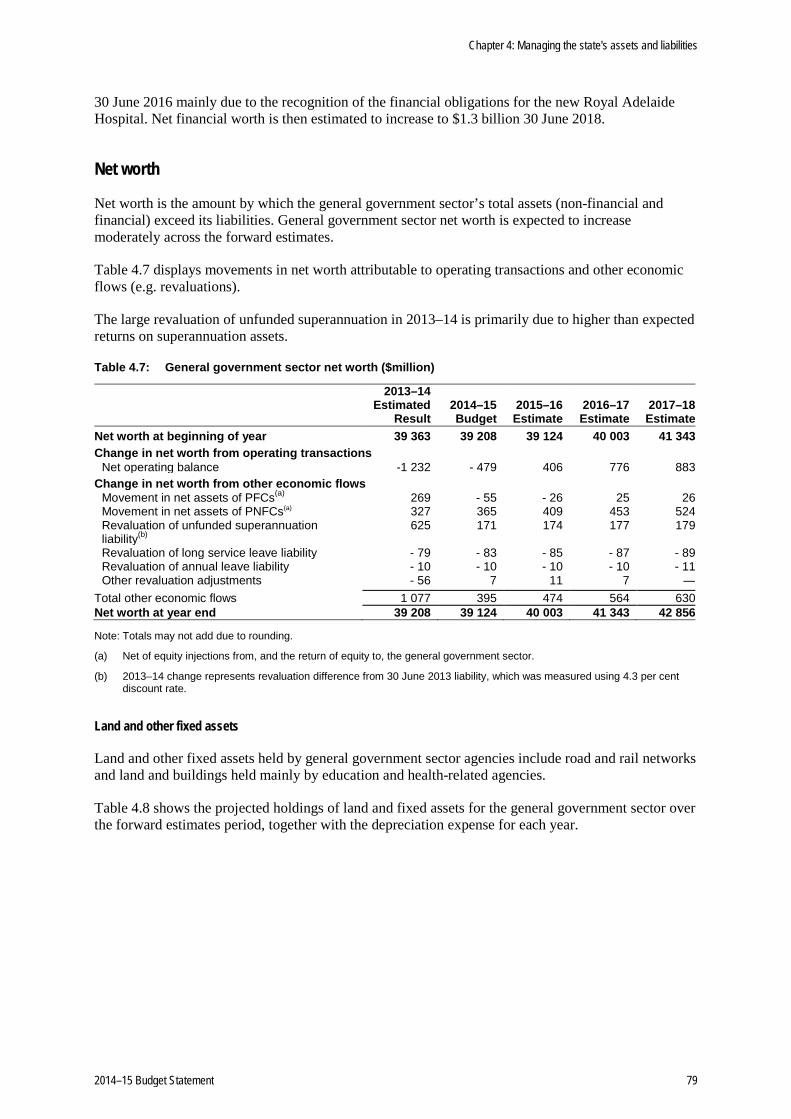
30 June 2016 mainly due to the recognition of the financial obligations for the new Royal Adelaide Hospital. Net financial worth is then estimated to increase to $1.3 billion 30 June 2018.
Net worth
Net worth is the amount by which the general government sector’s total assets (non-financial and financial) exceed its liabilities. General government sector net worth is expected to increase moderately across the forward estimates.
Table 4.7 displays movements in net worth attributable to operating transactions and other economic flows (e.g. revaluations).
The large revaluation of unfunded superannuation in 2013–14 is primarily due to higher than expected returns on superannuation assets.
Table 4.7: General government sector net worth ($million)
2013–14 Estimated
Result 2014–15 Budget
2015–16 Estimate
2016–17 Estimate
2017–18 Estimate
Net worth at beginning of year 39 363 39 208 39 124 40 003 41 343
Change in net worth from operating transactions Net operating balance -1 232 - 479 406 776 883
Change in net worth from other economic flows Movement in net assets of PFCs(a) 269 - 55 - 26 25 26 Movement in net assets of PNFCs(a) 327 365 409 453 524 Revaluation of unfunded superannuation liability(b)
625 171 174 177 179
Revaluation of long service leave liability - 79 - 83 - 85 - 87 - 89 Revaluation of annual leave liability - 10 - 10 - 10 - 10 - 11 Other revaluation adjustments - 56 7 11 7 —
Total other economic flows 1 077 395 474 564 630 Net worth at year end 39 208 39 124 40 003 41 343 42 856
Note: Totals may not add due to rounding.
(a) Net of equity injections from, and the return of equity to, the general government sector.
(b) 2013–14 change represents revaluation difference from 30 June 2013 liability, which was measured using 4.3 per cent discount rate.
Land and other fixed assets
Land and other fixed assets held by general government sector agencies include road and rail networks and land and buildings held mainly by education and health-related agencies.
Table 4.8 shows the projected holdings of land and fixed assets for the general government sector over the forward estimates period, together with the depreciation expense for each year.
Chapter 4: Managing the state's assets and liabilities
2014–15 Budget Statement 79

Table 4.8: Land and other fixed assets — general government sector ($million)
2014 2013 Estimated 2015 2016 2017 2018 As at 30 June Actual Result Estimate Estimate Estimate Estimate
Inventories 72 72 72 72 72 73 Land 5 867 6 615 6 565 6 503 6 411 6 410 Buildings and improvements 8 689 8 932 8 668 11 060 10 725 10 400 Water, sewerage and drainage assets 160 162 177 175 171 168 Road networks 16 391 15 991 16 353 16 757 17 268 17 960 Rail and bus networks 1 206 1 436 1 478 1 510 1 554 1 578 Other infrastructure assets 4 116 3 891 3 730 4 007 3 890 3 809 Heritage assets 1 114 1 115 1 116 1 117 1 117 1 118 Self-generating and regenerating assets 2 2 2 2 2 2 Total land and other fixed assets (net of provisions for depreciation)
37 616 38 217 38 160 41 203 41 210 41 518
Depreciation expense 762 864 927 990 1 065 1 084
Note: Totals may not add due to rounding.
The total value of land and fixed assets held in the general government sector is expected to grow from $38.2 billion as at 30 June 2014 to $41.5 billion as at 30 June 2018. This increase reflects significant ongoing investment in the state’s infrastructure, particularly in health and transport network assets.
The decline in the value of land assets from 30 June 2014 to 30 June 2018 largely reflects the sale of land at Strathmont and Magill, as well as disposal of surplus land associated with the South Road Superway, Northern Expressway and Aldinga Land Corridor projects.
The general government sector will acquire $1.2 billion of non-financial assets in 2014–15, mainly in the areas of health, transport and education. Total general government sector capital investment is expected to be $7.8 billion from 2014–15 to 2017–18.
Strong levels of capital investment continue to increase the state’s infrastructure base, stimulate the economy in the short term and increase the state’s long-term capacity to grow.
Key general government sector balance sheet indicators — time series
Table 4.9 provides a time series of net debt, net financial liabilities, unfunded superannuation, net financial worth and net worth for the general government sector since 30 June 2003 and projected to 30 June 2018.
Significant volatility in the unfunded superannuation liability is evident between 2003 and 2013, reflecting the short-term variability resulting from some key valuation assumptions, in particular the discount rate and actual investment earnings. These factors are largely outside of government control. The state government’s concern is to ensure that the impact of its budget policy is in accord with its medium-term fiscal objectives. It therefore focuses on managing debt and other financial liabilities whilst maintaining its longer-term commitment to fully fund the unfunded superannuation liability by 2034.
The rise in the ratio of net debt to revenue from 2009 to 2016 largely reflects the strong levels of capital investment to renew and increase the state’s infrastructure base, which includes the new Royal Adelaide Hospital in 2015–16.
Despite the significant fluctuation in reported liabilities, net worth is expected to grow over the forward estimates. This growth is primarily due to increases in the value of public non-financial corporation assets and the return to net operating surpluses from 2015–16.
Chapter 4: Managing the state's assets and liabilities
80 2014–15 Budget Statement

Table 4.9: General government sector balance sheet indicators — time series(a)
Net debt Net financial Unfunded(b) Net financial Net As at % of liabilities superannuation worth worth 30 June $m revenue $m $m $m $m 2003 666 7.1 6 974 4 445 3 500 15 288 2004 224 2.3 7 858 5 668 3 842 15 760 2005 144 1.4 9 393 7 227 3 853 16 359 2006 - 119 -1.1 8 171 6 146 5 846 19 703 2007 - 24 -0.2 7 254 5 075 8 110 22 128 2008 - 276 -2.1 8 078 6 468 7 580 23 741 2009 475 3.5 11 562 8 939 5 551 24 146 2010 1 402 9.0 13 182 9 478 6 551 36 231 2011 2 930 19.5 14 313 9 096 7 299 40 958 2012 4 165 26.2 20 332 13 523 1 413 37 199 2013 5 227 34.1 19 079 11 085 1 742 39 363 2014 6 887 45.1 20 456 10 506 986 39 208 2015 4 511 28.1 18 121 10 360 958 39 124 2016 7 146 41.4 20 687 10 189 -1 205 40 003 2017 5 839 32.3 19 346 9 990 128 41 343 2018 5 269 28.2 18 707 9 762 1 332 42 856
(a) For details of structural breaks impacting numbers, refer to footnotes in table B.2 in Appendix B.
(b) Prior to 2014 values are impacted by variations in discount rates. From 2014 discount rates are assumed to be unchanged.
Non-financial public sector financial position
While the general government sector is the focus of the budget, the financial position of the non-financial public sector is also important. The non-financial public sector comprises the general government sector and the PNFC sector.
Table 4.10 summarises key balance sheet indicators for the non-financial public sector.
Table 4.10: Key balance sheet indicators — non-financial public sector
2014 2013 Estimated 2015 2016 2017 2018 As at 30 June Actual Result Estimate Estimate Estimate Estimate Net debt $m 8 949 10 931 11 497 14 266 13 075 12 545 % of total revenue 54.3 66.9 66.4 77.2 67.5 62.9
Net financial liabilities $m 23 064 24 736 25 355 28 060 26 829 26 227 % of total revenue 139.8 151.5 146.4 151.9 138.6 131.5
Net financial worth $m -23 223 -24 627 -25 300 -28 031 -27 275 -26 647 % of total revenue -140.8 -150.8 -146.1 -151.8 -140.9 -133.6
Net worth $m 39 363 39 208 39 124 40 003 41 343 42 856 % of total revenue 238.6 240.1 225.9 216.6 213.6 214.8
NFPS net debt is projected to increase from $10.9 billion at 30 June 2014 to $12.5 billion at 30 June 2018.
Chapter 4: Managing the state's assets and liabilities
2014–15 Budget Statement 81

The estimated ratio of net debt to revenue for the NFPS is expected to increase from 66.9 per cent as at 30 June 2014 to 77.2 per cent at 30 June 2016 before reducing to 62.9 per cent by 30 June 2018. This is largely due to the impact of the new Royal Adelaide Hospital, offset by general government sector surpluses and tapering in the investment program.
The forecast negative net financial worth position of the NFPS contrasts with the positive net financial worth of the general government sector, reflecting:
• the exclusion of equity held by the general government sector in the PNFC sector, which is recognised as a financial asset in the general government sector but is eliminated in the consolidation of the NFPS
• the inclusion of the PNFC sector’s net debt.
Land and other fixed assets
Table 4.11 shows the projected holdings of land and other fixed assets for the NFPS in 2012–13 and across the forward estimates.
Table 4.11: Land and other fixed assets — non-financial public sector ($million)
2014 2013 Estimated 2015 2016 2017 2018
As at 30 June Actual Result Estimate Estimate Estimate Estimate
Inventories 560 621 668 666 640 631 Land 11 984 12 864 12 941 13 010 13 049 13 179 Buildings and improvements 13 400 13 723 13 501 15 933 15 637 15 365 Water, sewerage and drainage assets 13 081 13 470 13 905 14 303 14 734 15 150 Road networks 16 392 15 992 16 354 16 759 17 269 17 961 Rail and bus networks 1 206 1 436 1 478 1 510 1 554 1 578 Other infrastructure assets 4 749 4 511 4 358 4 634 4 509 4 413 Heritage assets 1 128 1 129 1 129 1 130 1 131 1 132 Self-generating and regenerating assets 74 74 74 74 74 74 Total land and other fixed assets (net of provisions for depreciation) 62 574 63 820 64 409 68 019 68 597 69 483 Depreciation expense 1 166 1 293 1 366 1 441 1 530 1 570
Note: Totals may not add due to rounding.
The total value of land and other fixed assets for the NFPS is projected to rise from $63.8 billion as at 30 June 2014 to $69.5 billion as at 30 June 2018, mainly due to investment and revaluations in health, transport and water-related infrastructure.
The higher level of non-financial assets in the NFPS compared with the general government sector reflects the inclusion of assets held by PNFCs. These include assets held by SA Water (water and wastewater infrastructure such as pipelines, water filtration plants and reservoirs) and the South Australian Housing Trust (SAHT).
NFPS infrastructure investment is expected to exceed depreciation in all years over the forward estimates. Depreciation expense reflects the consumption of an asset’s service potential. Depreciation totals $1.3 billion in 2013–14 and rises to $1.6 billion in 2017–18 as a result of the significant increase in the state’s asset base over the same period.
Figure 4.2 illustrates the government’s capital investment across the forward estimates.
Chapter 4: Managing the state's assets and liabilities
82 2014–15 Budget Statement

Figure 4.2: Non-financial public sector purchases of non-financial assets ($million)
0
500
1000
1500
2000
2500
3000
3500
4000
4500
5000
1999–00 2001–02 2003–04 2005–06 2007–08 2009–10 2011–12 2013–14 2015–16 2017–18
Purchases of non-financial assets Depreciation
Key non-financial public sector balance sheet indicators — time series
Table 4.12 provides a time series of net debt, net financial liabilities, unfunded superannuation, net financial worth and net worth for the NFPS since 30 June 2003 and projected to 30 June 2018.
Table 4.12: Non-financial public sector balance sheet indicators — time series(a)
Net debt Net financial Unfunded(b) Net financial Net As at % of liabilities superannuation worth worth 30 June $m revenue $m $m $m $m 2003 2 696 26.5 9 096 4 445 -8 811 15 288 2004 2 285 21.3 10 031 5 668 -9 550 15 760 2005 2 126 18.7 11 511 7 227 -11 004 16 359 2006 1 786 15.1 10 451 6 146 -9 889 19 703 2007 1 989 16.1 9 518 5 075 -8 795 22 128 2008 1 611 11.8 10 208 6 468 -10 487 23 741 2009 2 872 20.0 14 302 8 939 -14 921 24 146 2010 4 487 27.5 16 626 9 478 -16 997 36 231 2011 6 541 41.0 18 273 9 096 -18 402 40 958 2012 7 996 47.4 24 500 13 523 -25 123 37 199 2013 8 949 54.3 23 064 11 085 -23 223 39 363 2014 10 931 66.9 24 736 10 506 -24 627 39 208 2015 11 497 66.4 25 355 10 360 -25 300 39 124 2016 14 266 77.2 28 060 10 189 -28 031 40 003 2017 13 075 67.5 26 829 9 990 -27 275 41 343 2018 12 545 62.9 26 227 9 762 -26 647 42 856
(a) For details of structural breaks impacting numbers, refer to footnotes in table B.7 in Appendix B.
(b) Prior to 2014 values are impacted by variations in discount rates. From 2014 discount rates are assumed to be unchanged.
Chapter 4: Managing the state's assets and liabilities
2014–15 Budget Statement 83
As shown in table 4.12, net debt steadily decreased from 2003 to 2008 before significantly increasing, reflecting the net operating position and the government’s capital investment program. Net worth, however, has continued to improve and is now estimated to reach $42.9 billion as at 30 June 2018.
Management of assets and liabilities
Assets
Each agency establishes, implements and maintains its own asset management plan to ensure assets are deployed efficiently and effectively in the delivery of programs.
Debt management
The funding and management of the state’s debt is undertaken by the South Australian Government Financing Authority (SAFA).
The state’s funding requirements are achieved by SAFA through the issue of securities in the financial markets, including long-term Select Line fixed interest securities issued in Australia and through SAFA’s short-term issuance programs.
Throughout the 2013–14 financial year, SAFA has had strong access to markets and continues to hold adequate levels of liquidity to ensure the state can meet its obligations.
Term interest rates in major world bond markets, including the United States of America and Europe, have remained at historically low levels over the course of the current financial year. In addition, credit spreads have narrowed due to the improved global outlook.
SAFA’s term borrowing rates have benefitted from the reduction in credit spreads. For instance, the interest rate on SAFA’s August 2019 Select Line bond has decreased to 3.61 per cent as at 30 April 2014 from 4.16 per cent as at 30 June 2013. The interest rate on a corresponding Commonwealth Government bond has fallen from 3.30 per cent to 3.22 per cent in the same time period.
For general government debt, the government’s debt management objective is to minimise the long-term average interest cost subject to acceptable levels of interest rate risk.
Under the debt management framework, debt is managed within a duration range of 1.0 to 1.5 years. There is no discretion to have an interest rate position outside that range. Interest rate risks are also controlled by the use of value at risk limits. The debt management framework is reviewed regularly and such reviews take into account any significant changes in the state’s debt levels.
In addition to debt managed under this framework, the general government sector has Consumer Price Index (CPI) indexed and long-term housing agreement debt. This serves to increase the overall duration of general government sector debt.
The framework for managing the debt of PNFCs, such as SA Water, is determined by the individual corporations.
Chapter 4: Managing the state's assets and liabilities
84 2014–15 Budget Statement
Insurance arrangements
SAFA manages the government’s insurance and risk management arrangements through a separate insurance division using the trading name SAICORP.
The insurance function of SAFA is operated through three funds specifically established in the authority’s accounts to quarantine the insurance activities from SAFA’s finance activities.
Premiums received from agencies for insurance cover provided under the government’s insurance and risk management arrangements for incidents occurring from 1 July 1994 are credited to SAICORP Insurance Fund 1, which is used to:
• meet loss and claim payments above agreed levels of agency excesses
• provide a reserve to cover future losses and claims
• pay premiums for the government’s catastrophe reinsurance program and other insurances deemed necessary and appropriate in connection with the arrangements
• meet the cost of administering the insurance and risk management program
• pay service providers for advice and services as required in connection with the insurance and risk management program.
All government departments and statutory authorities are included in the arrangements, unless specifically exempted by the Treasurer.
Premium revenue earned by SAFA from client agencies for 2013–14 is estimated to be $39.2 million ($39.1 million for 2012–13). SAFA has a policy of accumulating reserves over time to meet the cost of retained risks. Funds not required to meet day-to-day operational costs or short-term claim costs are invested in the tax exempt multi-sector growth product of Funds SA.
At 30 June 2013, SAICORP Insurance Fund 1 had:
• total assets of $403.0 million
• total liabilities of $273.0 million, including outstanding claim liabilities of $272.7 million ― medical malpractice claims accounted for $200.9 million of the outstanding claim liabilities
• net assets (free reserves) of $130.0 million.
SAICORP operated within its target level of reserves throughout the year.
Two other funds are retained for other residual claims, with these being in a break even position, and indemnified by the Treasurer.
Chapter 4: Managing the state's assets and liabilities
2014–15 Budget Statement 85

Chapter 4: Managing the state's assets and liabilities
86 2014–15 Budget Statement
Chapter 5: Government businesses
Overview
This chapter outlines the major developments and performance of government businesses. ‘Government businesses’ is a broad term that captures both public non-financial corporations (government controlled entities that are engaged mainly in the production of marketable goods and/or services) and public financial corporations (government controlled entities engaged mainly in financial intermediation or other financial services).
A defining feature of government businesses is that a significant proportion of their operational costs are recovered through user charges.
Highlights 2014–15
• The public non-financial corporations (PNFC) sector will undertake a $658.3 million capital investment program in 2014–15. This includes SA Water’s investment expenditure of $390.0 million, South Australian Housing Trust’s (SAHT) investment expenditure of $171.7 million and the Adelaide Convention Centre’s investment expenditure of $47.6 million.
• PNFC sector net debt is budgeted to increase from $4.0 billion as at 30 June 2014 to $7.3 billion as at 30 June 2018 primarily due to a $2.7 billion adjustment to SA Water’s gearing from 2014–15.
Recent developments
The Lifetime Support Authority (LSA) is a new statutory authority established under the Motor Vehicle Accidents (Lifetime Support Scheme) Act 2013. The LSA is classified as a public financial corporation (PFC). The LSA was created following the reforms to the Compulsory Third Party (CTP) insurance scheme and will provide for the lifetime treatment, care and support of people severely injured in motor vehicle accidents in South Australia through the Lifetime Support Scheme from 1 July 2014.
In the 2014–15 Budget, the government has determined to adjust the gearing level of SA Water by requiring the corporation to borrow an additional $2.7 billion. This will have the effect of bringing SA Water into line with its interstate peers with a debt to assets ratio of around 45 per cent, and will reduce the level of distributions (income tax equivalent payments and dividends) payable to government. The change in gearing for SA Water will have no impact on the pricing to water customers as the actual level of debt held by SA Water does not influence ESCOSA’s pricing determination.
The government is currently consulting on draft legislation for a new scheme to replace the current WorkCover scheme, with a goal of better assisting injured workers to return to work and saving registered businesses in South Australia in the order of $180 million per year through targeting an average premium rate of 1.5 per cent to 2 per cent. It is anticipated that the new scheme will be operational by 1 July 2015.
The government has decided to open the provision of Compulsory Third Party (CTP) insurance to the private sector in South Australia from 1 July 2016. As part of this initiative, the Motor Accident Commission (MAC) will end its role as the sole provider of CTP insurance in South Australia and this will allow MAC to cease writing new CTP insurance policies and run off its claims against policies issued up to and including 30 June 2016.
2014–15 Budget Statement 87

Consequently, this will allow MAC to pay $500 million in 2016–17 from its surplus net assets into the Highways Fund to invest in improving the safety of roads in South Australia.
Financial arrangements and policy framework
Contributions (i.e. dividends and income tax equivalent payments) made by PNFCs and PFCs are recorded as part of the general government sector’s revenue. Some PNFCs also pay guarantee fees to the government, consistent with competitive neutrality principles. Grants, subsidies and payments for community service obligations made to PNFCs and PFCs are recorded as expenditures of the general government sector.
Competitive neutrality policy
All jurisdictions signed the Competition Principles Agreement, which covers a range of matters including competitive neutrality policy and principles (Competition Principles Agreement — 11 April 1995, as amended to 13 April 2007).
Among the requirements of the policy are that jurisdictions will impose government taxes or tax equivalent systems, debt guarantee fees and those regulations that private sector businesses are normally subject to on their government business enterprises.
All jurisdictions recommitted to the principles in the Competition Principles Agreement at the Council of Australian Governments (COAG) meeting on 10 February 2006, and signed the Competition and Infrastructure Reform Agreement. The objectives listed under the agreement in relation to competitive neutrality of government business enterprises are:
• that the enterprise has clear commercial objectives
• that any non-commercial objectives or obligations established for the enterprise are clearly specified and publicly reported
• that enterprises do not exercise regulatory or planning approval functions in circumstances in which they compete with private sector enterprises (Competition and Infrastructure Reform Agreement — COAG meeting 10 February 2006, Appendix E to Attachment B, National Competition Policy Review).
Heads of Treasuries monitor and report annually to COAG on the operation of the enhanced competitive neutrality principles in the Competition and Infrastructure Reform Agreement. States are required to complete a competitive neutrality matrix template and self-assess compliance against criteria that reflect obligations under the Competition Principles Agreement and the Competition and Infrastructure Reform Agreement.
As a signatory to the Competition Principles Agreement, the Government of South Australia must also report annually on the competitive neutrality status of all of its significant business activities. Information on the status of category 1 and 2 significant business activities is published by the Department of the Premier and Cabinet on its website <www.dpc.sa.gov.au>, based on information provided by agencies to the Department of Treasury and Finance.
The Commonwealth Government has commenced a comprehensive review of Australia's competition laws and policy. Given the considerable changes to the Australian economy since the last review was undertaken in the early 1990s, the Competition Policy Review will examine the competition framework and make recommendations on reforms to improve the Australian economy through promoting more competitive and productive markets. This will include a review of competitive neutrality policy and is expected to be completed by mid-2015.
Chapter 5: Government businesses
88 2014–15 Budget Statement

Guarantee fees
The liabilities of a government business are guaranteed by the government. As a result it is likely to receive cheaper finance than it would as a ‘stand-alone’ borrower that has its credit risk assessed independently of the government guarantee. It is government policy that the fee for the government guarantee on borrowings should be appropriately priced, to avoid a government business obtaining a competitive advantage over a private sector company. The guarantee fee represents a price for the funding cost advantage the government guarantee provides, as well as the cost advantages of centralised funding arrangements. The charging of a guarantee fee supports transparency and accountability by ensuring that a government business makes decisions that reflect true borrowing costs.
Governance framework
The PNFCs Ownership Framework Policy Guidelines outline the government’s policy framework for community service obligations, dividends and capital structure. The ownership framework has been implemented for SA Water and ForestrySA and elements of the framework have been applied to the Public Trustee. The development of an ownership framework for the Urban Renewal Authority, trading as Renewal SA, is progressing.
The Department of Treasury and Finance is introducing initiatives to improve the governance framework for government businesses. These include the commencement of Treasurer’s Instruction 7 allowing the Treasurer to appoint a representative to attend board meetings of PNFCs and PFCs.
Work has also progressed on the introduction of standardised reporting with the preparation of guidelines for charters, performance statements and financial reporting, including the pilot of a new quarterly reporting process for PNFCs.
Dividends and capital structure
The policy guidelines provide for the dividend requirements of the government as shareholder to be calculated with consideration of the capital structure targets for each PNFC.
The capital structure of a PNFC is determined by the capital intensity of its operations and the riskiness of its operating revenue and expenses. Other factors considered include the volatility of cash flows and the characteristics of the market in which the PNFC operates. Capital structures are set to ensure that each PNFC has sufficient operating and financial flexibility to allow for approved and unexpected capital expenditure and changes in business operating conditions.
Community service obligations
A community service obligation (CSO) arises when a government specifically requires a public enterprise to carry out activities relating to outputs or inputs that it would not elect to do on a commercial basis, and which the government does not require other businesses in the public or private sectors to generally undertake, or which it would only do commercially at higher prices (Steering Committee on National Performance Monitoring of Government Trading Enterprises 1994, Community Service Obligations: Some Definitional, Costing and Funding Issues).
Amongst other things, these policy guidelines provide that “CSO payments will be made for all non-commercial activities that PNFCs are required to undertake” and “CSO payments will be transparent and clearly reported”.
SA Water receives a number of CSO payments. This includes the largest CSO payment amongst the PNFCs for statewide uniform pricing with a smaller, but still significant, CSO paid in relation to exemptions and concessions.
Chapter 5: Government businesses
2014–15 Budget Statement 89

Grants and subsidies
Grants and subsidies are monies provided by a government department or agency to an entity in order to fund or to assist with the funding of a program or project. This includes Commonwealth Government grants and subsidies paid through the state government.
Operating performance
Table 5.1 provides an overview of the key budget aggregates for the PNFC sector.
Table 5.1: Public non-financial corporations sector budget aggregates ($million)
2013–14 2013–14 Estimated 2014–15 2015–16 2016–17 2017–18 Budget Result Budget Estimate Estimate Estimate
Net operating balance before dividends and income tax equivalents 45.5 72.5 12.2 91.1 85.3 146.8 less Dividends 197.7 208.0 151.0 188.9 162.0 172.7 less Income tax equivalents 84.7 88.9 68.1 82.5 71.7 71.6 equals Net operating balance - 236.9 - 224.5 - 206.9 - 180.3 - 148.5 - 97.5 less Net acquisition of non-financial assets Gross fixed capital formation(a) 482.1 434.7 464.7 431.2 460.6 451.7 less Depreciation 445.1 428.6 439.0 451.0 464.4 487.0 plus Change in inventories 42.2 61.3 46.9 - 2.8 - 25.9 - 9.6
equals Total net acquisition of non-financial assets 79.2 67.4 72.6 - 22.5 - 29.6 - 44.9
equals Net lending/borrowing(b) - 316.1 - 291.9 - 279.5 - 157.7 - 118.9 - 52.6
Note: Totals may not add due to rounding.
(a) Gross fixed capital formation comprises purchases of non-financial assets (including contributed assets) less sales of non-financial assets (including donated assets).
(b) A negative net lending result means that revenues are not sufficient to fund operating and investing expenditure, resulting in increased liabilities.
The 2013–14 estimated net operating balance before dividends and income tax equivalents for the PNFC sector of $72.5 million is a $27.0 million improvement from budget. This mainly reflects an improvement in SA Water’s net operating balance ($20.8 million) primarily due to lower depreciation expenditure, and an improvement in SAHT’s estimated net operating balance ($15.8 million), primarily due to delays in a number of grant funded projects. This is partially offset by a deterioration in Renewal SA’s net operating balance ($9.9 million) due to delays in sales.
The budgeted 2014–15 net operating balance before dividends and income tax equivalents of $12.2 million is a $60.3 million deterioration from 2013–14. This is mainly due to a deterioration in SA Water’s net operating balance ($99.5 million), due to additional interest and guarantee fee expenses following a $2.7 billion increase in debt, partially offset by increased revenue as a result of rates and sales revenue increasing by inflation, in line with ESCOSA’s Final Revenue Determination, and decreased operating costs associated with efficiency targets applied by ESCOSA and the government. The deterioration in SA Water’s net operating balance is partially offset by an improvement in Renewal SA’s net operating balance ($42.5 million) largely due to the sale of 150 hectares of land at Gillman.
The 2013–14 estimated net operating balance after dividends and income tax equivalents is -$224.5 million, an improvement of $12.4 million since budget. From 2013–14 to 2014–15, this is forecast to improve by $17.5 million and further improvements are forecast across the forward
Chapter 5: Government businesses
90 2014–15 Budget Statement

estimates. As a majority of the profits made by commercial PNFC entities are paid out as dividends and income tax equivalents, the negative net operating balance after dividends and income tax equivalents in all years is influenced heavily by the inclusion of SAHT, which is a non-commercial PNFC that does not fully recover the cost of services provided through its own revenue sources. This line is also impacted by forecast losses in Renewal SA in all years other than 2014–15.
Although the net operating balance after dividends and income tax equivalents is negative in all years over the forward estimates, overall there is a positive trend, primarily due to the timing of SAHT’s grant funded projects and an increase in the state grant to SAHT from 2017–18. This positive trend is also supported in 2014–15 by a forecast profit for Renewal SA, which is impacted significantly by the sale of 150 hectares of land at Gillman.
The revenue sources of a number of major government businesses, such as Renewal SA, are tied to the level of activity in the building and construction sector, particularly residential housing. Following low levels of activity in 2012–13, dwelling construction activity picked up significantly in South Australia, reflecting a similar trend nationally. Forward indicators of construction activity, including building and finance approvals, suggest moderate growth in the remainder of 2013–14 and into 2014–15. However, given the oversupply of residential and commercial land in South Australia, Renewal SA is forecasting delays in sales resulting in losses in all years other than 2014–15.
Gross fixed capital formation largely reflects SA Water’s capital program but also includes significant investment expenditure by the Adelaide Convention Centre (ACC) on the Riverbank Precinct Development and net capital expenditure by SAHT, and is reduced by sales of government housing assets and sales of commercial properties by Renewal SA. The 2013–14 estimated result is $434.7 million, $47.4 million lower than budget due to a reduction in SA Water’s estimated capital expenditure ($55.1 million) as a result of changes in timing of a number of projects, as well as the identification of savings for several projects and annual programs, and a reduction in SAHT’s net capital expenditure ($25.7 million) due to an increase in net sales proceeds and delayed capital expenditure. This is partially offset by lower estimated sales of non-financial assets due to a re-profile of Renewal SA’s commercial property sales ($21.7 million) and a reduction in estimated sales of government employee housing assets ($26.5 million).
Gross fixed capital formation is expected to be $30.0 million higher in 2014–15 compared to 2013–14, mainly reflecting higher capital expenditure by SA Water ($38.0 million) due to the roll-forward of capital expenditure previously budgeted to occur in 2013–14, lower commercial property sales by Renewal SA ($14.2 million) and lower sales of government employee housing assets ($11.1 million) following the completion of this program. This is partially offset by lower capital expenditure by the ACC on the Riverbank Precinct Development ($43.3 million).
Depreciation in 2013–14 is estimated to be $428.6 million which is $16.4 million lower than budget, mainly reflecting a reduction in SA Water’s depreciation expense ($14.6 million) due to recent asset revaluations. Depreciation is then forecast to increase across the forward estimates.
The estimated net change in inventories in 2013–14 is $61.3 million, $19.1 million higher than budget and mainly reflects movements in Renewal SA’s inventories due to the delay in land sales.
Overall, net acquisition of non-financial assets is estimated to be $67.4 million in 2013–14, $11.8 million lower than budget, reflecting the reduction in gross fixed capital formation, partially offset by lower depreciation and higher change in inventories. This is then forecast to increase slightly in 2014–15. From 2015–16 net acquisition of non-financial assets is expected to be negative as depreciation exceeds forecast capital spending.
Net lending for the PNFC sector is estimated to be -$291.9 million in 2013–14, an improvement of $24.2 million since budget, reflecting the improvement in net operating balance ($12.4 million) and the decrease in net acquisition of non-financial assets ($11.8 million). Net lending is then forecast to improve across the forward estimates due to the expected improvements in net operating balance and lower net acquisition of non-financial assets.
Chapter 5: Government businesses
2014–15 Budget Statement 91

Public non-financial corporations — performance
Table 5.2 summarises net contributions to the government, which comprise income tax equivalents, dividends, grants, subsidies and community service obligations (CSOs).
Table 5.2: Net contributions from PNFCs to the government ($million)(a)(b)
2013–14 2013–14 Estimated 2014–15
Budget Result Budget Income tax equivalents ForestrySA — — — Renewal SA — — 6.7 SA Water 84.0 88.5 60.8 South Australian Housing Trust — — — Other 0.7 0.4 0.6 Total income tax equivalents 84.7 88.9 68.1 Dividends ForestrySA — — — Renewal SA 9.5 2.1 14.2 SA Water 186.1 203.0 134.9 South Australian Housing Trust — — — Other 2.1 2.9 2.0 Total dividends 197.7 208.0 151.0 Grants and subsidies(b) ForestrySA 15.1 6.8 4.9 Renewal SA — 3.6 0.5 SA Water 3.4 4.7 2.4 South Australian Housing Trust 243.5 242.2 239.9 Other 40.7 41.8 46.2 Total grants and subsidies 302.7 299.1 293.9 CSOs ForestrySA 3.2 3.2 3.2 Renewal SA 20.7 21.1 20.6 SA Water 124.0 125.6 125.8 South Australian Housing Trust — — — Other — — — Total CSOs 147.8 149.9 149.6 Net contribution to government(c) ForestrySA - 18.2 - 10.0 - 8.1 Renewal SA - 11.1 - 22.6 - 0.3 SA Water 142.7 161.3 67.6 South Australian Housing Trust - 243.5 - 242.2 - 239.9 Other - 37.9 - 38.4 - 43.7 Total net contribution to government - 168.1 - 152.0 - 224.3
Note: Totals may not add due to rounding.
(a) Table 5.2 is presented on an accrual basis.
(b) Net contribution to the government comprises income tax equivalents plus dividends less grants, subsidies and CSOs. A negative amount indicates grants, subsidies and CSOs exceed dividends and income tax equivalents.
(c) Grants and subsidies are recognised in accordance with ABS classification standards and include Commonwealth Government grants and subsidies paid through the state government.
Chapter 5: Government businesses
92 2014–15 Budget Statement

In 2013–14, the PNFC sector is estimated to receive a net contribution (including Commonwealth Government grant funding) from the government of $152.0 million because grants, subsidies and CSO payments from the government to the PNFC sector exceed dividend and tax contributions to the government from the PNFC sector.
The net contribution from the government to the PNFC sector of $152.0 million is $16.1 million lower than budget, mainly as a result of higher dividend and tax contributions from SA Water, and a lower subsidy payment to ForestrySA. This has been partially offset by a higher net contribution from the government to Renewal SA, due to lower special dividends and higher grant payments.
The budgeted net contribution from the government to the PNFC sector of $224.3 million in 2014–15 is $72.3 million higher than 2013–14. This is the result of lower net contributions to the government from SA Water partially offset by lower net contributions from the government to Renewal SA.
In 2013–14 the PNFC sector is estimated to contribute a total of $296.9 million in dividends and income tax equivalents to the government, which represents a $14.6 million increase from budget. The increase is mainly the result of higher dividends from SA Water due to lower depreciation expense, as a result of recent asset revaluations, partially offset by lower special dividends from Renewal SA.
Overall, dividends and income tax equivalent payments by the PNFC sector are forecast to decrease by $77.9 million from 2013–14 to 2014–15, mainly from SA Water, reflecting higher interest and guarantee fee expenses associated with the increase in debt, partially offset by increased revenue as a result of rates and sales revenue increasing by inflation, in line with ESCOSA’s Final Revenue Determination, and decreased operating costs associated with efficiency targets applied by ESCOSA and the government. This is also partially offset by higher contributions from Renewal SA in 2014–15, largely due to the sale of 150 hectares of land at Gillman.
In 2013–14 the PNFC sector is estimated to receive a total of $449.0 million in CSOs and grants and subsidies from the state government, including the pass through of Commonwealth Government grants paid through the state government. This represents a $1.5 million decrease from budget as a result of a number of small increases in CSOs and grants and subsidy payments to PNFCs, largely offset by the reduction to the subsidy to ForestrySA as a result of identifying commercial sales opportunities and efficiencies in its operations.
Overall, payments from the government to the PNFC sector are forecast to decrease by $5.6 million from 2013–14 to 2014–15, due to lower budgeted grants and subsidies to Renewal SA, SAHT and SA Water.
Chapter 5: Government businesses
2014–15 Budget Statement 93

SA Water
Table 5.3: Net contributions from SA Water to the government ($million)
2013–14 Budget
2013–14 Estimated
Result 2014–15 Budget
Income tax equivalents 84.0 88.5 60.8 plus Dividends 186.1 203.0 134.9 less Grants, subsidies and CSOs(a) 127.4 130.3 128.1
equals
Net contribution to government 142.7 161.3 67.6
Note: Totals may not add due to rounding.
(a) Grants, subsidies and CSOs are recognised in accordance with ABS’s classification standards and include Commonwealth Government grants and subsidies paid through the state government.
The government is estimated to receive a net contribution from SA Water in 2013–14 of $161.3 million as dividends and income tax equivalents exceed grants, subsidies and CSOs. The government is estimated to receive a net contribution in 2014–15 of $67.6 million, which is $93.6 million less than estimated for 2013–14.
SA Water’s 2013–14 estimated dividends and income tax equivalent payments to the government of $291.5 million are above budget by $21.5 million, primarily due to lower depreciation expenditure.
During approval of the 2014–15 Budget, the government has determined to adjust the gearing level of SA Water by requiring the corporation to borrow an additional $2.7 billion. This will have the effect of bringing SA Water into line with its interstate peers with a debt to assets ratio of around 45 per cent, and will reduce the level of distributions (income tax equivalent payments and dividends) payable to government.
SA Water’s dividends and income tax equivalent payments are estimated to decrease by $95.8 million from 2013–14 to 2014–15, mainly due to higher interest and guarantee fee expenses associated with the increase in debt, partially offset by increased revenue as a result of rates and sales revenue increasing by inflation, in line with ESCOSA’s Final Revenue Determination, and decreased operating costs associated with efficiency targets applied by ESCOSA and the government.
CSO payments to SA Water from the government in 2013–14 of an estimated $125.6 million have increased by $1.6 million since the 2013–14 Budget, as a result of additional funding for works in remote communities. CSOs are estimated to remain relatively stable in 2014–15 and 2015–16, consistent with the direction to SA Water by the Minister for Water and the River Murray under section 6 of the Public Corporations Act 1993.
The SA Water Board has approved water prices for 2014–15 that have been prepared on a consistent basis with ESCOSA’s Final Revenue Determination of SA Water’s water and sewerage retail services for three years from 1 July 2013 to 30 June 2016. The government has announced that for SA Water customers, drinking water charges will increase by 2.9 per cent (nominal) on average in 2014–15, metropolitan sewerage charges will rise on average by 2.9 per cent (nominal) and country sewerage charges will rise on average by 3.4 per cent (nominal).
Chapter 5: Government businesses
94 2014–15 Budget Statement

Renewal SA
Table 5.4: Net contributions from Renewal SA to the government ($million)
2013–14 Budget
2013–14 Estimated
Result 2014–15 Budget
Income tax equivalents — — 6.7 plus Dividends 9.5 2.1 14.2 less Grants, subsidies and CSOs 20.7 24.7 21.1 equals Net contribution to government - 11.1 - 22.6 - 0.3
Note: Totals may not add due to rounding.
Renewal SA is estimated to receive a net contribution from the government in 2013–14 of $22.6 million, which is a deterioration from budget where a net contribution from the government of $11.1 million was forecast. This is largely due to lower than forecast special dividend payments due to the sale of commercial properties being deferred. Grants, subsidies and CSOs have increased since budget mainly due to $2.8 million received from the Department of State Development (DSD) under an Indemnity Deed following the sale of a property at Felixstow. No income tax equivalent payments are expected in 2013–14 due to a forecast financial loss.
The revenue sources for Renewal SA are heavily influenced by the level of activity in the building and construction sector. Dwelling commencements have risen substantially from the deep trough in mid-2012. Recent data on dwelling approvals indicate that dwelling construction activity should continue to rise in the second half of 2013–14 and into 2014–15. The underlying market conditions have however resulted in sales for a number of projects being delayed in 2013–14, including commercial land at Edinburgh Parks and Cast Metals Precinct and residential land at Blakeview, Evanston and Northgate.
The 2014–15 year is impacted significantly by the sale of 150 hectares of land at Gillman. Without this sale Renewal SA would be forecasting a loss in 2014–15. Excluding the Gillman land sale, Renewal SA’s anticipated land release program for 2014–15 is only expected to increase slightly from 2013–14 and will remain relatively consistent thereafter across the forward estimates. Major projects impacting on net sales revenue across the forward estimates include Northgate, Playford Alive, Seaford Heights, Blakeview and Bowden.
Chapter 5: Government businesses
2014–15 Budget Statement 95

ForestrySA
Table 5.5: Net contributions from ForestrySA to the government ($million) (a)
2013–14 Budget
2013–14 Estimated
Result 2014–15 Budget
Grants, subsidies and CSOs 18.2 10.0 8.1 Net contribution to government - 18.2 - 10.0 - 8.1
Note: Totals may not add due to rounding.
(a) ForestrySA is subject to the tax equivalent regime and dividend requirements outlined in its ownership framework, however no income tax equivalent and dividend payments are forecast over the forward estimates.
ForestrySA has a new role as operational manager of the Green Triangle plantations following the forward sale of the Green Triangle forest plantations. It is estimated that the government will provide ForestrySA with a $6.5 million subsidy in 2013–14, which reflects the government’s support of ForestrySA’s future obligations in the South East as well as ForestrySA’s other operations in the Mid North and Mount Lofty Ranges regions. The amount of the subsidy is forecast to reduce across the forward estimates as ForestrySA continues to identify efficiencies in its new role. The level of fire related services that are funded by a CSO payment from Primary Industries and Regions SA (PIRSA) remains unchanged.
South Australian Housing Trust
Table 5.6: Net contributions from the South Australian Housing Trust (SAHT) to the government ($million)(a)
2013–14 Budget
2013–14 Estimated
Result 2014–15 Budget
Grants, subsidies and CSOs(b) State grants 234.9 226.8 231.0 Commonwealth grants(c)(d) 8.6 15.4 8.9
Net contribution to government - 243.5 - 242.2 - 239.9
Note: Totals may not add due to rounding.
(a) SAHT is subject to the tax equivalent regime, however no income tax equivalent payments are forecast over the forward estimates. SAHT is not required to make dividend payments to the government.
(b) Grants, subsidies and CSOs are recognised in accordance with ABS’s classification standards and include Commonwealth Government grants and subsidies paid through the state government.
(c) Commonwealth grants represent funding provided under various National Partnership agreements for specific outcomes.
(d) Excludes capital funding ($37.3 million in 2013–14 and $27.8 million in 2014–15) received under the National Partnership Agreement for Remote Indigenous Housing which is provided to the trust as an equity contribution.
SAHT does not fully recover the cost of services provided through its own revenue sources.
Total grant funding provided to SAHT is estimated to be $242.2 million in 2013–14, which is a decrease of $1.3 million from budget, primarily due to additional funding of $6.8 million provided under the Homelessness National Partnership Agreement for capital projects partially offset by the allocation of government savings.
The decrease in total grant funding to $239.9 million in 2014–15 is mainly due to once-off capital funding provided under the Homelessness National Partnership in 2013–14.
Chapter 5: Government businesses
96 2014–15 Budget Statement

Capital investment
Figure 5.1: Purchases of non-financial assets and depreciation ($million)(a)
(a) Purchases of non-financial assets comprises investing expenditure and contributed assets.
Purchases of non-financial assets by the PNFC sector are forecast to be $658.3 million in 2014–15, which is $5.4 million higher than the 2013–14 forecast of $652.9 million, reflecting increased asset renewal by SA Water offset by lower investing expenditure on the Riverbank Precinct upgrade in line with the construction schedule.
The significant investing expenditure in 2014–15 includes SA Water’s investment program of $390.0 million, comprising major projects such as the Bolivar Pre-aeration Concrete Rehabilitation and Adelaide Desalination Plant (for the completion of works following project handover, which occurred in December 2012), SAHT’s investment program of $171.7 million comprising public housing redevelopment and capital maintenance programs and major projects such as remote indigenous and social housing, and Adelaide Convention Centre’s investment program of $47.6 million comprising mainly of the Riverbank Precinct Development.
PNFC depreciation is budgeted to increase across the forward estimates reflecting continued investment.
0
200
400
600
800
1 000
1 200
1 400
1 600
1 800
2003
–04
2004
–05
2005
–06
2006
–07
2007
–08
2008
–09
2009
–10
2010
–11
2011
–12
2012
–13
2013
–14
2014
–15
2015
–16
2016
–17
2017
–18
Purchases of non-financial assets Depreciation
Chapter 5: Government businesses
2014–15 Budget Statement 97
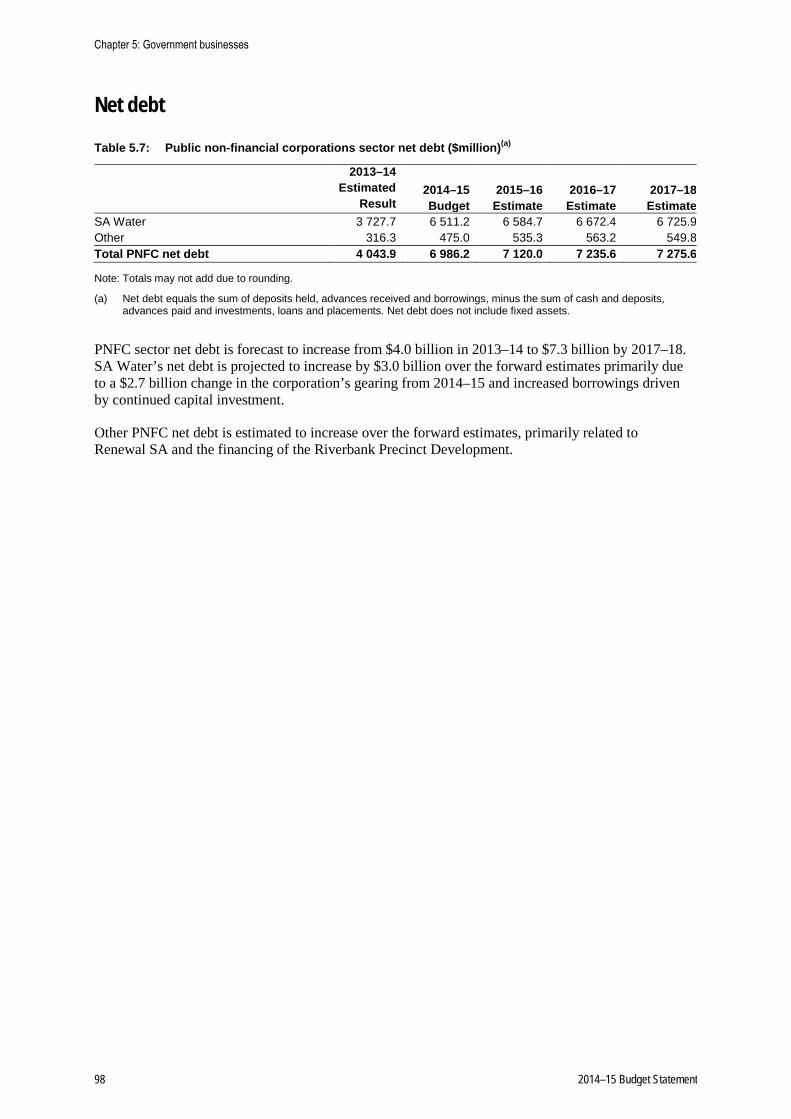
Net debt
Table 5.7: Public non-financial corporations sector net debt ($million)(a)
2013–14 Estimated 2014–15 2015–16 2016–17 2017–18 Result Budget Estimate Estimate Estimate SA Water 3 727.7 6 511.2 6 584.7 6 672.4 6 725.9 Other 316.3 475.0 535.3 563.2 549.8 Total PNFC net debt 4 043.9 6 986.2 7 120.0 7 235.6 7 275.6
Note: Totals may not add due to rounding.
(a) Net debt equals the sum of deposits held, advances received and borrowings, minus the sum of cash and deposits, advances paid and investments, loans and placements. Net debt does not include fixed assets.
PNFC sector net debt is forecast to increase from $4.0 billion in 2013–14 to $7.3 billion by 2017–18. SA Water’s net debt is projected to increase by $3.0 billion over the forward estimates primarily due to a $2.7 billion change in the corporation’s gearing from 2014–15 and increased borrowings driven by continued capital investment.
Other PNFC net debt is estimated to increase over the forward estimates, primarily related to Renewal SA and the financing of the Riverbank Precinct Development.
Chapter 5: Government businesses
98 2014–15 Budget Statement

Public financial corporations
The public financial corporations (PFC) sector includes HomeStart Finance, South Australian Government Financing Authority (SAFA), Motor Accident Commission (MAC), Superannuation Funds Management Corporation of South Australia (trading as Funds SA), WorkCover Corporation and the Lifetime Support Authority.
PFCs that make contributions to the government are shown in table 5.8.
Table 5.8: Net contributions from PFCs to the government ($million)(a)(b)(c)
2013–14 Budget
2013–14 Estimated
Result 2014–15 Budget
Income tax equivalents HomeStart Finance 4.9 4.7 5.3 South Australian Government Financing Authority 4.8 32.3 14.1 Total income tax equivalents 9.7 37.0 19.4 Dividends HomeStart Finance 6.9 6.6 7.4 South Australian Government Financing Authority 28.2 32.8 8.9 Total dividends 35.1 39.4 16.3 CSOs HomeStart Finance 5.6 5.6 5.9 Total CSOs 5.6 5.6 5.9 Net contribution to government(b) HomeStart Finance 6.2 5.7 6.8 South Australian Government Financing Authority 33.0 65.1 23.0 Total net contribution to government 39.2 70.8 29.8
Note: Totals may not add due to rounding.
(a) Income tax equivalents and dividends from PFCs are shown in table 3.17 of Chapter 3.
(b) Net contribution to the government from PFCs comprises income tax equivalents plus dividends less CSOs.
(c) This table does not reflect the once-off payment from MAC to government in 2013–14 for road safety initiatives.
The net contribution to government from HomeStart Finance is below budget in 2013–14 mainly due to lower than expected operating performance.
SAFA’s 2013–14 distributions are estimated to be $32.1 million higher than budgeted primarily due to the payment of higher income tax equivalents from better than estimated operating results in 2012–13 and 2013–14 and a special dividend from Playford Capital Pty Ltd.
SAFA’s 2013–14 Budget and estimated result includes a special dividend of $20 million from the return of excess capital in SAFA’s fleet business.
The full list of PNFCs and PFCs is contained in Appendix D.
Chapter 5: Government businesses
2014–15 Budget Statement 99

Full-time equivalents (FTEs)
Table 5.9: Public non-financial corporations’ and public financial corporations’ employment numbers
Full-time equivalent employees as at 30 June
2014 2015 2016 2017 2018
Estimate Estimate Estimate Estimate Estimate Public non-financial corporations
ForestrySA(a) 164.0 164.3 152.3 136.3 130.1 Renewal SA 197.7 202.7 197.7 197.7 197.7 SA Water 1 526.9 1 510.2 1 470.2 1 468.2 1 466.2 South Australian Housing Trust 896.0 853.5 843.5 828.5 824.3 Other 995.6 968.6 963.6 992.6 992.6 Total public non-financial corporations 3 780.2 3 699.3 3 627.3 3 623.3 3 610.9
Total public financial corporations 535.5 538.4 544.4 548.4 555.4
(a) Following Cabinet’s approval of the 2014–15 Budget, as announced by the Minister for Forests on 28 May 2014, Cabinet subsequently approved ForestrySA offering up to 60 TVSPs for its employees located in the South East and the Mount Lofty Ranges. At the completion of the TVSP process, it is anticipated that ForestrySA’s FTE profile will be significantly lower across the forward estimates.
The estimated aggregate workforce of the PNFC sector is 3780.2 FTEs at 30 June 2014, over 64 per cent of which relates to positions in SA Water and SAHT.
Employment in the PFC sector is estimated to be approximately 535.5 FTEs at 30 June 2014, with a large proportion of positions within WorkCoverSA, HomeStart Finance and SAFA.
FTEs in the PNFC sector are estimated to decrease by 169.3 between 30 June 2014 and 30 June 2018 primarily driven by FTE reductions for SAHT, SA Water and ForestrySA.
SA Water’s FTE profile across the forward estimates is significantly lower than the profile published at the 2013–14 Budget. Workforce levels for 2013–14 are expected to be 151.1 FTEs less than the original budget, due to an initial phase of workforce reductions, a significant corporation-wide organisational restructure and the transfer of the technical plumbing regulator function to the Department of State Development (DSD). Continuing FTE reductions over the forward estimates reflect the impact of ongoing efficiency activities.
Chapter 5: Government businesses
100 2014–15 Budget Statement

Chapter 6: Risk statement
Overview
This chapter outlines the major financial risks that could affect the fiscal outlook set out in the 2014−15 Budget and identifies measures the government has adopted to manage these risks. The risks are summarised in three main sections — risks to revenue, risks to expenditure, and contingent liabilities.
Budget estimates are made on assumptions and judgements formed in the context of information available at the time of their preparation. In practice, both revenues and expenses will be subject to variation from the budget, the size of such variation typically increasing over the forward estimates period.
Financial risks arise from general developments or from specific events that affect the fiscal outlook. They may be positive or negative, and they may not necessarily be within the government’s control. Examples include fluctuations in economic activity, changes to demand for services, fluctuations in financial markets and changes in Commonwealth Government policy.
The budget estimates include allowances to help manage potential financial risks. For example, allowances are made for wage and salary outcomes and capital expenditure contingency provisions. In addition, some sources of risk to the fiscal outlook can, to a certain extent, be managed through established risk management practices such as hedging and insurance.
Revenue risks
Taxation, grants, royalties and fines
State taxation revenues are exposed to variations and fluctuations in both the volume and value of activities that are subject to taxation. Broadly based taxes such as payroll tax are influenced by general economic trends, whereas more narrowly based taxes are subject to particular segments of economic activity. Price and activity trends in the property market have a greater impact on the short-term volatility of state taxation revenues than the broader economy because of the significant share of revenues derived from property-based taxes such as stamp duty and land tax.
Fluctuations in economic activity within the state increase the risk of state taxation revenues exceeding or falling short of budget forecasts, particularly at turning points in the economic cycle. The performance of the national economy is also a key driver of state government revenues. The pool of GST revenue grants allocated to the states and territories is directly influenced by national trends in consumer spending and housing construction, as well as population growth in each jurisdiction.
Furthermore, South Australia’s share of GST revenue grants is influenced, in part, by the state’s relative taxation revenue capacity. Under the horizontal fiscal equalisation (HFE) system, if South Australia’s taxation revenues are constrained relative to other states and territories as a result of weaker state economic conditions, the HFE process will provide South Australia with a higher share of GST revenues. This means that in the medium to longer term, South Australian revenues (GST revenue grants and own-source revenues in per capita terms) are primarily driven by the state
2014–15 Budget Statement 101

of the national economy. However, the HFE process operates with a lag and therefore fluctuations in state economic activity do have a short-term impact on overall revenues.
Specific economic-related risk factors include that:
• the international economic environment could be weaker than anticipated as a result of more subdued growth in the economies of China, some European economies and the United States of America, as well as growing geopolitical tensions in the Ukraine
• nationally, the timing and magnitude of the decrease in mining investment and the pace of uptake in investment by the non-mining sectors presents uncertainties, as does the transition from mining investment to the production phase, particularly in respect of the prospect of a slowing in Chinese demand for iron ore
• the longer–term sustainability of recent improvements in household spending and residential construction in light of more moderate income growth present a risk to the economic outlook and key revenue sources such as GST revenue grants, stamp duty and gambling tax revenues
• structural adjustment in response to announcements of future closures in the automotive manufacturing industry — both in terms of timing of closures and capacity of the economy to adjust, represents a risk to payroll tax revenues in particular
• variations in climatic conditions could impact on the volume of South Australian agricultural output and farm incomes with flow-on impacts into other areas of the economy.
State taxation revenue is not particularly sensitive to movements in broad based price measures, such as the Consumer Price Index (CPI). Rather, where there are price effects on taxation revenues they tend to be specific to particular transactions — for example, property values, motor vehicle values and insurance premiums.
Impact: A variance of 1.0 per cent in state taxation revenues equates to about $45 million per annum.
Specific revenue risk areas over and above general economic conditions are discussed below.
Property taxes
Conveyance duty revenue is exposed to local variations in the property market. Trends in property market values and activity levels have been difficult to predict in recent years. While property values have grown modestly in the past year, property market activity has shown stronger growth, albeit from very low levels recorded in recent years. Forward projections of conveyance duty revenue assume that property market transactions will return to long-term trend levels over the medium term.
There is a risk that property prices and/or activity levels will be lower than estimated, particularly if relatively soft employment conditions remain or structural change in the economy causes employment uncertainty. On the other hand, the property market has experienced strong growth from time to time after periods of downturn. Early signs of some improvement in the market, together with relatively low interest rates and strong growth in interstate property markets, could contribute to a continued rebound in property market transactions and price growth.
This uncertainty makes forecasting of property taxes difficult, especially for conveyance duty receipts. The irregular timing of large commercial transactions also adds to the risk of forecasting error.
Figure 6.1 shows the annual growth in total conveyance duty revenue since 1996–97. Over that time, annual growth in total conveyance duty revenue has ranged from around negative 20 per cent to positive 42 per cent.
Chapter 6: Risk statement
102 2014–15 Budget Statement

Figure 6.1: Total conveyance duty — annual growth
-30%
-20%
-10%
0%
10%
20%
30%
40%
50%
1996
–97
1997
–98
1998
–99
1999
–200
0
2000
–01
2001
–02
2002
–03
2003
–04
2004
–05
2005
–06
2006
–07
2007
–08
2008
–09
2009
–10
2010
–11
2011
–12
2012
–13
2013
–14
Est
Source: South Australian Department of Treasury and Finance.
Land tax receipts can also vary from expectation over the forward estimates period. Indexation of land tax thresholds commenced on 1 July 2011 and avoids the impact of bracket creep when property values are increasing, with growth in land tax revenues to be broadly in line with growth in land values. Land tax thresholds will not be reduced if land values fall, and as a result, land tax revenues will be additionally impacted.
Impact: A 1.0 per cent variation in property values equates to about $10 million in conveyance duty revenue, while a 1.0 per cent variation in transactions equates to about $8 million in conveyance duty revenue. As indicated in figure 6.1, historical annual growth in conveyance duty revenue has varied from around negative 20 per cent to positive 42 per cent. A 1.0 per cent variation in land values equates to around $6 million in private land tax revenue in 2014–15 (after indexation of tax brackets for growth in land values).
Gaming machine revenue
There are a number of risks to gaming machine tax revenue collections.
Discretionary spending levels are influenced by a range of factors, including income, debt servicing levels, the cost of essential items and perceived future spending needs. Regulatory reforms can also impact on gaming machine taxation revenue collections.
Underlying gaming machine expenditure is expected to grow modestly over the forward estimates. The growth projection is, however, vulnerable to household budget shocks, for example increases in interest rates and petrol prices as well as increases in key basic living charges.
Impact: A variance of 1.0 per cent in hotel and club gaming machine expenditure equates to around $4 million in gambling tax revenue.
Insurance duty
Insurance premiums can vary significantly over time depending on the capacity of the market and can sometimes be affected by major insurable events around the world. Events such as the natural disasters
Chapter 6: Risk statement
2014–15 Budget Statement 103

in Australia and offshore may affect the level and type of insurance taken out by policy holders, as well as the price of insurance premiums.
Impact: A variance of 1.0 per cent in premium levels equates to around $4 million in insurance duty.
Royalties
Mining and petroleum royalty revenue is exposed to external economic conditions. In particular, royalties are affected by exchange rates and changes in international prices for oil, copper, uranium and gold. Royalties can also be affected by changes to production levels, including the impact from natural occurrences (e.g. floods), unplanned operational incidents such as plant fires and failures, and other unforeseen events.
There is potential for growth in royalty revenue from new mines. The timing of these additional royalty streams is dependent on the timing of discoveries, global economic conditions as well as the time required for development approvals and to develop new mine sites to an operational level. Royalty revenue does not flow until commercial production commences.
Variations in royalty revenues arising from the royalty base (production and price levels) are substantially offset over time by consequent variations in the share of Commonwealth Government GST revenue grants received by South Australia through the HFE process.
Impact: Excluding HFE impacts, a 1.0 cent change in the US dollar/Australian dollar exchange rate has a direct revenue impact of about $2 million on royalty revenue. A 1.0 per cent change in international prices for copper, uranium, gold, oil and petroleum liquids has a direct revenue impact of about $3 million.
Traffic infringement fines
Revenue collected from traffic infringement fines is sensitive to changes in driver behaviour patterns and the number of speed detection devices (red light/speed cameras) in operation.
Impact: A variance of 1.0 per cent in the number of traffic infringement notices equates to around $1 million per annum in fines revenue.
Changes to general purpose payments (GST revenue)
The pool of GST revenue grants allocated to the states and territories is directly influenced by national trends in consumer spending and housing construction.
Households have become more cautious in their spending behaviour in recent years, increasing their savings. Spending patterns have also shifted towards items not subject to GST. These trends have had a significant impact on the growth of the GST pool.
South Australia’s GST revenue grants are primarily driven by the size of the national GST pool and the state’s population share. They are also impacted by changes to the state’s share of the pool, which is determined by the Commonwealth Grants Commission (CGC) in accordance with HFE principles. Figure 6.2 shows that annual growth in the GST pool and South Australia’s GST revenue grants has also fluctuated over the past 10 years. South Australia’s GST revenue grants comprise over 50 per cent of general-purpose revenues and therefore the budget is particularly exposed to lower than expected growth in the GST pool.
Chapter 6: Risk statement
104 2014–15 Budget Statement
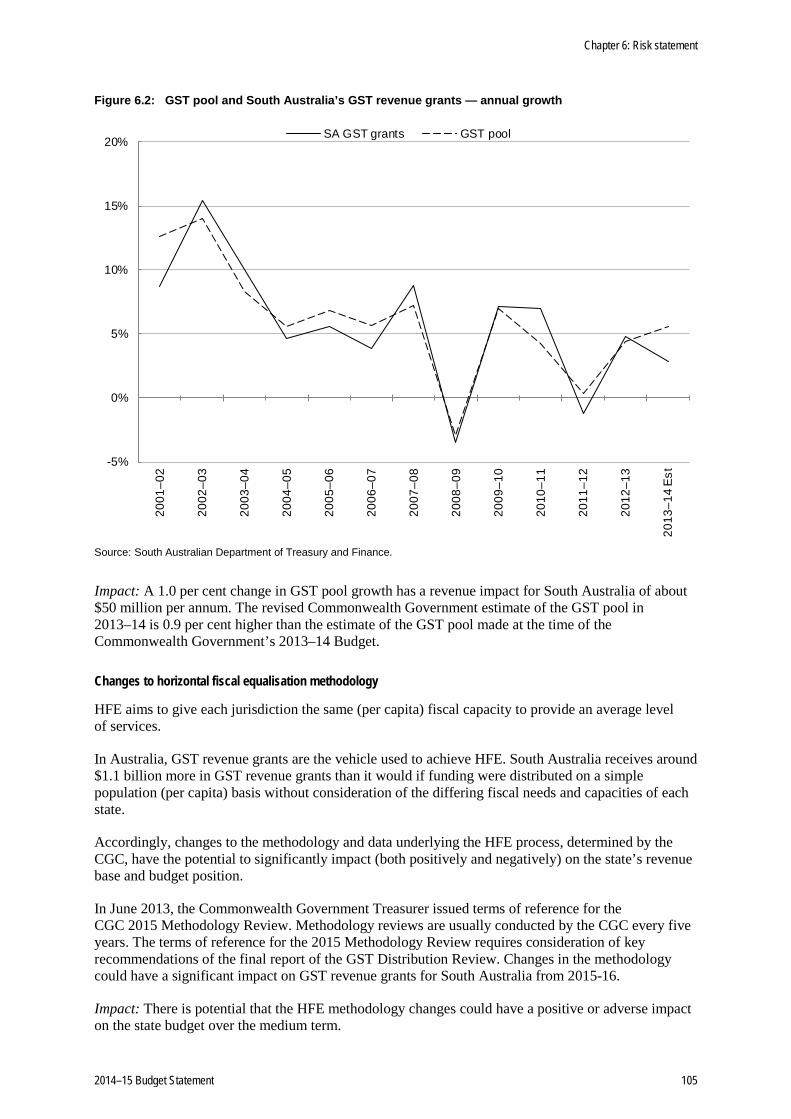
Figure 6.2: GST pool and South Australia’s GST revenue grants — annual growth
-5%
0%
5%
10%
15%
20%20
01–0
2
2002
–03
2003
–04
2004
–05
2005
–06
2006
–07
2007
–08
2008
–09
2009
–10
2010
–11
2011
– 12
2012
–13
2013
–14
Est
SA GST grants GST pool
Source: South Australian Department of Treasury and Finance.
Impact: A 1.0 per cent change in GST pool growth has a revenue impact for South Australia of about $50 million per annum. The revised Commonwealth Government estimate of the GST pool in 2013–14 is 0.9 per cent higher than the estimate of the GST pool made at the time of the Commonwealth Government’s 2013–14 Budget.
Changes to horizontal fiscal equalisation methodology
HFE aims to give each jurisdiction the same (per capita) fiscal capacity to provide an average level of services.
In Australia, GST revenue grants are the vehicle used to achieve HFE. South Australia receives around $1.1 billion more in GST revenue grants than it would if funding were distributed on a simple population (per capita) basis without consideration of the differing fiscal needs and capacities of each state.
Accordingly, changes to the methodology and data underlying the HFE process, determined by the CGC, have the potential to significantly impact (both positively and negatively) on the state’s revenue base and budget position.
In June 2013, the Commonwealth Government Treasurer issued terms of reference for the CGC 2015 Methodology Review. Methodology reviews are usually conducted by the CGC every five years. The terms of reference for the 2015 Methodology Review requires consideration of key recommendations of the final report of the GST Distribution Review. Changes in the methodology could have a significant impact on GST revenue grants for South Australia from 2015-16.
Impact: There is potential that the HFE methodology changes could have a positive or adverse impact on the state budget over the medium term.
Chapter 6: Risk statement
2014–15 Budget Statement 105

Changes to data used by the Commonwealth Grants Commission (CGC)
In each annual update of relativities, the CGC updates its assessment for the latest available social, demographic and economic data, while continuing to use methods established in the last methodology review. While the requirement for the CGC to improve data and data sources wherever possible is appropriate, this can lead to changes in annual relativities.
The CGC has also changed methods used in annual updates where data is no longer available or is no longer considered fit for purpose.
State relativities can vary significantly between annual updates, reflecting factors such as differential fluctuations in the value of mining output, variations in Commonwealth Government payments between states and differential growth rates in conveyance duty receipts.
Impact: A 0.01 change in South Australia’s relativity (from the 2014 update relativity of 1.28803) would result in a change in GST revenue grants of about $38 million.
Specific purpose and National Partnership payments
Commonwealth-state funding arrangements are governed by the Intergovernmental Agreement on Federal Financial Relations (the IGA) agreed to by the Council of Australian Governments (COAG) in December 2008. The IGA provides for a small number of national-specific purpose payments (SPPs) covering the major state functions of health, housing, skills development, education and disability services. In addition, National Partnership payments (NPPs) are paid to states to support delivery of specified projects or to facilitate or reward the implementation of reforms of national importance. The SPPs focus on outcomes. The Disability SPP will cease with the commencement of the National Disability Insurance Scheme (NDIS).
Some NPPs require funding co-contributions from the states and in some cases penalty provisions apply if performance targets are not met.
In the 2014–15 Commonwealth Budget the Commonwealth Government ceased funding a number of long-standing programs, reduced or deferred funding for several programs and has not honoured some reward payments in existing agreements. These changes to Commonwealth Government policy have significant impacts for the State Budget.
Impact: SPPs and NPPs from the Commonwealth Government account for about 20 per cent of state government revenues. Variations in their level or the conditions applying to these payments impact the budget.
Changes in profitability of government businesses
As part of their day-to-day operations, government business enterprises — comprising public non-financial corporations (PNFCs) such as SA Water and Renewal SA and public financial corporations (PFCs) such as the South Australian Government Financing Authority (SAFA) — manage a range of commercial risks. Risks that adversely impact upon a government business may affect its ability to pay dividends and make tax equivalent payments, thereby impacting on the financial position of the general government sector.
Impact: A 1.0 per cent fall in total contributions in 2014–15 to the general government sector from PNFCs and PFCs would have a $2.5 million impact on the budget.
Chapter 6: Risk statement
106 2014–15 Budget Statement

Asset sales
Reductions in net debt and corresponding interest costs in the budget arising from debt retirement may be at risk if the government is unable to achieve the value estimated for divestment of selected government owned properties.
Expenditure risks
Hospital expenditure growth
Hospital expenditure growth has consistently exceeded budget in recent years.
In response to these increasing costs, the government is continuing to implement a number of strategies to manage the expenditure growth in hospitals.
Impact: A 1.0 per cent growth in hospital expenditure above the level incorporated in the 2014−15 Budget would increase expenditure by approximately $46 million per annum.
Student enrolment numbers
The budget includes a best estimate of expected movements in the number of student enrolments. To the extent that actual enrolment numbers vary from those estimates there will be an impact on the state’s financial position.
Impact: A 1.0 per cent growth in government school enrolment numbers above the levels incorporated in the 2014−15 Budget would increase expenditure by approximately $12 million per annum.
Growth in children in care
The budget includes provisions for resourcing requirements of children in state care, including home-based, community residential and emergency alternative care accommodation.
Impact: Depending on the mix of care types, a 1.0 per cent growth in children in alternative care above the levels incorporated in the 2014−15 Budget would increase expenditure by approximately $2.8 million per annum.
Disability
The number of people receiving state government disability support is increasing in excess of the growth in population, resulting in an increase in the proportion of people receiving services. This is due to a number of factors including ageing of the potential client population, medical advances and a general drift from home care to state care in part due to the ageing of carers. If the increase in services is higher than forecast there will be an impact on the budget.
Above projected growth costs for children aged 0–14 years will be met within the NDIS trial cohort from 2013–14 and fully funded by the Commonwealth Government. Similarly, growth in costs above the state contribution to NDIS will be met by the Commonwealth Government when the states enter the full NDIS in 2018–19. This is subject to a Productivity Commission review in 2017 and subsequent COAG deliberations, with the Commonwealth Government committing to a minimum of 75 per cent of cost risk.
Chapter 6: Risk statement
2014–15 Budget Statement 107

Impact: Depending on the mix of client needs, a 1.0 per cent growth in disability support clients above the level incorporated in the 2014−15 Budget would increase expenditure by approximately $5.3 million per annum.
Higher than expected increases in wages and salaries
Enterprise agreements are in place for major workforce groups for the relevant terms of each agreement, with all associated costs included in the 2014−15 Budget.
Enterprise bargaining negotiations are continuing for the trades group (building, metal and plumbing trades) and have commenced for police and the wages parity salaried and weekly paid groups.
During 2014−15, enterprise bargaining negotiations are also expected to commence for TAFE SA lecturers, teachers and staff in schools and preschools, ambulance officers and visiting medical specialists.
The outcomes of future wage negotiations will be crucial in determining whether expenditure forward estimates in this budget can be achieved, and the level of government services that can be delivered in light of the current challenging economic conditions.
Allowances in the forward estimates for enterprise bargaining outcomes cover both salary and non-salary outcomes.
Impact: If public sector-wide wage outcomes for new enterprise agreements vary by 1.0 per cent per annum from allowances in the forward estimates, the budget impact is estimated to be around $260 million in 2017−18.
Delivery of savings and revenue measures
Since the 2008–09 Mid-Year Budget Review (MYBR) the government has budgeted for significant savings measures, the achievement of which are factored into the budget outlook.
Additional monitoring arrangements were put in place to oversee the implementation of the specific savings measures introduced since the 2010–11 Budget. With the exception of the Department of Health and Ageing, agencies have delivered the budgeted savings. Adjustments to agencies savings tasks have been disclosed in the budget papers. Agency savings budgeted to commence in 2013–14 are substantially on track.
Table 6.1: Delivery of operating savings and revenue measures since the 2008–09 MYBR
$million Delivered in 2009–10 37 Delivered in 2010–11 200 Delivered in 2011–12 352 Delivered in 2012–13 122 Delivered in 2013–14 estimate 282 To commence in 2014–15 276 To commence in 2015–16 313 To commence in 2016–17 208 To commence in 2017–18 286
Impact: Not quantifiable. Where savings and revenue measures are delayed or not achieved there will be an adverse budget impact unless alternative savings measures can be found. Any changes are disclosed in the budget and mid-year budget review papers.
Chapter 6: Risk statement
108 2014–15 Budget Statement
Interest rates
Changes in interest rates would affect the budget positions of the general government and public non-financial corporation (PNFC) sectors through changes in interest payments.
Impact: A 1.0 percentage point move in the average interest rate applying to general government sector net debt would change net interest expense by approximately $45 million in 2014−15 rising to $53 million in 2017−18.
A 1.0 percentage point move in interest rates applying to the PNFC sector would change net interest expense by approximately $70 million in 2014−15. This would affect contributions received by the general government sector from PNFCs.
Increase in Consumer Price Index (CPI)
Higher inflation may impact on the prices paid by government agencies for goods and services. The government’s indexation policy provides for standard indexation of supplies and services expenditure in line with projections in the CPI. Agencies are required to absorb a cost increase from within existing budget allocations, unless the specific price increase has resulted in a material effect on the agency budget. The materiality test applied is that the price change experienced has altered agency costs by more than 0.5 percentage points above or below the standard indexation provided for in agency budgets.
Impact: Not quantifiable.
Fluctuation in foreign exchange rates
Treasurer’s Instruction 23 ‘Management of Foreign Currency Exposures’ requires public authorities to recognise and control foreign exchange risks associated with the purchase of imported goods and services. Public authorities are required to obtain forward cover for the acquisition of goods and services that are expected to give rise to a foreign currency exposure exceeding $250 000. This limits potential foreign exchange risks faced by the government once acquisition decisions are made.
Impact: Foreign exchange rates could have an impact on the costs of portfolios that source capital equipment, supplies and services from overseas. This includes items such as pharmaceuticals, transport equipment and the operations of overseas offices.
Capital investment
Project estimates include prudent allowances for cost escalations. Large capital programs increase the risk of additional costs.
Impact: If cost escalations exceed the allowances included in the investment program, there will be a negative impact on annual net lending outcomes. A 1.0 per cent increase in costs for the general government investment program would increase capital expenditure by approximately $12 million in 2014−15.
Chapter 6: Risk statement
2014–15 Budget Statement 109

Superannuation liabilities and expenses
For defined benefit scheme superannuation liabilities (pension or defined benefit lump sum schemes), the budget is exposed to factors affecting the value of the unfunded liability. These factors include:
• volatility in the expected returns on investment funds and the risk-free discount rate
• changes in actuarial assumptions relating to future benefit payments
• an increase in long-term inflation assumptions.
The unfunded superannuation liability is the state’s biggest financial liability.
Impact: Volatility in asset markets poses a risk to the budget. A 1.0 percentage point lower than expected return on superannuation assets invested by Funds SA would increase estimated unfunded superannuation liabilities by around $56 million. An increase in unfunded superannuation liabilities of this magnitude would increase nominal superannuation interest expenses, decreasing the net operating balance by around $2 million per annum. A 1.0 percentage point higher than expected return would have the opposite effect by the same amounts.
A fall in the Commonwealth Government bond rate between valuation dates will lead to the use of a lower discount rate for valuation purposes, resulting in an increase in the value of the unfunded liability. A 1.0 percentage point reduction in the discount rate would increase unfunded superannuation liabilities by $2.3 billion. However the impact on the budget balance is the imputed interest on these unfunded liabilities, and the interest rate used to calculate this will also fall by 1.0 percentage point. The net effect on the budget would be an improvement of around $26 million per annum in the net operating balance. An increase in the discount rate of 1.0 percentage point would decrease unfunded superannuation liabilities by $1.9 billion and increase the imputed interest by $3.2 million.
Change in domestic and overseas share prices
Funds SA, WorkCoverSA, MAC and the insurance-related investments of SAFA are exposed to both domestic and international equity markets. Changes in domestic and overseas share prices impact on the investments of these entities.
Impact: A variation in domestic and overseas share prices will directly impact the budget through a change in earnings on superannuation assets. A change in the value of the financial investments of WorkCoverSA and MAC will not have a direct impact on the budget.
A change in the value of SAFA’s financial investments may have a direct impact on the budget through a variation in SAFA’s contribution to the Consolidated Account.
Insurance
Risks associated with insurance liabilities are managed by SAICORP, the insurance division of SAFA. The operations of SAICORP are described in Chapter 4.
Government motor vehicle fleet — residual value risk
The state government’s fleet operations transferred to SAFA from 1 July 2009. Accordingly, reductions in residual values of vehicles will be met by SAFA and will impact on government agencies over time through changes to the leasing rates charged by SAFA.
Chapter 6: Risk statement
110 2014–15 Budget Statement

Any reductions in residual values of vehicles will be a risk exposure to SAFA and may impact on the budget through either an increase in lease rates or a reduction in SAFA’s contribution to the Consolidated Account.
Contingent liabilities
Contingent liabilities are liabilities, or possible liabilities, that have not been recognised in the government’s balance sheet because they:
• arise from past events, and will be confirmed only by the occurrence or non-occurrence of one or more uncertain future events not wholly within the control of the government, or
• are a present obligation that arises from past events but is not recognised because:
– it is not probable that an outflow of resources will be required to settle the obligation, or
– the amount of the obligation cannot be measured with sufficient reliability.
Full details of the state’s material quantifiable and non-quantifiable contingent liabilities are included in the 2012−13 Final Budget Outcome and Consolidated Financial Report as at 30 June 2013.
The state’s quantifiable contingent liabilities are summarised in table 6.1.
Table 6.1: Contingent liabilities of the Government of South Australia to entities external to the public sector at 30 June ($million)
2012 2013 Guarantees 891 941 Other 5 11
Total 896 951
Note: Totals may not add due to rounding.
Final whole of government data for 2013–14 will be published in the 2013−14 Final Budget Outcome and Consolidated Financial Report as at 30 June 2014.
The information below provides 30 June 2013 data for the major individual contingent liabilities.
It also recognises a recent agreement the government has entered into with Nyrstar in relation to the Port Pirie Smelter Transformation project.
Summary of contingent liabilities and other exposures
Significant contingent liabilities and other specific exposures, both quantifiable and non-quantifiable, for the Government of South Australia include the following.
• Guarantee of Local Government Finance Authority loans and other liabilities ― pursuant to the Local Government Finance Authority Act 1983, liabilities incurred or assumed by the Local Government Finance Authority are guaranteed by the Treasurer.
Exposure: $662 million at 30 June 2013.
• Osborne Cogeneration arrangements ― certain underlying exposures were retained as part of the former government’s sale of electricity assets.
Exposure: $150 million to $200 million at 30 June 2013.
Chapter 6: Risk statement
2014–15 Budget Statement 111

• Electricity entities ― as part of the former government’s privatisation of the state’s electricity assets, the government provided certain specified undertakings to the lessees. In the extremely remote event that these undertakings are not enforceable and the leasing arrangements are terminated, the state is required to make specified payments to the lessees and would receive the associated electricity infrastructure assets in return.
Gross exposure: $1.8 billion at 30 June 2013.
• Alice Springs–Darwin Railway ― both the South Australian and Northern Territory governments guarantee the obligations of the AustralAsia Railway Corporation, the joint statutory authority that looks after the government’s interests in relation to the Alice Springs–Darwin Railway. The prospect of these contingent liabilities arising is considered to be highly remote.
Exposure: Not quantifiable.
• Port Pirie smelter upgrade ― the Treasurer has agreed to indemnify the Export Finance and Insurance Corporation (EFIC), the Commonwealth Government’s export finance agency, for a guarantee of up to $291 million to external lenders to the Port Pirie Smelter Transformation Project being undertaken by Nyrstar.
Exposure: Nil at 30 June 2013. The indemnity is not expected to be issued before January 2015.
Other, less material, contingent liabilities are reported in individual agency financial statements, as contained in agency annual reports or Part B of the Report of the Auditor-General.
Chapter 6: Risk statement
112 2014–15 Budget Statement

Chapter 7: South Australian economy
Overview
International economic conditions have improved and are anticipated to strengthen further in 2014–15. World output growth is forecast by the International Monetary Fund (IMF) to increase from 3.0 per cent in 2013 to 3.6 per cent in 2014 and 3.9 per cent in 2015, with much of the contribution coming from advanced economies. Accommodative monetary policy settings are anticipated to lead to above trend growth projections for the United States of America (USA) and near trend growth in key Euro economies.
Recent indicators from China suggest some moderation in economic growth is occurring, but growth is still running at a very solid pace. Policy intervention to support investment and the achievement of growth targets for China may occur if the economy slows more significantly. IMF forecasts suggest economic growth in China will be 7.5 per cent in 2014, moderating slightly to 7.3 per cent in 2015.
The Australian economy has been boosted by stronger resource production as this sector transitions from the investment phase to the production phase. Accommodative monetary policy settings, which have been in place for some time now, are contributing to a moderate pick–up in both new housing construction and household spending. The relatively high Australian dollar continues to act as a drag on economic growth however, by constraining expansion and investment opportunities in the non-mining sector, and overall employment growth has been below trend.
In South Australia, economic conditions have also been mixed across sectors. Positive trends have been evident in a strong crop season, improved levels of housing construction and stronger mining export returns. The record infrastructure program in recent years is tapering off but nonetheless continues to support the state economy currently and into the near term. Challenges continue to be faced by sectors of the economy exposed to international competition and the relatively high Australian dollar. The South Australian economy is expected to improve in 2014–15 supported by improvements in dwelling construction activity and improved consumer spending. Recent announcements by GM Holden and Toyota that they will cease production by 2017 will impact on the South Australian economy and employment. In spite of these developments, the South Australian economy is sufficiently large, diverse and resilient to cope with and, adjust to, these changes with appropriate support from government.
While unemployment has risen over the past two years it remains low by international standards (see figure 7.1).
2014–15 Budget Statement 113
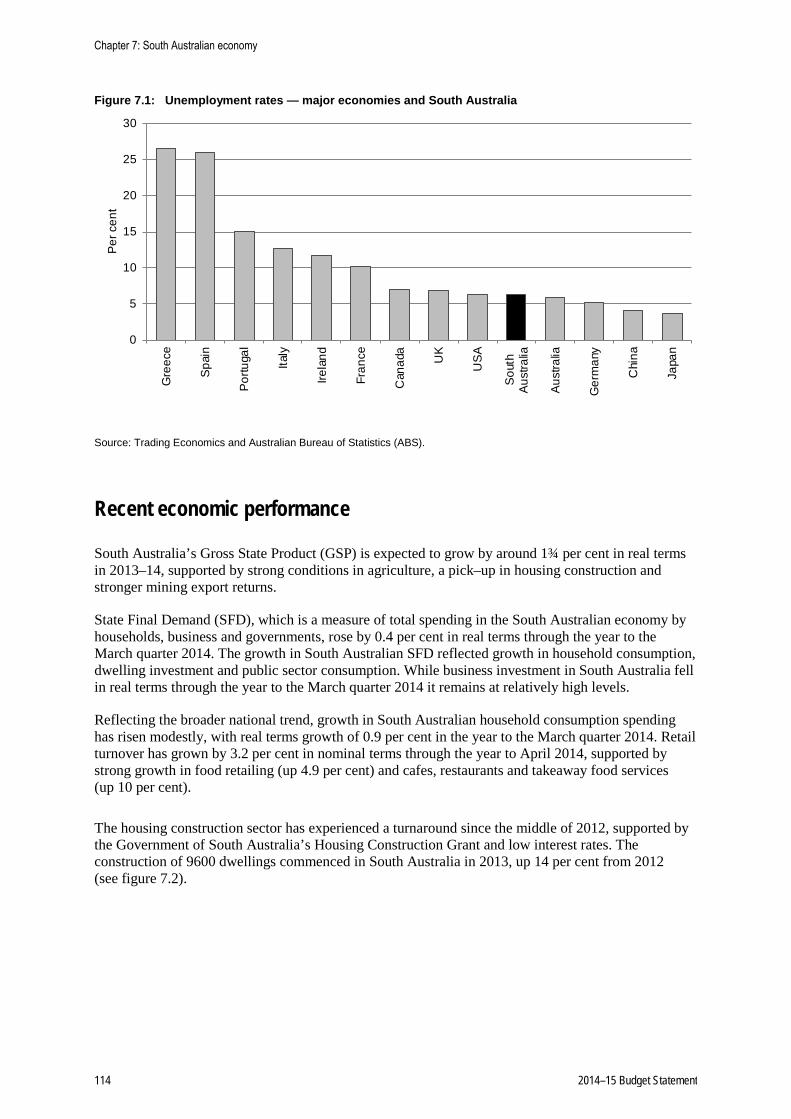
Figure 7.1: Unemployment rates — major economies and South Australia
0
5
10
15
20
25
30
Gre
ece
Spa
in
Por
tuga
l
Italy
Irela
nd
Fran
ce
Can
ada
UK
US
A
Sou
thA
ustra
lia
Aus
tralia
Ger
man
y
Chi
na
Japa
n
Per
cen
t
Source: Trading Economics and Australian Bureau of Statistics (ABS).
Recent economic performance
South Australia’s Gross State Product (GSP) is expected to grow by around 1¾ per cent in real terms in 2013–14, supported by strong conditions in agriculture, a pick–up in housing construction and stronger mining export returns.
State Final Demand (SFD), which is a measure of total spending in the South Australian economy by households, business and governments, rose by 0.4 per cent in real terms through the year to the March quarter 2014. The growth in South Australian SFD reflected growth in household consumption, dwelling investment and public sector consumption. While business investment in South Australia fell in real terms through the year to the March quarter 2014 it remains at relatively high levels.
Reflecting the broader national trend, growth in South Australian household consumption spending has risen modestly, with real terms growth of 0.9 per cent in the year to the March quarter 2014. Retail turnover has grown by 3.2 per cent in nominal terms through the year to April 2014, supported by strong growth in food retailing (up 4.9 per cent) and cafes, restaurants and takeaway food services (up 10 per cent).
The housing construction sector has experienced a turnaround since the middle of 2012, supported by the Government of South Australia’s Housing Construction Grant and low interest rates. The construction of 9600 dwellings commenced in South Australia in 2013, up 14 per cent from 2012 (see figure 7.2).
Chapter 7: South Australian economy
114 2014–15 Budget Statement

Figure 7.2: Dwelling commencements and approvals in South Australia — seasonally adjusted
0
500
1000
1500
2000
2500
3000
3500
4000
4500
Mar-04 Mar-06 Mar-08 Mar-10 Mar-12 Mar-14
Num
ber o
f qua
rterly
app
rova
ls,
com
men
cem
ents
Dwelling approvals Dwelling commencements
Source: ABS, Building Activity, Australia, Catalogue no. 8752.0; Building Approvals, Australia, Catalogue no. 8731.0.
Conditions in the rural sector remain strong. Winter crop production in 2013–14 was the third highest on record, rising by 33 per cent to be 23 per cent above the five-year average. Full water allocations for River Murray irrigators were available for production in 2013–14.
The value of South Australian overseas goods exports rose by 15 per cent to a total of $12.3 billion in the year to April 2014. Solid increase in exports of metal ores, meat, grains and copper were the major contributors to South Australian export growth over the period. The value of mining exports from the state is at very high levels, boosted by the commencement of new mines in recent years.
International education and tourism present future opportunities for growth within the state. In the year to December 2013, the number of overseas students studying in South Australia was 143 per cent higher than in 2002. The state's share of the overseas student market has risen from 4.0 per cent to 5.1 per cent over the same period. Full year enrolments of international students peaked in 2010 and declined through the next few years but are showing recent signs of recovery, with enrolments in the March quarter 2014 being 7 per cent higher than at the same time a year earlier. International visitor numbers continue to grow. In the year to March 2014 there were 381 000 international visitors to South Australia, 7.8 per cent higher than a year ago.
South Australia’s annual population growth rate continues to be supported by solid gains in net overseas migration. South Australia’s estimated resident population grew by 15 300 during the year to September 2013. Net overseas migration accounted for the bulk of the population gain (11 900) and, to a lesser extent, natural increase (7300). These gains, however, were partially offset by continuing losses interstate (3900).
South Australia’s labour market has reflected subdued domestic demand conditions in the non-resources sectors of the economy. Employment decreased by 1.4 per cent through the year to November 2013 but some signs of recovery have started to emerge in recent months with employment growing by 0.3 per cent in the five months to April 2014 (see figure 7.3).
Chapter 7: South Australian economy
2014–15 Budget Statement 115

Figure 7.3: South Australian employment and hours worked — trend estimates
90
97
104
111
118
650
700
750
800
850
Apr–04 Apr–06 Apr–08 Apr–10 Apr–12 Apr–14
Mill
ion
hour
s w
orke
d pe
r mon
th
Em
ploy
men
t ('0
00 p
erso
ns)
Employment Hours worked
Source: ABS, Labour Force Australia, Catalogue no. 6202.0.
South Australia’s trend unemployment rate was 6.6 per cent in April 2014, up from 6.0 per cent a year earlier (see figure 7.4).
Figure 7.4: South Australian unemployment rate — trend estimates (per cent)
4
6
8
10
12
14
Apr–79 Apr–84 Apr–89 Apr–94 Apr–99 Apr–04 Apr–09 Apr–14
Per
cen
t
Source: ABS, Labour Force Australia, Catalogue no. 6202.0.
Figure 7.5 shows the latest trends in the employment to population ratio, based on annual average data to remove volatility in the monthly estimates. Both nationally and in South Australia the employment to population ratio has declined over the past two years. The gap between South Australia’s employment rate and the national average is partly the result of South Australia’s older age structure. When adjustment is made to remove this age structure effect, the gap between South Australia’s employment to population ratio and the national average reduces to 1.1 percentage points.
Chapter 7: South Australian economy
116 2014–15 Budget Statement

Figure 7.5: Employment to population ratios — moving annual average (per cent)
54
56
58
60
62
64
Apr–04 Apr–06 Apr–08 Apr–10 Apr–12 Apr–14
Em
ploy
men
t to
popu
latio
n ra
tio (%
)
AustraliaSouth AustraliaSouth Australia — standardised to national age structure
Source: ABS, Labour Force Australia, Catalogue no. 6291.0.55.001.
Wages growth remains well contained and below the rates of growth recorded prior to the global financial crisis. Annual South Australian wages growth, based on the ABS hourly rates of pay index, was 3.2 per cent in the year to the March quarter 2014, compared with 2.6 per cent nationally. This variation may, in part, reflect the timing of wage decisions.
Economic outlook
The national economy is expected to grow at a below trend rate in 2014–15 before returning to above trend rates of growth from 2016–17 onwards. National economic growth is underpinned by strong growth in the volume of commodities exports. Growth is anticipated to gradually transition to non-resource drivers of growth, assisted by monetary policy settings, which have been very accommodative for some time now and anticipated to remain so in the immediate term.
In South Australia, GSP is forecast to increase by 2¼ per cent in real terms in 2014–15, following expected growth of 1¾ per cent in 2013–14. Dwelling construction activity has picked up significantly since the middle of 2012, assisted by state government stimulus measures and accommodative monetary policy settings. Some other sectors, which have been exposed to international competition and the relatively strong Australian dollar, have faced more difficult trading conditions. Employment growth in South Australia is expected to be 1 per cent in 2014–15, accelerating to 1¼ per cent in 2015–16.
In South Australia, the announcement that GM Holden Ltd, and more recently Toyota Motor Corporation, will stop Australian vehicle production in 2017 is expected to reduce the pace of employment and economic growth in 2016–17 and 2017–18. ‘Our Jobs Plan’ seeks to provide training and support for workers affected by the impending closure of GM Holden Ltd and affected motor vehicle component manufacturers, accelerate structural change in the economy to take advantage of new opportunities for growth, accelerate infrastructure provision, and support affected communities.
Forecasts and projections for South Australia from 2014–15 onwards take into consideration the expected performance of the national economy over the medium term and relative population growth rates.
Chapter 7: South Australian economy
2014–15 Budget Statement 117

Table 7.1: Key economic indicators — Australia and South Australia real growth rates (per cent per annum)
(a) Australian forecasts from 2014–15 Commonwealth Government Budget.
(b) Employment growth forecasts and projections reflect full year averages.
2012–13 Actual
2013–14 Estimate
2014–15 Forecast
2015–16 Projection
2016–17 Projection
2017–18 Projection
Australia(a)
Gross Domestic Product (GDP) 2.6 2¾ 2½ 3 3½ 3½ South Australia
Gross State Product (GSP) 1.3 1¾ 2¼ 2½ 2¼ 2¼ State Final Demand (SFD) -0.2 1 2 2½ 2¼ 2¼ Employment(b) 0.1 -1¼ 1 1¼ 1 1 Adelaide Consumer Price Index (CPI) 2.0 2¾ 2½ 2½ 2½ 2½
Chapter 7: South Australian economy
118 2014–15 Budget Statement
Chapter 8: Regional South Australia
Overview
This chapter provides information about the new initiatives in the 2014–15 Budget that provide opportunities for regional South Australia.
Regions contribute to the economic strength and social fabric of South Australia and are an integral part of the state’s identity. Regional South Australia contributes around $23 billion to the state’s economy and produces around 45 per cent of merchandise exports — and it does so with just 29 per cent of the state’s population.
The Government of South Australia recognises the need for regional communities to build on their economic foundations, generate social vitality and preserve their environmental assets.
Regions are dealing with various challenges and opportunities — some are region-specific and need a local solution, while others are common across all regions and affect the whole state.
The success of industries such as agriculture, forestry and food and wine production, aquaculture, fishing, mining and minerals processing, manufacturing, tourism and energy production, is vital. Creating the conditions for regional businesses and communities to grow and prosper is fundamental.
Charter for stronger regional policy
Building stronger regions is an imperative recognised by the state government and is encapsulated in the delivery of the series of agreements between the Premier and the Independent Member for Frome, the Hon. Geoffrey Brock, reached in March 2014.
These agreements detail a number of actions committed to by the state government for regional South Australia and includes additional support to be provided to communities, projects and programs.
The regional development package of initiatives is worth $39 million in the first year and $29 million per annum thereafter.
The $39 million includes:
• $10 million as a once-off Jobs Accelerator Fund in 2014–15, directed at regional development opportunities
• $13.4 million per annum increase to the Regional Development Fund
• $15.5 million per annum drawn from existing resources across government.
The Government of South Australia’s regional development package of $39 million in new and existing funding is highlighted by the Charter for Stronger Regional Policy, which sets out a number of opportunities for regional communities to interact with the government, including:
• the reintroduction of three Country Cabinet meetings in regions each year
• at least one state parliamentary forum in a regional area per year
2014–15 Budget Statement 119

• the requirement that at least one minister spend a day each week in a regional area
• holding at least three Senior Management Council meetings in regions each year
• the development of an interactive portal connected to the <sa.gov.au> website to engage with regional communities
• a dedicated GovChat program that enables regional South Australians to discuss issues directly with the Premier, ministers and chief executives.
The charter also provides for a greater focus on regional South Australia in government decisions through regional engagement processes.
Regional South Australia Cabinet Committee
The new Regional South Australia Cabinet Committee held its inaugural meeting on 26 May 2014.
The objective of this Cabinet Committee is to ensure greater focus on the needs of regional South Australia when making government decisions and improved coordination of government programs, as well as funding arrangements for regional South Australia.
The Cabinet Committee is chaired by the Hon. Geoffrey Brock, Minister for Regional Development and Minister for Local Government. Other members include:
• the Hon. Gail Gago, Minister for Employment, Higher Education and Skills and Minister for Science and Information Economy
• the Hon. Tom Koutsantonis, Treasurer, Minister for State Development, Minister for Mineral Resources and Energy
• the Hon. Leon Bignell, Minister for Agriculture, Food and Fisheries (Deputy Chair), Minister for Tourism, Minister for Forests
• the Hon. Stephen Mullighan, Minister for Transport and Infrastructure.
The Cabinet Committee will meet its objective by:
• having the lead responsibility for overseeing the portfolio deliverables in the agreements with the Independent Member for Frome to support a stable and effective government
• coordinating, reviewing and advising Cabinet on strategies to promote regional development within the state
• reviewing and prioritising proposed uses of the Jobs Accelerator Fund, in particular the additional $10 million to facilitate regional development
• providing strategic advice about the distribution of funds from the state government expanded Regional Development Fund
• ensuring that the government meets its election commitments within regional South Australia • developing the Regional Budget paper to allow communities to clearly identify the funding
provided to regional South Australia • ensuring that the development and implementation of the government’s regional development
strategies are effectively co-ordinated across portfolios and agencies whilst delivering on the commitments of the government
• identifying priority areas for influencing funding under the Commonwealth Government’s National Stronger Regions Fund and other Commonwealth Government funding programs available to regional areas
• considering any other related matters referred to it by Cabinet.
Chapter 8: Regional South Australia
120 2014–15 Budget Statement

Regions South Australia
To deliver on these agreements and commitments, Regions South Australia (Regions SA) has been established to support the Minister for Regional Development in the exercise of his portfolio responsibilities to provide a comprehensive focus on regions.
Regions SA will provide a clear, strategic focus to state government regional development activity and will provide regions with a strong voice in government.
Regions SA will provide an integrated cross-sector, cross-government and regionally focussed approach to policies, strategies and programs, ensuring government policy to promote improved economic and social outcomes for regions is developed with input from regional stakeholders.
Regional communities will also benefit from having a clear point of entry to government, while the government will be able to leverage Regions SA’s expertise to better engage with and deliver outcomes to regional communities.
Regions SA will have significant capabilities in terms of the development and implementation of regional development strategies, supporting increased economic activity in the regions, and maximising the collective impact of government activity in the regions.
Regional Statement for South Australia
The Regional Statement for South Australia was launched in December 2013. It is based around the four themes regional communities identified through consultation: a commitment to regions, working together, empowering regional communities, and aligning regional priorities.
The statement highlights to regional communities and to government agencies the linkages between government plans, strategies, programs and services.
The statement reaffirms the Government of South Australia’s commitment to regional areas by highlighting the importance of regional communities to the continuing economic development of the state. It also builds on South Australia’s Strategic Plan by working closely with relevant state agencies and key stakeholders.
South Australia’s Strategic Plan
South Australia’s Strategic Plan (SASP) sets down six objectives for strengthening South Australia economically, socially and environmentally — Growing Prosperity, Improving Wellbeing, Attaining Sustainability, Fostering Creativity, Building Communities and Expanding Opportunity.
The plan is for the whole of South Australia and invites collaboration and cooperation between governments, communities and business.
Examples of SASP targets that relate to regional South Australia include:
• target 4: tourism industry
• target 35: economic growth
• target 37: total exports
Chapter 8: Regional South Australia
2014–15 Budget Statement 121
• target 40: food industry
• target 46: regional population levels
• target 56: strategic infrastructure.
Regional development portfolio programs
Regional Impact Assessment Statements
The Regional Impact Assessment Policy and Guidelines were launched in July 2003 as part of a broader commitment to ensure that regional impacts and issues are considered in government decision making processes.
The Regional Impact Assessment Policy and Guidelines require government agencies to prepare a Regional Impact Assessment Statement (RIAS) for any significant change proposed in relation to services or infrastructure in regional areas.
Agency chief executives are responsible for ensuring there is a process in place to identify when a significant change is proposed that will trigger the preparation of a RIAS.
The statements are publicly available on Regions SA’s website, along with guides for Government of South Australia’s agencies on how to prepare their RIAS.
Regional Development Fund
The series of agreements between the Premier and the Independent Member for Frome include a funding increase of $13.4 million to enhance the Regional Development Fund to an annual expenditure program of $15 million per annum commencing in 2014–15.
The purpose of the fund is to drive economic growth and productivity by investing in regional infrastructure, creating jobs and new opportunities for regional South Australia.
The fund also supports the Government of South Australia’s commitment to regions outlined in the Regional Statement for South Australia and many of the opportunities identified in South Australia’s Strategic Plan.
The enhanced $15 million Regional Development Fund will be allocated over five programs.
• Regional Food Initiatives Program to support regionally-based food organisations to build a stronger regional food presence around South Australia.
• Small Grants Program to support new regional employment and investment opportunities linked with state government strategic priorities.
• Major Projects Program to support major economic projects designed to strengthen regional industries, support local economies and opportunities through investment in strategic projects.
• Community Infrastructure Program to support investment in regional communities to develop their economic infrastructure and grow their capabilities as a foundation for future jobs and economic growth.
• Country Cabinet Program to support communities that host Country Cabinet meetings for project proposals from communities that will assist the community meet its economic and social needs.
Chapter 8: Regional South Australia
122 2014–15 Budget Statement

Regional Communities Consultative Council
The Regional Communities Consultative Council was formed in 2002 as an independent advisory body to make recommendations to the Minister for Regional Development on ways the government and communities can work together to strengthen the capacity of communities to respond to current and emerging local issues and provide opportunities to maximise the competitive advantage of regional South Australia.
The responsibilities of the council are to:
• advise the Minister for Regional Development about the broader impact of decisions on regional communities
• advise the Minister for Regional Development of opportunities for initiatives to advance the social, economic and environmental development across regional South Australia
• advise the Minister for Regional Development on the opportunities and challenges in the provision of government programs and services to regional communities
• advise the Minister for Regional Development on regional communities access to information on government initiatives, programs and services being delivered to regional South Australia
• advise and advocate change within regional communities and within government that will improve the quality of life in regional areas
• through the Minister for Regional Development, advise state government ministers and Cabinet on matters that may be referred to the council by them from time to time.
Regional boundaries
Twelve uniform Government of South Australia regions are used by government agencies when undertaking planning, service delivery and reporting to enhance collaborative strategic planning between agencies.
Regional areas are those eight areas defined by the state government under non-Adelaide Metropolitan regional boundaries as the Greater Adelaide Area and Country Regions.
The Greater Adelaide area includes the regions of Adelaide Hills, Barossa Light and Lower North, and Fleurieu and Kangaroo Island.
Country regions include the regions of Eyre and Western, Far North, Limestone Coast, Murray and Mallee, and Yorke and Mid North.
The Adelaide Metropolitan area includes Eastern Adelaide, Northern Adelaide, Southern Adelaide, and Western Adelaide.
Regional economic conditions
Regional South Australia accounts for 29 per cent of the state’s population, produces more than half of our merchandise exports and contributes around $23 billion (25 per cent) of the Gross State Product.
Agriculture and mining are important contributors to regional economies. The 2013–14 winter crop production was the third highest on record. The value of mineral and petroleum production increased by 12 per cent in the 2013 calendar year.
Chapter 8: Regional South Australia
2014–15 Budget Statement 123

All eight non metropolitan regional areas of the state recorded growth in population during 2012–13.
Over the longer term, the regions are expected to continue to play a very important role in the economic development of the state. Asia’s growing middle class will boost demand for protein and high quality clean and green food, presenting opportunities for our agriculture and associated agribusiness sectors. This dynamic also presents opportunities for regional tourism players and service providers. South Australia’s unconventional gas and other mineral and energy resources continue to be in high demand.
Regional economic strategic priorities
Premium food and wine from our clean environment
The Government of South Australia has determined that food, wine and agriculture development is a strategic priority for the state.
After consultation with stakeholders, The Premium Food and Wine from our Clean Environment program was developed to provide the foundation for action taken by government and industry, both individually and collaboratively, within an integrated framework. The program has the following three themes.
Build Our Brand — seeks to improve recognition and sales of South Australian products in targeted markets locally, nationally and internationally. An important opportunity in building our brand is promoting South Australian quality and credentials to target markets where those features are valued and further developing our reputation for food, wine and tourism experiences. A particular opportunity is to meet the needs of the growing Asian middle class, to supply these markets with high-value products that meet emerging preferences for safe, high quality goods.
Grow Our Capability — drives efforts to support the overall growth and development of South Australia’s agriculture sector. It recognises that to achieve improved competitiveness it is important to increase the capability of businesses and the workforce, and to increase their access to research, technology and services. Business confidence should be further improved by streamlined government processes and support for public and private investment and infrastructure development. There is a focus on helping the agriculture sector transition from competing primarily on cost to a model that competes on value and an emotional attachment with the marketplace, as well as capturing new or increased revenue through higher value adding activities.
Secure Production — reaffirms the commitment to respond effectively to the major risks to future food and wine production. This includes environmental factors such as climate change and maintaining appropriate biosecurity and food safety standards. Initiatives encourage the productive and efficient use of natural resources through the implementation of industry programs designed to increase productivity and efficiency. It also recognises that it is vital that standards set are appropriate, and are being complied with, in order to improve market confidence, maintain and grow market access and provide a competitive point of difference.
South Australia’s food and wine industries alone generated more than $16.3 billion in gross food and wine revenue in 2012–13. Agricultural production to farm gate together with associated manufacturing, food service and retail in total contributes up to 12 per cent of South Australia’s economy and around one in five South Australian jobs. The contribution of the agriculture, forestry and fisheries industries to regional economies is very significant. In 2011–12, they directly contributed around 20 per cent to the economies of South Australia’s regions.
Chapter 8: Regional South Australia
124 2014–15 Budget Statement

A comparison of the change in the value of output for selected agricultural commodities between 2011–12 and 2012–13 is provided in table 8.1.
Table 8.1: Gross Value of Production (Selected commodities) 2011–12 and 2012–13
2011–12 $m
2012–13 $m
Field Crops(a) 1 945 2 220 Livestock(a) 1 915 1 697 Dairy(a) 234 205 Horticulture(a) 917 1 065 Wine grapes(a)(b) 356 435 Minerals(c) 5 406 4 835 Petroleum(c) 1 135 1 311
(a) Source: Australian Bureau of Statistics (ABS) Catalogue 7503.0 ‘Value of Agricultural Commodities Produced’ 2011–12 and 2012–13, Gross Value of Production.
(b) In 2011–12, the ABS did not report wine grapes separately from total grapes. The total in 2011–12 of 356 includes dried grapes, for example, sultanas, raisins etc. Note that in 2010–11, the dried component only accounted for around 1.5 per cent of the total and there was no significant growth in dried grape activity in 2011–12.
(c) Source: Minerals and Energy Group, Department of Manufacturing, Innovation, Trade, Resources and Energy.
In 2012–13 there were moderate gains in the gross value of production for grain and horticulture, but declines in livestock and dairy. There was also an increase in the gross value of wine grape production as a result of increases in both the volume of production and farm gate prices. This follows on from one of the most uncertain periods in history that the South Australian wine industry has recently experienced and is due to a combination of factors, including the significant structural oversupply of grapes and wine, global market volatility, increased competition, low water allocations, and discounting in international and domestic markets. After several years of declining values, there are some signs of a slight turnaround.
The outlook for the 2013–14 season looks promising with South Australia’s grain crop confirmed at 8.5 million tonnes, the third largest on record. This represents an increase of 28 per cent on the 2012–13 grain crop. The largest grain crop on record of 10.3 million tonnes occurred in the 2010–11 season.
According to the Australian Bureau of Agricultural and Resource Economics and Sciences (ABARES) March quarter 2014 edition of Agricultural Commodities South Australian broadacre farm cash incomes are projected to increase to average $231 000 per farm in 2013–14, around 85 per cent above the 10-year average to 2012–13. This is the highest average farm cash income recorded for South Australian broadacre farms in the 37 years the ABARES Australian Agricultural and Grazing Industries Survey (AAGIS) has operated.
A 30 per cent increase in winter crop production and higher sheep and lamb prices has resulted in projected average farm cash income and business profit increasing in all South Australian regions, with the largest increase expected in the Eyre Peninsula. Drier seasonal conditions in the Northern Pastoral region have resulted in increased cattle turn-off and farm receipts.
Overall, crop receipts in 2013–14 are projected to increase by around 24 per cent, sheep and lamb receipts by 9 per cent and beef cattle receipts by 4 per cent. Wool receipts are also expected to be higher.
Chapter 8: Regional South Australia
2014–15 Budget Statement 125
Realising the benefits of the mining boom for all
The mining sector has performed strongly in recent years, with high levels of exploration activity leading to a number of new mines coming on stream and higher levels of production converting into higher levels of exports. A number of new mines are also in advanced stages of planning.
The mining sector has been a key priority area for the Government of South Australia for some time. A significant proportion of mining activity occurs in the regions and the Government of South Australia is committed to ensuring that all South Australians benefit from the uplift in their economic activity. A significant part of these benefits includes the provision of new infrastructure, which while benefitting the mining sector, can also have spill-over benefits for agriculture.
Pre-exploration data provision such as the Plan for Accelerating Exploration (PACE) 2020 Program, a streamlined and case management oriented regulatory process, and infrastructure mapping and development are all activities that are contributing to delivering the benefits of mining to the state.
The establishment of a future fund, announced last year, which will receive a share of royalties as contributions, will ensure that the benefit of the state’s natural resources is shared not only by current South Australians but also with future generations.
Global and domestic demand for South Australian resources remains high and minerals and petroleum production continues to grow, achieving a combined value of $6.2 billion in 2012–13 (see table 8.1). More recently, record production of $7.0 billion was achieved in the 2013 calendar year with minerals and petroleum sectors recording production values of $5.4 billion and $1.6 billion respectively.
Continued growth in production of South Australia’s mineral commodities and petroleum is the result of ongoing steady production at the state’s major mines and significant increases in the state’s production of iron ore, and growth in oil and gas production from the Cooper–Eromanga basins.
To sustain growth in mineral and petroleum resource production over the longer term, South Australia maintains more than 900 exploration licences and 30 developing projects in various stages of exploration, resource definition, feasibility or assessment.
Growing advanced manufacturing
Manufacturing is an important industry sector for the regions. Manufacturing innovation has the potential to transform regional economies by diversifying the industry base. In a direct way, the regions account for 28 per cent of the state’s manufacturing gross value add, compared to 25 per cent of overall gross regional product in 2011–12.
Indirectly the sector is also important for supporting a critical mass of business and engineering services that are important for continuing development of our regional growth opportunities. Projects like the cellulose fibre chain study have supported the growing advanced manufacturing agenda by identifying new opportunities for the timber and forestry industries in the Limestone Coast.
Population and unemployment
The estimated resident population of South Australia’s non-metropolitan regions (based on the government’s common regional boundaries) was 483 100 persons as at 30 June 2013. Non-metropolitan regional population increased by 2700 persons or 0.6 per cent from a year earlier and accounted for 29 per cent of the total population of the state, which was 1.7 million.
Chapter 8: Regional South Australia
126 2014–15 Budget Statement
All non-metropolitan regions recorded population growth during 2012–13, with the Fleurieu and Kangaroo Island region recording the highest percentage growth over the year to 30 June 2013 at 1.3 per cent, followed by Barossa, Light and Lower North at 1.1 per cent. The slowest population growth was recorded in the regions of Limestone Coast, Eyre and Western, and Murray and Mallee, which all increased by 0.2 per cent.
The estimated resident population of the Outer Adelaide Area was 186 800 at 30 June 2013, 1800 persons or 1.0 per cent higher than a year earlier. The Adelaide Metropolitan Area had an estimated resident population of 1.2 million, 12 100 persons or 1.0 per cent higher than a year earlier.
According to the Commonwealth Department of Employment, during 2013 the unemployment rate for South Australia’s nonmetropolitan regions averaged 5.8 per cent and the Adelaide Metropolitan Area unemployment rate averaged 6.5 per cent. During 2013, the average unemployment rate was lowest in the Adelaide Hills region (3.7 per cent) and highest in the Far North region (7.8 per cent) as shown in table 8.2.
Table 8.2: Regional population and labour force data(a)
Adelaide Metropolitan
Area
Outer(b)
Adelaide Area
Yorke and Mid North
Region
Murray and
Mallee Region
Limestone Coast
Region
Eyre and Western
Region
Far North
Region Estimated resident population(c) ($000) 1 187.8 186.8 74.9 69.0 64.7 58.2 29.5 Unemployment(d) (‘000) 40.1 4.8 2.0 2.8 2.0 1.7 1.1 Unemployment rate(d) (%) 6.5 5.0 5.6 7.5 5.4 5.9 7.8
Source: ABS Catalogue no. 3218.0; Commonwealth Department of Employment.
(a) Regional classifications are in accordance with Government of South Australia common regional boundaries.
(b) Outer Adelaide includes the three regions of Adelaide Hills, Barossa, Light and Lower North, and Fleurieu and Kangaroo Island.
(c) Estimated resident population is at the end of June 2013.
(d) Unemployment and unemployment rate estimates are averages for 2013.
Regional economic profile
The economic contribution of South Australia’s non metropolitan regions was $23 billion in 2011–12. This accounted for 25 per cent of the state’s gross state product, which was $92.0 billion.
Growth in nominal Gross Regional Product in non-metropolitan regions has expanded significantly compared with five years earlier, rising at an annualised rate of 6.8 per cent per annum in nominal terms. Much of this growth is attributable to growth in agriculture in the Yorke and Mid North, Limestone Coast and Murray and Mallee regions, reflecting better farm conditions and, the mining industry in the Far North reflecting the expansion of mining capacity including the opening of new mines, which have boosted production.
All non-metropolitan regions recorded growth in nominal Gross Regional Product (GRP) in the five years to 2011–12. The Far North region recorded the highest average annual percentage growth in nominal terms over the period, rising by 9.8 per cent per annum, followed by Yorke and Mid North (up 8.2 per cent per annum), Eyre and Western (up 6.3 per cent per annum), the Limestone Coast (up 5.1 per cent per annum) and Murray and Mallee (up 4.5 per cent per annum) as shown in table 8.3.
The value of nominal Gross Regional Product in the Outer Adelaide area was $6.3 billion in 2011–12. This represented 6.9 per cent of the state’s Gross State Product and was up by an annualised rate of 4.3 per cent in nominal terms compared with five years earlier.
Chapter 8: Regional South Australia
2014–15 Budget Statement 127
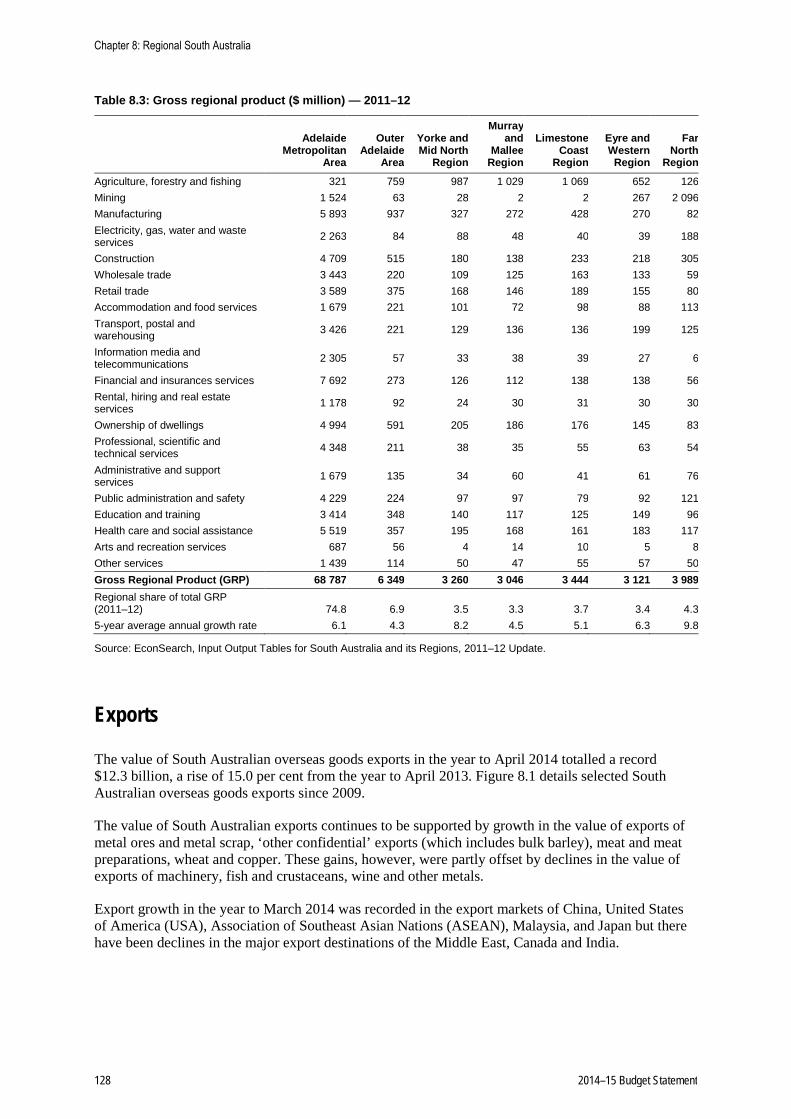
Table 8.3: Gross regional product ($ million) — 2011–12
Adelaide Metropolitan
Area
Outer
Adelaide Area
Yorke and Mid North
Region
Murray and
Mallee Region
Limestone Coast
Region
Eyre and Western
Region
Far North
Region
Agriculture, forestry and fishing 321 759 987 1 029 1 069 652 126 Mining 1 524 63 28 2 2 267 2 096 Manufacturing 5 893 937 327 272 428 270 82 Electricity, gas, water and waste services 2 263 84 88 48 40 39 188
Construction 4 709 515 180 138 233 218 305 Wholesale trade 3 443 220 109 125 163 133 59 Retail trade 3 589 375 168 146 189 155 80 Accommodation and food services 1 679 221 101 72 98 88 113 Transport, postal and warehousing 3 426 221 129 136 136 199 125
Information media and telecommunications 2 305 57 33 38 39 27 6
Financial and insurances services 7 692 273 126 112 138 138 56 Rental, hiring and real estate services 1 178 92 24 30 31 30 30
Ownership of dwellings 4 994 591 205 186 176 145 83 Professional, scientific and technical services 4 348 211 38 35 55 63 54
Administrative and support services 1 679 135 34 60 41 61 76
Public administration and safety 4 229 224 97 97 79 92 121 Education and training 3 414 348 140 117 125 149 96 Health care and social assistance 5 519 357 195 168 161 183 117 Arts and recreation services 687 56 4 14 10 5 8 Other services 1 439 114 50 47 55 57 50 Gross Regional Product (GRP) 68 787 6 349 3 260 3 046 3 444 3 121 3 989 Regional share of total GRP (2011–12) 74.8 6.9 3.5 3.3 3.7 3.4 4.3 5-year average annual growth rate 6.1 4.3 8.2 4.5 5.1 6.3 9.8
Source: EconSearch, Input Output Tables for South Australia and its Regions, 2011–12 Update.
Exports
The value of South Australian overseas goods exports in the year to April 2014 totalled a record $12.3 billion, a rise of 15.0 per cent from the year to April 2013. Figure 8.1 details selected South Australian overseas goods exports since 2009.
The value of South Australian exports continues to be supported by growth in the value of exports of metal ores and metal scrap, ‘other confidential’ exports (which includes bulk barley), meat and meat preparations, wheat and copper. These gains, however, were partly offset by declines in the value of exports of machinery, fish and crustaceans, wine and other metals.
Export growth in the year to March 2014 was recorded in the export markets of China, United States of America (USA), Association of Southeast Asian Nations (ASEAN), Malaysia, and Japan but there have been declines in the major export destinations of the Middle East, Canada and India.
Chapter 8: Regional South Australia
128 2014–15 Budget Statement

Figure 8.1: Selected South Australian overseas goods exports ($ billion per annum)
0.0
0.5
1.0
1.5
2.0
2.5
3.0
Apr-09 Apr-10 Apr-11 Apr-12 Apr-13 Apr-14
Ann
ual o
vers
eas
good
s ex
ports
($ b
illion
)
Meat and meat preparations Metal ores and metal scrap Wheat
Vegetables and fruit Wine Copper
Source: Australian Bureau of Statistics (ABS) Cat No. 5368.0.
2014–15 Budget —New Initiatives
The 2014–15 Budget includes a number of new initiatives that are specific to regional areas as set out in table 8.4. This includes the Regional Development Australia initiative which increases funding available to communities across regional South Australia from $1.4 million per annum to $3.0 million per annum. More details on each initiative are provided in the Budget Measures Statement.
A number of other budget initiatives could provide service benefits across the state, including to residents of regional areas.
Chapter 8: Regional South Australia
2014–15 Budget Statement 129

Table 8.4: 2014–15 General government regional new initiatives ($000s)
2013–14 Estimate
2014–15 Budget
2015–16 Budget
2016–17 Budget
2017–18 Budget
Communities and Social Inclusion Port Pirie RSL — 'Huey' Helicopter display
Operating initiatives -200 — — — —
Total — operating initiatives -200 — — — —
Emergency Services — Country Fire Service Thermal imaging cameras
Operating initiatives — -120 — — — Bushfire Response
Operating initiatives -7 500 — — — —
Total — operating initiatives -7 500 -120 — — —
Emergency Services — South Australian Fire and Emergency Services Commission
Natural Disaster Resilience Program National Partnership
Operating initiatives — -1 129 — — —
Total — operating initiatives — -1 129 — — —
Environment, Water and Natural Resources Enhanced monitoring programs for marine parks
Operating initiatives — -1 000 -1 000 -1 000 -1 000 Establishment of an artificial reef
Operating initiatives — -600 — — —
Marine Parks — regional support grants for improved recreational fishing
Operating initiatives — -750 -750 -750 — New recreational fishing opportunities
Operating initiatives — -200 -200 — —
Reduce NRM Board Funding
Operating savings — 1 000 1 000 1 000 1 000 Kangaroo Island multi-day walk
Operating initiatives — -200 -200 -605 -266 Revenue offsets — — — 205 266 Investing initiatives — -1 050 -1 050 — — Asset sales — — — 2 900 —
Total — operating initiatives — -2 750 -2 150 -2 355 -1 266
Total — operating savings — 1 000 1 000 1 000 1 000
Total — revenue offsets — — — 205 266
Total — investing initiatives — -1 050 -1 050 — —
Total — asset sales — — — 2 900 —
Health and Ageing Country Health SA hubs
Operating initiatives — -1 300 -67 -71 -75 Investing initiatives — -2 200 — — —
Regional dialysis services — Gawler Operating initiatives — -1 383 -2 018 -2 060 -2 102
Investing initiatives — -2 909 — — —
Chapter 8: Regional South Australia
130 2014–15 Budget Statement

2013–14 Estimate
2014–15 Budget
2015–16 Budget
2016–17 Budget
2017–18 Budget
Nyrstar Port Pirie smelter transformation — Targeted Lead Abatement Program
Operating initiatives — -454 -310 -317 -323 Revenue offsets — 454 310 317 323
Patient Assistance Transport Scheme Operating initiatives — -1 600 -2 755 -2 461 -2 519
Project Agreement on Improving Trachoma Control for Indigenous Australians
Operating initiatives -934 -952 -971 -990 — Revenue offsets 934 952 971 990 —
Total — operating initiatives -934 -5 689 -6 121 -5 899 -5 019
Total — revenue offsets 934 1 406 1 281 1 307 323
Total — investing initiatives — -5 109 — — —
Planning, Transport and Infrastructure Rural Road Safety Program
Investing initiatives — -8 560 -8 774 -8 993 -9 218 South Eastern Freeway — Mount Barker Interchange
Investing initiatives — -6 000 -21 000 — — Commissioner for Kangaroo Island
Operating initiatives -1 470 -994 -1 019 -1 045 -1 071 Point-to-point speed cameras
Investing initiatives -132 -3 750 — — — Regional public transport services
Operating initiatives -312 -652 -806 -909 -998
Total — operating initiatives -1 782 -1 646 -1 825 -1 954 -2 069
Total — investing initiatives -132 -18 310 -29 774 -8 993 -9 218
Premier and Cabinet Motorsport Park at Tailem Bend
Operating initiatives — -7 500 — — —
Total — operating initiatives — -7 500 — — —
Primary Industries and Regions Agribusiness Accelerator Program
Operating initiatives — -1 900 -2 300 -1 050 -750 Jobs Accelerator Fund
Operating initiatives — -10 000 — — — Premium free range food
Operating initiatives — -450 -300 -350 -400 Regional Development Australia
Operating initiatives — -1 600 -1 600 -1 600 -1 600 Regional Development Fund
Operating initiatives — -13 400 -13 400 -13 400 -13 400 Supporting brands of our key regions
Operating initiatives — -250 -250 — — Farm Finance Concessional Loan Scheme
Operating initiatives -1 170 -2 239 -2 097 -2 289 -2 370 Revenue offsets 1 475 2 364 2 047 2 239 2 250
Total — operating initiatives -1 170 -29 839 -19 947 -18 689 -18 520
Total — revenue offsets 1 475 2 364 2 047 2 239 2 250
Chapter 8: Regional South Australia
2014–15 Budget Statement 131
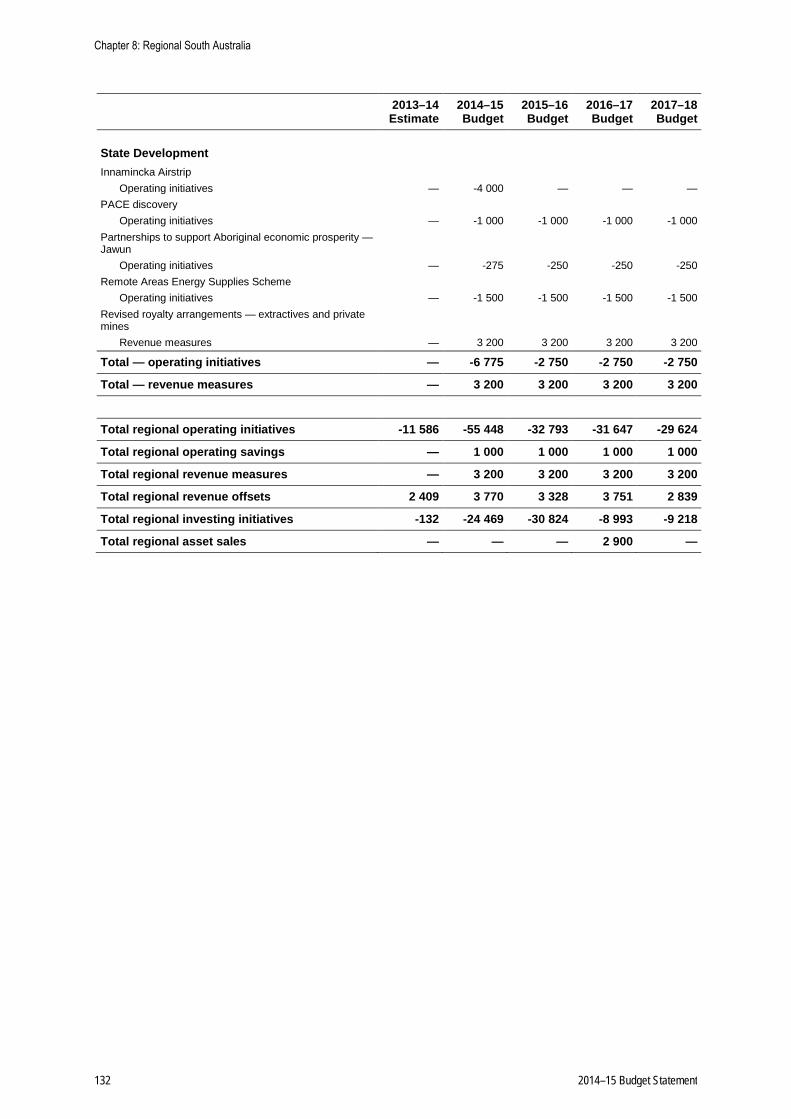
2013–14 Estimate
2014–15 Budget
2015–16 Budget
2016–17 Budget
2017–18 Budget
State Development Innamincka Airstrip
Operating initiatives — -4 000 — — — PACE discovery
Operating initiatives — -1 000 -1 000 -1 000 -1 000 Partnerships to support Aboriginal economic prosperity — Jawun
Operating initiatives — -275 -250 -250 -250 Remote Areas Energy Supplies Scheme
Operating initiatives — -1 500 -1 500 -1 500 -1 500 Revised royalty arrangements — extractives and private mines
Revenue measures — 3 200 3 200 3 200 3 200
Total — operating initiatives — -6 775 -2 750 -2 750 -2 750
Total — revenue measures — 3 200 3 200 3 200 3 200
Total regional operating initiatives -11 586 -55 448 -32 793 -31 647 -29 624
Total regional operating savings — 1 000 1 000 1 000 1 000
Total regional revenue measures — 3 200 3 200 3 200 3 200
Total regional revenue offsets 2 409 3 770 3 328 3 751 2 839
Total regional investing initiatives -132 -24 469 -30 824 -8 993 -9 218
Total regional asset sales — — — 2 900 —
Chapter 8: Regional South Australia
132 2014–15 Budget Statement

Regional Capital Projects
The 2014–15 Budget includes a number of capital investment projects that are specific to regional areas as set out in table 8.5. More details on these projects are provided in the Capital Investment Statement.
Table 8.5: 2014–15 Government regional capital investment program ($000s)
Expected completion
Proposed expenditure
2014–15
Estimated total cost
General Government
Correctional Services Major Projects
Mobilong Security System Upgrade Jun Qtr 2015 9 000 10 142 Port Lincoln Prison — Additional Accommodation Jun Qtr 2015 5 000 5 000 Mount Gambier Prison Expansion Sept Qtr 2015 17 470 25 419
Total — Correctional Services 31 470 40 561
Education and Child Development Major Projects
Cleve Area School Mar Qtr 2015 3 158 4 300 Eastern Fleurieu R–12 School Jun Qtr 2015 6 250 9 250 Keith Area School Jun Qtr 2014 100 3 800 Nairne Primary School Stage 2 Sep Qtr 2013 51 2 118 Yalata Anangu School Dec Qtr 2014 550 2 010
Total — Education and Child Development 10 109 21 478
Emergency Services Major Projects
Breathing Apparatus Set Replacement Jun Qtr 2015 2 026 2 026 Emergency Information Warning System n.a. 2 950 4 079 SES Whyalla Unit-Redevelopment of Accommodation Jun Qtr 2015 150 1 300
Annual Programs
Capital Works and Rescue Equipment — SES n.a. 2 917 n.a. Capital Works, Vehicles and Equipment — CFS n.a. 12 328 n.a. Replacement of SA Government Radio Network (GRN) radios n.a. 2 236 n.a. SES Light Vehicle Fleet n.a. 256 n.a.
Total — Emergency Services 22 863 7 405
Environment, Water and Natural Resources
Major Projects Heysen Trail — Realignment and Further Development Jun Qtr 2015 1 100 1 100 Kangaroo Island Multi-Day Walk Jun Qtr 2016 2 250 4 600 Riverine Recovery Jun Qtr 2016 15 240 24 771 Seal Bay Conservation Park Facilities Upgrade Dec Qtr 2014 565 2 714
Annual Programs Fire Management on Public Land — Enhanced Capabilities n.a. 1 036 n.a. Small Programs — DEWNR Administered Items n.a. 4 n.a.
Chapter 8: Regional South Australia
2014–15 Budget Statement 133

Expected completion
Proposed expenditure
2014–15
Estimated total cost
South East Drainage System — Maintenance n.a. 1 599 n.a. South Eastern Water Conservation & Drain Board n.a. 427 n.a.
Total — Environment, Water and Natural Resources 22 221 33 185
Health and Ageing
Major Projects Berri Hospital Redevelopment Dec Qtr 2014 500 36 000 Country Health SA Hubs (Mt Gambier & Whyalla) Jun Qtr 2015 2 200 2 200 Mount Gambier Health Service Redevelopment Jun Qtr 2015 6 760 26 714 Murray Bridge Community Dental Clinic Jun Qtr 2015 574 3 798 Port Lincoln Health Service Redevelopment Dec Qtr 2015 10 000 39 200 Regional Cancer Services — Expansion of Services Mar Qtr 2015 3 480 16 500 South Coast Primary Health Care Jun Qtr 2015 7 205 10 000 Whyalla Hospital Redevelopment Dec Qtr 2014 1 000 68 286
Annual Programs Volunteer Ambulance Stations n.a. 2 263 n.a.
Total — Health and Ageing 33 982 202 698
Planning, Transport and Infrastructure
Major Projects Adelaide Hills Priority Program Jun Qtr 2016 2 000 9 000 Adelaide to Melbourne Road Corridor Jun Qtr 2015 350 100 000 Anangu Pitjantjatjara Yankunytjatjara Lands — Transport Upgrades Jun Qtr 2019 6 000 106 000 Managed Motorways on the South Eastern Freeway Jun Qtr 2016 470 8 870 Marine Safety Jun Qtr 2018 1 335 14 726 Motorcycling Safety Program Jun Qtr 2015 1 400 1 400 Port Bonython Jetty Refurbishment Jun Qtr 2015 8 245 23 900 River Murray Ferries — Replacement Jun Qtr 2016 2 723 6 130 Rural Freight Improvement Program Jun Qtr 2018 16 594 70 514 Rural Point-to-Point Safety Cameras Jun Qtr 2015 3 750 7 198 Rural Road Safety Program Jun Qtr 2018 8 560 76 221 Shoulder Sealing Jun Qtr 2015 1 641 41 704 Strategic Route Reviews — Victor Harbor Road, Main South Road, Pt Augusta to Port Wakefield Road Jun Qtr 2015 19 800 20 000
Victor Harbor Road/Main Road McLaren Vale — Overpass Jun Qtr 2015 2 695 18 000
Annual Programs Fishing Industries Facilities n.a. 499 n.a. Rural and Remote n.a. 11 273 n.a.
Total — Planning, Transport and Infrastructure 87 335 503 663
Primary Industries and Regions
Major Projects Loxton Research Centre Redevelopment Jun Qtr 2016 700 6 700 Sterile Insect Technology Facility Jun Qtr 2015 2 860 3 000
Annual Programs Minor Capital Works and Equipment n.a. 3 810 n.a.
Total — Primary Industries and Regions 7 370 9 700
Chapter 8: Regional South Australia
134 2014–15 Budget Statement
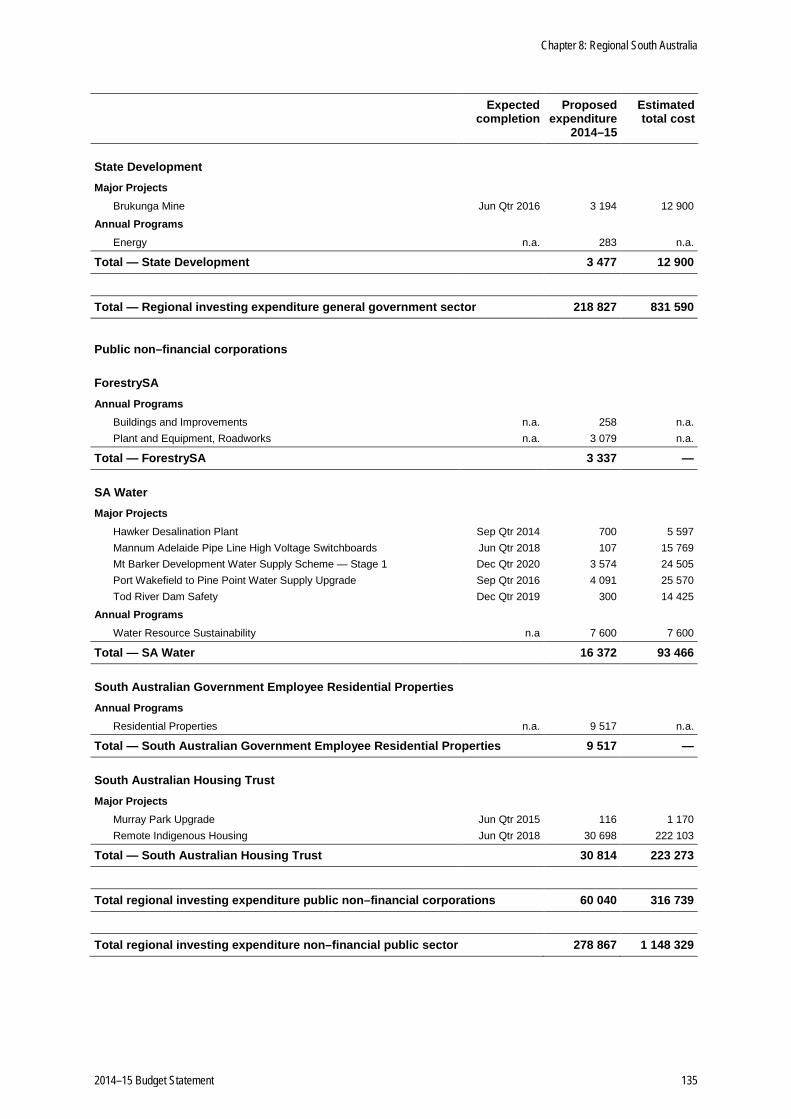
Expected completion
Proposed expenditure
2014–15
Estimated total cost
State Development
Major Projects Brukunga Mine Jun Qtr 2016 3 194 12 900
Annual Programs Energy n.a. 283 n.a.
Total — State Development 3 477 12 900
Total — Regional investing expenditure general government sector 218 827 831 590
Public non–financial corporations
ForestrySA
Annual Programs Buildings and Improvements n.a. 258 n.a. Plant and Equipment, Roadworks n.a. 3 079 n.a.
Total — ForestrySA 3 337 —
SA Water
Major Projects Hawker Desalination Plant Sep Qtr 2014 700 5 597 Mannum Adelaide Pipe Line High Voltage Switchboards Jun Qtr 2018 107 15 769 Mt Barker Development Water Supply Scheme — Stage 1 Dec Qtr 2020 3 574 24 505 Port Wakefield to Pine Point Water Supply Upgrade Sep Qtr 2016 4 091 25 570 Tod River Dam Safety Dec Qtr 2019 300 14 425
Annual Programs Water Resource Sustainability n.a 7 600 7 600
Total — SA Water 16 372 93 466
South Australian Government Employee Residential Properties
Annual Programs Residential Properties n.a. 9 517 n.a.
Total — South Australian Government Employee Residential Properties 9 517 —
South Australian Housing Trust
Major Projects Murray Park Upgrade Jun Qtr 2015 116 1 170 Remote Indigenous Housing Jun Qtr 2018 30 698 222 103
Total — South Australian Housing Trust 30 814 223 273
Total regional investing expenditure public non–financial corporations 60 040 316 739
Total regional investing expenditure non–financial public sector 278 867 1 148 329
Chapter 8: Regional South Australia
2014–15 Budget Statement 135

Chapter 8: Regional South Australia
136 2014–15 Budget Statement
Appendix A: Uniform presentation framework
Overview
By agreement between the Commonwealth Government and the states and territories, each jurisdiction presents financial information on a uniform presentation framework (UPF) basis presented in their budget papers, mid-year budget update and budget outcome reporting. The tables in this appendix present budget information for South Australia on the UPF basis, reflecting the fiscal measures and scope outlined below.
The primary objective of the UPF is to ensure that the Commonwealth Government and state and territory governments provide a common ‘core’ of financial information in their budget papers to enable direct comparisons of each government’s budget and financial results.
The Australian System of Government Finance Statistics: Concepts, Sources and Methods, published by the Australian Bureau of Statistics (ABS), requires that provisions for doubtful debts be excluded from the balance sheet. Consistent with the Commonwealth Government’s methodology, South Australia has not adopted this treatment in the UPF reports because excluding such provisions would overstate the value of assets in the balance sheet (and would therefore be inconsistent with the market valuation principle).
Accrual Government Financial Statistics (GFS) fiscal measures
The key measures in the GFS accrual framework are GFS net operating balance, GFS net lending, cash surplus, net debt, net worth, change in net worth, net financial worth and net financial liabilities.
GFS net operating balance
The GFS net operating balance, or operating result, is the excess of revenue from transactions over expenses from transactions. The net operating balance excludes expenditure on the acquisition of capital assets, but includes non-cash costs such as accruing superannuation entitlements and the consumption of capital (depreciation).
Net operating balance can also be defined as the change in net worth less the effects of revaluation of financial assets and liabilities.
GFS net lending
GFS net lending (sometimes referred to as fiscal balance) measures a government’s investment-saving balance.
Net lending (which is recorded in the operating statement) differs from the net operating balance in the treatment of capital expenditure. Unlike the net operating balance, net lending includes net capital expenditure, but not the use of capital (depreciation).
Net lending is the accrual counterpart of the GFS cash surplus in the cash flow statement. However, the two measures are unlikely to coincide because of the differences arising when transactions are recorded in cash and accrual terms.
2014–15 Budget Statement 137

GFS cash surplus
The GFS cash surplus/deficit is a flow measure reported in the cash flow statement.
The GFS cash surplus has four components:
• net cash received from operating activities — comprising tax revenue plus grants and subsidies received plus revenue from sales of goods and services, less payments for goods and services, interest costs, and grants and subsidies paid
• net cash inflow from sales and purchases of non-financial assets
• the level of distributions paid — in the case of public non-financial corporations and public financial corporations
• the recognition of the initial increase in liability accruing at the beginning of finance leases and similar arrangements.
Net debt
Net debt comprises the stock of selected gross financial liabilities less financial assets.
Net debt is reported in the balance sheet and is the sum of deposits held, advances received and borrowing, minus the sum of cash and deposits, advances paid, and investments, loans and placements.
Net worth
Net worth is calculated as total assets (both financial and non-financial) minus total liabilities. Net worth incorporates a government’s non-financial assets, such as land and other fixed assets, which may be sold and used to repay debt, as well as certain financial assets and liabilities not captured by the net debt measure, most notably accrued employee superannuation liabilities, debtors and creditors.
The net worth measure is reported in the balance sheet.
Change in net worth
Change in net worth measures the variation in net worth (as described above), and is the most inclusive measure of the change in a government’s financial position over a given period.
Net financial worth
Net financial worth measures a government’s net holdings of financial assets. It is calculated from the balance sheet as financial assets minus liabilities.
Net financial liabilities
Net financial liabilities comprises total liabilities less financial assets (net financial worth), but excludes equity investments (net worth) in the other sectors of the jurisdiction.
Net financial liabilities is a broader measure than net debt as it includes substantial non-debt liabilities such as accrued superannuation and long service leave entitlements. Excluding the net worth of other sectors of government from net financial worth results in a purer measure of financial worth than net financial worth, as, in general, the net worth of other sectors of government, in particular the public non-financial corporations sector, is backed by physical assets.
Appendix A: Uniform presentation framework
138 2014–15 Budget Statement

Scope
The UPF divides the Australian public sector into three institutional sub-sectors — the general government sector, the public non-financial corporations (PNFC) sector and the public financial corporations (PFC) sector.
General government comprises all government departments, offices and other bodies engaged in providing services free of charge or at prices significantly below their cost of production.
PNFCs are bodies mainly engaged in the production of goods and services of a non-financial nature for sale in the marketplace at prices that aim to recover most of the costs involved. This sector includes some trading enterprises, such as SA Water and the South Australian Housing Trust (SAHT). In general, PNFCs are legally distinguishable from the governments that own them.
PFCs are bodies primarily engaged in providing financial intermediation services or auxiliary financial services. Generally, they are able to transact in financial liabilities on their own account.
A listing of government entities within each sector is included in Appendix D.
Budget reporting
Under the UPF agreement, all governments are required to present as part of their budget documentation an operating statement, balance sheet and cash flow statement for the general government sector, PNFC sector and the non-financial public sector. The non-financial public sector is the consolidation of the general government sector and the PNFC sectors. In addition, information is also presented on taxes, general government sector expenses by function and Loan Council Allocations.
This information is presented in tables A.1 through to A.20 in this appendix.
Reporting of outcomes
Outcomes are presented in final budget outcome documents. In addition to the tables presented at budget time, outcome reporting also contains the accrual financial statements for the PFC sector.
Appendix A: Uniform presentation framework
2014–15 Budget Statement 139

Table A.1: General government sector operating statement ($million)________________________________________________________________________________________________________________________________________________________________________________________________________________
2013–14Estimated
Result2014–15Budget
2015–16Estimate
2016–17Estimate
2017–18Estimate
RevenueTaxation revenue 4 121 4 524 4 795 5 020 5 236Grants 7 855 8 270 9 064 9 620 9 867Sales of goods and services 2 199 2 282 2 353 2 441 2 513Interest income 33 32 35 37 39Dividend and income tax equivalent income 375 256 298 261 271Other 673 704 713 711 732
Total revenue 15 254 16 067 17 258 18 090 18 659
lessExpensesEmployee expenses 7 258 7 268 7 271 7 347 7 554Superannuation expenses Superannuation interest cost 468 443 436 429 420 Other superannuation expenses 781 796 798 807 820Depreciation and amortisation 864 927 990 1 065 1 084Interest expenses 304 232 319 465 462Other property expenses — — — — —Other operating expenses 4 210 4 254 4 396 4 470 4 579Grants 2 601 2 626 2 642 2 732 2 858
Total expenses 16 487 16 547 16 852 17 315 17 776
equals
Net operating balance -1 232 -479 406 776 883
plusOther economic flows 1 077 395 474 564 630
equals
Comprehensive result - total change in net worth -155 -84 880 1 340 1 513
Net operating balance -1 232 -479 406 776 883
lessNet acquisition of non-financial assetsPurchases of non-financial assets 1 567 1 217 4 067 1 125 1 374less Sales of non-financial assets 127 389 84 99 25less Depreciation 864 927 990 1 065 1 084plus Change in inventories — — — — —plus Other movements in non-financial assets — — — — —
equals Total net acquisition of non-financial assets 576 -99 2 993 -39 266
equals
Net lending/borrowing -1 808 -380 -2 587 814 617
Note: Totals may not add due to rounding.
Appendix A: Uniform presentation framework
140 2014–15 Budget Statement

Table A.2: Public non-financial corporations (public trading enterprises) sectoroperating statement ($million)________________________________________________________________________________________________________________________________________________________________________________________________________________
2013–14Estimated
Result2014–15Budget
2015–16Estimate
2016–17Estimate
2017–18Estimate
RevenueTaxation revenue — — — — —Grants 457 445 434 473 547Sales of goods and services 1 667 1 805 1 797 1 852 1 895Interest income 14 6 6 6 6Dividend and income tax equivalent income 4 4 4 4 4Other 169 159 200 179 184
Total revenue 2 311 2 420 2 440 2 514 2 635
lessExpensesEmployee expenses 193 200 203 207 214Superannuation expenses Superannuation interest cost — — — — — Other superannuation expenses 24 25 27 27 28Depreciation and amortisation 429 439 451 464 487Interest expenses 220 328 331 347 354Other property expenses 300 222 274 237 247Other operating expenses 1 226 1 273 1 256 1 303 1 322Grants 144 140 78 77 80
Total expenses 2 535 2 627 2 620 2 663 2 733
equals
Net operating balance -224 -207 -180 -149 -97
plusOther economic flows 576 -2 100 608 616 637
equals
Comprehensive result - total change in net worth 351 -2 307 428 467 540
Net operating balance -224 -207 -180 -149 -97
lessNet acquisition of non-financial assetsPurchases of non-financial assets 653 658 575 594 514less Sales of non-financial assets 218 194 143 133 62less Depreciation 429 439 451 464 487plus Change in inventories 61 47 -3 -26 -10plus Other movements in non-financial assets — — — — —
equals Total net acquisition of non-financial assets 67 73 -23 -30 -45
equals
Net lending/borrowing -292 -280 -158 -119 -53
Note: Totals may not add due to rounding.
Appendix A: Uniform presentation framework
2014–15 Budget Statement 141

Table A.3: Non-financial public sector operating statement ($million)________________________________________________________________________________________________________________________________________________________________________________________________________________
2013–14Estimated
Result2014–15Budget
2015–16Estimate
2016–17Estimate
2017–18Estimate
RevenueTaxation revenue 3 841 4 210 4 471 4 684 4 892Grants 7 856 8 270 9 064 9 620 9 868Sales of goods and services 3 678 3 903 3 961 4 097 4 208Interest income 36 32 35 37 39Dividend and income tax equivalent income 82 41 31 31 31Other 836 860 909 887 912
Total revenue 16 328 17 316 18 470 19 357 19 950
lessExpensesEmployee expenses 7 451 7 468 7 474 7 555 7 768Superannuation expenses Superannuation interest cost 468 443 436 429 420 Other superannuation expenses 805 821 825 834 848Depreciation and amortisation 1 293 1 366 1 441 1 530 1 570Interest expenses 513 554 644 805 810Other property expenses — — — — —Other operating expenses 4 966 5 028 5 138 5 241 5 357Grants 2 289 2 322 2 286 2 336 2 391
Total expenses 17 784 18 002 18 244 18 730 19 164
equals
Net operating balance -1 457 -686 225 627 786
plusOther economic flows 1 301 602 654 713 728
equals
Comprehensive result - total change in net worth -155 -84 880 1 340 1 513
Net operating balance -1 457 -686 225 627 786
lessNet acquisition of non-financial assetsPurchases of non-financial assets 2 215 1 876 4 642 1 717 1 888less Sales of non-financial assets 341 583 228 229 87less Depreciation 1 293 1 366 1 441 1 530 1 570plus Change in inventories 62 47 -3 -26 -9plus Other movements in non-financial assets — — — — —
equals Total net acquisition of non-financial assets 643 -27 2 971 -68 221
equals
Net lending/borrowing -2 100 -659 -2 745 695 565
Note: Totals may not add due to rounding.
Appendix A: Uniform presentation framework
142 2014–15 Budget Statement
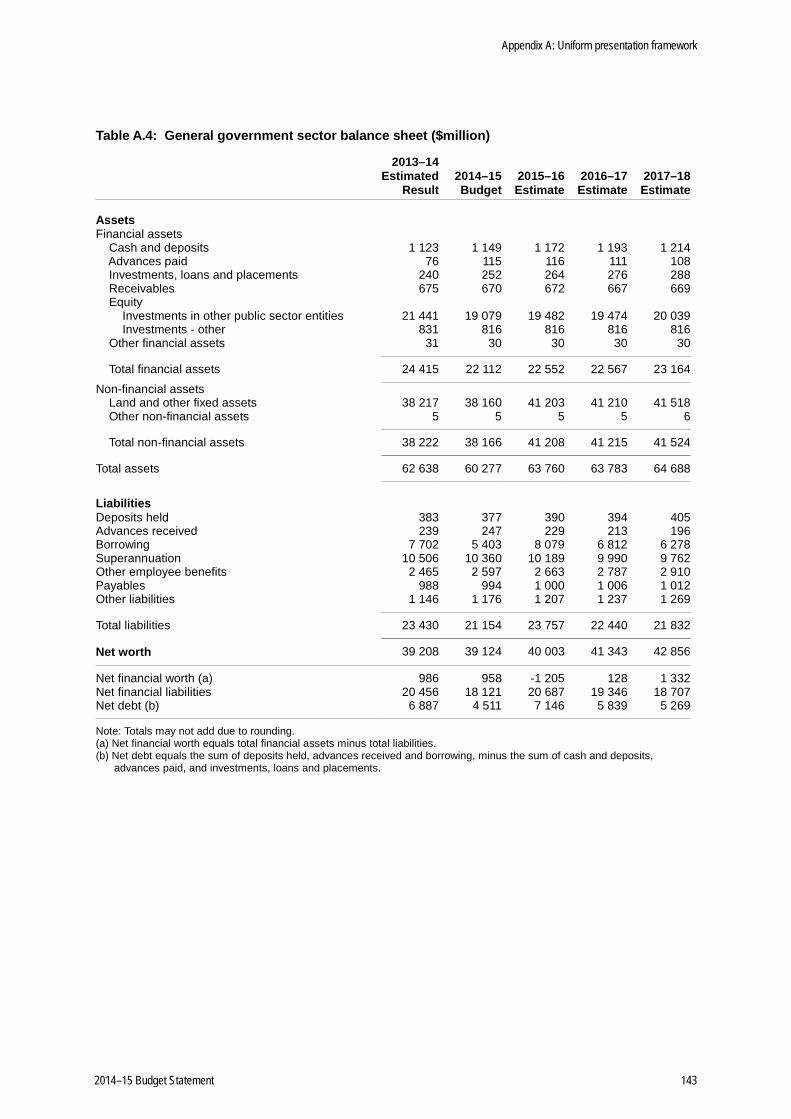
Table A.4: General government sector balance sheet ($million)________________________________________________________________________________________________________________________________________________________________________________________________________________
2013–14Estimated
Result2014–15Budget
2015–16Estimate
2016–17Estimate
2017–18Estimate
AssetsFinancial assets Cash and deposits 1 123 1 149 1 172 1 193 1 214 Advances paid 76 115 116 111 108 Investments, loans and placements 240 252 264 276 288 Receivables 675 670 672 667 669 Equity Investments in other public sector entities 21 441 19 079 19 482 19 474 20 039 Investments - other 831 816 816 816 816 Other financial assets 31 30 30 30 30
Total financial assets 24 415 22 112 22 552 22 567 23 164
Non-financial assets Land and other fixed assets 38 217 38 160 41 203 41 210 41 518 Other non-financial assets 5 5 5 5 6
Total non-financial assets 38 222 38 166 41 208 41 215 41 524
Total assets 62 638 60 277 63 760 63 783 64 688
LiabilitiesDeposits held 383 377 390 394 405Advances received 239 247 229 213 196Borrowing 7 702 5 403 8 079 6 812 6 278Superannuation 10 506 10 360 10 189 9 990 9 762Other employee benefits 2 465 2 597 2 663 2 787 2 910Payables 988 994 1 000 1 006 1 012Other liabilities 1 146 1 176 1 207 1 237 1 269
Total liabilities 23 430 21 154 23 757 22 440 21 832
Net worth 39 208 39 124 40 003 41 343 42 856
Net financial worth (a) 986 958 -1 205 128 1 332Net financial liabilities 20 456 18 121 20 687 19 346 18 707Net debt (b) 6 887 4 511 7 146 5 839 5 269
Note: Totals may not add due to rounding.(a) Net financial worth equals total financial assets minus total liabilities.(b) Net debt equals the sum of deposits held, advances received and borrowing, minus the sum of cash and deposits, advances paid, and investments, loans and placements.
Appendix A: Uniform presentation framework
2014–15 Budget Statement 143

Table A.5: Public non-financial corporations (public trading enterprises) sectorbalance sheet ($million)________________________________________________________________________________________________________________________________________________________________________________________________________________
2013–14Estimated
Result2014–15Budget
2015–16Estimate
2016–17Estimate
2017–18Estimate
AssetsFinancial assets Cash and deposits 344 278 292 307 329 Advances paid 22 15 9 2 — Investments, loans and placements 45 46 47 49 50 Receivables 273 267 297 303 313 Equity Investments in other public sector entities — — — — — Investments - other 17 17 17 17 17 Other financial assets 1 1 1 1 1
Total financial assets 701 624 662 678 710
Non-financial assets Land and other fixed assets 25 603 26 249 26 816 27 387 27 964 Other non-financial assets 9 9 10 15 16
Total non-financial assets 25 612 26 258 26 825 27 402 27 980
Total assets 26 313 26 882 27 488 28 080 28 690
LiabilitiesDeposits held — 1 1 2 2Advances received 33 33 33 33 33Borrowing 4 421 7 291 7 434 7 558 7 620Superannuation — — — — —Other employee benefits 73 74 76 77 77Payables 275 273 297 295 292Other liabilities 179 185 194 196 205
Total liabilities 4 982 7 857 8 035 8 160 8 230
Net worth 21 332 19 025 19 453 19 920 20 460
Net financial worth (a) -4 280 -7 234 -7 373 -7 483 -7 520Net financial liabilities 4 280 7 234 7 373 7 483 7 520Net debt (b) 4 044 6 986 7 120 7 236 7 276
Note: Totals may not add due to rounding.(a) Net financial worth equals total financial assets minus total liabilities.(b) Net debt equals the sum of deposits held, advances received and borrowing, minus the sum of cash and deposits, advances paid, and investments, loans and placements.
Appendix A: Uniform presentation framework
144 2014–15 Budget Statement

Table A.6: Non-financial public sector balance sheet ($million)________________________________________________________________________________________________________________________________________________________________________________________________________________
2013–14Estimated
Result2014–15Budget
2015–16Estimate
2016–17Estimate
2017–18Estimate
AssetsFinancial assets Cash and deposits 1 256 1 222 1 247 1 278 1 311 Advances paid 65 97 91 79 75 Investments, loans and placements 285 298 311 325 338 Receivables 819 807 833 836 842 Equity Investments in other public sector entities 110 55 29 -446 -420 Investments - other 848 833 833 833 833 Other financial assets 31 31 31 30 30
Total financial assets 3 412 3 342 3 375 2 936 3 009
Non-financial assets Land and other fixed assets 63 820 64 409 68 019 68 597 69 483 Other non-financial assets 14 15 15 20 21
Total non-financial assets 63 834 64 424 68 034 68 618 69 504
Total assets 67 247 67 766 71 409 71 553 72 512
LiabilitiesDeposits held 173 173 174 174 175Advances received 239 247 229 213 196Borrowing 12 124 12 694 15 512 14 370 13 898Superannuation 10 506 10 360 10 189 9 990 9 762Other employee benefits 2 538 2 671 2 739 2 863 2 988Payables 1 164 1 167 1 196 1 199 1 201Other liabilities 1 296 1 330 1 366 1 401 1 437
Total liabilities 28 039 28 642 31 405 30 210 29 656
Net worth 39 208 39 124 40 003 41 343 42 856
Net financial worth (a) -24 627 -25 300 -28 031 -27 275 -26 647Net financial liabilities 24 736 25 355 28 060 26 829 26 227Net debt (b) 10 931 11 497 14 266 13 075 12 545
Note: Totals may not add due to rounding.(a) Net financial worth equals total financial assets minus total liabilities.(b) Net debt equals the sum of deposits held, advances received and borrowing, minus the sum of cash and deposits, advances paid, and investments, loans and placements.
Appendix A: Uniform presentation framework
2014–15 Budget Statement 145

Table A.7: General government sector cash flow statement ($million)________________________________________________________________________________________________________________________________________________________________________________________________________________
2013–14Estimated
Result2014–15Budget
2015–16Estimate
2016–17Estimate
2017–18Estimate
Cash receipts from operating activitiesTaxes received 4 138 4 522 4 792 5 016 5 233Receipts from sales of goods and services 2 190 2 273 2 344 2 432 2 503Grants and subsidies received 7 883 8 269 9 063 9 619 9 867Interest receipts 33 32 35 37 39Dividends and income tax equivalents 409 255 294 263 267Other receipts 687 710 718 717 738
Total operating receipts 15 339 16 061 17 246 18 084 18 647
Cash payments for operating activitiesPayments for employees -8 531 -8 446 -8 536 -8 582 -8 823Payments for goods and services -3 991 -4 039 -4 179 -4 251 -4 361Grants and subsidies paid -2 708 -2 753 -2 772 -2 864 -2 973Interest paid -304 -232 -319 -465 -462Other payments -95 -64 -63 -64 -63
Total operating payments -15 629 -15 534 -15 869 -16 225 -16 681
Net cash flows from operating activities -290 526 1 377 1 859 1 966
Net cash flows from investmentsin non-financial assetsSales of non-financial assets 115 388 84 99 7Purchases of non-financial assets (a) -1 521 -1 213 -1 245 -1 123 -1 371
Net cash flows from investments -1 406 -826 -1 160 -1 024 -1 364in non-financial assets
Net cash flows from investments in financialassets for policy purposes (b) 75 2 633 -20 491 -13
Net cash flows from investments in financialassets for liquidity purposes -12 2 -12 -12 -12
Net cash flows from financing activitiesAdvances received (net) 8 7 -17 -17 -17Borrowing (net) 1 585 -2 296 -141 -1 263 -531Deposits received (net) -9 -6 13 4 11Dividends paid — — — — —Other financing (net) — — — — —
Net cash flows from financing activities 1 584 -2 295 -145 -1 275 -536
Net Increase/(decrease) in cash held -49 42 40 39 40
Net cash flows from operating activities -290 526 1 377 1 859 1 966Net cash flows from investments -1 406 -826 -1 160 -1 024 -1 364in non-financial assetsDividends paid — — — — —
Cash surplus/(deficit) -1 696 -300 217 835 601
Note: Totals may not add due to rounding.(a) The ABS disaggregates this item into new and secondhand non-financial assets.(b) Includes equity acquisitions and disposals.
Appendix A: Uniform presentation framework
146 2014–15 Budget Statement

Table A.8: Public non-financial corporations (public trading enterprises) sectorcash flow statement ($million)________________________________________________________________________________________________________________________________________________________________________________________________________________
2013–14Estimated
Result2014–15Budget
2015–16Estimate
2016–17Estimate
2017–18Estimate
Cash receipts from operating activitiesTaxes received — — — — —Receipts from sales of goods and services 1 646 1 786 1 742 1 818 1 859Grants and subsidies received 457 445 434 473 547Interest receipts 14 6 6 6 6Dividends and income tax equivalents 4 4 4 4 4Other receipts 156 145 181 156 164
Total operating receipts 2 276 2 386 2 365 2 457 2 579
Cash payments for operating activitiesPayments for employees -227 -237 -241 -248 -256Payments for goods and services -980 -983 -879 -912 -937Grants and subsidies paid -140 -100 -78 -77 -80Interest paid -221 -329 -332 -348 -355Other payments -391 -382 -404 -416 -419
Total operating payments -1 960 -2 031 -1 933 -2 001 -2 047
Net cash flows from operating activities 316 355 432 456 531
Net cash flows from investmentsin non-financial assetsSales of non-financial assets 215 154 143 133 62Purchases of non-financial assets (a) -624 -628 -540 -557 -477
Net cash flows from investments -410 -474 -396 -425 -415in non-financial assets
Net cash flows from investments in financialassets for policy purposes (b) 8 7 6 7 2
Net cash flows from investments in financialassets for liquidity purposes -2 -1 -1 -1 -1
Net cash flows from financing activitiesAdvances received (net) -86 -2 672 19 14 16Borrowing (net) 222 2 870 143 124 62Deposits received (net) — — — — —Dividends paid -209 -151 -189 -162 -173Other financing (net) — — — — —
Net cash flows from financing activities -73 47 -27 -23 -94
Net Increase/(decrease) in cash held -161 -65 15 14 23
Net cash flows from operating activities 316 355 432 456 531Net cash flows from investments -410 -474 -396 -425 -415in non-financial assetsDividends paid -209 -151 -189 -162 -173
Cash surplus/(deficit) -303 -269 -153 -130 -56
Note: Totals may not add due to rounding.(a) The ABS disaggregates this item into new and secondhand non-financial assets.(b) Includes equity acquisitions and disposals.
Appendix A: Uniform presentation framework
2014–15 Budget Statement 147

Table A.9: Non-financial public sector cash flow statement ($million)________________________________________________________________________________________________________________________________________________________________________________________________________________
2013–14Estimated
Result2014–15Budget
2015–16Estimate
2016–17Estimate
2017–18Estimate
Cash receipts from operating activitiesTaxes received 3 855 4 208 4 468 4 680 4 889Receipts from sales of goods and services 3 652 3 878 3 902 4 060 4 168Grants and subsidies received 7 884 8 270 9 063 9 620 9 867Interest receipts 36 32 35 37 39Dividends and income tax equivalents 82 41 31 31 31Other receipts 832 847 891 864 893
Total operating receipts 16 340 17 277 18 389 19 292 19 886
Cash payments for operating activitiesPayments for employees -8 746 -8 670 -8 763 -8 816 -9 064Payments for goods and services -4 804 -4 859 -4 892 -4 995 -5 127Grants and subsidies paid -2 393 -2 409 -2 416 -2 468 -2 507Interest paid -514 -555 -645 -806 -810Other payments -67 -53 -52 -54 -53
Total operating payments -16 524 -16 546 -16 769 -17 139 -17 562
Net cash flows from operating activities -183 730 1 620 2 153 2 324
Net cash flows from investmentsin non-financial assetsSales of non-financial assets 325 543 228 229 69Purchases of non-financial assets (a) -2 140 -1 842 -1 784 -1 678 -1 848
Net cash flows from investments -1 816 -1 299 -1 556 -1 449 -1 779in non-financial assets
Net cash flows from investments in financialassets for policy purposes (b) -3 -32 5 512 5
Net cash flows from investments in financialassets for liquidity purposes -15 1 -13 -14 -13
Net cash flows from financing activitiesAdvances received (net) 8 7 -17 -17 -17Borrowing (net) 1 807 574 2 -1 138 -469Deposits received (net) — — — — —Dividends paid — — — — —Other financing (net) — — — — —
Net cash flows from financing activities 1 816 582 -15 -1 154 -484
Net Increase/(decrease) in cash held -201 -18 41 49 52
Net cash flows from operating activities -183 730 1 620 2 153 2 324Net cash flows from investments -1 816 -1 299 -1 556 -1 449 -1 779in non-financial assetsDividends paid — — — — —
Cash surplus/(deficit) -1 999 -569 64 705 545
Note: Totals may not add due to rounding.(a) The ABS disaggregates this item into new and secondhand non-financial assets.(b) Includes equity acquisitions and disposals.
Appendix A: Uniform presentation framework
148 2014–15 Budget Statement
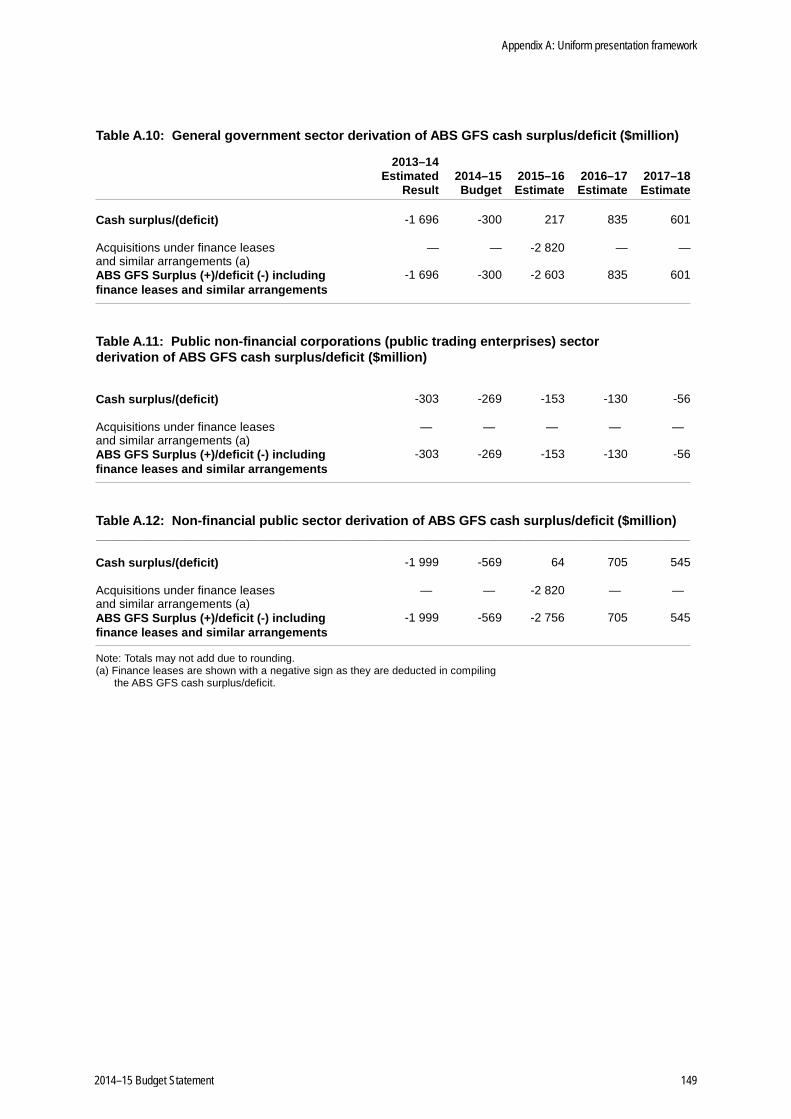
Table A.10: General government sector derivation of ABS GFS cash surplus/deficit ($million)________________________________________________________________________________________________________________________________________________________________________________________________________________
2013–14Estimated
Result2014–15Budget
2015–16Estimate
2016–17Estimate
2017–18Estimate
Cash surplus/(deficit) -1 696 -300 217 835 601
Acquisitions under finance leases — — -2 820 — —and similar arrangements (a)ABS GFS Surplus (+)/deficit (-) including -1 696 -300 -2 603 835 601finance leases and similar arrangements
Table A.11: Public non-financial corporations (public trading enterprises) sectorderivation of ABS GFS cash surplus/deficit ($million)___________________________________________________________________________________________________________________________________________________________________________________________________________________________________
Cash surplus/(deficit) -303 -269 -153 -130 -56
Acquisitions under finance leases — — — — — and similar arrangements (a)ABS GFS Surplus (+)/deficit (-) including -303 -269 -153 -130 -56finance leases and similar arrangements
Table A.12: Non-financial public sector derivation of ABS GFS cash surplus/deficit ($million)___________________________________________________________________________________________________________________________________________________________________________________________________________________________________
Cash surplus/(deficit) -1 999 -569 64 705 545
Acquisitions under finance leases — — -2 820 — — and similar arrangements (a)ABS GFS Surplus (+)/deficit (-) including -1 999 -569 -2 756 705 545finance leases and similar arrangements
Note: Totals may not add due to rounding.(a) Finance leases are shown with a negative sign as they are deducted in compiling the ABS GFS cash surplus/deficit.
Appendix A: Uniform presentation framework
2014–15 Budget Statement 149

Table A.13: General government sector taxes ($million) (a)________________________________________________________________________________________________________________________________________________________________________________________________________________
2013–14Estimated
Result2014–15Budget
2015–16Estimate
2016–17Estimate
2017–18Estimate
Taxes on employers' payroll and labour force 1 097 1 172 1 253 1 323 1 400
Taxes on propertyLand taxes 567 578 598 622 640Stamp duties on financial and capital transactions 891 1 038 1 156 1 230 1 282Financial institutions' transaction taxes — — — — —Other 178 299 298 303 308
Total 1 636 1 915 2 052 2 155 2 231
Taxes on the provision of goods and servicesExcises and levies — — — — —Taxes on gambling 388 404 424 437 461Taxes on insurance 443 440 453 471 490
Total 832 844 877 907 951
Taxes on use of goods and performance of activitiesMotor vehicle taxes 556 592 614 634 654
Total 556 592 614 634 654
Total GFS taxation revenue 4 121 4 524 4 795 5 020 5 236
Note: Totals may not add due to rounding.(a) Excludes taxes paid by general government entities.
Appendix A: Uniform presentation framework
150 2014–15 Budget Statement

Table A.14(a): General government sector grant revenue ($million)________________________________________________________________________________________________________________________________________________________________________________________________________________
2013–14Estimated
Result2014–15Budget
2015–16Estimate
2016–17Estimate
2017–18Estimate
Current grant revenueCurrent grants from the Commonwealth General purpose grants 4 618 4 956 5 315 5 814 6 063 National partnership grants 450 346 313 320 212 National partnership grants for on-passing 113 156 154 153 159 Specific purpose grants 1 486 1 636 1 753 1 875 1 965 Specific purpose grants for on-passing 730 764 811 861 901
Total current grants from the Commonwealth 7 397 7 859 8 346 9 023 9 300
Other contributions and grants 245 142 141 142 142
Total current grant revenue 7 642 8 000 8 487 9 165 9 442
Capital grant revenueCapital grants from the Commonwealth General purpose grants — — — — — National partnership grants 69 155 463 342 311 Specific purpose grants 104 92 92 93 94 Specific purpose grants for on-passing 11 — — — — Other capital grants 4 5 3 3 3
Total capital grants from the Commonwealth 188 251 558 438 408
Other contributions and grants 25 18 19 17 17
Total capital grant revenue 213 269 577 455 425
Total grant revenue 7 855 8 270 9 064 9 620 9 867
Table A.14(b): General government sector grant expense ($million)___________________________________________________________________________________________________________________________________________________________________________________________________________________________________
2013–14Estimated
Result2014–15Budget
2015–16Estimate
2016–17Estimate
2017–18Estimate
Current grant expense State/territory government 5 4 4 5 5 Local government 50 46 52 53 52 Local government on-passing 102 151 150 149 155 Private and not-for-profit sector 899 951 956 955 938 Private and not-for-profit sector on-passing 741 769 815 865 905 Grants to other sectors of government 451 446 436 476 549 Other 205 186 184 191 197
Total current grant expense 2 454 2 553 2 597 2 694 2 802
Capital grant expense State/territory government — — — — — Local government 3 — — — — Local government on-passing — — — — — Private and not-for-profit sector 132 73 45 38 56 Private and not-for-profit sector on-passing 11 — — — — Grants to other sectors of government — — — — — Other 1 — — — —
Total capital grant expense 147 73 45 38 56
Total grant expense 2 601 2 626 2 642 2 732 2 858
Note: Totals may not add due to rounding.
Appendix A: Uniform presentation framework
2014–15 Budget Statement 151
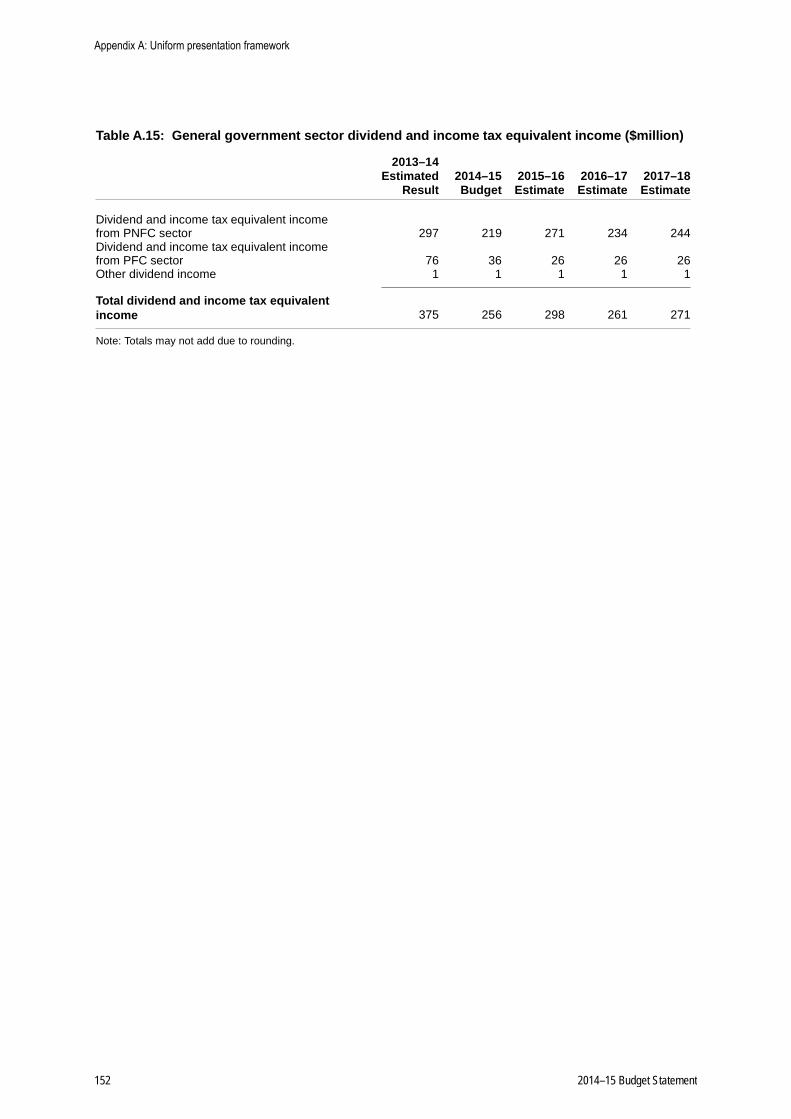
Table A.15: General government sector dividend and income tax equivalent income ($million)________________________________________________________________________________________________________________________________________________________________________________________________________________
2013–14Estimated
Result2014–15Budget
2015–16Estimate
2016–17Estimate
2017–18Estimate
Dividend and income tax equivalent incomefrom PNFC sector 297 219 271 234 244Dividend and income tax equivalent incomefrom PFC sector 76 36 26 26 26Other dividend income 1 1 1 1 1
Total dividend and income tax equivalentincome 375 256 298 261 271
Note: Totals may not add due to rounding.
Appendix A: Uniform presentation framework
152 2014–15 Budget Statement

Table A.16: General government sector expenses by function ($million)(a)(b)
2013-142013-14Budget
Estimated Result
2014-15Budget
General public services 366 384 383Government superannuation benefits — — —Other general public services 366 384 383
Defence(c) — — —
Public order and safety 1 565 1 559 1 578Police and fire protection services 952 938 944Law courts and legal services 287 288 295Prisons and corrective services 258 258 265Other public order and safety 68 75 73
Education 4 132 4 219 4 240Primary and secondary education 3 286 3 333 3 359Tertiary education 523 570 553Pre-school education and education not definable by level 293 286 297Transportation of students 28 28 30Education n.e.c. 3 3 3
Health 5 084 5 119 5 203Acute care institutions 4 345 4 396 4 461Mental health institutions n.a. n.a. n.a.Nursing homes for the aged n.a. n.a. n.a.Community health services 405 391 409Public health services 162 160 160Pharmaceuticals, medical aids and appliances 11 10 10Health research 9 9 10Health administration n.e.c. 152 152 153
Social security and welfare 1 282 1 312 1 314Social security 112 110 111Welfare services 1 060 1 091 1 093Social security and welfare services n.e.c. 109 110 110
Housing and community amenities 944 1 058 1 092Housing and community development 441 459 440Water supply 242 244 241Sanitation and protection of the environment 252 331 377Other community amenities 8 23 34
Recreation and culture 337 368 357Recreation facilities and services 159 184 173Cultural facilities and services 165 171 171Broadcasting and film production 7 7 7Recreation and culture n.e.c. 6 5 5
Appendix A: Uniform presentation framework
2014–15 Budget Statement 153

Table A.16: General government sector expenses by function ($million)(a)(b) (continued)
2013-142013-14Budget
Estimated Result
2014-15Budget
Fuel and energy 56 47 43Fuel affairs and services 10 15 14Electricity and other energy 8 8 8Fuel and energy n.e.c. 38 23 21
Agriculture, forestry, fishing and hunting 193 197 207Agriculture 138 140 150Forestry, fishing and hunting 55 57 57
Mining and mineral resources other than fuels; 71 82 76manufacturing; and construction
Mining and mineral resources other than fuels 34 35 35Manufacturing — — —Construction 37 47 41
Transport and communications 1 022 1 038 1 043Road transport 416 416 417Water transport 16 15 15Rail transport 36 35 35Air transport 2 3 6Pipelines n.a. n.a. n.a.Other transport 498 505 506Communications 55 64 64
Other economic affairs 238 257 270Storage, saleyards and markets n.a. n.a. n.a.Tourism and area promotion 69 70 62Labour and employment affairs 52 55 55Other economic affairs 117 132 154
Other purposes 887 847 740Public debt transactions 379 304 232General purpose inter-government transactions 32 31 22Natural disaster relief 5 4 5Nominal superannuation interest expense 434 468 443Other purposes n.e.c. 37 40 38
Total GFS expenses 16 176 16 487 16 547
Note: Totals may not add due to rounding.
(a) Expenses by function data is derived from information submitted by government departments and agencies. The processes for deriving this data are subject to ongoing refinements. Consequently the data may be subject to future revisions.
(b) Some functional classifications are not readily distinguishable at agency level. Those instances are denoted as ‘not available’ (n.a.).
(c) The ABS defines ‘defence’ as expenditure on military and civil defence affairs, foreign military aid and defence research. The expenditure of Defence SA is included in ‘other economic affairs’.
Appendix A: Uniform presentation framework
154 2014–15 Budget Statement

Table A.17: General government sector capital expenditure by function ($million)(a)
2013-142013-14Budget
Estimated Result
2014-15Budget
General public services 13 20 13Defence(b) — — —Public order and safety 95 72 113Education 231 217 102Health 327 236 234Social security and welfare 5 10 5Housing and community amenities 27 14 23Recreation and culture 186 239 36Fuel and energy — — —Agriculture, forestry, fishing and hunting 5 5 8Mining and mineral resources other than fuels; manufacturing; and construction 40 26 26Transport and communications 923 722 647Other economic affairs 5 5 9Other purposes 1 — —Total capital expenditure 1 858 1 567 1 217
Note: Totals may not add due to rounding.
(a) Expenses by function data is derived from information submitted by government departments and agencies. The processes for deriving this data are subject to ongoing refinements. Consequently the data may be subject to future revisions.
(b) The ABS defines ‘defence’ as expenditure on military and civil defence affairs, foreign military aid and defence research. The expenditure of Defence SA is included in ‘other economic affairs’.
Table A.18: General government sector net worth ($million)
Estimated Result
2014–15 Budget
2015–16 Estimate
2016–17 Estimate
2017–18 Estimate
Net worth at beginning of year 39 363 39 208 39 124 40 003 41 343
Change in net worth from operating transactionsNet operating balance -1 232 - 479 406 776 883
Change in net worth from other economic flowsMovement in net assets of PFCs(a) 269 - 55 - 26 25 26Movement in net assets of PNFCs(a) 327 365 409 453 524Revaluation of unfunded superannuation liability(b) 625 171 174 177 179Revaluation of long service leave liability - 79 - 83 - 85 - 87 - 89Revaluation of annual leave liability - 10 - 10 - 10 - 10 - 11Other revaluation adjustments - 56 7 11 7 —
Total other economic flows 1 077 395 474 564 630Net worth at year end 39 208 39 124 40 003 41 343 42 856
2013–14
Note: Totals may not add due to rounding.
(a) Net of equity injections from, and the return of equity to, the general government sector.
(b) 2013–14 change represents revaluation difference from 30 June 2013 liability, which was measured using 4.3 per cent discount rate.
Appendix A: Uniform presentation framework
2014–15 Budget Statement 155

Loan Council arrangements
The Australian Loan Council, a ministerial council established in 1927 comprising the Commonwealth, state and territory Treasurers, requires all jurisdictions to nominate a Loan Council Allocation (LCA) for consideration at its annual meeting.
LCA nominations, prepared in February, are intended to provide an indication of each government’s probable call on financial markets over the forthcoming financial year. The Loan Council, having regard to each jurisdiction’s fiscal position and reasonable infrastructure requirements, along with the macroeconomic implications of the aggregate figure, then considers the nominations.
Following the endorsement of LCA nominations, jurisdictions are further required to update their nominated LCAs at budget time for changes in economic parameters and policy decisions, and also provide an LCA outcome at the end of the financial year. A tolerance limit of 2 per cent of total public sector revenue, set at nomination time, applies between both the nomination and budget, and the budget and outcome LCAs. If the tolerance limit is exceeded, the Loan Council must be notified and a report detailing the reasons for change released publicly.
Nominated LCAs for 2014–15, for all jurisdictions and in aggregate, were reviewed and endorsed at the meeting of the Australian Loan Council held on 28 March 2014.
South Australia’s nomination, budget and estimated outcome LCAs for 2013–14 are shown in table A.19, with nomination and budget time LCAs for 2014–15 shown in table A.20. These tables are prepared in accordance with the requirements of the accrual UPF, endorsed by the Loan Council in March 2000 and revised in April 2008 to recognise acquisitions under finance leases and similar arrangements.
As table A.19 indicates, South Australia is expecting an LCA deficit of $1 155 million for 2013–14. This is marginally higher than the 2013–14 Budget (June 2013) estimated deficit of $1 149 million, reflecting an increase in the non-financial public sector deficit partially offset by higher than expected earnings on superannuation assets. On the basis of these estimates, South Australia’s 2013–14 LCA outcome will not exceed the 2 per cent of total revenue tolerance limit included in the 2013–14 LCA nomination.
South Australia’s 2014–15 Budget LCA, detailed in table A.20, is an estimated $51 million deficit. This differs from the $124 million surplus nominated in February of this year due to an increase in the non-financial public sector deficit. On the basis of these estimates, South Australia’s 2014–15 LCA is not likely to exceed the LCA nomination tolerance limit.
Appendix A: Uniform presentation framework
156 2014–15 Budget Statement

Table A.19: Loan Council allocation 2013–14 ($million)(a)
Nomination (February
2013) Budget
(June 2013)
Estimated result
(June 2014) General government sector cash deficit/surplus 1 597 1 332 1 696 PNFC sector cash deficit/surplus 11 307 303
Non-financial public sector cash deficit/surplus(b) 1 607 1 640 1 999 Acquisitions under finance leases and similar arrangements — — —
ABS Government Finance Statistics cash deficit/surplus 1 607 1 640 1 999 Less: Net cash flows from investments in financial assets for
policy purposes
11
11
-3
Adjusted total non-financial public sector deficit/surplus 1 596 1 629 2 002 Plus: Memorandum items(c)
Operating leases(d) -91 -106 -68 Recourse asset sales — — — Superannuation(e) -505 -496 -777 Local government 58 60 23 Home finance schemes 75 62 -25
Total memorandum items -463 -480 -847
LCA deficit/surplus(f)(g) 1 133 1 149 1 155
Note: Totals may not add due to rounding.
(a) For the purposes of this table a surplus amount is represented as a negative number while a deficit is shown as a positive number.
(b) The sum of the deficits of the general government and PNFC sectors may not equal the non-financial public sector deficit due to intersectoral transfers, which are netted out in the calculation of the total figure. The figures exclude statutory marketing authorities.
(c) Excludes universities.
(d) Increase/decrease in the net present value (NPV) of operating leases with a NPV of $5.0 million or greater.
(e) Includes both ‘payments in excess of emerging costs of superannuation’ and ‘interest earnings on employer balances’.
(f) The 2 per cent of total revenue tolerance limit for South Australia’s 2013–14 LCA is $329.5 million.
(g) South Australia does not have any proposed infrastructure projects with private sector involvement that meets the recognition criteria for 2013–14.
Appendix A: Uniform presentation framework
2014–15 Budget Statement 157

Table A.20: Loan Council allocation 2014–15 ($million)(a)
Nomination (January 2014)
Budget (June 2014)
General government sector cash deficit/surplus 236 300 PNFC sector cash deficit/surplus 174 269
Total non-financial public sector cash deficit/surplus(b) 410 569 Acquisitions under finance leases and similar arrangements — —
ABS Government Finance Statistics cash deficit/surplus 410 569 Less: Net cash flows from investments in financial assets for
policy purposes
-25
-32
Adjusted total non-financial public sector deficit/surplus 435 601 Plus: Memorandum items(c)
Operating leases(d) -84 -84 Recourse asset sales — — Superannuation(e) -500 -497 Local government 17 17 Home finance schemes 8 13
Total memorandum items -559 -550
LCA deficit/surplus(f)(g) -124 51
Note: Totals may not add due to rounding.
(a) For the purposes of this table a surplus amount is represented as a negative number while a deficit is shown as a positive number.
(b) The sum of the deficits of the general government and PNFC sectors may not equal the non-financial public sector deficit due to intersectoral transfers, which are netted out in the calculation of the total figure. The figures exclude statutory marketing authorities.
(c) Excludes universities.
(d) Increase/decrease in the net present value (NPV) of operating leases with a NPV of $5.0 million or greater.
(e) Includes both ‘payments in excess of emerging costs of superannuation’ and ‘interest earnings on employer balances’.
(f) The 2 per cent of total revenue tolerance limit around South Australia’s 2014–15 LCA is $342.0 million.
(g) South Australia does not have any proposed infrastructure projects with private sector involvement that meets the recognition criteria for 2014–15.
Appendix A: Uniform presentation framework
158 2014–15 Budget Statement

Appendix B: General government and non-financial public sector financial statistics time series
The following tables provide historical data on key fiscal aggregates, together with estimates reflected in the 2014–15 Budget. Data provided is sourced for 1998–99 from Australian Bureau of Statistics Government Finance Statistics 2007–08 and 1999–2000 to 2012–13 from budget outcome publications for South Australia. The estimates for 2013–14 onwards are contained in the 2014–15 Budget papers.
Gross State Product (GSP) and Consumer Price Index (for real-growth calculations) data up to 2012–13 is sourced from the latest Australian Bureau of Statistics (ABS) publications. Department of Treasury and Finance forecasts are used for the forward estimates.
Except where specified, historical data in this time series has not been back-cast to reflect classification and accounting changes. As such care must be taken in interpreting the data.
General government Table B.1: General government key operating statement aggregates
Revenue Expenses
Net operating
balance
Net acquisition of non-financial
assetsNet
lending
$m% real
growth % GSP $m% real
growth % GSP $m $m $m1998–99 7 290 16.8 7 505 17.3 - 215 19 - 2331999–2000 7 644 2.3 16.8 7 974 3.6 17.6 - 330 140 - 4712000–01 8 108 3.0 16.7 8 406 2.4 17.3 - 297 102 - 3992001–02 8 538 2.1 16.3 8 713 0.5 16.6 - 174 - 50 - 1242002–03 9 346 5.2 16.8 8 898 -1.8 16.0 448 34 4142003–04 9 955 3.4 16.8 9 570 4.4 16.1 385 - 38 4242004–05 10 592 3.9 17.1 10 368 5.8 16.7 224 105 1192005–06 11 242 2.9 17.1 11 040 3.3 16.8 202 119 832006–07 11 757 1.9 16.5 11 547 1.9 16.3 209 139 712007–08 12 879 6.1 16.6 12 414 4.1 16.0 464 242 2222008–09 13 531 1.9 16.9 13 764 7.5 17.2 - 233 639 - 8722009–10(a) 15 534 12.3 18.6 15 347 9.1 18.3 187 1 279 -1 0922010–11(a) 15 017 -6.3 16.7 15 069 -4.9 16.8 - 53 1 370 -1 4222011–12 15 905 3.2 17.1 16 164 4.5 17.4 - 258 839 -1 0982012–13 15 333 -5.5 16.1 16 282 -1.3 17.1 - 948 55 -1 0032013–14(b)(c) 15 254 -3.2 15.5 16 487 -1.5 16.7 -1 232 576 -1 8082014–15 16 067 2.8 15.5 16 547 -2.1 16.0 - 479 - 99 - 3802015–16 17 258 4.8 15.9 16 852 -0.6 15.5 406 2 993 -2 5872016–17 18 090 2.3 15.9 17 315 0.2 15.2 776 - 39 8142017–18 18 659 0.6 15.7 17 776 0.2 14.9 883 266 617
Note: Totals may not add due to rounding. (a) In 2009–10 and 2010–11 revenue, expenses and net acquisition of non-financial assets are impacted by the Commonwealth Government’s
Nation Building — Economic Stimulus Plan. (b) There is a structural break in 2013–14 in the methodology used to calculate the nominal superannuation interest expense. This accounting
change is in accordance with AASB 119 Employee Benefits and results in deterioration to the net operating balance and net lending. (c) There is a structural break in 2013–14 in the presentation of interest income and interest expense. Interest income earned on cash and
deposits is offset with interest expense on the borrowings the Treasurer has with SAFA. This results in a reduction to interest income and interest expense accordingly.
2014–15 Budget Statement 159
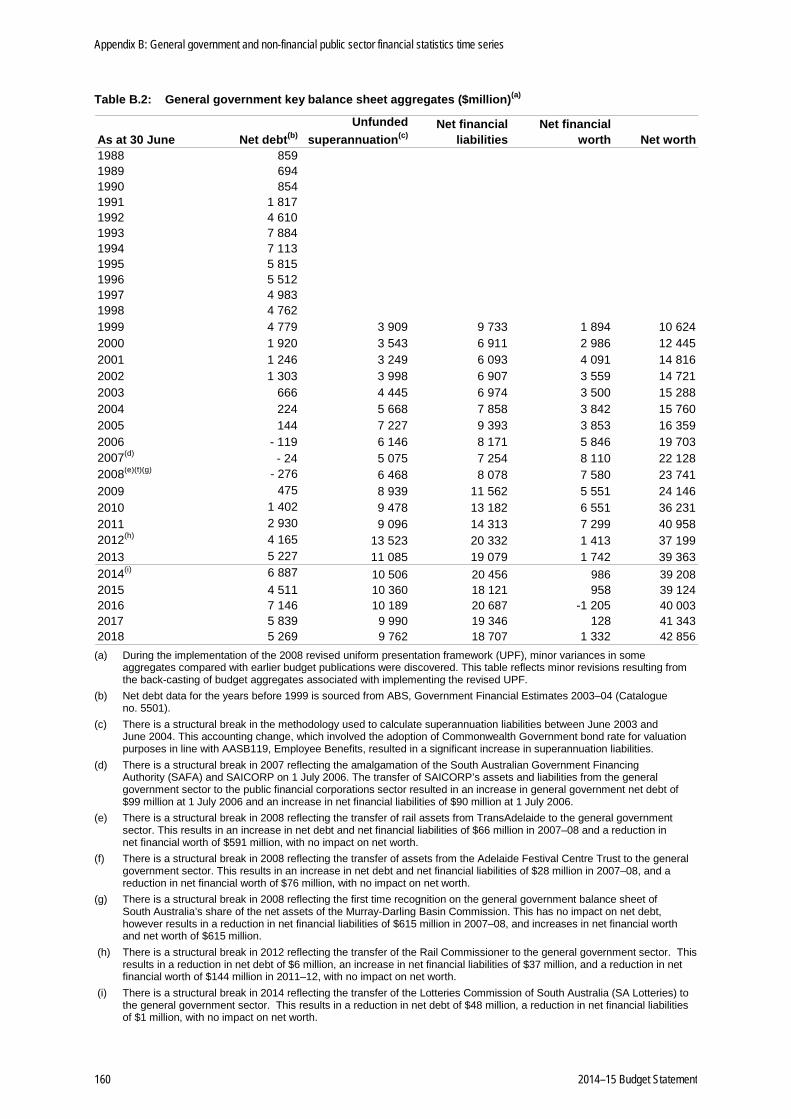
Table B.2: General government key balance sheet aggregates ($million)(a)
As at 30 June Net debt(b)Unfunded
superannuation(c) Net financial
liabilitiesNet financial
worth Net worth1988 8591989 6941990 8541991 1 8171992 4 6101993 7 8841994 7 1131995 5 8151996 5 5121997 4 9831998 4 7621999 4 779 3 909 9 733 1 894 10 6242000 1 920 3 543 6 911 2 986 12 4452001 1 246 3 249 6 093 4 091 14 8162002 1 303 3 998 6 907 3 559 14 7212003 666 4 445 6 974 3 500 15 2882004 224 5 668 7 858 3 842 15 7602005 144 7 227 9 393 3 853 16 3592006 - 119 6 146 8 171 5 846 19 7032007(d) - 24 5 075 7 254 8 110 22 1282008(e)(f)(g) - 276 6 468 8 078 7 580 23 7412009 475 8 939 11 562 5 551 24 1462010 1 402 9 478 13 182 6 551 36 2312011 2 930 9 096 14 313 7 299 40 9582012(h) 4 165 13 523 20 332 1 413 37 1992013 5 227 11 085 19 079 1 742 39 3632014(i) 6 887 10 506 20 456 986 39 2082015 4 511 10 360 18 121 958 39 1242016 7 146 10 189 20 687 -1 205 40 0032017 5 839 9 990 19 346 128 41 3432018 5 269 9 762 18 707 1 332 42 856
(a) During the implementation of the 2008 revised uniform presentation framework (UPF), minor variances in some aggregates compared with earlier budget publications were discovered. This table reflects minor revisions resulting from the back-casting of budget aggregates associated with implementing the revised UPF.
(b) Net debt data for the years before 1999 is sourced from ABS, Government Financial Estimates 2003–04 (Catalogue no. 5501).
(c) There is a structural break in the methodology used to calculate superannuation liabilities between June 2003 and June 2004. This accounting change, which involved the adoption of Commonwealth Government bond rate for valuation purposes in line with AASB119, Employee Benefits, resulted in a significant increase in superannuation liabilities.
(d) There is a structural break in 2007 reflecting the amalgamation of the South Australian Government Financing Authority (SAFA) and SAICORP on 1 July 2006. The transfer of SAICORP’s assets and liabilities from the general government sector to the public financial corporations sector resulted in an increase in general government net debt of $99 million at 1 July 2006 and an increase in net financial liabilities of $90 million at 1 July 2006.
(e) There is a structural break in 2008 reflecting the transfer of rail assets from TransAdelaide to the general government sector. This results in an increase in net debt and net financial liabilities of $66 million in 2007–08 and a reduction in net financial worth of $591 million, with no impact on net worth.
(f) There is a structural break in 2008 reflecting the transfer of assets from the Adelaide Festival Centre Trust to the general government sector. This results in an increase in net debt and net financial liabilities of $28 million in 2007–08, and a reduction in net financial worth of $76 million, with no impact on net worth.
(g) There is a structural break in 2008 reflecting the first time recognition on the general government balance sheet of South Australia’s share of the net assets of the Murray-Darling Basin Commission. This has no impact on net debt, however results in a reduction in net financial liabilities of $615 million in 2007–08, and increases in net financial worth and net worth of $615 million.
(h) There is a structural break in 2012 reflecting the transfer of the Rail Commissioner to the general government sector. This results in a reduction in net debt of $6 million, an increase in net financial liabilities of $37 million, and a reduction in net financial worth of $144 million in 2011–12, with no impact on net worth.
(i) There is a structural break in 2014 reflecting the transfer of the Lotteries Commission of South Australia (SA Lotteries) to the general government sector. This results in a reduction in net debt of $48 million, a reduction in net financial liabilities of $1 million, with no impact on net worth.
Appendix B: General government and non-financial public sector financial statistics time series
160 2014–15 Budget Statement

Table B.3: General government sector receipts, payments and surplus ($million)(a)
Receipts Payments ABS Cash surplus1979–80 1 891 1 671 2201980–81 2 065 1 917 1481981–82 2 210 2 122 871982–83 2 664 2 507 1561983–84 2 988 2 734 2551984–85 3 380 3 057 3241985–86 3 634 3 161 4741986–87 3 956 3 416 5401987–88 4 307 3 858 4491988–89 4 630 3 977 6531989–90 4 973 4 370 6031990–91 5 260 4 796 4631991–92 5 387 5 396 - 101992–93 5 967 5 456 5121993–94 6 087 6 024 631994–95 6 155 6 220 - 661995–96 6 405 6 164 2411996–97 6 379 6 282 971997–98 6 988 6 724 2641998–99 7 165 7 041 1231999–2000 7 676 7 915 - 2392000–01 8 278 8 387 - 1082001–02 8 698 8 748 - 502002–03 9 522 8 864 6582003–04 10 023 9 502 5222004–05 11 252 11 059 1932005–06 11 480 11 293 1872006–07 12 090 12 116 - 262007–08 12 932 12 552 3792008–09 13 579 14 299 - 7212009–10 15 837 16 991 -1 1542010–11 15 331 16 851 -1 5202011–12 16 556 17 594 -1 0382012–13 16 489 17 655 -1 1662013–14 15 454 17 150 -1 6962014–15 16 448 16 748 - 3002015–16 17 330 19 933 -2 6032016–17 18 183 17 348 8352017–18 18 654 18 053 601
Note: Totals may not add due to rounding.
(a) There is a break in the series between 1998–99 and 1999–2000. Data for the years before 1999–2000 is sourced from ABS and are consistent with ABS Government Finance Statistics (GFS) reporting requirements on a cash basis. Capital receipts and payments, including payments associated with the provision of financial support for state owned financial institutions (which were treated by the ABS as an ‘investment in financial assets for policy purposes’) are not included in the series before 1999–2000. After 1998–99, data is derived from an accrual ABS GFS reporting framework, with receipts proxied by receipts from operating activities and sales of non-financial assets, and payments proxied by payments for operating activities, purchases of non-financial assets and net acquisition of assets under finance leases and similar arrangements. Due to the associated methodological and data-source changes, time series data that encompasses measures derived under both cash and accrual accounting should be used with caution.
Appendix B: General government and non-financial public sector financial statistics time series
2014–15 Budget Statement 161

Tabl
e B
.4:
Gen
eral
gov
ernm
ent s
ecto
r ope
ratin
g st
atem
ent (
$mill
ion)
20
08–0
920
09–1
020
10–1
120
11–1
220
12–1
320
13–1
420
14–1
520
15–1
620
16–1
720
17–1
8R
even
ueTa
xatio
n re
venu
e3
537
3 64
93
831
3 85
44
104
4 12
14
524
4 79
55
020
5 23
6G
rant
s7
249
8 88
18
185
8 66
87
669
7 85
58
270
9 06
49
620
9 86
7S
ales
of g
oods
and
ser
vice
s1
697
1 93
61
879
2 01
52
115
2 19
92
282
2 35
32
441
2 51
3In
tere
st in
com
e(b)
150
138
168
172
134
33
32
35
37
39
Div
iden
d an
d in
com
e ta
x eq
uiva
lent
inco
me
382
433
403
385
446
375
256
298
261
271
Oth
er 5
17 4
97 5
50 8
11 8
65 6
73 7
04 7
13 7
11 7
32To
tal r
even
ue13
531
15 5
3415
017
15 9
0515
333
15 2
5416
067
17 2
5818
090
18 6
59le
ssEx
pens
esE
mpl
oyee
exp
ense
s5
749
6 22
16
400
6 77
07
105
7 25
87
268
7 27
17
347
7 55
4S
uper
annu
atio
n ex
pens
esS
uper
annu
atio
n in
tere
st c
ost(a
) 3
83 4
55 4
27 4
07 3
14 4
68 4
43 4
36 4
29 4
20O
ther
sup
eran
nuat
ion
expe
nses
580
600
621
666
675
781
796
798
807
820
Dep
reci
atio
n an
d am
ortis
atio
n 5
66 6
33 6
70 7
18 7
62 8
64 9
27 9
901
065
1 08
4In
tere
st e
xpen
ses(b
) 1
80 2
04 3
08 4
27 3
86 3
04 2
32 3
19 4
65 4
62O
ther
ope
ratin
g ex
pens
es3
624
3 69
53
824
3 99
34
313
4 21
04
254
4 39
64
470
4 57
9G
rant
s2
682
3 54
02
819
3 18
32
726
2 60
12
626
2 64
22
732
2 85
8To
tal e
xpen
ses
13 7
6415
347
15 0
6916
164
16 2
8216
487
16 5
4716
852
17 3
1517
776
equa
lsN
et o
pera
ting
bala
nce
- 233
187
- 53
- 258
- 948
-1 2
32- 4
79 4
06 7
76 8
83pl
usO
ther
eco
nom
ic fl
ows
708
11 8
302
905
-3 5
563
113
1 07
7 3
95 4
74 5
64 6
30eq
uals
Com
preh
ensi
ve re
sult
— to
tal c
hang
e in
net
wor
th 4
7512
017
2 85
2-3
814
2 16
4- 1
55- 8
4 8
801
340
1 51
3
Net
ope
ratin
g ba
lanc
e(a)
- 233
187
- 53
- 258
- 948
-1 2
32- 4
79 4
06 7
76 8
83le
ssN
et a
cqui
sitio
n of
non
-fina
ncia
l ass
ets
Pur
chas
es o
f non
-fina
ncia
l ass
ets
1 30
52
144
2 12
21
876
2 00
81
567
1 21
74
067
1 12
51
374
less
Sal
es o
f non
-fina
ncia
l ass
ets
108
29
82
322
1 19
7 1
27 3
89 8
4 9
9 2
5le
ss D
epre
ciat
ion
566
633
670
718
762
864
927
990
1 06
51
084
plus
Cha
nge
in in
vent
orie
s 7
3—
3 7
——
——
—pl
us O
ther
mov
emen
ts in
non
-fina
ncia
l ass
ets
—- 2
06—
——
——
——
—eq
uals
Tot
al n
et a
cqui
sitio
n of
non
-fina
ncia
l ass
ets
639
1 27
91
370
839
55
576
- 99
2 99
3- 3
9 2
66eq
uals
Net
lend
ing/
borr
owin
g(a)
- 872
-1 0
92-1
422
-1 0
98-1
003
-1 8
08- 3
80-2
587
814
617
Not
e: T
otal
s m
ay n
ot a
dd d
ue to
roun
ding
. (a
) Th
ere
is a
stru
ctur
al b
reak
in 2
013–
14 in
the
met
hodo
logy
use
d to
cal
cula
te th
e no
min
al s
uper
annu
atio
n in
tere
st e
xpen
se.
This
acc
ount
ing
chan
ge is
in a
ccor
danc
e w
ith A
ASB
119
Em
ploy
ee
Ben
efits
and
resu
lts in
det
erio
ratio
n to
the
net o
pera
ting
bala
nce
and
net l
endi
ng.
(b)
Ther
e is
a s
truct
ural
bre
ak in
201
3–14
in th
e pr
esen
tatio
n of
inte
rest
inco
me
and
inte
rest
exp
ense
. In
tere
st in
com
e ea
rned
on
cash
and
dep
osits
is o
ffset
with
inte
rest
exp
ense
on
the
borro
win
gs th
e Tr
easu
rer h
as w
ith S
AFA
. Th
is re
sults
in a
redu
ctio
n to
inte
rest
inco
me
and
inte
rest
exp
ense
acc
ordi
ngly
.
Appendix B: General government and non-financial public sector financial statistics time series
162 2014–15 Budget Statement
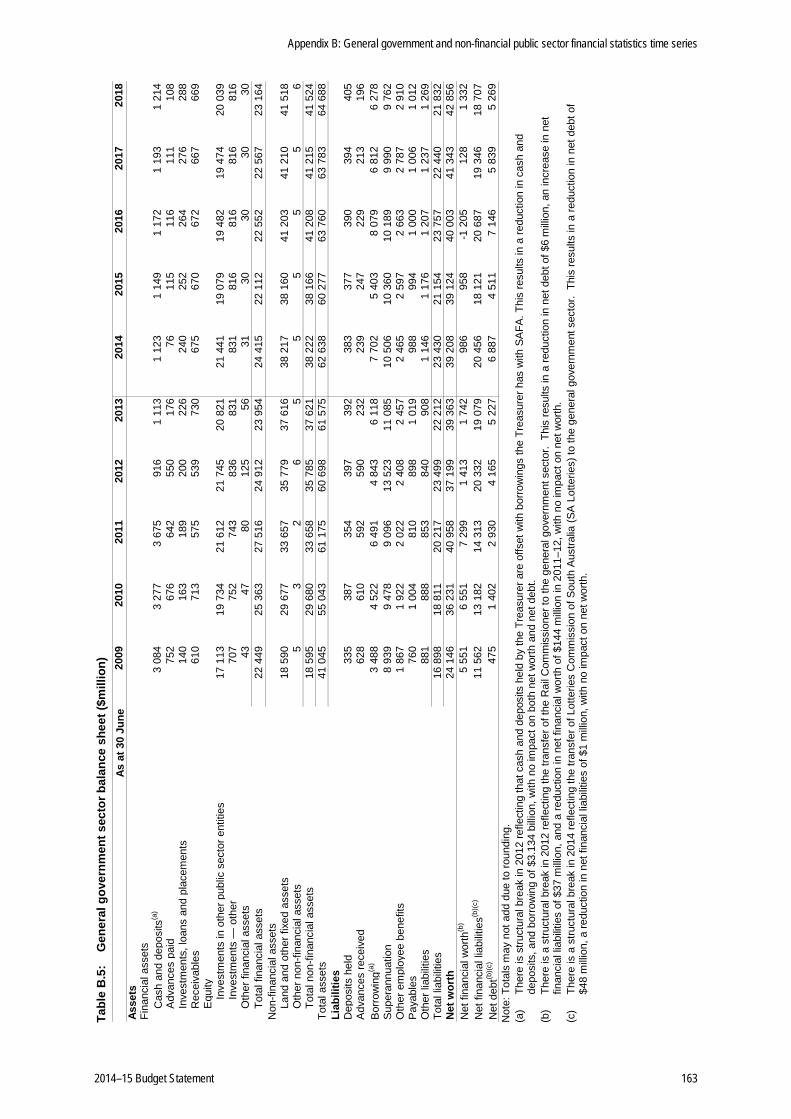
Tabl
e B
.5:
Gen
eral
gov
ernm
ent s
ecto
r bal
ance
she
et ($
mill
ion)
As
at 3
0 Ju
ne20
0920
1020
1120
1220
1320
1420
1520
1620
1720
18As
sets
Fina
ncia
l ass
ets
Cas
h an
d de
posi
ts(a
)3
084
3 27
73
675
916
1 11
31
123
1 14
91
172
1 19
31
214
Adv
ance
s pa
id 7
52 6
76 6
42 5
50 1
76 7
6 1
15 1
16 1
11 1
08In
vest
men
ts, l
oans
and
pla
cem
ents
140
163
189
200
226
240
252
264
276
288
Rec
eiva
bles
610
713
575
539
730
675
670
672
667
669
Equ
ity
Inve
stm
ents
in o
ther
pub
lic s
ecto
r ent
ities
17 1
1319
734
21 6
1221
745
20 8
2121
441
19 0
7919
482
19 4
7420
039
In
vest
men
ts —
oth
er 7
07 7
52 7
43 8
36 8
31 8
31 8
16 8
16 8
16 8
16O
ther
fina
ncia
l ass
ets
43
47
80
125
56
31
30
30
30
30
Tota
l fin
anci
al a
sset
s22
449
25 3
6327
516
24 9
1223
954
24 4
1522
112
22 5
5222
567
23 1
64N
on-fi
nanc
ial a
sset
sLa
nd a
nd o
ther
fixe
d as
sets
18 5
9029
677
33 6
5735
779
37 6
1638
217
38 1
6041
203
41 2
1041
518
Oth
er n
on-fi
nanc
ial a
sset
s 5
3 2
6 5
5 5
5 5
6To
tal n
on-fi
nanc
ial a
sset
s18
595
29 6
8033
658
35 7
8537
621
38 2
2238
166
41 2
0841
215
41 5
24To
tal a
sset
s41
045
55 0
4361
175
60 6
9861
575
62 6
3860
277
63 7
6063
783
64 6
88Li
abili
ties
Dep
osits
hel
d 3
35 3
87 3
54 3
97 3
92 3
83 3
77 3
90 3
94 4
05A
dvan
ces
rece
ived
628
610
592
590
232
239
247
229
213
196
Bor
row
ing(a
)3
488
4 52
26
491
4 84
36
118
7 70
25
403
8 07
96
812
6 27
8S
uper
annu
atio
n8
939
9 47
89
096
13 5
2311
085
10 5
0610
360
10 1
899
990
9 76
2O
ther
em
ploy
ee b
enef
its1
867
1 92
22
022
2 40
82
457
2 46
52
597
2 66
32
787
2 91
0P
ayab
les
760
1 00
4 8
10 8
981
019
988
994
1 00
01
006
1 01
2O
ther
liab
ilitie
s 8
81 8
88 8
53 8
40 9
081
146
1 17
61
207
1 23
71
269
Tota
l lia
bilit
ies
16 8
9818
811
20 2
1723
499
22 2
1223
430
21 1
5423
757
22 4
4021
832
Net
wor
th24
146
36 2
3140
958
37 1
9939
363
39 2
0839
124
40 0
0341
343
42 8
56N
et fi
nanc
ial w
orth
(b)
5 55
16
551
7 29
91
413
1 74
2 9
86 9
58-1
205
128
1 33
2N
et fi
nanc
ial l
iabi
litie
s(b)(c
) 11
562
13 1
8214
313
20 3
3219
079
20 4
5618
121
20 6
8719
346
18 7
07N
et d
ebt(b
)(c)
475
1 40
22
930
4 16
55
227
6 88
74
511
7 14
65
839
5 26
9
Not
e: T
otal
s m
ay n
ot a
dd d
ue to
roun
ding
. (a
) Th
ere
is s
truct
ural
bre
ak in
201
2 re
flect
ing
that
cas
h an
d de
posi
ts h
eld
by th
e Tr
easu
rer a
re o
ffset
with
bor
row
ings
the
Trea
sure
r has
with
SA
FA. T
his
resu
lts in
a re
duct
ion
in c
ash
and
depo
sits
, and
bor
row
ing
of $
3.13
4 bi
llion
, with
no
impa
ct o
n bo
th n
et w
orth
and
net
deb
t. (b
) Th
ere
is a
stru
ctur
al b
reak
in 2
012
refle
ctin
g th
e tra
nsfe
r of t
he R
ail C
omm
issi
oner
to th
e ge
nera
l gov
ernm
ent s
ecto
r. T
his
resu
lts in
a re
duct
ion
in n
et d
ebt o
f $6
milli
on, a
n in
crea
se in
net
fin
anci
al li
abilit
ies
of $
37 m
illion
, and
a re
duct
ion
in n
et fi
nanc
ial w
orth
of $
144
milli
on in
201
1–12
, with
no
impa
ct o
n ne
t wor
th.
(c)
Th
ere
is a
stru
ctur
al b
reak
in 2
014
refle
ctin
g th
e tra
nsfe
r of L
otte
ries
Com
mis
sion
of S
outh
Aus
tralia
(SA
Lot
terie
s) to
the
gene
ral g
over
nmen
t sec
tor.
Thi
s re
sults
in a
redu
ctio
n in
net
deb
t of
$48
mill
ion,
a re
duct
ion
in n
et fi
nanc
ial l
iabi
litie
s of
$1
mill
ion,
with
no
impa
ct o
n ne
t wor
th.
Appendix B: General government and non-financial public sector financial statistics time series
2014–15 Budget Statement 163

Non-financial public sector
Table B.6: Non-financial public sector key operating statement aggregates
Net operating
balance
Net acquisition of non-financial
assetsNet
lending
$m% real
growth % GSP $m% real
growth % GSP $m $m $m1998–99 9 468 21.8 9 597 22.1 - 129 - 115 - 141999–2000 9 206 -5.2 20.3 9 552 -2.9 21.0 - 346 -3 508 3 1612000–01 9 051 -4.5 18.7 9 279 -5.7 19.1 - 228 -1 111 8832001–02 9 367 0.3 17.9 9 487 -0.9 18.1 - 120 - 124 52002–03 10 172 4.4 18.3 9 696 -1.7 17.5 476 72 4052003–04 10 707 2.2 18.0 10 294 3.1 17.3 413 33 3792004–05 11 343 3.5 18.3 11 029 4.6 17.8 314 125 1892005–06 11 807 0.9 17.9 11 634 2.3 17.7 172 53 1192006–07 12 321 1.7 17.3 12 175 2.0 17.1 147 173 - 262007–08 13 634 7.1 17.6 13 065 3.9 16.8 569 303 2662008–09 14 360 2.1 17.9 14 567 8.1 18.2 - 207 1 249 -1 4562009–10(a) 16 315 11.2 19.5 15 679 5.3 18.7 636 2 361 -1 7252010–11(a) 15 960 -5.2 17.8 15 939 -1.5 17.8 21 1 920 -1 8982011–12 16 866 3.0 18.1 16 908 3.3 18.2 - 41 1 383 -1 4242012–13 16 494 -4.1 17.3 17 152 -0.6 18.0 - 657 64 - 7212013–14(b)(c) 16 328 -3.7 16.5 17 784 0.9 18.0 -1 457 643 -2 1002014–15 17 316 3.5 16.7 18 002 -1.2 17.4 - 686 - 27 - 6592015–16 18 470 4.1 17.0 18 244 -1.1 16.8 225 2 971 -2 7452016–17 19 357 2.2 17.0 18 730 0.2 16.5 627 - 68 6952017–18 19 950 0.6 16.7 19 164 -0.2 16.1 786 221 565
Revenue Expenses
Note: Totals may not add due to rounding.
(a) In 2009–10 and 2010–11 revenue, expenses and net acquisition of non-financial assets are impacted by the Commonwealth Government’s Nation Building ― Economic Stimulus Plan.
(b) There is a structural break in 2013–14 in the methodology used to calculate the nominal superannuation interest expense. This accounting change is in accordance with AASB 119 Employee Benefits and results in deterioration to the net operating balance and net lending.
(c) There is a structural break in 2013–14 in the presentation of interest income and interest expense. Interest income earned on cash and deposits is offset with interest expense on the borrowings the Treasurer has with SAFA. This results in a reduction to interest income and interest expense accordingly.
Appendix B: General government and non-financial public sector financial statistics time series
164 2014–15 Budget Statement

Table B.7: Non-financial public sector key balance sheet aggregates ($million)
As at 30 June Net debt(a)Unfunded
superannuation(b)Net financial
liabilitiesNet financial
worth Net worth1988 4 3971989 4 1971990 4 4571991 5 4181992 8 1421993 11 6101994 10 5501995 8 8441996 8 4321997 8 1701998 7 9271999 7 657 3 909 13 099 -12 256 10 6242000 4 355 3 543 9 914 -8 986 12 4452001 3 223 3 249 8 151 -7 109 14 8162002 3 317 3 998 8 973 -7 902 14 7212003 2 696 4 445 9 096 -8 811 15 2882004 2 285 5 668 10 031 -9 550 15 7602005 2 126 7 227 11 511 -11 004 16 3592006 1 786 6 146 10 451 -9 889 19 7032007(c) 1 989 5 075 9 518 -8 795 22 1282008(d)(e) 1 611 6 468 10 208 -10 487 23 7412009 2 872 8 939 14 302 -14 921 24 1462010 4 487 9 478 16 626 -16 997 36 2312011 6 541 9 096 18 273 -18 402 40 9582012 7 996 13 523 24 500 -25 123 37 1992013 8 949 11 085 23 064 -23 223 39 3632014 10 931 10 506 24 736 -24 627 39 2082015 11 497 10 360 25 355 -25 300 39 1242016 14 266 10 189 28 060 -28 031 40 0032017 13 075 9 990 26 829 -27 275 41 3432018 12 545 9 762 26 227 -26 647 42 856
(a) Net debt data for the years before 1999 is sourced from ABS, Government Financial Estimates 2003–04 (Catalogue no. 5501).
(b) There is a structural break in the methodology used to calculate superannuation liabilities between June 2003 and June 2004. This accounting change, which involved the adoption of Commonwealth Government bond rate for valuation purposes in line with AASB119, Employee Benefits, resulted in a significant increase in superannuation liabilities.
(c) There is a structural break in 2007 reflecting the amalgamation of SAFA and SAICORP on 1 July 2006. The transfer of SAICORP assets and liabilities from the general government sector to the public financial corporations sector resulted in an increase in non-financial public sector net debt of $99 million at 1 July 2006 and an increase in net financial liabilities of $90 million at 1 July 2006.
(d) There is a structural break in 2008 reflecting the amalgamation of the South Australian Community Housing Authority (public financial corporation) with the South Australian Housing Trust (public non-financial corporation). This results in an increase in net debt and net financial liabilities and a decrease in net financial worth of $98 million in 2007–08, with no impact on net worth.
(e) There is a structural break in 2008 reflecting the first time recognition on the general government balance sheet of South Australia’s share of the net assets of the Murray-Darling Basin Commission. This has no impact on net debt, however results in a reduction in net financial liabilities of $615 million in 2007–08, and increases in net financial worth and net worth of $615 million.
Appendix B: General government and non-financial public sector financial statistics time series
2014–15 Budget Statement 165

Table B.8: Non-financial public sector receipts, payments and surplus ($million)(a)
Receipts Payments ABS Cash surplus1979–80 2 681 2 388 2921980–81 2 877 2 649 2281981–82 3 145 2 963 1821982–83 3 651 3 356 2951983–84 4 383 4 014 3691984–85 4 887 4 356 5311985–86 5 172 4 415 7571986–87 5 542 4 790 7521987–88 6 078 5 299 7801988–89 6 946 5 784 1 1621989–90 7 517 6 465 1 0521990–91 7 830 6 839 9911991–92 8 352 7 969 3831992–93 8 939 7 946 9931993–94 8 761 8 119 6421994–95 8 570 8 142 4281995–96 8 985 8 654 3311996–97 8 908 8 532 3751997–98 9 426 8 895 5321998–99 9 301 8 692 6091999–2000 13 014 9 501 3 5132000–01 10 572 9 414 1 1582001–02 9 726 9 722 42002–03 10 439 9 805 6342003–04 10 891 10 403 4882004–05 12 051 11 786 2652005–06 12 239 11 868 3702006–07 12 684 12 809 - 1252007–08 13 943 13 477 4662008–09 14 563 15 806 -1 2432009–10 16 847 18 695 -1 8492010–11 16 548 18 553 -2 0042011–12 17 431 18 863 -1 4322012–13 17 814 19 133 -1 3192013–14 16 665 18 664 -1 9992014–15 17 820 18 388 - 5692015–16 18 617 21 373 -2 7562016–17 19 521 18 817 7052017–18 19 955 19 410 545
Note: Totals may not add due to rounding.
(a) There is a break in the series between 1998–99 and 1999–2000. Data for the years before 1999–2000 is sourced from the ABS and are consistent with ABS GFS reporting requirements on a cash basis. Capital receipts and payments, including payments associated with the provision of financial support for state owned financial institutions (which were treated by the ABS as an ‘investment in financial assets for policy purposes’) are not included in the series before 1999–2000. After 1998–99, data is derived from an accrual ABS GFS reporting framework, with receipts proxied by receipts from operating activities and sales of non-financial assets, and payments proxied by payments for operating activities, purchases of non-financial assets and net acquisition of assets under finance leases and similar arrangements. Due to the associated methodological and data-source changes, time series data that encompasses measures derived under both cash and accrual accounting should be used with caution.
Appendix B: General government and non-financial public sector financial statistics time series
166 2014–15 Budget Statement
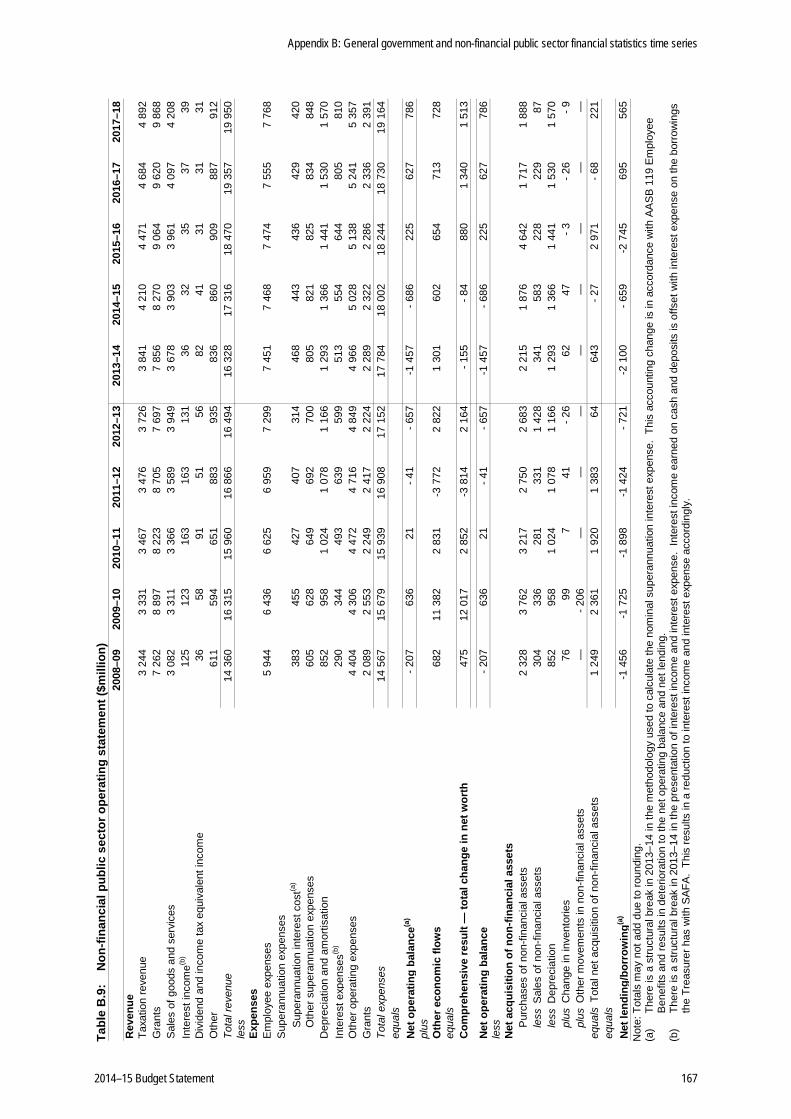
Tabl
e B
.9:
Non
-fina
ncia
l pub
lic s
ecto
r ope
ratin
g st
atem
ent (
$mill
ion)
20
08–0
920
09–1
020
10–1
120
11–1
220
12–1
320
13–1
420
14–1
520
15–1
620
16–1
720
17–1
8R
even
ueTa
xatio
n re
venu
e3
244
3 33
13
467
3 47
63
726
3 84
14
210
4 47
14
684
4 89
2G
rant
s7
262
8 89
78
223
8 70
57
697
7 85
68
270
9 06
49
620
9 86
8S
ales
of g
oods
and
ser
vice
s3
082
3 31
13
366
3 58
93
949
3 67
83
903
3 96
14
097
4 20
8In
tere
st in
com
e(b)
125
123
163
163
131
36
32
35
37
39
Div
iden
d an
d in
com
e ta
x eq
uiva
lent
inco
me
36
58
91
51
56
82
41
31
31
31
Oth
er 6
11 5
94 6
51 8
83 9
35 8
36 8
60 9
09 8
87 9
12To
tal r
even
ue14
360
16 3
1515
960
16 8
6616
494
16 3
2817
316
18 4
7019
357
19 9
50le
ssEx
pens
esE
mpl
oyee
exp
ense
s5
944
6 43
66
625
6 95
97
299
7 45
17
468
7 47
47
555
7 76
8S
uper
annu
atio
n ex
pens
esS
uper
annu
atio
n in
tere
st c
ost(a
) 3
83 4
55 4
27 4
07 3
14 4
68 4
43 4
36 4
29 4
20O
ther
sup
eran
nuat
ion
expe
nses
605
628
649
692
700
805
821
825
834
848
Dep
reci
atio
n an
d am
ortis
atio
n 8
52 9
581
024
1 07
81
166
1 29
31
366
1 44
11
530
1 57
0In
tere
st e
xpen
ses(b
) 2
90 3
44 4
93 6
39 5
99 5
13 5
54 6
44 8
05 8
10O
ther
ope
ratin
g ex
pens
es4
404
4 30
64
472
4 71
64
849
4 96
65
028
5 13
85
241
5 35
7G
rant
s2
089
2 55
32
249
2 41
72
224
2 28
92
322
2 28
62
336
2 39
1To
tal e
xpen
ses
14 5
6715
679
15 9
3916
908
17 1
5217
784
18 0
0218
244
18 7
3019
164
equa
lsN
et o
pera
ting
bala
nce(a
)- 2
07 6
36 2
1- 4
1- 6
57-1
457
- 686
225
627
786
plus
Oth
er e
cono
mic
flow
s 6
8211
382
2 83
1-3
772
2 82
21
301
602
654
713
728
equa
lsC
ompr
ehen
sive
resu
lt —
tota
l cha
nge
in n
et w
orth
475
12 0
172
852
-3 8
142
164
- 155
- 84
880
1 34
01
513
Net
ope
ratin
g ba
lanc
e- 2
07 6
36 2
1- 4
1- 6
57-1
457
- 686
225
627
786
less
Net
acq
uisi
tion
of n
on-fi
nanc
ial a
sset
sP
urch
ases
of n
on-fi
nanc
ial a
sset
s2
328
3 76
23
217
2 75
02
683
2 21
51
876
4 64
21
717
1 88
8le
ss S
ales
of n
on-fi
nanc
ial a
sset
s 3
04 3
36 2
81 3
311
428
341
583
228
229
87
less
Dep
reci
atio
n 8
52 9
581
024
1 07
81
166
1 29
31
366
1 44
11
530
1 57
0pl
us C
hang
e in
inve
ntor
ies
76
99
7 4
1- 2
6 6
2 4
7- 3
- 26
- 9pl
us O
ther
mov
emen
ts in
non
-fina
ncia
l ass
ets
—- 2
06—
——
——
——
—eq
uals
Tot
al n
et a
cqui
sitio
n of
non
-fina
ncia
l ass
ets
1 24
92
361
1 92
01
383
64
643
- 27
2 97
1- 6
8 2
21eq
uals
Net
lend
ing/
borr
owin
g(a)
-1 4
56-1
725
-1 8
98-1
424
- 721
-2 1
00- 6
59-2
745
695
565
Not
e: T
otal
s m
ay n
ot a
dd d
ue to
roun
ding
. (a
) Th
ere
is a
stru
ctur
al b
reak
in 2
013–
14 in
the
met
hodo
logy
use
d to
cal
cula
te th
e no
min
al s
uper
annu
atio
n in
tere
st e
xpen
se.
This
acc
ount
ing
chan
ge is
in a
ccor
danc
e w
ith A
ASB
119
Em
ploy
ee
Ben
efits
and
resu
lts in
det
erio
ratio
n to
the
net o
pera
ting
bala
nce
and
net l
endi
ng.
(b)
Ther
e is
a s
truct
ural
bre
ak in
201
3–14
in th
e pr
esen
tatio
n of
inte
rest
inco
me
and
inte
rest
exp
ense
. In
tere
st in
com
e ea
rned
on
cash
and
dep
osits
is o
ffset
with
inte
rest
exp
ense
on
the
borro
win
gs
the
Trea
sure
r has
with
SAF
A. T
his
resu
lts in
a re
duct
ion
to in
tere
st in
com
e an
d in
tere
st e
xpen
se a
ccor
ding
ly.
Appendix B: General government and non-financial public sector financial statistics time series
2014–15 Budget Statement 167

Tabl
e B
.10:
Non
-fina
ncia
l pub
lic s
ecto
r bal
ance
she
et ($
mill
ion)
As a
t 30
June
2009
2010
2011
2012
2013
2014
2015
2016
2017
2018
Asse
tsFi
nanc
ial a
sset
sC
ash
and
depo
sits
(a)
3 36
03
573
3 96
11
207
1 44
01
256
1 22
21
247
1 27
81
311
Adv
ance
s pa
id 7
1 7
2 9
9 7
7 6
2 6
5 9
7 9
1 7
9 7
5In
vest
men
ts, l
oans
and
pla
cem
ents
176
232
228
242
270
285
298
311
325
338
Rec
eiva
bles
520
766
635
662
877
819
807
833
836
842
Equ
ity
Inve
stm
ents
in o
ther
pub
lic s
ecto
r ent
ities
- 619
- 371
- 128
- 623
- 159
110
55
29
- 446
- 420
In
vest
men
ts —
oth
er 7
27 7
66 7
61 8
52 8
48 8
48 8
33 8
33 8
33 8
33O
ther
fina
ncia
l ass
ets
82
104
83
126
56
31
31
31
30
30
Tota
l fin
anci
al a
sset
s4
316
5 14
35
638
2 54
33
394
3 41
23
342
3 37
52
936
3 00
9N
on-fi
nanc
ial a
sset
sLa
nd a
nd fi
xed
asse
ts39
059
53 2
2459
302
62 3
1162
574
63 8
2064
409
68 0
1968
597
69 4
83O
ther
non
-fina
ncia
l ass
ets
8 4
57
12
12
14
15
15
20
21
Tota
l non
-fina
ncia
l ass
ets
39 0
6753
228
59 3
5962
322
62 5
8663
834
64 4
2468
034
68 6
1869
504
Tota
l ass
ets
43 3
8458
371
64 9
9764
866
65 9
8167
247
67 7
6671
409
71 5
5372
512
Liab
ilitie
sD
epos
its h
eld
174
171
171
177
172
173
173
174
174
175
Adv
ance
s re
ceiv
ed 6
28 6
10 5
92 5
90 2
32 2
39 2
47 2
29 2
13 1
96B
orro
win
g(a)
5 67
77
583
10 0
658
755
10 3
1812
124
12 6
9415
512
14 3
7013
898
Sup
eran
nuat
ion
8 93
99
478
9 09
613
523
11 0
8510
506
10 3
6010
189
9 99
09
762
Oth
er e
mpl
oyee
ben
efits
1 94
42
003
2 10
62
486
2 53
12
538
2 67
12
739
2 86
32
988
Pay
able
s 9
071
319
1 07
71
204
1 21
51
164
1 16
71
196
1 19
91
201
Oth
er li
abili
ties
969
975
932
932
1 06
41
296
1 33
01
366
1 40
11
437
Tota
l lia
bilit
ies
19 2
3722
140
24 0
4027
667
26 6
1728
039
28 6
4231
405
30 2
1029
656
Net
wor
th24
146
36 2
3140
958
37 1
9939
363
39 2
0839
124
40 0
0341
343
42 8
56N
et fi
nanc
ial w
orth
-14
921
-16
997
-18
402
-25
123
-23
223
-24
627
-25
300
-28
031
-27
275
-26
647
Net
fina
ncia
l lia
bilit
ies
14 3
0216
626
18 2
7324
500
23 0
6424
736
25 3
5528
060
26 8
2926
227
Net
deb
t2
872
4 48
76
541
7 99
68
949
10 9
3111
497
14 2
6613
075
12 5
45
Not
e: T
otal
s m
ay n
ot a
dd d
ue to
roun
ding
. (a
) Th
ere
is a
stru
ctur
al b
reak
in 2
012
refle
ctin
g th
at c
ash
and
depo
sits
hel
d by
the
Trea
sure
r are
offs
et w
ith b
orro
win
gs th
e Tr
easu
rer h
as w
ith S
AFA
. Th
is re
sults
in a
redu
ctio
n in
cas
h an
d de
posi
ts,
and
borro
win
gs o
f $3.
134
mill
ion,
with
no
impa
ct o
n bo
th n
et w
orth
and
net
deb
t.
Appendix B: General government and non-financial public sector financial statistics time series
168 2014–15 Budget Statement

2013–142014–15 Estimated 2013–14Budget Result Budget
$000 $000 $000
ReceiptsTaxation 3 977 217 3 813 051 3 799 926Commonwealth general purpose grants 4 956 300 4 646 800 4 595 000Commonwealth specific purpose grants 271 128 404 320 578 576Commonwealth National Partnership payments 31 704 290 030 90 918Contributions from state undertakings 263 880 419 751 343 646Fees and charges 479 797 400 961 404 013Recoveries 51 442 459 611 148 100Royalties 323 062 295 234 276 131Other receipts 2 826 529 258 061 156 855Total receipts 13 181 059 10 987 819 10 393 165
PaymentsAppropriation Act 11 496 312 12 305 152 12 245 316Specific appropriation authorised in various Acts 110 242 139 088 132 137Total payments 11 606 554 12 444 240 12 377 453
Consolidated Account financing requirement -1 574 505 1 456 421 1 984 288
Borrowing from (+) repayment to (-) South Australian GovernmentFinancing Authority -1 574 505 1 456 421 1 984 288
Appendix C: Consolidated Account
Table C.1: Summary of receipts and payments
2014–15 Budget Statement 169

2013–142014–15 Estimated 2013–14Budget Result Budget
$000 $000 $000
Payments from Appropriation Act Arts SA(a) — 129 676 132 559 Attorney-General's Department 97 446 85 586 85 898 Administered items for the Attorney-General's Department 125 951 62 300 107 276 Auditor-General's Department 16 191 15 427 16 016 Courts Administration Authority 92 158 91 686 89 348 Defence SA 16 467 16 294 16 482 Department for Communities and Social Inclusion 998 989 962 921 1 040 343 Administered items for the Department for Communities and Social Inclusion 184 930 173 956 179 118 Department for Correctional Services 267 808 229 692 241 375 Department for Education and Child Development 2 614 395 2 821 749 2 777 471 Administered items for the Department for Education and Child Development 238 563 228 711 228 818 Department for Health and Ageing 3 070 300 3 033 055 3 021 228 Department for Manufacturing, Innovation, Trade, Resources and Energy(a) — 92 031 89 407 Administered items for the Department for Manufacturing, Innovation, Trade, Resources and Energy(a) — 1 420 1 325 Department of Environment, Water and Natural Resources 117 130 166 282 184 701 Administered items for the Department of Environment, Water and Natural Resources 18 913 27 102 19 361 Department of Further Education, Employment, Science and Technology(a) — 543 295 488 973 Department of Planning, Transport and Infrastructure 501 908 762 561 747 396 Administered items for the Department of Planning, Transport and Infrastructure 10 022 14 579 14 790 Department of Primary Industries and Regions 107 229 77 198 78 136 Administered items for the Department of Primary Industries and Regions 3 311 4 553 3 516 Department of the Premier and Cabinet 91 807 114 615 95 827 Administered items for the Department of the Premier and Cabinet 2 079 8 052 7 930 Department of State Development(a) 644 298 — — Administered items for the Department of State Development(a) 7 665 — — Department of Treasury and Finance 49 379 61 265 61 572 Administered items for the Department of Treasury and Finance 1 392 192 1 767 308 1 702 329 Electoral Commission of South Australia 2 895 14 790 12 588 House of Assembly 8 894 8 609 8 615 Independent Gambling Authority 1 731 1 691 1 691 Joint Parliamentary Services 11 324 15 863 13 915 Legislative Council 5 963 5 673 5 575(a) Appropriation for Arts SA, Department for Manufacturing, Innovation, Trade, Resources and Energy including Administered Items and Department of Further Education, Employment, Science and Technology will transfer to the Department of State Development on 1 July 2014.
Table C.2: Estimates of payments
Appendix C: Consolidated Account
170 2014–15 Budget Statement

2013–142014–15 Estimated 2013–14Budget Result Budget
$000 $000 $000
Minister for Tourism 4 679 4 565 4 565 South Australia Police 737 614 706 274 713 028 Administered items for South Australia Police 173 173 173 South Australian Tourism Commission 50 502 52 884 50 515 State Governor's Establishment 3 406 3 316 3 456Total payments appropriated for administrative units, statutory authorities and ministers 11 496 312 12 305 152 12 245 316
Payments for which specific appropriation is authorised in various Acts 110 242 139 088 132 137
Total Consolidated Account payments 11 606 554 12 444 240 12 377 453
Payments for which specific appropriation is authorised in various Acts
Salaries and allowancesAgent-General — pursuant to Agent-General Act 1901 104 101 101Auditor-General — pursuant to Public Finance and Audit Act 1987 308 303 302Commissioners of Environment, Resource and DevelopmentCourt — pursuant to Remuneration Act 1990 1 234 1 200 1 198Commissioner of Police — pursuant to Police Act 1998 432 422 422State Coroner and Deputy Coroner — pursuant to Remuneration Act 1990 879 854 857Electoral Commissioner and Deputy Electoral Commissioner — pursuant to Electoral Act 1985 413 404 376Electoral District Boundaries Commission —pursuant to Constitution Act 1934 541 — — Employee Ombudsman — pursuant to Fair Work Act 1994 167 164 164Governor — pursuant to Constitution Act 1934 331 321 312Judges — pursuant to Remuneration Act 1990
Chief Justice 702 684 684Judges and Masters 23 184 22 561 24 215
Magistrates — pursuant to Remuneration Act 1990 14 844 14 427 15 017Members of various standing committees — pursuant toParliamentary Remuneration Act 1990 and Parliamentary Committees Act 1991 836 836 895Ombudsman — pursuant to Ombudsman Act 1972 385 377 376Parliamentary salaries and electorate other allowances — pursuant to Parliamentary Remuneration Act 1990
Ministers, officers and members of parliament 14 828 14 636 14 564Senior Judge and judges of the Industrial Relations Courtand Commission — pursuant to Remuneration Act 1990 1 946 2 270 2 262Solicitor-General — pursuant to Solicitor-General Act 1972 628 615 614South Australian Civil and Administrative Tribunal —pursuant to Remuneration Act 1990 521 212 — Valuer-General — pursuant to Valuation of Land Act 1971 135 132 132Total salaries and allowances 62 418 60 519 62 491
OtherCompensation for injuries resulting from criminalacts — pursuant to Victims of Crime Act 2001 8 020 7 824 7 824First Home Owner Grant — pursuant to First Home Owner Grant Act 2000 39 804 70 745 61 822Total other 47 824 78 569 69 646
Total payments for which specific appropriation is authorised in various Acts 110 242 139 088 132 137
Table C.2: Estimates of payments (continued)
Appendix C: Consolidated Account
2014–15 Budget Statement 171
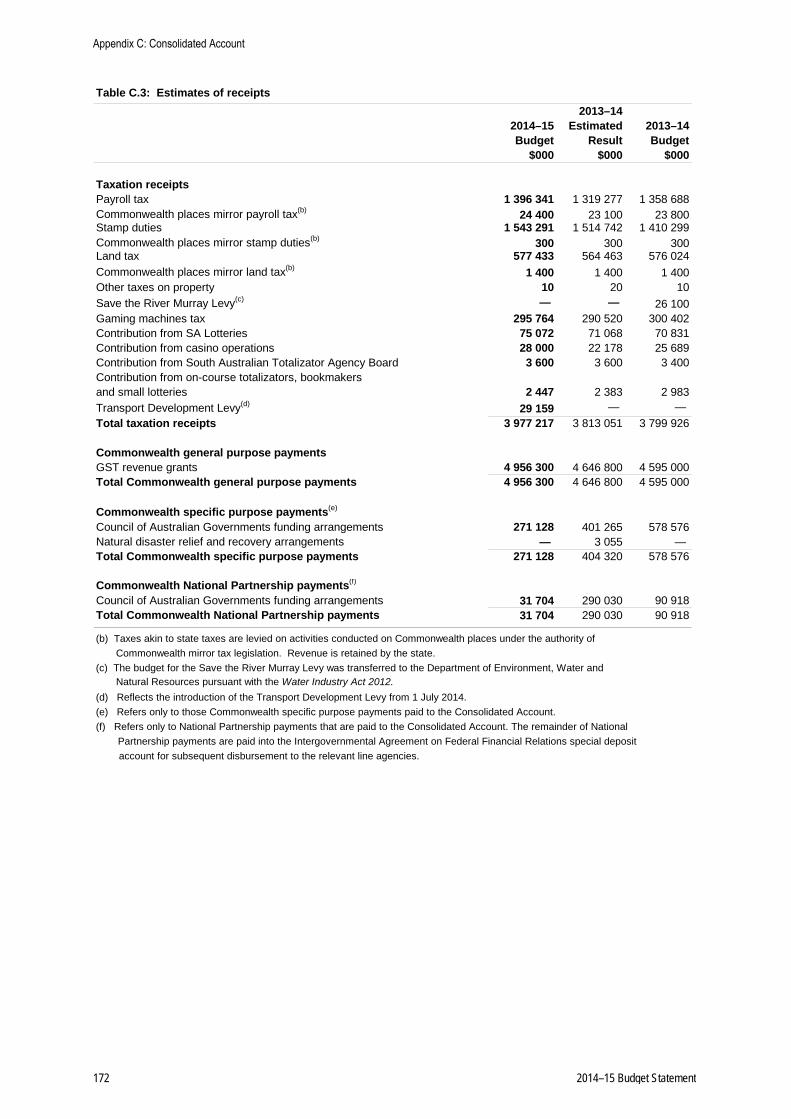
2013–142014–15 Estimated 2013–14Budget Result Budget
$000 $000 $000
Taxation receiptsPayroll tax 1 396 341 1 319 277 1 358 688Commonwealth places mirror payroll tax(b) 24 400 23 100 23 800Stamp duties 1 543 291 1 514 742 1 410 299Commonwealth places mirror stamp duties(b) 300 300 300Land tax 577 433 564 463 576 024Commonwealth places mirror land tax(b) 1 400 1 400 1 400Other taxes on property 10 20 10Save the River Murray Levy(c) — — 26 100Gaming machines tax 295 764 290 520 300 402Contribution from SA Lotteries 75 072 71 068 70 831Contribution from casino operations 28 000 22 178 25 689Contribution from South Australian Totalizator Agency Board 3 600 3 600 3 400Contribution from on-course totalizators, bookmakers and small lotteries 2 447 2 383 2 983Transport Development Levy(d) 29 159 — — Total taxation receipts 3 977 217 3 813 051 3 799 926
Commonwealth general purpose paymentsGST revenue grants 4 956 300 4 646 800 4 595 000Total Commonwealth general purpose payments 4 956 300 4 646 800 4 595 000
Commonwealth specific purpose payments(e)
Council of Australian Governments funding arrangements 271 128 401 265 578 576Natural disaster relief and recovery arrangements — 3 055 — Total Commonwealth specific purpose payments 271 128 404 320 578 576
Commonwealth National Partnership payments(f)
Council of Australian Governments funding arrangements 31 704 290 030 90 918Total Commonwealth National Partnership payments 31 704 290 030 90 918
(b) Taxes akin to state taxes are levied on activities conducted on Commonwealth places under the authority of Commonwealth mirror tax legislation. Revenue is retained by the state.(c) The budget for the Save the River Murray Levy was transferred to the Department of Environment, Water and Natural Resources pursuant with the Water Industry Act 2012.(d) Reflects the introduction of the Transport Development Levy from 1 July 2014.(e) Refers only to those Commonwealth specific purpose payments paid to the Consolidated Account.(f) Refers only to National Partnership payments that are paid to the Consolidated Account. The remainder of National
Partnership payments are paid into the Intergovernmental Agreement on Federal Financial Relations special deposit account for subsequent disbursement to the relevant line agencies.
Table C.3: Estimates of receipts
Appendix C: Consolidated Account
172 2014–15 Budget Statement
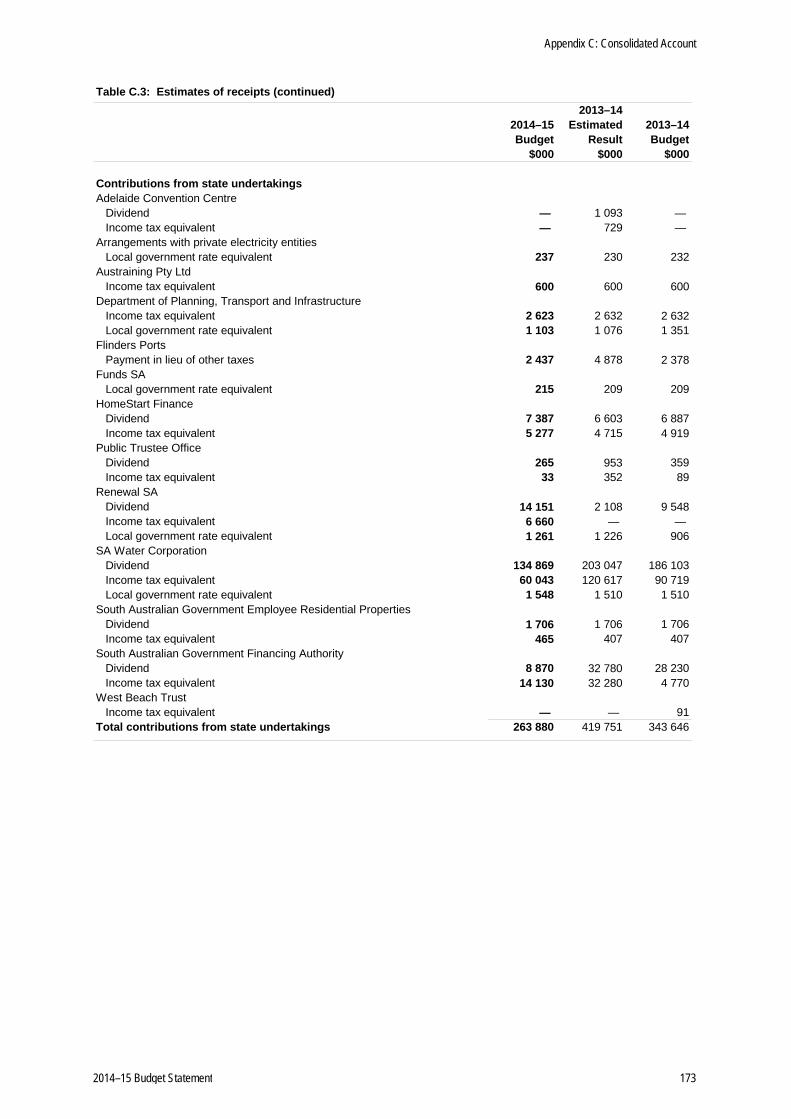
2013–142014–15 Estimated 2013–14Budget Result Budget
$000 $000 $000
Contributions from state undertakingsAdelaide Convention Centre Dividend — 1 093 — Income tax equivalent — 729 — Arrangements with private electricity entities Local government rate equivalent 237 230 232Austraining Pty Ltd Income tax equivalent 600 600 600Department of Planning, Transport and Infrastructure Income tax equivalent 2 623 2 632 2 632 Local government rate equivalent 1 103 1 076 1 351Flinders Ports Payment in lieu of other taxes 2 437 4 878 2 378Funds SA Local government rate equivalent 215 209 209HomeStart Finance Dividend 7 387 6 603 6 887 Income tax equivalent 5 277 4 715 4 919Public Trustee Office Dividend 265 953 359 Income tax equivalent 33 352 89Renewal SA Dividend 14 151 2 108 9 548 Income tax equivalent 6 660 — — Local government rate equivalent 1 261 1 226 906SA Water Corporation Dividend 134 869 203 047 186 103 Income tax equivalent 60 043 120 617 90 719 Local government rate equivalent 1 548 1 510 1 510South Australian Government Employee Residential Properties Dividend 1 706 1 706 1 706 Income tax equivalent 465 407 407South Australian Government Financing Authority Dividend 8 870 32 780 28 230 Income tax equivalent 14 130 32 280 4 770West Beach Trust Income tax equivalent — — 91Total contributions from state undertakings 263 880 419 751 343 646
Table C.3: Estimates of receipts (continued)
Appendix C: Consolidated Account
2014–15 Budget Statement 173
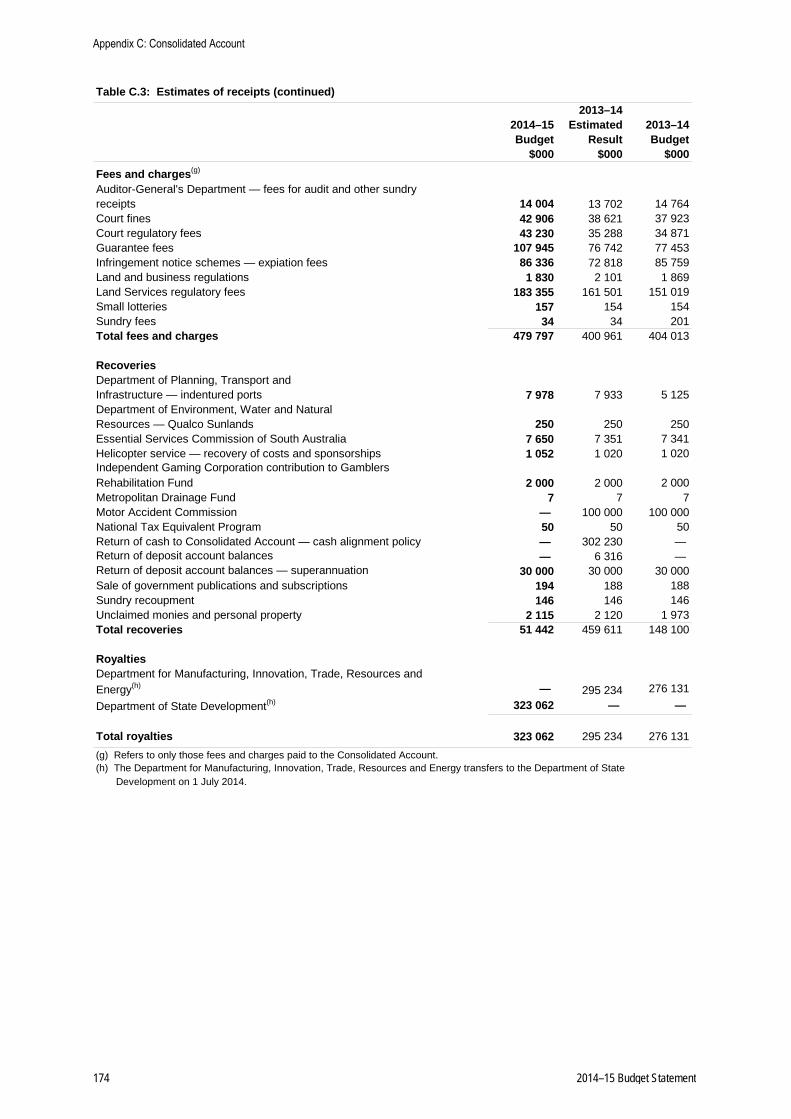
2013–142014–15 Estimated 2013–14Budget Result Budget
$000 $000 $000
Fees and charges(g)
Auditor-General's Department — fees for audit and other sundry receipts 14 004 13 702 14 764Court fines 42 906 38 621 37 923Court regulatory fees 43 230 35 288 34 871Guarantee fees 107 945 76 742 77 453Infringement notice schemes — expiation fees 86 336 72 818 85 759Land and business regulations 1 830 2 101 1 869Land Services regulatory fees 183 355 161 501 151 019Small lotteries 157 154 154Sundry fees 34 34 201Total fees and charges 479 797 400 961 404 013
RecoveriesDepartment of Planning, Transport and Infrastructure — indentured ports 7 978 7 933 5 125Department of Environment, Water and NaturalResources — Qualco Sunlands 250 250 250Essential Services Commission of South Australia 7 650 7 351 7 341Helicopter service — recovery of costs and sponsorships 1 052 1 020 1 020Independent Gaming Corporation contribution to GamblersRehabilitation Fund 2 000 2 000 2 000Metropolitan Drainage Fund 7 7 7Motor Accident Commission — 100 000 100 000National Tax Equivalent Program 50 50 50Return of cash to Consolidated Account — cash alignment policy — 302 230 — Return of deposit account balances — 6 316 — Return of deposit account balances — superannuation 30 000 30 000 30 000Sale of government publications and subscriptions 194 188 188Sundry recoupment 146 146 146Unclaimed monies and personal property 2 115 2 120 1 973Total recoveries 51 442 459 611 148 100
RoyaltiesDepartment for Manufacturing, Innovation, Trade, Resources andEnergy(h) — 295 234 276 131Department of State Development(h) 323 062 — —
Total royalties 323 062 295 234 276 131(g) Refers to only those fees and charges paid to the Consolidated Account.(h) The Department for Manufacturing, Innovation, Trade, Resources and Energy transfers to the Department of State Development on 1 July 2014.
Table C.3: Estimates of receipts (continued)
Appendix C: Consolidated Account
174 2014–15 Budget Statement
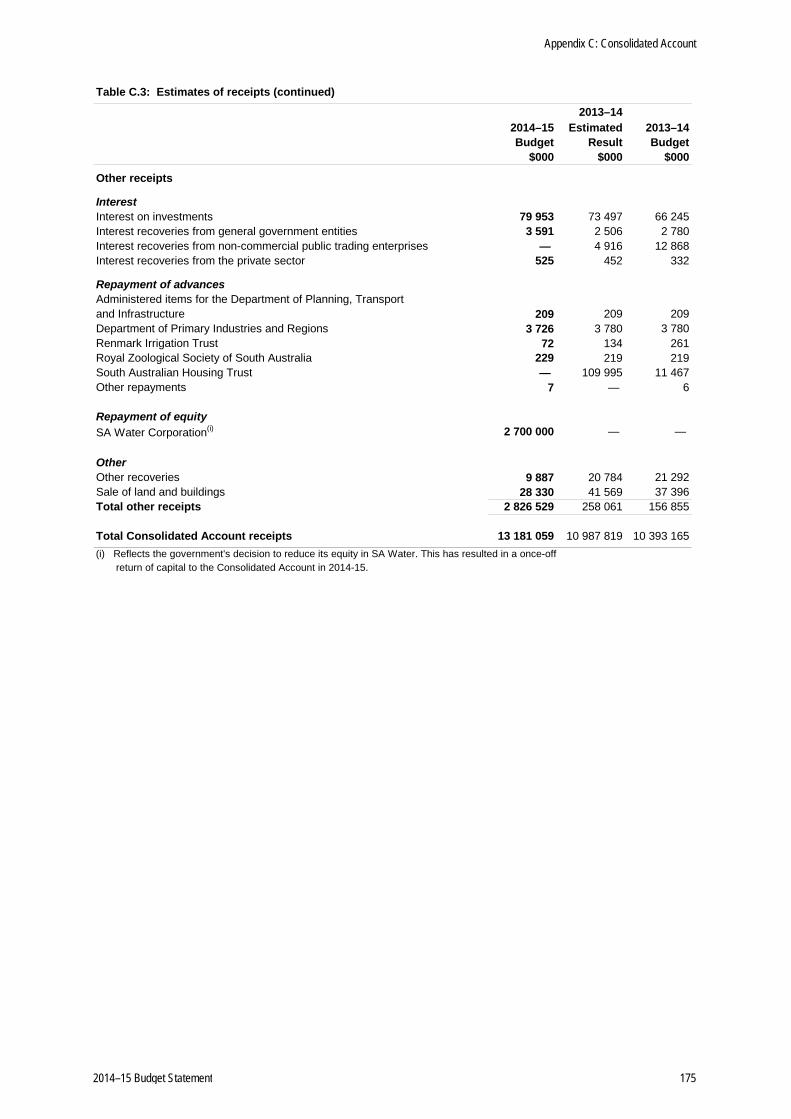
2013–142014–15 Estimated 2013–14Budget Result Budget
$000 $000 $000
Other receipts
InterestInterest on investments 79 953 73 497 66 245Interest recoveries from general government entities 3 591 2 506 2 780Interest recoveries from non-commercial public trading enterprises — 4 916 12 868Interest recoveries from the private sector 525 452 332
Repayment of advancesAdministered items for the Department of Planning, Transportand Infrastructure 209 209 209Department of Primary Industries and Regions 3 726 3 780 3 780Renmark Irrigation Trust 72 134 261Royal Zoological Society of South Australia 229 219 219South Australian Housing Trust — 109 995 11 467Other repayments 7 — 6
Repayment of equitySA Water Corporation(i) 2 700 000 — —
OtherOther recoveries 9 887 20 784 21 292Sale of land and buildings 28 330 41 569 37 396Total other receipts 2 826 529 258 061 156 855
Total Consolidated Account receipts 13 181 059 10 987 819 10 393 165(i) Reflects the government's decision to reduce its equity in SA Water. This has resulted in a once-off return of capital to the Consolidated Account in 2014-15.
Table C.3: Estimates of receipts (continued)
Appendix C: Consolidated Account
2014–15 Budget Statement 175

Appendix C: Consolidated Account
176 2014–15 Budget Statement

Appendix D: South Australian state public sector organisations
The entities listed below are controlled by the government and their income, expenses, assets, liabilities and equity have been included in the CFR. Some of these entities control other entities, in which case the consolidated accounts include the entities’ consolidated financial information.
The sectors to which these entities belong are based on the date of the release of the 2014–15 State Budget.
The government’s interest in each of the public non-financial corporations and public financial corporations listed below is 100 per cent.
General
Government Sector
Public Non-Financial Corporations
Sector
Public Financial
Corporations Sector
Adelaide Cemeteries Authority * Adelaide Convention Centre Corporation * Adelaide Entertainments Corporation (trading as Adelaide Entertainment Centre) *
Adelaide Festival Centre Trust * Adelaide Festival Corporation * Adelaide Film Festival * Adelaide and Mount Lofty Ranges Natural Resources Management Board *
Alinytjara Wilurara Natural Resources Management Board * Art Gallery Board, The * Attorney-General’s Department * Auditor-General’s Department * Australian Children’s Performing Arts Company (trading as Windmill Performing Arts) *
Bio Innovation SA * Carrick Hill Trust * Communities and Social Inclusion, Department for * Correctional Services, Department for * Courts Administration Authority * Dairy Authority of South Australia * Defence SA * Distribution Lessor Corporation * Education Adelaide * Education and Child Development, Department for * Electoral Commission of South Australia * Environment, Water and Natural Resources, Department of * Environment Protection Authority * Essential Services Commission of South Australia * Eyre Peninsula Natural Resources Management Board *
2014–15 Budget Statement 177
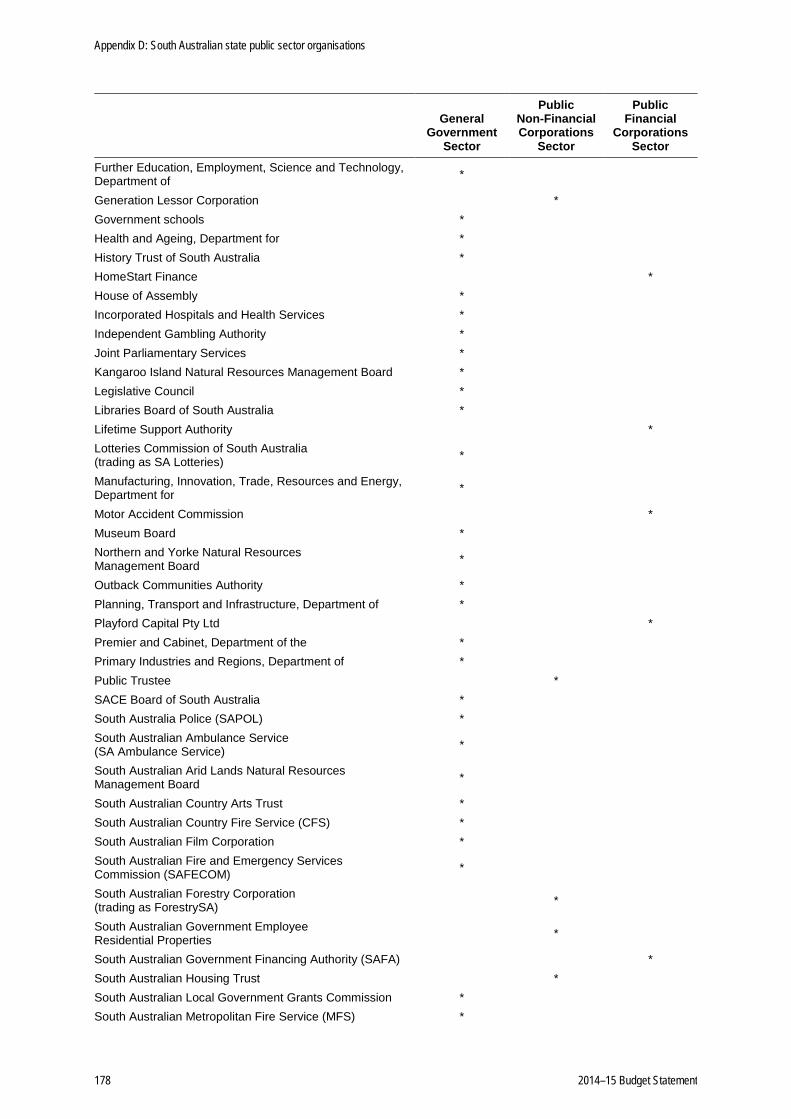
General
Government Sector
Public Non-Financial Corporations
Sector
Public Financial
Corporations Sector
Further Education, Employment, Science and Technology, Department of *
Generation Lessor Corporation * Government schools * Health and Ageing, Department for * History Trust of South Australia * HomeStart Finance * House of Assembly * Incorporated Hospitals and Health Services * Independent Gambling Authority * Joint Parliamentary Services * Kangaroo Island Natural Resources Management Board * Legislative Council * Libraries Board of South Australia * Lifetime Support Authority * Lotteries Commission of South Australia (trading as SA Lotteries) *
Manufacturing, Innovation, Trade, Resources and Energy, Department for *
Motor Accident Commission * Museum Board * Northern and Yorke Natural Resources Management Board *
Outback Communities Authority * Planning, Transport and Infrastructure, Department of * Playford Capital Pty Ltd * Premier and Cabinet, Department of the * Primary Industries and Regions, Department of * Public Trustee * SACE Board of South Australia * South Australia Police (SAPOL) * South Australian Ambulance Service (SA Ambulance Service) *
South Australian Arid Lands Natural Resources Management Board *
South Australian Country Arts Trust * South Australian Country Fire Service (CFS) * South Australian Film Corporation * South Australian Fire and Emergency Services Commission (SAFECOM) *
South Australian Forestry Corporation (trading as ForestrySA) *
South Australian Government Employee Residential Properties *
South Australian Government Financing Authority (SAFA) * South Australian Housing Trust * South Australian Local Government Grants Commission * South Australian Metropolitan Fire Service (MFS) *
Appendix D: South Australian state public sector organisations
178 2014–15 Budget Statement

General
Government Sector
Public Non-Financial Corporations
Sector
Public Financial
Corporations Sector
South Australian Motor Sport Board * South Australian Murray Darling Basin Natural Resources Management Board *
South Australian State Emergency Service (SES) * South Australian Tourism Commission * South Australian Water Corporation (trading as SA Water) * State Development, Department of * South East Natural Resources Management Board * South Eastern Water Conservation and Drainage Board * State Governor’s Establishment * State Opera of South Australia * State Procurement Board * State Theatre Company of South Australia * Superannuation Funds Management Corporation of South Australia (trading as Funds SA) *
TAFE SA * Transmission Lessor Corporation * Treasury and Finance, Department of * Urban Renewal Authority (trading as Renewal SA) * Venue Management, Office of * West Beach Trust (trading as Adelaide Shores) * WorkCover Corporation of South Australia * Zero Waste SA * Changes to controlled entities/reporting structures since the 2013–14 Budget:
Dissolved entities: Department of Planning and Local Government Abolition effective 30 June 2013.
*
New entities:
Department of State Development The Department of Manufacturing, Innovation, Trade, Resources and Energy and the Department of Further Education, Employment and Science and Technology will merge to form the new Department of State Development. Change effective 1 July 2014.
*
Lifetime Support Authority The Lifetime Support Authority of South Australia is a statutory authority established under the Motor Vehicle Accidents (Lifetime Support Scheme) Act 2013. Change effective 1 July 2013.
*
Appendix D: South Australian state public sector organisations
2014–15 Budget Statement 179

Appendix D: South Australian state public sector organisations
180 2014–15 Budget Statement

Appendix E: Tax expenditure statement
Overview
This statement provides a summary of tax expenditures incurred by the Government of South Australia in 2012−13 and 2013−14.
What are tax expenditures?
The term ‘tax expenditure’ refers to differential tax treatment where the difference constitutes a departure from the tax standard or benchmark.
Examples of tax expenditures can include revenue forgone from:
• tax exemptions
• reduced rates of taxation
• tax rebates or deductions
• deferral of the payment of tax liabilities.
Thus a tax expenditure is a reduction in tax revenue resulting from ‘preferential’ tax treatment. In practice, differentiating preferential tax treatment from tax differences that are integral to efficient revenue raising design is not always straightforward.
In the design of expenditure and revenue policy, governments observe various principles of fairness and equity. Such principles apply to decisions on taxation policies as well as decisions that underpin the direction of public expenditure. As a result, a number of differential tax treatments across a broad spectrum of taxpayers and particular activities may arise. Differential treatment afforded to certain taxpayers to achieve social and political objectives rather than tax design objectives constitutes a tax expenditure.
Why measure tax expenditures?
The immediate and direct impact of preferential tax treatment is to reduce the revenue yield from a given tax. In the absence of concessions and exemptions, governments would be able to support a higher level of government spending, or reduce the severity of their tax rates or, if expenditures remain unchanged, reduce their borrowing requirements.
The provision of preferential tax treatment is indisputably a cost to the budget and may also impose additional costs on non-favoured taxpayers. It is often a hidden cost. By explicitly publishing estimates of the magnitude of this preferential tax treatment, transparency is increased and the community is made more aware of the government’s fiscal priorities. The government should also be better placed to ensure that resources, in total, are committed to the areas that clearly reflect policy priorities.
2014–15 Budget Statement 181

Valuation of tax expenditures
Tax expenditures in this appendix are calculated according to the revenue forgone method, which involves applying the general structure of a tax to a tax base (that is, a group of people or activities) that is currently exempt from the tax or subject to concessional treatment.
This static approach does not take into account possible behavioural changes which may result from the removal of a tax concession, that is, the revenue forgone approach assumes that taxpayer behaviour will remain unchanged if concessions are removed. Therefore, tax expenditures measured using this approach are likely to be only a broad indication of actual revenue impacts and, more specifically, this approach is likely to overstate the actual revenue forgone as a result of an individual tax concession.
Aside from the absence of assumptions about behavioural responses, the estimates are in many cases approximations, reflecting data limitations and the use of proxy indicators to measure the size of revenue bases relevant to tax concessions.
Benchmark for measuring tax expenditures
Tax expenditures should be quantified by comparing the existing tax structure with a benchmark tax structure based entirely on taxation design principles. In practice, deciding on such a structure does involve some judgements. For example, the benchmark structure used for payroll tax is a flat tax at the current rate with no threshold. There is no particular merit in the current rate from the point of view of tax design but it has been adopted because it is the existing rate. Further, a zero threshold would probably not be desirable from a tax design point of view because the administrative costs of collecting revenue from very small employers might well exceed the revenue collected. However, for the sake of simplicity, a zero threshold has been adopted in this exercise.
Summary
The view has been taken that the extent of tax relief provided through the availability of exemptions, concessions, rebates and allowable deductions is sufficiently important to warrant documentation even if:
• the benchmark against which the tax expenditure is assessed could be argued to be imperfectly defined
• the measurement of those imperfectly defined expenditures is also subject to qualification
• the value of many tax expenditures cannot be quantified.
Many tax expenditures have not been able to be quantified. In particular, there are a large number of exemptions from stamp duties that are not reflected in the estimates due to a lack of information on the size of the affected tax bases. Similarly, a number of exemptions relating to payroll tax have not been quantified. As such, the aggregate total of the estimates contained in table E.1 does not represent the total value of assistance provided by tax expenditures.
The largest tax expenditures are the payroll tax threshold exemption and the land tax exemptions for primary production and the principal place of residence.
The following is a brief summary of the individual tax expenditures that have been quantified.
Appendix E: Tax expenditure statement
182 2014–15 Budget Statement

Payroll tax
Total quantified tax expenditures relating to payroll tax for 2013–14 ($656.2 million) represent 59.8 per cent of payroll tax revenue collections (excluding general government collections). This is a $28.4 million increase on the estimated value of payroll tax expenditures in 2012–13 and mainly reflects growth in taxable payrolls as well as the introduction of a payroll tax concession for small businesses.
The largest payroll tax expenditure is the provision of a tax-free threshold. Payroll tax is levied on wages paid by employers and is applied at a rate of 4.95 per cent above an annual threshold of $600 000. The threshold exemption results in a large number of small businesses not being liable for payroll tax. In addition, those businesses that are liable for payroll tax do not have tax liabilities in respect of annual wages below the threshold.
It is estimated that the tax revenue forgone as a result of the existence of the threshold is $447.3 million in 2013–14 for private sector employers. This comprises $316.8 million in revenue forgone from small businesses that are not liable for payroll tax, and $130.5 million in respect of employers who are liable for payroll tax but benefit from not paying tax on annual wages up to the threshold.
Several other groups of taxpayers are exempt from payroll tax liabilities, many of which have not been able to be quantified in terms of tax expenditure. Of those that have been calculated, the largest tax expenditure relates to the exemption for public hospitals, which is estimated to amount to $122.1 million in 2013−14. Other expenditures include local government councils ($29.9 million), not-for-profit schools ($17.3 million) and not-for-profit hospital and health providers ($12.9 million).
The government also offers schemes whereby businesses can claim payroll tax rebates for certain activities. In the 2013–14 Budget, the government announced a new temporary payroll tax concession for small businesses, available in 2013–14 and 2014–15. It is estimated that the scheme will cost $9.5 million in 2013–14. The payroll tax exporter rebate was abolished from 1 July 2013. Rebates expected to be paid in 2013–14 ($2.8 million) are due to the timing of rebate claims.
Stamp duties
Stamp duties apply to a range of transactions including conveyances, insurance and motor vehicle registration. There are a large number of exemptions contained in stamp duty legislation, many of which cannot be quantified. The total quantifiable tax expenditure on stamp duties in 2013–14 ($116.7 million) is equivalent to 8.3 per cent of stamp duty revenues. The total cost of stamp duty tax expenditures has increased by $66.9 million from 2012–13 mainly due to ex gratia relief provided for a once-off large asset-backed securitisation transaction.
Conveyance duty expenditures are estimated to amount to $96.3 million in 2013–14. The stamp duty exemption for family farm transfers is estimated to cost $9.3 million in 2013–14. Stamp duty relief for corporate reconstructions is estimated to cost $10.0 million in 2013–14 compared to $12.2 million in 2012–13. No stamp duty is payable on eligible corporate reconstructions from 1 July 2013. Prior to that time, an ex gratia relief scheme was in place which provided tax relief of up to 95 per cent of the duty otherwise payable.
The government introduced a stamp duty concession for eligible apartments purchased off-the-plan in the Adelaide City Council area from 31 May 2012. In October 2013, the government extended the concession to eligible apartments purchased off-the-plan in the inner metropolitan region. A full stamp duty exemption is available to 30 June 2014 for eligible apartments valued up to $500 000. The exemption is recorded at the time of settlement of the new apartment so there is likely to be substantial timing lags between the signing of eligible off-the-plan contracts and the cost of the exemption. Given the timing lags, the cost of the scheme in 2012–13 and 2013–14 is not indicative of the expected cost
Appendix E: Tax expenditure statement
2014–15 Budget Statement 183

of the scheme over the next few years. The cost of the exemption is expected to increase as apartment developments with qualifying apartments are completed.
Approximately $20.4 million of stamp duty tax expenditures in 2013−14 relate to exemptions given in respect of the $60 stamp duty fee payable on the combined renewal certificate for vehicle registration and compulsory third party (CTP) insurance. Of this, an estimated $13.2 million relates to concessions provided to pensioners and eligible low-income earners. The balance mainly relates to conditionally registered vehicles (for example historic and left hand drive vehicles, special purpose vehicles such as fork lifts, tractors, self-propelled farm implements and mobile cranes), government vehicles registered under the Continuous Government Registration Scheme and vehicles owned by councils.
Land tax
Total land tax expenditures are estimated to be $1044.2 million in 2013–14. This represents 184.2 per cent of land tax collections (including from government).
Land tax is calculated on the aggregate taxable value of all land held by a person as at 30 June preceding the assessment year. No tax is payable if the total taxable value of all land is less than the tax-free threshold level. The tax-free threshold is currently to $316 000. A marginal tax rate structure applies above this threshold, with increasing marginal tax rates applied as the value of landholdings increase.
The 2013–14 tax expenditures associated with land tax include:
• the primary production exemption (provided it meets certain criteria) — estimated to cost $432.3 million
• the principal place of residence exemption (provided the land is owned by a natural person as distinct from a corporate body) — estimated to cost $266.1 million
• the tax-free threshold — estimated to cost $199.3 million
• the for-profit aged care facilities exemption — estimated to cost $2.2 million
• other specific exemptions provided in sections 4 and 5 of the Land Tax Act 1936. Exempt categories include caravan parks, residential parks, supported residential facilities, land used for religious purposes, state subsidised hospitals, libraries, parklands, conservation of native flora and fauna, sporting activities and so on. The cost of these exemptions amounts to approximately $144.3 million in 2013–14.
Total land tax expenditures in 2013–14 are expected to be higher than estimated for 2012–13. This is primarily a result of a higher cost of the primary production and principal place of residence exemptions, due to growth in land values.
Gambling taxes
Tax expenditures for gambling taxes arise from the gambling tax-free threshold and the differential tax treatments that apply to gaming machine activity in not-for-profit venues and the Adelaide Casino compared with the tax rate structure applying to hotels.
In South Australia, for hotels, gambling tax is levied on net gambling revenue (NGR) above an annual threshold of $75 000. Not-for-profit venues are subject to a tax structure that is relatively less severe than that applicable to hotels. Prior to 14 February 2014, the Adelaide Casino paid a single, flat tax rate on net gaming revenue from gaming machines of 34.41 per cent — less than the average tax rate for large hotels. Since 14 February 2014, different tax rates have applied to non-premium and premium gaming machines at the Adelaide Casino as part of the new regulatory and tax framework established under the Approved Licensing and the Casino Duty Agreements. The maximum tax rate of 41 per cent of NGR for non-premium gaming machines was set having regard to the average tax rate
Appendix E: Tax expenditure statement
184 2014–15 Budget Statement

paid by for-profit gaming venues. The rate of 10.91 per cent of NGR for premium gaming machines was set with regard to tax rates faced by interstate competitors. The increase in tax expenditure between 2012–13 and 2013–14 partly reflects expectations on the NGR split between non-premium and premium gaming machines.
In 2013–14, it is estimated that the revenue foregone as a result of the existence of the tax-free threshold is $10.7 million. The benefit to not-for-profit venues of the tax differential is estimated to be $7.8 million in 2013–14. The benefit to the Adelaide Casino of the tax differential is estimated to be $19.0 million in 2013–14. The combined costs of gambling tax expenditures represent approximately 9.7 per cent of gambling tax collections in 2013–14. Gambling tax expenditure in 2013–14 is broadly in line with the estimate for 2012 –13.
Save the River Murray Levy
The Save the River Murray Levy was introduced to fund specific measures aimed at improving the long-term security and quality of South Australia’s water supply.
The levy is imposed at a flat rate on SA Water customers and is indexed annually to movements in the Adelaide Consumer Price Index. Consideration of the impact the levy would have on different sections of the community was taken into account before the introduction of the levy. To relieve the burden of the levy, eligible pensioners and low income earners are exempt from the levy. This exemption amounts to an estimated tax expenditure of $5.9 million in 2013–14, or 24.4 per cent of revenue raised from the Save the River Murray Levy.
Primary producers who own land that is not contiguous, but is farmed as a single farming enterprise, are allowed to amalgamate their Save the River Murray Levy liabilities in certain circumstances. This limits their Save the River Murray Levy liability to the non-residential charge applicable on one property. However, it is not possible to quantify expenditure for this exemption.
Emergency services levy
The emergency services levy (ESL) was originally intended to provide a comprehensive method of funding emergency services by raising sufficient funds from property holders to support aggregate expenditure on emergency services. In practice, private property owners (fixed and mobile) currently collectively contribute just over half of the total levy proceeds. The remaining levy proceeds have been provided by government in the form of remissions, pensioner concessions and the levy payable on the government’s own property. The tax expenditure costings measure the difference between standard levy rates and post-remission levy rates which vary depending on land use code and location (for fixed property) and class of vehicle (for mobile property). From 1 July 2014, the government will remove remissions on the fixed property prescribed rate for most property owners and will remove the remission provided on ESL for cars, larger motorcycles and historic vehicles from 1 August 2014.
The ESL is a complex tax with differential rates of levy on land use types and regions. The motivation for the differential levy rates lies in a desire to achieve some alignment with relative risk of property types, the value of the service provided (related to property value) and regional variation in service levels.
The cost of the fixed property remission is estimated to be $95.0 million in 2013–14 and the mobile remission is estimated to cost $11.4 million. Pensioner concessions on the ESL on fixed property are estimated to cost $7.2 million in 2013–14.
Appendix E: Tax expenditure statement
2014–15 Budget Statement 185
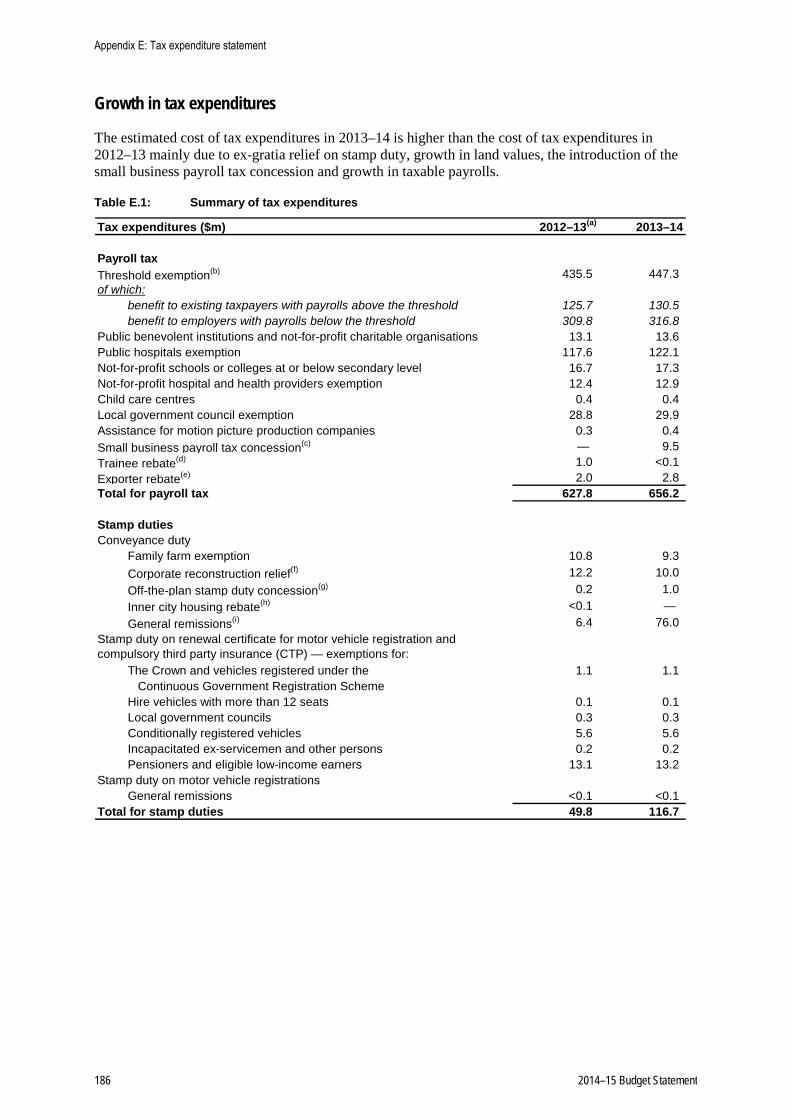
Growth in tax expenditures
The estimated cost of tax expenditures in 2013–14 is higher than the cost of tax expenditures in 2012–13 mainly due to ex-gratia relief on stamp duty, growth in land values, the introduction of the small business payroll tax concession and growth in taxable payrolls.
Table E.1: Summary of tax expenditures
Tax expenditures ($m) 2012–13(a) 2013–14
Payroll taxThreshold exemption(b) 435.5 447.3 of which:
benefit to existing taxpayers with payrolls above the threshold 125.7 130.5 benefit to employers with payrolls below the threshold 309.8 316.8
Public benevolent institutions and not-for-profit charitable organisations 13.1 13.6 Public hospitals exemption 117.6 122.1 Not-for-profit schools or colleges at or below secondary level 16.7 17.3 Not-for-profit hospital and health providers exemption 12.4 12.9 Child care centres 0.4 0.4 Local government council exemption 28.8 29.9 Assistance for motion picture production companies 0.3 0.4 Small business payroll tax concession(c) — 9.5 Trainee rebate(d) 1.0 <0.1Exporter rebate(e) 2.0 2.8 Total for payroll tax 627.8 656.2
Stamp dutiesConveyance duty
Family farm exemption 10.8 9.3 Corporate reconstruction relief(f) 12.2 10.0 Off-the-plan stamp duty concession(g) 0.2 1.0 Inner city housing rebate(h) <0.1 — General remissions(i) 6.4 76.0
Stamp duty on renewal certificate for motor vehicle registration and compulsory third party insurance (CTP) — exemptions for:
The Crown and vehicles registered under the 1.1 1.1 Continuous Government Registration Scheme
Hire vehicles with more than 12 seats 0.1 0.1 Local government councils 0.3 0.3 Conditionally registered vehicles 5.6 5.6 Incapacitated ex-servicemen and other persons 0.2 0.2 Pensioners and eligible low-income earners 13.1 13.2
Stamp duty on motor vehicle registrationsGeneral remissions <0.1 <0.1
Total for stamp duties 49.8 116.7
Appendix E: Tax expenditure statement
186 2014–15 Budget Statement

Table E.1: Summary of tax expenditures (continued)
Tax expenditures ($m) 2012–13(a) 2013–14
Land taxThreshold exemption 198.6 199.3 Principal place of residence exemption(j) 260.3 266.1 Primary production exemption(j) 421.6 432.3 Caravan parks and residential parks exemption(j) 1.3 1.2 Supported residential facilities exemption(j) 0.4 0.4 For-profit aged care facilities 2.2 2.2 Other exemptions(k) 139.4 142.7 Total for land tax 1 023.9 1 044.2
Gambling taxesThreshold exemption for clubs and hotels 11.0 10.7 Differential treatment of Adelaide Casino gaming machine tax structure(l) 17.7 19.0 Differential treatment of not-for-profit businesses 8.1 7.8 General remissions 0.5 0.1 Total for gambling taxes 37.3 37.5
Other taxes on propertySave the River Murray Levy
Pensioner concessions 5.9 5.9 Emergency services levy
Pensioner concessions 7.3 7.2 General remissions
Fixed property 83.1 95.0 Mobile property 11.1 11.4
Total for other taxes on property 107.4 119.5 Note: Totals may not add due to rounding.
(a) Costing of specific exemptions for 2012–13 may differ from those published in the 2013–14 Budget, reflecting new data.
(b) The value of the threshold exemption is based on total taxable wages in the relevant financial year.
(c) The small business payroll tax concession commenced in 2013–14.
(d) The trainee rebate was abolished from 1 July 2010. Amounts paid in 2012–13 relate to timing of rebate claims.
(e) The exporter rebate was abolished from 1 July 2013. Amounts paid in 2013–14 relate to timing of rebate claims.
(f) From 1 July 2013, no stamp duty is payable on eligible corporate reconstructions. Prior to that time an ex-gratia scheme was in place which provided tax relief of up to 95 per cent of the duty otherwise payable.
(g) The off-the-plan stamp duty concession is available for eligible contracts entered into from 31 May 2012.
(h) The inner city housing rebate ceased from 31 May 2012.
(i) General remissions in 2013–14 include an ex-gratia refund for a large asset-backed securitisation transaction.
(j) Consistent with the approach taken for other taxes in this table, the cost of these land tax exemptions has been calculated assuming the current land tax rates and thresholds apply.
(k) Includes a wide range of exemptions provided to land used for a number of specific activities under section four of the Land Tax Act 1936. Some of these include land used for religious purposes, state subsidised hospitals, libraries, parklands, conservation of native flora and fauna, sporting activities and so on.
(l) Rate structure applying to the Casino changed from 14 February 2014. Two rates now apply to gaming machines at the Casino — for non-premium gaming machines 41 per cent of NGR and for premium gaming machines 10.91 per cent of NGR. Prior to 14 February 2014, a flat rate of 34.41 per cent applied to NGR on all gaming machines.
Appendix E: Tax expenditure statement
2014–15 Budget Statement 187

Appendix E: Tax expenditure statement
188 2014–15 Budget Statement
Glossary of terms used in the budget statement
Assets: Resources controlled by the entity as a result of past events and from which future economic benefits are expected to flow to the entity.
Balance sheet: A statement showing the financial position (at a specific time) of a reporting entity in terms of its recognised assets, liabilities and equity at the end of a reporting period.
Cash flow statement: A statement showing the inflows and outflows of cash and cash equivalents of a reporting entity during the reporting period. Cash flows are classified as operating, investing and/or financing activities.
Consolidated Account: The government’s main operating account, from which appropriations are paid and revenues of the state are credited, created pursuant to the Public Finance and Audit Act 1987.
Consumer Price Index (CPI): A general indicator of the rate of change in prices paid by households for consumer goods and services published by the Australian Bureau of Statistics (ABS).
Contingent asset: A possible asset that arises from past events and whose existence will be confirmed by the occurrence or non-occurrence of uncertain future events not wholly within the control of the entity.
Contingent liability: A possible obligation that arises from past events and whose existence will be confirmed by the occurrence or non-occurrence of uncertain future events not wholly within the control of the entity; or a liability that does not meet the recognition criteria.
Financial reports: Financial reports for the various sectors of the public sector are also produced in accordance with the uniform presentation framework. These are the operating statement, balance sheet and cash flow statement.
General government: The sector of government that includes all government agencies that provide services free of charge or at prices significantly below the cost of production or provide regulatory services.
Government Finance Statistics (GFS): Statistics that measure the financial activities of governments and reflect the impact of those activities on other sectors of the economy. GFS is based on international statistical standards.
GFS transactions: Changes to assets, liabilities and equity that arise from mutually agreed interactions between entities.
Government Purpose Classification: A system used to classify expenses and net acquisition of non-financial assets of the public sector in terms of the purposes for which the transactions are made.
Gross Domestic Product (GDP): The total market value of all final goods and services produced within a country in a given period after deducting the cost of goods and services used up in the process of production, but before deducting allowances for the consumption of fixed capital. It is an indicator of the level of economic activity in the market sector, and percentages changes in it are used as a measure of a country’s rate of economic growth.
2014–15 Budget Statement 189
Gross State Product (GSP): The total market value of goods and services produced within a state in a given period after deducting the cost of goods and services used up in the process of production, but before deducting allowances for the consumption of fixed capital.
Horizontal fiscal equalisation (HFE): The principle underlying the Commonwealth Grants Commission’s assessment of per capita relativities, which are the basis for the interstate distribution of general revenue grants. Under this principle, grants are distributed so as to give each state and territory the capacity to provide public services at an average standard and level of efficiency, for comparable revenue effort.
Income (revenue): Increases in economic benefits during the accounting period in the form of inflows or enhancements of assets or decreases of liabilities that result in increases in equity, other than those relating to contribution by owners.
Income tax equivalent (ITE): Payments equivalent to income tax that certain public authorities or business units (if a legal entity) would be liable to pay under the Commonwealth Government’s Income Tax Assessment Act 1997, were that public authority or business unit (if a legal entity) not an instrumentality of the Crown in right of the State of South Australia.
Investment expenditure: Comprises projects and programs that result in the capitalisation of assets on the balance sheet. They include the acquisition and construction of, or addition to non-current assets, including property, plant and equipment and other productive assets. Examples include roads, hospitals, medical equipment and schools.
Liabilities: Present obligations arising from past events, the settlement of which is expected to result in an outflow from the entity of resources embodying economic benefits.
Net debt: The sum of deposits held, advances received and borrowing, minus the sum of cash and deposits, advances paid, and investments, loans and placements.
Net financial liabilities: Total liabilities less financial assets, other than equity in non-financial public corporations and in public financial corporations. This measure is broader than net debt as it includes significant liabilities other than borrowings, such as unfunded superannuation and long service leave entitlements.
Net financial worth: Net financial worth measures a government’s net holdings of financial assets. It is calculated from the balance sheet as financial assets minus liabilities. It differs from net financial liabilities in that equity in non-financial public corporations and public financial corporations are included as assets.
Net lending/borrowing position: A GFS measure of the net operating balance, less acquisition of non-financial assets, plus consumption of fixed capital (depreciation). Measures the extent to which accruing operating expenses (less depreciation) and investment expenditures are funded by revenues.
Net operating balance: A GFS measure of the operating result of a sector of government. It is the excess of GFS revenue over GFS expenses.
Net worth: Net worth is calculated as total assets (both financial and non-financial) minus total liabilities, shares and other contributed capital. Net worth incorporates a government’s non-financial assets, such as land and other fixed assets, as well as financial assets and liabilities not captured by the net debt measure, most notably accrued employee superannuation liabilities, debtors and creditors.
Non-financial public sector: The consolidation of the general government sector and public non-financial corporations sector.
Glossary
190 2014–15 Budget Statement

Operating expenses: A decrease in economic benefits during the accounting period in the form of outflows or depletion of assets, or incurrence of liabilities that result in decreases of equity other than those relating to distributions to owners.
Operating statement: The financial statement disclosing all income and expenses (and their sources) of a reporting entity recognised in the reporting period unless an accounting standard requires otherwise.
Other economic flows: Changes to assets, liabilities and equity that are not the result of GFS transactions.
Public financial corporation (PFC): Government controlled entity that is mainly engaged in financial intermediation or the provision of auxiliary financial services.
Public non-financial corporation (PNFC): Government controlled entity that is mainly engaged in the production of market goods and/or non-financial services, which recovers a significant portion of its costs through user charges.
Real terms: Estimates of financial aggregates in real terms reflect adjustments made in order to take account of the impact of rising prices on the purchasing power of money. Throughout this budget paper, reference is made to real term aggregates and growth rates. All real terms calculations use the Adelaide CPI, unless specifically stated otherwise.
Sector: An ABS national accounting concept used to group entities with similar economic characteristics. Sectors comprising the public sector are general government, public non-financial corporations and public financial corporations.
State Final Demand (SFD): A measure of spending in a state economy. The estimate obtained by summing government final consumption expenditure, household final consumption expenditure, private gross fixed capital formation and the gross fixed capital formation of public corporations and general government.
Unfunded superannuation liability: The amount by which the liabilities of a superannuation scheme or schemes (measured as the present value of expected future superannuation benefits that have accrued to members) at the reporting date exceeds the value of assets held by the superannuation scheme or schemes to meet those benefits.
Uniform presentation framework (UPF): The reporting framework agreed by the Commonwealth Government and state and territory governments, to ensure all governments provide a common ‘core’ of financial information in their budget papers (refer to Appendix A).
Glossary
2014–15 Budget Statement 191

192 2014–15 Budget Statement

WWW.STATEBUDGET.SA.GOV.AUWWW.STATEBUDGET.SA.GOV.AU
Department of Treasury and Finance
State Administration Centre 200 Victoria Square, Adelaide,
South Australia, 5000
GPO Box 1045, Adelaide, South Australia, 5001
Telephone: +61 (08) 8226 9500
www.treasury.sa.gov.au
www.statebudget.sa.gov.au
Department of Treasury and Finance
State Administration Centre 200 Victoria Square, Adelaide South Australia, 5000
GPO Box 1045, Adelaide South Australia, 5001
Telephone: +61 (08) 8226 9500 www.treasury.sa.gov.au