Embed Size (px)
Citation preview

2014 Transmission Stakeholder Meeting Ameren Transmission Company of Illinois and Ameren Illinois Company
October 29, 2013

2
AGENDA
Main Purpose is to review ATXI and AIC Projected 2014 Transmission Rate Calculations
• Background on Attachment O, GG & MM• Overview of MTEP and MVPs• Forward Looking Rates• New Rate Protocols• Approved Incentives• ATXI Comparison to Current Revenue Requirement• ATXI 2012 True Up• AIC Comparison to Current Revenue Requirement• 2014 AMIL Pricing Zone NITS Charge

3
AIC AND ATXI
• Both AIC and ATXI are transmission owning subsidiaries of Ameren
Corporation, as well as MISO Transmission Owners (TOs)• AIC will continue to build and own traditional reliability projects• ATXI is in the process of building and will own new regional
transmission projects• Prairie Power, Inc. became a TO in the AMIL pricing zone effective
June 1, 2013.• The sum of their Attachment O net revenue requirements equals the
total revenue requirement for AMIL pricing zone to be collected under Schedule 9 (NITS)
4
MISO ATTACHMENTS O, GG & MM
Calculate rates for Schedules 9, 26 & 26-A• Attachment GG - Schedule 26 (page 5)
• Attachment MM - Schedule 26-A (page 6)
• Attachment O - net revenue requirement billed under Schedule 9 (page 7)
• Schedules 26 and 26-A are billed by MISO• Schedule 9 is billed by Ameren

5
MISO ATTACHMENT GG
• Cost Recovery for certain Network Upgrades• Eligible projects
• Market Efficiency• Generator Interconnections
• Cost shared based upon project type• MISO-wide based on load• Subregional based on LODF (Line Outage Distribution Factor)
• AIC has three Attachment GG projects completed• Three additional projects under construction
• ATXI has no Attachment GG projects

6
MISO ATTACHMENT MM
• Cost recovery for Multi-Value Projects (MVPs)• Very similar format as Attachment GG• Criteria for being considered
• Developed through planning process and support energy policy• Multiple types of economic value across multiple pricing zones with
benefit to costs > 1• Address at least one:
• Projected NERC violation• Economic-based issue
• Cost shared across MISO based on load• AMIL Zone is approximately 9%
• Ameren MVPs will primarily be built by ATXI• AIC will be responsible for modifications needed to its existing facilities

7
MISO ATTACHMENT O, GG & MM
• All transmission costs included in Attachment O calculation • Schedule 9 based on net revenue requirement – reductions for:
• Costs recovered in Schedules 26 & 26-A• Point-to-Point revenue in Schedules 7 & 8• Rental revenue• Revenue from generator interconnections
• Questions on Tariffs?

8
MISO TRANSMISSION EXPANSION PLAN (MTEP)
• Developed on an annual basis building upon previous analysis• MISO, Transmission Owners & Stakeholders• Includes subregional planning meetings
• MTEP goals• Ensure the reliability of the transmission system• Ensure compliance with NERC Standards• Provide economic benefits, such as increased market efficiency• Facilitate public policy objectives, such as meeting Renewable Portfolio
Standards• Address other issues or goals identified through the stakeholder process
• Multiple future scenarios analyzed• End result – comprehensive, cohesive plan for MISO footprint
• MTEP approved by MISO Board of Directors

9
MISO MVPS
• Brief history of development• Began investigating value added expansion in 2003• 2008 Regional Generation Outlet Study (RGOS) - formed basis of
Candidate MVP portfolio• Portfolio refined due to additional analysis
• MISO approved portfolio of 17 Projects• Seven transmission line segments (MTEP proj numbers) in Ameren territory• Ameren identifies these three projects as:
• Illinois Rivers (four line segments)• Spoon River• Mark Twain (two line segments)
• Broadly cost-shared, AMIL pricing zone allocated 9% of each MVP no matter where project is located or who builds it

10
MAP OF AMEREN MVPS

11
FORWARD LOOKING RATES
• Rates better reflect current costs• Implemented by several MISO TOs• Requires true-up to actual year costs
• New calculations based on projected 2014 data• Rate base items -13 month average balance• Interest on over/under recovery• 2014 true-up calculated in 2015 and reflected in 2016 rates
• FERC approved forward looking rates for ATXI effective March 1, 2012
• FERC approved forward looking rates for AIC effective January 1, 2013

12
FORWARD LOOKING RATES TIMELINE
• September 1, 2013• Calculate 2014 revenue requirements for AIC & ATXI• Includes 2012 true up with interest for ATXI
• October 31, 2013• Meet with Customers to discuss rate input projections and cost detail
• January 1, 2014• New rates in effect based on 2014 projections and 2012 true-up for ATXI
• July 1, 2014• Calculate and post 2013 true-up for AIC and ATXI
• September 1, 2014• Calculate 2015 revenue requirements for AIC & ATXI• Includes 2013 true up with interest for AIC & ATXI
• October 31, 2014• Meet with Customers to discuss rate input projections and cost detail
• January 1, 2015• New rates in effect based on 2015 projections and 2013 true-ups

13
NEW RATE PROTOCOLS
• On May 16, 2013, FERC issued order EL12-35 concerning required modifications to MISO rate protocols.
• The order requires MISO and the MISO Transmission Owners to modify the formula rate protocols to
• Allow for increased scope of participation by Interested Parties• Allow for increased transparency concerning the implementation of the
formula rate, • Define a process for the information exchange• Allow for a provision of additional information, and well-defined and clearly-
structured challenge procedure• Require MISO and the MISO Transmission Owners to make an annual
informational filing with FERC
• The TOs filed compliance filings on September 13, 2013• Requested an effective date of January 1, 2014• The protocols will be applicable for the first subsequent Annual Update and
Annual True-Up, which will take place on June 1, 2014

14
NEW PROTOCOL TIMELINE
DateProposed Schedule
(Historical and Forward-Looking)June 1 Posting of Annual Update (historical) or True-Up (forward-
looking). Information Exchange begins. Informal Challenge Process begins.
Between June 1 and October 1 Each Transmission Owner must hold an open meeting during which the Annual Update or True-Up (at a minimum) is reviewed and Interested Parties may ask questions.
October 1 Information Exchange ends.
November 1 Informal Challenge Process ends.
December 1 Deadline for Transmission Owners to respond to Informal Challenges submitted by the end date of the Informal Challenge Process.
For forward-looking rates: any rate changes agreed to by the Transmission Owner by this date would be included in the projected rate for the following rate year (changes after this date would be included in the following year’s True-Up).
December 30 Deadline to submit Formal Challenge to the Commission.
January 31 (following the process) Transmission Owners submit informational filing to the Commission.

15
RATE INCENTIVES
• FERC approved the following rate incentives for Illinois Rivers in Docket No. EL10-80– CWIP (no AFUDC)– Abandonment (requires additional filing prior to recovery)– Hypothetical capital structure during construction for ATXI
• FERC approved similar incentives for Spoon River and Mark Twain Projects in Docket No. ER12-2216

16
ATXI Revenue Requirement
Projected 2013 vs Projected 2014

17
ATXI PROJECTIONS FOR 2014
ATXI Rate Base
Page.Line Jan-13 Jan-14 Change Percent2.6 Total Gross Plant 63,438,000 72,401,000 8,963,000 14%
2.12 Total Accum Depreciation 2,652,000 3,701,000 1,049,000 40%2.18 TOTAL NET PLANT 60,786,000 68,700,000 7,914,000 13%
2.18a 100% CWIP RECOVERY 33,665,000 166,179,000 132,514,000 394%
ADJUSTMENTS TO RATE BASE 2.20 Account No. 282 -12,172,000 -15,292,000 -3,120,000 26%2.21 Account No. 283 -8,000 -1,009,000 -1,001,000 12513%2.22 Account No. 190 3,984,000 2,877,000 -1,107,000 -28%2.25 Land Held for Future Use 0 0 0 N/A2.26 CWC 115,500 395,500 280,000 242%2.27 Materials & Supplies 0 0 0 N/A2.28 Prepayments 0 0 0 N/A
TOTAL ADJUSTMENTS -8,080,500 -13,028,500 -4,948,000 61%
2.30 TOTAL RATE BASE 86,370,500 221,850,500 135,480,000 157%

18
ATXI PROJECTIONS FOR 2014
ATXI Expenses
Page.Line Jan-13 Jan-14 Change PercentO&M
3.1 Transmission 41,000 184,000 143,000 349%3.1a Less LSE Expenses 0 0 0 N/A3.2 Less Account 565 0 0 0 N/A3.3 A&G 883,000 2,980,000 2,097,000 237%3.4 Less FERC Annual Fees 0 0 0 N/A3.5 Less EPRI, ect. 0 68,720 68,720 N/A3.5a Plus Trans. Reg. Comm. Exp 0 68,720 68,720 N/A3.8 TOTAL O&M 924,000 3,164,000 2,240,000 242%
3.12 TOTAL DEPRECIATION 1,006,000 1,064,000 58,000 6%
TAXES 0 N/A3.13 Payroll 0 0 0 N/A3.16 Property 0 0 0 N/A3.18 Other 25,000 82,000 57,000 228%3.27 Income Taxes 4,189,084 10,819,901 6,630,816 158%
TOTAL TAXES 4,214,084 10,901,901 6,687,816 159%
TOTAL EXPENSES 6,144,084 15,129,901 8,985,816 146%

19
ATXI PROJECTIONS FOR 2014
Total ATXI Revenue Requirement
Page.Line Jan-13 Jan-14 Change Percent
2.30 TOTAL RATE BASE 86,370,500 221,850,500 135,480,000 157%
4.30 Rate of Return on ACS 8.49% 8.73% 0.23% 3%
3.28 Return from ACS 7,336,763 19,359,229 12,022,466 164%
2.30a 100% CWIP RECOVERY 33,665,000 166,179,000 132,514,000 394%
4.30e Incremental Rate of Return on HCS 0.00% -0.10% -0.10% -2368%
3.28a Incremental Return from HCS 1,422 -159,215 -160,637 -11296%
Total Return 7,338,185 19,200,014 11,861,828 162%
Total Expenses 6,144,084 15,129,901 8,985,816 146%
3.29 TOTAL GROSS REV. REQ. 13,482,270 34,329,914 20,847,645 155%
3.30 Less ATT. GG Adjustment 0 0 0 N/A
3.30a Less ATT. MM Adjustment 5,588,351 25,755,419 20,167,068 361%
3.31 GROSS REV. REQ. UNDER ATT. O 7,893,919 8,574,496 680,577 9%

20
ATXI PROJECTIONS FOR 2014
ATXI True-up & Net Revenue Requirement
Page.Line Jan-13 Jan-14 Change Percent1.1 Gross Revenue Requirement 7,893,919 8,574,496 680,577 9%1.6 Total Revenue Credits 487,917 502,000 14,083 3%
1.6a Historic Year Actual ATRR 0 9,892,717 9,892,717 N/A1.6b Projected ATRR from Prior Year 0 7,270,263 7,270,263 N/A1.6c Prior Year ATRR True-Up 0 2,622,454 2,622,454 N/A1.6d Prior Year Divisor True-Up 0 30,874 30,874 N/A1.6e Interest on Prior Year True-Up 0 35,470 35,470 N/A
1.7 NET REVENUE REQUIREMENT 7,406,002 10,761,294 3,355,292 45%

21
ATXI PROJECTIONS FOR 2014
ATXI Attachment MM Calculation - Page 1
(1) (2) (3) (4)Attachment O
Line No. Page, Line, Col. Transmission Allocator1 Gross Transmission Plant - Total Attach O, p 2, line 2 + 18a col 5 (Note A) 238,580,000
1a Transmission Accumulated Depreciation Attach O, p 2, line 8 col 5 3,701,000 2 Net Transmission Plant - Total Line 1 minus Line 1a (Note B) 234,879,000
O&M TRANSMISSION EXPENSE
3 Total O&M Allocated to Transmission Attach O, p 3, line 8 col 5 3,164,000
3a Transmission O&M Attach O, p 3, line 1 col 5 184,000 3b Less: LSE Expenses included in above, if any Attach O, p 3, line 1a col 5, if any - 3c Less: Account 565 included in above, if any Attach O, p 3, line 2 col 5, if any -
3d Adjusted Transmission O&M Line 3a minus Line 3b minus Line 3c 184,000
4 Annual Allocation Factor for Transmission O&M (Line 3d divided by line 1a, col 3) 4.97% 4.97%
OTHER O&M EXPENSE
4a Other O&M Allocated to Transmission Line 3 minus Line 3d 2,980,000 4b Annual Allocation Factor for Other O&M Line 4a divided by Line 1, col 3 1.25% 1.25%
GENERAL AND COMMON (G&C) DEPRECIATION EXPENSE5 Total G&C Depreciation Expense Attach O, p 3, lines 10 & 11, col 5 (Note H) - 6 Annual Allocation Factor for G&C Depreciation Expense (line 5 divided by line 1 col 3) 0.00% 0.00%
TAXES OTHER THAN INCOME TAXES
7 Total Other Taxes Attach O, p 3, line 20 col 5 82,000 8 Annual Allocation Factor for Other Taxes (line 7 divided by line 1 col 3) 0.03% 0.03%
9 Annual Allocation Factor for Other Expense Sum of line 4b, 6, and 8 1.28%
INCOME TAXES10 Total Income Taxes Attach O, p 3, line 27 col 5 10,819,901 11 Annual Allocation Factor for Income Taxes (line 10 divided by line 2 col 3) 4.61% 4.61%
RETURN 12 Return on Rate Base (Note I) Attach O, p 3, line 28 col 5 19,359,229 13 Annual Allocation Factor for Return on Rate Base (line 12 divided by line 2 col 3) 8.24% 8.24%
14 Annual Allocation Factor for Return Sum of line 11 and 13 12.85%
HYPOTHETICAL CAPITAL STRUCTURE (HCS) RETURN15 Annual Allocation Factor HCS Return (Note J) Attach O, p 4, line 30e -0.10% -0.10%

22
ATXI PROJECTIONS FOR 2014
ATXI Attachment MM Calculation - Page 2 (1) (2) (3) (4) (5) (6) (7) (8) (9)
Line No. Project Name
MTEP Project Number
Project Gross Plant
Project Accumulat
ed Depreciati
on
Transmission O&M Annual
Allocation Factor
Annual Allocation for Transmission O&M Expense
Other Expense Annual
Allocation Factor
Annual Allocation for Other Expense
Annual Expense Charge
(Note C) Page 1 line 4 (Col 4 * Col 5) Page 1 line 9 (Col 3 * Col 7) (Col 6 + Col 8)Multi-Value Projects (MVP)
1a Pana-Sugar Creek 2237 $ 40,917,314 4.97%
$ - 1.28% $525,143.84 $525,143.84
1b Pana-Sugar Creek - Land - No HCS 2237 $ 1,357,137 4.97%
$ - 1.28% $17,417.86 $17,417.86
1c Sidney-Rising 2239 $ 9,533,439 4.97%
$ - 1.28% $122,354.72 $122,354.72
1d Sidney-Rising - Land - No HCS 2239 $ 800,360 4.97%
$ - 1.28% $10,272.04 $10,272.04
1e Adair-Ottumwa 2248 $ 528,003 4.97%
$ - 1.28% $6,776.53 $6,776.53
1f Adair-Ottumwa - Land - No HCS 2248 $ 519,420 4.97%
$ - 1.28% $6,666.38 $6,666.38
1g Palmyra-Pawnee 3017 $ 90,215,717 4.97%
$ - 1.28% $1,157,852.82 $1,157,852.82
1h Palmyra-Pawnee - Land - No HCS 3017 $ 7,709,954 4.97%
$ - 1.28% $98,951.62 $98,951.62
1i Fargo-Galesburg-Oak Grove 3022 $ 4,265,599 4.97%
$ - 1.28% $54,745.84 $54,745.84
1j Fargo-Galesburg-Oak Grove - Land - No HCS 3022 $ 3,224,180 4.97%
$ - 1.28% $41,379.99 $41,379.99
1k Pawnee-Pana 3169 $ 7,377,699 4.97%
$ - 1.28% $94,687.38 $94,687.38
1l Pawnee-Pana - Land - No HCS 3169 $ 2,812,781 4.97%
$ - 1.28% $36,099.99 $36,099.99
1m Adair-Palmyra 3170 $ 13,341,659 4.97%
$ - 1.28% $171,230.45 $171,230.45
1n Adair-Palmyra - Land - No HCS 3170 $ 769,371 4.97%
$ - 1.28% $9,874.32 $9,874.32
(1) (2) (10) (11) (11a) (12) (13) (14) (15) (16)
Line No. Project Name
MTEP Project Number Project Net Plant
Annual Allocation Factor for
Return
Annual Allocation
Factor for HCS Return
Annual Return Charge
Project Depreciation
Expense
Annual Revenue
RequirementTrue-Up
AdjustmentMVP Annual Adjusted Revenue Requirement
(Col 3 - Col 4)(Page 1 line
14)(Page 1 line 15)
(Note J)(Col 10 * (Col 11
+ 11a)) (Note E)(Sum Col. 9, 12
& 13) (Note F)Sum Col. 14 & 15
(Note G)Multi-Value Projects (MVP)
1a Pana-Sugar Creek 2237 $ 40,917,314 12.85% -0.10%
$ 5,218,181
$ -
$ 5,743,325 $ 161,958 $ 5,905,282
1b Pana-Sugar Creek - Land - No HCS 2237 $ 1,357,137 12.85% 0.00%
$ 174,376
$ -
$ 191,794
$ -
$ 191,794
1c Sidney-Rising 2239 $ 9,533,439 12.85% -0.10%
$ 1,215,798
$ -
$ 1,338,153 $ (200,123) $ 1,138,030
1d Sidney-Rising - Land - No HCS 2239 $ 800,360 12.85% 0.00%
$ 102,837
$ -
$ 113,109
$ -
$ 113,109
1e Adair-Ottumwa 2248 $ 528,003 12.85% -0.10%
$ 67,336
$ -
$ 74,113
$ -
$ 74,113
1f Adair-Ottumwa - Land - No HCS 2248 $ 519,420 12.85% 0.00%
$ 66,739
$ -
$ 73,406
$ -
$ 73,406
1g Palmyra-Pawnee 3017 $ 90,215,717 12.85% -0.10%
$ 11,505,201
$ -
$ 12,663,053 $ (413,430) $ 12,249,623
1h Palmyra-Pawnee - Land - No HCS 3017 $ 7,709,954 12.85% 0.00%
$ 990,636
$ -
$ 1,089,588
$ - $ 1,089,588
1i Fargo-Galesburg-Oak Grove 3022 $ 4,265,599 12.85% -0.10%
$ 543,991
$ -
$ 598,737
$ 23
$ 598,761
1j Fargo-Galesburg-Oak Grove - Land - No HCS 3022 $ 3,224,180 12.85% 0.00%
$ 414,268
$ -
$ 455,648
$ -
$ 455,648
1k Pawnee-Pana 3169 $ 7,377,699 12.85% -0.10%
$ 940,877
$ -
$ 1,035,565 $ 108,884 $ 1,144,449
1l Pawnee-Pana - Land - No HCS 3169 $ 2,812,781 12.85% 0.00%
$ 361,409
$ -
$ 397,509
$ -
$ 397,509
1m Adair-Palmyra 3170 $ 13,341,659 12.85% -0.10%
$ 1,701,460
$ -
$ 1,872,691 $ 28,623 $ 1,901,314
1n Adair-Palmyra - Land - No HCS 3170 $ 769,371 12.85% 0.00%
$ 98,855
$ -
$ 108,729
$ -
$ 108,729
2 MVP Total Annual Revenue Requirements $25,755,419 -$314,065 $25,441,354
3 Rev. Req. Adj For Attachment O $25,755,419

23
ATXI PROJECTIONS FOR 2014
Ameren MVPsAmeren Name 2013-2014 CAPEX MTEP #s MTEP Description
Illinois Rivers $267 million
2237 Pana - Mt. Zion - Kansas - Sugar Creek 345 kV line2239 Sidney to Rising 345 kV line3017 Palmyra-Quincy-Meredosia - Ipava & Meredosia-Pawnee 345 kV Line3169 Pawnee to Pana - 345 kV Line
Spoon River $12 million
3022 Fargo-Galesburg-Oak Grove 345 kV Line
Mark Twain $7 million
2248 Adair - Ottumwa 3453170 Adair-Palmyra 345 kV Line

24
ATXI Revenue Requirement
2012 True Up
Projected 2012 vs Actual 2012

25
ATXI 2012 TRUE UP
ATXI Rate Base
Page.Line2012 Projected - Effective Mar 12 2012 Actual Change Percent
2.6 Total Gross Plant 53,171,000 52,637,808 -533,192 -1%2.12 Total Accum Depreciation 1,653,000 1,646,760 -6,240 0%2.18 TOTAL NET PLANT 51,518,000 50,991,048 -526,952 -1%
2.18a 100% CWIP RECOVERY 8,742,000 4,883,265 -3,858,735 -44%
ADJUSTMENTS TO RATE BASE 0 N/A2.20 Account No. 282 -11,550,000 -11,796,750 -246,750 2%2.21 Account No. 283 0 -573,717 -573,717 N/A2.22 Account No. 190 4,009,000 4,241,715 232,715 6%2.25 Land Held for Future Use 0 0 0 N/A2.26 CWC 68,110 155,678 87,568 129%2.27 Materials & Supplies 0 0 0 N/A2.28 Prepayments 0 0 0 N/A
TOTAL ADJUSTMENTS -7,472,891 -7,973,074 -500,184 7%
2.30 TOTAL RATE BASE 52,787,110 47,901,239 -4,885,871 -9%
26
ATXI 2012 TRUE UP
ATXI Expenses
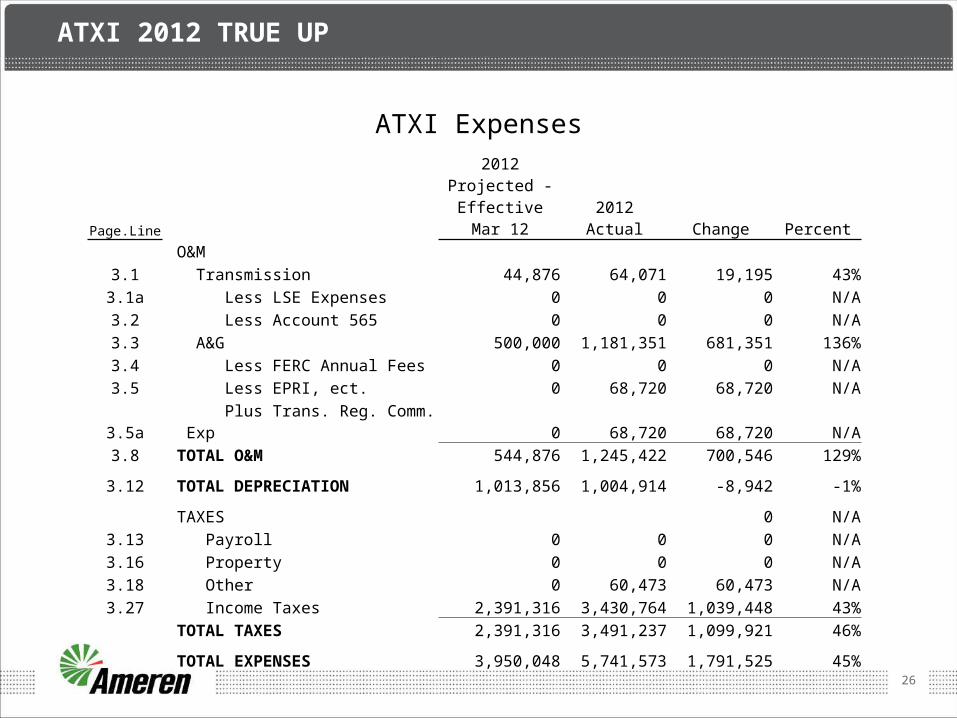
Page.Line2012 Projected - Effective Mar 12 2012 Actual Change Percent
O&M3.1 Transmission 44,876 64,071 19,195 43%3.1a Less LSE Expenses 0 0 0 N/A3.2 Less Account 565 0 0 0 N/A3.3 A&G 500,000 1,181,351 681,351 136%3.4 Less FERC Annual Fees 0 0 0 N/A3.5 Less EPRI, ect. 0 68,720 68,720 N/A3.5a Plus Trans. Reg. Comm. Exp 0 68,720 68,720 N/A3.8 TOTAL O&M 544,876 1,245,422 700,546 129%
3.12 TOTAL DEPRECIATION 1,013,856 1,004,914 -8,942 -1%
TAXES 0 N/A3.13 Payroll 0 0 0 N/A3.16 Property 0 0 0 N/A3.18 Other 0 60,473 60,473 N/A3.27 Income Taxes 2,391,316 3,430,764 1,039,448 43%
TOTAL TAXES 2,391,316 3,491,237 1,099,921 46%
TOTAL EXPENSES 3,950,048 5,741,573 1,791,525 45%

27
ATXI 2012 TRUE UP
Total ATXI Revenue Requirement
Page.Line2012 Projected - Effective Mar 12 2012 Actual Change Percent
2.30 TOTAL RATE BASE 52,787,110 47,901,239 -4,885,871 -9%4.30 Rate of Return on ACS 9.43% 11.76% 2.32% 25%3.28 Return from ACS 4,980,379 5,631,738 651,359 13%
2.30a 100% CWIP RECOVERY 8,742,000 4,883,265 -3,858,735 -44%4.30e Incremental Rate of Return on HCS 0.04% -2.53% -2.57% -6196%3.28a Incremental Return from HCS 3,628 -123,554 -127,182 -3505%
Total Return 4,984,007 5,508,184 524,177 11%Total Expenses 3,950,048 5,741,573 1,791,525 45%
3.29 TOTAL GROSS REV. REQ. 8,934,055 11,249,758 2,315,702 26%
3.30 Less ATT. GG Adjustment 0 0 0 N/A3.30a Less ATT. MM Adjustment 1,143,454 773,909 -369,545 -32%3.31 GROSS REV. REQ. UNDER ATT. O 7,790,601 10,475,848 2,685,247 34%

28
ATXI 2012 TRUE UP
ATXI True-up & Net Revenue Requirement
Page.Line2012 Projected - Effective Mar 12 2012 Actual Change Percent
1.1 Gross Revenue Requirement 7,790,601 10,475,848 2,685,247 34%1.6 Total Revenue Credits 611,000 583,131 -27,869 -5%
1.6a Historic Year Actual ATRR 0 0 0 N/A1.6b Projected ATRR from Prior Year 0 0 0 N/A1.6c Prior Year ATRR True-Up 0 0 0 N/A1.6d Prior Year Divisor True-Up 0 0 0 N/A1.6e Interest on Prior Year True-Up 0 0 0 N/A
1.7 NET REVENUE REQUIREMENT 7,179,601 9,892,717 2,713,116 38%

29
ATXI 2012 TRUE UP
ATXI 2012 Actual Attachment MM Calculation - Page 1
(1) (2) (3) (4)Attachment O
Line Page, Line, Col. Transmission AllocatorNo.1 Gross Transmission Plant - Total Attach O, p 2, line 2 + 18a col 5 (Note A) 57,521,073 1a Transmission Accumulated Depreciation Attach O, p 2, line 8 col 5 (Note A) 1,646,760 2 Net Transmission Plant - Total Line 1 minus Line 1a (Note B) 55,874,313
O&M TRANSMISSION EXPENSE3 Total O&M Allocated to Transmission Attach O, p 3, line 8 col 5 1,245,422 3a Transmission O&M Attach O, p 3, line 1 col 5 64,071 3b Less: LSE Expenses included in above, if any Attach O, p 3, line 1a col 5, if any - 3c Less: Account 565 included in above, if any Attach O, p 3, line 2 col 5, if any - 3d Adjusted Transmission O&M Line 3a minus Line 3b minus Line 3c 64,071
4 Annual Allocation Factor for Transmission O&M (Line 3d divided by line 1a, col 3) 3.89% 3.89%
OTHER O&M EXPENSE4a Other O&M Allocated to Transmission Line 3 minus Line 3d 1,181,351 4b Annual Allocation Factor for Other O&M Line 4a divided by Line 1, col 3 2.05% 2.05%
GENERAL AND COMMON (G&C) DEPRECIATION EXPENSE5 Total G&C Depreciation Expense Attach O, p 3, lines 10 & 11, col 5 (Note H) - 6 Annual Allocation Factor for G&C Depreciation Expense (line 5 divided by line 1 col 3) 0.00% 0.00%
TAXES OTHER THAN INCOME TAXES7 Total Other Taxes Attach O, p 3, line 20 col 5 60,473 8 Annual Allocation Factor for Other Taxes (line 7 divided by line 1 col 3) 0.11% 0.11%
9 Annual Allocation Factor for Other Expense Sum of line 4b, 6, and 8 2.16% 2.16%
INCOME TAXES10 Total Income Taxes Attach O, p 3, line 27 col 5 3,430,764 11 Annual Allocation Factor for Income Taxes (line 10 divided by line 2 col 3) 6.14% 6.14%
RETURN 12 Return on Rate Base (Note I) Attach O, p 3, line 28 col 5 5,631,738 13 Annual Allocation Factor for Return on Rate Base (line 12 divided by line 2 col 3) 10.08% 10.08%
14 Annual Allocation Factor for Return Sum of line 11 and 13 16.22%
HYPOTHETICAL CAPITAL STRUCTURE (HCS) RETURN15 Annual Allocation Factor HCS Return (Note J) Attach O, p 4, line 30e -2.53% -2.53%
30
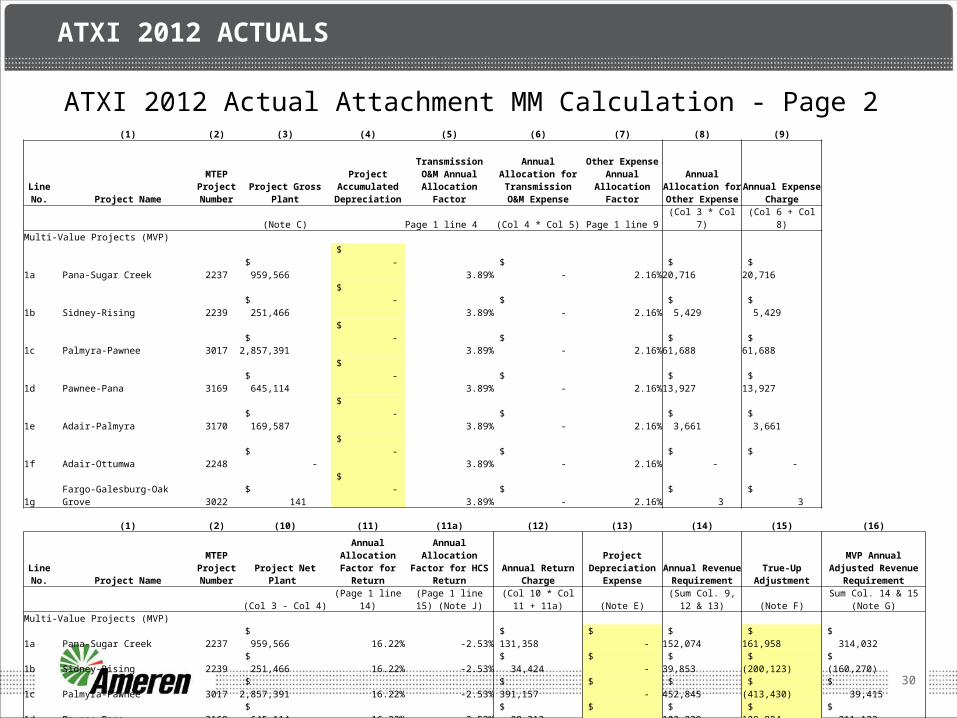
ATXI 2012 ACTUALS
ATXI 2012 Actual Attachment MM Calculation - Page 2 (1) (2) (3) (4) (5) (6) (7) (8) (9)
Line No. Project Name
MTEP Project Number
Project Gross Plant
Project Accumulated Depreciation
Transmission O&M Annual
Allocation Factor
Annual Allocation for Transmission
O&M Expense
Other Expense Annual Allocation
Factor
Annual Allocation for Other Expense
Annual Expense Charge
(Note C) Page 1 line 4 (Col 4 * Col 5) Page 1 line 9 (Col 3 * Col 7) (Col 6 + Col 8)Multi-Value Projects (MVP)
1a Pana-Sugar Creek 2237 $ 959,566
$ - 3.89%
$ - 2.16% $ 20,716 $ 20,716
1b Sidney-Rising 2239 $ 251,466
$ - 3.89%
$ - 2.16% $ 5,429 $ 5,429
1c Palmyra-Pawnee 3017 $ 2,857,391
$ - 3.89%
$ - 2.16% $ 61,688 $ 61,688
1d Pawnee-Pana 3169 $ 645,114
$ - 3.89%
$ - 2.16% $ 13,927 $ 13,927
1e Adair-Palmyra 3170 $ 169,587
$ - 3.89%
$ - 2.16% $ 3,661 $ 3,661
1f Adair-Ottumwa 2248 $ -
$ - 3.89%
$ - 2.16%
$ -
$ -
1g Fargo-Galesburg-Oak Grove 3022 $ 141
$ - 3.89%
$ - 2.16%
$ 3
$ 3
(1) (2) (10) (11) (11a) (12) (13) (14) (15) (16)
Line No. Project Name
MTEP Project Number Project Net Plant
Annual Allocation Factor for
Return
Annual Allocation Factor for HCS
ReturnAnnual Return
Charge
Project Depreciation
ExpenseAnnual Revenue
RequirementTrue-Up
AdjustmentMVP Annual Adjusted Revenue Requirement
(Col 3 - Col 4) (Page 1 line 14)(Page 1 line 15)
(Note J)(Col 10 * Col 11 +
11a) (Note E)(Sum Col. 9, 12 &
13) (Note F)Sum Col. 14 & 15
(Note G)Multi-Value Projects (MVP)
1a Pana-Sugar Creek 2237 $ 959,566 16.22% -2.53%
$ 131,358
$ - $ 152,074 $ 161,958 $ 314,032
1b Sidney-Rising 2239 $ 251,466 16.22% -2.53%
$ 34,424
$ - $ 39,853 $ (200,123) $ (160,270)
1c Palmyra-Pawnee 3017 $ 2,857,391 16.22% -2.53%
$ 391,157
$ - $ 452,845 $ (413,430) $ 39,415
1d Pawnee-Pana 3169 $ 645,114 16.22% -2.53%
$ 88,312
$ - $ 102,239 $ 108,884 $ 211,123
1e Adair-Palmyra 3170 $ 169,587 16.22% -2.53%
$ 23,215
$ - $ 26,876 $ 28,623 $ 55,500
1f Adair-Ottumwa 2248 $ - 16.22% -2.53%
$ -
$ -
$ - $ - $ -
1g Fargo-Galesburg-Oak Grove 3022 $ 141 16.22% -2.53%
$ 19
$ -
$ 22 $ 23 $ 46
2 MVP Total Annual Revenue Requirements $773,909 -$314,065 $459,845
3 Rev. Req. Adj For Attachment O $773,909

31
ATXI 2012 TRUE UP
ATXI 2012 Attachment MM True Up(a) (b) (c) (d) (e) (f) (g) (h) (i) (j) (k)
Actual Projected Attachment MM Actual True-Up Applicable True-Up MTEP Actual Annual Revenues Annual Adjustment Interest Adjustment TotalLine Project Project Attachment MM Revenue Allocated Revenue Principal Rate on Interest True-UpNo. Name Number Revenues Requirement 1 to Projects 1 Requirement 1 Under/(Over) Under/(Over) Under/(Over) Adjustment
Projected [Col. (d), line 1 Actual Attachment MM x (Col. (e), line 2x / Attachment MM Col. (h) x Col. (i) p 2 of 2, Col. 14 2 Col. (e), line 3)]2 p 2 of 2, Col. 14 2 Col. (g) - Col. (f) Line 5 x 24 months 2 Col. (h) + Col. (j)
1 Actual Attachment MM revenues for True-Up Year 1
$ 1,068,808
2a Pana-Sugar Creek 2237 - -
152,074 152,074 0.27% 9,884 161,958
2b Sidney-Rising 2239 243,670 227,763
39,853 (187,910) 0.27% (12,213) (200,123)
2c Palmyra-Pawnee 3017 899,784 841,045
452,845 (388,200) 0.27% (25,230) (413,430)
2d Pawnee-Pana 3169 - -
102,239 102,239 0.27% 6,645 108,884
2e Adair-Palmyra 3170 - 26,876 26,876 0.27% 1,747 28,623
2f Adair-Ottumwa 2248 - - - 0.27% - -
2gFargo-Galesburg-Oak Grove 3022 -
22 22 0.27% 1 23
3 Subtotal $ 1,143,454 $ 1,068,808 $ 773,909
4 Under/(Over) Recovery $ (294,899) $ (19,166) $ (314,065)5 Interest rate per month on Under Recovery (expressed to four decimal places) 0.27%1 Amount excludes True-Up Adjustment, as reported in True-Up Year projected Attachment MM, page 2, column 15.

32
ATXI 2012 TRUE UP
ATXI 2012 Load True Up
2012 ATXI Load and Rate Jan- Feb 1/ Mar - May June - Dec Average
Months Applicable
2
3 7 12 Net Att O Revenue Requirement in Effect $7,723,571 $7,179,601 $7,179,601 $7,270,263 AMIL Divisor for Period 7,188,902 7,188,902 7,256,406 7,228,279 ATXI Annual Projected Rate for period $1.0744 $0.9987 $0.9894 $1.0058
Historic Year Actual Divisor for Pricing Zone 7,197,583 Projected Year Divisor for Pricing Zone 7,228,279 Difference between Historic & Projected Yr Divisor 30,696 Prior Year Projected Annual Cost ($ per kw per yr) $1.0058 Prior Year Divisor True-up $30,874
1/ - ATXI testimony in ER12-749 included the following statement: "Note that the first true-up for 2012, to be posted in July 2013, will include revenues for January and February 2012 which are based on 2010 historical costs, plus revenues for the last 10 months of 2012 based on the new projected ATRR". Therefore, ATXI is including January and February in the volume and rate True-Up Calculation.

33
ATXI 2012 TRUE UP
Ameren Transmission Company of IllinoisInterest on 2012 Attachment O Load True Up
FERC interest rate 3.25%
ATXI short term debt rate 0.668%Interest Rate updated through July 2013
Rate to be applied to 2012 under recovery 0.6683%Monthly interest rate 0.0557%
Total True up $2,653,328.47
Interest on True up $35,469.69

34
AIC Revenue Requirement
Projected 2013 vs Projected 2014

35
AIC PROJECTIONS FOR 2014
AIC Rate Base
Page.Line Jan-13 Jan-14 Change Percent2.6 Total Gross Plant 1,196,828,998 1,327,622,018 130,793,020 11%
2.12 Total Accum Depreciation 446,390,099 465,639,921 19,249,822 4%2.18 TOTAL NET PLANT 750,438,898 861,982,097 111,543,198 15%
2.18a 100% CWIP RECOVERY 0 0 0 N/A
ADJUSTMENTS TO RATE BASE 0 N/A2.20 Account No. 282 -220,140,173 -229,080,460 -8,940,287 4%2.21 Account No. 283 -10,556,597 -17,757,369 -7,200,772 68%2.22 Account No. 190 47,301,777 40,041,062 -7,260,714 -15%2.23 Account No. 255 0 0 0 N/A2.25 Land Held for Future Use 528,800 425,040 -103,760 -20%2.26 CWC 4,399,010 4,767,079 368,069 8%2.27 Materials & Supplies 4,093,957 8,000,238 3,906,281 95%2.28 Prepayments 932,348 1,049,481 117,132 13%
TOTAL ADJUSTMENTS -173,440,877 -192,554,928 -19,114,051 11%
2.30 TOTAL RATE BASE 576,998,022 669,427,168 92,429,147 16%
36
AIC PROJECTIONS FOR 2014
AIC Expenses
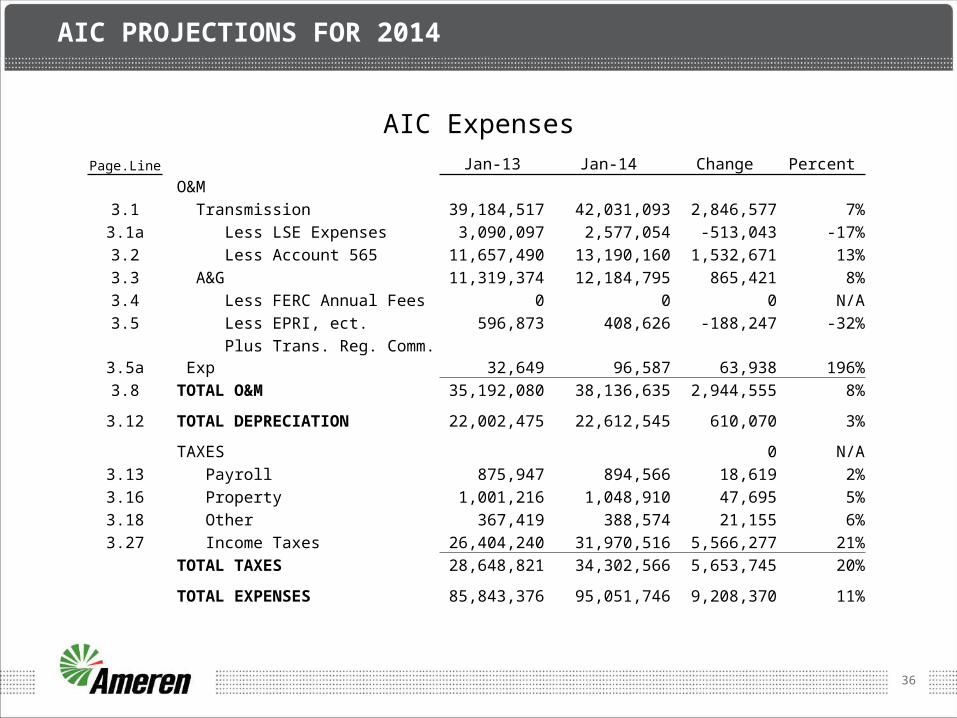
Page.Line Jan-13 Jan-14 Change PercentO&M
3.1 Transmission 39,184,517 42,031,093 2,846,577 7%3.1a Less LSE Expenses 3,090,097 2,577,054 -513,043 -17%3.2 Less Account 565 11,657,490 13,190,160 1,532,671 13%3.3 A&G 11,319,374 12,184,795 865,421 8%3.4 Less FERC Annual Fees 0 0 0 N/A3.5 Less EPRI, ect. 596,873 408,626 -188,247 -32%3.5a Plus Trans. Reg. Comm. Exp 32,649 96,587 63,938 196%3.8 TOTAL O&M 35,192,080 38,136,635 2,944,555 8%
3.12 TOTAL DEPRECIATION 22,002,475 22,612,545 610,070 3%
TAXES 0 N/A3.13 Payroll 875,947 894,566 18,619 2%3.16 Property 1,001,216 1,048,910 47,695 5%3.18 Other 367,419 388,574 21,155 6%3.27 Income Taxes 26,404,240 31,970,516 5,566,277 21%
TOTAL TAXES 28,648,821 34,302,566 5,653,745 20%
TOTAL EXPENSES 85,843,376 95,051,746 9,208,370 11%

37
AIC PROJECTIONS FOR 2014
Total AIC Revenue Requirement
Page.Line Jan-13 Jan-14 Change Percent2.30 TOTAL RATE BASE 576,998,022 669,427,168 92,429,147 16%4.30 Rate of Return 10.06% 9.57% -0.49% -5%3.28 Return 58,068,885 64,074,874 6,005,989 10%
Total Expenses 85,843,376 95,051,746 9,208,370 11%3.29 TOTAL GROSS REV. REQ. 143,912,261 159,126,620 15,214,359 11%
3.30 Less ATT. GG Adjustment 2,393,291 5,567,662 3,174,371 133%3.30a Less ATT. MM Adjustment 0 0 0 N/A3.31 GROSS REV. REQ. UNDER ATT. O 141,518,970 153,558,958 12,039,988 9%

38
AIC PROJECTIONS FOR 2014
AIC True-up & Net Revenue Requirement
Page.Line Jan-13 Jan-14 Change Percent1.1 Gross Revenue Requirement 141,518,970 153,558,958 12,039,988 9%1.6 Total Revenue Credits 8,011,058 10,558,034 2,546,976 32%
1.6a Historic Year Actual ATRR 0 0 0 N/A1.6b Projected ATRR from Prior Year 0 0 0 N/A1.6c Prior Year ATRR True-Up 0 0 0 N/A1.6d Prior Year Divisor True-Up 0 0 0 N/A1.6e Interest on Prior Year True-Up 0 0 0 N/A
1.7a NET REVENUE REQUIREMENT 133,507,911 143,000,924 9,493,013 7%1.7b Prairie Power 583,724 0 -583,724 N/A1.7 AIC Adjusted Revenue Requirement 134,091,635 143,000,924 8,909,289 7%

39
AIC PROJECTIONS FOR 2014
AIC Attachment GG Calculation - Page 1 (1) (2) (3) (4)
Attachment OLine Page, Line, Col. Transmission AllocatorNo.
1 Gross Transmission Plant - TotalAttach O, p 2, line 2 col 5 (Note
A) 1,288,643,141
2 Net Transmission Plant - TotalAttach O, p 2, line 14 and 23b
col 5 (Note B) 835,965,823
O&M EXPENSE
3 Total O&M Allocated to Transmission Attach O, p 3, line 8 col 5 38,136,635
4 Annual Allocation Factor for O&M (line 3 divided by line 1 col 3) 2.96% 2.96%
GENERAL AND COMMON (G&C) DEPRECIATION EXPENSE
5 Total G&C Depreciation ExpenseAttach O, p 3, lines 10 & 11, col
5 (Note H) 1,605,096
6 Annual Allocation Factor for G&C Depreciation Expense (line 5 divided by line 1 col 3) 0.12% 0.12%
TAXES OTHER THAN INCOME TAXES
7 Total Other Taxes Attach O, p 3, line 20 col 5 2,332,050
8 Annual Allocation Factor for Other Taxes (line 7 divided by line 1 col 3) 0.18% 0.18%
9 Annual Allocation Factor for Expense Sum of line 4, 6, and 8 3.26%
INCOME TAXES
10 Total Income Taxes Attach O, p 3, line 27 col 5 31,970,516
11 Annual Allocation Factor for Income Taxes (line 10 divided by line 2 col 3) 3.82% 3.82%
RETURN
12 Return on Rate Base Attach O, p 3, line 28 col 5 64,074,874
13Annual Allocation Factor for Return on Rate Base (line 12 divided by line 2 col 3) 7.66% 7.66%
14 Annual Allocation Factor for Return Sum of line 11 and 13 11.49%

40
AIC PROJECTIONS FOR 2014
AIC Attachment GG Calculation - Page 2
(1) (2) (3) (4) (5) (6) (7) (8) (9) (10) (11) (12)
Line No. Project Name
MTEP Project Number
Project Gross Plant
Annual Allocation Factor for Expense
Annual Expense Charge
Project Net Plant
Annual Allocation Factor for
Return
Annual Return Charge
Project Depreciation
ExpenseAnnual Revenue
RequirementTrue-Up
Adjustment
Network Upgrade Charge
(Note C)(Page 1 line
9) (Col. 3 * Col. 4) (Note D)(Page 1 line
14) (Col. 6 * Col. 7) (Note E) (Sum Col. 5, 8 & 9) (Note F)
Sum Col. 10 & 11
(Note G)
1a Wood River-Roxford 1502 138kV line 728 $3,424,487 3.26% $111,808 $2,985,993 11.49% $343,065 $72,620 $527,494 $0.00 527,494
1bSidney-Paxton 138kV Reconductor 18 miles 870 $5,972,222 3.26% $194,991 $5,146,204 11.49% $591,255 $149,094 $935,341 $0.00
935,341
1c Coffeen Plant-Coffeen, North - 2nd. Bus tie 2829 $5,592,558 3.26% $182,595 $5,194,191 11.49% $596,769 $94,119 $873,483 $0.00 873,483
1d Latham - Oreana 8.5 mile 345kV line 2068 $18,579,825 3.26% $606,625 $18,312,180 11.49% $2,103,914 $520,805 $3,231,345 $0.00 3,231,345
2 Annual Totals $5,567,662 $0 $5,567,662
3 Rev. Req. Adj For Attachment O $5,567,662
41
AIC PROJECTIONS FOR 2014
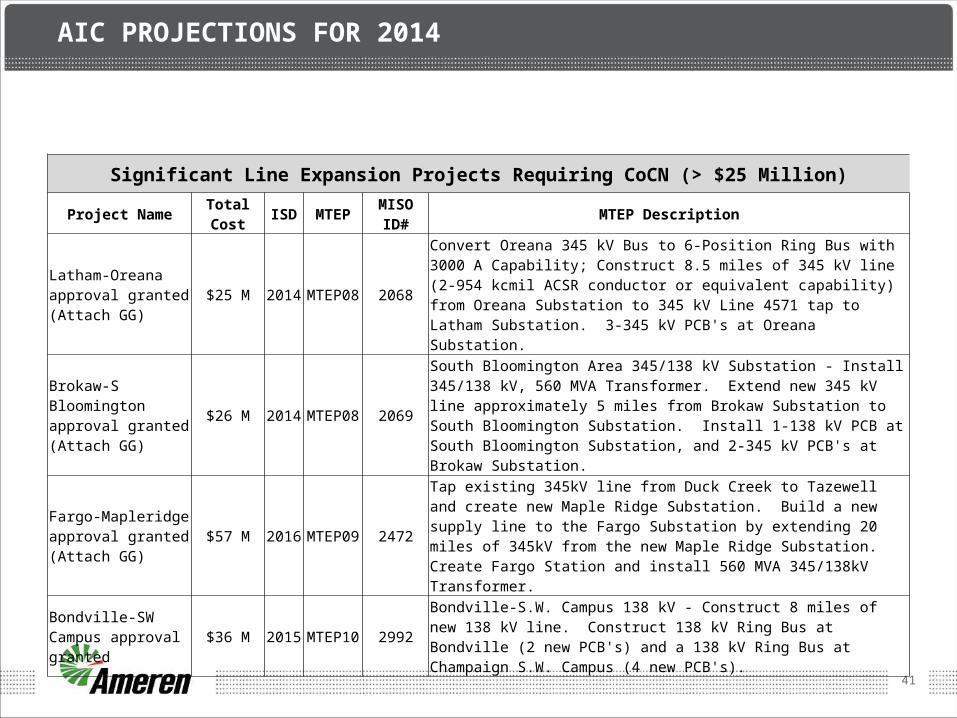
Significant Line Expansion Projects Requiring CoCN (> $25 Million)Project Name Total Cost ISD MTEP MISO ID# MTEP Description
Latham-Oreana approval granted(Attach GG)
$25 M 2014 MTEP08 2068Convert Oreana 345 kV Bus to 6-Position Ring Bus with 3000 A Capability; Construct 8.5 miles of 345 kV line (2-954 kcmil ACSR conductor or equivalent capability) from Oreana Substation to 345 kV Line 4571 tap to Latham Substation. 3-345 kV PCB's at Oreana Substation.
Brokaw-S Bloomington approval granted(Attach GG)
$26 M 2014 MTEP08 2069South Bloomington Area 345/138 kV Substation - Install 345/138 kV, 560 MVA Transformer. Extend new 345 kV line approximately 5 miles from Brokaw Substation to South Bloomington Substation. Install 1-138 kV PCB at South Bloomington Substation, and 2-345 kV PCB's at Brokaw Substation.
Fargo-Mapleridge approval granted(Attach GG)
$57 M 2016 MTEP09 2472Tap existing 345kV line from Duck Creek to Tazewell and create new Maple Ridge Substation. Build a new supply line to the Fargo Substation by extending 20 miles of 345kV from the new Maple Ridge Substation. Create Fargo Station and install 560 MVA 345/138kV Transformer.
Bondville-SW Campus approval granted $36 M 2015 MTEP10 2992 Bondville-S.W. Campus 138 kV - Construct 8 miles of new 138 kV line. Construct
138 kV Ring Bus at Bondville (2 new PCB's) and a 138 kV Ring Bus at Champaign S.W. Campus (4 new PCB's).

42
AIC PROJECTIONS FOR 2014
Modifications to Existing FacilitiesCategory 2013-2014 CAPEX Projects Description
Reliability/aging infrastructure replacement $197 million 216
These projects are primarily driven by the need to upgrade the transmission system based on meeting NERC standards or Ameren Planning Criteria and Guidelines. The NERC TPL standards set forth a set of tests that a transmission system must meet for a list of plausible scenarios, including contingent scenarios. Ameren Planning Criteria and Guidelines (C&G) are filed each year at FERC and constitute an additional, or complementary, set of tests that the transmission system must meet.
Clearance for planned line rating $168 million 92These projects are primarily driven by the need to upgrade the transmission system to support expected flows on the transmission circuits. Load growth, plant additions/retirements, and flow changes due to future system expansions are primary inputs into the decision to either increase ground clearances using existing wire or in some cases, increasing ground clearances with wire replacement, in order to achieve higher circuit ratings.
Right of way expansion $46 million 39
These projects are driven by the need to increase the rights and rights-of-way associated with 40 transmission corridors. The primary benefit of this set of projects is increased reliability of the system in the area of vegetation. In many cases, the existing rights-of-way are much narrower than the widths specified in Ameren's Planning Criteria and Guidelines for reliable circuit operation. The 2003 blackout and the recent 2011 Northeast US major outage event had vegetation as an incipient cause. After both events, and with the adoption of the FAC-003 standard, FERC has emphasized the need for increased vegetation management efforts which these projects support.
Improved Reliability $12 million 18These projects are driven by the need to address reliability concerns driven by system topology, configuration, or condition. Operating issues, including outages, usually identify these kinds of projects. The majority of these projects involve additions of equipment in substations, e.g. relaying and/or circuit breakers.

43
AMIL SCHEDULE 9 NITS RATE FOR 2014
AMIL Schedule 9 Rate Calculation
Page.Line 2013 * 2014 Change Percent1.7 AIC Adjusted Revenue Requirement 133,507,912 143,000,924 9,493,012 7%1.7 ATXI Adjusted Revenue Requirement 7,406,002 10,761,294 3,355,292 45%1.7 PPI Adjusted Revenue Requirement 3,555,338 3,555,338 0 0%
Total Revenue Requirement 144,469,252 157,317,556 12,848,304 9%1.15 Ameren Illinois Divisor 7,175,041 7,045,000 (130,041) -2%
. Annual Cost ($/kW/Yr) 20.135 22.330 2.195 11%
. Network & P-to-P Rate ($/kW/Mo) 1.678 1.861 0.183 11%
* 2013 rates above include PPI effective June 1, 2013. PPI revenue requirement subject to outcome of FERC Dockets EL13-69 and EL13-83. Actual AMIL Network & P-to-P Rate for 1/1/13 - 5/31/13 was $1.643/kW/Mo. The PPI revenue requirement will be updated annually on June 1st.

44
MISO WEB LINKS
• Transmission Pricing - Attachments O, GG & MM Information• https://
www.midwestiso.org/MarketsOperations/MarketInformation/Pages/TransmissionPricing.aspx
• Ameren OASIS• http://oasis.midwestiso.org/oasis/AMRN
• MTEP 11• https://www.midwestiso.org/Planning/TransmissionExpansionPlanning/P
ages/MTEP11.aspx
• Schedule 26 & 26-A Indicative Charges • https://
www.midwestiso.org/Planning/TransmissionExpansionPlanning/Pages/MTEPStudies.aspx

QUESTIONS?