Embed Size (px)
Citation preview

EN
Enterprise
and Industry
Enterprise and Industry
CYPRUS
2014 SBA Fact Sheet
In a nutshell
The immediate effect of two successive financial crises and the measures put in place to stabilise the situation was
to aggravate the recession. During the 2013 recession, negative growth rates were recorded mainly in the
construction, manufacturing, banking, transport, trade and other service sectors. Unemployment, which had reached
16 % by the end of 2013, is expected to continue to increase (compared to 7.9 % in 2011 and 11.8 % in 2012). The
increase in unemployment was accompanied by severe losses of disposable income and a sharp decline in the
spending power of the unemployed. This led to a drastic decrease in the volume of business of local SMEs. The
contraction of real GDP increased to 6 % in 2013. The primary concern of local SMEs was therefore to survive
during 2013. The situation of SMEs in the business economy reflects these macroeconomic developments.
Employment in SMEs (-7 %) and their added value (-9 %) decreased significantly, bringing SMEs’ overall losses in
employment and added value between 2010 and 2013 to -13 % and -14 % respectively. As a result of what
happened last year, many local SMEs in the construction and retail sectors closed down or saw their volume of
business drastically decrease. On top of job losses of 29 %, SMEs in construction continued to accumulate losses,
amounting to an overall 59 % decline in added value between 2010 and 2013.
In these difficult circumstances, the government tried mostly to take measures to help local SMEs survive and foster
a competitive business environment. Some measures announced in previous years were further delayed to give way
to higher priorities. As a result, most of the measures implemented in 2013 focused on helping SMEs access
external financing, grants or bank guarantees. Improvements were made in the area of responsive administration
and reducing red tape. No real progress was made in other problematic SBA areas, such as the environment, state
aid and public procurement.
About the SBA Fact Sheets1 The Small Business Act for Europe (SBA) is the EU’s flagship policy initiative to support small and medium-
sized enterprises (SMEs). It comprises a set of policy measures organised around 10 principles ranging
from ‘entrepreneurship’ and ‘responsive administration’ to ‘internationalisation’. To improve the governance
of the SBA, the 2011 review of the Act called for improved monitoring. The SBA Fact Sheets are published
annually and aim to improve understanding of recent trends and national policies affecting SMEs.
Ref. Ares(2016)1539710 - 31/03/2016

2014 SBA Fact Sheet — Cyprus 2
1. SMEs in Cyprus — basic figures2
EU–28 EU–28 EU–28
Number Proportion Proportion Number Proportion Proportion Billion € Proportion Proportion
Micro 37 637 92.1% 92.4% 78 399 37.4% 29.1% 2 26.8% 21.6%
Small 2 726 6.7% 6.4% 50 417 24.0% 20.6% 2 25.9% 18.2%
Medium-sized 439 1.1% 1.0% 41 673 19.9% 17.2% 2 23.6% 18.3%
SMEs 40 802 99.8% 99.8% 170 489 81.2% 66.9% 6 76.2% 58.1%
Large 79 0.2% 0.2% 39 388 18.8% 33.1% 2 23.8% 41.9%
Total 40 881 100.0% 100.0% 209 877 100.0% 100.0% 8 100.0% 100.0%
These are estimates for 2013 produced by DIW Econ, based on 2008–11 figures from the Structural Business Statistics Database
(Eurostat). The data cover the 'business economy', which includes industry, construction, trade, and services (NACE Rev. 2 sections B to J,
L, M and N), but not enterprises in agriculture, forestry and fisheries and the largely non-market service sectors such as education and
health. The advantage of using Eurostat data is that the statistics are harmonised and comparable across countries. The disadvantage is
that for some countries the data may be different from those published by national authorities.
Number of enterprises Number of employees Value added
Cyprus Cyprus Cyprus
At the end of 2013 Cyprus had about 40 800 SMEs,
99.8 % of the total number of local businesses,
accounting for 81 % of total employment, and 76 % of
total value added. This puts the proportion of
employment in SMEs about 14 % above the EU
average and value added about 18 % above the EU
average.
Most of Cyprus’ SMEs operate in the wholesale and
retail trade sectors (about 38 %), which account for
the highest proportion of SME employment (31 %) and
value added (29 %). 12 % of SMEs operate in the
accommodation and food services, construction,
professional activities and manufacturing sectors. In
accommodation and food services this proportion is
approximately 42 % higher than the EU average. The
proportion of value added by SMEs in this sector, as a
proportion of value added by all Cypriot SMEs, is
14 %. This is almost three times the EU average.
Almost 17 % of all employees working in SMEs are
employed in this sector, almost twice the EU average.
This shows how important the tourism industry is for
Cyprus and Cypriot SMEs, with the result that there is
less of a focus on other sectors that are more
important in most Member States, e.g. the
manufacturing sector. As a result, the proportion of
SMEs active in the manufacturing sector in terms of
employment and value added are between six and
seven percentage points below the EU average.
In the course of the continuing recession, negative
growth rates were recorded in 2013, mainly in
construction, manufacturing and trade3.
Unemployment, which had reached 16 % by the end
of 2013, is expected to continue to increase
(compared to 7.9 % in 2011 and 11.8 % in 2012)4.
Severe losses of disposable income and a sharp
decline in the spending power of the unemployed led
to a drastic decrease in the volume of business of
local SMEs and the contraction of real GDP increased
to 6 %5.
Employment in (-7 %), and value added by (-9 %),
SMEs decreased significantly in 2013, amounting to
overall losses of 13 % in SMEs’ proportion of
employment, and of 14 % in their added value,
between 2010 and 2013.
Value added by (-17 %) and employment in (-15 %)
microfirms decreased the most — 28 % below 2008
levels. Microfirms are particularly badly affected
because they are mostly family-owned businesses
operating in the retail sector, dominated by the arrival
of new financially strong shopping malls and
supermarket chains during the past five years. The
effect of the recession on households was to make
them very price-sensitive.
The number of company bankruptcies/liquidations
increased constantly between 2010 and 2013, from
920 to 1 670. The number of new company
registrations decreased from 19 278 to 10 850 during
the same period6. These figures show how badly the
2013 financial and economic crisis affected the
number of bankruptcies/liquidations (a significant
increase of 31 % in 2013 compared to 2012) and the
number of new company registrations (a significant
decrease of 40 % in 2013 compared to 2012).
Despite the recent downturn in the domestic market,
exports increased by about 10 % in 2013, possibly as
a result of the EU economies’ moderate recovery.

2014 SBA Fact Sheet — Cyprus 3
Nonetheless, imports still dominate in Cyprus, with
export/import ratios extremely low at about 15 %7.
By the end of 2013, forecasts were cautiously
positive. The Cypriot economy seems to be on track
to disprove the projections of its international lenders
as the economic downturn in the fourth quarter of
2013 was limited to 5.3 % of GDP8. There are signs
of stabilisation in the banking sector too. However,
the outlook remains downbeat, with increasing
unemployment, a shrinking volume of loans to SMEs.
and an increasing number of non-performing loans.
In this context, the IMF’s growth projections remain
unchanged, with a contraction of 4.8 % expected in
2014 and a modest, credit-less recovery in mid-
20159.
SME trends in Cyprus10
2014 SBA Fact Sheet — Cyprus 4
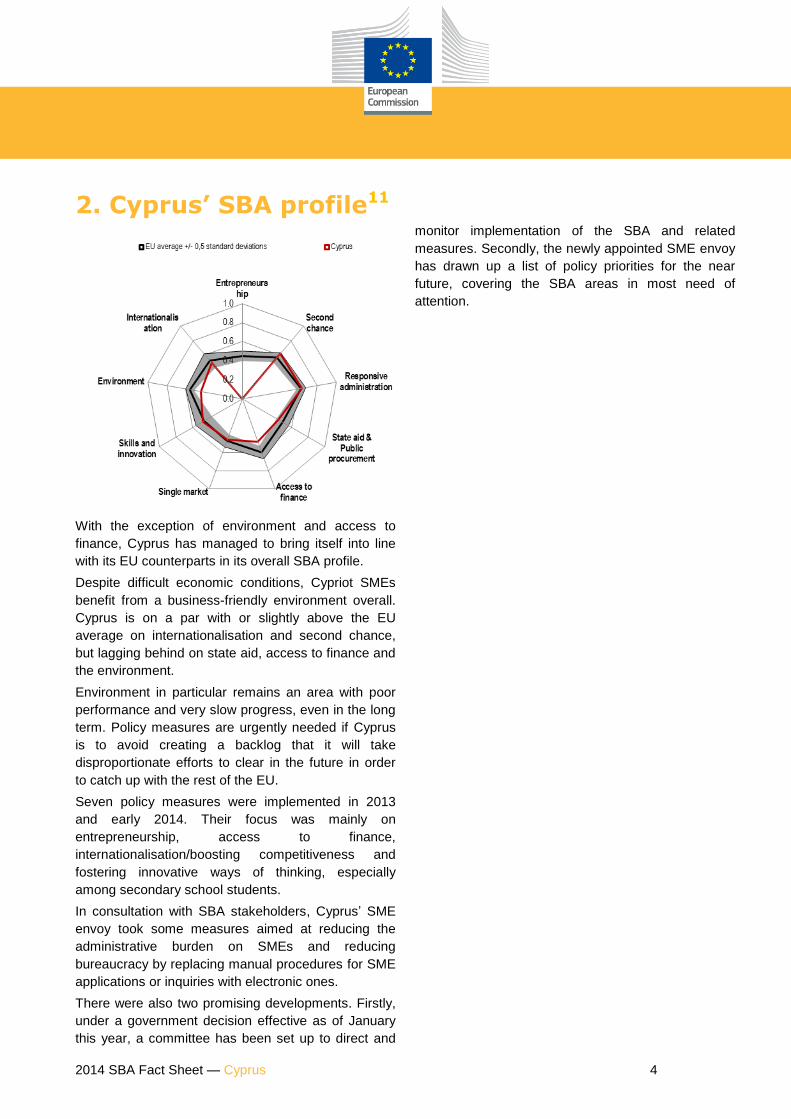
2. Cyprus’ SBA profile11
With the exception of environment and access to
finance, Cyprus has managed to bring itself into line
with its EU counterparts in its overall SBA profile.
Despite difficult economic conditions, Cypriot SMEs
benefit from a business-friendly environment overall.
Cyprus is on a par with or slightly above the EU
average on internationalisation and second chance,
but lagging behind on state aid, access to finance and
the environment.
Environment in particular remains an area with poor
performance and very slow progress, even in the long
term. Policy measures are urgently needed if Cyprus
is to avoid creating a backlog that it will take
disproportionate efforts to clear in the future in order
to catch up with the rest of the EU.
Seven policy measures were implemented in 2013
and early 2014. Their focus was mainly on
entrepreneurship, access to finance,
internationalisation/boosting competitiveness and
fostering innovative ways of thinking, especially
among secondary school students.
In consultation with SBA stakeholders, Cyprus’ SME
envoy took some measures aimed at reducing the
administrative burden on SMEs and reducing
bureaucracy by replacing manual procedures for SME
applications or inquiries with electronic ones.
There were also two promising developments. Firstly,
under a government decision effective as of January
this year, a committee has been set up to direct and
monitor implementation of the SBA and related
measures. Secondly, the newly appointed SME envoy
has drawn up a list of policy priorities for the near
future, covering the SBA areas in most need of
attention.

2014 SBA Fact Sheet — Cyprus 5
Cyprus’s SBA performance: status quo and
development between 2008 and 201412
‘Think small first’ principle The ‘think small first’ principle aims to ensure that SME concerns are integrated into EU and national legislation
and policies. Policy-makers at all levels are expected to consult small businesses and keep their needs and
limitations in mind at all stages of the legislative and policy processes. The aim is to ensure that regulations do
not unnecessarily or excessively burden SMEs or hamper their competitiveness. The analysis of the potential
impact of proposed legislation on SMEs (the SME test) is an essential component of the ‘think small first’
principle.
Cyprus has implemented a number of measures to alleviate the disproportionate regulatory and administrative
burden SMEs face compared to larger businesses. It has simplified impact assessments by including a
standardised questionnaire to accompany all legislative proposals. A public consultation with stakeholders must
be organised to complete the questionnaire. In line with the SBA, it has adopted a roadmap for implementing
the SME test.
A guide to legal drafting has been put together and civil servants involved in drafting new legislation are trained
to improve and simplify the procedure and to ensure that policy results are delivered at minimum cost and little
burden to business.
Better online communication between businesses and public authorities through a one-stop-shop is being set up
to simplify the most time-consuming procedures e.g. getting licences for renewable energy plants. So far,
Cyprus has managed to reduce the administrative burden by 19 % (June 2013).

2014 SBA Fact Sheet — Cyprus 6
The country’s SME envoy has set up a steering committee with SME representatives to ensure that the SBA is
effectively implemented and its implementation monitored. The committee will consult relevant ministries and
departments to identify and promote further action in support of SMEs in Cyprus.
Entrepreneurship
-2.0 -1.5 -1.0 -0.5 0.0 0.5 1.0 1.5 2.0
Degree to which school education helped develop an entrepreneurial attitude; 2012;Cyprus: 60; EU avg: 50
Variation from the EU average(measured in standard deviations, EU average=0)
Up-to-date statistics on Cyprus’ performance in this
area are no longer available because the data source
has changed (from the Eurobarometer Survey on
Entrepreneurship — available every three years — to
statistics provided through the Global
Entrepreneurship project — annually published, which
does not yet cover Cyprus).
Overall, the Eurobarometer data from 2012 shows a
reasonable amount of entrepreneurial activity. Four
out of 10 (39 % compared to 23 % in the EU) Cypriots
say they started a business in the past, or are doing
so. Entrepreneurial activity is intensifying, having
increased from 32 % in 2009.
The feasibility of becoming self-employed declined
however. It was slightly lower than the EU average in
2012: 27 % of Cypriots (37 % in 2009) said that it was
very or fairly feasible for them to start a business in
the near future, compared to the EU average of 30 %
(31 % in 2009). At the same time, 38 % (versus 12 %)
of Cypriots thought that the economic conditions were
not good enough for a start-up.
With regard to starting a business, the threat of
bankruptcy (48 % compared to the EU average of
13 %) and the lack of a guaranteed income (39 %
compared to 33 %) are Cypriots’ main concerns.
Although there has been a noticeable shift since 2009,
far more Cypriots than other EU citizens (45 % versus
37 %) would rather be self-employed. This shows that
the entrepreneurial inclination is there, but has been
undermined by economic conditions.
In policy terms, entrepreneurship was among the few
areas in which new measures were implemented and
progress is considered significant.
Under the Ministry of Commerce, Industry and
Tourism’s scheme for improving youth
entrepreneurship, a new call for the next phase of the
scheme was launched in November 2013. The
scheme provides financial support for young
entrepreneurs who want to start a business.
With the support of the Ministry of Education and
Culture, the Cyprus Productivity Centre and the
Entrepreneurship Education Programme run a
‘Productivity in Education’ school competition. It aims
to help secondary school students start their own
businesses as part of a team.

2014 SBA Fact Sheet — Cyprus 7
Second chance
-2.0 -1.5 -1.0 -0.5 0.0 0.5 1.0 1.5 2.0
Degree of support for a second chance (%); 2012; Cyprus: 85; EU avg: 82
Cost of resolving insolvency (cost of recovering debt as percentage of the debtor'sestate); 2014; Cyprus: 15; EU avg: 10.29
Time to resolve insolvency (in years); 2014; Cyprus: 1.5; EU avg: 2
Note: Data bars pointing right show better performance than the EU average and data bars pointing left show weaker performance.
Variation from the EU average(measured in standard deviations, EU average=0)
Cyprus’ performance in this area remains in line with
the EU average, although it is slightly undermined by
the cost of resolving insolvency, which are 50 %
higher than in the other Member States on average.
However, Cypriot entrepreneurs whose business has
failed and therefore need to claim insolvency can
finish the procedures six months faster than their
counterparts.
The public is also more supportive of entrepreneurs
who are taking a second chance than it is on average
in the EU.
No new policy measures are announced or have been
implemented in this area. Given the difficult economic
and entrepreneurial environment in Cyprus, this is a
complicated, sensitive area that requires a tailor-made
approach.
Responsive administration
-2.0 -1.5 -1.0 -0.5 0.0 0.5 1.0 1.5 2.0
Burden of government regulations (1=burdensome, 7=not burdensome); 2013;Cyprus: 4.1; EU avg: 3.2
Licenses and permit systems (1=lowest level of complexity, 26=highest level ofcomplexity); 2011; Cyprus: 15.2; EU avg: 15.77
SMEs interacting online with public authorities (%); 2013; Cyprus: 84.24; EU avg:87.58
The complexity of administrative procedures is a problem for doing business(percentage of respondents who agree); 2013; Cyprus: 57; EU avg: 63
Fast-changing legislation and policies are a problem for doing business (percentageof respondents who agree); 2013; Cyprus: 58; EU avg: 70
Cost of enforcing contracts (percentage of claim); 2014; Cyprus: 16.4; EU avg: 21.49
Time it takes to pay taxes (hours per year); 2014; Cyprus: 147; EU avg: 192.57
Number of tax payments per year; 2014; Cyprus: 30; EU avg: 12.54
Cost required to transfer property (percentage of property value); 2014; Cyprus:10.3; EU avg: 4.7
Time required to transfer property (in calendar days); 2014; Cyprus: 28; EU avg:27.7
Paid-in minimum capital (percentage of income per capita); 2014; Cyprus: 0; EUavg: 10.42
Cost of starting a business (in euros); 2013; Cyprus: 311; EU avg: 318
Time to start a business (in calendar days); 2013; Cyprus: 2; EU avg: 4.2
N
Variation from the EU average(measured in standard deviations, EU average=0)
Note: Data bars pointing right show better performance than the EU average and data bars pointing left show weaker performance.
Cyprus’ profile for this policy area is well in line with
2014 SBA Fact Sheet — Cyprus 8
the EU average. Overall, very little has changed and it
has managed to stay on track.
Cypriot SMEs continue to benefit from a business-
friendly environment, with good conditions for starting
a business (time, cost and the capital needed). The
regulatory burden is considered very reasonable.
Legislative and policy changes are not too frequent
and the administrative burden is not considered very
heavy.
There is however a lot of room for improvement in
some areas, such as the cost of transferring property
and the number of tax payments, both more than
twice the EU average.
More should also be done to facilitate and encourage
the use of e-services and online communication
between the government and SMEs.
No new measures were announced or implemented in
this area in 2013 and progress is considered limited.
The previously announced government data
warehouse initiative, aimed at putting the
technological infrastructure for online government
services in place, has not yet been implemented.
Significant progress is expected to be made in
reducing bureaucracy in the near future however,
given responsive administration is among the newly
appointed SME envoy’s priorities.
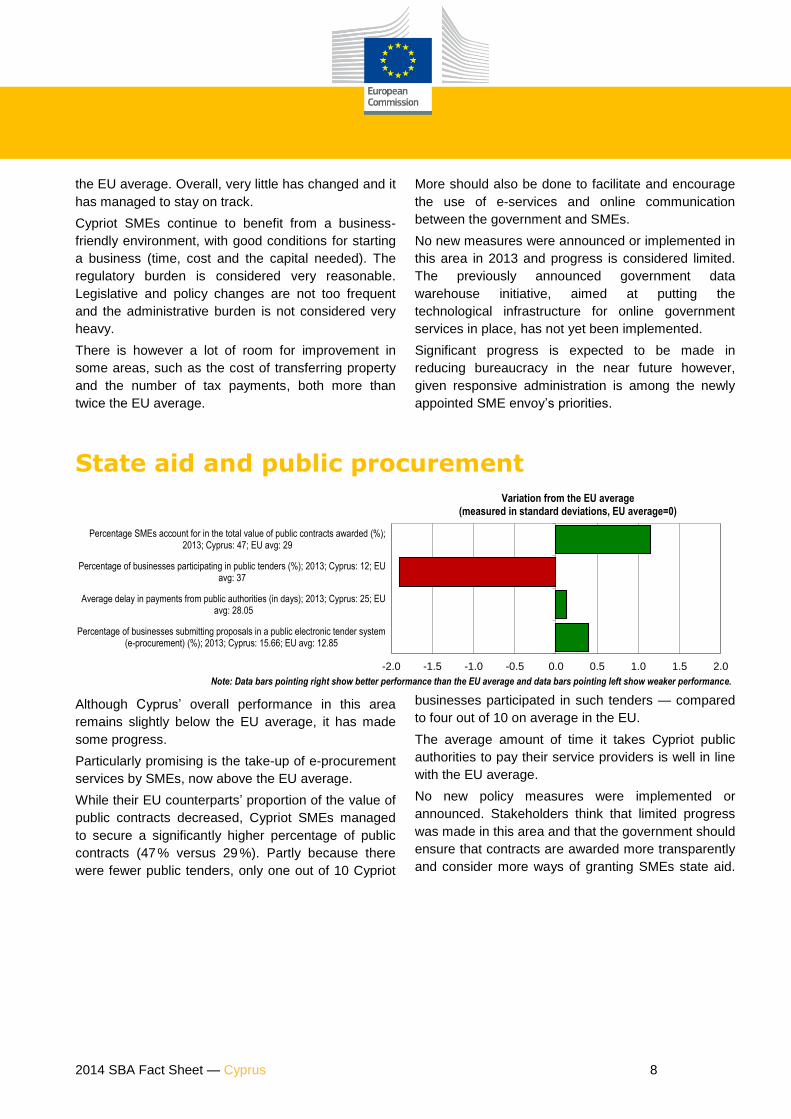
State aid and public procurement
-2.0 -1.5 -1.0 -0.5 0.0 0.5 1.0 1.5 2.0
Percentage of businesses submitting proposals in a public electronic tender system(e-procurement) (%); 2013; Cyprus: 15.66; EU avg: 12.85
Average delay in payments from public authorities (in days); 2013; Cyprus: 25; EUavg: 28.05
Percentage of businesses participating in public tenders (%); 2013; Cyprus: 12; EUavg: 37
Percentage SMEs account for in the total value of public contracts awarded (%);2013; Cyprus: 47; EU avg: 29
Note: Data bars pointing right show better performance than the EU average and data bars pointing left show weaker performance.
Variation from the EU average(measured in standard deviations, EU average=0)
Although Cyprus’ overall performance in this area
remains slightly below the EU average, it has made
some progress.
Particularly promising is the take-up of e-procurement
services by SMEs, now above the EU average.
While their EU counterparts’ proportion of the value of
public contracts decreased, Cypriot SMEs managed
to secure a significantly higher percentage of public
contracts (47 % versus 29 %). Partly because there
were fewer public tenders, only one out of 10 Cypriot
businesses participated in such tenders — compared
to four out of 10 on average in the EU.
The average amount of time it takes Cypriot public
authorities to pay their service providers is well in line
with the EU average.
No new policy measures were implemented or
announced. Stakeholders think that limited progress
was made in this area and that the government should
ensure that contracts are awarded more transparently
and consider more ways of granting SMEs state aid.

2014 SBA Fact Sheet — Cyprus 9
Access to finance
-2.0 -1.5 -1.0 -0.5 0.0 0.5 1.0 1.5 2.0
Strength of legal rights index (0-10); 2014; Cyprus: 9; EU avg: 6.82
Bad debt loss (percentage of total turnover); 2013; Cyprus: 3.6; EU avg: 3.83
Total amount of time it takes to get paid (days); 2013; Cyprus: 77.33; EU avg: 50.76
Cost of borrowing for small loans relative to large loans (%); 2013; Cyprus: 11.45;EU avg: 23.82
Willingness of banks to provide a loan (percentage of respondents that indicated adeterioration); 2013; Cyprus: 59.8; EU avg: 24.6
Access to public financial support including guarantees (percentage of respondentsthat indicated a deterioration); 2013; Cyprus: 31.6; EU avg: 17.3
Rejected loan applications and unacceptable loan offers (percentage of loanapplications by SMEs); 2013; Cyprus: 22.6; EU avg: 14.4
Note: Data bars pointing right show better performance than the EU average and data bars pointing left show weaker performance.
Variation from the EU average(measured in standard deviations, EU average=0)
As can be expected under current conditions, Cyprus’
performance in this area has continued to move
further away from the EU average.
The legislative framework for transactions is
adequately set up (legal rights index at 9 versus 6.82
on average) and SMEs do not face disproportionate
interest rates or higher costs for smaller loans (half
the EU average), but this is not enough to counter the
continuing deterioration of financing conditions.
In 2013 Cypriot SMEs found it very hard to survive
due to the closure of the second largest bank and the
personal accounts haircut in March. This severely
undermined the banking system and Cyprus’
economic model. All Cypriot businesses in all sectors
were negatively affected, making it increasingly harder
for both established and new businesses to get loans
from local banks. Faced with acute liquidity problems,
a lower volume of business and less profitability, an
increasing number of SMEs and microenterprises
went bankrupt or had to close down in 2013, further
increasing the number of non-performing loans.
Cyprus’ absorption rate of the structural funds also
remains low. Access to finance remains one of the
main difficulties for companies, particularly SMEs.
Since the bail-out and the greater capitalisation needs
have hampered the banking sector’s ability to finance
the real economy, eligible candidates find it difficult to
secure their financial contribution to their investment
proposals. As a result, even if their loan is approved,
they do not implement their investment proposal.
Four new measures to improve SMEs access to
finance were implemented.
New structural funding was made available to the
JEREMIE co-financing instrument administered by the
Bank of Cyprus. This measure co-finances loans of up
to EUR 100 000 to support and strengthen small and
microenterprises and help them expand.
More funding was made available to the Cooperative
Central Bank’s financing scheme for microbusinesses
(the PROGRESS programme), with the emphasis on
female and young entrepreneurs, sole traders and
start-ups.
The Trade Finance Facility is an innovative instrument
the European Investment Bank (EIB) is putting in
place to help SMEs in Cyprus.
The EIB Board approved a Trade Finance Facility
worth EUR 150 million for Cyprus. The facility’s
purpose is to re-activate credit lines with international
banks and support short-term trade-related
instruments for maintaining the Cypriot banking
sector’s capacity to provide a sufficient volume of
products such as credit letters, despite the
deterioration of their credit rating. By leveraging funds,
it will support the export and import flows of SMEs to
the tune of EUR 300 to 450 million a year, since they
are suffering the most from the credit squeeze. A EUR
50 million first contract under the Trade Finance
Facility has already been signed with the Bank of

2014 SBA Fact Sheet — Cyprus 10
Cyprus.
The government is also setting up the Cyprus
Entrepreneurship Fund (CYPEF) to improve the
liquidity of Cypriot SMEs. Its budget is EUR 100
million and is funded by national funds acquired
through a loan from the EIB. Implemented in
cooperation with selected financial intermediaries, it
will provide financing for SMEs through risk-sharing
loans 50 % co-financed by the financial intermediaries.
The loans will be offered to SMEs with good interest
rates and reasonable repayment deadlines and will be
available by the end of 2014.
A funding scheme has been set up to help keep jobs
in the retail sector. This measure aims to minimise
layoffs by local microbusinesses in the retail sector,
badly affected by the ongoing economic crisis. In
place since February 2014, it provides a fixed subsidy
of EUR 7 000 for each microbusiness in the retail
sector that employs fewer than four people. Its main
aim is to help the business retain its current
employees for at least 12 months.
Single market
-2.0 -1.5 -1.0 -0.5 0.0 0.5 1.0 1.5 2.0
Number of pending infringement proceedings; 2013; Cyprus: 12; EU avg: 30
Average transposition delay for overdue directives (in months); 2013; Cyprus: 6.7;EU avg: 8
Number of single market directives not yet transposed; 2013; Cyprus: 13; EU avg:8.69
Public contracts secured abroad by SMEs (percentage of total value of publiccontracts); 2013; Cyprus: 9.1; EU avg: 2.6
SMEs with intra-EU imports of goods (percentage of SMEs in industry); 2011;Cyprus: 22.25; EU avg: 17.47
SMEs with intra-EU exports of goods (percentage of SMEs in industry); 2011;Cyprus: 4.74; EU avg: 13.89
Note: Data bars pointing right show better performance than the EU average and data bars pointing left show weaker performance.
Variation from the EU average(measured in standard deviations, EU average=0)
Cyprus’ performance in this area has improved and is
now close to the EU average.
Improvements are most noticeable in the average
amount of time it takes to transpose directives that
have not yet been enacted in national law, now more
than a month less than the EU average. This has a
knock-on effect on the number of outstanding single
market directives, which has decreased from twice the
average last year to 13, compared to 8.69 on average.
Cypriot SMEs manage to secure almost four times the
contract value abroad that their EU counterparts do.
Although traditionally they tend to import more than
they export, more recent figures than those used for
this assessment show a considerable increase in the
number of exports (10 % during 2013)13
. Since they
only cover goods, the figures for SMEs with intra-EU
exports or imports do not present the whole picture.
For example, statistics on trade in services
disaggregated by size-class are not available.
No significant policy measure was announced or
implemented over the period in question.

2014 SBA Fact Sheet — Cyprus 11
Skills and innovation
-2.0 -1.5 -1.0 -0.5 0.0 0.5 1.0 1.5 2.0
Percentage of all enterprises that train their employees; 2010; Cyprus: 72; EU avg:66
Turnover from e-commerce; 2013; Cyprus: 5.44; EU avg: 13.98
Percentage of SMEs purchasing online; 2013; Cyprus: 7.55; EU avg: 26.31
Percentage of SMEs selling online; 2013; Cyprus: 6.88; EU avg: 13.87
Sales of new-to-market and new-to-firm innovations (percentage of turnover); 2010;Cyprus: 14.7; EU avg: 14.37
Percentage of innovative SMEs collaborating with others; 2010; Cyprus: 21.49; EUavg: 11.69
Percentage of SMEs innovating in-house; 2008; Cyprus: 41.55; EU avg: 31.83
Percentage of SMEs introducing marketing or organisational innovations ; 2010;Cyprus: 36.99; EU avg: 40.3
Percentage of SMEs introducing product or process innovations; 2010; Cyprus: 34.8;EU avg: 38.44
Note: Data bars pointing right show better performance than the EU average and data bars pointing left show weaker performance.
Variation from the EU average(measured in standard deviations, EU average=0)
Cyprus’ performance in this area is stable and in line
with the EU average, but it has made little progress.
The data available for most indicators are out-of-date,
making it harder to assess whether or not there was
any improvement in the number of SMEs who
introduce innovations into their markets, or in the
resulting turnover.
Where recent data are available however, they show
that Cypriot SMEs are still not familiar enough with
online business, or confident enough to do business
online. All the indicators show values that are at best
half the EU average. Their EU counterparts
outnumber by three to one Cypriot SMEs that buy
online.
Nevertheless, the importance of skills and innovation
for the competitiveness of Cypriot SMEs, especially
given their increasing involvement in international
business and trade, is increasingly being recognised.
Only one new measure was implemented however: a
productivity measure and benchmarking programme
set up by the Cyprus Productivity Centre. It gives local
SMEs useful information about performance data from
more than 100 000 counterparts all over the world.
The data cover financial, customer-related, process-
related, learning and growth objectives. The
information enables Cypriot SMEs to compare their
performance with that of many international
counterparts/competitors, giving them an incentive to
internationalise by becoming more competitive
through innovation and research.

2014 SBA Fact Sheet — Cyprus 12
Environment
-2.0 -1.5 -1.0 -0.5 0.0 0.5 1.0 1.5 2.0
Percentage of SMEs that have benefited from public support measures for theirproduction of green products; 2013; Cyprus: 0; EU avg: 26
Percentage of SMEs with a turnover share of more than 50% generated by greenproducts or services; 2013; Cyprus: 19; EU avg: 22
Percentage of SMEs that offer green products or services; 2013; Cyprus: 25; EUavg: 26
Percentage of SMEs that have benefited from public support measures for theirresource-efficiency actions; 2013; Cyprus: 52; EU avg: 35
Percentage of SMEs that have taken resource-efficiency measures; 2013; Cyprus:73; EU avg: 95
Note: Data bars pointing right show better performance than the EU average and data bars pointing left show weaker performance.
Variation from the EU average(measured in standard deviations, EU average=0)
New data for this area shows that Cyprus has made
no progress.
While more SMEs than the EU average have obtained
public support to finance their resource-efficiency
measures, overall the number of businesses that have
actually implemented such measures remains well
below the EU average.
Under current conditions, environmental issues are
not a priority for Cypriot SMEs or for the government.
Nevertheless, the indicators for the number of
businesses that offer green products or services or
derive more than half their turnover from such
products or services are only slightly below the
average.
Recently SMEs have not obtained any public support
for producing green products. This is not surprising
given the Cypriot economy’s current financial
difficulties.
Since there were higher priorities in other areas, no
new policy measures were introduced in this area
over the period in question.

2014 SBA Fact Sheet — Cyprus 13
Internationalisation
-2.0 -1.5 -1.0 -0.5 0.0 0.5 1.0 1.5 2.0
Number of documents required to export; 2014; Cyprus: 5; EU avg: 4.25
Time required to export (in days); 2014; Cyprus: 7; EU avg: 11.82
Cost required to export (in USD); 2014; Cyprus: 865; EU avg: 1034.64
Number of documents required to import; 2014; Cyprus: 7; EU avg: 4.68
Time required to import (in days); 2014; Cyprus: 5; EU avg: 10.71
Cost required to import (in USD); 2014; Cyprus: 1010; EU avg: 1069.89
SMEs with extra-EU imports of goods (percentage of SMEs in industry); 2011;Cyprus: 13.96; EU avg: 8.18
SMEs with extra-EU exports of goods (percentage of SMEs in industry); 2011;Cyprus: 4.35; EU avg: 9.68
N
Variation from the EU average(measured in standard deviations, EU average=0)
Overall, Cyprus continues to perform above the EU
average in this area.
Data for extra-EU exports and imports of goods cover
only industry SMEs and are out-of-date, making it
hard to assess progress. Although figures show an
increase in exports of 10 % during 2013, the impact of
export activities remains marginal because it accounts
for only 5 % of GDP.
Nonetheless, the costs of importing (measured as the
fees levied on a 20-foot container, including
documents, customs clearance, terminal handling
etc.) and the time it takes to import or export goods
are well below the EU average. However, the
administrative burden related to international
activities, which is heavier than average, should be
further reduced.
No new policy measures were implemented in 2013.

2014 SBA Fact Sheet — Cyprus 14
3. Good practice Below is an example of an interesting policy practice from Cyprus to show what governments can do to
support SMEs:
Cyprus Entrepreneurship Fund (CYPEF)
In December 2013 the government announced it would set up a fund to support and strengthen
entrepreneurship by giving SMEs better access to finance. It will make EUR 100 million available to the fund
through the European Investment Bank. The European Investment Fund (EIF) will manage CYPEF.
Its financial instruments, covering working capital and investments, will be available to SMEs at lower interest
rates and with fewer collateral requirements, extended loan maturities and grace periods.
The EUR 100 million of initial capital from the EIB will be matched by equal contributions from the EIF’s
selected financial intermediaries, amounting to EUR 200 million in total for SMEs. Additional amounts may
become available later on if the market satisfactorily absorbs CYPEF.
Reference: http://www.eif.org/what_we_do/resources/cypef/index.htm
Important remarks The Small Business Act (SBA) Fact Sheets are produced by DG Enterprise and Industry as part of the SME
Performance Review (SPR), which is its main vehicle for economic analysis of SME issues. They combine
the latest available statistical and policy information for the 28 EU Member States and nine non-EU countries
which also contribute to the EU’s Competitiveness and Innovation Framework Programme (CIP). Produced
annually, the Fact Sheets help to organise the available information to facilitate SME policy assessments and
monitor SBA implementation. They take stock and record progress. They are not an assessment of Member
States’ policies but should be regarded as an additional source of information designed to improve evidence-
based policy-making. For example, the Fact Sheets cite only those policy measures deemed relevant by
local SME policy experts. They do not, and cannot, reflect all measures taken by the government over the
reference period. More policy information can be found on a database accessible from the SPR website.
Please also see the end notes overleaf.
For more information SME Performance Review:
http://ec.europa.eu/enterprise/policies/sme/facts-figures-analysis/performance-review/index_en.htm
Small Business Act:
http://ec.europa.eu/enterprise/policies/sme/small-business-act/index_en.htm
The European Small Business Portal:
http://ec.europa.eu/small-business/index_en.htm

2014 SBA Fact Sheet — Cyprus 15
1 The 2014 SBA Fact Sheets benefited substantially from input from the European Commission’s Joint
Research Centre (JRC) in Ispra, Italy. The JRC made major improvements to the methodological approach,
statistical work on the dataset and the visual presentation of the data. 2 Unless stated otherwise, the proportions and growth rates are calculated based on the data the European
Commission provided for Cyprus. See http://ec.europa.eu/enterprise/policies/sme/facts-figures-
analysis/performance-review/index_en.html. 3 IMF Country Report No 13/374, December 2013. See
http://www.imf.org/external/pubs/ft/scr/2013/cr13374.pdf. 4 Ibid. 5 Calculated based on real GDP data from the European Commission’s annual macro-economic database
http://ec.europa.eu/economy_finance/ameco/user/serie/SelectSerie.cfm. 6 Department of Registrar of Companies and Official Receiver.
7 Based on figures published by the Statistical Service of Cyprus. 8 Preliminary estimate issued on 14 February 2014 by Statistical Service of Cyprus. 9 IMF. See http://www.imf.org/external/pubs/ft/scr/2014/cr1492.pdf. 10 The three graphs below present the trend over time for the variables. They consist of index values for 2008
to 2015, with the base year 2008 set at a value of 100. As from 2012, the graphs show estimates of the
development over time, produced by DIW Econ on the basis of 2008–11 figures from the Structural Business
Statistics Database (Eurostat). The data cover the ‘business economy’, which includes industry, construction,
trade and services (NACE Rev. 2 sections B to J, L, M and N). They do not cover enterprises in the financial
sector, agriculture, forestry and fisheries or largely non-market service sectors such as education and health.
A detailed methodology can be consulted at: http://ec.europa.eu/enterprise/policies/sme/facts-figures-
analysis/performance-review/index_en.htm. 11 The policy measures presented in this SBA Fact Sheet represent only a selection of the measures taken
by the government in 2013 and the first quarter of 2014. The selection was made by the national SME policy
expert contracted by CARSA Spain (DG Enterprise’s lead contractor for the 2014 Fact Sheets). The experts
were asked to select only those measures that, in their view, were the most important, i.e. were expected to
have the highest impact in the specific SBA area. The complete range of measures that the experts compiled
in producing this year’s Fact Sheets will be published alongside the Fact Sheets in the form of a policy
database on the DG Enterprise website. 12 The quadrant chart combines two sets of information: first, it shows the status quo performance based on
data for the latest available years. This information is plotted along the x-axis measured in standard
deviations of the simple, non-weighted arithmetical average for the EU-28. Secondly, it reveals progress over
time, i.e. the average annual growth rates for 2008–14. The growth rates are measured against the individual
indicators which make up the SBA area averages. Hence, the location of a particular SBA area average in
any of the four quadrants provides information not only about where the country is located in this SBA area
relative to the rest of the EU at a given point in time, but also about the extent of progress made in 2008–14.