Embed Size (px)
DESCRIPTION
45xtgd67fuyh7
Citation preview

lable at ScienceDirect
Renewable Energy 64 (2014) 82e97
Contents lists avai
Renewable Energy
journal homepage: www.elsevier .com/locate/renene
Ecodesign of photovoltaic grid-connected systems
J.R. Perez-Gallardo a, C. Azzaro-Pantel a,*, S. Astier b, S. Domenech a, A. Aguilar-Lasserre c
aUniversité de Toulouse, INPT, UPS, Laboratoire de Génie Chimique, 4 Allée Emile Monso, F-31432 Toulouse, FrancebUniversité de Toulouse, INPT, UPS, LAPLACE (Laboratoire PLAsma et Conversion d’Energie), ENSEEIHT, 2 rue Charles Camichel, BP 7122, F-31071 ToulouseCedex 7, Francec Instituto Tecnológico de Orizaba, Division of Research and Postgraduate Studies, Av. Instituto Tecnológico 852, Col. Emiliano Zapata, 94300 Orizaba,Veracruz, México
a r t i c l e i n f o
Article history:Received 1 March 2013Accepted 14 October 2013Available online 22 November 2013
Keywords:Optimum system sizingPhotovoltaic grid-connected systemEnvironmental impactLife cycle assessmentGenetic algorithms
* Corresponding author.E-mail address: [email protected]
0960-1481/$ e see front matter � 2013 Elsevier Ltd.http://dx.doi.org/10.1016/j.renene.2013.10.027
a b s t r a c t
Optimization approaches for PV grid-connected system (PVGCS) have focused on optimizing the tech-nical and economic performances. The main objective of this study is thus to propose an integratedframework that manages simultaneously technical, economic and environmental criteria. Life CycleAssessment (LCA) is applied for the evaluation of environmental impacts of PVGCS. The proposedframework involves a PVGCS sizing simulator involving the computation of solar irradiance coupled to anouter optimization loop, based on a Genetic Algorithm. The objective is to maximize the annual energygenerated by the facility. The analysis was carried out for different types of solar panel technologies:monocrystalline silicon (m-Si), polycrystalline silicon (p-Si), amorphous silicon (a-Si), cadmium telluride(CdTe) and copper indium diselenide (CIS). The environmental impact assessment was achieved by use ofthe IMPACT 2002þ method embedded in the SimaPro software tool with Ecoinvent database. The otherchosen criteria based on technical and economic aspects concern the payback time of investment (PBT)and energy payback time (EPBT).
To select the best option among the five choices under study, a weighted evaluation is performed on allcriteria in order to obtain a score for each technology. The technology with the lowest total score is the a-Sitechnology. A more relevant analysis is then performed taking into account the environmental impacts perkWh produced, as new criteria. In this case, the CIS PV module technology best meets the objectives.
� 2013 Elsevier Ltd. All rights reserved.
1. Introduction
Solar Photovoltaic (PV) systems will be a major alternative incoming decades to cope with the scarcity of fossil fuels [1,2]. Thedirect conversion technology based on solar PV has several positiveattributes. Although hydroelectric, thermal and nuclear power arecheaper in generation, solar PV has an edge over them since it re-quires almost no maintenance and neither depletes natural re-sources nor pollutes while in operation [3,4]. The energy source,our sun, is free and inexhaustible. PV technology is also very robustand has a long life.
The PV grid-connected system (PVGCS) performance dependsexclusively upon the availability of solar energy at the site, systemelements and configuration, and load parameters. The annual en-ergy generated by a PVGCS is calculated as the sum of hourly pro-duction over the entire year. This hourly production depends onmany parameters such as PV collector peak power, solar radiation
r (C. Azzaro-Pantel).
All rights reserved.
on PV module plane, PV module temperature, shading, inverterefficiency and size, maximum power point tracking losses and thearrangement of the various electrical connections [5e8].
The size and configuration of a PVGCS are critical for evaluatingprofitability and environmental performance [9,10]. The search foran optimal arrangement of collectors in a field, trying to satisfydifferent objectives, constitutes an important challenge. Theoptimal deployment is principally based on production [5,6,11e14]or economic [9,12,15] criteria. Another criterion that has lately beenused to evaluate PVGCS is the environmental impact [3,16e20].
As PVGCS is exclusively made with static components gener-ating no particulate matter emission and requiring no fluid main-tenance, the only potential impact of PVCGS during operation isrelated to the environmental impact on flora and fauna arising fromchange in land use. It can also cause changes in the economic ac-tivities. Emissions are generated by the use of fossil fuel-basedenergy [16,21,22] during the manufacture of the components,building and subsequent recycling of the components. This paperdeals with this particular issue.
Although different models and tools have been developed toachieve the optimum PVGCS configuration, they are limited to a

J.R. Perez-Gallardo et al. / Renewable Energy 64 (2014) 82e97 83
single objective evaluation, usually based on technical or economiccriteria, and in few cases, on environmental criteria.
The goal of this work is to propose a system for generatingalternative configurations of PV power plants, taking into accountsimultaneously three criteria based on technical, economic andenvironmental aspects, while considering different types of PVsolar technologies through an optimizationmethod. In the first partof this paper, the analysis of a literature review reports the differentstudies and tools that enable the modeling and design of a PVGCS.Secondly, the optimization approach is described in detail. Then,the results obtained after the proposed methodology was testedinto single-objective studies are discussed. Finally, the majorcontribution of this work is highlighted along with some ideas thatcould be implemented in the future.
2. Literature review
Systemmodeling forms a key part of the PV system design. It canprovide answers to a number of important issues such as the overallarray size, orientation and tilt, and the electrical configuration. Thedesign criteria depend generally on the nature of the application.The applications of PVGCS vary from small building integratedsystems to PV power plants. Modeling tools are available to providesolar radiation data, assess possible shading effects and produce theresulting electrical layout of the array as presented in what follows.
2.1. PV system design and sizing tools
When designing a PVGCS, it is very difficult to make an accurateassessment of the power generation through photovoltaic conver-sion because it depends on many uncertain parameters. A widevariety of software tools now exist for the analysis, simulation andsizing of photovoltaic systems. These tools present different de-grees of complexity and accuracy depending on the specific tasksthat each tool had been developed for. Examples of these sizing andsimulation tools are given in Table 1. In general, they involve theestimation of solar radiation (using a meteorological database or amathematical model) and/or the estimation of the energy gener-ated by the system taking into account the characteristics andlocation of the PV components in the field (e.g. modules, the bal-ance of system), weather consideration and solar radiation.
2.2. Solar radiation
Solar radiation on tilted surfaces is a very important aspect inthe design of flat plate PV collectors for power plants. To eliminatethe effects of local features, solar radiation is measured on hori-zontal surfaces, free of obstacles. Consequently, solar radiation datais most often given in the form of global radiation on a horizontalsurface. Since PV modules are usually positioned at an angle to thehorizontal plane, the radiation input to the system must be calcu-lated from this data.
Global radiation on a tilted surface consists of three compo-nents, i.e., beam radiation, diffuse radiation and reflected radiation.The calculation of irradiance arriving on a tilted surface, used asinput global horizontal data, raises two main problems, firstly, theseparation of the global horizontal radiation into its direct anddiffuse components and secondly, the estimation of the irradiancecomponents incident on an inclined surface.
Over the years, different models have been developed to esti-mate solar radiation over tilted surfaces [23e25]. These models canbe classified as isotropic or anisotropic models. However, a largemajority of these models use the same method of calculating beamand ground-reflected radiation, the main difference being thetreatment of the diffuse radiation.
Isotropic models assume that the intensity of the sky-diffusedradiation is uniform over the sky dome. Hence, the diffuse radiationincident on a tilted surface depends on the fraction of the sky domeseen by it. The most widely used model belonging to this category isthe one developed by Liu and Jordan (presented in Ref. [23]).
The second group of models assumes both, the anisotropy of thesky diffused radiation in the circumsolar region (sky near the solardisc) and, an isotropically distributed diffuse component from therest of the sky dome.
2.3. Output energy estimation
The design of PVGCS must take into account the dimensions ofthe field, the balance of system components and, solar radiationdata. In addition, shading and masking affect the collectordeployment, by decreasing the incident energy on collector sur-faces of the field.
In a solar field, an array of PV modules (collectors), are deployedin different rows with spacing; this allows tilting and facilitatesmaintenance. In this arrangement, a collector may cast a shadowonthe adjacent row during the day, thus decreasing the amount ofcollected energy. This shading effect depends on the spacing be-tween the collector rows, the collector height, the tilt angle, the rowlength and on the latitude of the solar field. The use of many rows ofcollectors, densely spread, not only increases the surface availableto transform solar irradiation, but also increases the shading.
The spacing, and consequently, shading has also an influence onlocal environmental since it does not allow grass or farm crops togrow between the PV panels. This aspect will not be studied in thispaper.
The balance of system (BOS), that encompasses all the compo-nents of a photovoltaic system besides the photovoltaic panels, alsoinfluences the estimation of the annual energy generated by thefacility because of the efficiency of the electrical components.
2.4. Techniques for sizing PV systems
In any PVGCS, sizing represents an important part of the design.Besides being an economic waste, an oversized system can nega-tively affect further utilization of solar cells and energy generation.Undoubtedly, at the present stage of development of PV technology,the major impediment to a wider market penetration is the highinvestment costs of the PV systems [2].
The solar field design problem may be described by mathe-matical expressions. The configuration of PV is based on criteriasuch as the minimum field area required for producing a givenamount of energy, the maximum energy generated from a givenfield or minimum cost of investment.
There are recent methods developed for sizing the parametersfor PVCGS based on Artificial intelligence (AI) and Genetic algo-rithm (GA) techniques [6,15,26e29].
2.4.1. Genetic algorithmGenetic algorithms (GA) are inspired by the way organisms
adapt to the harsh realities of life in a hostile world, i.e., by evolu-tion and inheritance. The algorithm imitates, in the process, theevolution of population by selecting only fit individuals forreproduction.
GAs were envisaged by Holland in the 1970s as an algorithmicconcept based on a Darwinian-type survival-of-the-fittest strategywith sexual reproduction, where stronger individuals in the pop-ulation have a higher chance of creating an offspring. A geneticalgorithm is implemented as a computerized search and optimi-zation procedure that uses principles of natural genetics and nat-ural selection. The basic approach is to model the possible solutions

Table 1System sizing and simulation programs.
Program Source Objective Type of system Main characteristics Resultants Advantages Inconvenient
CalSol Institut Nationalde l’Energie Solaire(INES), France
Simulation and dataanalysisof PV system
Grid-connected,stand-alone andDC-grid system
- Economic analysis tool - CO2 balance- Report of yield productionand monthly irradiation
- Economic report
- Easy to handle- Pre-sizing- Available online
- Only French meteorologicaldatabase
- No PV components database.- Insufficient energy losscalculation andeconomic analysis
- No interconnection withanother program isallowed
PVGIS Institute forEnergyand Transport eEuropeanCommission
Estimation of solar radiationand simulation of a PVsystem
Grid-connected - Meteorological database- Interactive maps
- Report of yield production- Monthly or daily radiation
- Easy to handle- Import meteorologicaldata
- Available online
- Exclusive to Europe and Africa- No PV components database- No energy loss calculation andeconomic analysis
- No interconnection withanother program isallowed
PVSOL Solar DesignCompany,UK
Design, simulation anddata analysis of PVsystem
Grid-connectedand stand-alone
- Extensive meteorologicaland PV components database.
- Calculation of shading losses�3D design tool- Economic analysis tool
- Report of yieldproduction, efficiencyof system and losses
- Economic report
- Easy to handle�3D animation- Import of meteorologicaldata
- Possibility of parametersettings
- Good quality results
- No interconnection withanother program isallowed
PVsyst University ofGeneva,Switzerland
Sizing, design, simulationand data analysis ofPV system
Grid-connected,stand-alone andDC-grid system
- Extensive meteorologicaland PV components database.
- Calculate shading losses�3D design tool- Economic analysis tool
- Report of yieldproduction, irradiation,efficiency of systemand losses
- Economic report
- Import of meteorologicaldata
�3D animation- Possibility of parametersettings
- Good quality results
- Unfriendly use- Sizing restricted to collectorconfiguration
- No interconnection withanother program isallowed
SolarPro Laplace SystemCo., Japan
Design and simulationof PV system
Grid-connected - Meteorological and PVcomponents database
�3D design tool- Calculation of shading losses
- Report of yieldproduction
- Easy to handle - No energy loss calculation andeconomic analysis
- No interconnection with anotherprogram is allowed
J.R.Perez-Gallardo
etal./
Renewable
Energy64
(2014)82
e97
84

Fig. 1. Functional flow diagram of the proposed methodology.
J.R. Perez-Gallardo et al. / Renewable Energy 64 (2014) 82e97 85
to the search problem as binary strings. Various portions of thesebit-strings represent parameters in the search problem. If aproblem-solving mechanism can be represented in a reasonablycompact form, then GA techniques can be applied using proceduresto maintain a population that represent candidate solutions, andthen let that population evolve over time through competition(survival of the fittest and controlled variation). A GAwill generallyinclude the three fundamental genetic operations of selection,crossover and mutation. These operations are used to modify thechosen solutions and select the most appropriate offspring to passon to succeeding generations. GAs consider many points in thesearch space simultaneously and have been found to provide arapid convergence to a near optimum solution in many types ofproblems: in other words, they usually exhibit a reduced chance ofconverging to local minima.
GA applications are appearing as alternatives to conventionalapproaches and in some cases are useful where other techniqueshave been completely unsuccessful. GAs are also used with intel-ligent technologies such as neural networks, expert systems, andcase-based reasoning.
3. PVGCS optimization approach
As explained in the previous section, several programs andmathematical models have been developed to calculate either thesolar irradiance received at a given point on the planet or size aPVGCS. Most of the studies reviewed [5,6,9,27,28,30] suggest opti-mizing PVGCS while considering only one criterion. Other authors[17,19,20,31] address only the issue of the environmental impactassessment of the elements of a PV systemwith emphasis on the PVmodule technology. Our main purpose consists of generatingalternative PVGCS configurations, taking into account their tech-nical, economic and environmental impact.
The main problem found in the programs described in Table 1 isthe lack of an integrated approach that allows the optimization ofthe sizing of a PVGCS. The coupling of all elements, via an externalprogram to optimize the model using a genetic algorithm, is diffi-cult due to the closed structure used.
To overcome the problem of interoperability, the design of asimulator for received solar radiation coupled with a sizing moduleconstitutes the most suitable option. The simulator must bedesigned in an open manner so that it can be interfaced easily withan outer optimization loop. TheMULTIGEN environment previouslydeveloped in our research group [32] was selected as the geneticalgorithm platform. It can treat both mono- and multi-objectiveproblems. In this work, only the mono-objective case is consid-ered. Hence, the potential of GAs to solve multi-objective problemsserves as an incentive to use such an optimization strategy. Thisconstitutes a natural way to extend this work. As it was initiallydeveloped in Visual Basic for Applications (VBA) in Excel, the samelanguage is used for simulation purpose.
The main advantages include the automation of repetitive tasksand calculations, and the easy creation of macros in a friendlyprogramming language.
Fig. 1 illustrates the system flow diagram for optimizing aPVGCS. The proposed system is a simulation tool coupled with anoptimization module based on genetic algorithms for optimalconfiguration alternatives. The system involves the followingmodels:
a) The estimated solar radiation received by the system ac-cording to the geographic location.
b) The PVGCS sizing based on a mathematical model that pro-vides the annual energy generated from the characteristics of
the system components and limitations on the design of theinstallation.
c) The evaluation of economic, technical and environmentalcriteria.
d) The optimization of the above criteria in order to generatealternatives for the optimal configuration of PVGCS.
3.1. Solar radiation model
The solar radiation model computes the radiation received atthe site where the future plant will be built. Fig. 2 shows the inputdata necessary for the operation of the model, sub-models and theoutputs.
The inputs for this module are classified into two groups. Theformer group is composed of meteorological data of the studiedsite. The average hourly temperature is available from various da-tabases. Another important element to establish the relationshipbetween solar radiation on the surface of the Earth and the extra-terrestrial radiation is the index of transparency of the atmo-sphere or clearness index (Kt). This index is the radio between thehorizontal radiation of a particular hour and the extra-terrestrialradiation for that hour, as expressed by:
Kt ¼ GGo
(1)
The latter group is composed of all the data inherent to thegeographic location of the sitewhere the facility will be placed. Thisinformation allows us to estimate the position of the sun and thesolar radiation that the facility will handle every hour.
When radiation passes through the atmosphere of Earth,changes in its trajectorymay occur because of the elements presentin it. Elements such as ozone, oxygen, carbon dioxide and watervapor absorb radiations; some are reflected by the clouds. Dust andwater droplets also cause disturbances. The result is the decom-position of the incident solar radiation into a receiver placed on thesurface in different components [33].
The estimation of diffused radiation is very complex because itdepends on the composition, shape and position of the elementsthat cause the scattering of radiation and this may vary with time.Diffused radiation is essentially anisotropic. The amount of re-flected radiation is affected by the nature of the ground and by awide range of features (snow, vegetation, water, etc.).
Solar radiation received on a horizontal surface is split into itsbeam and diffused components. These components provide thebasis for estimating solar radiation on tilted surfaces. Fig. 3 showsthe relations among the different levels of solar radiation.

Fig. 2. Data flow diagram of solar irradiance estimation model.
J.R. Perez-Gallardo et al. / Renewable Energy 64 (2014) 82e9786
3.1.1. Components of hourly radiation on horizontal surfaceHourly irradiance received on the horizontal surfaces may be
expressed by:
G ¼ Gb þ Gd (2)
Presented in Ref. [23], Miguel et al. establish a correlation be-tween the diffuse fraction of hourly global horizontal irradiance andthe clearness index. This correlation is given by the followingexpressions:
GdG
¼8<:
0:995�0:081Kt if Kt<0:210:724þ2:738Kt�8:32Kt2þ4:967Kt3 if 0:21�Kt�0:76
0:180 if Kt>0:76
(3)
Then, the beam irradiance can be calculated by reformulatingEq. (2) as follows:
Gb ¼ G� Gd (4)
Fig. 3. Sequence for determination o
3.1.2. Components of hourly radiation on tilted surfaceThe most appropriate procedure to calculate the global irradi-
ance on a tilted surface is to obtain separately the components to bedefined after, as expressed by:
Gb ¼ Gb;b þ Gb;d þ Gb;r (5)
3.1.2.1. Beam irradiance. The amount of beam irradiance on a tiltedsurface can be calculated by multiplying the beam horizontalirradiance by the beam ratio factor (rb).
Gb;b ¼ Gbrb (6)
rb ¼ cos qcos qz
(7)
One considerationmust be taken into account in calculating thiscomponent, when the sun shines on the back of the surface (cosq < 0) the irradiance on the PV modules is normally not utilized,Gb,b ¼ 0. A factor max (0, cos q) is introduced in Eq. (7).
f hourly global tilted irradiance.

J.R. Perez-Gallardo et al. / Renewable Energy 64 (2014) 82e97 87
rb ¼ maxð0; cos qÞcos qz
(8)
3.1.2.2. Reflected irradiance. The reflectivity of most types ofground surfaces is rather low [33] except snow and ice. Conse-quently, the contribution of this type of irradiance falling on areceiver is low. Eq. (9) computes ground-reflected irradiance.
Gb;r ¼ rG1� cos b
2(9)
where r is the reflectivity of the ground and depends on thecomposition of the ground. A value of 0.2 is commonly adopted.
3.1.2.3. Diffuse irradiance. The methods used to estimate thediffuse irradiance on a tilted surface are classified as either isotropicor anisotropic models. The isotropic models assume that the in-tensity of diffuse sky radiation is uniform over the sky dome. Hence,the diffuse irradiance incident depends on the fraction of the skydome where the surface is located.
A well-known isotropic model was proposed by Liu and Jordan(1963).
Gb;d ¼ Gd1þ cos b
2(10)
Better results are obtained with the supposed anisotropicmodels. These type of models include a circumsolar brightening,which assumes that the highest intensity is found at the peripheryof the solar disk and decreases with increasing angular distancefrom the periphery.
Hay and Devis (consulted in Ref. [23] propose a model based onthe assumption that all that is diffused can be represented by acircumsolar component coming directly from the sun and anisotropic component coming from the entire celestial hemisphere.The diffuse irradiance on a tilted surface is then:
Gb;d ¼ Gdrd (11)
rd ¼ GbGo
rb þ�1� Gb
Go
��1þ cos b
2
�(12)
Reindl et al. propose another model (presented in Ref. [23], (Eq.(13)). This model extends the Hay and Davies model by adding thehorizon brightening. The horizon brightening is assumed to be alinear source at the horizon, independent of azimuth. In fact, forclear skies, the horizon brightening is highest at the horizon anddecreases in intensity away from the horizon. For overcast skies, thehorizon brightening has a negative value.
rd ¼ GbGo
rb þ�1� Gb
Go
��1þ cos b
2
�"1þ
ffiffiffiffiffiffiGbGo
ssin3
�b
2
�#(13)
3.1.3. ValidationThe simulator was used to estimate the annual radiation
received in 4 different positions: Toulouse, France (43.4� N, 1.2� E,altitude 152 m), Sydney, Australia (33.5�S, 151.1� E, altitude42 m), Mexico City, Mexico (19.2� N, 99.1� W, altitude 2277 m)and Singapore, Singapore (1.1� N, 104.1� E, altitude 5 m). Theresults were compared with those estimated for the same citiesby PVsyst software [34] and MIDC SOLPOS Calculator 2.0 [35].MIDC SOLPOS Calculator 2.0 was developed by the National
Renewable Energy Laboratory (NREL), a research laboratory forthe U.S. Department of Energy. This software tool contains a SolarPosition Algorithm (SPA) [36] for solar radiation applicationsdeveloped by the NREL. The algorithm can calculate the sunzenith and azimuth angle with uncertainties equal to �0.0003�.MIDC SOLPOS Calculator calculates the position of the sun in thesky and its intensity for any given location, day, and time. It isvalid from the year 1950e2050 and has an uncertainty of�0.01� [37].
As we mention in Table 1, PVsyst is a PV simulation tool devel-oped at the University of Geneva, Switzerland to be used by ar-chitects, engineers and researchers. In 2011, PVsyst got excellentresults in the PHOTON Magazine evaluation [38]. The evaluationconsidered approximately 20 different PV simulation softwareavailable on the market, for the study of PV systems yield, and triedto assess the accuracy of irradiance data in the horizontal plane andambient temperature, as well as horizon shading,
The lowest statistical difference between the result of oursimulator and those of the PV simulation software tools consideredas references was found when the formula developed by Hay et al.reported in Ref. [23] for diffused radiation was used (eq. (12)).
3.2. PVGCS sizing model
The second model of the system aims at calculating annualenergy generated by the system from the radiation computed bythe first model and the characteristics of the electrical components.This model considers the following aspects:
a) The field dimension where the PVGCS will be installed;b) Technical aspects of the different elements of the PVGCS.c) Design restrictions due to maintenance and safety purposes.
These restrictions concern not only the maximumweight of thestructures that will support the PV modules but also the stan-dards and best practices to ensure appropriate maintenance incase of problems during operation of the PVGCS.
Fig. 4 describes the main elements of this model.
3.2.1. PVGCS mathematical sizing modelWeinstock and Appelbaum [9] formulated the PVGCS sizing
problem as a mathematical problem. The optimal design parame-ters of the solar field were determined to obtain the maximumannual incident energy on the collector planes for a given field size.
The improvements that were implemented relative to themodelpresented in Ref. [9] concern the computation of the output powerof the system, mainly in the following aspects:
� The equation used to calculate the diffuse irradiance received bythe collector was replaced by the anisotropic model of Hay et al.[24].
� The reflected irradiance was included in the calculation of theradiation received by the installation.
� The method used to calculate energy loss caused by the shadowgenerated by adjacent collectors was changed. An array indi-cating the number of panels covered in a collector was createdfollowing the method proposed by Ziar et al. [39]
Themodel considers a horizontal field without elevations with afixed length L and a fixed width W. It comprises K rows of solarcollectors with a horizontal distance D between the rows; eachcollector has a length LC, a heightH, and are tilted by an angle bwithrespect to the horizontal (Fig. 5). Each collector is an array of PVmodules arranged in Nr rows and Nc columns. The length of col-lector row LC and its height HC are given by:
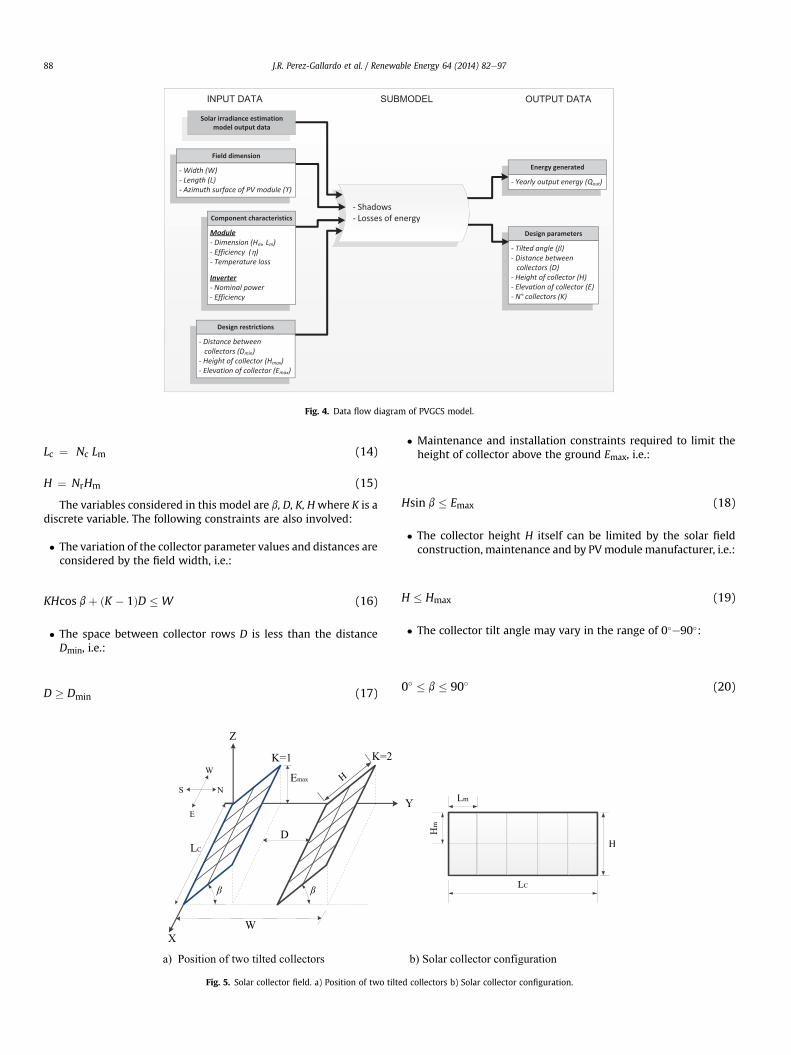
Fig. 4. Data flow diagram of PVGCS model.
J.R. Perez-Gallardo et al. / Renewable Energy 64 (2014) 82e9788
Lc ¼ Nc Lm (14)
H ¼ NrHm (15)
The variables considered in this model are b, D, K, Hwhere K is adiscrete variable. The following constraints are also involved:
� The variation of the collector parameter values and distances areconsidered by the field width, i.e.:
KHcos bþ ðK � 1ÞD � W (16)
� The space between collector rows D is less than the distanceDmin, i.e.:
D � Dmin (17)
Fig. 5. Solar collector field. a) Position of two tilt
� Maintenance and installation constraints required to limit theheight of collector above the ground Emax, i.e.:
Hsin b � Emax (18)
� The collector height H itself can be limited by the solar fieldconstruction, maintenance and by PVmodule manufacturer, i.e.:
H � Hmax (19)
� The collector tilt angle may vary in the range of 0�e90�:
0� � b � 90� (20)
ed collectors b) Solar collector configuration.

Fig. 6. Shading by collectors in a stationary solar field [9].Fig. 8. Life Cycle Assessment framework.
J.R. Perez-Gallardo et al. / Renewable Energy 64 (2014) 82e97 89
� The number of collector rows of the configuration is less than orequal to 2 and discrete:
2 � K˛Zþ (21)
3.2.2. Direct shadingIn the case of large-scale solar plants, collectors are set in several
rows and shading by neighbors may become inevitable. Theshadow that is projected from a collector to another one variesthroughout the day and can be determined geometrically [39,40].
The amount of shading depends on the distance between thecollector rows D, their height H, the row length Lc, the tilt angle b
and the latitude f (see Fig. 6).A status matrix is defined, M(j, k, t, n), as follows in order to
determine the shaded modules of the collector in a specific hour tand in a specific day n [28]:
Fig. 7. Evaluation of
Mðj; k; t;nÞ ¼�1 if module in column j and row k is unshaded0 if module in column j and row k is shaded
This matrix makes it possible to determine if a module receivessolar irradiation during the whole day or only at given hours of theday. In addition, the status matrix assumes that any partiallyshaded module at a given time is considered as a fully shadedmodule.
3.2.3. Output energy of solar fieldThe output power of the modules in a row connected in series
depends on three main factors: module efficiency (h), moduletemperature (Tm), and the number of shaded modules at a giventime. The meteorological data at the specific site together with thegeographical coordinates of the site allow calculating the powerdelivered by a module as a function of time.
QmðtÞ ¼ hAGbðtÞ (23)
The module temperature was calculated according to VanOverstraeten et al. [13], eq. (24), and the loss of power due totemperature rises over 25 �C is taken into account in eq. (25) for thepower delivered by a module at time t and day n:
criteria model.
at hour t in day nat hour t in day n
(22)

Fig. 9. Boundaries fixed for LCA in a PVGCS.
J.R. Perez-Gallardo et al. / Renewable Energy 64 (2014) 82e9790
TmðtÞ ¼ 20þ 0:035GbðtÞ (24)
Qmðt;nÞ ¼ hAGbðt;nÞ½1þ TkðTmðt;nÞ � 25Þ� (25)
The integration of eq (25) over a year predicts the annual energyproduced by a module.
The yearly incident solar energy of the field is given by:
Human Toxicity
Respiratory effects
Ionizing radiation
Ozone layer deplet
Photochemical oxi
Aquatic ecotoxicity
Terrestrial ecotoxic
Aquatic acidificatio
Aquatic eutrophica
Terrestrial acid/nut
Land occupation
Global warming
Non-renewable ene
Mineral extraction
Inventory results
Mid-point categori
/nut
Fig. 10. IMPACT 2002þ framework: Mid-
Qout ¼NrNcX365n¼1
X24t¼1
Qmðt;nÞ
þ ðK � 1ÞX365n¼1
X24t¼1
XNr
k¼1
XNc
j¼1
Mðj; k; t;nÞQmðt;nÞ(26)
The first part of the equation (26) represents the energy pro-duced by the unshaded first collector and the second part com-prises the energy produced by the K�1 shaded collectors.
ion
dation
ity
n
tion
ri
rgy
Human Health
Ecosystem Quality
Climate Change
Resources
es End-point categories
ri
point and End-point categories [42].

Fig. 11. Process for evaluate environmental criteria.
Table 3Typical features of various commercial PV modules technologies.
PV module Hm (m) Wm (m) h (%) Tk (%/�C) Nominal power (Wp)
m-Si [43] 1.56 1.05 20.10 �0.380 327.00p-Si [44] 1.64 0.94 15.50 �0.485 300.00a-Si [45] 1.31 1.11 7.20 �0.200 105.00CdTe [46] 1.20 0.60 11.50 �0.250 82.50CIS [47] 1.26 0.98 12.20 �0.310 150.00
Table 4Results obtained for the best configuration that maximizes the output energy of thesystem.
PV module b (�) K D (m) Yearly Qout (kWh)
m-Si 18.42 55 0.84 430,397
J.R. Perez-Gallardo et al. / Renewable Energy 64 (2014) 82e97 91
3.3. Evaluation of criteria
The third model of the integrated system is dedicated to theevaluation of the three criteria. For each criterion, a performanceindex was selected. These indexes will allow the evaluation andcomparison of the resulting options. Fig. 7 summarizes the differentelements required by this model.
3.3.1. Techno-economic criteriaThe technical and economic criteria chosen in this study concern
the payback time of investment and energy payback time, respec-tively. Their choice is summarized in the following.
In project evaluation and capital budgeting, the payback time(PBT) is an estimation of the time that will be necessary for aninvestor to recover the initial investment. It is used to compareinvestments that might have different initial capital requirements.It is calculated by the following expression:
PBT ¼ Cost of projectAnnual Cash Inflows
(27)
The cost of project considers all the components that make upthe installation (PV modules, cables, mounting system.), theconstruction and the edification cost as well as the cost ofconnection to grid. Annual cash flow represents the incomegenerated by selling all the energy produced.
Energy payback time (EPBT) is the time inwhich the input energyduring the PV system life-cycle (which includes the energyrequirement for manufacturing, installation, energy use duringoperation, and energy needed for decommissioning) is compen-sated by electricity generated by the PV system.
Table 2Comparison between both approaches.
K B (�) Qout (kWh)
Maximum incident energy WAP 58 24.62 2,641,034PB 58 24.62 3,201,915
Maximum output energy without energy loss WAP 58 24.62 328,048PB 58 24.62 397,793
Maximum output energy with energy loss WAP 57 21.33 268,000PB 57 21.26 327,338
A ¼ Results of Weinstock and Appelbaum (WAP). PB ¼ Results of our approach (PBmodel, Perez-Gallardo et al.).
EPBT ¼ Primary energy required for manufacturingAnnual primary energy produced
(28)
Primary energy required for manufacture is obtained as a resultof a LCA study. It is reported into the Non-renewable energy cate-gory. The yearly energy produced is converted to annual primaryenergy produced. A conversion factor of 2.58 is used to transform1 kWh electricity into primary energy [41].
3.3.2. Environmental criteriaEnvironmental assessment is performed following the meth-
odology of Life Cycle Assessment (LCA) established by ISO-14040-44. LCA is a technique that characterizes and assesses the totalenvironmental burdens associated with a product or a system, fromraw materials acquisition to end-of-life management. This methodcompares the environmental damage of different products, pro-cesses or systems together, and analyses the different stages of thelife cycle of a product. LCA provides support elements for industrialpolicies such as the choice of design and improvement of productsor the selection of a production method, and is also interesting forpublic actions. According to the norms, LCA is divided into 4 parts(Fig. 8):
� Goal and scope definition. The objectives and scope of the studyare described and a functional unit to which emissions andextractions are reported is established. The system boundariesare fixed;
� Inventory analysis. It involves creating an inventory of flows fromand to nature. Inventory flows include inputs of water, energyand rawmaterials as well as emissions to air, water and soil. Theinput and output data needed for the construction of the in-ventory are collected for all activities within the systemboundary;
Table 5PBT and EPBT for each configuration.
PV module EPBT (yr) PBT (yr)
m-Si 2.36 5.90p-Si 2.67 7.59a-Si 2.04 7.59CdTe 1.77 9.23CIS 2.14 6.29
p-Si 21.22 60 0.80 328,453a-Si 17.01 54 0.81 131,021CdTe 34.86 78 0.80 227,324CIS 19.73 56 0.88 225,536
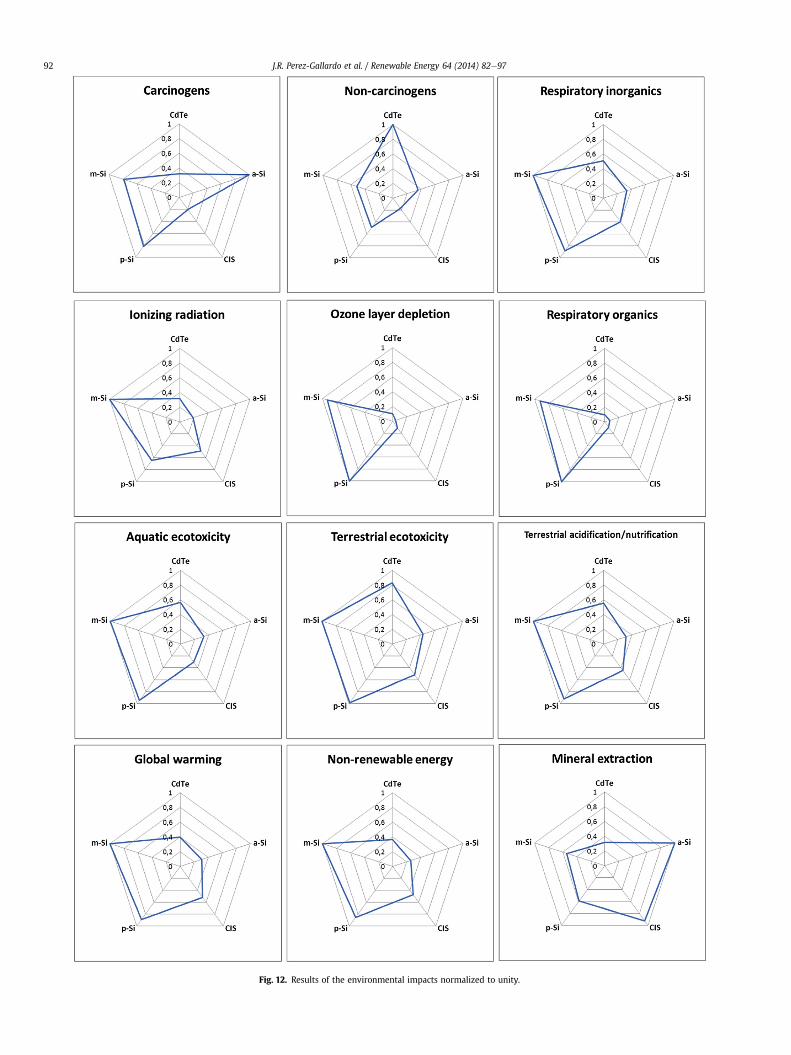
Fig. 12. Results of the environmental impacts normalized to unity.
J.R. Perez-Gallardo et al. / Renewable Energy 64 (2014) 82e9792

Table 6Final ranking of alternatives.
PV module Final weighted evaluation Ranking
CdTe 40 3a-Si 32 1CIS 36 2p-Si 58 4m-Si 58 4
J.R. Perez-Gallardo et al. / Renewable Energy 64 (2014) 82e97 93
� Impact assessment. It consists to assess the potential environ-mental impacts based on the inventory made in the previousphase;
� Interpretation of results. Based on the results of the impactassessment, it is possible to establish a set of conclusions andrecommendations for the study.
Following the guidelines indicated by the LCA methodology forenvironmental impact analysis for PVGCS, the first step is to set theboundaries of the system under analysis. Fig. 9 illustrates asimplified PVGCS with the boundaries fixed in order to apply theLCA methodology. It must be emphasized that a thorough appli-cation of an LCA methodology would require to take into accountthe recycling phase of the PV panels. Hence, this issue suffers from alack of data for all PV technologies. This explains mainly why it wasnot included in the environmental assessment and is an area thatmerits further exploration.
The software tool SimaPro 7.3 was used here for modeling thesystem under analysis and the calculation of environmental im-pacts. This program involves the Ecoinvent database that allowsdetermining the flow of materials, energy and emissions in order tomake the inventory flow list of the system. Ecoinvent has over 4000industrial process databases in different sectors such as energy,transport, building materials, chemicals, washing agents, paper &board, agriculture and waste management.
IMPACT 2002þ [42], included in SimaPro 7.3, was selected as amethod for evaluating the environmental impacts. This methodproposes a feasible implementation of a combined midpoint/damage approach linking the environmental evaluation results ofthe inventory flow list via 14 midpoint categories which can thenbe regrouped into four damage categories (Fig. 10). Midpoint/damage approach performs environmental impact assessment of aprocess at relatively early stages in the cause-effect chain (midpointcategories) and as far back as possible in the cause-effect chain(damages categories). All midpoint scores are expressed in units ofa reference substance and related to the four damage categories.
The impacts grouped into the midpoint categories of differentflows of material, energy and emission involved in themanufacturing and commissioning of the plant are obtained fromthe characterization factors determined by the method selected asfollows (eq. (29)):
SIi ¼XS
FIs;i MS (29)
where SIi represents the characterization score for the impactcategory i, FIs,i is the characterization factor for the substance S inthe impact category i, and Ms is the mass of substances from thedifferent flows.
Fig. 11 summarizes the process followed to evaluate the envi-ronmental impacts generated by a PVGCS.
3.4. Decision variables
The optimization is performed here in a mono-objective mode.The technique adopted is a genetic algorithm to facilitate itsextension to a multi-objective mode. The decision variables thatare used are the same as indicated in the mathematical model (b, D,K, H).
4. Optimization of annual energy output
The example given by Weinstock and Appelbaum [28] (referredas WAP in the following) is used to validate the relevance of theproposed approach. The maximization of annual energy generation
by the facility is the objective function. In all cases, the samegeographical position (Tel Aviv), the same type of PV module andthe available surface are considered. The same limitations as thoseused for the WAP example are used: minimum space betweencollector rows (Dmin) equal to 0.80 m, maximum collector height(Hmax) equal to 1.98 m and height of collector above the ground(Emax) equal to 1.80 m. The technology of the panel used in theWAPstudy is not mentioned explicitly but the computation is performedwith the assumption of a 12% efficiency. The GA parameters are thefollowing ones: number of generations equal to 200; crossover rateof 0.90 and mutation rate of 0.50. Table 2 shows the comparisonbetween the results obtained by our approach and the WAPexample [28].
In order to verify the relevance of our model, the same criteria asthose used in the approach proposed byWeinstock and Appelbaum[28] were used in the optimization procedure. They involverespectively the maximum solar incident energy of the fieldwithout any type of energy losses, then the maximum output en-ergy of the PVGCS at the incident irradiance only considering themodule efficiency and shading, and finally the maximum outputenergy of the PVGCS while accounting all possible energy losses.
Table 2 shows that a good agreement is obtained between bothmodels. Not surprisingly, the difference in the amount of outputpower for the three cases is mainly due to the improvement in thecomputation of irradiance received at the facility as presented inSection 3.2.1.
Optimization runs were then performed for different types ofsolar panel technology. In the simulations, only one technology isassumed per field which means that no mixed technologies areallowed. In what follows, the maximum output energy, takinginto account all possible energy losses, was considered as anobjective function. Table 3 provides information for five differentPV commercial module technologies that were tested: mono-crystalline silicon (m-Si), polycrystalline silicon (p-Si), amor-phous silicon (a-Si), cadmium telluride (CdTe) and copper indiumdiselenide (CIS).
The best configuration for maximizing the output energy of thefield was searched for in each PV module technology (Table 4). Thelocation, assumptions and constraints for the new set of optimi-zations are the same as in the previous case. The GA parameters arethe following ones: number of generations equal to 200; crossoverrate of 0.90 and mutation rate of 0.50.
The results suggest that the configuration using PV modulesbased on m-Si generates the highest amount of annual energyunder the conditions given in the case studied.
The result of the evaluation of PBT and EPBT for each configu-ration (Table 5) shows that the lowest EPBT is achieved by using PVmodules based on CdTe but this technology does not lead to thelowest PBT value. Even though the m-Si PV module generates themaximum output energy, its EPBT is high due to the amount ofenergy required during the manufacturing phase.
The results of the environmental impact assessment (12 mainmidpoint categories) for each configuration are shown in Fig. 12 bythe use of radar charts. To facilitate the comparison, normalizationwas performed by assigning the value 1 to the maximum value of

Fig. 13. Results of the environmental impacts per annual energy generated ratio normalized to unity.
J.R. Perez-Gallardo et al. / Renewable Energy 64 (2014) 82e9794

Table 7Final ranking of alternatives (environmental impact per kWh produced).
PV module Final weighted evaluation Ranking
CdTe 39 2a-Si 47 4CIS 30 1p-Si 63 5m-Si 45 3
J.R. Perez-Gallardo et al. / Renewable Energy 64 (2014) 82e97 95
each category. The computed relative impacts represent the ratiobetween the environmental impact and this maximum value.
The result analysis shows that among seven of the 12 categories,the highest impacts occur when m-Si technology is used to buildthe PV power plant e.g. in Global Warming category, where the CO2
in the air is the reference flow, the installation with PV modulesbased on m-Si, generates more kg of CO2 after the characterizationof all inventory flows. Likewise, for the Non-renewable Energycategory, the most MJ of non-renewable primary energy consumedby the entire process evaluated within the boundaries set for theLCA study was found at installations with m-Si based PV modules.In spite of its low EPBT, the solar plant with CdTe modules has asignificant impact within the category of Non-carcinogens, i.e., thecharacterization of the different flows in the inventory for CdTemodule installation results in a large amount of chloroethyleneC2H3Cl into the air, a substance that affects human health. Thepotential consequence is not related with carcinogenic effects.
To select the best compromise among the five alternativesproposed by our model relative to the set of possibilities, aweighted evaluation is performed for the 15 goals (maximizingfinal energy generation output, minimizing PBT, minimizing EPBTand minimizing 12 environmental impacts). First, a classificationfor each solar plant configuration at each goal was made giving avalue of 1 to the choice that best meets the objective and 5 theworst. The value assigned to each choice in a given goal is multi-plied by a weighting factor. This factor depends on the importanceof each of the goal for the person responsible for making the finalchoice. An equal factor was assigned to the 15 goals. Then, thescores obtained by each alternative are added to give a cumulativescore. As can be seen in Table 6, the alternativewith the lowest totalscore is the a-Si technology.
Another analysis is then performed taking into account theenergy generated by each configuration. This new analysis consistsin assessing the environmental impact per kWh produced, asfollows:
index ¼ SIiQout
(30)
The weighting factor is the same for all objectives. The resultsare presented through radar charts normalized to unity (Fig. 13). Itcan be highlighted that the PV technology with the higher ratio isthe one based on p-Si modules (7 of 12 categories). Although theenvironmental impacts of m-Si based technology are higher, theseare offset by the large amounts of energy generated annually.
The same weighted evaluation is made for this analysis and theresults are reported in Table 7. The CIS PV module technology bestmeets the objectives.
Reviewing the results obtained from the weighted evaluation inTables 6 and 7, if all criteria have the same weights, the conversionefficiency of PV module takes an important role depending on theform of the evaluation of the environmental categories. It mayserve as a mitigating circumstance to the values reported for thedifferent environmental categories. e.g. the alternative based on a-Si PV module proved to be the best trade-off for all the objectives
considered when only the results obtained from the LCA study istaken into account but it falls to fourth position if these values aredivided by the amount of energy produced. Table 7 shows that theconfiguration with m-Si has a better performance than p-Si forsilicon-based PV modules even if they have the highest impacts inalmost all environmental categories in Fig. 12. The configurationwith CIS and CdTe has the best trade-off in both cases. Further workwould now consist in encompassing PV recycling in the LCA step inorder to study if the same trend is observed.
5. Conclusions
The goal of the present work was to develop a new approach forgenerating alternative configurations of PV power plant by addingan environmental assessment to the traditional way of determiningthe optimum PV power plant configuration. An integrated frame-work based on a PVGCS sizing simulator involving the computationof solar irradiance coupled to an outer optimization loop was thusdesigned and tested.
Our approach was applied to themaximization of annual energygeneration by the facility as the objective function. The analysis wascarried out for different types of solar panel technology, with onlyone technology assumed per field: monocrystalline silicon (m-Si),polycrystalline silicon (p-Si), amorphous silicon (a-Si), cadmiumtelluride (CdTe) and copper indium diselenide (CIS). The environ-mental impact assessment was achieved by use of the IMPACT2002þ method embedded in the SimaPro software tool withEcoinvent database. The 12 main midpoint impact categories werecomputed for each configuration as well as PBTand EPBT. The resultanalysis shows that among seven of the 12 environmental cate-gories, the highest impacts occur when m-Si and p-Si technologiesare used. Despite a low EPBT value, CdTe modules have a significantimpact within the category of Non-carcinogens.
To select the best compromise among the five options proposedby our model, a weighted evaluation was then performed on allcriteria in order to obtain a score for each technology. The alter-native with the lowest total score was the a-Si technology. A similaranalysis was then performed by taking into account the environ-mental impacts per kWh produced as new criteria. In this case, theCIS PV module technology best meets the objectives.
Finally, this investigation highlighted that the early design stageof PVGCS should take into account not only economic performancebut also the environmental impacts as those proposed in LCAmethodology. The proposed framework is now extended to themulti-objective optimization case by considering simultaneouslythe conflicting criteria. For this purpose, the selection of GAs willfacilitate an easy extension to a multi-criteria investigation, asalready carried out in previous investigations [32]. Another sug-gestion is to extend the system boundaries to consider the recyclingphase of the module.
Nomenclature
A PV module area, m2
D distance between collector rows, mDmin minimum distance between collector rows, mE equation of time, minEmax maximum collector height above ground, mFIs,i characterization factorGo extraterrestrial irradiance, W/m2
Gon normal extraterrestrial irradiance, W/m2
G global irradiance, W/m2
Gb beam irradiance, W/m2
Gd diffuse irradiance, W/m2
Gb global irradiance onto PV module tilted, W/m2

J.R. Perez-Gallardo et al. / Renewable Energy 64 (2014) 82e9796
Gb,b beam irradiance onto PV module tilted, W/m2
Gb,d diffuse irradiance onto PV module tilted, W/m2
Gb,r reflected irradiance onto PV module tilted, W/m2
H collector height, mHm PV module height, mHmax maximum collector height, mI global irradiation for an hour, Wh/m2
K number of solar collector rowsL solar field length, mLc collector length, mLm PV module length, mLonLoc longitude of the locationLST local solar timeLSTM local standard time meridianMj,k,t,n status matrix of unshaded modules in a collectorMs mass of substance from the energy, material or emission
flown day number; 1e365Nc number of PV modules columns in the collectorNc,max maximum number of PV modules columns in the
collectorNc min minimumnumber of PVmodules columns in the collectorNr number of PV modules rows in the collectorNr max maximum number of PV modules rows in the collectorPi max inverter maximum power, WPm max PV module’s maximum output power at MPP, WQm PV module’s output energy, kWhQout yearly output energy of the field, kWhSIi characterization score for the impact categoryST solar timet hour number, 1e24Tk temperature coefficient for nominal power, %/�CTm PV module temperature, �CVi max maximum voltage level of the AC/DC converter, VVi min minimum voltage level of the AC/DC converter, VVm mpp voltage at the PV module’s maximum power point, VVm oc PV module’s open circuit voltage, VW solar field width, mZþ positive natural number seta sun elevation angle, degreeb collector inclination angle, degreef latitude, degree
References
[1] EPIA. Global market outlook for photovoltaics until 2016; 2012. Brussels,Belgium.
[2] EPIA. Solar photovoltaic on the road to large scale grid integration; 2012.Brussels, Belgium.
[3] García-Valverde R, Miguel C, Martínez-Béjar R, Urbina a. Life cycle assessmentstudy of a 4.2 kWp stand-alone photovoltaic system. Sol Energy Sep.2009;83(9):1434e45.
[4] McDonald NC, Pearce JM. Producer responsibility and recycling solar photo-voltaic modules. Energy Policy Nov. 2010;38(11):7041e7.
[5] Notton G, Lazarov V, Stoyanov L. Optimal sizing of a grid-connected PV systemfor various PV module technologies and inclinations, inverter efficiencycharacteristics and locations. Renew Energy Feb. 2010;35(2):541e54.
[6] Mondol JD, Yohanis YG, Norton B. Optimal sizing of array and inverter forgrid-connected photovoltaic systems. Sol Energy Dec. 2006;80(12):1517e39.
[7] Mondol JD, Yohanis YG, Norton B. The impact of array inclination and orien-tation on the performance of a grid-connected photovoltaic system. RenewEnergy Jan. 2007;32(1):118e40.
[8] Pacca S, Sivaraman D, Keoleian GA. Parameters affecting the life cycle per-formance of PV technologies and systems. Energy Policy Jun. 2007;35(6):3316e26.
[9] Weinstock D, Appelbaum J. Optimization of economic solar field design ofstationary thermal collectors. J Sol Energy Eng 2007;129(4):363.
[10] Oliver M, Jackson T. The evolution of economic and environmental cost forcrystalline silicon photovoltaics. Energy Policy Nov. 2000;28(14):1011e21.
[11] Senjyu T, Hayashi D, Yona A, Urasaki N, Funabashi T. Optimal configuration ofpower generating systems in isolated island with renewable energy. RenewEnergy Sep. 2007;32(11):1917e33.
[12] Kornelakis A, Koutroulis E. Methodology for the design optimisation and theeconomic analysis of grid-connected photovoltaic systems. IET Renew PowerGener 2009;3(4):476.
[13] Weinstock D, Appelbaum J. Optimal solar field design of stationary collectors.J Sol Energy Eng 2004;126(3):898.
[14] Kaushika ND, Rai AK. Solar PV design aid expert system. Sol Energy Mater SolCells Nov. 2006;90(17):2829e45.
[15] Mondol JD, Yohanis YG, Norton B. Optimising the economic viability of grid-connected photovoltaic systems. Appl Energy Jul. 2009;86(7e8):985e99.
[16] Fthenakis VM, Kim HC. Photovoltaics: life-cycle analyses. Sol Energy Aug.2011;85(8):1609e28.
[17] Dones R, Frischknecht R. Life-cycle assessment of photovoltaic systems: re-sults of Swiss studies on energy chains. Prog Photovolt Res Appl December1997;125:117e25. 1998.
[18] Ito M, Komoto K, Kurokawa K. Life-cycle analyses of very-large scale PVsystems using six types of PV modules. Curr Appl Phys Mar. 2010;10(2):S271e3.
[19] Kannan R, Leong KC, Osman R, Ho HK, Tso CP. Life cycle assessment study ofsolar PV systems: an example of a 2.7 kWp distributed solar PV system inSingapore. Sol Energy May 2006;80(5):555e63.
[20] Pacca S, Sivaraman D, Keoleian GA. Life cycle assessment of the 33 kWPhotovoltaic system on the Dana building at the University of Michigan.Michigan, USA; 2006.
[21] Fthenakis VM, Kim HC, Alsema E. Emissions from photovoltaic life cycles.Environ Sci Technol Mar. 2008;42(6):2168e74.
[22] de Wild-Scholten MJ, Alsema E. Towards cleaner solar PV; 2004. p. 46e9.Refocus, no. October.
[23] Noorian AM, Moradi I, Kamali GA. Evaluation of 12 models to estimatehourly diffuse irradiation on inclined surfaces. Renew Energy Jun. 2008;33(6):1406e12.
[24] Demain C, Journée M, Bertrand C. Evaluation of different models to estimatethe global solar radiation on inclined surfaces. Renew Energy Feb. 2013;50:710e21.
[25] Duffie JA, Beckman WA. Solar engineering of thermal process. 3rd ed. USA:John Wiley & Son; 2006. p. 1e893.
[26] Mellit A, Kalogirou SA, Hontoria L, Shaari S. Artificial intelligence techniquesfor sizing photovoltaic systems: a review. Renew Sustain Energy Rev Feb.2009;13(2):406e19.
[27] Gong X, Kulkarni M. Design optimization of a large scale rooftop photovoltaicsystem. Sol Energy Mar. 2005;78(3):362e74.
[28] Weinstock D, Appelbaum J. Optimization of solar photovoltaic fields. J SolEnergy Eng 2009;131(3):031003.
[29] Mellit A, Benghanem M. Sizing of stand-alone photovoltaic systems usingneural network adaptive model. Desalination Apr. 2007;209(1e3):64e72.
[30] Kornelakis A, Marinakis Y. Contribution for optimal sizing of grid-connectedPV-systems using PSO. Renew Energy Jun. 2010;35(6):1333e41.
[31] Ito M, Kato K, Komoto K, Kichimi T, Kurokawa K. A comparative study on costand life-cycle analysis for 100 MW Very large-scale PV (VLS-PV) system inDeserts Usinf m-Si, a-Si, CdTe, and CIS module. Prog Photovolt Res Appl May2007;16:17e30. 2008.
[32] Gomez A, Pibouleau L, Azzaro-Pantel C, Domenech S, Latgé C, Haubensack D.Multiobjective genetic algorithm strategies for electricity production fromgeneration IV nuclear technology. Energy Convers Manag Apr. 2010;51(4):859e71.
[33] Lorenzo E. Energy collected and delivered by PV modules. In: Luque A,Hegedus S, editors. Handbook of photovoltaic science and engineering. 1st ed.John Wiley & Son; 2003. p. 905e70.
[34] U. of G. Institute of Sciences of the Environmental. “PVSyst.” PVSyst SA.Geneva; 2011.
[35] National Renewable Energy Laboratory. SOLPOS. National Renewable EnergyLaboratory; 2000.
[36] Reda I, Andreas A. Solar position algorithm for solar radiation applications;2008.
[37] National Renewable Energy Laboratory, MIDC solar and Lunar position Cal-culators, [Online]. Available: http://www.nrel.gov/midc/solpos/. [accessed05.07.13].
[38] Mermoud A. Note sur le comparatif de programmes de simulation PV dePHOTON. Geneva, Switzerland; 2011.
[39] Ziar H, Mansourpour S, Salimi A, Afjei E. Analysis of shadow effect in photo-voltaic array using binary coding method. In: 2nd international conference onelectric power and energy conversion systems (EPECS) 2011. p. 1e6.
[40] Weinstock D, Appelbaum J. Shadow variation on photovoltaic collectors in asolar field. In: IEEE, vol. 1; 2004. p. 4e7.
[41] A. de l’Environnement et de la M. de l’Energie ADEME, Glossaire. [Online].Available: http://www2.ademe.fr/servlet/KBaseShow?sort¼-1&cid¼96&m¼3&catid¼12843&p1¼5&p2¼12564. [accessed 31.01.13].
[42] Jolliet O, Margni M, Charles R, Humbert S, Payet J, Rebitzer G. Presenting a newmethod IMPACT 2002þ: a new life cycle impact assessment methodology, vol.8 (6); 2003. p. 324e30.
[43] SunPower Corporation. E20/327 solar panel. Data sheet [Online]. Available:http://us.sunpowercorp.com/homes/products-services/solar-panels/e-series/;2012 [accessed 04.01.12].

J.R. Perez-Gallardo et al. / Renewable Energy 64 (2014) 82e97 97
[44] SHARP. ND-F4Q300. Data sheet [Online]. Available: http://www.sharpusa.com/SolarElectricity/SolarProducts/CommercialSolarProducts.aspx; 2012[accessed 04.01.12].
[45] SCHOTT. SCHOTT PROTECT� ASI 100e107. Data sheet [Online]. Available:http://www.schott.com/photovoltaic/english/schott-protect-asi.html; 2012[accessed 04.01.12].
[46] GE Energy. GE-CdTe83. Data sheet [Online]. Available: http://www.enfsolar.com/pv/panel-datasheet/Thin-film/38; 2012 [accessed 04.01.12].
[47] GE Energy. CIGS thin film solar module 145 W, 150 W. Data sheet [Online].Available: http://www.ge-energy.com/products_and_services/products/solar_power/cigs_thin_film_145.jsp; 2012 [accessed 04.01.12].
![Lasserre Hierarchy, Higher Eigenvalues, and Approximation … · 2011-05-19 · arXiv:1104.4746v3 [cs.CC] 18 May 2011 Lasserre Hierarchy, Higher Eigenvalues, and Approximation Schemes](https://img.dokumen.tips/doc/110x75/5fa6d75f50cc700e6652ae13/lasserre-hierarchy-higher-eigenvalues-and-approximation-2011-05-19-arxiv11044746v3.jpg)