Embed Size (px)
Citation preview

2014 Holiday Shopping RecapAdobe Digital Index

ADOBE DIGITAL INDEX
ADOBE DIGITAL INDEX | 2014 Holiday Shopping Recap
Methodology• Data from Adobe Marketing Cloud: Adobe Analytics,
Adobe Mobile Services, Adobe Media Optimizer, and Adobe Social
• Based on analysis of aggregated and anonymous data • More than 18 billion visits to 4,500 retail websites during
November and December• Over $7.00 out of $10.00 spent online with top 500
retailers is measured by Adobe Marketing Cloud• Separate findings from surveys of 400+ U.S. consumers,
and digital marketers
2

ADOBE DIGITAL INDEX
ADOBE DIGITAL INDEX | 2014 Holiday Shopping Recap
US: Online ShoppingAdobe Digital Index
ADOBE DIGITAL INDEX
ADOBE DIGITAL INDEX | 2014 Holiday Shopping Recap
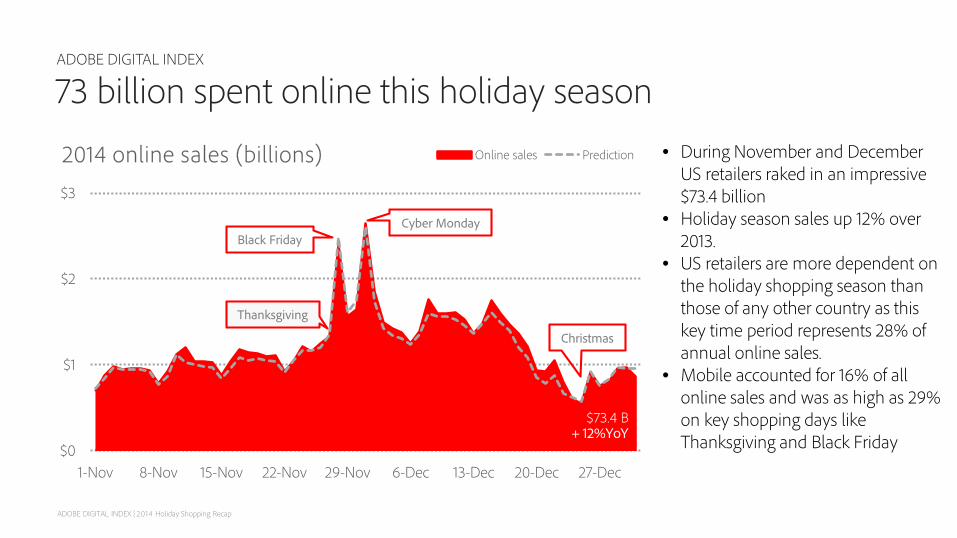
73 billion spent online this holiday season • During November and December
US retailers raked in an impressive $73.4 billion
• Holiday season sales up 12% over 2013.
• US retailers are more dependent on the holiday shopping season than those of any other country as this key time period represents 28% of annual online sales.
• Mobile accounted for 16% of all online sales and was as high as 29% on key shopping days like Thanksgiving and Black Friday$0
$1
$2
$3
1-Nov 8-Nov 15-Nov 22-Nov 29-Nov 6-Dec 13-Dec 20-Dec 27-Dec
2014 online sales (billions) Online sales Prediction
Thanksgiving
Black FridayCyber Monday
Christmas
$73.4 B+ 12%YoY
ADOBE DIGITAL INDEX
ADOBE DIGITAL INDEX | 2014 Holiday Shopping Recap
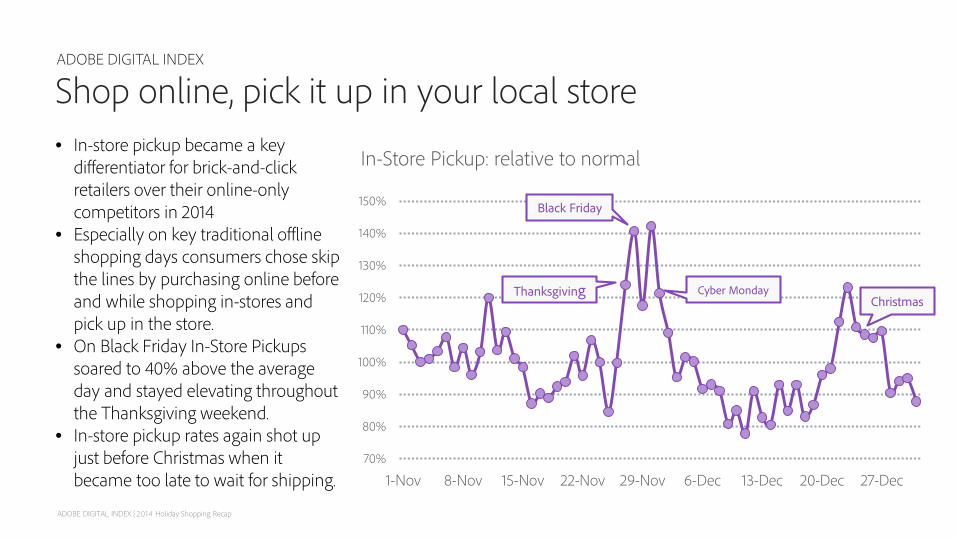
Shop online, pick it up in your local store• In-store pickup became a key
differentiator for brick-and-click retailers over their online-only competitors in 2014
• Especially on key traditional offline shopping days consumers chose skip the lines by purchasing online before and while shopping in-stores and pick up in the store.
• On Black Friday In-Store Pickups soared to 40% above the average day and stayed elevating throughout the Thanksgiving weekend.
• In-store pickup rates again shot up just before Christmas when it became too late to wait for shipping.
70%
80%
90%
100%
110%
120%
130%
140%
150%
1-Nov 8-Nov 15-Nov 22-Nov 29-Nov 6-Dec 13-Dec 20-Dec 27-Dec
In-Store Pickup: relative to normal
Thanksgiving
Black Friday
Cyber MondayChristmas

ADOBE DIGITAL INDEX
ADOBE DIGITAL INDEX | 2014 Holiday Shopping Recap
Geo-Based Personalization: Consumer Sentiment• 34% report receiving a marketing promotion
based on their location (another 21% unsure);
• Open to Beacons? 55% feel it would be useful to receive marketing promotions on their mobile device while in a physical store
• 71% like having ads personalized, but opinions differ about quality of today’s personalization efforts:• 20% like it, but say that such ads are “not done well
enough today” • 30% like it and feel that today’s efforts are “as tailored to
me as they need to be” • 20% feel today’s personalization efforts are too intrusive• 29% don’t think ads should be personalized at all
6

ADOBE DIGITAL INDEX
ADOBE DIGITAL INDEX | 2014 Holiday Shopping Recap
• The use of location technologies to personalize mobile experiences is expanding via both GPS location data and iBeacons. • For GPS location, 49% are already using device
position to deliver location-aware content. • In addition, majority of expert mobile marketers,
56.5%, use GPS in comparison to only 36.6 % of less-experienced marketers.
• But the newbies are catching up; 48.8 percent plan to add it in the next 12 months.
• In the case of iBeacons, sports media companies like Major League Baseball have already deployed beacons in their stadiums to “push” relevant content to fans. Furthermore, companies like Safeway, American Airlines and Marriott have announced the deployment of beacons at retail stores, airports and hotels to drive a location-aware experience for customers.
Location Aware Content Request GPS Location Data
Use Beacon Technology
7

ADOBE DIGITAL INDEX
ADOBE DIGITAL INDEX | 2014 Holiday Shopping Recap
Digital Wallets • 35% of consumers report that their mobile phone allows
them to make payments at a physical store; of these people, 47% report having used their mobile phone to make such a payment
• Consumers, weary of entering credit card information on mobile devices, rely more on alternative payment methods like PayPal, Amazon Payments, Google Wallet to make purchases online.• 23% of purchases on smartphones• 19% of purchases on tablets• 16% of purchases on desktops
• Apple Pay will soon become the default alternative payment tool for many consumers. Enabling easy transactions both off and online.
• Mobile conversion rates expected to increase as digital wallets become ever more commonplace for online shopping.
0%
5%
10%
15%
20%
25%
Mobile Phone Tablet Desktop
Share of online sales via digital wallet payments
8

ADOBE DIGITAL INDEX
ADOBE DIGITAL INDEX | 2014 Holiday Shopping Recap
Growth by Retailer Category2014 Winners and Losers• Specialty, General Merchandise, and Apparel retailers faired the best YoY• Jewelry, Food & Drug, Health & Beauty sold less online in 2014 than 2013When do people shop?• Toy and General Merchandise retailers saw high sales levels on Thanksgiving• Most other categories didn’t see major spikes until Black Friday and Cyber Monday.
9

ADOBE DIGITAL INDEX
ADOBE DIGITAL INDEX | 2014 Holiday Shopping Recap
Price Level and Product Availability• Online prices hit rock bottom on
Thanksgiving Day at an average discount of 25.2%
• Online Sales started on Monday before Thanksgiving as prices fell by more than 5% in two days.
• During Thanksgiving week the average item was discounted more than 20%.
• Prices began to increases dramatically after Black Friday and remained elevated during the rest of December.
• Out-of-stock messages increased 5-fold to peak Cyber Monday due to increased demand and limited supply
-30%
-25%
-20%
-15%
-10%
1-Nov 8-Nov 15-Nov 22-Nov 29-Nov 6-Dec 13-Dec 20-Dec 27-Dec
2014 average discount: online prices by day Average discount Prediction
Thanksgiving Black Friday
Cyber Monday
70%
90%
110%
130%
Out-of-stock product views per visit
Thanksgiving
Black Friday Cyber Monday
10

ADOBE DIGITAL INDEX
ADOBE DIGITAL INDEX | 2014 Holiday Shopping Recap
New Sales RecordsRecord Sales growth on Thanksgiving Day
• $1.33 Billion • 25% YoY growth
Black Friday barely lags behind Cyber Monday• $2.40 Billion• 24% YoY growth
Cyber Monday continued to drive top dollar• $2.65 Billion• 16% YoY growth
+25%
+24% +16%
$0.0
$1.0
$2.0
$3.0
Thanksgiving Black Friday Cyber Monday
Online sales growth (billions) 2013 2014
0%
10%
20%
30%
40%
50%
$-
$1
$2
$3
2009 2010 2011 2012 2013 2014
Cyber Monday growth of online sales (billions)
Online Sales YoY Growth

ADOBE DIGITAL INDEX
ADOBE DIGITAL INDEX | 2014 Holiday Shopping Recap
13% 12% 9%
16% 14%12%
Thanksgiving Black Friday Cyber Monday
Mobile share of salesTabletSmartphone
Mobile Continues to Move Sales OnlineThe iPad was the online shopping device of choice for consumers in 2014• Mobile accounted for 16% of all online sales and
was as high as 29% on key shopping days like Thanksgiving and Black Friday
• 48% of mobile sales came from consumers using iPads to shop online
• iOS represented nearly three-quarters of all mobile sales.
Smartphones aren’t just for browsing anymore.• Large screen phones led smartphones to account
for nearly half of all mobile ecommerce, up from a third last year.
• Tablets still drove the majority of mobile sales on Thanksgiving, Black Friday and Cyber Monday with 13%, 12%, and 9% of total sales.
iPad, 48%
iPhone, 27%
Android Tablet, 6%
Android Phone, 17%
Other Mobile, 2%
iPad iPhone Android Tablet Android Phone Other Mobile12

ADOBE DIGITAL INDEX
ADOBE DIGITAL INDEX | 2014 Holiday Shopping Recap
Retail Facebook trendsPosts:• In retail, up 74% year-over-year in November• Up 64% year-over-year in December
Paid Impressions: • In retail, up 13% year-over-year in December • Up 20% year-over-year in November
13

ADOBE DIGITAL INDEX
ADOBE DIGITAL INDEX | 2014 Holiday Shopping Recap
Top Gifts according to Social Media Buzz Top Gifts • Mobile Phones: iPhone 6/6+ • Wearable Devices: Fitbit• 4K TVs: Sony and Samsung• OTT Devices: Roku• Video Games: “Call of Duty”• Game Consoles: PS4 tops Xbox One
Toys: • Guardians of the Galaxy Toys• My Little Pony• Transformer Toys• Legos• Teenage Mutant Ninja Turtles
Top buzzed about gifts
Top children’s gifts
14

ADOBE DIGITAL INDEX
ADOBE DIGITAL INDEX | 2014 Holiday Shopping Recap
International: Online ShoppingAdobe Digital Index

ADOBE DIGITAL INDEX
ADOBE DIGITAL INDEX | 2014 Holiday Shopping Recap
Online sales and spend per personUS Cyber Monday sales exceeded the largest shopping day in Japan, Germany, France and the UK combined
• Mobile spending alone in the US will surpassed most other countries total online sales
• China’s Singles Day (Bachelor’s Day), which appropriately falls on 11/11 every year, rivals Cyber Day as the largest online shopping day world-wide
The Average U.S. consumer will spent $8 online on Cyber Monday
• The Swedes, Swiss, and Fins spent $12+ per person.
• The large economies of China, Brazil, and Russia all ranked near the bottom of the list in spend per person.
$- $500
$1,000 $1,500 $2,000 $2,500 $3,000
Uni
ted
Stat
esCh
ina
Uni
ted
King
dom
Japa
nG
erm
any
Fran
ceBr
azil
Cana
daAu
stra
liaSp
ain
Italy
Russ
iaN
ethe
rland
sPo
land
Switz
erla
ndSw
eden
Aust
riaBe
lgiu
mFi
nlan
dD
enm
ark
Nor
way
Irela
ndH
ong
Kong
New
Zea
land
Port
ugal
Sing
apor
eTh
aila
nd
Online Spend on Largest Online Shopping Day (Millions)
$0$2$4$6$8
$10$12
Switz
erla
ndFi
nlan
dU
nite
d St
ates
Uni
ted
King
dom
Swed
enAu
stria
Den
mar
kIre
land
Nor
way
Net
herla
nds
Aust
ralia
Cana
daFr
ance
Ger
man
yBe
lgiu
mN
ew Z
eala
ndJa
pan
Sing
apor
eH
ong
Kong
Spai
nPo
land
Italy
Port
ugal
Chin
aBr
azil
Russ
iaTh
aila
nd
Spend per Person on Largest Online Shopping Day
16

ADOBE DIGITAL INDEX
ADOBE DIGITAL INDEX | 2014 Holiday Shopping Recap
Growth by CountryUS, Austrian and Brazilian retailers brought in the largest share of annual online sales during the holiday period.
Online sales growing fastest in Ireland China, Russia, Brazil, and Thailand.
• All five countries saw holiday sales grow by more than 20% over last year.
• Average growth was closer to 10% year-over-year.
• Offline sales are growing at 2-4% in most countries.
13%15%
16%16%16%16%
17%17%17%17%
18%19%19%19%19%19%
20%20%20%20%
21%22%
23%23%
25%26%
28%
PolandAustralia
New ZealandSingapore
Hong KongChina
NetherlandsFinland
JapanIreland
ThailandPortugal
FranceSpain
GermanyBelgium
DenmarkSwedenCanada
ItalyUnited Kingdom
SwitzerlandNorway
RussiaBrazil
AustriaUnited States
Holiday Season Share of Annual Online Sales
34%30%
29%29%
28%27%
18%17%16%16%16%
15%15%14%
13%12%12%
11%11%
9%9%9%8%
7%4%
0%-4%
IrelandRussiaBrazil
ThailandChina
PolandHong Kong
ItalySwitzerland
BelgiumUnited Kingdom
SingaporeAustria
CanadaAustralia
GermanyUnited States
JapanSweden
FranceSpain
FinlandNetherlands
DenmarkPortugal
New ZealandNorway
Holiday Season YoY Growth
17

ADOBE DIGITAL INDEX
ADOBE DIGITAL INDEX | 2014 Holiday Shopping Recap
Mobile Share of SalesThe most mobile friendly (phones and tablets) shoppers in the world can be found the countries of North-west Europe: UK, Ireland, Norway, Swedish and Denmark.
But shoppers in Asia including Japan, Hong Kong, Thailand, and Malaysia are the most likely to pull our their phones rather than a tablet to shop online.
0%
5%
10%
15%
20%
25%
Uni
ted
King
dom
Irela
ndJa
pan
Nor
way
Aust
ralia
Swed
enD
enm
ark
Spai
nU
nite
d St
ates
Sing
apor
eN
ethe
rland
sH
ong
Kong
Thai
land
Cana
daIta
lySw
itzer
land
New
Zea
land
Ger
man
yFi
nlan
dFr
ance
Aust
riaRu
ssia
Mal
aysia
Belg
ium
Braz
ilCh
ina
Pola
nd
Phone Tablet
18

ADOBE DIGITAL INDEX
ADOBE DIGITAL INDEX | 2014 Holiday Shopping Recap
Product Price Variation - International ComparisonThe biggest discounts of the season were found in the UK on Boxing Day, followed by the 11th of December in Germany and Thanksgiving for the US.
In UK and Germany prices fall gradually throughout the holiday season and hit their lowest point in December.
US prices are lower throughout November, but stay relatively high during December when many consumer expect lower prices due to inventory blow-outs.
-30%
-25%
-20%
-15%
-10%
1-Nov 8-Nov 15-Nov 22-Nov 29-Nov 6-Dec 13-Dec 20-Dec 27-Dec
2014 average discount: online prices by dayUnited StatesGermanyUnited Kingdom
Thanksgiving
Dec 11th Boxing Day
19