Embed Size (px)
Citation preview

2014 Cost of Potato Production for Idaho With Comparisons to 2013 Author: Paul E. Patterson, Extension Ag Economist, [email protected]
Report submitted to:
The Cost of Potato Production Advisory Committee
and the Idaho Potato Commission R & E Committee
November 15, 2014
Agricultural Economics Extension Series No. 14-03 November 2014
Department of Agricultural Economics and Rural Sociology

© Department of Agricultural Economics and Rural Sociology Author: Paul E. Patterson, Extension Ag Economist, [email protected] Acknowledgments: This project is funded in part by the Idaho Potato Commission, IPC Project No. 8742, UI Project No. BDK802, Cost of Potato Production. Copies of the earlier report plus earlier reports can be found at http://web.cals.uidaho.edu/IdahoAgBiz Click Publications and scroll down to Potato Bulletins and Reports

ii
Table of Contents Idaho Potato Production Costs Project: Goal and Objectives Page 1 Cost of Production Background 1 2014 Crop Input Costs 2 Potato Cost of Production Overview 3-6 Farm Size and Potato Acreage Input Costs Potato Yields Fumigation Yield and Cost Dilemma 6-7 Unresolved Yield Issue: Field-Run vs. Paid Yield 8 2014 Cost of Potato Production Overview and Comparison 8-9 Cost of Production Summaries and Comparisons by Region Adjustments for 2014 9-10 Table 1. Idaho potato costs and returns estimates by region for 2014 11
Table 2. Model farm size and potato acreage assumptions by region 11
Table 3Interest rates, labor charges and power rates used in costs and returns 12 Estimates: 2011 – 2014 and percentage changes
Table 4. Current and historical fuel, and water assessment prices: 2011 - 2014
4-a Southwestern Idaho 12 4-b Southcentral Idaho 13 4-c Eastern Idaho 13
Table 5. Current and historical fertilizer component prices for southern Idaho: 13 2011 – 2014 and percentage change from 2013 to 2014 Table 6. Potato yields by region for published and unpublished University of Idaho 14 costs and returns estimates, both with and without fumigation
Table 7. Historical potato yields published by USDA-NASS for 2009 – 2013 and 14 Historical 3-year averages.
Table 8. Historical potato yields reported by USDA-NASS for primary commercial 15 potato counties of eastern Idaho and historical 3-year averages. Table 9. Fumigation yield adjustment and estimated fumigation percentages by region 15

iii
Table 10. Change in per acre cost of production by major cost category from 2013 16 to 2014 by region
Table 11. Cost of productionper acre for Russet Burbank potatoes by region from. 17 2013 to 2014 and change in costs between these years.
Table 12. Cost of production per hundredweight for irrigated Russet Burbank potatoes 18
By region for 2013 and 2014 and change in costs between these years
Appendices
Appendix A Southwestern Idaho Irrigated Russet Burbank Potato 19-22 Table A-1. 2014 Costs to grow, harvest, and sort southwestern Idaho irrigated 20-21 Russet Burbank potatoes with fumigation.. Comparison with 2013.
Table A-2. 2014 Cost per hundredweight to grow, harvest and store southwestern 22
Idaho irrigated Russet Burbank potato based on both field-run and paid yield, Storage operating costs by month from Octoaber to June
Appendix B Southcentral Idaho Irrigated Russet Burbank Potato 23-26 Table B-1. 2014 Costs to grow, harvest, and sort southcentral Idaho irrigated 24-25 Russet Burbank potatoes, no fumigation. Comparison with 2013.
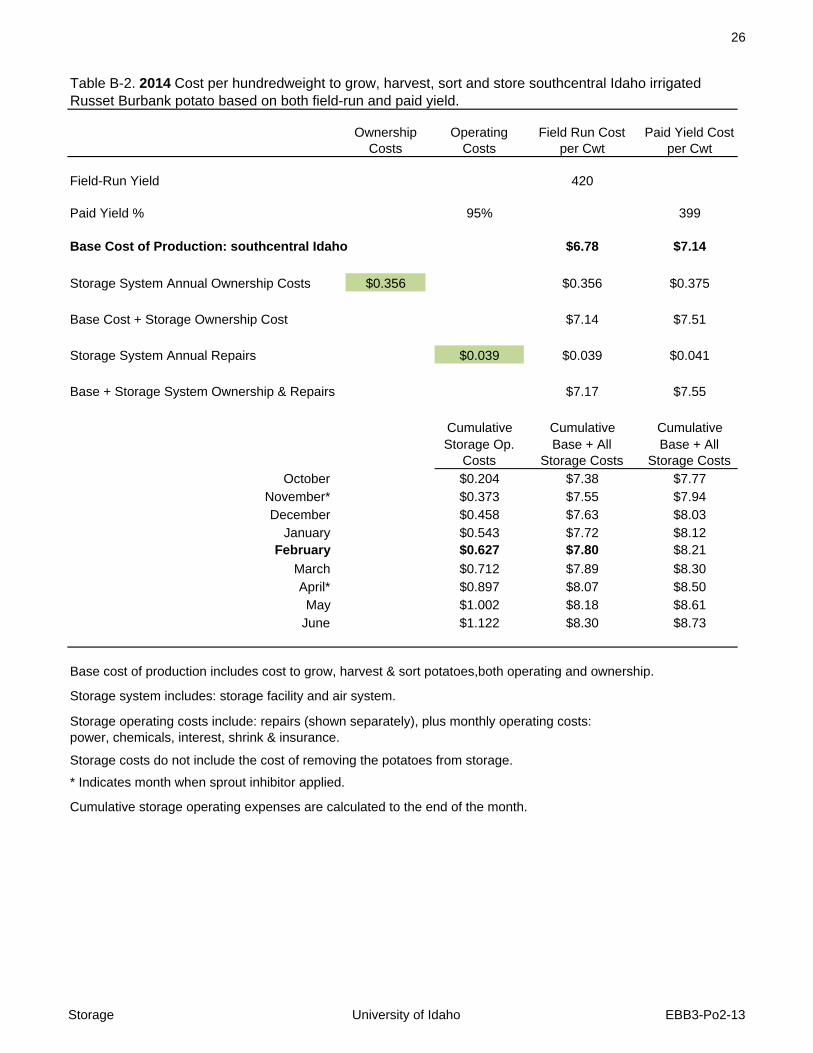
Table B-2. 2014 Cost per hundredweight to grow, harvest and store southcentral 26
Idaho irrigated Russet Burbank potato based on both field-run and paid yield, Storage operating costs by month from October to June
Appendix C Eastern Idaho Irrigated Russet Burbank Potato 27-30 Table C-1. 2014 Costs to grow, harvest, and sort eastern Idaho irrigated 28-29 Russet Burbank potatoes. Comparison with 2013.
Table C-2. 2014 Cost per hundredweight to grow, harvest and store eastern Idaho 30
irrigated Russet Burbank potato based on both field-run and paid yield, Storage operating costs by month from October to June

pcop-14.doc University of Idaho October 31, 2014
1Cost of Potato Production in Idaho
The overall goal of this project is to provide the Idaho potato industry with an unbiased and consistently
calculated estimate of the cost of producing potatoes in three regions of Idaho and to track the change in
production costs per acre and per hundredweight over time.
The following objectives are designed to meet the project goal:
1. To collect data from input suppliers, machinery and equipment dealers, and growers as appropriate. 2. To revise and update existing potato costs and returns estimates to reflect current input costs and
production practices. 3. To develop cost of production estimates for new varieties and/or new or proposed production
systems as needed or as requested. 4. To calculate changes in production costs per acre and per hundredweight and include both the
detailed and summary cost changes in an annual report. 5. To make the annual report available to the Idaho potato industry and to present the information as
requested. 6. To maintain a Cost of Production Advisory Committee representing the different segments of the
Idaho potato industry and to meet with this group to review the CAR estimates and to obtain input on proposed revisions.
I would like to acknowledge the cooperation and support that I receive from all segments of the Idaho
potato industry, including growers, processors, equipment dealers, and input suppliers. I would also like
to thank the Idaho Potato Commission for the funding I receive to support this project, IPC Project
Number 8742, UI Project number BDK802. This project has been funded 21 of the past 23 years.
Cost of Production Background The University of Idaho Department of Agricultural Economics and Rural Sociology (AERS) develops
and publishes crop costs and returns (CAR) estimates – also referred to as enterprise budgets or cost of
production estimates -- for many of the major crops grown in Idaho. CAR estimates are revised and
published every other year in odd-numbered years, typically in the early winter. Crop CAR estimates
have historically been developed for four geographic regions of the state: northern Idaho, southwestern
Idaho, southcentral Idaho, and eastern Idaho. Enterprise budgets are tied to region-specific production
management systems that reflect climate and soil conditions as well as current cultural practices.
Production practices depicted in the University of Idaho CAR estimates are typical or representative for
that crop and region, recognizing that there is a wide range in production practices among growers, or
pcop-14.doc University of Idaho October 31, 2014
2even between fields on the same farm. Because of data collection limitations relating to sample size,
these costs of production estimates do not represent a regional average or state average.
Information used in developing production practices modeled in the CAR estimates comes from a variety
of sources, including: information from individual growers, information from grower panels, industry
fieldmen, as well as University of Idaho county Extension educators and production specialists. Both crop
and livestock CAR estimates are available from the Internet at the following URL:
http://web.cals.uidaho.edu/idahoagbiz/ Click on Cost of Production
The crop and livestock enterprise budgets and the annual input cost summary are located here. A database
search routine has replaced the old listing of crop budgets by region. Simply fill in one or more of the
search items (Year, Region, Commodity and Format) and then click Search. Copies of this report and
earlier reports on changes in potato production costs in Idaho can be found at the same web address. Click
on Publications and then scroll down to the Potato Bulletins and Reports section.
2014 Crop Input Costs Prices used to value inputs in the 2014 potato CAR estimates came from data collected from input
suppliers by the University of Idaho. This information is published in the Agricultural Economics
Extension Series. The Idaho Crop Input Price Summary for 2014 is available at the Idaho AgBiz website
shown above, simply select the year and click on Search.
Data were collected between February and October. Sources included irrigation districts and canal
companies, agricultural lenders, crop insurance companies, trucking companies, aerial and other custom
applicators, fuel suppliers, and chemical and fertilizer dealers. Information on seed potato prices and the
cost to cut and treat potato seed was taken from a survey of Idaho seed potato growers and commercial
growers. A charge for handling and transportation is added to the FOB seed farm-based seed potato prices
to derive a seed potato cost for each region.
Machinery and equipment prices were obtained from a survey of dealers conducted between August and
December of 2010, and published in 2011 as PNW 346: The Cost of Owning and Operating Farm
Machinery in the Pacific Northwest: 2011. These prices were increased by approximately 16% based on
the annual change in USDA’s Prices Paid Machinery Index from 2010 to 2013. Irrigation equipment
prices and costs were based on Extension Bulletin 788, Economics of Sprinkler Irrigation Systems:
handline, solid set & wheelline, and Extension Bulletin 787, Economics of Low-Pressure Sprinkler
Irrigation Systems: center pivot and linear move. Irrigation system costs were also adjusted using the
USDA Prices Paid Machinery Index.

pcop-14.doc University of Idaho October 31, 2014
3Potato Cost of Production Overview
Cost of production estimates are influenced by assumptions made in depicting a representative or typical
farm. Farm size and acreage planted to different crops will influence costs, particularly machinery
ownership costs. It is important to recognize this when making comparisons between regions where
assumptions differ or within a region over time as the underlying assumptions change. The University of
Idaho currently publishes seven potato CAR estimates. Six CAR estimates are for commercial potato
production and one is for seed production. Prior to 2013, there was a separate non-storage (with
transloading) and storage budgets for each of the three southern Idaho commercial production regions.
The current format, adopted in 2013, shows the cost to grow, harvest and sort potatoes in the base budget.
Basically all costs to the “end of the piler boom.” Storage costs are shown in a separate table and begin
with the base budget values. A list of CAR estimates by region and variety is found in Table 1.
Farm Size and Potato Acreage Table 2 shows the farm size and potato acreage for each region’s model farm for the five most recent
years these estimates were made. For 2014 the model farm in southwestern Idaho is 1,600 acres with 500
acres in potatoes. The model farm for southcentral Idaho is 2,200 with 550 acres in potatoes. The model
farm for eastern Idaho is 2,400 acres with 800 acres in potatoes. The size of the model farm and the
number of potato acres were increased in 2013 for all three regions.
In general, operating costs are not influenced by farm size. However, ownership costs do change with
farm size, primarily because of economies of size and scale with equipment. Equipment ownership costs
per acre are strongly influenced by the number of acres over which these costs are spread. The more
acres, the lower the cost. In setting the farm size and selecting the machinery compliment, we attempt to
achieve an economically efficient combination. Equipment that is under utilized has high ownership
costs, while equipment with too many hours of use results in unrealistically low ownership costs.
Input Costs Some input prices are region specific, while other input prices are standardized for the entire state since
they don’t vary consistently by region. Table 3 contains information on three such items: interest rates,
labor wage and benefit rates, and power costs based on Idaho Power’s Service Schedule 24, and the
resulting cost per acre inch of water applied. Table 3 has values for 2014, the previous 3 years and the
percentage change from 2013 to 2014. In the costs and returns estimates, interest is charged from the time
expenditures are made until the harvest month using the operating interest rate shown in Table 3.
Operating interest is identified as a separate line item in the CAR estimates. The intermediate interest rate
is used in calculating non-cash machinery costs. The labor used in crop production falls into six classes
shown in Table 3. Labor used to operate machinery, drive trucks, and manage pivot irrigation systems,

pcop-14.doc University of Idaho October 31, 2014
4including chemigation and fertigation, receive a higher wage than irrigation labor used on set-move
systems (handlines and wheellines) and unskilled general farm labor used primarily during harvest to pick
clods and rocks and to help with storage and trans-loading operations. Prior to 2012, irrigation labor was
not differentiated between set-move and continuous move irrigation systems. The labor costs include the
base wage rate plus payroll taxes and benefit costs. These are shown as a percentage. Additional labor
information is included in the background and assumptions page that accompanies each CAR estimate.
While Idaho Power’s service area does not extend to all irrigated areas of southern Idaho, it is by far the
largest supplier of power to Idaho farms and ranches and that is why it is used in the CAR estimates. The
power rates shown in Table 3 are used with a center pivot irrigation system to derive the cost per acre-
inch of water applied. The power demand used in the calculation is for pressurization only. The standard
assumption for each region is that surface water is delivered to the farm from a canal. Cost per acre-inch
of water applied by different irrigation systems and with different pumping lifts are found in Table 3 of
the Crop Input Cost Summary referenced earlier.
Tables 4-a, 4-b and 4-c contain cost information on commonly used inputs where prices generally vary by
region. These include fuel (gas, farm diesel and road diesel) and irrigation water assessments. Table 4-a
shows these costs for southwestern Idaho, Table 4-b shows the costs for southcentral Idaho and Table 4-c
shows the costs for eastern Idaho.
Prior to 2008, fuel prices were determined by a survey conducted at a single point in time, typically
August. Since 2008, fuel prices found in the Crop Input Cost Summary and used in CAR estimates are the
simple average of prices collected at four times during the year: February, April, June and August. This
change was made at the request of the potato cost of production advisory committee.
Table 5 contains the fertilizer component prices from 2012 through 2014 used in the CAR estimates, and
the percentage changes from 2013 to 2014. Prior to 2009 fertilizer prices were collected and summarized
separately for the three southern Idaho regions.
Potato Yields The yield in a CAR estimate is used to calculate gross revenue and break-even prices needed to cover
costs in different categories. Yield is also the basis for certain costs, such as promotion or inspection fees
paid by growers. Yield also drives storage and sorting costs, which are calculated on a hundredweight
basis. Table 6 shows the potato yields used in the University of Idaho’s 2014 commercial potato CAR
estimates, as well as the previous four years. Some values are shown only as a reference and indicate the
value we would use if the University of Idaho published a CAR estimate for that area and with those
production practices. Only those shown in bold type are used in CAR estimates.

pcop-14.doc University of Idaho October 31, 2014
5
Prior to 1991 there was not a consistent method used to determine potato yields in CAR estimates for all
three regions. Starting in 1991, yields in all three regions were based on USDA-NASS county or regional-
level yield data. From 1991 to 1995, the yield was calculated using a 5-year rolling average. From 1995
through 2003 the yields used were based on a projected yield using exponential smoothing with
an alpha value of .20. This procedure eliminated the negative bias that resulted from using
historical data to calculate averages when yields were increasing rapidly. Unfortunately,
exponential smoothing also produced projected yields that varied widely from actual yield when
potato yield variation from one year to the next was substantial. To avoid this problem, the yield
calculation for CAR estimates was switched to a projected 3-year average starting in 2005. For
2006, the 3-year average consisted of two years of historical data and the third year was
projected, based on the November USDA crop production report. Starting in 2007, the 3-year
average was switched to the three most recent years of published USDA data. For the 2014 CAR
estimates, yield data for the 2011, 2012 and 2013 crops were used. The 2014 county-level data
for Idaho will not be published until October 2015, so the yields used in calculating the average
will always be lagged by one year. Yields used in the CAR estimates are rounded to the nearest 5
hundredweight. These base area yields are then adjusted to account for fumigation, a procedure described
later.
For crop reporting purposes, the Idaho NASS Field Office breaks Idaho into regions. The USDA
calculates potato yields both for individual counties within a region and for the region itself. The yield
estimates used in southwestern and southcentral Idaho CAR estimates are based on the USDA-NASS
regions and includes all the counties in that region. Prior to 2001, yields in eastern Idaho CAR estimates
were based on four major commercial potato counties: Bannock, Bingham, Bonneville and Power.
Starting in 2001, separate CAR estimates were made for commercial potato production in the southern
counties, Bannock, Bingham and Power, and the northern counties: Bonneville, Jefferson and Madison.
Starting in 2012, Jefferson County was removed from the northern county’s average. (See Tables 6-8.)
Because of changes in how yields were calculated and other procedural changes, it can be difficult to
make historical comparisons going back more than one year. In this report when procedural changes
occur in cost calculations, the previous year’s CAR estimate is re-calculated using the new procedure so
that the year-to-year change is based on the price and quantity change of inputs, not based on procedural
changes. Because of this, the resulting costs for the previous year can be different than those published
the previous year.

pcop-14.doc University of Idaho October 31, 2014
6The potato yields for the non-fumigated 2014 CAR estimates are the same as 2013 for southwestern, 10
cwt higher for southcentral Idaho, and 5 cwt higher for eastern Idaho. The potato yields for the fumigated
2014 CAR estimates are 5 cwt higher than 2013 for southwestern, 15 cwt higher for southcentral Idaho,
and 5 cwt higher for eastern-South, and eastern-North. (See Table 6.) Note that for the fourth year, the
yield for Southwestern Idaho uses the Russet Burbank Adjusted Yield, which is 97% of the region’s
average yield. The increasing use of higher yielding varieties, such as Rangers, made this adjustment
necessary.
The following section explains how the yield values used in the fumigation and non-fumigation CAR
estimates are derived.
Fumigation Yield and Cost Allocation Dilemma Fumigation can have a significant impact on per acre production costs and can also have a large impact on
potato yield and quality. For an individual grower, this is does not pose a problem because the cost and
yield increases correspond. In budgeting procedures used to generate potato CAR estimates, the cost
increase is not a problem when fumigation is included. There are, however, two yield questions that must
be considered. The first question: how much of a yield increase should be attributed to fumigation? The
second question: what should the base yield in the non-fumigation CAR estimate be? Since the county
and regional yields published by USDA contain both fumigated and non-fumigated potato acreage,
USDA values are not appropriate for either a CAR estimate with fumigation or one without fumigation
unless some attempt is made to identify and separate the fumigation yield impact in the data.
Historic yields based on USDA data are too low if used in a CAR estimate with the full cost of fumigation
included. Historic yields are too high if used in a CAR estimate when no fumigation cost is included.
Including only a partial cost for fumigation would be appropriate in calculating average production costs,
but not for calculating typical costs where fumigation is either used or it is not. In addition, the methods
used by the University of Idaho to obtain farmer production practice data is not consistent with
calculating average production costs for a region. Using the USDA yield data and including a partial
fumigation cost in a typical budget is not appropriate as it gives the appearance that fumigation is less
expensive then it actually is.
The USDA county-level or regional potato yield data are used to calculate a 3-year average yield for a
given area. These procedures were discussed in the previous section. This base area yield value is set
equal to the weighted average of the fumigated yield and the non-fumigated yield as shown in the
following formula. The weights are estimated percentages of potato acres in that region that are fumigated

pcop-14.doc University of Idaho October 31, 2014
7and not fumigate, respectively. The yield adjustment attributable to fumigation as well as the percentage
of acres fumigated in each region is shown in Table 9.
Fumigation Yield Adjustment Factor
(% of acres not fumigated x Y) + (% acres fumigated x FY) = Area Average Yield,
Where Y = non-fumigation yield,
FY = fumigation yield, and
FY = Y + fumigation yield adjustment The following example illustrates how the fumigation adjustment factor was used, given an area yield of
400 cwt, with 60 percent of the potato acreage fumigated and a fumigation yield adjustment of 50
hundredweight per acre. Set up the equation as shown below and solve for Y.
.4Y + .6 (Y+50) = 400 .4Y + .6Y + 30 = 400 1.0 Y + 30 = 400 Y = 370 And FY = 420 Check: .4 x 370 + .6 x 420 = 400
Fumigation yield in this example is 420 and non-fumigation yield is 370, while the area average is 400.
The fumigation CAR estimate would include the full cost of fumigation and the non-fumigation would
have no fumigation costs. Thus, the costs and yields would correspond.
Note: There are limitations to this type of adjustment and there is a lack of publicly available data on
which to base fumigation estimates. While not perfect, using this methodology does reduce the previous
negative bias that occurred when calculating costs per hundredweight when the benefit of fumigation on
yield was included in the region or county yields, but the cost of fumigation was not. Comments from the
potato industry on how to improve this procedure are encouraged, particularly on how to improve the
values shown in Table 9. Using the percentages of acres fumigated from Table 9 and the number of potato
acres grown in each region produces a statewide weighted-average of approximately 50 percent of the
potato acreage being fumigated. This falls within the ranges of values of 50-60 percent given by
knowledgeable people in the industry.

pcop-14.doc University of Idaho October 31, 2014
8Unresolved Yield Issue: Field-Run vs. Paid
Regardless of how the area potato yields are calculated, how does this yield compare to the grower’s paid
yield? The answer will vary depending on whether the potatoes are sold in the fresh or in the process
market. The yield data from USDA includes all tubers greater than 1-1/2 inches. Since the University of
Idaho CAR estimates do not segment yield into size and grade components that would sell for different
prices, the breakeven prices shown in the CAR estimates are what the grower would have to average if
paid on a field-run yield in order to cover costs. The issue of paid yield is dealt with in the storage tables
for each crop budget: Tables A-2, B-2 and C-2 of the Appendix for storage. One column in each table
shows the field-run breakeven prices and an adjacent column shows paid-yield breakeven prices for an
assumed paid yield of 95%.
Another unresolved issue is whether it is better to use changes in cost per acre or per hundredweight to
measure production costs changes from year-to-year. This report provides both values.
2014 Cost of Potato Production Overview and Comparison Direct comparisons with previously published estimates should not be made without accounting for
differences in procedures and assumptions. There are no longer storage and non-storage potato budgets as
had been published for many years. The base budget contains the cost of sorting potatoes, including labor,
electricity and repair costs. Costs in the base budget are to the end of the piler boom. If potatoes are being
transloaded and hauled to a processor or fresh pack shed, the cost of hauling would need to be added.
Storage costs are added to the base cost in a separate table, including the storage ownership costs, annual
repairs, and monthly storage costs. This is done on both a field-run and paid-yield basis.
Table 10 summarizes the dollar cost per acre and percentage changes from 2013 to 2014 by region for the
major input cost categories. The detailed cost of production estimates for 2014 and 2013 from which this
data were taken are in the appendix. Appendix A, B, and C,contain the cost of production estimates for
southwestern, southcentral and the eastern south region, respectively.
In general, the cost of seed was higher and fertilizer costs were lower. Pesticide and chemical costs in
southwestern and southcentral potato budgets were lower in part because of a reduction in foliar
insecticides. While pesticide and chemical costs were higher in eastern Idaho because of an increase in
foliar fungicides because of late blight. Viewing the color-coded detailed budgets in the appendix shows
that price changes for pesticides is a mixed bag, some up and some down. The cost of power was down in
2014, because of the lower PCA rate (See Table 3 for more detail.). No adjustment was made to the
quantity of water applied. Higher irrigation repairs offset most of the power cost savings, however. Fuel

pcop-14.doc University of Idaho October 31, 2014
9costs were lower (See Tabl3 4 for more detail.), but were offset by higher repair costs on machinery,
pushing overall machinery operating expenses higher. Labor costs were also up slightly across the board.
Overall, operating costs per acre and per hundredweight were down slightly in 2014, primarily because
the drop in fertilizer costs. Operating costs per acre dropped between $30 and $94 per acre, or 13 to 23
cents per hundredweight. Ownership costs per acre were unchanged in southcentral Idaho, up slightly in
eastern Idaho (primarily on higher land costs), and down slightly in southwestern Idaho.
Total costs per acre and per hundredweight were down in all three regions. With yield increases in
southcentral and eastern Idaho, the percentage change in total costs per unit was greater than the
percentage drop per acre. The opposite was the case in southwestern Idaho the yield used in the potato
budget was down 5 hundredweight from 2013.
Cost of Production Summaries and Comparisons by Region Table 11 summarizes production costs for 2013 and 2014 for operating, ownership and total costs per
acre, as well as per acre dollar and percentage changes between these years. Table 12 summarizes
production costs for 2013 and 2014 for operating, ownership and total costs per hundredweight, and the
change per hundredweight and percentage between years. Because the yields used in budgets for 2014
were different than those used in 2013, the percentage changes per hundredweight were different than the
percentage changes per acre.
The total cost to raise, harvest and sort potatoes in the three regions of southern Idaho presented in this
report ranged from $2,558 per acre in eastern Idaho (nonfumigation) up to $3,679 in southwestern Idaho
(with fumigation). (See Table 11.) The range in values per hundredweight is not so extreme. The total
cost to raise, harvest and sort potatoes ranged from $6.73 per hundredweight in eastern Idaho up to $7.12
in southwestern Idaho. (See Table 12.)
Adjustments for 2014
As mentioned previously, there no longer are separate storage and non-storage budgets. The base budget
now shows the cost of growing, harvesting and sorting the potatoes. The cost in the base budget is
basically to the end of the piler boom. Potatoes at this point can be loaded into a semi-trailer and hauled to
a potato processing plant or fresh pack shed. Transportation costs can simply be added to the base cost of
production to get the cost of potatoes delivered to a processing plant or fresh pack shed. The storage
budgets published previously showed storage costs to the end of February. Monthly storage costs from
the end of October to the end of June are now provided in the appendix tables. Cumulative costs per
hundredweight for both field-run and paid-yield are shown.

pcop-14.doc University of Idaho October 31, 2014
10There were no product changes in the three potato cost of production estimates shown in this report.
There was, however, a change in quantities for some inputs. These were primarily associated with
fungicides and insecticides. Changes in products or quantities shown in the detailed cost estimates found
in the appendix are shown in green (Tables A-1, B-1 and C-1).

pcop-14.doc University of Idaho October 31, 2014
11Table 1.Idaho potato costs and returns estimates by region for 2014.
Region/Publication No.
Variety
Fumigation
Storage Costs
Commercial Potatoes Southwestern: EBB2-Po1-13 Russet Burbank Yes Yes Southcentral: EBB3-Po1-13 Russet Burbank No Yes EBB3-Po3-13 Russet Burbank Yes Yes Eastern – South Counties: EBB4-Po1-13 Russet Burbank No Yes EBB4-Po6-13 Russet Burbank Yes Yes Eastern – North Counties: EBB4-Po2-13 Russet Burbank No Yes Seed Eastern – Seed Counties EBB4-Po4-13 G3 Russet Burbank No Yes Eastern – South Counties: Bannock, Bingham and Power. Eastern – North Counties: Bonneville and Madison. Jefferson County was dropped in 2012. Table 2. Model farm size and potato acreage by region. 2009 - 2012 2013 & 2014
Farm Potato Farm Potato
Southwestern 1200 300 1600 500
Southcentral 1800 450 2200 550
Eastern 1800 600 2400 800

pcop-14.doc University of Idaho October 31, 2014
12
Table 3. Interest rates, labor charges and power rates used in CAR estimates: 2011 – 2014 and percentage changes from 2013 to 2014. 2011 2012 2013 2014 Change Operating Interest Rate 6.75% 6.0% 5.75% 6.0% +4.3% Intermediate Interest Rate 7.0% 6.25% 6.0% 5.75% -4.2% Labor Class (overhead) Equipment Operator Labor (25%) $16.25 $17.50 $17.80 $18.10 +1.7% Truck Driver Labor $13.00 $13.50 $13.80 $14.05 +1.8% Irrigation Labor: HL & WL (30%) $11.55 $12.35 $12.60 $12.85 +2.0% Irrigation Labor: CP (25%) $16.25 $17.50 $17.80 $18.10 +1.7% Irrigation Labor: Chem-Fert (25%) $17.80 $18.10 +1.7% General Farm Labor (15%) $9.55 $10.05 $10.25 $10.40 +1.5% Power Rate: Idaho Power Irrigation Service Schedule 24 Monthly Service Charge $18.18 $22.00 $22.00 $22.00 +0% Demand Charge: irrigation season $5.65 $6.54 $7.01 $7.01 +0% Base Rate: per kWh 4.6168¢ 4.584¢ 4.9133¢ 5.6453¢ +14.9%
< 165 kWh per kW of Demand 5.0596 5.7916 +14.5% >165 kWh per kW of Demand 4.7670 5.4990 +15.4%
Power Cost Adjustment per kWh 0.0114¢ 0.1295¢ 1.1767¢ 0.5263¢ -55% Effective Rate: per kWh 4.6282¢ 4.7135¢ 6.090¢ 5.9383¢ -2.5% Pumping Cost per Acre Inch $1.47 $1.56 $1.90 $1.86 -2.1%
Pumping cost is calculated using Idaho Power Company rates for a 160-acre center pivot with a corner system: 69% pumping plant efficiency and with zero lift. Pumping costs per acre-inch at different lifts (0-, 100-, 200- and 300-feet) and different irrigation systems (center pivots without corner systems and wheellines) can be found in the Idaho Crop Input Cost Summary for 2013.
Table 4-a. Current and historical fuel and water assessment prices for southwestern Idaho: 2011 – 2014 and percentage change from 2013 to 2014. 2011 2012 2013 2014 Change Gasoline $3.50 $3.60 $3.70 $3.60 -2.7% Off-Road Diesel $3.50 $3.55 $3.60 $3.55 -1.4% Road Diesel $4.00 $4.05 $4.10 $4.05 -1.2% Water Assessment $45.85 $45.85 $48.85 $50.60 +3.6%

pcop-14.doc University of Idaho October 31, 2014
13
Table 4-b. Current and historical fuel and water assessment prices for southcentral Idaho: 2011 – 2014 and percentage change from 2013 to 2014. 2011 2012 2013 2014 Change Gasoline $3.50 $3.55 $3.60 $3.55 -1.4% Off-Road Diesel $3.45 $3.50 $3.55 $3.50 -1.4% Road Diesel $3.95 $4.00 $4.10 $4.00 -2.4% Water Assessment $41.30 $44.15 $45.30 $45.60 +0.7%
Table 4-c. Current and historical fuel and water assessment prices for eastern Idaho: 2011 – 2014 and percentage change from 2012 to 2013. 2011 2012 2013 2014 Change Gasoline $3.45 $3.50 $3.60 $3.50 -2.8% Off-Road Diesel $3.35 $3.50 $3.50 $3.45 -1.4% Road Diesel $3.85 $4.00 $4.00 $3.95 -1.25% Water Assessment: All $14.60 $14.70 $15.80 $15.90 +0.6%
E. Idaho South District $30.00 $30.00 $35.00 $35.00 +0% E. Idaho North District $11.55 $11.65 $11.95 $12.05 +0.8%
Table 5. Current and historical fertilizer component prices for southern Idaho: 2011 – 2014 and percentage change from 2013 to 2014. 2011 2012 2013 2014 Change Dry Nitrogen (46-0-0) $0.61 $0.69 $0.66 $0.58 -12.1% Liquid Nitrogen (32-0-0) $0.70 $0.75 $0.82 $0.72 -12.2% P2O5 Dry (11-52-0)* $0.57 $0.60 $0.53 $0.48 -9.4% P2O5 Liquid (10-34-0)* $0.76 $0.91 $0.76 $0.61 -19.7% K2O (0-0-60) $0.51 $0.57 $0.50 $0.41 -18.0% Sulfur $0.22 $0.25 $0.25 $0.25 +0%
*Nitrogen in 11-52-0 and 10-34—0 was valued at the price of N in urea and Solution 32, respectively.

pcop-14.doc University of Idaho October 31, 2014
14
Table 6. Calculated potato yields used in published University of Idaho costs and returns estimates by region, both with and without fumigation: 2010 - 2014. *
Area 2010 2011 2012 2013 2014 cwt cwt cwt cwt Southwest Region: Base Yield 510 530 530 540 530 Potatoes: No Fumigation 470 490 485 490 490 Potatoes: Fumigation 535 555 550 550 540 Adj. Russet Burbank: Fumigation 515 530 530 530 525 Southcentral Region: Base Yield 445 445 440 431 443 Russet Burbank: No Fumigation 415 420 415 410 420 Russet Burbank: Fumigation 470 475 470 445 460 Eastern Region: Russet Burbank: Base South Counties* : Base Yield 385 385 395 392 395 South: No Fumigation 365 365 375 375 380 South: Fumigation 410 410 420 410 415 North Counties*: Base Yield 345 360 360 368 North: No Fumigation 335 350 350 355 North: Fumigation 375 390 380 385
Note: Values in bold indicate published CAR estimates. There are no published CAR estimates for those not in bold. These are shown only for reference and comparison. *Eastern Idaho North Counties: Bonneville and Madison. Jefferson County was dropped in 2012. *Eastern Idaho South Counties: Bannock, Bingham and Power. Note: Russet Burbank adjustment factor on SWI is -3%. This was first used in 2011.
Table 7. Potato yields published by USDA for crop years 2009 - 2013 and the 3-year averages based on the most recent published data.
Area
2009
2010
2011
2012
2013
3-Year Average
Southwest Region 500 545 540 530 520 530 Southcentral Region 466 428 429 435 465 443 Eastern Region 390 357 383 394 388 388
South District 405 375 399 403 395 399 North District 377 339 369 372 364 368
Statewide 415 384 404 412 415 410
Source: USDA-NASS. Note: Yields for Eastern – North District are the revised yields that include only Bonneville and Madison Counties.

pcop-14.doc University of Idaho October 31, 2014
15
Table 8. Historical potato yields reported by USDA for the primary commercial potato counties in eastern Idaho for 2009 - 2013 and historical 3-year average for crop year.
Area
2009
2010
2011
2012
2013
3-Year Average
North District Counties: Bonneville 373 355 370 360 359 363 Madison 381 323 367 385 369 374
2-county Average 377 339 369 372 364 368 Jefferson 472 412 471 na na South District Counties: Bannock 409 367 na 400 na Bingham 385 367 384 406 395 395 Power 422 391 414 na na
3-county Average 405 375 399 403
Source: USDA-NASS. Note: Jefferson County was dropped from the North District in 2012 (2011 potato crop year). Values for previous years were re-calculated using only Bonneville and Madison counties. 3-Year averages are based on the last three years where data was published. Note: County-level data was not published for either Bannock or Power counties for 2013. Table 9. Fumigation percentage by region and yield adjustment factors by region. Region Acres Fumigated Fumigation Adjustment Southwest 80% + 50 cwt Southcentral 60% + 40 cwt Southeastern
South District 50% + 35 cwt North District 40% + 30 cwt
Notes: Southwest increased from 65% to 80% in 2013 and yield increase dropped from 65 to 50 Southcentral increased from 55% to 60% in 2013 and yield increase dropped from 55 to 40 cwt South District increased from 45% to 50% in 2013 and yield increase dropped from 45 to 35 cwt North District increased from 30 to 45% in 2013 and yield increase dropped from 40 to 30 cwt

16
Item
Yield -5 -0.9% 10 2.4% 5 1.3%
Operating Inputs $ % $ % $ %
Seed: $6.00 1.7% $5.75 1.8% $5.25 1.8%
Fertilizer: -$77.70 -12.6% $50.95 -10.7% -$54.90 -12.2%
Pesticides & Chemicals: -$26.31 -4.4% -$19.92 -6.7% $11.82 5.1%
Custom & Consultants: -$2.00 -1.6% $4.90 5.9% $2.20 3.9%
Irrigation: $1.11 0.9% -$0.24 -0.2% -$0.48 -0.5%
Machinery: Fuel & Repairs $0.44 0.2% $0.18 0.1% $0.19 0.1%
Field Labor $3.60 1.7% $2.80 1.7% $2.58 1.7%
Sorting: $1.11 1.4% $2.76 4.5% $2.08 3.7%
Other: Fees & Crop Insurance -$0.72 -0.4% $1.62 1.2% $0.90 0.6%
Operating Interest $0.13 0.2% $0.69 1.3% $0.42 0.9%
Total Operating Costs -$94.33 -3.7% -$52.40 -2.8% -$29.94 -1.8%
Operating Costs per Unit -$0.13 -2.8% -$0.23 -5.1% -$0.14 -3.1%
Ownership Costs:$4.00 2.1% $3.00 1.7% $2.00 1.2%
$0.00 0.0% $0.00 0.0% $15.00 3.0%
-$2.50 -3.9% -$1.25 -2.7% -$0.75 -1.8%
-$5.00 -2.8% -$3.00 -2.2% $0.00 0.0%
Total Ownership Costs -$1.31 -0.1% -$0.07 0.0% $18.41 2.1%
Ownership Costs per Unit $0.02 0.8% -$0.06 -2.4% $0.02 0.7%
Total Costs:Total Costs per Acre -$95.64 -2.5% -$52.47 -1.8% -$11.53 -0.4%
Total Cost per Unit -$0.11 -1.6% -$0.29 -4.1% -$0.12 -1.8%
See appendix for detailed cost comparison and for storage costs.
http://web.cals.uidaho.edu/idahoagbiz/
Fumigated Non-Fumigated Non-Fumigated
Table 10. Change in per acre cost of production by major cost category from 2013 to 2014 for irrigated Russet Burbank potatoes in three production regions of Idaho.
Southwestern Idaho Southcentral Idaho Eastern IdahoChange from 2013 Change from 2013 Change from 2013
Click on Publications.
Tractors & Equipment
Land *
Overhead
Management Fee
Note: Cost of production refers to the cost to grow, harvest and sort potatoes. The cost of on-farm storage is not included.
Per Acre & % COP Changes University of Idaho

17
Eastern -South
Russet Burbank with Fumigation
Russet Burbank with No Fumigation
Russet Burbank with No Fumigation
Po2 Po2 Po5
2013 Operating Cost $2,550 $1,870 $1,679
2014 Operating Cost $2,456 $1,818 $1,649
$ Change -$94 -$52 -$30
% Change -3.7% -2.8% -1.8%
2013 Ownership Cost $1,224 $1,030 $891
2014 Ownership Cost $1,223 $1,030 $909
$ Change -$1 $0 $18
% Change -0.1% 0.0% 2.0%
2013 Total Cost $3,774 $2,900 $2,570
2014 Total Cost $3,679 $2,848 $2,558
$ Change -$95 -$52 -$12
% Change -2.5% -1.8% -0.5%
Note: values are rounded an may not add up.
The cost of on-farm storage is not included.See appendix for detailed cost comparison and for storage costs.
Table 11. Cost of production per acre for irrigated Russet Burbank potatoes by region for 2013 and 2014 and change in costs between these years.
Southwestern Southcentral
Note: Cost of production refers to the cost to grow, harvest and sort potatoes.
Summary per Acre University of Idaho

18
Eastern -South
Russet Burbank with Fumigation
Russet Burbank with No Fumigation
Russet Burbank with No Fumigation
Po2 Po2 Po5
2013 Operating Cost $4.81 $4.56 $4.48
2014 Operating Cost $4.68 $4.33 $4.34
$ Change -$0.13 -$0.23 -$0.14
% Change -2.7% -5.0% -3.1%
2013 Ownership Cost $2.31 $2.51 $2.38
2014 Ownership Cost $2.33 $2.45 $2.39
$ Change $0.02 -$0.06 $0.01
% Change 0.9% -2.4% 0.4%
2013 Total Cost $7.12 $7.07 $6.86
2014 Total Cost $7.01 $6.78 $6.73
$ Change -$0.11 -$0.29 -$0.13
% Change -1.5% -4.1% -1.9%
Note: values are rounded an may not add up.
The cost of on-farm storage is not included.See appendix for detailed cost comparison and for and storage costs.
Table 12. Cost of production per hundredweight for irrigated Russet Burbank potatoes by region for 2013 and 2014 and change in costs between these years.
Southwestern Southcentral
Note: Cost of production refers to the cost to grow, harvest and sort potatoes.
Summary per CWT University of Idaho

19
Appendix A Southwestern Idaho
Irrigated Russet Burbank Potato

20
Quantity Price or Value orItem Per Acre Unit Cost Cost/Acre Comparison
Gross Returns 2013Potatoes 525 cwt $7.25 $3,806.25 530 -5 -0.9%
Operating Inputs $ Change % Change
Seed: $357.60 $351.60 $6.00 1.7%G-3 Burbank Potato Seed 24 cwt $13.25 $318.00 $312.00 $6.00 1.9%Seed Cutting 24 cwt $1.65 $39.60 $39.60 $0.00 0.0%
Fertilizer: $541.35 $619.05 -$77.70 -12.6%Dry Nitrogen - Preplant 175 lb $0.58 $101.50 $115.50 -$14.00 -12.1%Dry P2O5 230 lb $0.48 $110.40 $121.90 -$11.50 -9.4%K2O 265 lb $0.41 $108.65 $132.50 -$23.85 -18.0%Sulfur 115 lb $0.25 $28.75 $28.75 $0.00 0.0%Micronutrients & Foliars 2 ac $24.00 $48.00 $48.00 $0.00 0.0%Liquid Nitrogen 145 lb $0.72 $104.40 $123.00 -$18.60 -15.1%Liquid P2O5 65 lb $0.61 $39.65 $49.40 -$9.75 -19.7%
Pesticides & Chemicals: $573.89 $600.20 -$26.31 -4.4%Vapam HL 42% 42 gal $5.50 $231.00 $233.10 -$2.10 -0.9%Potato Seed Treatment 24 cwt $0.50 $12.00 $10.80 $1.20 11.1%Admire Pro 8.0 fl oz $1.60 $12.80 $18.40 -$5.60 -30.4%Moncut 70DF 0.8 lb $33.70 $26.96 $26.08 $0.88 3.4%Eptam 7E 4.0 pt $6.35 $25.40 $25.00 $0.40 1.6%Metribuzin 75DF 0.75 lb $14.35 $10.76 $9.56 $1.20 12.6%Prowl 3.3EC 2.0 pt $4.75 $9.50 $11.20 -$1.70 -15.2%Ridomil Gold MZ 2.5 lb $15.85 $39.63 $41.00 -$1.38 -3.4%Fulfill WDG 5.50 oz $6.00 $33.00 $39.33 -$6.33 -16.1%Movento (2x) 10.00 fl oz $7.15 $71.50 $71.50 $0.00 0.0%Endura 6.00 oz $5.40 $32.40 $30.60 $1.80 5.9%Revus Top 5.5 fl oz $2.48 $13.64 $12.38 $1.26 10.2%Agri-Mek .75SC (2x) 5.0 fl oz $4.65 $23.25 $18.00 $5.25 29.2%Bravo Weather Stik 3.0 pint $4.95 $14.85 $13.65 $1.20 8.8%Gavel 75DF 2.0 lb $8.60 $17.20 $15.80 $1.40 8.9%Athena 0.0 fl oz $1.35 $0.00 $23.80 -$23.80 -100.0%
$0.00
Custom & Consultants: $123.70 $125.70 -$2.00 -1.6%Custom Fumigate: Deep Inject 1 ac $35.00 $35.00 $38.00 -$3.00 -7.9%Custom Fertilize: 400 - 800 lbs 1 ac $9.25 $9.25 $8.50 $0.75 8.8%Custom Fertilize: 0 - 400 lbs 1 ac $9.00 $9.00 $8.00 $1.00 12.5%Custom Air Spray-5G 2 ac $9.00 $18.00 $18.30 -$0.30 -1.6%Custom Air Spray-8G 3 ac $10.15 $30.45 $30.90 -$0.45 -1.5%Consultant & Soil Test 1 ac $22.00 $22.00 $22.00 $0.00 0.0%
Irrigation: $126.12 $125.01 $1.11 0.9%Water Assessment 1 ac $50.60 $50.60 $48.85 $1.75 3.6%Irrigation Power-CP * 32 acin $1.86 $59.52 $60.80 -$1.28 -2.1%Irrigation Repairs-CP * 32 acin $0.50 $16.00 $15.36 $0.64 4.2%
Machinery: $189.64 $189.20 $0.44 0.2%Fuel - Gas 5.32 gal $3.60 $19.15 $19.68 -$0.53 -2.7%Fuel - Farm Diesel 22.37 gal $3.55 $79.41 $80.53 -$1.12 -1.4%Fuel - Road Diesel 2.32 gal $4.05 $9.40 $9.51 -$0.11 -1.2%Lube 1 ac $16.20 $16.20 $16.46 -$0.26 -1.6%Machinery Repairs 1 ac $65.48 $65.48 $63.02 $2.46 3.9%
Field Labor: $217.76 $214.16 $3.60 1.7%Equipment Operator Labor 4.78 hr $18.10 $86.52 $85.08 $1.44 1.7%Truck Driver Labor 3.6 hr $14.05 $50.58 $49.68 $0.90 1.8%Irrigation Labor: CP* 1.28 hr $18.10 $23.17 $22.78 $0.39 1.7%Irrigation Labor: Chem-Fert 1.2 hr $18.10 $21.72 $21.36 $0.36 1.7%General Farm Labor 3.44 hr $10.40 $35.78 $35.26 $0.52 1.5%
Sorting: $80.33 $79.21 $1.11 1.4%Sorting Labor Costs 525 cwt $0.120 $63.00 $62.25 $0.75 1.2%Sorting Equip. Repairs & Power 525 cwt $0.033 $17.33 $16.96 $0.36 2.2%
Other: $159.82 $160.54 -$0.72 -0.4%Crop Insurance 1 ac $70.00 $70.00 $70.00 $0.00 0.0%Fees & Assessments 499 cwt $0.18 $89.82 $90.54 -$0.72 -0.8%
Operating Interest @ 6.0% $85.56 $85.43 $0.13 0.2%
Total Operating Costs $2,456 $2,550 -$94.33 -3.7%Operating Costs per Unit $4.68 $4.81 -$0.13 -2.8%
Net Returns Above Operating Expenses $1,350 $1,148
Table A-1. 2014 Costs to grow, harvest and sort southwestern Idaho irrigated Russet Burbank potatoes with fumigation. No costs for transloading and hauling to processor or for on-farm storage are included. Comparison with 2013. Final 10/30/2014
Yield Change
SWI-Po2-14 University of Idaho EBB2-Po2

21
Quantity Price or Value orItem Per Acre Unit Cost Cost/Acre Comparison
Table A-1. 2014 Costs to grow, harvest and sort southwestern Idaho irrigated Russet Burbank potatoes with fumigation. No costs for transloading and hauling to processor or for on-farm storage are included. Comparison with 2013. Final 10/30/2014
Ownership Costs:$5.62 $5.43 $0.19 3.5%
$198.00 $194.00 $4.00 2.1%$83.00 $81.00 $2.00 2.5%
$700.00 $700.00 $0.00 0.0%$61.50 $64.00 -$2.50 -3.9%
$175.00 $180.00 -$5.00 -2.8%
Total Ownership Costs $1,223 $1,224 -$1.31 -0.1%Ownership Costs per Unit $2.33 $2.31 $0.02 0.8%
Total Costs per Acre $3,679 $3,775 -$95.64 -2.5%Total Cost per Unit $7.01 $7.12 -$0.11 -1.6%
Returns to Risk $127
Notes:
Breakeven Analysis: - Base +5% 5%
YieldPrice 498.75 525 551.25
Operating Cost Breakeven $4.92 $4.68 $4.45
Ownership Cost Breakeven $2.45 $2.33 $2.22
Total Cost Breakeven $7.38 $7.01 $6.67
PriceYield $6.89 $7.25 $7.61
Operating Cost Breakeven 356.6 338.7 322.6
Ownership Cost Breakeven 177.6 168.7 160.7
Total Cost Breakeven 534.1 507.4 483.3
Procedureal changes can result in different costs than were published the previous year.
* Center pivot. ** Includes irrigation system ownership costs.Blue font indicates an increase.A red font indicates a decrease.A green font indicates a change in product or procedure to derive the cost.
OverheadManagement Fee
Tractors & Equipment Depreciation & InterestPotato Handling Equipment Deprec. & InterestLand **
Tractors & Equipment Insurance
SWI-Po2-14 University of Idaho EBB2-Po2

22
Ownership Costs
Operating Costs
Field Run Cost per Cwt
Paid Yield Cost per Cwt
Field-Run Yield 525
Paid Yield % 95% 498.75
Base Cost of Production: southwestern Idaho $7.01 $7.38
Storage System Annual Ownership Costs $0.356 $0.356 $0.37
Base Cost + Storage Ownership Cost $7.36 $7.75
Storage System Annual Repairs $0.039 $0.039 $0.04
Base + Storage System Ownership & Repairs $7.40 $7.79
Cumulative Cumulative CumulativeStorage Op.
CostsBase + All
Storage CostsBase + All
Storage CostsOctober $0.210 $7.61 $8.01
November* $0.382 $7.78 $8.19December $0.470 $7.87 $8.29
January $0.557 $7.96 $8.38February $0.645 $8.05 $8.47
March $0.732 $8.13 $8.56April* $0.921 $8.32 $8.76May $1.028 $8.43 $8.87
June $1.153 $8.56 $9.01
Base cost of production includes cost to grow and harvest potatoes, not including storage or transloading.
Storage system includes: storage facility, air system, and the equipment used to place
potatoes in storage (even flow bin, tables, sizer, piler, etc.)
Storage operating costs include: repairs (shown separately), plus monthly operating costs:labor, power, chemicals, interest, shrink & insurance.
Storage costs do not include the cost of removing the potatoes from storage.
* Indicates month when sprout inhibitor applied.
Cumulative storage operating expenses are calculated to the end of the month.
Table A-2. 2014 Cost per hundredweight to grow, harvest, sort and store Southwestern Idaho irrigated Russet Burbank potato based on both field-run and paid yield.
Storage University of Idaho EBB2-Po2-13

23
Appendix B Southcentral Idaho
Irrigated Russet Burbank Potato

24
Quantity Price or Value orItem Per Acre Unit Cost Cost/Acre Comparison
Gross Returns 2013Potatoes 420 cwt $7.25 $3,045.00 410 10 2.4%
Operating Inputs $ Change % Change
Seed: $331.20 $325.45 $5.75 1.8%G-3 Burbank Potato Seed 23 cwt $12.75 $293.25 $287.50 $5.75 2.0%Seed Cutting 23 cwt $1.65 $37.95 $37.95 $0.00 0.0%
Fertilizer: $426.45 $477.40 -$50.95 -10.7%Dry Nitrogen - Preplant 150 lb $0.58 $87.00 $95.70 -$8.70 -9.1%Dry P2O5 205 lb $0.48 $98.40 $106.00 -$7.60 -7.2%K2O 210 lb $0.41 $86.10 $105.00 -$18.90 -18.0%Sulfur 80 lb $0.25 $20.00 $20.00 $0.00 0.0%Micronutrients & Foliars 2 ac $19.00 $38.00 $38.00 $0.00 0.0%Liquid Nitrogen 105 lb $0.72 $75.60 $86.10 -$10.50 -12.2%Liquid P2O5 35 lb $0.61 $21.35 $26.60 -$5.25 -19.7%
Pesticides & Chemicals: $275.50 $295.42 -$19.92 -6.7%Seed Treatment 23.0 cwt $0.50 $11.50 $10.35 $1.15 11.1%Admire Pro 8.0 oz $1.60 $12.80 $18.40 -$5.60 -30.4%Quadris Flowable 8.0 fl oz $2.60 $20.80 $19.20 $1.60 8.3%Outlook 6EC 20.0 fl oz $1.10 $22.00 $28.00 -$6.00 -21.4%Prowl 3.3 EC 2.0 pt $4.75 $9.50 $11.20 -$1.70 -15.2%Metribuzin 75DF 0.75 lb $14.35 $10.76 $9.56 $1.20 12.6%Endura 4.5 oz $5.40 $24.30 $22.95 $1.35 5.9%Dithane F45 Rainshield (2X) 3.2 qt $8.95 $28.64 $29.76 -$1.12 -3.8%Headline 6.0 fl oz $3.22 $19.32 $19.50 -$0.18 -0.9%Tanos 6.0 oz $2.75 $16.50 $15.60 $0.90 5.8%Gavel 75DF 2.0 lb $8.60 $17.20 $15.80 $1.40 8.9%Brigadier 16.0 fl oz $1.48 $23.68 $21.60 $2.08 9.6%Movento 5.0 fl oz $7.05 $35.25 $35.75 -$0.50 -1.4%Agri-Mek .75SC (2X) 5.0 fl oz $4.65 $23.25 $21.25 $2.00 9.4%Hero 0.0 fl oz $1.52 $0.00 $16.50 -$16.50 -100.0%
$0.00
Custom & Consultants: $93.65 $88.75 $4.90 5.5%Custom Fertilize: 400 - 800 lbs 1 ac $8.75 $8.75 $8.00 $0.75 9.4%Custom Fertilize: 0 - 400 lbs 1 ac $7.90 $7.90 $7.50 $0.40 5.3%Custom Air Spray-7.5G 5 ac $11.00 $55.00 $51.25 $3.75 7.3%Consultant/Soil Testing 1 ac $22.00 $22.00 $22.00 $0.00 0.0%
Irrigation: $109.32 $109.56 -$0.24 -0.2%Water Assessment 1 ac $45.60 $45.60 $45.30 $0.30 0.7%Irrigation Power-CP 27 acin $1.86 $50.22 $51.30 -$1.08 -2.1%Irrigation Repairs 27 acin $0.50 $13.50 $12.96 $0.54 4.2%
Machinery: $154.30 $154.12 $0.18 0.1%Fuel - Gas 4.59 gal $3.55 $16.29 $16.52 -$0.23 -1.4%Fuel - Farm Diesel 18.80 gal $3.50 $65.80 $66.74 -$0.94 -1.4%Fuel - Road Diesel 2.13 gal $4.00 $8.52 $8.73 -$0.21 -2.4%Lube 1 ac $13.60 $13.60 $13.80 -$0.20 -1.4%Machinery Repairs 1 ac $50.09 $50.09 $48.33 $1.76 3.6%
Field Labor: $170.67 $167.87 $2.80 1.7%Equipment Operator Labor 4.40 hrs $18.10 $79.64 $78.32 $1.32 1.7%Truck Driver Labor 1.83 hrs $14.05 $25.71 $25.25 $0.46 1.8%Irrigation Labor: CP 1.08 hr $18.10 $19.55 $19.22 $0.33 1.7%Irrigation Labor: Chem-Fert 0.92 hr $18.10 $16.65 $16.38 $0.27 1.7%General Farm Labor 2.80 hr $10.40 $29.12 $28.70 $0.42 1.5%
Sorting: $64.26 $61.50 $2.76 4.5%Sorting Labor Costs 420 cwt $0.120 $50.40 $48.38 $2.02 4.2%Sorting Equip. Repairs & Power 420 cwt $0.033 $13.86 $13.12 $0.74 5.6%
Other: $136.82 $135.20 $1.62 1.2%Fees & Assessments 399 cwt $0.18 $71.82 $70.20 $1.62 2.3%Crop Insurance 1 ac $65.00 $65.00 $65.00 $0.00 0.0%
Operating Interest @ 6.0% $55.52 $54.83 $0.69 1.3%
Total Operating Costs $1,818 $1,870 -$52.40 -2.8%Operating Costs per Unit $4.33 $4.56 -$0.23 -5.1%
Net Returns Above Operating Expenses $1,227 $900
Table B-1. 2014 Costs to grow, harvest and sort southcentral Idaho irrigated Russet Burbank potatoes. No Costs for transloading and hauling to processor or for on-farm storage are included. Comparison with 2013. Final 10/30/2014
Yield Change
SCI-Po2-14 University of Idaho

25
Quantity Price or Value orItem Per Acre Unit Cost Cost/Acre Comparison
Table B-1. 2014 Costs to grow, harvest and sort southcentral Idaho irrigated Russet Burbank potatoes. No Costs for transloading and hauling to processor or for on-farm storage are included. Comparison with 2013. Final 10/30/2014
Ownership Costs:$5.20 $5.02 $0.18 3.6%
$180.00 $177.00 $3.00 1.7%$64.00 $63.00 $1.00 1.6%
$600.00 $600.00 $0.00 0.0%$45.50 $46.75 -$1.25 -2.7%
$135.00 $138.00 -$3.00 -2.2%
Total Ownership Costs $1,030 $1,030 -$0.07 0.0%Ownership Costs per Unit $2.45 $2.51 -$0.06 -2.4%
Total Costs per Acre $2,847 $2,900 -$52.47 -1.8%Total Cost per Unit $6.78 $7.07 -$0.29 -4.1%
Returns to Risk $198
Notes:
Breakeven Analysis: - Base +5% 5%
YieldPrice 399 420 441
Operating Cost Breakeven $4.56 $4.33 $4.12
Ownership Cost Breakeven $2.58 $2.45 $2.33
Total Cost Breakeven $7.14 $6.78 $6.46
PriceYield $6.89 $7.25 $7.61
Operating Cost Breakeven 263.9 250.7 238.8
Ownership Cost Breakeven 149.5 142.0 135.3
Total Cost Breakeven 413.4 392.7 374.0
Procedureal changes can result in different costs than were published the previous year.
* Center pivot. ** Includes irrigation system ownership costs.Blue font indicates an increase.A red font indicates a decrease.A green font indicates a change in product or procedure to derive the cost.
OverheadManagement Fee
Tractors & Equipment Depreciation & InterestPotato Handling Equipment Deprec. & InterestLand *
Tractors & Equipment Insurance
SCI-Po2-14 University of Idaho
26
Ownership Costs
Operating Costs
Field Run Cost per Cwt
Paid Yield Cost per Cwt
Field-Run Yield 420
Paid Yield % 95% 399
Base Cost of Production: southcentral Idaho $6.78 $7.14
Storage System Annual Ownership Costs $0.356 $0.356 $0.375
Base Cost + Storage Ownership Cost $7.14 $7.51
Storage System Annual Repairs $0.039 $0.039 $0.041
Base + Storage System Ownership & Repairs $7.17 $7.55
Cumulative Cumulative CumulativeStorage Op.
CostsBase + All
Storage CostsBase + All
Storage CostsOctober $0.204 $7.38 $7.77
November* $0.373 $7.55 $7.94December $0.458 $7.63 $8.03
January $0.543 $7.72 $8.12February $0.627 $7.80 $8.21
March $0.712 $7.89 $8.30April* $0.897 $8.07 $8.50May $1.002 $8.18 $8.61
June $1.122 $8.30 $8.73
Base cost of production includes cost to grow, harvest & sort potatoes,both operating and ownership.
Storage system includes: storage facility and air system.
Storage operating costs include: repairs (shown separately), plus monthly operating costs:power, chemicals, interest, shrink & insurance.
Storage costs do not include the cost of removing the potatoes from storage.
* Indicates month when sprout inhibitor applied.
Cumulative storage operating expenses are calculated to the end of the month.
Table B-2. 2014 Cost per hundredweight to grow, harvest, sort and store southcentral Idaho irrigated Russet Burbank potato based on both field-run and paid yield.
Storage University of Idaho EBB3-Po2-13
27
Appendix C Eastern Idaho Southern Region Irrigated Russet Burbank Potato

28
Quantity Price or Value orItem Per Acre Unit Cost Cost/Acre Comparison
Gross Returns 2013Potatoes 380 cwt $7.25 $2,755.00 375 5 1.3%
Operating Inputs $ Change % Change
Seed: $290.85 $285.60 $5.25 1.8%G-3 Russet Burbank Seed S 21 cwt $12.20 $256.20 $250.95 $5.25 2.1%Potato Seed Cutting 21 cwt $1.65 $34.65 $34.65 $0.00 0.0%
Fertilizer: $394.85 $449.75 -$54.90 -12.2%Dry Nitrogen - Pre-plant 135 lb $0.58 $78.30 $89.10 -$10.80 -12.1%Dry P2O5 160 lb $0.48 $76.80 $84.80 -$8.00 -9.4%K2O 190 lb $0.41 $77.90 $95.00 -$17.10 -18.0%Sulfur 85 lb $0.25 $21.25 $21.25 $0.00 0.0%Liquid Nitrogen 100 lb $0.72 $72.00 $82.00 -$10.00 -12.2%Liquid P2O5 60 lb $0.61 $36.60 $45.60 -$9.00 -19.7%Micronutrients/Humic Acid - CP 1 acre $32.00 $32.00 $32.00 $0.00 0.0%
Pesticides & Chemicals: $245.42 $233.60 $11.82 5.1%Potato Seed Treatment 21.0 cwt $0.50 $10.50 $9.45 $1.05 11.1%Admire Pro 8.0 fl oz $1.60 $12.80 $18.40 -$5.60 -30.4%Metribuzin 75DF 0.67 lb $14.35 $9.61 $8.54 $1.07 12.6%Eptam 7E 3.5 pint $6.35 $22.23 $21.88 $0.34 1.6%Prowl 3.3EC 2.0 pint $4.75 $9.50 $11.20 -$1.70 -15.2%Moncut 700DF 1.0 lb $33.70 $33.70 $32.60 $1.10 3.4%Quadris Flowable 8.0 fl oz $2.60 $20.80 $19.20 $1.60 8.3%Omega 500DF 5.5 fl oz $3.50 $19.25 $20.08 -$0.83 -4.1%Bravo Weatherstik 1.0 pint $4.95 $4.95 $4.55 $0.40 8.8%Dithane F45 Rainshield (2x) 3.2 qt $8.95 $28.64 $14.88 $13.76 92.5%Gavel 75DF 2.0 lb $8.60 $17.20 $15.80 $1.40 8.9%Brigadier 16.0 fl oz $1.48 $23.68 $21.60 $2.08 9.6%Agri-Mek 0.75SC 2.25 fl oz $4.65 $10.46 $10.62 -$0.16 -1.5%Reglone 2.0 pint $11.05 $22.10 $24.80 -$2.70 -10.9%
Custom & Consultants: $59.00 $56.80 $2.20 3.9%Custom Fertilize: 400 - 800 lbs 1 acre $8.50 $8.50 $7.25 $1.25 17.2%Custom Fertilize: 0 - 400 lbs 1 acre $8.00 $8.00 $6.75 $1.25 18.5%Consultants/Soil Testing - CP 1 acre $22.00 $22.00 $22.00 $0.00 0.0%Custom Air Spray - 7.5 gal. rate 2 acre $10.25 $20.50 $20.80 -$0.30 -1.4%
Irrigation: $91.64 $92.12 -$0.48 -0.5%Irrigation Power - Center Pivot* 24 ac-in $1.86 $44.64 $45.60 -$0.96 -2.1%Irrigation Water Assessment-S 1 acre $35.00 $35.00 $35.00 $0.00 0.0%Irrigation Repairs - CP* 24 ac-in $0.50 $12.00 $11.52 $0.48 4.2%
Machinery: $158.23 $158.04 $0.19 0.1%Fuel - Gas 4.52 gal $3.50 $15.82 $16.27 -$0.45 -2.8%Fuel - Farm Diesel 20.47 gal $3.45 $70.62 $71.65 -$1.03 -1.4%Fuel - Road Diesel 1.92 gal $3.95 $7.58 $7.68 -$0.10 -1.3%Lube 1 acre $14.10 $14.10 $14.34 -$0.24 -1.7%Machinery Repair 1 acre $50.10 $50.10 $48.10 $2.00 4.2%
Field Labor: $157.44 $154.86 $2.58 1.7%Equipment Operator Labor 3.88 hrs $18.10 $70.23 $69.06 $1.17 1.7%Truck Driver Labor 1.86 hrs $14.05 $26.13 $25.67 $0.46 1.8%Irrigation Labor-CP 0.96 hrs $18.10 $17.38 $17.09 $0.29 1.7%Irrigation Labor: Chem-Fert 0.80 hr $18.10 $14.48 $14.24 $0.24 1.7%General Farm Labor 2.81 hrs $10.40 $29.22 $28.80 $0.42 1.5%
Sorting: $58.14 $56.06 $2.08 3.7%Sorting Labor Costs 380 cwt $0.120 $45.60 $44.06 $1.54 3.5%Sorting Equip. Repairs & Power 380 cwt $0.033 $12.54 $12.00 $0.54 4.5%
Other: $144.98 $144.08 $0.90 0.6%Crop Insurance: MP + Hail 1 acre $80.00 $80.00 $80.00 $0.00 0.0%Potato Fees & Assessments 361 cwt $0.18 $64.98 $64.08 $0.90 1.4%
Operating Interest @ 6.00% $48.73 $48.31 $0.42 0.9%
Total Operating Costs $1,649 $1,679 -$29.94 -1.8%Operating Costs per Unit $4.34 $4.48 -$0.14 -3.1%
Net Returns Above Operating Expenses $1,106 $900
Table C-1. 2014 Costs to grow, harvest and sort eastern Idaho southern region irrigated Russet Burbank potatoes. No costs for transloading and hauling to processor or for on-farm storage. Comparison with 2013. Final 10/30/2014
Yield Change
EIS-Po5-14 University of Idaho

29
Quantity Price or Value orItem Per Acre Unit Cost Cost/Acre Comparison
Table C-1. 2014 Costs to grow, harvest and sort eastern Idaho southern region irrigated Russet Burbank potatoes. No costs for transloading and hauling to processor or for on-farm storage. Comparison with 2013. Final 10/30/2014
Ownership Costs:$4.89 $4.73 $0.16 3.4%
$167.00 $165.00 $2.00 1.2%$59.00 $57.00 $2.00 3.5%
$515.00 $500.00 $15.00 3.0%$41.25 $42.00 -$0.75 -1.8%
$122.00 $122.00 $0.00 0.0%
Total Ownership Costs $909 $891 $18.41 2.1%Ownership Costs per Unit $2.39 $2.38 $0.02 0.7%
Total Costs per Acre $2,558 $2,570 -$11.53 -0.4%Total Cost per Unit $6.73 $6.85 -$0.12 -1.8%
Returns to Risk $197
Notes:
Breakeven Analysis: - Base +5% 5%
YieldPrice 361 380 399
Operating Cost Breakeven $4.57 $4.34 $4.13
Ownership Cost Breakeven $2.52 $2.39 $2.28
Total Cost Breakeven $7.09 $6.73 $6.41
PriceYield $6.89 $7.25 $7.61
Operating Cost Breakeven 239.5 227.5 216.7
Ownership Cost Breakeven 132.0 125.4 119.4
Total Cost Breakeven 371.5 352.9 336.1
Tractors & Equipment InsuranceTractors & Equipment Depreciation & InterestPotato Handling Equipment Deprec. & InterestLand *OverheadManagement Fee
Procedureal changes can result in different costs than were published the previous year.
* Center pivot. ** Includes irrigation system ownership costs.Blue font indicates an increase.A red font indicates a decrease.A green font indicates a change in product or procedure to derive the cost.
EIS-Po5-14 University of Idaho

30
Ownership Costs
Operating Costs
Field-Run Cost per Cwt
Paid Yield Cost per Cwt
Field-Run Yield 380
Paid Yield % 95% 361
Base Cost of Production: Eastern Idaho southern region $6.73 $7.09
Storage System Annual Ownership Costs $0.356 $0.356 $0.375
Base Cost + Storage Ownership Cost $7.09 $7.46
Storage System Annual Repairs $0.039 $0.039 $0.04
Base + Storage System Ownership & Repairs $7.13 $7.50
Cumulative Cumulative CumulativeStorage Op.
CostsBase + All
Storage CostsBase + All
Storage CostsOctober $0.204 $7.33 $7.72
November* $0.373 $7.50 $7.90December $0.458 $7.59 $7.98
January $0.543 $7.67 $8.07February $0.627 $7.75 $8.16
March $0.712 $7.84 $8.25April* $0.897 $8.02 $8.45May $1.002 $8.13 $8.56
June $1.122 $8.25 $8.68
Base cost of production includes the cost to grow, harvest & sort potatoes, both operating & ownership.
Storage system includes: storage facility and air system.
Storage operating costs include: repairs (shown separately), plus monthly operating costs:power, chemicals, interest, shrink & insurance.
Storage costs do not include the cost of removing the potatoes from storage.
* Indicates month when sprout inhibitor applied.
Cumulative storage operating expenses are calculated to the end of the month.
Table C-2. 2014 Cost to grow, harvest, sort, and store eastern Idaho irrigated Russet Burbank potato based on both field-run and paid yield.
Storage University of Idaho EBB4-Po5-14