Embed Size (px)
Citation preview

2014 BPA Final Rate Proposal
BP-14-FS-BPA-08A-E02
Errata to Transmission Revenue Requirement Study Documentation
1. Delete and replace the following with the attachments:
Table 3-5
Table 9-1
Table 9-2
Tables 12-1 through 12-8
Tables 13-1 through 13-8
ERRATA BP-14-FS-BPA-08A-E02
Page 1 of 50

This page intentionally left blank.

A B C
Initial Revenue Requirement 2013 2014 AVERAGE
1 ANCILLARY SERVICES 103,028 103,028 103,028
2 SYNCHRONOUS CONDENSING 1,573 1,573 1,573
3 GENERATION DROPPING 333 333 333
4COE/RECLAMATION NETWORK/
DELIVERY FACILITIES SEGMENTATION7,600 7,600 7,600
5 Redispatch 400 400 400
6 STATION SERVICE 2,385 2,385 2,385
7 TOTAL 115,319 115,319 115,319
Revised Revenue Test 2013 2014
8 ANCILLARY SERVICES 112,124 117,102
9 SYNCHRONOUS CONDENSING 1,880 1,880
10 GENERATION DROPPING 377 377
11COE/RECLAMATION NETWORK/
DELIVERY FACILITIES SEGMENTATION7,106 7,106
12 Redispatch 400 400
13 STATION SERVICE 2,385 2,385
14 TOTAL 124,272 129,250
TABLE 3-5
BETWEEN BUSINESS LINE COSTS
($000s)
ERRATA BP-14-FS-BPA-08A-E02
Page 2 of 50

This page intentionally left blank.
A B C
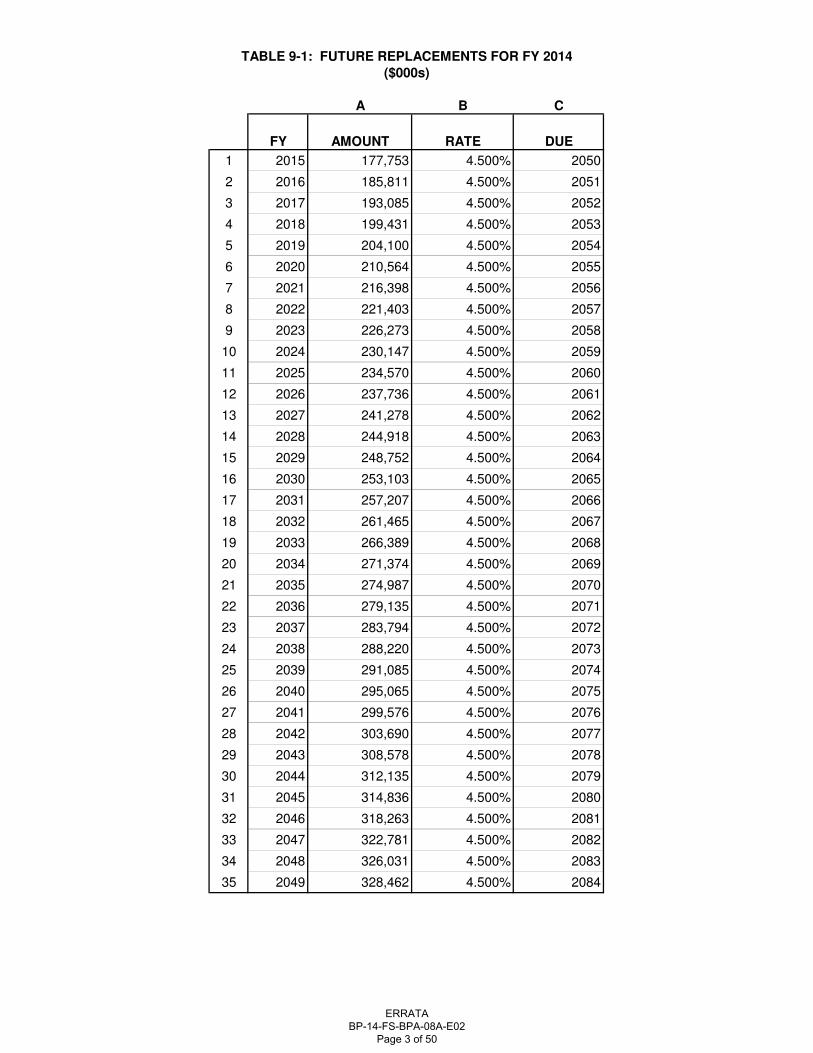
FY AMOUNT RATE DUE
1 2015 177,753 4.500% 2050
2 2016 185,811 4.500% 2051
3 2017 193,085 4.500% 2052
4 2018 199,431 4.500% 2053
5 2019 204,100 4.500% 2054
6 2020 210,564 4.500% 2055
7 2021 216,398 4.500% 2056
8 2022 221,403 4.500% 2057
9 2023 226,273 4.500% 2058
10 2024 230,147 4.500% 2059
11 2025 234,570 4.500% 2060
12 2026 237,736 4.500% 2061
13 2027 241,278 4.500% 2062
14 2028 244,918 4.500% 2063
15 2029 248,752 4.500% 2064
16 2030 253,103 4.500% 2065
17 2031 257,207 4.500% 2066
18 2032 261,465 4.500% 2067
19 2033 266,389 4.500% 2068
20 2034 271,374 4.500% 2069
21 2035 274,987 4.500% 2070
22 2036 279,135 4.500% 2071
23 2037 283,794 4.500% 2072
24 2038 288,220 4.500% 2073
25 2039 291,085 4.500% 2074
26 2040 295,065 4.500% 2075
27 2041 299,576 4.500% 2076
28 2042 303,690 4.500% 2077
29 2043 308,578 4.500% 2078
30 2044 312,135 4.500% 2079
31 2045 314,836 4.500% 2080
32 2046 318,263 4.500% 2081
33 2047 322,781 4.500% 2082
34 2048 326,031 4.500% 2083
35 2049 328,462 4.500% 2084
TABLE 9-1: FUTURE REPLACEMENTS FOR FY 2014
($000s)
ERRATA BP-14-FS-BPA-08A-E02
Page 3 of 50

This page intentionally left blank.

A B C
FY AMOUNT RATE DUE
1 2016 189,512 5.060% 2051
2 2017 196,922 5.060% 2052
3 2018 203,574 5.060% 2053
4 2019 208,629 5.060% 2054
5 2020 215,471 5.060% 2055
6 2021 221,414 5.060% 2056
7 2022 226,804 5.060% 2057
8 2023 232,252 5.060% 2058
9 2024 236,640 5.060% 2059
10 2025 241,160 5.060% 2060
11 2026 244,724 5.060% 2061
12 2027 248,878 5.060% 2062
13 2028 253,053 5.060% 2063
14 2029 256,959 5.060% 2064
15 2030 261,392 5.060% 2065
16 2031 265,934 5.060% 2066
17 2032 270,853 5.060% 2067
18 2033 276,407 5.060% 2068
19 2034 281,566 5.060% 2069
20 2035 285,629 5.060% 2070
21 2036 290,425 5.060% 2071
22 2037 295,659 5.060% 2072
23 2038 300,168 5.060% 2073
24 2039 303,420 5.060% 2074
25 2040 308,011 5.060% 2075
26 2041 313,067 5.060% 2076
27 2042 317,258 5.060% 2077
28 2043 322,295 5.060% 2078
29 2044 326,338 5.060% 2079
30 2045 329,605 5.060% 2080
31 2046 333,499 5.060% 2081
32 2047 338,102 5.060% 2082
33 2048 341,663 5.060% 2083
34 2049 344,541 5.060% 2084
35 2050 347,044 5.060% 2085
TABLE 9-2: FUTURE REPLACEMENTS FOR FY 2015
($000s)
ERRATA BP-14-FS-BPA-08A-E02
Page 4 of 50

This page intentionally left blank.

Table 12-1: Summary of Interest ($000s) (FY 2014)
1
2
3
4
5
6
7
8
9
10
11
A B C D E F G H I J K L M N O P Q R S T U
2013 2014 2015 2016 2017 2018 2019 2020 2021 2022 2023 2024 2025 2026 2027 2028 2029 2030 2031
Appropriation Bonneville Power Administration 18,641 14,540 13,930 7,145 6,202 6,202 3,728 2,156 - - - - - - - - - - -
Bonneville Power
Administration Subtotal:18,641 14,540 13,930 7,145 6,202 6,202 3,728 2,156 - - - - - - - - - - -
Appropriation Subtotal: 18,641 14,540 13,930 7,145 6,202 6,202 3,728 2,156 - - - - - - - - - - -
Treasury Construction 85,724 108,349 126,408 137,853 145,954 154,567 163,666 166,274 170,077 170,139 170,858 171,203 172,749 174,001 175,546 177,607 179,242 181,378 183,594
Environment 1,102 1,233 1,372 1,372 1,372 1,372 1,372 1,372 1,372 1,372 1,372 1,372 1,122 694 694 232 200 - -
(Less Interest Income) (1,333) (1,303) (1,460) (1,036) (917) (1,025) (2,615) (2,459) (2,442) (2,452) (2,451) (2,503) (2,660) (2,657) (2,652) (2,646) (2,641) (2,634) (2,587)
Coupon Scale Down Premiums - - - 19 - - - 138 3,370 1,086 3,392 3,826 2,766 5,318 5,723 6,568 4,843 5,187 6,205
BPA Borrowing Subtotal: 85,492 108,279 126,320 138,208 146,409 154,914 162,423 165,324 172,377 170,145 173,171 173,897 173,978 177,356 179,311 181,762 181,644 183,931 187,212
Treasury Subtotal: 85,492 108,279 126,320 138,208 146,409 154,914 162,423 165,324 172,377 170,145 173,171 173,897 173,978 177,356 179,311 181,762 181,644 183,931 187,212
GRAND TOTAL: 104,133 122,819 140,250 145,353 152,612 161,116 166,150 167,480 172,377 170,145 173,171 173,897 173,978 177,356 179,311 181,762 181,644 183,931 187,212
Project
ERRATA BP-14-FS-BPA-08A-E02
Page 5 of 50

Table 12-1: Summary of Interest ($000s) (FY 2014)
1
2
3
4
5
6
7
8
9
10
11
A B
Appropriation Bonneville Power Administration
Bonneville Power
Administration Subtotal:
Appropriation Subtotal:
Treasury Construction
Environment
(Less Interest Income)
Coupon Scale Down Premiums
BPA Borrowing Subtotal:
Treasury Subtotal:
GRAND TOTAL:
Project
V W X Y Z AA AB AC AD AE AF AG AH AI AJ AK AL AM AN
2032 2033 2034 2035 2036 2037 2038 2039 2040 2041 2042 2043 2044 2045 2046 2047 2048 2049
Total
- - - - - - - - - - - - - - - - - - 72,544
- - - - - - - - - - - - - - - - - - 72,544
- - - - - - - - - - - - - - - - - - 72,544
186,172 189,139 196,368 201,180 204,887 208,922 220,379 230,636 237,053 244,473 254,773 267,646 277,350 284,440 291,363 298,766 306,665 315,040 7,430,441
- - - - - - - - - - - - - - - - - - 18,996
(2,566) (1,782) (2,316) (2,572) (2,562) (1,251) (1,498) (2,388) (2,339) (1,756) (1,303) (2,061) (2,548) (2,655) (2,626) (2,595) (2,562) (2,526) (80,377)
3,116 2,066 2,853 969 2,309 51 561 540 177 220 31 - 2,497 2,319 2,119 2,006 1,780 72,053
186,722 189,423 196,905 199,577 204,634 207,721 219,441 228,788 234,892 242,938 253,502 265,585 274,802 284,283 291,056 298,290 306,109 314,294 7,441,113
186,722 189,423 196,905 199,577 204,634 207,721 219,441 228,788 234,892 242,938 253,502 265,585 274,802 284,283 291,056 298,290 306,109 314,294 7,441,113
186,722 189,423 196,905 199,577 204,634 207,721 219,441 228,788 234,892 242,938 253,502 265,585 274,802 284,283 291,056 298,290 306,109 314,294 7,513,658
ERRATA BP-14-FS-BPA-08A-E02
Page 6 of 50

Table 12-2: Interest Calculation Summary ($000s) (FY 2014)
A B C D E F G H
Fiscal Year Project Type Principal Rate Interest Premium Total
1 2013 Bonneville Power Administration Historical 257,352 7.243% 18,641 - 18,641
2 2013 Construction Historical 1,927,890 4.074% 78,544 - 78,544
3 2013 Construction New 361,396 1.987% 7,180 - 7,180
4 2013 Environment Historical 23,000 3.867% 889 - 889
5 2013 Environment New 5,540 3.836% 213 - 213
6 2013 Float Historical - - (1,333) - (1,333)
7 FY 2013 Subtotal: 2,575,178 104,133 - 104,133
8 2014 Bonneville Power Administration Historical 200,978 7.235% 14,540 - 14,540
9 2014 Construction Historical 2,369,266 4.132% 97,901 - 97,901
10 2014 Construction New 547,950 1.907% 10,448 - 10,448
11 2014 Environment Historical 29,050 4.034% 1,172 - 1,172
12 2014 Environment New 3,460 1.766% 61 - 61
13 2014 Float Historical - - (1,303) - (1,303)
14 FY 2014 Subtotal: 3,150,704 122,819 - 122,819
15 2015 Bonneville Power Administration Historical 192,577 7.233% 13,930 - 13,930
16 2015 Construction Historical 2,938,646 4.165% 122,399 - 122,399
17 2015 Construction New 177,753 2.255% 4,008 - 4,008
18 2015 Environment Historical 34,430 3.985% 1,372 - 1,372
19 2015 Float Historical - - (1,460) - (1,460)
20 FY 2015 Subtotal: 3,343,406 140,250 - 140,250
21 2016 Bonneville Power Administration Historical 98,958 7.220% 7,145 - 7,145
22 2016 Construction Historical 3,116,399 4.289% 133,663 19 133,682
23 2016 Construction New 185,811 2.255% 4,190 - 4,190
24 2016 Environment Historical 34,430 3.985% 1,372 - 1,372
25 2016 Float Historical - - (1,036) - (1,036)
26 FY 2016 Subtotal: 3,435,598 145,334 19 145,353
27 2017 Bonneville Power Administration Historical 85,919 7.219% 6,202 - 6,202
28 2017 Construction Historical 3,272,225 4.327% 141,600 - 141,600
29 2017 Construction New 193,085 2.255% 4,354 - 4,354
30 2017 Environment Historical 34,430 3.985% 1,372 - 1,372
31 2017 Float Historical - - (917) - (917)
32 FY 2017 Subtotal: 3,585,659 152,612 - 152,612
33 2018 Bonneville Power Administration Historical 85,919 7.219% 6,202 - 6,202
34 2018 Construction Historical 3,439,395 4.363% 150,070 - 150,070
35 2018 Construction New 199,431 2.255% 4,497 - 4,497
36 2018 Environment Historical 34,430 3.985% 1,372 - 1,372
37 2018 Float Historical - - (1,025) - (1,025)
38 FY 2018 Subtotal: 3,759,175 161,116 - 161,116
39 2019 Bonneville Power Administration Historical 51,690 7.211% 3,728 - 3,728
40 2019 Construction Historical 3,638,826 4.371% 159,064 - 159,064
41 2019 Construction New 204,100 2.255% 4,602 - 4,602
42 2019 Environment Historical 34,430 3.985% 1,372 - 1,372
43 2019 Float Historical - - (2,615) - (2,615)
44 FY 2019 Subtotal: 3,929,046 166,150 - 166,150
45 2020 Bonneville Power Administration Historical 29,899 7.210% 2,156 - 2,156
46 2020 Construction Historical 3,647,136 4.429% 161,525 138 161,663
47 2020 Construction New 210,564 2.255% 4,748 - 4,748
48 2020 Environment Historical 34,430 3.985% 1,372 - 1,372
49 2020 Float Historical - - (2,459) - (2,459)
50 FY 2020 Subtotal: 3,922,029 167,342 138 167,480
51 2021 Construction Historical 3,688,126 4.479% 165,197 3,370 168,567
52 2021 Construction New 216,398 2.255% 4,880 - 4,880
53 2021 Environment Historical 34,430 3.985% 1,372 - 1,372
54 2021 Float Historical - - (2,442) - (2,442)
55 FY 2021 Subtotal: 3,938,954 169,007 3,370 172,377
ERRATA BP-14-FS-BPA-08A-E02
Page 7 of 50

Table 12-2: Interest Calculation Summary ($000s) (FY 2014)
A B C D E F G H
Fiscal Year Project Type Principal Rate Interest Premium Total
56 2022 Construction Historical 3,710,071 4.451% 165,146 1,086 166,232
57 2022 Construction New 221,403 2.255% 4,993 - 4,993
58 2022 Environment Historical 34,430 3.985% 1,372 - 1,372
59 2022 Float Historical - - (2,452) - (2,452)
60 FY 2022 Subtotal: 3,965,904 169,059 1,086 170,145
61 2023 Construction Historical 3,733,656 4.439% 165,756 3,392 169,148
62 2023 Construction New 226,273 2.255% 5,102 - 5,102
63 2023 Environment Historical 34,430 3.985% 1,372 - 1,372
64 2023 Float Historical - - (2,451) - (2,451)
65 FY 2023 Subtotal: 3,994,359 169,779 3,392 173,171
66 2024 Construction Historical 3,764,915 4.409% 166,013 3,759 169,772
67 2024 Construction New 230,147 2.255% 5,190 - 5,190
68 2024 Environment Historical 34,430 3.985% 1,372 67 1,439
69 2024 Float Historical - - (2,503) - (2,503)
70 FY 2024 Subtotal: 4,029,492 170,071 3,826 173,897
71 2025 Construction Historical 3,799,559 4.407% 167,460 2,766 170,226
72 2025 Construction New 234,570 2.255% 5,290 - 5,290
73 2025 Environment Historical 29,430 3.812% 1,122 - 1,122
74 2025 Float Historical - - (2,660) - (2,660)
75 FY 2025 Subtotal: 4,063,559 171,212 2,766 173,978
76 2026 Construction Historical 3,825,037 4.409% 168,640 5,318 173,958
77 2026 Construction New 237,736 2.255% 5,361 - 5,361
78 2026 Environment Historical 19,430 3.572% 694 - 694
79 2026 Float Historical - - (2,657) - (2,657)
80 FY 2026 Subtotal: 4,082,203 172,038 5,318 177,356
81 2027 Construction Historical 3,846,936 4.422% 170,105 5,723 175,827
82 2027 Construction New 241,278 2.255% 5,441 - 5,441
83 2027 Environment Historical 19,430 3.572% 694 - 694
84 2027 Float Historical - - (2,652) - (2,652)
85 FY 2027 Subtotal: 4,107,644 173,588 5,723 179,311
86 2028 Construction Historical 3,887,213 4.427% 172,085 6,568 178,652
87 2028 Construction New 244,918 2.255% 5,523 - 5,523
88 2028 Environment Historical 6,430 3.615% 232 - 232
89 2028 Float Historical - - (2,646) - (2,646)
90 FY 2028 Subtotal: 4,138,561 175,194 6,568 181,762
91 2029 Construction Historical 3,921,536 4.428% 173,633 4,843 178,475
92 2029 Construction New 248,752 2.255% 5,609 - 5,609
93 2029 Environment Historical 5,380 3.716% 200 - 200
94 2029 Float Historical - - (2,641) - (2,641)
95 FY 2029 Subtotal: 4,175,668 176,801 4,843 181,644
96 2030 Construction Historical 3,963,703 4.432% 175,670 5,187 180,857
97 2030 Construction New 253,103 2.255% 5,707 - 5,707
98 2030 Float Historical - - (2,634) - (2,634)
99 FY 2030 Subtotal: 4,216,806 178,744 5,187 183,931
100 2031 Construction Historical 4,006,962 4.437% 177,794 6,205 183,999
101 2031 Construction New 257,207 2.255% 5,800 - 5,800
102 2031 Float Historical - - (2,587) - (2,587)
103 FY 2031 Subtotal: 4,264,169 181,007 6,205 187,212
104 2032 Construction Historical 4,061,994 4.438% 180,276 3,116 183,392
105 2032 Construction New 261,465 2.255% 5,896 - 5,896
106 2032 Float Historical - - (2,566) - (2,566)
107 FY 2032 Subtotal: 4,323,459 183,606 3,116 186,722
ERRATA BP-14-FS-BPA-08A-E02
Page 8 of 50
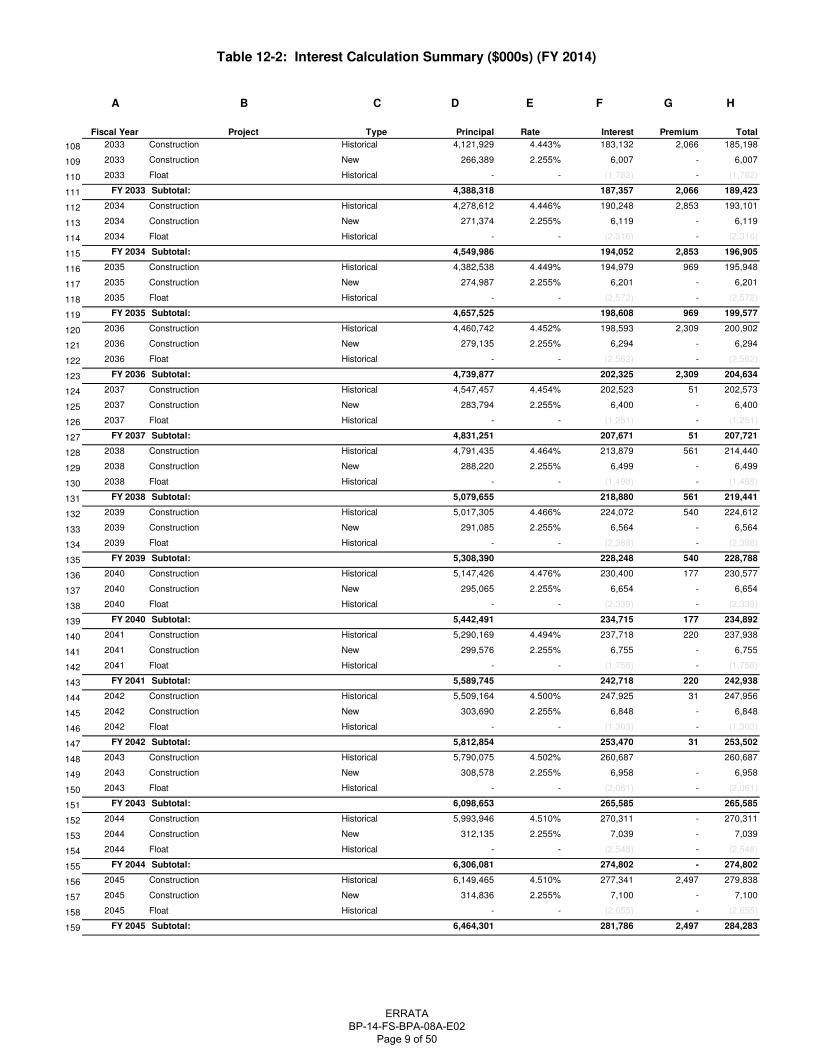
Table 12-2: Interest Calculation Summary ($000s) (FY 2014)
A B C D E F G H
Fiscal Year Project Type Principal Rate Interest Premium Total
108 2033 Construction Historical 4,121,929 4.443% 183,132 2,066 185,198
109 2033 Construction New 266,389 2.255% 6,007 - 6,007
110 2033 Float Historical - - (1,782) - (1,782)
111 FY 2033 Subtotal: 4,388,318 187,357 2,066 189,423
112 2034 Construction Historical 4,278,612 4.446% 190,248 2,853 193,101
113 2034 Construction New 271,374 2.255% 6,119 - 6,119
114 2034 Float Historical - - (2,316) - (2,316)
115 FY 2034 Subtotal: 4,549,986 194,052 2,853 196,905
116 2035 Construction Historical 4,382,538 4.449% 194,979 969 195,948
117 2035 Construction New 274,987 2.255% 6,201 - 6,201
118 2035 Float Historical - - (2,572) - (2,572)
119 FY 2035 Subtotal: 4,657,525 198,608 969 199,577
120 2036 Construction Historical 4,460,742 4.452% 198,593 2,309 200,902
121 2036 Construction New 279,135 2.255% 6,294 - 6,294
122 2036 Float Historical - - (2,562) - (2,562)
123 FY 2036 Subtotal: 4,739,877 202,325 2,309 204,634
124 2037 Construction Historical 4,547,457 4.454% 202,523 51 202,573
125 2037 Construction New 283,794 2.255% 6,400 - 6,400
126 2037 Float Historical - - (1,251) - (1,251)
127 FY 2037 Subtotal: 4,831,251 207,671 51 207,721
128 2038 Construction Historical 4,791,435 4.464% 213,879 561 214,440
129 2038 Construction New 288,220 2.255% 6,499 - 6,499
130 2038 Float Historical - - (1,498) - (1,498)
131 FY 2038 Subtotal: 5,079,655 218,880 561 219,441
132 2039 Construction Historical 5,017,305 4.466% 224,072 540 224,612
133 2039 Construction New 291,085 2.255% 6,564 - 6,564
134 2039 Float Historical - - (2,388) - (2,388)
135 FY 2039 Subtotal: 5,308,390 228,248 540 228,788
136 2040 Construction Historical 5,147,426 4.476% 230,400 177 230,577
137 2040 Construction New 295,065 2.255% 6,654 - 6,654
138 2040 Float Historical - - (2,339) - (2,339)
139 FY 2040 Subtotal: 5,442,491 234,715 177 234,892
140 2041 Construction Historical 5,290,169 4.494% 237,718 220 237,938
141 2041 Construction New 299,576 2.255% 6,755 - 6,755
142 2041 Float Historical - - (1,756) - (1,756)
143 FY 2041 Subtotal: 5,589,745 242,718 220 242,938
144 2042 Construction Historical 5,509,164 4.500% 247,925 31 247,956
145 2042 Construction New 303,690 2.255% 6,848 - 6,848
146 2042 Float Historical - - (1,303) - (1,303)
147 FY 2042 Subtotal: 5,812,854 253,470 31 253,502
148 2043 Construction Historical 5,790,075 4.502% 260,687 260,687
149 2043 Construction New 308,578 2.255% 6,958 - 6,958
150 2043 Float Historical - - (2,061) - (2,061)
151 FY 2043 Subtotal: 6,098,653 265,585 265,585
152 2044 Construction Historical 5,993,946 4.510% 270,311 - 270,311
153 2044 Construction New 312,135 2.255% 7,039 - 7,039
154 2044 Float Historical - - (2,548) - (2,548)
155 FY 2044 Subtotal: 6,306,081 274,802 - 274,802
156 2045 Construction Historical 6,149,465 4.510% 277,341 2,497 279,838
157 2045 Construction New 314,836 2.255% 7,100 - 7,100
158 2045 Float Historical - - (2,655) - (2,655)
159 FY 2045 Subtotal: 6,464,301 281,786 2,497 284,283
ERRATA BP-14-FS-BPA-08A-E02
Page 9 of 50

Table 12-2: Interest Calculation Summary ($000s) (FY 2014)
A B C D E F G H
Fiscal Year Project Type Principal Rate Interest Premium Total
160 2046 Construction Historical 6,301,247 4.510% 284,186 2,319 286,505
161 2046 Construction New 318,263 2.255% 7,177 - 7,177
162 2046 Float Historical - - (2,626) - (2,626)
163 FY 2046 Subtotal: 6,619,510 288,737 2,319 291,056
164 2047 Construction Historical 6,463,132 4.510% 291,487 2,119 293,606
165 2047 Construction New 322,781 2.255% 7,279 - 7,279
166 2047 Float Historical - - (2,595) - (2,595)
167 FY 2047 Subtotal: 6,785,913 296,171 2,119 298,290
168 2048 Construction Historical 6,636,646 4.510% 299,313 2,006 301,319
169 2048 Construction New 326,031 2.255% 7,352 - 7,352
170 2048 Float Historical - - (2,562) - (2,562)
171 FY 2048 Subtotal: 6,962,677 304,103 2,006 306,109
172 2049 Construction Historical 6,821,144 4.510% 307,634 1,780 309,414
173 2049 Construction New 328,462 2.255% 7,407 - 7,407
174 2049 Float Historical - - (2,526) - (2,526)
175 FY 2049 Subtotal: 7,149,606 312,514 1,780 314,294
176 Grand Total: 173,788,405 7,441,604 72,053 7,513,658
ERRATA BP-14-FS-BPA-08A-E02
Page 10 of 50

Table 12-3: Summary of Amortization ($000s) (FY 2014)
1
2
3
4
5
6
7
8
9
10
11
A B C D E F G H I J K L M N O P Q R S T U
2013 2014 2015 2016 2017 2018 2019 2020 2021 2022 2023 2024 2025 2026 2027 2028 2029 2030 2031
BONNEVILLE POWER
ADMINISTRATION BPA 56,374 8,401 93,619 13,039 - 34,230 21,790 29,899 - - - - - - - - - - -
APPROPRIATION
SUBTOTAL:56,374 8,401 93,619 13,039 0 34,230 21,790 29,899 0 0 0 0 0 0 0 0 0 0 0
BPA BORROWING
CONSTRUCTION - 73,050 - 29,985 25,915 - 195,790 169,574 194,453 197,818 195,014 195,503 209,092 215,837 201,000 210,595 206,585 209,845 202,175
ENVIRONMENT - - - - - - - - - - - 5,000 10,000 - 13,000 1,050 5,380 - -
BPA BORROWING
SUBTOTAL:- 73,050 - 29,985 25,915 - 195,790 169,574 194,453 197,818 195,014 200,503 219,092 215,837 214,000 211,645 211,965 209,845 202,175
MAKE WHOLE CALL
DISCOUNTS - - - - - - - - - - - - - - - - - - -
PREMIUMS 0 0 0 0 0 0 0 0 0 0 0 0 0 0 0 0 0 0 0
MAKE WHOLE CALL
SUBTOTAL:0 0 0 0 0 0 0 0 0 0 0 0 0 0 0 0 0 0 0
TREASURY SUBTOTAL: - 73,050 - 29,985 25,915 - 195,790 169,574 194,453 197,818 195,014 200,503 219,092 215,837 214,000 211,645 211,965 209,845 202,175
GRAND TOTAL: 56,374 81,451 93,619 43,024 25,915 34,230 217,580 199,473 194,453 197,818 195,014 200,503 219,092 215,837 214,000 211,645 211,965 209,845 202,175
ERRATA BP-14-FS-BPA-08A-E02
Page 11 of 50

Table 12-3: Summary of Amortization ($000s) (FY 2014)
1
2
3
4
5
6
7
8
9
10
11
A B
BONNEVILLE POWER
ADMINISTRATION BPA
APPROPRIATION
SUBTOTAL:
BPA BORROWING
CONSTRUCTION
ENVIRONMENT
BPA BORROWING
SUBTOTAL:
MAKE WHOLE CALL
DISCOUNTS
PREMIUMS
MAKE WHOLE CALL
SUBTOTAL:
TREASURY SUBTOTAL:
GRAND TOTAL:
V W X Y Z AA AB AC AD AE AF AG AH AI AJ AK AL AM AN
2032 2033 2034 2035 2036 2037 2038 2039 2040 2041 2042 2043 2044 2045 2046 2047 2048 2049 TOTAL
- - - - - - - - - - - - - - - - - - 257,352
0 0 0 0 0 0 0 0 0 0 0 0 0 0 0 0 0 0 257,352
201,530 109,706 167,448 196,783 192,420 39,816 62,349 160,964 152,322 80,581 22,779 104,706 156,617 163,054 156,378 149,267 141,533 133,417 5,123,902
- - - - - - - - - - - - - - - - - - 34,430
201,530 109,706 167,448 196,783 192,420 39,816 62,349 160,964 152,322 80,581 22,779 104,706 156,617 163,054 156,378 149,267 141,533 133,417 5,158,332
- - - - - - - - - - - - - - - - - - -
0 0 0 0 0 0 0 0 0 0 0 0 0 0 0 0 0 0 0
0 0 0 0 0 0 0 0 0 0 0 0 0 0 0 0 0 0 0
201,530 109,706 167,448 196,783 192,420 39,816 62,349 160,964 152,322 80,581 22,779 104,706 156,617 163,054 156,378 149,267 141,533 133,417 5,158,332
201,530 109,706 167,448 196,783 192,420 39,816 62,349 160,964 152,322 80,581 22,779 104,706 156,617 163,054 156,378 149,267 141,533 133,417 5,415,684
ERRATA BP-14-FS-BPA-08A-E02
Page 12 of 50

Table 12-4: Application of Amortization ($000s) (FY 2014)
A B C D E F G H I J
Fiscal Year Project Appropriation Type In Service Due Date
Original
Principal
Current
Balance Rate Rollover
Amount
Amortized
1 FY 2013 Bonneville Power Administration BPA 1973 2018 21,656 5,041 7.280% No 5,041
2 FY 2013 Bonneville Power Administration BPA 1973 2018 33,788 15,769 7.280% No 15,769
3 FY 2013 Bonneville Power Administration BPA 1974 2019 12,079 12,079 7.270% No 5,191
4 FY 2013 Bonneville Power Administration BPA 1974 2019 12,563 12,563 7.270% No 12,563
5 FY 2013 Bonneville Power Administration BPA 1974 2019 20,984 17,810 7.270% No 17,810
6 FY 2013 Subtotal: - - - 101,070 63,262 - - 56,374
7 FY 2014 Construction - 1999 2014 59,050 59,050 5.900% No 59,050
8 FY 2014 Construction - 2009 2014 14,000 14,000 2.746% No 14,000
9 FY 2014 Bonneville Power Administration BPA 1974 2019 12,079 6,888 7.270% No 6,888
10 FY 2014 Bonneville Power Administration BPA 1975 2020 11,742 11,742 7.250% No 1,513
11 FY 2014 Subtotal: - - - 96,871 91,680 - - 81,451
12 FY 2015 Bonneville Power Administration BPA 1975 2020 11,742 10,229 7.250% No 10,229
13 FY 2015 Bonneville Power Administration BPA 1975 2020 17,158 17,158 7.250% No 17,158
14 FY 2015 Bonneville Power Administration BPA 1975 2020 21,916 21,916 7.250% No 21,916
15 FY 2015 Bonneville Power Administration BPA 1975 2020 32,026 32,026 7.250% No 32,026
16 FY 2015 Bonneville Power Administration BPA 1976 2021 2,212 2,212 7.230% No 2,212
17 FY 2015 Bonneville Power Administration BPA 1976 2021 61,025 61,025 7.230% No 10,078
18 FY 2015 Subtotal: - - - 146,079 144,566 - - 93,619
19 FY 2016 Construction - 2011 2016 13,000 13,000 1.957% No 13,000
20 FY 2016 Construction - 2011 2016 6,500 6,500 1.423% No 6,500
21 FY 2016 Construction - 2012 2017 36,400 36,400 0.920% No 10,485
22 FY 2016 Bonneville Power Administration BPA 1976 2021 61,025 50,947 7.230% No 13,039
23 FY 2016 Subtotal: - - - 116,925 106,847 - - 43,024
24 FY 2017 Construction - 2012 2017 36,400 25,915 0.920% No 25,915
25 FY 2017 Subtotal: - - - 36,400 25,915 - - 25,915
26 FY 2018 Bonneville Power Administration BPA 1976 2021 61,025 37,908 7.230% No 34,230
27 FY 2018 Subtotal: - - - 61,025 37,908 - - 34,230
28 FY 2019 Construction - 2009 2019 46,940 46,940 4.026% No 46,940
29 FY 2019 Construction - 2009 2019 35,000 35,000 3.699% No 35,000
30 FY 2019 Construction - 2010 2019 13,000 13,000 4.069% No 13,000
31 FY 2019 Construction - 2010 2019 23,000 23,000 3.719% No 23,000
32 FY 2019 Construction - 2010 2019 30,000 30,000 3.714% No 30,000
33 FY 2019 Construction - 2010 2019 15,000 15,000 3.533% No 15,000
34 FY 2019 Construction - 2013 2019 10,500 10,500 1.800% No 10,500
35 FY 2019 Construction - 2013 2019 12,180 13,650 1.800% No 13,650
36 FY 2019 Construction - 2013 2019 8,700 8,700 1.100% No 8,700
37 FY 2019 Bonneville Power Administration BPA 1976 2021 61,025 3,679 7.230% No 3,679
38 FY 2019 Bonneville Power Administration BPA 1977 2022 4,981 4,981 7.210% No 4,981
39 FY 2019 Bonneville Power Administration BPA 1977 2022 33,702 33,702 7.210% No 13,131
40 FY 2019 Subtotal: - - - 294,028 238,152 - - 217,580
41 FY 2020 Construction - 2009 2020 50,000 50,000 3.830% No 50,000
42 FY 2020 Construction - 2010 2020 43,000 43,000 3.842% No 43,000
43 FY 2020 Construction - 2010 2020 50,000 50,000 3.118% No 50,000
44 FY 2020 Construction - 2014 2020 5,260 5,260 2.200% No 5,260
45 FY 2020 Construction - 2014 2020 5,640 5,640 2.200% No 5,640
46 FY 2020 Construction - 2014 2020 6,140 6,140 2.200% No 6,140
47 FY 2020 Construction - 2014 2020 6,540 6,540 2.200% No 6,540
48 FY 2020 Bonneville Power Administration BPA 1977 2022 3,948 3,948 7.210% No 3,948
49 FY 2020 Bonneville Power Administration BPA 1977 2022 5,380 5,380 7.210% No 5,380
50 FY 2020 Bonneville Power Administration BPA 1977 2022 33,702 20,571 7.210% No 20,571
51 FY 2020 Construction - 2013 2043 18,000 18,000 6.000% No 2,994
52 FY 2020 Subtotal: - - - 227,610 214,479 - - 199,473
53 FY 2021 Construction - 2010 2021 15,000 15,000 4.188% No 15,000
54 FY 2021 Construction - 2010 2021 22,000 22,000 4.094% No 22,000
55 FY 2021 Construction - 2010 2021 22,000 22,000 3.694% No 22,000
ERRATA BP-14-FS-BPA-08A-E02
Page 13 of 50

Table 12-4: Application of Amortization ($000s) (FY 2014)
A B C D E F G H I J
Fiscal Year Project Appropriation Type In Service Due Date
Original
Principal
Current
Balance Rate Rollover
Amount
Amortized
56 FY 2021 Construction - 2010 2021 22,000 22,000 3.374% No 22,000
57 FY 2021 Construction - 1998 2028 112,300 112,300 5.850% No 53,447
58 FY 2021 Construction - 2013 2043 15,000 15,000 6.000% No 15,000
59 FY 2021 Construction - 2013 2043 18,000 15,006 6.000% No 15,006
60 FY 2021 Construction - 2013 2043 30,000 30,000 6.000% No 30,000
61 FY 2021 Subtotal: - - - 256,300 253,306 - - 194,453
62 FY 2022 Construction - 2009 2022 35,000 35,000 4.253% No 35,000
63 FY 2022 Construction - 2009 2022 20,000 20,000 4.200% No 20,000
64 FY 2022 Construction - 2010 2022 30,000 30,000 3.372% No 30,000
65 FY 2022 Construction - 2010 2022 20,000 20,000 3.029% No 20,000
66 FY 2022 Construction - 1998 2028 112,300 58,853 5.850% No 58,853
67 FY 2022 Construction - 1998 2028 106,500 106,500 5.850% No 33,965
68 FY 2022 Subtotal: - - - 323,800 270,353 - - 197,818
69 FY 2023 Construction - 2010 2023 46,000 46,000 3.161% No 46,000
70 FY 2023 Construction - 1998 2028 106,500 72,535 5.850% No 72,535
71 FY 2023 Construction - 2009 2039 35,000 35,000 5.192% No 21,479
72 FY 2023 Construction - 2013 2043 55,000 55,000 5.700% No 55,000
73 FY 2023 Subtotal: - - - 242,500 208,535 - - 195,014
74 FY 2024 Construction - 2012 2024 45,000 45,000 3.360% No 45,000
75 FY 2024 Environment - 2013 2028 5,000 5,000 5.000% No 5,000
76 FY 2024 Construction - 2011 2035 40,000 40,000 4.794% No 6,982
77 FY 2024 Construction - 2011 2036 50,000 50,000 4.952% No 50,000
78 FY 2024 Construction - 2011 2038 55,000 55,000 4.935% No 55,000
79 FY 2024 Construction - 2009 2039 35,000 13,521 5.192% No 13,521
80 FY 2024 Construction - 2011 2040 25,000 25,000 4.775% No 25,000
81 FY 2024 Subtotal: - - - 255,000 233,521 - - 200,503
82 FY 2025 Construction - 2010 2025 15,000 15,000 4.310% Yes 15,000
83 FY 2025 Construction - 2012 2025 14,300 14,300 4.310% Yes 14,300
84 FY 2025 Construction - 2012 2025 26,000 26,000 4.310% Yes 26,000
85 FY 2025 Construction - 2012 2025 37,000 37,000 4.310% Yes 37,000
86 FY 2025 Environment - 2010 2025 10,000 10,000 4.279% No 10,000
87 FY 2025 Construction - 2011 2035 40,000 33,018 4.794% No 33,018
88 FY 2025 Construction - 2011 2036 50,000 50,000 4.629% No 50,000
89 FY 2025 Construction - 2015 2050 177,753 177,753 4.510% No 33,774
90 FY 2025 Subtotal: - - - 370,053 363,071 - - 219,092
91 FY 2026 Construction - 2011 2026 45,000 45,000 3.450% No 45,000
92 FY 2026 Construction - 2015 2050 177,753 143,979 4.510% No 143,979
93 FY 2026 Construction - 2016 2051 185,811 185,811 4.510% No 26,858
94 FY 2026 Subtotal: - - - 408,564 374,790 - - 215,837
95 FY 2027 Construction - 2012 2027 17,000 17,000 3.550% No 17,000
96 FY 2027 Environment - 2012 2027 13,000 13,000 3.550% No 13,000
97 FY 2027 Construction - 2016 2051 185,811 158,953 4.510% No 158,953
98 FY 2027 Construction - 2017 2052 193,085 193,085 4.510% No 25,048
99 FY 2027 Subtotal: - - - 408,896 382,038 - - 214,000
100 FY 2028 Environment - 2013 2028 510 510 3.100% No 510
101 FY 2028 Environment - 2013 2028 540 540 3.100% No 540
102 FY 2028 Construction - 2017 2052 193,085 168,037 4.510% No 168,037
103 FY 2028 Construction - 2018 2053 199,431 199,431 4.510% No 42,558
104 FY 2028 Subtotal: - - - 393,566 368,518 - - 211,645
105 FY 2029 Construction - 2011 2029 50,000 50,000 4.238% No 50,000
106 FY 2029 Environment - 2014 2029 780 780 4.400% No 780
107 FY 2029 Environment - 2014 2029 1,250 1,250 3.600% No 1,250
108 FY 2029 Environment - 2014 2029 1,430 1,430 3.600% No 1,430
109 FY 2029 Environment - 2014 2029 1,920 1,920 3.600% No 1,920
110 FY 2029 Construction - 2018 2053 199,431 156,873 4.510% No 156,585
111 FY 2029 Subtotal: - - - 254,811 212,253 - - 211,965
112 FY 2030 Construction - 2013 2030 42,110 42,110 4.100% No 42,110
113 FY 2030 Construction - 2018 2053 199,431 289 4.510% No 288
114 FY 2030 Construction - 2019 2054 204,100 204,100 4.510% No 167,446
115 FY 2030 Subtotal: - - - 445,641 246,499 - - 209,845
116 FY 2031 Construction - 2019 2054 204,100 36,654 4.510% No 36,654
117 FY 2031 Construction - 2020 2055 210,564 210,564 4.510% No 165,521
118 FY 2031 Subtotal: - - - 414,664 247,218 - - 202,175
ERRATA BP-14-FS-BPA-08A-E02
Page 14 of 50

Table 12-4: Application of Amortization ($000s) (FY 2014)
A B C D E F G H I J
Fiscal Year Project Appropriation Type In Service Due Date
Original
Principal
Current
Balance Rate Rollover
Amount
Amortized
119 FY 2032 Construction - 2011 2032 98,900 98,900 4.355% No 98,900
120 FY 2032 Construction - 2020 2055 210,564 45,043 4.510% No 45,043
121 FY 2032 Construction - 2021 2056 216,398 216,398 4.510% No 57,587
122 FY 2032 Subtotal: - - - 525,862 360,341 - - 201,530
123 FY 2033 Construction - 2011 2033 40,000 40,000 4.386% No 40,000
124 FY 2033 Construction - 2021 2056 216,398 158,811 4.510% No 69,706
125 FY 2033 Subtotal: - - - 256,398 198,811 - - 109,706
126 FY 2034 Construction - 2011 2034 40,000 40,000 4.416% No 40,000
127 FY 2034 Construction - 2014 2044 87,940 87,940 4.500% No 56,928
128 FY 2034 Construction - 2021 2056 216,398 89,105 4.510% No 70,520
129 FY 2034 Subtotal: - - - 344,338 217,045 - - 167,448
130 FY 2035 Construction - 2011 2035 40,000 40,000 4.446% No 40,000
131 FY 2035 Construction - 2011 2035 40,000 40,000 4.446% No 40,000
132 FY 2035 Construction - 2011 2035 45,000 45,000 4.446% No 45,000
133 FY 2035 Construction - 2014 2044 87,940 31,012 4.500% No 31,012
134 FY 2035 Construction - 2014 2044 79,760 79,760 4.500% No 40,770
135 FY 2035 Construction - 2021 2056 216,398 18,585 4.510% No
136 FY 2035 Subtotal: - - - 509,098 254,357 - - 196,783
137 FY 2036 Construction - 2014 2044 79,760 38,990 4.500% No 38,990
138 FY 2036 Construction - 2014 2044 52,970 52,970 4.500% No 44,431
139 FY 2036 Construction - 2014 2044 53,170 53,170 4.500% No 53,170
140 FY 2036 Construction - 2014 2044 55,830 55,830 4.500% No 55,830
141 FY 2036 Subtotal: - - - 241,730 200,960 - - 192,420
142 FY 2037 Construction - 2012 2037 35,000 35,000 3.503% No 35,000
143 FY 2037 Construction - 2014 2044 52,970 8,539 4.500% No 4,816
144 FY 2037 Subtotal: - - - 87,970 43,539 - - 39,816
145 FY 2038 Construction - 2014 2044 52,970 3,723 4.500% No 3,723
146 FY 2038 Construction - 2014 2044 45,810 45,810 4.500% No 2,796
147 FY 2038 Construction - 2014 2044 55,830 55,830 4.500% No 55,830
148 FY 2038 Subtotal: - - - 154,610 105,363 - - 62,349
149 FY 2039 Construction - 2011 2039 50,000 50,000 4.295% No 50,000
150 FY 2039 Construction - 2012 2039 39,000 39,000 3.627% No 39,000
151 FY 2039 Construction - 2014 2044 45,810 43,014 4.500% No 43,014
152 FY 2039 Construction - 2014 2044 49,700 49,700 4.500% No 28,951
153 FY 2039 Subtotal: - - - 184,510 181,714 - - 160,964
154 FY 2040 Construction - 2011 2040 35,000 35,000 3.796% No 35,000
155 FY 2040 Construction - 2012 2040 30,000 30,000 3.890% No 30,000
156 FY 2040 Construction - 2012 2040 45,000 45,000 3.890% No 45,000
157 FY 2040 Construction - 2013 2043 66,330 66,330 4.100% No 40,351
158 FY 2040 Construction - 2014 2044 49,700 20,749 4.500% No 1,971
159 FY 2040 Subtotal: - - - 226,030 197,079 - - 152,322
160 FY 2041 Construction - 2013 2043 66,330 25,979 4.100% No 25,979
161 FY 2041 Construction - 2013 2043 60,016 60,016 4.100% No 54,602
162 FY 2041 Subtotal: - - - 126,346 85,995 - - 80,581
163 FY 2042 Construction - 2013 2043 60,016 5,414 4.100% No 5,414
164 FY 2042 Construction - 2013 2043 40,010 40,010 4.100% No 17,365
165 FY 2042 Subtotal: - - - 100,026 45,424 - - 22,779
166 FY 2043 Construction - 2013 2043 40,010 22,645 4.100% No 22,645
167 FY 2043 Construction - 2013 2043 39,950 39,950 4.100% No 39,950
168 FY 2043 Construction - 2013 2043 42,110 42,110 4.100% No 42,110
169 FY 2043 Construction - 2014 2044 49,700 18,778 4.500% No 2
170 FY 2043 Subtotal: - - - 171,770 123,483 - - 104,706
171 FY 2044 Construction - 2014 2044 49,700 18,777 4.500% No 18,777
172 FY 2044 Construction - 2014 2044 20,040 20,040 4.500% No 20,040
173 FY 2044 Construction - 2014 2044 28,630 28,630 4.500% No 28,630
174 FY 2044 Construction - 2014 2044 40,700 40,700 4.500% No 40,700
175 FY 2044 Construction - 2014 2044 48,470 48,470 4.500% No 48,470
176 FY 2044 Subtotal: - - - 187,540 156,617 - - 156,617
177 FY 2045 Construction - 2021 2056 216,398 18,585 4.510% No 18,585
178 FY 2045 Construction - 2022 2057 221,403 221,403 4.510% No 144,469
179 FY 2045 Subtotal: - - - 437,801 239,988 - - 163,054
ERRATA BP-14-FS-BPA-08A-E02
Page 15 of 50

Table 12-4: Application of Amortization ($000s) (FY 2014)
A B C D E F G H I J
Fiscal Year Project Appropriation Type In Service Due Date
Original
Principal
Current
Balance Rate Rollover
Amount
Amortized
180 FY 2046 Construction - 2022 2057 221,403 76,934 4.510% No 76,934
181 FY 2046 Construction - 2023 2058 226,273 226,273 4.510% No 79,444
182 FY 2046 Subtotal: - - - 447,676 303,207 - - 156,378
183 FY 2047 Construction - 2023 2058 226,273 146,829 4.510% No 146,829
184 FY 2047 Construction - 2024 2059 230,147 230,147 4.510% No 2,438
185 FY 2047 Subtotal: - - - 456,420 376,976 - - 149,267
186 FY 2048 Construction - 2024 2059 230,147 227,709 4.510% No 141,533
187 FY 2048 Subtotal: - - - 230,147 227,709 - - 141,533
188 FY 2049 Construction - 2024 2059 230,147 86,176 4.510% No 86,176
189 FY 2049 Construction - 2025 2060 234,570 234,570 4.510% No 47,241
190 FY 2049 Subtotal: - - - 464,717 320,746 - - 133,417
191 FY 2050 Construction - 2025 2060 234,570 187,329 4.510% No 121,733
192 FY 2050 Subtotal: - - - 234,570 187,329 - - 121,733
193 FY 2051 Construction - 2025 2060 234,570 65,596 4.510% No 65,596
194 FY 2051 Construction - 2026 2061 237,736 237,736 4.510% No 61,665
195 FY 2051 Subtotal: - - - 472,306 303,332 - - 127,261
196 FY 2052 Construction - 2026 2061 237,736 176,071 4.510% No 133,037
197 FY 2052 Subtotal: - - - 237,736 176,071 - - 133,037
198 FY 2053 Construction - 2026 2061 237,736 43,034 4.510% No 43,034
199 FY 2053 Construction - 2027 2062 241,278 241,278 4.510% No 96,015
200 FY 2053 Subtotal: - - - 479,014 284,312 - - 139,049
201 FY 2054 Construction - 2027 2062 241,278 145,263 4.510% No 145,263
202 FY 2054 Construction - 2028 2063 244,918 244,918 4.510% No 143
203 FY 2054 Subtotal: - - - 486,196 390,181 - - 145,405
204 FY 2055 Construction - 2028 2063 244,918 244,775 4.510% No 151,924
205 FY 2055 Subtotal: - - - 244,918 244,775 - - 151,924
206 FY 2056 Construction - 2028 2063 244,918 92,851 4.510% No 92,851
207 FY 2056 Construction - 2029 2064 248,752 248,752 4.510% No 66,003
208 FY 2056 Subtotal: - - - 493,670 341,603 - - 158,854
209 FY 2057 Construction - 2029 2064 248,752 182,749 4.510% No 166,069
210 FY 2057 Subtotal: - - - 248,752 182,749 - - 166,069
211 FY 2058 Construction - 2029 2064 248,752 16,679 4.510% No 16,679
212 FY 2058 Construction - 2030 2065 253,103 253,103 4.510% No 156,866
213 FY 2058 Subtotal: - - - 501,855 269,782 - - 173,546
214 FY 2059 Construction - 2030 2065 253,103 96,237 4.510% No 96,237
215 FY 2059 Construction - 2031 2066 257,207 257,207 4.510% No 85,201
216 FY 2059 Subtotal: - - - 510,310 353,444 - - 181,438
217 FY 2060 Construction - 2031 2066 257,207 172,006 4.510% No 172,006
218 FY 2060 Construction - 2032 2067 261,465 261,465 4.510% No 17,673
219 FY 2060 Subtotal: - - - 518,672 433,471 - - 189,679
220 FY 2061 Construction - 2032 2067 261,465 243,792 4.510% No 198,227
221 FY 2061 Subtotal: - - - 261,465 243,792 - - 198,227
222 FY 2062 Construction - 2032 2067 261,465 45,564 4.510% No 45,564
223 FY 2062 Construction - 2033 2068 266,389 266,389 4.510% No 161,631
224 FY 2062 Subtotal: - - - 527,854 311,953 - - 207,196
225 FY 2063 Construction - 2033 2068 266,389 104,758 4.510% No 104,758
226 FY 2063 Construction - 2034 2069 271,374 271,374 4.510% No 111,826
227 FY 2063 Subtotal: - - - 537,763 376,132 - - 216,584
228 FY 2064 Construction - 2034 2069 271,374 159,548 4.510% No 159,548
229 FY 2064 Construction - 2035 2070 274,987 274,987 4.510% No 66,842
230 FY 2064 Subtotal: - - - 546,361 434,535 - - 226,389
231 FY 2065 Construction - 2035 2070 274,987 208,145 4.510% No 208,145
232 FY 2065 Construction - 2036 2071 279,135 279,135 4.510% No 28,481
233 FY 2065 Subtotal: - - - 554,122 487,280 - - 236,627
234 FY 2066 Construction - 2036 2071 279,135 250,654 4.510% No 247,313
235 FY 2066 Subtotal: - - - 279,135 250,654 - - 247,313
236 FY 2067 Construction - 2036 2071 279,135 3,341 4.510% No 3,341
237 FY 2067 Construction - 2037 2072 283,794 283,794 4.510% No 255,107
238 FY 2067 Subtotal: - - - 562,929 287,135 - - 258,447
239 FY 2068 Construction - 2037 2072 283,794 28,687 4.510% No 28,687
240 FY 2068 Construction - 2038 2073 288,220 288,220 4.510% No 241,424
241 FY 2068 Subtotal: - - - 572,014 316,907 - - 270,111
ERRATA BP-14-FS-BPA-08A-E02
Page 16 of 50
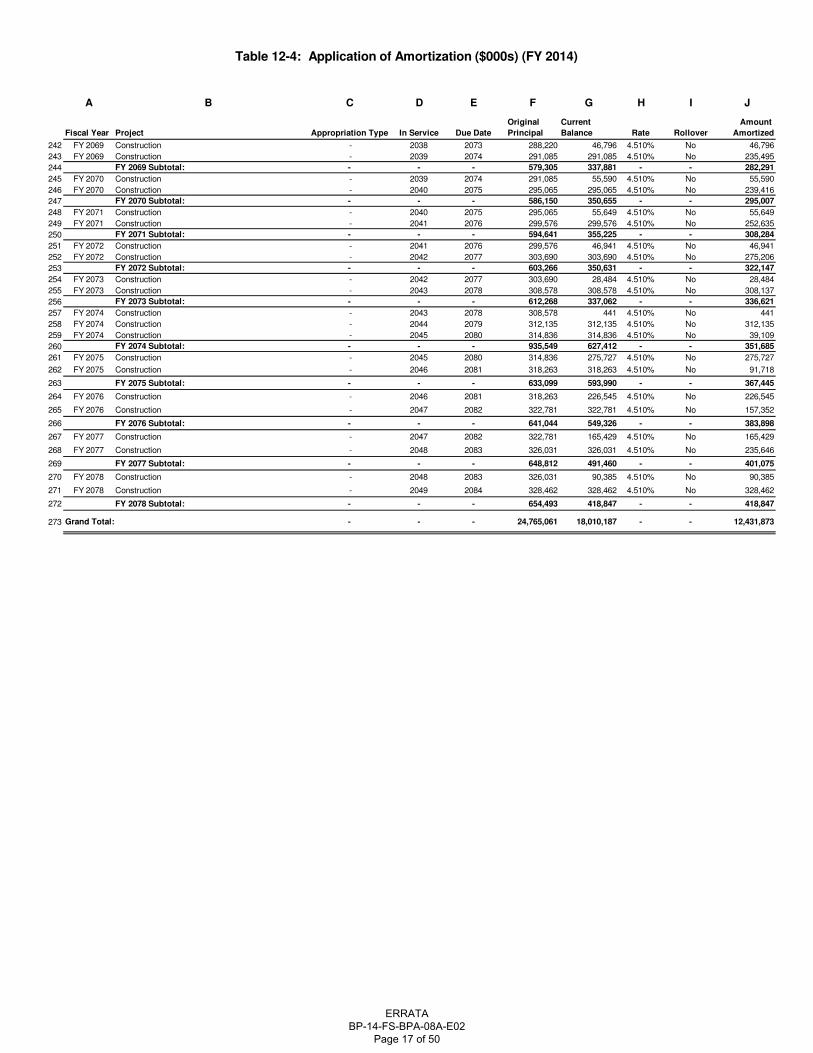
Table 12-4: Application of Amortization ($000s) (FY 2014)
A B C D E F G H I J
Fiscal Year Project Appropriation Type In Service Due Date
Original
Principal
Current
Balance Rate Rollover
Amount
Amortized
242 FY 2069 Construction - 2038 2073 288,220 46,796 4.510% No 46,796
243 FY 2069 Construction - 2039 2074 291,085 291,085 4.510% No 235,495
244 FY 2069 Subtotal: - - - 579,305 337,881 - - 282,291
245 FY 2070 Construction - 2039 2074 291,085 55,590 4.510% No 55,590
246 FY 2070 Construction - 2040 2075 295,065 295,065 4.510% No 239,416
247 FY 2070 Subtotal: - - - 586,150 350,655 - - 295,007
248 FY 2071 Construction - 2040 2075 295,065 55,649 4.510% No 55,649
249 FY 2071 Construction - 2041 2076 299,576 299,576 4.510% No 252,635
250 FY 2071 Subtotal: - - - 594,641 355,225 - - 308,284
251 FY 2072 Construction - 2041 2076 299,576 46,941 4.510% No 46,941
252 FY 2072 Construction - 2042 2077 303,690 303,690 4.510% No 275,206
253 FY 2072 Subtotal: - - - 603,266 350,631 - - 322,147
254 FY 2073 Construction - 2042 2077 303,690 28,484 4.510% No 28,484
255 FY 2073 Construction - 2043 2078 308,578 308,578 4.510% No 308,137
256 FY 2073 Subtotal: - - - 612,268 337,062 - - 336,621
257 FY 2074 Construction - 2043 2078 308,578 441 4.510% No 441
258 FY 2074 Construction - 2044 2079 312,135 312,135 4.510% No 312,135
259 FY 2074 Construction - 2045 2080 314,836 314,836 4.510% No 39,109
260 FY 2074 Subtotal: - - - 935,549 627,412 - - 351,685
261 FY 2075 Construction - 2045 2080 314,836 275,727 4.510% No 275,727
262 FY 2075 Construction - 2046 2081 318,263 318,263 4.510% No 91,718
263 FY 2075 Subtotal: - - - 633,099 593,990 - - 367,445
264 FY 2076 Construction - 2046 2081 318,263 226,545 4.510% No 226,545
265 FY 2076 Construction - 2047 2082 322,781 322,781 4.510% No 157,352
266 FY 2076 Subtotal: - - - 641,044 549,326 - - 383,898
267 FY 2077 Construction - 2047 2082 322,781 165,429 4.510% No 165,429
268 FY 2077 Construction - 2048 2083 326,031 326,031 4.510% No 235,646
269 FY 2077 Subtotal: - - - 648,812 491,460 - - 401,075
270 FY 2078 Construction - 2048 2083 326,031 90,385 4.510% No 90,385
271 FY 2078 Construction - 2049 2084 328,462 328,462 4.510% No 328,462
272 FY 2078 Subtotal: - - - 654,493 418,847 - - 418,847
273 Grand Total: - - - 24,765,061 18,010,187 - - 12,431,873
ERRATA BP-14-FS-BPA-08A-E02
Page 17 of 50

Table 12-5: Summary of Interest ($000s) (FY 2015)
1
2
3
4
5
6
7
8
9
10
11
A B C D E F G H I J K L M N O P Q R S T U
2013 2014 2015 2016 2017 2018 2019 2020 2021 2022 2023 2024 2025 2026 2027 2028 2029 2030 2031
Bonneville Power Administration 18,641 14,540 13,930 7,145 3,566 2,357 - - - - - - - - - - - - -
Bonneville Power Administration
Subtotal:18,641 14,540 13,930 7,145 3,566 2,357 - - - - - - - - - - - - -
Appropriation Subtotal: 18,641 14,540 13,930 7,145 3,566 2,357 - - - - - - - - - - - - -
Construction 85,724 108,349 133,869 161,589 171,019 180,817 189,597 190,750 192,670 193,207 194,321 195,935 197,425 198,610 199,655 201,227 202,487 204,288 206,391
Environment 1,102 1,233 1,441 1,609 1,609 1,609 1,609 1,609 1,609 1,609 1,609 1,609 1,609 1,181 1,181 719 437 237 -
(Less Interest Income) (1,333) (1,303) (1,643) (1,480) (1,344) (1,456) (3,186) (3,024) (3,014) (3,022) (3,020) (3,071) (3,240) (3,238) (3,235) (3,231) (3,228) (3,223) (3,173)
Coupon Scale Down Premiums - - - - - 1,373 1,916 930 1,615 3,513 6,432 6,360 4,754 6,625 7,370 8,186 6,475 6,663 8,062
BPA Borrowing Subtotal: 85,492 108,279 133,667 161,717 171,284 182,342 189,936 190,266 192,880 195,306 199,342 200,833 200,548 203,178 204,971 206,902 206,171 207,965 211,280
Treasury Subtotal: 85,492 108,279 133,667 161,717 171,284 182,342 189,936 190,266 192,880 195,306 199,342 200,833 200,548 203,178 204,971 206,902 206,171 207,965 211,280
GRAND TOTAL: 104,133 122,819 147,597 168,862 174,850 184,699 189,936 190,266 192,880 195,306 199,342 200,833 200,548 203,178 204,971 206,902 206,171 207,965 211,280
Appropriation
Treasury
ERRATA BP-14-FS-BPA-08A-E02
Page 18 of 50

Table 12-5: Summary of Interest ($000s) (FY 2015)
1
2
3
4
5
6
7
8
9
10
11
A B
Bonneville Power Administration
Bonneville Power Administration
Subtotal:
Appropriation Subtotal:
Construction
Environment
(Less Interest Income)
Coupon Scale Down Premiums
BPA Borrowing Subtotal:
Treasury Subtotal:
GRAND TOTAL:
Appropriation
Treasury
V W X Y Z AA AB AC AD AE AF AG AH AI AJ AK AL AM AN AO
2032 2033 2034 2035 2036 2037 2038 2039 2040 2041 2042 2043 2044 2045 2046 2047 2048 2049 2050 Total
- - - - - - - - - - - - - - - - - - - 60,179
- - - - - - - - - - - - - - - - - - - 60,179
- - - - - - - - - - - - - - - - - - - 60,179
208,446 211,445 218,931 223,761 227,888 232,658 245,109 256,435 264,007 272,526 284,171 298,562 309,882 318,626 326,373 334,712 343,663 353,217 363,376 8,701,719
- - - - - - - - - - - - - - - - - - - 23,616
(3,153) (2,302) (2,880) (3,159) (3,146) (1,719) (1,983) (2,945) (2,886) (2,247) (1,749) (2,565) (3,087) (3,196) (3,161) (3,123) (3,082) (3,038) (2,991) (101,876)
4,510 3,343 3,917 299 1,877 326 789 723 393 320 60 - - 3,354 3,136 2,890 2,677 2,453 2,150 103,493
209,803 212,486 219,968 220,902 226,619 231,266 243,916 254,213 261,514 270,598 282,482 295,997 306,795 318,783 326,348 334,480 343,258 352,632 362,535 8,726,951
209,803 212,486 219,968 220,902 226,619 231,266 243,916 254,213 261,514 270,598 282,482 295,997 306,795 318,783 326,348 334,480 343,258 352,632 362,535 8,726,951
209,803 212,486 219,968 220,902 226,619 231,266 243,916 254,213 261,514 270,598 282,482 295,997 306,795 318,783 326,348 334,480 343,258 352,632 362,535 8,787,130
ERRATA BP-14-FS-BPA-08A-E02
Page 19 of 50

Table 12-6: Interest Calculation Summary ($000s) (FY 2015)
A B C D E F G HFISCAL YEAR PROJECT TYPE PRINCIPAL RATE Interest Premium Total
1 2013 Bonneville Power Administration Historical 257,352 7.243% 18,641 - 18,641
2 2013 Construction Historical 1,927,890 4.074% 78,544 - 78,544
3 2013 Construction New 361,396 1.987% 7,180 - 7,180
4 2013 Environment Historical 23,000 3.867% 889 - 889
5 2013 Environment New 5,540 3.836% 213 - 213
6 2013 Float Historical - - (1,333) - (1,333)
7 FY 2013 Subtotal: 2,575,178 104,133 - 104,133
8 2014 Bonneville Power Administration Historical 200,978 7.235% 14,540 - 14,540
9 2014 Construction Historical 2,369,266 4.132% 97,901 - 97,901
10 2014 Construction New 547,950 1.907% 10,448 - 10,448
11 2014 Environment Historical 29,050 4.034% 1,172 - 1,172
12 2014 Environment New 3,460 1.766% 61 - 61
13 2014 Float Historical - - (1,303) - (1,303)
14 FY 2014 Subtotal: 3,150,704 122,819 - 122,819
15 2015 Bonneville Power Administration Historical 192,577 7.233% 13,930 - 13,930
16 2015 Construction Historical 2,938,646 4.165% 122,399 - 122,399
17 2015 Construction New 528,000 2.172% 11,470 - 11,470
18 2015 Environment Historical 34,430 3.985% 1,372 - 1,372
19 2015 Environment New 3,460 1.993% 69 - 69
20 2015 Float Historical - - (1,643) - (1,643)
21 FY 2015 Subtotal: 3,697,113 147,597 - 147,597
22 2016 Bonneville Power Administration Historical 98,958 7.220% 7,145 - 7,145
23 2016 Construction Historical 3,557,916 4.407% 156,794 - 156,794
24 2016 Construction New 189,512 2.530% 4,795 - 4,795
25 2016 Environment Historical 39,810 4.041% 1,609 - 1,609
26 2016 Float Historical - - (1,480) - (1,480)
27 FY 2016 Subtotal: 3,886,196 168,862 - 168,862
28 2017 Bonneville Power Administration Historical 49,456 7.211% 3,566 - 3,566
29 2017 Construction Historical 3,727,928 4.454% 166,037 - 166,037
30 2017 Construction New 196,922 2.530% 4,982 - 4,982
31 2017 Environment Historical 39,810 4.041% 1,609 - 1,609
32 2017 Float Historical - - (1,344) - (1,344)
33 FY 2017 Subtotal: 4,014,116 174,850 - 174,850
34 2018 Bonneville Power Administration Historical 32,685 7.210% 2,357 - 2,357
35 2018 Construction Historical 3,888,450 4.518% 175,666 1,373 177,039
36 2018 Construction New 203,574 2.530% 5,150 - 5,150
37 2018 Environment Historical 39,810 4.041% 1,609 - 1,609
38 2018 Float Historical - - (1,456) - (1,456)
39 FY 2018 Subtotal: 4,164,519 183,325 1,373 184,699
40 2019 Construction Historical 4,064,560 4.535% 184,319 1,916 186,235
41 2019 Construction New 208,629 2.530% 5,278 - 5,278
42 2019 Environment Historical 39,810 4.041% 1,609 - 1,609
43 2019 Float Historical - - (3,186) - (3,186)
44 FY 2019 Subtotal: 4,312,999 188,020 1,916 189,936
45 2020 Construction Historical 4,029,877 4.598% 185,299 930 186,229
46 2020 Construction New 215,471 2.530% 5,451 - 5,451
47 2020 Environment Historical 39,810 4.041% 1,609 - 1,609
48 2020 Float Historical - - (3,024) - (3,024)
49 FY 2020 Subtotal: 4,285,158 189,335 930 190,266
50 2021 Construction Historical 4,019,131 4.654% 187,068 1,615 188,683
51 2021 Construction New 221,414 2.530% 5,602 - 5,602
52 2021 Environment Historical 39,810 4.041% 1,609 - 1,609
53 2021 Float Historical - - (3,014) - (3,014)
54 FY 2021 Subtotal: 4,280,355 191,265 1,615 192,880
55 2022 Construction Historical 4,017,062 4.667% 187,469 3,513 190,982
56 2022 Construction New 226,804 2.530% 5,738 - 5,738
57 2022 Environment Historical 39,810 4.041% 1,609 - 1,609
58 2022 Float Historical - - (3,022) - (3,022)
59 FY 2022 Subtotal: 4,283,676 191,793 3,513 195,306
60 2023 Construction Historical 4,021,662 4.686% 188,445 6,432 194,877
61 2023 Construction New 232,252 2.530% 5,876 - 5,876
62 2023 Environment Historical 39,810 4.041% 1,609 - 1,609
63 2023 Float Historical - - (3,020) - (3,020)
64 FY 2023 Subtotal: 4,293,724 192,909 6,432 199,342
ERRATA BP-14-FS-BPA-08A-E02
Page 20 of 50

Table 12-6: Interest Calculation Summary ($000s) (FY 2015)
A B C D E F G HFISCAL YEAR PROJECT TYPE PRINCIPAL RATE Interest Premium Total
65 2024 Construction Historical 4,035,501 4.707% 189,948 6,360 196,308
66 2024 Construction New 236,640 2.530% 5,987 - 5,987
67 2024 Environment Historical 39,810 4.041% 1,609 - 1,609
68 2024 Float Historical - - (3,071) - (3,071)
69 FY 2024 Subtotal: 4,311,951 194,472 6,360 200,833
70 2025 Construction Historical 4,048,986 4.725% 191,324 4,754 196,078
71 2025 Construction New 241,160 2.530% 6,101 - 6,101
72 2025 Environment Historical 39,810 4.041% 1,609 - 1,609
73 2025 Float Historical - - (3,240) - (3,240)
74 FY 2025 Subtotal: 4,329,956 195,794 4,754 200,548
75 2026 Construction Historical 4,058,033 4.742% 192,418 6,625 199,044
76 2026 Construction New 244,724 2.530% 6,192 - 6,192
77 2026 Environment Historical 29,810 3.961% 1,181 - 1,181
78 2026 Float Historical - - (3,238) - (3,238)
79 FY 2026 Subtotal: 4,332,567 196,553 6,625 203,178
80 2027 Construction Historical 4,063,135 4.759% 193,358 7,370 200,728
81 2027 Construction New 248,878 2.530% 6,297 - 6,297
82 2027 Environment Historical 29,810 3.961% 1,181 - 1,181
83 2027 Float Historical - - (3,235) - (3,235)
84 FY 2027 Subtotal: 4,341,823 197,601 7,370 204,971
85 2028 Construction Historical 4,087,043 4.767% 194,825 8,186 203,011
86 2028 Construction New 253,053 2.530% 6,402 - 6,402
87 2028 Environment Historical 16,810 4.278% 719 - 719
88 2028 Float Historical - - (3,231) - (3,231)
89 FY 2028 Subtotal: 4,356,906 198,716 8,186 206,902
90 2029 Construction Historical 4,109,991 4.769% 195,986 6,475 202,461
91 2029 Construction New 256,959 2.530% 6,501 - 6,501
92 2029 Environment Historical 10,760 4.058% 437 - 437
93 2029 Float Historical - - (3,228) - (3,228)
94 FY 2029 Subtotal: 4,377,710 199,695 6,475 206,171
95 2030 Construction Historical 4,135,240 4.780% 197,674 6,663 204,337
96 2030 Construction New 261,392 2.530% 6,613 - 6,613
97 2030 Environment Historical 5,380 4.400% 237 - 237
98 2030 Float Historical - - (3,223) - (3,223)
99 FY 2030 Subtotal: 4,402,012 201,302 6,663 207,965
100 2031 Construction Historical 4,166,546 4.792% 199,663 8,062 207,725
101 2031 Construction New 265,934 2.530% 6,728 - 6,728
102 2031 Float Historical - - (3,173) - (3,173)
103 FY 2031 Subtotal: 4,432,480 203,218 8,062 211,280
104 2032 Construction Historical 4,204,702 4.794% 201,593 4,510 206,103
105 2032 Construction New 270,853 2.530% 6,853 - 6,853
106 2032 Float Historical - - (3,153) - (3,153)
107 FY 2032 Subtotal: 4,475,555 205,293 4,510 209,803
108 2033 Construction Historical 4,247,409 4.814% 204,452 3,343 207,795
109 2033 Construction New 276,407 2.530% 6,993 - 6,993
110 2033 Float Historical - - (2,302) - (2,302)
111 FY 2033 Subtotal: 4,523,816 209,143 3,343 212,486
112 2034 Construction Historical 4,387,454 4.828% 211,808 3,917 215,724
113 2034 Construction New 281,566 2.530% 7,124 - 7,124
114 2034 Float Historical - - (2,880) - (2,880)
115 FY 2034 Subtotal: 4,669,020 216,051 3,917 219,968
116 2035 Construction Historical 4,474,911 4.839% 216,535 299 216,834
117 2035 Construction New 285,629 2.530% 7,226 - 7,226
118 2035 Float Historical - - (3,159) - (3,159)
119 FY 2035 Subtotal: 4,760,540 220,603 299 220,902
120 2036 Construction Historical 4,535,343 4.863% 220,541 1,877 222,418
121 2036 Construction New 290,425 2.530% 7,348 - 7,348
122 2036 Float Historical - - (3,146) - (3,146)
123 FY 2036 Subtotal: 4,825,768 224,742 1,877 226,619
ERRATA BP-14-FS-BPA-08A-E02
Page 21 of 50

Table 12-6: Interest Calculation Summary ($000s) (FY 2015)
A B C D E F G HFISCAL YEAR PROJECT TYPE PRINCIPAL RATE Interest Premium Total
124 2037 Construction Historical 4,605,567 4.889% 225,178 326 225,504
125 2037 Construction New 295,659 2.530% 7,480 - 7,480
126 2037 Float Historical - - (1,719) - (1,719)
127 FY 2037 Subtotal: 4,901,226 230,940 326 231,266
128 2038 Construction Historical 4,835,169 4.912% 237,515 789 238,304
129 2038 Construction New 300,168 2.530% 7,594 - 7,594
130 2038 Float Historical - - (1,983) - (1,983)
131 FY 2038 Subtotal: 5,135,337 243,127 789 243,916
132 2039 Construction Historical 5,047,674 4.928% 248,759 723 249,481
133 2039 Construction New 303,420 2.530% 7,677 - 7,677
134 2039 Float Historical - - (2,945) - (2,945)
135 FY 2039 Subtotal: 5,351,094 253,491 723 254,213
136 2040 Construction Historical 5,165,752 4.960% 256,214 393 256,607
137 2040 Construction New 308,011 2.530% 7,793 - 7,793
138 2040 Float Historical - - (2,886) - (2,886)
139 FY 2040 Subtotal: 5,473,763 261,121 393 261,514
140 2041 Construction Historical 5,298,239 4.994% 264,605 320 264,925
141 2041 Construction New 313,067 2.530% 7,921 - 7,921
142 2041 Float Historical - - (2,247) - (2,247)
143 FY 2041 Subtotal: 5,611,306 270,278 320 270,598
144 2042 Construction Historical 5,508,540 5.013% 276,144 60 276,204
145 2042 Construction New 317,258 2.530% 8,027 - 8,027
146 2042 Float Historical - - (1,749) - (1,749)
147 FY 2042 Subtotal: 5,825,798 282,422 60 282,482
148 2043 Construction Historical 5,782,152 5.022% 290,408 - 290,408
149 2043 Construction New 322,295 2.530% 8,154 - 8,154
150 2043 Float Historical - - (2,565) - (2,565)
151 FY 2043 Subtotal: 6,104,447 295,997 - 295,997
152 2044 Construction Historical 5,980,300 5.044% 301,626 - 301,626
153 2044 Construction New 326,338 2.530% 8,256 - 8,256
154 2044 Float Historical - - (3,087) - (3,087)
155 FY 2044 Subtotal: 6,306,638 306,795 - 306,795
156 2045 Construction Historical 6,132,147 5.060% 310,287 3,354 313,640
157 2045 Construction New 329,605 2.530% 8,339 - 8,339
158 2045 Float Historical - - (3,196) - (3,196)
159 FY 2045 Subtotal: 6,461,752 315,430 3,354 318,783
160 2046 Construction Historical 6,283,310 5.060% 317,935 3,136 321,071
161 2046 Construction New 333,499 2.530% 8,438 - 8,438
162 2046 Float Historical - - (3,161) - (3,161)
163 FY 2046 Subtotal: 6,616,809 323,212 3,136 326,348
164 2047 Construction Historical 6,445,818 5.060% 326,158 2,890 329,049
165 2047 Construction New 338,102 2.530% 8,554 - 8,554
166 2047 Float Historical - - (3,123) - (3,123)
167 FY 2047 Subtotal: 6,783,920 331,589 2,890 334,480
168 2048 Construction Historical 6,620,936 5.060% 335,019 2,677 337,696
169 2048 Construction New 341,663 2.530% 8,644 - 8,644
170 2048 Float Historical - - (3,082) - (3,082)
171 FY 2048 Subtotal: 6,962,599 340,581 2,677 343,258
172 2049 Construction Historical 6,808,297 5.060% 344,500 2,453 346,953
173 2049 Construction New 344,541 2.530% 8,717 - 8,717
174 2049 Float Historical - - (3,038) - (3,038)
175 FY 2049 Subtotal: 7,152,838 350,178 2,453 352,632
176 2050 Construction Historical 7,007,823 5.060% 354,596 2,150 356,746
177 2050 Construction New 347,044 2.530% 8,780 - 8,780
178 2050 Float Historical - - (2,991) - (2,991)
179 FY 2050 Subtotal: 7,354,867 360,385 2,150 362,535
180 187,126,236 8,683,638 103,493 8,787,130Grand Total:
ERRATA BP-14-FS-BPA-08A-E02
Page 22 of 50

Table 12-7: Summary of Amortization ($000s) (FY 2015)
1
2
3
4
5
6
7
8
9
10
11
12
A B C D E F G H I J K L M N O P Q R S T U
2013 2014 2015 2016 2017 2018 2019 2020 2021 2022 2023 2024 2025 2026 2027 2028 2029 2030 2031
Bonneville Power Administration 56,374 8,401 93,619 49,502 16,771 32,685 - - - - - - - - - - - - -
Bonneville Power
Administration Subtotal:56,374 8,401 93,619 49,502 16,771 32,685 - - - - - - - - - - - - -
Appropriation Subtotal: 56,374 8,401 93,619 49,502 16,771 32,685 0 0 0 0 0 0 0 0 0 0 0 0 0
Construction - 73,050 - 19,500 36,400 27,464 243,312 226,217 223,483 222,204 218,412 223,155 232,113 239,622 224,970 230,105 231,711 230,086 227,779
Environment - - - - - - - - - - - - 10,000 - 13,000 6,050 5,380 5,380 -
BPA Borrowing Subtotal: 0 73,050 0 19,500 36,400 27,464 243,312 226,217 223,483 222,204 218,412 223,155 242,113 239,622 237,970 236,155 237,091 235,466 227,779
Discounts - - - - - - - - - - - - - - - - - - -
Premiums - - - - - - - - - - - - - - - - - - -
Make Whole Call Subtotal: 0 0 0 0 0 0 0 0 0 0 0 0 0 0 0 0 0 0 0
Treasury Subtotal: 0 73,050 0 19,500 36,400 27,464 243,312 226,217 223,483 222,204 218,412 223,155 242,113 239,622 237,970 236,155 237,091 235,466 227,779
GRAND TOTAL: 56,374 81,451 93,619 69,002 53,171 60,149 243,312 226,217 223,483 222,204 218,412 223,155 242,113 239,622 237,970 236,155 237,091 235,466 227,779
Appropriation
Treasury
ERRATA BP-14-FS-BPA-08A-E02
Page 23 of 50

Table 12-7: Summary of Amortization ($000s) (FY 2015)
1
2
3
4
5
6
7
8
9
10
11
12
A B
Bonneville Power Administration
Bonneville Power
Administration Subtotal:
Appropriation Subtotal:
Construction
Environment
BPA Borrowing Subtotal:
Discounts
Premiums
Make Whole Call Subtotal:
Treasury Subtotal:
GRAND TOTAL:
Appropriation
Treasury
V W X Y Z AA AB AC AD AE AF AG AH AI AJ AK AL AM AN AO
2032 2033 2034 2035 2036 2037 2038 2039 2040 2041 2042 2043 2044 2045 2046 2047 2048 2049 2050 TOTAL
- - - - - - - - - - - - - - - - - - - 257,352
- - - - - - - - - - - - - - - - - - - 257,352
0 0 0 0 0 0 0 0 0 0 0 0 0 0 0 0 0 0 0 257,352
228,146 136,362 194,109 225,197 220,200 66,057 87,663 185,342 175,525 102,766 43,646 124,147 174,491 178,442 170,991 162,984 154,302 145,014 135,183 6,040,150
- - - - - - - - - - - - - - - - - - - 39,810
228,146 136,362 194,109 225,197 220,200 66,057 87,663 185,342 175,525 102,766 43,646 124,147 174,491 178,442 170,991 162,984 154,302 145,014 135,183 6,079,960
- - - - - - - - - - - - - - - - - - - -
- - - - - - - - - - - - - - - - - - - -
0 0 0 0 0 0 0 0 0 0 0 0 0 0 0 0 0 0 0 0
228,146 136,362 194,109 225,197 220,200 66,057 87,663 185,342 175,525 102,766 43,646 124,147 174,491 178,442 170,991 162,984 154,302 145,014 135,183 6,079,960
228,146 136,362 194,109 225,197 220,200 66,057 87,663 185,342 175,525 102,766 43,646 124,147 174,491 178,442 170,991 162,984 154,302 145,014 135,183 6,337,312
ERRATA BP-14-FS-BPA-08A-E02
Page 24 of 50

Table 12-8: Application of Amortization ($000s) (FY 2015)
A B C D E F G H I J
YEAR PROJECT
APPROPRIATION TYPE
IN SERVICE DATE PRINCIPAL BALANCE RATE ROLLOVER
AMOUNT
AMORTIZED
1 FY 2013 Bonneville Power Administration BPA 1973 2018 21,656 5,041 7.280% No 5,041
2 FY 2013 Bonneville Power Administration BPA 1973 2018 33,788 15,769 7.280% No 15,769
3 FY 2013 Bonneville Power Administration BPA 1974 2019 12,079 12,079 7.270% No 5,191
4 FY 2013 Bonneville Power Administration BPA 1974 2019 12,563 12,563 7.270% No 12,563
5 FY 2013 Bonneville Power Administration BPA 1974 2019 20,984 17,810 7.270% No 17,810
6 FY 2013 Subtotal: - - - 101,070 63,262 - - 56,374
7 FY 2014 Construction - 1999 2014 59,050 59,050 5.900% No 59,050
8 FY 2014 Construction - 2009 2014 14,000 14,000 2.746% No 14,000
9 FY 2014 Bonneville Power Administration BPA 1974 2019 12,079 6,888 7.270% No 6,888
10 FY 2014 Bonneville Power Administration BPA 1975 2020 11,742 11,742 7.250% No 1,513
11 FY 2014 Subtotal: - - - 96,871 91,680 - - 81,451
12 FY 2015 Bonneville Power Administration BPA 1975 2020 11,742 10,229 7.250% No 10,229
13 FY 2015 Bonneville Power Administration BPA 1975 2020 17,158 17,158 7.250% No 17,158
14 FY 2015 Bonneville Power Administration BPA 1975 2020 21,916 21,916 7.250% No 21,916
15 FY 2015 Bonneville Power Administration BPA 1975 2020 32,026 32,026 7.250% No 32,026
16 FY 2015 Bonneville Power Administration BPA 1976 2021 2,212 2,212 7.230% No 2,212
17 FY 2015 Bonneville Power Administration BPA 1976 2021 61,025 61,025 7.230% No 10,078
18 FY 2015 Subtotal: - - - 146,079 144,566 - - 93,619
19 FY 2016 Construction - 2011 2016 13,000 13,000 1.957% No 13,000
20 FY 2016 Construction - 2011 2016 6,500 6,500 1.423% No 6,500
21 FY 2016 Bonneville Power Administration BPA 1976 2021 61,025 50,947 7.230% No 49,502
22 FY 2016 Subtotal: - - - 80,525 70,447 - - 69,002
23 FY 2017 Construction - 2012 2017 36,400 36,400 0.920% No 36,400
24 FY 2017 Bonneville Power Administration BPA 1976 2021 61,025 1,445 7.230% No 1,445
25 FY 2017 Bonneville Power Administration BPA 1977 2022 4,981 4,981 7.210% No 4,981
26 FY 2017 Bonneville Power Administration BPA 1977 2022 33,702 33,702 7.210% No 10,345
27 FY 2017 Subtotal: - - - 136,108 76,528 - - 53,171
28 FY 2018 Bonneville Power Administration BPA 1977 2022 3,948 3,948 7.210% No 3,948
29 FY 2018 Bonneville Power Administration BPA 1977 2022 5,380 5,380 7.210% No 5,380
30 FY 2018 Bonneville Power Administration BPA 1977 2022 33,702 23,357 7.210% No 23,357
31 FY 2018 Construction - 2013 2043 15,000 15,000 6.000% No 9,464
32 FY 2018 Construction - 2013 2043 18,000 18,000 6.000% No 18,000
33 FY 2018 Subtotal: - - - 76,030 65,685 - - 60,149
34 FY 2019 Construction - 2009 2019 46,940 46,940 4.026% No 46,940
35 FY 2019 Construction - 2009 2019 35,000 35,000 3.699% No 35,000
36 FY 2019 Construction - 2010 2019 13,000 13,000 4.069% No 13,000
37 FY 2019 Construction - 2010 2019 23,000 23,000 3.719% No 23,000
38 FY 2019 Construction - 2010 2019 30,000 30,000 3.714% No 30,000
39 FY 2019 Construction - 2010 2019 15,000 15,000 3.533% No 15,000
40 FY 2019 Construction - 2013 2019 10,500 10,500 1.800% No 10,500
41 FY 2019 Construction - 2013 2019 12,180 13,650 1.800% No 13,650
42 FY 2019 Construction - 2013 2019 8,700 8,700 1.100% No 8,700
43 FY 2019 Construction - 1998 2028 112,300 112,300 5.850% No 11,986
44 FY 2019 Construction - 2013 2043 15,000 5,536 6.000% No 5,536
45 FY 2019 Construction - 2013 2043 30,000 30,000 6.000% No 30,000
46 FY 2019 Subtotal: - - - 351,620 343,626 - - 243,312
47 FY 2020 Construction - 2009 2020 50,000 50,000 3.830% No 50,000
48 FY 2020 Construction - 2010 2020 43,000 43,000 3.842% No 43,000
49 FY 2020 Construction - 2010 2020 50,000 50,000 3.118% No 50,000
50 FY 2020 Construction - 2014 2020 5,260 5,260 2.200% No 5,260
51 FY 2020 Construction - 2014 2020 5,640 5,640 2.200% No 5,640
52 FY 2020 Construction - 2014 2020 6,140 6,140 2.200% No 6,140
53 FY 2020 Construction - 2014 2020 6,540 6,540 2.200% No 6,540
54 FY 2020 Construction - 1998 2028 112,300 100,314 5.850% No 59,637
55 FY 2020 Subtotal: - - - 278,880 266,894 - - 226,217
56 FY 2021 Construction - 2010 2021 15,000 15,000 4.188% No 15,000
ERRATA BP-14-FS-BPA-08A-E02
Page 25 of 50

Table 12-8: Application of Amortization ($000s) (FY 2015)
A B C D E F G H I J
YEAR PROJECT
APPROPRIATION TYPE
IN SERVICE DATE PRINCIPAL BALANCE RATE ROLLOVER
AMOUNT
AMORTIZED
57 FY 2021 Construction - 2010 2021 22,000 22,000 4.094% No 22,000
58 FY 2021 Construction - 2010 2021 22,000 22,000 3.694% No 22,000
59 FY 2021 Construction - 2010 2021 22,000 22,000 3.374% No 22,000
60 FY 2021 Construction - 2015 2021 5,390 5,390 3.300% No 5,390
61 FY 2021 Construction - 2015 2021 5,780 5,780 3.300% No 5,780
62 FY 2021 Construction - 2015 2021 6,290 6,290 3.300% No 6,290
63 FY 2021 Construction - 2015 2021 6,700 6,700 3.300% No 6,700
64 FY 2021 Construction - 1998 2028 112,300 40,677 5.850% No 40,677
65 FY 2021 Construction - 1998 2028 106,500 106,500 5.850% No 77,646
66 FY 2021 Subtotal: - - - 323,960 252,337 - - 223,483
67 FY 2022 Construction - 2009 2022 35,000 35,000 4.253% No 35,000
68 FY 2022 Construction - 2009 2022 20,000 20,000 4.200% No 20,000
69 FY 2022 Construction - 2010 2022 30,000 30,000 3.372% No 30,000
70 FY 2022 Construction - 2010 2022 20,000 20,000 3.029% No 20,000
71 FY 2022 Construction - 1998 2028 106,500 28,854 5.850% No 28,854
72 FY 2022 Construction - 2009 2039 35,000 35,000 5.192% No 33,350
73 FY 2022 Construction - 2013 2043 55,000 55,000 5.700% No 55,000
74 FY 2022 Subtotal: - - - 301,500 223,854 - - 222,204
75 FY 2023 Construction - 2010 2023 46,000 46,000 3.161% No 46,000
76 FY 2023 Construction - 2009 2039 35,000 1,650 5.192% No 1,650
77 FY 2023 Construction - 2015 2045 51,130 51,130 5.100% No 9,493
78 FY 2023 Construction - 2015 2045 76,700 76,700 5.100% No 76,700
79 FY 2023 Construction - 2015 2045 84,570 84,570 5.100% No 84,570
80 FY 2023 Subtotal: - - - 293,400 260,050 - - 218,412
81 FY 2024 Construction - 2012 2024 45,000 45,000 3.360% No 45,000
82 FY 2024 Construction - 2015 2045 51,130 41,637 5.100% No 41,637
83 FY 2024 Construction - 2015 2045 50,940 50,940 5.100% No 50,940
84 FY 2024 Construction - 2015 2045 53,690 53,690 5.100% No 31,888
85 FY 2024 Construction - 2015 2045 53,690 53,690 5.100% No 53,690
86 FY 2024 Subtotal: - - - 254,450 244,957 - - 223,155
87 FY 2025 Construction - 2010 2025 15,000 15,000 4.310% Yes 15,000
88 FY 2025 Construction - 2012 2025 14,300 14,300 4.310% Yes 14,300
89 FY 2025 Construction - 2012 2025 26,000 26,000 4.310% Yes 26,000
90 FY 2025 Construction - 2012 2025 37,000 37,000 4.310% Yes 37,000
91 FY 2025 Environment - 2010 2025 10,000 10,000 4.279% No 10,000
92 FY 2025 Construction - 2015 2045 53,690 21,802 5.100% No 21,802
93 FY 2025 Construction - 2015 2045 44,050 44,050 5.100% No 44,050
94 FY 2025 Construction - 2015 2045 46,610 46,610 5.100% No 26,171
95 FY 2025 Construction - 2015 2045 47,790 47,790 5.100% No 47,790
96 FY 2025 Subtotal: - - - 294,440 262,552 - - 242,113
97 FY 2026 Construction - 2011 2026 45,000 45,000 3.450% No 45,000
98 FY 2026 Construction - 2015 2045 19,270 19,270 5.100% No 19,270
99 FY 2026 Construction - 2015 2045 46,610 20,439 5.100% No 20,439
100 FY 2026 Construction - 2015 2045 27,530 27,530 5.100% No 27,530
101 FY 2026 Construction - 2015 2045 39,140 39,140 5.100% No 39,140
102 FY 2026 Construction - 2016 2051 189,512 189,512 5.060% No 88,243
103 FY 2026 Subtotal: - - - 367,062 340,891 - - 239,622
104 FY 2027 Construction - 2012 2027 17,000 17,000 3.550% No 17,000
105 FY 2027 Environment - 2012 2027 13,000 13,000 3.550% No 13,000
106 FY 2027 Construction - 2016 2051 189,512 101,269 5.060% No 101,269
107 FY 2027 Construction - 2017 2052 196,922 196,922 5.060% No 106,701
108 FY 2027 Subtotal: - - - 416,434 328,191 - - 237,970
109 FY 2028 Environment - 2013 2028 5,000 5,000 5.000% No 5,000
110 FY 2028 Environment - 2013 2028 510 510 3.100% No 510
111 FY 2028 Environment - 2013 2028 540 540 3.100% No 540
112 FY 2028 Construction - 2017 2052 196,922 90,221 5.060% No 90,221
ERRATA BP-14-FS-BPA-08A-E02
Page 26 of 50

Table 12-8: Application of Amortization ($000s) (FY 2015)
A B C D E F G H I J
YEAR PROJECT
APPROPRIATION TYPE
IN SERVICE DATE PRINCIPAL BALANCE RATE ROLLOVER
AMOUNT
AMORTIZED
113 FY 2028 Construction - 2018 2053 203,574 203,574 5.060% No 139,884
114 FY 2028 Subtotal: - - - 406,546 299,845 - - 236,155
115 FY 2029 Construction - 2011 2029 50,000 50,000 4.238% No 50,000
116 FY 2029 Environment - 2014 2029 780 780 4.400% No 780
117 FY 2029 Environment - 2014 2029 1,250 1,250 3.600% No 1,250
118 FY 2029 Environment - 2014 2029 1,430 1,430 3.600% No 1,430
119 FY 2029 Environment - 2014 2029 1,920 1,920 3.600% No 1,920
120 FY 2029 Construction - 2018 2053 203,574 63,690 5.060% No 63,690
121 FY 2029 Construction - 2019 2054 208,629 208,629 5.060% No 118,020
122 FY 2029 Subtotal: - - - 467,583 327,699 - - 237,091
123 FY 2030 Construction - 2013 2030 42,110 42,110 4.100% No 42,110
124 FY 2030 Environment - 2015 2030 780 780 4.400% No 780
125 FY 2030 Environment - 2015 2030 1,250 1,250 4.400% No 1,250
126 FY 2030 Environment - 2015 2030 1,430 1,430 4.400% No 1,430
127 FY 2030 Environment - 2015 2030 1,920 1,920 4.400% No 1,920
128 FY 2030 Construction - 2019 2054 208,629 90,609 5.060% No 90,609
129 FY 2030 Construction - 2020 2055 215,471 215,471 5.060% No 97,367
130 FY 2030 Subtotal: - - - 471,590 353,570 - - 235,466
131 FY 2031 Construction - 2020 2055 215,471 118,104 5.060% No 118,104
132 FY 2031 Construction - 2021 2056 221,414 221,414 5.060% No 109,674
133 FY 2031 Subtotal: - - - 436,885 339,518 - - 227,779
134 FY 2032 Construction - 2011 2032 98,900 98,900 4.355% No 98,900
135 FY 2032 Construction - 2021 2056 221,414 111,740 5.060% No 111,740
136 FY 2032 Construction - 2022 2057 226,804 226,804 5.060% No 17,506
137 FY 2032 Subtotal: - - - 547,118 437,444 - - 228,146
138 FY 2033 Construction - 2011 2033 40,000 40,000 4.386% No 40,000
139 FY 2033 Construction - 2022 2057 226,804 209,298 5.060% No 96,362
140 FY 2033 Subtotal: - - - 266,804 249,298 - - 136,362
141 FY 2034 Construction - 2011 2034 40,000 40,000 4.416% No 40,000
142 FY 2034 Construction - 2011 2036 50,000 50,000 4.952% No 41,232
143 FY 2034 Construction - 2022 2057 226,804 112,936 5.060% No 112,877
144 FY 2034 Subtotal: - - - 316,804 202,936 - - 194,109
145 FY 2035 Construction - 2011 2035 40,000 40,000 4.794% No 40,000
146 FY 2035 Construction - 2011 2035 40,000 40,000 4.446% No 40,000
147 FY 2035 Construction - 2011 2035 40,000 40,000 4.446% No 40,000
148 FY 2035 Construction - 2011 2035 45,000 45,000 4.446% No 45,000
149 FY 2035 Construction - 2011 2036 50,000 8,768 4.952% No 8,768
150 FY 2035 Construction - 2011 2038 55,000 55,000 4.935% No 51,429
151 FY 2035 Subtotal: - - - 270,000 228,768 - - 225,197
152 FY 2036 Construction - 2011 2036 50,000 50,000 4.629% No 50,000
153 FY 2036 Construction - 2011 2038 55,000 3,571 4.935% No 3,571
154 FY 2036 Construction - 2011 2040 25,000 25,000 4.775% No 25,000
155 FY 2036 Construction - 2014 2044 79,760 79,760 4.500% No 53,689
156 FY 2036 Construction - 2014 2044 87,940 87,940 4.500% No 87,940
157 FY 2036 Subtotal: - - - 297,700 246,271 - - 220,200
158 FY 2037 Construction - 2012 2037 35,000 35,000 3.503% No 35,000
159 FY 2037 Construction - 2014 2044 79,760 26,071 4.500% No 26,071
160 FY 2037 Construction - 2014 2044 53,170 53,170 4.500% No 4,986
161 FY 2037 Subtotal: - - - 167,930 114,241 - - 66,057
162 FY 2038 Construction - 2014 2044 53,170 48,184 4.500% No 48,184
163 FY 2038 Construction - 2014 2044 55,830 55,830 4.500% No 39,479
164 FY 2038 Subtotal: - - - 109,000 104,014 - - 87,663
165 FY 2039 Construction - 2011 2039 50,000 50,000 4.295% No 50,000
166 FY 2039 Construction - 2012 2039 39,000 39,000 3.627% No 39,000
167 FY 2039 Construction - 2014 2044 55,830 16,351 4.500% No 16,351
168 FY 2039 Construction - 2014 2044 52,970 52,970 4.500% No 52,970
ERRATA BP-14-FS-BPA-08A-E02
Page 27 of 50

Table 12-8: Application of Amortization ($000s) (FY 2015)
A B C D E F G H I J
YEAR PROJECT
APPROPRIATION TYPE
IN SERVICE DATE PRINCIPAL BALANCE RATE ROLLOVER
AMOUNT
AMORTIZED
169 FY 2039 Construction - 2014 2044 55,830 55,830 4.500% No 27,021
170 FY 2039 Subtotal: - - - 253,630 214,151 - - 185,342
171 FY 2040 Construction - 2011 2040 35,000 35,000 3.796% No 35,000
172 FY 2040 Construction - 2012 2040 30,000 30,000 3.890% No 30,000
173 FY 2040 Construction - 2012 2040 45,000 45,000 3.890% No 45,000
174 FY 2040 Construction - 2014 2044 55,830 28,809 4.500% No 28,809
175 FY 2040 Construction - 2014 2044 45,810 45,810 4.500% No 36,716
176 FY 2040 Subtotal: - - - 211,640 184,619 - - 175,525
177 FY 2041 Construction - 2013 2043 60,016 60,016 4.100% No 14,293
178 FY 2041 Construction - 2013 2043 66,330 66,330 4.100% No 66,330
179 FY 2041 Construction - 2014 2044 45,810 9,094 4.500% No 9,094
180 FY 2041 Construction - 2014 2044 49,700 49,700 4.500% No 13,049
181 FY 2041 Subtotal: - - - 221,856 185,140 - - 102,766
182 FY 2042 Construction - 2013 2043 60,016 45,723 4.100% No 43,646
183 FY 2042 Subtotal: - - - 60,016 45,723 - - 43,646
184 FY 2043 Construction - 2013 2043 60,016 2,077 4.100% No 2,077
185 FY 2043 Construction - 2013 2043 39,950 39,950 4.100% No 39,950
186 FY 2043 Construction - 2013 2043 40,010 40,010 4.100% No 40,010
187 FY 2043 Construction - 2013 2043 42,110 42,110 4.100% No 42,110
188 FY 2043 Subtotal: - - - 182,086 124,147 - - 124,147
189 FY 2044 Construction - 2014 2044 20,040 20,040 4.500% No 20,040
190 FY 2044 Construction - 2014 2044 28,630 28,630 4.500% No 28,630
191 FY 2044 Construction - 2014 2044 49,700 36,651 4.500% No 36,651
192 FY 2044 Construction - 2014 2044 40,700 40,700 4.500% No 40,700
193 FY 2044 Construction - 2014 2044 48,470 48,470 4.500% No 48,470
194 FY 2044 Subtotal: - - - 187,540 174,491 - - 174,491
195 FY 2045 Construction - 2022 2057 226,804 59 5.060% No 59
196 FY 2045 Construction - 2023 2058 232,252 232,252 5.060% No 178,383
197 FY 2045 Subtotal: - - - 459,056 232,311 - - 178,442
198 FY 2046 Construction - 2023 2058 232,252 53,869 5.060% No 53,869
199 FY 2046 Construction - 2024 2059 236,640 236,640 5.060% No 117,122
200 FY 2046 Subtotal: - - - 468,892 290,509 - - 170,991
201 FY 2047 Construction - 2024 2059 236,640 119,518 5.060% No 119,518
202 FY 2047 Construction - 2025 2060 241,160 241,160 5.060% No 43,466
203 FY 2047 Subtotal: - - - 477,800 360,678 - - 162,984
204 FY 2048 Construction - 2025 2060 241,160 197,694 5.060% No 154,302
205 FY 2048 Subtotal: - - - 241,160 197,694 - - 154,302
206 FY 2049 Construction - 2025 2060 241,160 43,392 5.060% No 43,392
207 FY 2049 Construction - 2026 2061 244,724 244,724 5.060% No 101,623
208 FY 2049 Subtotal: - - - 485,884 288,116 - - 145,014
209 FY 2050 Construction - 2026 2061 244,724 143,101 5.060% No 135,183
210 FY 2050 Subtotal: - - - 244,724 143,101 - - 135,183
211 FY 2051 Construction - 2026 2061 244,724 7,918 5.060% No 7,918
212 FY 2051 Construction - 2027 2062 248,878 248,878 5.060% No 114,376
213 FY 2051 Subtotal: - - - 493,602 256,796 - - 122,293
214 FY 2052 Construction - 2027 2062 248,878 134,502 5.060% No 128,585
215 FY 2052 Subtotal: - - - 248,878 134,502 - - 128,585
216 FY 2053 Construction - 2027 2062 248,878 5,917 5.060% No 5,917
217 FY 2053 Construction - 2028 2063 253,053 253,053 5.060% No 129,120
218 FY 2053 Subtotal: - - - 501,931 258,970 - - 135,037
219 FY 2054 Construction - 2028 2063 253,053 123,933 5.060% No 123,933
220 FY 2054 Construction - 2029 2064 256,959 256,959 5.060% No 18,040
221 FY 2054 Subtotal: - - - 510,012 380,892 - - 141,973
222 FY 2055 Construction - 2029 2064 256,959 238,919 5.060% No 149,123
223 FY 2055 Subtotal: - - - 256,959 238,919 - - 149,123
224 FY 2056 Construction - 2029 2064 256,959 89,796 5.060% No 89,796
ERRATA BP-14-FS-BPA-08A-E02
Page 28 of 50

Table 12-8: Application of Amortization ($000s) (FY 2015)
A B C D E F G H I J
YEAR PROJECT
APPROPRIATION TYPE
IN SERVICE DATE PRINCIPAL BALANCE RATE ROLLOVER
AMOUNT
AMORTIZED
225 FY 2056 Construction - 2030 2065 261,392 261,392 5.060% No 66,939
226 FY 2056 Subtotal: - - - 518,351 351,188 - - 156,735
227 FY 2057 Construction - 2030 2065 261,392 194,453 5.060% No 164,708
228 FY 2057 Subtotal: - - - 261,392 194,453 - - 164,708
229 FY 2058 Construction - 2030 2065 261,392 29,745 5.060% No 29,745
230 FY 2058 Construction - 2031 2066 265,934 265,934 5.060% No 143,283
231 FY 2058 Subtotal: - - - 527,326 295,679 - - 173,028
232 FY 2059 Construction - 2031 2066 265,934 122,651 5.060% No 122,651
233 FY 2059 Construction - 2032 2067 270,853 270,853 5.060% No 59,205
234 FY 2059 Subtotal: - - - 536,787 393,504 - - 181,856
235 FY 2060 Construction - 2032 2067 270,853 211,648 5.060% No 191,094
236 FY 2060 Subtotal: - - - 270,853 211,648 - - 191,094
237 FY 2061 Construction - 2032 2067 270,853 20,554 5.060% No 20,554
238 FY 2061 Construction - 2033 2068 276,407 276,407 5.060% No 180,186
239 FY 2061 Subtotal: - - - 547,260 296,961 - - 200,741
240 FY 2062 Construction - 2033 2068 276,407 96,221 5.060% No 96,221
241 FY 2062 Construction - 2034 2069 281,566 281,566 5.060% No 114,731
242 FY 2062 Subtotal: - - - 557,973 377,787 - - 210,952
243 FY 2063 Construction - 2034 2069 281,566 166,835 5.060% No 166,835
244 FY 2063 Construction - 2035 2070 285,629 285,629 5.060% No 54,835
245 FY 2063 Subtotal: - - - 567,195 452,464 - - 221,670
246 FY 2064 Construction - 2035 2070 285,629 230,794 5.060% No 230,794
247 FY 2064 Construction - 2036 2071 290,425 290,425 5.060% No 2,124
248 FY 2064 Subtotal: - - - 576,054 521,219 - - 232,918
249 FY 2065 Construction - 2036 2071 290,425 288,301 5.060% No 244,660
250 FY 2065 Subtotal: - - - 290,425 288,301 - - 244,660
251 FY 2066 Construction - 2036 2071 290,425 43,641 5.060% No 43,641
252 FY 2066 Construction - 2037 2072 295,659 295,659 5.060% No 213,413
253 FY 2066 Subtotal: - - - 586,084 339,300 - - 257,054
254 FY 2067 Construction - 2037 2072 295,659 82,246 5.060% No 82,246
255 FY 2067 Construction - 2038 2073 300,168 300,168 5.060% No 187,818
256 FY 2067 Subtotal: - - - 595,827 382,414 - - 270,065
257 FY 2068 Construction - 2038 2073 300,168 112,350 5.060% No 112,350
258 FY 2068 Construction - 2039 2074 303,420 303,420 5.060% No 171,369
259 FY 2068 Subtotal: - - - 603,588 415,770 - - 283,719
260 FY 2069 Construction - 2039 2074 303,420 132,051 5.060% No 132,051
261 FY 2069 Construction - 2040 2075 308,011 308,011 5.060% No 165,996
262 FY 2069 Subtotal: - - - 611,431 440,062 - - 298,047
263 FY 2070 Construction - 2040 2075 308,011 142,015 5.060% No 142,015
264 FY 2070 Construction - 2041 2076 313,067 313,067 5.060% No 171,068
265 FY 2070 Subtotal: - - - 621,078 455,082 - - 313,083
266 FY 2071 Construction - 2041 2076 313,067 141,999 5.060% No 141,999
267 FY 2071 Construction - 2042 2077 317,258 317,258 5.060% No 186,864
268 FY 2071 Subtotal: - - - 630,325 459,257 - - 328,863
269 FY 2072 Construction - 2042 2077 317,258 130,394 5.060% No 130,394
270 FY 2072 Construction - 2043 2078 322,295 322,295 5.060% No 215,027
271 FY 2072 Subtotal: - - - 639,553 452,689 - - 345,421
272 FY 2073 Construction - 2043 2078 322,295 107,268 5.060% No 107,268
273 FY 2073 Construction - 2044 2079 326,338 326,338 5.060% No 255,529
274 FY 2073 Subtotal: - - - 648,633 433,606 - - 362,797
275 FY 2074 Construction - 2044 2079 326,338 70,809 5.060% No 70,809
276 FY 2074 Construction - 2045 2080 329,605 329,605 5.060% No 310,221
277 FY 2074 Subtotal: - - - 655,943 400,414 - - 381,030
278 FY 2075 Construction - 2045 2080 329,605 19,384 5.060% No 19,384
279 FY 2075 Construction - 2046 2081 333,499 333,499 5.060% No 333,499
280 FY 2075 Construction - 2047 2082 338,102 338,102 5.060% No 47,210
281 FY 2075 Subtotal: - - - 1,001,206 690,985 - - 400,093
282 FY 2076 Construction - 2047 2082 338,102 290,892 5.060% No 290,892
283 FY 2076 Construction - 2048 2083 341,663 341,663 5.060% No 129,220
284 FY 2076 Subtotal: - - - 679,765 632,555 - - 420,112
285 FY 2077 Construction - 2048 2083 341,663 212,443 5.060% No 212,443
286 FY 2077 Construction - 2049 2084 344,541 344,541 5.060% No 228,701
287 FY 2077 Subtotal: - - - 686,204 556,984 - - 441,144
288 FY 2078 Construction - 2049 2084 344,541 115,840 5.060% No 115,840
289 FY 2078 Construction - 2050 2085 347,044 347,044 5.060% No 347,044
290 FY 2078 Subtotal: - - - 691,585 462,884 - - 462,884
291Grand
Total:- - - 26,086,893 19,155,089 - - 13,556,996
ERRATA BP-14-FS-BPA-08A-E02
Page 29 of 50

This page intentionally left blank.
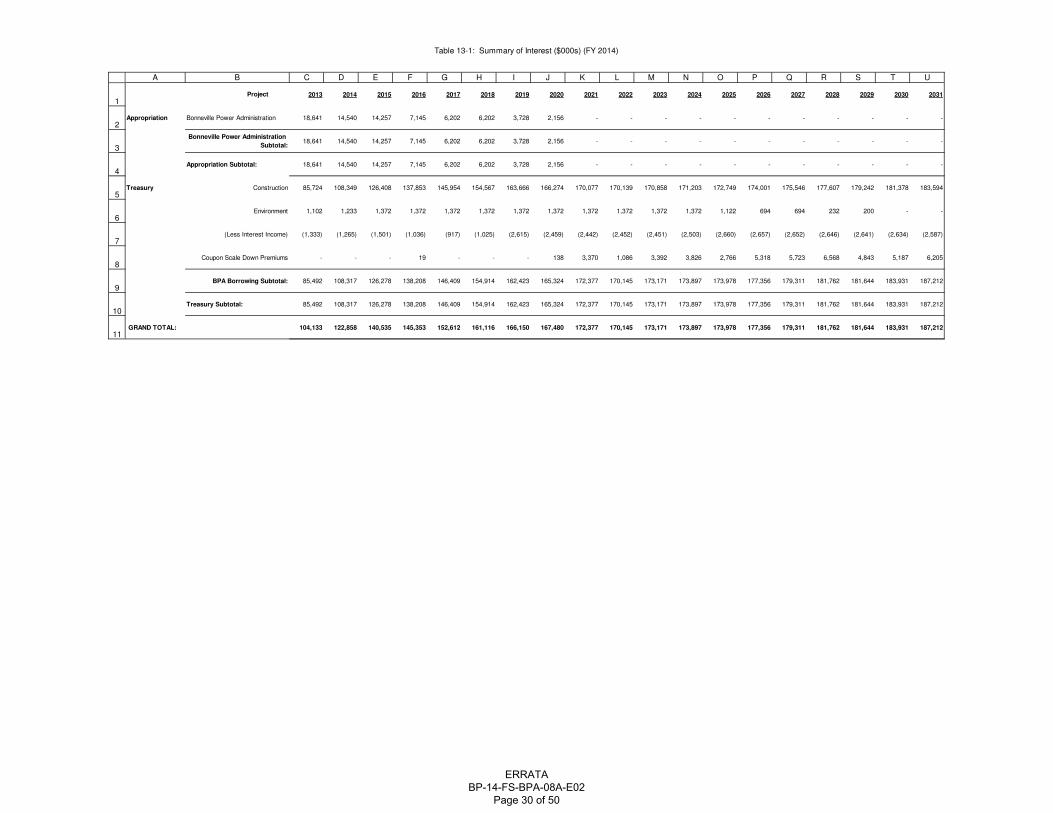
Table 13-1: Summary of Interest ($000s) (FY 2014)
1
2
3
4
5
6
7
8
9
10
11
A B C D E F G H I J K L M N O P Q R S T U
2013 2014 2015 2016 2017 2018 2019 2020 2021 2022 2023 2024 2025 2026 2027 2028 2029 2030 2031
Appropriation Bonneville Power Administration 18,641 14,540 14,257 7,145 6,202 6,202 3,728 2,156 - - - - - - - - - - -
Bonneville Power Administration
Subtotal:18,641 14,540 14,257 7,145 6,202 6,202 3,728 2,156 - - - - - - - - - - -
Appropriation Subtotal: 18,641 14,540 14,257 7,145 6,202 6,202 3,728 2,156 - - - - - - - - - - -
Treasury Construction 85,724 108,349 126,408 137,853 145,954 154,567 163,666 166,274 170,077 170,139 170,858 171,203 172,749 174,001 175,546 177,607 179,242 181,378 183,594
Environment 1,102 1,233 1,372 1,372 1,372 1,372 1,372 1,372 1,372 1,372 1,372 1,372 1,122 694 694 232 200 - -
(Less Interest Income) (1,333) (1,265) (1,501) (1,036) (917) (1,025) (2,615) (2,459) (2,442) (2,452) (2,451) (2,503) (2,660) (2,657) (2,652) (2,646) (2,641) (2,634) (2,587)
Coupon Scale Down Premiums - - - 19 - - - 138 3,370 1,086 3,392 3,826 2,766 5,318 5,723 6,568 4,843 5,187 6,205
BPA Borrowing Subtotal: 85,492 108,317 126,278 138,208 146,409 154,914 162,423 165,324 172,377 170,145 173,171 173,897 173,978 177,356 179,311 181,762 181,644 183,931 187,212
Treasury Subtotal: 85,492 108,317 126,278 138,208 146,409 154,914 162,423 165,324 172,377 170,145 173,171 173,897 173,978 177,356 179,311 181,762 181,644 183,931 187,212
GRAND TOTAL: 104,133 122,858 140,535 145,353 152,612 161,116 166,150 167,480 172,377 170,145 173,171 173,897 173,978 177,356 179,311 181,762 181,644 183,931 187,212
Project
ERRATA BP-14-FS-BPA-08A-E02
Page 30 of 50
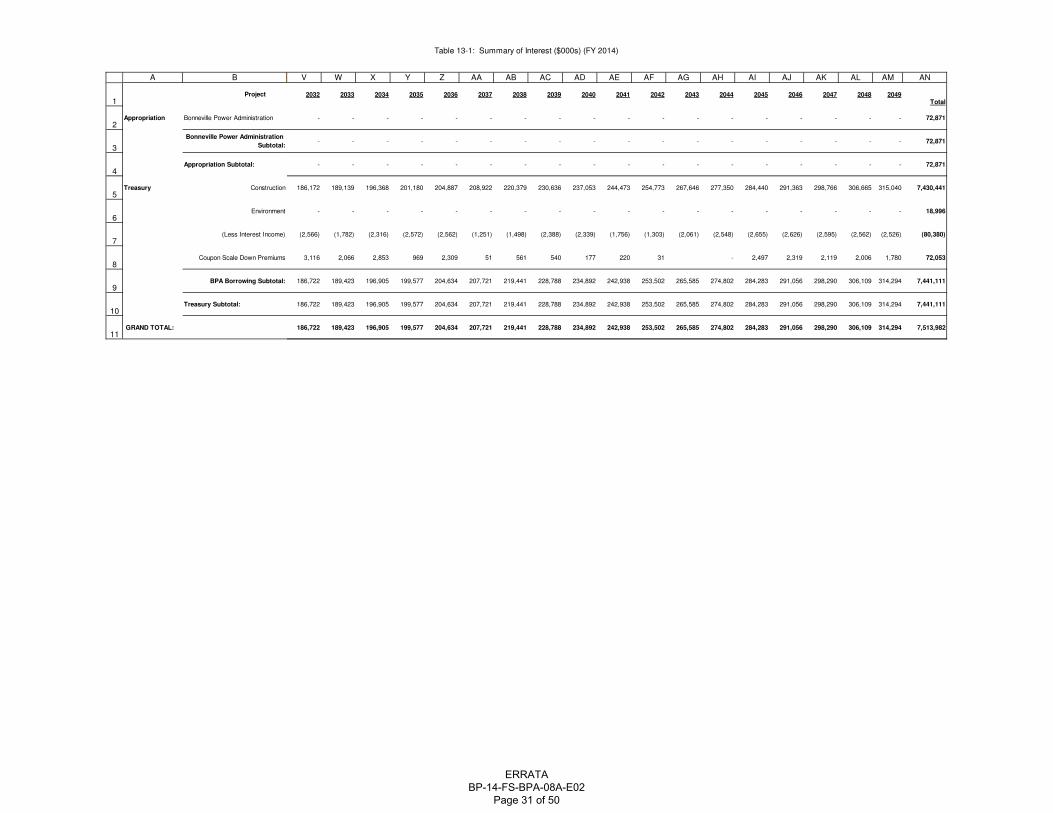
Table 13-1: Summary of Interest ($000s) (FY 2014)
1
2
3
4
5
6
7
8
9
10
11
A B
Appropriation Bonneville Power Administration
Bonneville Power Administration
Subtotal:
Appropriation Subtotal:
Treasury Construction
Environment
(Less Interest Income)
Coupon Scale Down Premiums
BPA Borrowing Subtotal:
Treasury Subtotal:
GRAND TOTAL:
Project
V W X Y Z AA AB AC AD AE AF AG AH AI AJ AK AL AM AN
2032 2033 2034 2035 2036 2037 2038 2039 2040 2041 2042 2043 2044 2045 2046 2047 2048 2049Total
- - - - - - - - - - - - - - - - - - 72,871
- - - - - - - - - - - - - - - - - - 72,871
- - - - - - - - - - - - - - - - - - 72,871
186,172 189,139 196,368 201,180 204,887 208,922 220,379 230,636 237,053 244,473 254,773 267,646 277,350 284,440 291,363 298,766 306,665 315,040 7,430,441
- - - - - - - - - - - - - - - - - - 18,996
(2,566) (1,782) (2,316) (2,572) (2,562) (1,251) (1,498) (2,388) (2,339) (1,756) (1,303) (2,061) (2,548) (2,655) (2,626) (2,595) (2,562) (2,526) (80,380)
3,116 2,066 2,853 969 2,309 51 561 540 177 220 31 - 2,497 2,319 2,119 2,006 1,780 72,053
186,722 189,423 196,905 199,577 204,634 207,721 219,441 228,788 234,892 242,938 253,502 265,585 274,802 284,283 291,056 298,290 306,109 314,294 7,441,111
186,722 189,423 196,905 199,577 204,634 207,721 219,441 228,788 234,892 242,938 253,502 265,585 274,802 284,283 291,056 298,290 306,109 314,294 7,441,111
186,722 189,423 196,905 199,577 204,634 207,721 219,441 228,788 234,892 242,938 253,502 265,585 274,802 284,283 291,056 298,290 306,109 314,294 7,513,982
ERRATA BP-14-FS-BPA-08A-E02
Page 31 of 50

Table 13-2: Interest Calculation Summary ($000s) (FY 2014)
A B C D E F G H
Fiscal Year Project Type Principal Rate Interest Premium Total
1 2013 Bonneville Power Administration Historical 257,352 7.243% 18,641 - 18,641
2 2013 Construction Historical 1,927,890 4.074% 78,544 - 78,544
3 2013 Construction New 361,396 1.987% 7,180 - 7,180
4 2013 Environment Historical 23,000 3.867% 889 - 889
5 2013 Environment New 5,540 3.836% 213 - 213
6 2013 Float Historical - - (1,333) - (1,333)
7 FY 2013 Subtotal: 2,575,178 104,133 - 104,133
8 2014 Bonneville Power Administration Historical 200,978 7.235% 14,540 - 14,540
9 2014 Construction Historical 2,369,266 4.132% 97,901 - 97,901
10 2014 Construction New 547,950 1.907% 10,448 - 10,448
11 2014 Environment Historical 29,050 4.034% 1,172 - 1,172
12 2014 Environment New 3,460 1.766% 61 - 61
13 2014 Float Historical - - (1,265) - (1,265)
14 FY 2014 Subtotal: 3,150,704 122,858 - 122,858
15 2015 Bonneville Power Administration Historical 197,077 7.234% 14,257 - 14,257
16 2015 Construction Historical 2,938,646 4.165% 122,399 - 122,399
17 2015 Construction New 177,753 2.255% 4,008 - 4,008
18 2015 Environment Historical 34,430 3.985% 1,372 - 1,372
19 2015 Float Historical - - (1,501) - (1,501)
20 FY 2015 Subtotal: 3,347,906 140,535 - 140,535
21 2016 Bonneville Power Administration Historical 98,958 7.220% 7,145 - 7,145
22 2016 Construction Historical 3,116,399 4.289% 133,663 19 133,682
23 2016 Construction New 185,811 2.255% 4,190 - 4,190
24 2016 Environment Historical 34,430 3.985% 1,372 - 1,372
25 2016 Float Historical - - (1,036) - (1,036)
26 FY 2016 Subtotal: 3,435,598 145,334 19 145,353
27 2017 Bonneville Power Administration Historical 85,919 7.219% 6,202 - 6,202
28 2017 Construction Historical 3,272,225 4.327% 141,600 - 141,600
29 2017 Construction New 193,085 2.255% 4,354 - 4,354
30 2017 Environment Historical 34,430 3.985% 1,372 - 1,372
31 2017 Float Historical - - (917) - (917)
32 FY 2017 Subtotal: 3,585,659 152,612 - 152,612
33 2018 Bonneville Power Administration Historical 85,919 7.219% 6,202 - 6,202
34 2018 Construction Historical 3,439,395 4.363% 150,070 - 150,070
35 2018 Construction New 199,431 2.255% 4,497 - 4,497
36 2018 Environment Historical 34,430 3.985% 1,372 - 1,372
37 2018 Float Historical - - (1,025) - (1,025)
38 FY 2018 Subtotal: 3,759,175 161,116 - 161,116
39 2019 Bonneville Power Administration Historical 51,690 7.211% 3,728 - 3,728
40 2019 Construction Historical 3,638,826 4.371% 159,064 - 159,064
41 2019 Construction New 204,100 2.255% 4,602 - 4,602
42 2019 Environment Historical 34,430 3.985% 1,372 - 1,372
43 2019 Float Historical - - (2,615) - (2,615)
44 FY 2019 Subtotal: 3,929,046 166,150 - 166,150
45 2020 Bonneville Power Administration Historical 29,899 7.210% 2,156 - 2,156
46 2020 Construction Historical 3,647,136 4.429% 161,525 138 161,663
47 2020 Construction New 210,564 2.255% 4,748 - 4,748
48 2020 Environment Historical 34,430 3.985% 1,372 - 1,372
49 2020 Float Historical - - (2,459) - (2,459)
50 FY 2020 Subtotal: 3,922,029 167,342 138 167,480
51 2021 Construction Historical 3,688,126 4.479% 165,197 3,370 168,567
52 2021 Construction New 216,398 2.255% 4,880 - 4,880
53 2021 Environment Historical 34,430 3.985% 1,372 - 1,372
54 2021 Float Historical - - (2,442) - (2,442)
55 FY 2021 Subtotal: 3,938,954 169,007 3,370 172,377
56 2022 Construction Historical 3,710,071 4.451% 165,146 1,086 166,232
57 2022 Construction New 221,403 2.255% 4,993 - 4,993
58 2022 Environment Historical 34,430 3.985% 1,372 - 1,372
59 2022 Float Historical - - (2,452) - (2,452)
60 FY 2022 Subtotal: 3,965,904 169,059 1,086 170,145
ERRATA BP-14-FS-BPA-08A-E02
Page 32 of 50

Table 13-2: Interest Calculation Summary ($000s) (FY 2014)
A B C D E F G H
Fiscal Year Project Type Principal Rate Interest Premium Total
61 2023 Construction Historical 3,733,656 4.439% 165,756 3,392 169,148
62 2023 Construction New 226,273 2.255% 5,102 - 5,102
63 2023 Environment Historical 34,430 3.985% 1,372 - 1,372
64 2023 Float Historical - - (2,451) - (2,451)
65 FY 2023 Subtotal: 3,994,359 169,779 3,392 173,171
66 2024 Construction Historical 3,764,915 4.409% 166,013 3,759 169,772
67 2024 Construction New 230,147 2.255% 5,190 - 5,190
68 2024 Environment Historical 34,430 3.985% 1,372 67 1,439
69 2024 Float Historical - - (2,503) - (2,503)
70 FY 2024 Subtotal: 4,029,492 170,071 3,826 173,897
71 2025 Construction Historical 3,799,559 4.407% 167,460 2,766 170,226
72 2025 Construction New 234,570 2.255% 5,290 - 5,290
73 2025 Environment Historical 29,430 3.812% 1,122 - 1,122
74 2025 Float Historical - - (2,660) - (2,660)
75 FY 2025 Subtotal: 4,063,559 171,212 2,766 173,978
76 2026 Construction Historical 3,825,037 4.409% 168,640 5,318 173,958
77 2026 Construction New 237,736 2.255% 5,361 - 5,361
78 2026 Environment Historical 19,430 3.572% 694 - 694
79 2026 Float Historical - - (2,657) - (2,657)
80 FY 2026 Subtotal: 4,082,203 172,038 5,318 177,356
81 2027 Construction Historical 3,846,936 4.422% 170,105 5,723 175,827
82 2027 Construction New 241,278 2.255% 5,441 - 5,441
83 2027 Environment Historical 19,430 3.572% 694 - 694
84 2027 Float Historical - - (2,652) - (2,652)
85 FY 2027 Subtotal: 4,107,644 173,588 5,723 179,311
86 2028 Construction Historical 3,887,213 4.427% 172,085 6,568 178,652
87 2028 Construction New 244,918 2.255% 5,523 - 5,523
88 2028 Environment Historical 6,430 3.615% 232 - 232
89 2028 Float Historical - - (2,646) - (2,646)
90 FY 2028 Subtotal: 4,138,561 175,194 6,568 181,762
91 2029 Construction Historical 3,921,536 4.428% 173,633 4,843 178,475
92 2029 Construction New 248,752 2.255% 5,609 - 5,609
93 2029 Environment Historical 5,380 3.716% 200 - 200
94 2029 Float Historical - - (2,641) - (2,641)
95 FY 2029 Subtotal: 4,175,668 176,801 4,843 181,644
96 2030 Construction Historical 3,963,703 4.432% 175,670 5,187 180,857
97 2030 Construction New 253,103 2.255% 5,707 - 5,707
98 2030 Float Historical - - (2,634) - (2,634)
99 FY 2030 Subtotal: 4,216,806 178,744 5,187 183,931
100 2031 Construction Historical 4,006,962 4.437% 177,794 6,205 183,999
101 2031 Construction New 257,207 2.255% 5,800 - 5,800
102 2031 Float Historical - - (2,587) - (2,587)
103 FY 2031 Subtotal: 4,264,169 181,007 6,205 187,212
104 2032 Construction Historical 4,061,994 4.438% 180,276 3,116 183,392
105 2032 Construction New 261,465 2.255% 5,896 - 5,896
106 2032 Float Historical - - (2,566) - (2,566)
107 FY 2032 Subtotal: 4,323,459 183,606 3,116 186,722
108 2033 Construction Historical 4,121,929 4.443% 183,132 2,066 185,198
109 2033 Construction New 266,389 2.255% 6,007 - 6,007
110 2033 Float Historical - - (1,782) - (1,782)
111 FY 2033 Subtotal: 4,388,318 187,357 2,066 189,423
112 2034 Construction Historical 4,278,612 4.446% 190,248 2,853 193,101
113 2034 Construction New 271,374 2.255% 6,119 - 6,119
114 2034 Float Historical - - (2,316) - (2,316)
115 FY 2034 Subtotal: 4,549,986 194,052 2,853 196,905
116 2035 Construction Historical 4,382,538 4.449% 194,979 969 195,948
117 2035 Construction New 274,987 2.255% 6,201 - 6,201
118 2035 Float Historical - - (2,572) - (2,572)
119 FY 2035 Subtotal: 4,657,525 198,608 969 199,577
ERRATA BP-14-FS-BPA-08A-E02
Page 33 of 50

Table 13-2: Interest Calculation Summary ($000s) (FY 2014)
A B C D E F G H
Fiscal Year Project Type Principal Rate Interest Premium Total
120 2036 Construction Historical 4,460,742 4.452% 198,593 2,309 200,902
121 2036 Construction New 279,135 2.255% 6,294 - 6,294
122 2036 Float Historical - - (2,562) - (2,562)
123 FY 2036 Subtotal: 4,739,877 202,325 2,309 204,634
124 2037 Construction Historical 4,547,457 4.454% 202,523 51 202,573
125 2037 Construction New 283,794 2.255% 6,400 - 6,400
126 2037 Float Historical - - (1,251) - (1,251)
127 FY 2037 Subtotal: 4,831,251 207,671 51 207,721
128 2038 Construction Historical 4,791,435 4.464% 213,879 561 214,440
129 2038 Construction New 288,220 2.255% 6,499 - 6,499
130 2038 Float Historical - - (1,498) - (1,498)
131 FY 2038 Subtotal: 5,079,655 218,880 561 219,441
132 2039 Construction Historical 5,017,305 4.466% 224,072 540 224,612
133 2039 Construction New 291,085 2.255% 6,564 - 6,564
134 2039 Float Historical - - (2,388) - (2,388)
135 FY 2039 Subtotal: 5,308,390 228,248 540 228,788
136 2040 Construction Historical 5,147,426 4.476% 230,400 177 230,577
137 2040 Construction New 295,065 2.255% 6,654 - 6,654
138 2040 Float Historical - - (2,339) - (2,339)
139 FY 2040 Subtotal: 5,442,491 234,715 177 234,892
140 2041 Construction Historical 5,290,169 4.494% 237,718 220 237,938
141 2041 Construction New 299,576 2.255% 6,755 - 6,755
142 2041 Float Historical - - (1,756) - (1,756)
143 FY 2041 Subtotal: 5,589,745 242,718 220 242,938
144 2042 Construction Historical 5,509,164 4.500% 247,925 31 247,956
145 2042 Construction New 303,690 2.255% 6,848 - 6,848
146 2042 Float Historical - - (1,303) - (1,303)
147 FY 2042 Subtotal: 5,812,854 253,470 31 253,502
148 2043 Construction Historical 5,790,075 4.502% 260,687 260,687
149 2043 Construction New 308,578 2.255% 6,958 - 6,958
150 2043 Float Historical - - (2,061) - (2,061)
151 FY 2043 Subtotal: 6,098,653 265,585 265,585
152 2044 Construction Historical 5,993,946 4.510% 270,311 - 270,311
153 2044 Construction New 312,135 2.255% 7,039 - 7,039
154 2044 Float Historical - - (2,548) - (2,548)
155 FY 2044 Subtotal: 6,306,081 274,802 - 274,802
156 2045 Construction Historical 6,149,465 4.510% 277,341 2,497 279,838
157 2045 Construction New 314,836 2.255% 7,100 - 7,100
158 2045 Float Historical - - (2,655) - (2,655)
159 FY 2045 Subtotal: 6,464,301 281,786 2,497 284,283
160 2046 Construction Historical 6,301,247 4.510% 284,186 2,319 286,505
161 2046 Construction New 318,263 2.255% 7,177 - 7,177
162 2046 Float Historical - - (2,626) - (2,626)
163 FY 2046 Subtotal: 6,619,510 288,737 2,319 291,056
164 2047 Construction Historical 6,463,132 4.510% 291,487 2,119 293,606
165 2047 Construction New 322,781 2.255% 7,279 - 7,279
166 2047 Float Historical - - (2,595) - (2,595)
167 FY 2047 Subtotal: 6,785,913 296,171 2,119 298,290
168 2048 Construction Historical 6,636,646 4.510% 299,313 2,006 301,319
169 2048 Construction New 326,031 2.255% 7,352 - 7,352
170 2048 Float Historical - - (2,562) - (2,562)
171 FY 2048 Subtotal: 6,962,677 304,103 2,006 306,109
172 2049 Construction Historical 6,821,144 4.510% 307,634 1,780 309,414
173 2049 Construction New 328,462 2.255% 7,407 - 7,407
174 2049 Float Historical - - (2,526) - (2,526)
175 FY 2049 Subtotal: 7,149,606 312,514 1,780 314,294
176 Grand Total: 173,792,905 7,441,928 72,053 7,513,982
ERRATA BP-14-FS-BPA-08A-E02
Page 34 of 50

Table 13-3: Summary of Amortization ($000s) (FY 2014)
1
2
3
4
5
6
7
8
9
10
11
A B C D E F G H I J K L M N O P Q R S T
2013 2014 2015 2016 2017 2018 2019 2020 2021 2022 2023 2024 2025 2026 2027 2028 2029 2030
BONNEVILLE POWER
ADMINISTRATION BPA 56,374 3,901 98,119 13,039 - 34,230 21,790 29,899 - - - - - - - - - -
APPROPRIATION SUBTOTAL: 56,374 3,901 98,119 13,039 0 34,230 21,790 29,899 0 0 0 0 0 0 0 0 0 0
BPA BORROWINGCONSTRUCTION 56,374 3,901 98,119 13,039 - 34,230 21,790 29,899 - - - - - - - - - -
ENVIRONMENT - 73,050 - 29,985 25,915 - 195,790 169,574 194,453 197,818 195,014 195,503 209,092 215,837 201,000 210,595 206,585 209,845
BPA BORROWING
SUBTOTAL:- - - - - - - - - - - 5,000 10,000 - 13,000 1,050 5,380 -
MAKE WHOLE CALLDISCOUNTS - 73,050 - 29,985 25,915 - 195,790 169,574 194,453 197,818 195,014 200,503 219,092 215,837 214,000 211,645 211,965 209,845
PREMIUMS - - - - - - - - - - - - - - - - - -
MAKE WHOLE CALL
SUBTOTAL:0 0 0 0 0 0 0 0 0 0 0 0 0 0 0 0 0 0
TREASURY SUBTOTAL: - 73,050 - 29,985 25,915 - 195,790 169,574 194,453 197,818 195,014 200,503 219,092 215,837 214,000 211,645 211,965 209,845
GRAND TOTAL: 56,374 76,951 98,119 43,024 25,915 34,230 217,580 199,473 194,453 197,818 195,014 200,503 219,092 215,837 214,000 211,645 211,965 209,845
ERRATA BP-14-FS-BPA-08A-E02
Page 35 of 50

Table 13-3: Summary of Amortization ($000s) (FY 2014)
1
2
3
4
5
6
7
8
9
10
11
A B
BONNEVILLE POWER
ADMINISTRATION BPA
APPROPRIATION SUBTOTAL:
BPA BORROWINGCONSTRUCTION
ENVIRONMENT
BPA BORROWING
SUBTOTAL:
MAKE WHOLE CALLDISCOUNTS
PREMIUMS
MAKE WHOLE CALL
SUBTOTAL:
TREASURY SUBTOTAL:
GRAND TOTAL:
U V W X Y Z AA AB AC AD AE AF AG AH AI AJ AK AL AM AN
2031 2032 2033 2034 2035 2036 2037 2038 2039 2040 2041 2042 2043 2044 2045 2046 2047 2048 2049 TOTAL
- - - - - - - - - - - - - - - - - - - 257,352
0 0 0 0 0 0 0 0 0 0 0 0 0 0 0 0 0 0 0 257,352
- - - - - - - - - - - - - - - - - - - 257,352
202,175 201,530 109,706 167,448 196,783 192,420 39,816 62,349 160,964 152,322 80,581 22,779 104,706 156,617 163,054 156,378 149,267 141,533 133,417 5,123,902
- - - - - - - - - - - - - - - - - - - 34,430
202,175 201,530 109,706 167,448 196,783 192,420 39,816 62,349 160,964 152,322 80,581 22,779 104,706 156,617 163,054 156,378 149,267 141,533 133,417 5,158,332
- - - - - - - - - - - - - - - - - - - -
0 0 0 0 0 0 0 0 0 0 0 0 0 0 0 0 0 0 0 0
202,175 201,530 109,706 167,448 196,783 192,420 39,816 62,349 160,964 152,322 80,581 22,779 104,706 156,617 163,054 156,378 149,267 141,533 133,417 5,158,332
202,175 201,530 109,706 167,448 196,783 192,420 39,816 62,349 160,964 152,322 80,581 22,779 104,706 156,617 163,054 156,378 149,267 141,533 133,417 5,415,684
ERRATA BP-14-FS-BPA-08A-E02
Page 36 of 50

Table 13-4: Application of Amortization ($000s) (FY 2014)
A B C D E F G H I J
Fiscal Year Project Appropriation Type In Service Due Date
Original
Principal
Current
Balance Rate Rollover
Amount
Amortized
1 FY 2013 Bonneville Power Administration BPA 1973 2018 21,656 5,041 7.280% No 5,041
2 FY 2013 Bonneville Power Administration BPA 1973 2018 33,788 15,769 7.280% No 15,769
3 FY 2013 Bonneville Power Administration BPA 1974 2019 12,079 12,079 7.270% No 5,191
4 FY 2013 Bonneville Power Administration BPA 1974 2019 12,563 12,563 7.270% No 12,563
5 FY 2013 Bonneville Power Administration BPA 1974 2019 20,984 17,810 7.270% No 17,810
6 FY 2013 Subtotal: - - - 101,070 63,262 - - 56,374
7 FY 2014 Construction - 1999 2014 59,050 59,050 5.900% No 59,050
8 FY 2014 Construction - 2009 2014 14,000 14,000 2.746% No 14,000
9 FY 2014 Bonneville Power Administration BPA 1974 2019 12,079 6,888 7.270% No 3,901
10 FY 2014 Subtotal: - - - 85,129 79,938 - - 76,951
11 FY 2015 Bonneville Power Administration BPA 1974 2019 12,079 2,987 7.270% No 2,987
12 FY 2015 Bonneville Power Administration BPA 1975 2020 11,742 11,742 7.250% No 11,742
13 FY 2015 Bonneville Power Administration BPA 1975 2020 17,158 17,158 7.250% No 17,158
14 FY 2015 Bonneville Power Administration BPA 1975 2020 21,916 21,916 7.250% No 21,916
15 FY 2015 Bonneville Power Administration BPA 1975 2020 32,026 32,026 7.250% No 32,026
16 FY 2015 Bonneville Power Administration BPA 1976 2021 2,212 2,212 7.230% No 2,212
17 FY 2015 Bonneville Power Administration BPA 1976 2021 61,025 61,025 7.230% No 10,078
18 FY 2015 Subtotal: - - - 158,158 149,066 - - 98,119
19 FY 2016 Construction - 2011 2016 13,000 13,000 1.957% No 13,000
20 FY 2016 Construction - 2011 2016 6,500 6,500 1.423% No 6,500
21 FY 2016 Construction - 2012 2017 36,400 36,400 0.920% No 10,485
22 FY 2016 Bonneville Power Administration BPA 1976 2021 61,025 50,947 7.230% No 13,039
23 FY 2016 Subtotal: - - - 116,925 106,847 - - 43,024
24 FY 2017 Construction - 2012 2017 36,400 25,915 0.920% No 25,915
25 FY 2017 Subtotal: - - - 36,400 25,915 - - 25,915
26 FY 2018 Bonneville Power Administration BPA 1976 2021 61,025 37,908 7.230% No 34,230
27 FY 2018 Subtotal: - - - 61,025 37,908 - - 34,230
28 FY 2019 Construction - 2009 2019 46,940 46,940 4.026% No 46,940
29 FY 2019 Construction - 2009 2019 35,000 35,000 3.699% No 35,000
30 FY 2019 Construction - 2010 2019 13,000 13,000 4.069% No 13,000
31 FY 2019 Construction - 2010 2019 23,000 23,000 3.719% No 23,000
32 FY 2019 Construction - 2010 2019 30,000 30,000 3.714% No 30,000
33 FY 2019 Construction - 2010 2019 15,000 15,000 3.533% No 15,000
34 FY 2019 Construction - 2013 2019 10,500 10,500 1.800% No 10,500
35 FY 2019 Construction - 2013 2019 12,180 13,650 1.800% No 13,650
36 FY 2019 Construction - 2013 2019 8,700 8,700 1.100% No 8,700
37 FY 2019 Bonneville Power Administration BPA 1976 2021 61,025 3,679 7.230% No 3,679
38 FY 2019 Bonneville Power Administration BPA 1977 2022 4,981 4,981 7.210% No 4,981
39 FY 2019 Bonneville Power Administration BPA 1977 2022 33,702 33,702 7.210% No 13,131
40 FY 2019 Subtotal: - - - 294,028 238,152 - - 217,580
41 FY 2020 Construction - 2009 2020 50,000 50,000 3.830% No 50,000
42 FY 2020 Construction - 2010 2020 43,000 43,000 3.842% No 43,000
43 FY 2020 Construction - 2010 2020 50,000 50,000 3.118% No 50,000
44 FY 2020 Construction - 2014 2020 5,260 5,260 2.200% No 5,260
45 FY 2020 Construction - 2014 2020 5,640 5,640 2.200% No 5,640
46 FY 2020 Construction - 2014 2020 6,140 6,140 2.200% No 6,140
47 FY 2020 Construction - 2014 2020 6,540 6,540 2.200% No 6,540
48 FY 2020 Bonneville Power Administration BPA 1977 2022 3,948 3,948 7.210% No 3,948
49 FY 2020 Bonneville Power Administration BPA 1977 2022 5,380 5,380 7.210% No 5,380
50 FY 2020 Bonneville Power Administration BPA 1977 2022 33,702 20,571 7.210% No 20,571
51 FY 2020 Construction - 2013 2043 18,000 18,000 6.000% No 2,994
52 FY 2020 Subtotal: - - - 227,610 214,479 - - 199,473
53 FY 2021 Construction - 2010 2021 15,000 15,000 4.188% No 15,000
54 FY 2021 Construction - 2010 2021 22,000 22,000 4.094% No 22,000
55 FY 2021 Construction - 2010 2021 22,000 22,000 3.694% No 22,000
56 FY 2021 Construction - 2010 2021 22,000 22,000 3.374% No 22,000
57 FY 2021 Construction - 1998 2028 112,300 112,300 5.850% No 53,447
58 FY 2021 Construction - 2013 2043 15,000 15,000 6.000% No 15,000
59 FY 2021 Construction - 2013 2043 18,000 15,006 6.000% No 15,006
60 FY 2021 Construction - 2013 2043 30,000 30,000 6.000% No 30,000
61 FY 2021 Subtotal: - - - 256,300 253,306 - - 194,453
ERRATA BP-14-FS-BPA-08A-E02
Page 37 of 50

Table 13-4: Application of Amortization ($000s) (FY 2014)
A B C D E F G H I J
Fiscal Year Project Appropriation Type In Service Due Date
Original
Principal
Current
Balance Rate Rollover
Amount
Amortized
62 FY 2022 Construction - 2009 2022 35,000 35,000 4.253% No 35,000
63 FY 2022 Construction - 2009 2022 20,000 20,000 4.200% No 20,000
64 FY 2022 Construction - 2010 2022 30,000 30,000 3.372% No 30,000
65 FY 2022 Construction - 2010 2022 20,000 20,000 3.029% No 20,000
66 FY 2022 Construction - 1998 2028 112,300 58,853 5.850% No 58,853
67 FY 2022 Construction - 1998 2028 106,500 106,500 5.850% No 33,965
68 FY 2022 Subtotal: - - - 323,800 270,353 - - 197,818
69 FY 2023 Construction - 2010 2023 46,000 46,000 3.161% No 46,000
70 FY 2023 Construction - 1998 2028 106,500 72,535 5.850% No 72,535
71 FY 2023 Construction - 2009 2039 35,000 35,000 5.192% No 21,479
72 FY 2023 Construction - 2013 2043 55,000 55,000 5.700% No 55,000
73 FY 2023 Subtotal: - - - 242,500 208,535 - - 195,014
74 FY 2024 Construction - 2012 2024 45,000 45,000 3.360% No 45,000
75 FY 2024 Environment - 2013 2028 5,000 5,000 5.000% No 5,000
76 FY 2024 Construction - 2011 2035 40,000 40,000 4.794% No 6,982
77 FY 2024 Construction - 2011 2036 50,000 50,000 4.952% No 50,000
78 FY 2024 Construction - 2011 2038 55,000 55,000 4.935% No 55,000
79 FY 2024 Construction - 2009 2039 35,000 13,521 5.192% No 13,521
80 FY 2024 Construction - 2011 2040 25,000 25,000 4.775% No 25,000
81 FY 2024 Subtotal: - - - 255,000 233,521 - - 200,503
82 FY 2025 Construction - 2010 2025 15,000 15,000 4.310% Yes 15,000
83 FY 2025 Construction - 2012 2025 14,300 14,300 4.310% Yes 14,300
84 FY 2025 Construction - 2012 2025 26,000 26,000 4.310% Yes 26,000
85 FY 2025 Construction - 2012 2025 37,000 37,000 4.310% Yes 37,000
86 FY 2025 Environment - 2010 2025 10,000 10,000 4.279% No 10,000
87 FY 2025 Construction - 2011 2035 40,000 33,018 4.794% No 33,018
88 FY 2025 Construction - 2011 2036 50,000 50,000 4.629% No 50,000
89 FY 2025 Construction - 2015 2050 177,753 177,753 4.510% No 33,774
90 FY 2025 Subtotal: - - - 370,053 363,071 - - 219,092
91 FY 2026 Construction - 2011 2026 45,000 45,000 3.450% No 45,000
92 FY 2026 Construction - 2015 2050 177,753 143,979 4.510% No 143,979
93 FY 2026 Construction - 2016 2051 185,811 185,811 4.510% No 26,858
94 FY 2026 Subtotal: - - - 408,564 374,790 - - 215,837
95 FY 2027 Construction - 2012 2027 17,000 17,000 3.550% No 17,000
96 FY 2027 Environment - 2012 2027 13,000 13,000 3.550% No 13,000
97 FY 2027 Construction - 2016 2051 185,811 158,953 4.510% No 158,953
98 FY 2027 Construction - 2017 2052 193,085 193,085 4.510% No 25,048
99 FY 2027 Subtotal: - - - 408,896 382,038 - 214,000
100 FY 2028 Environment - 2013 2028 510 510 3.1 No 510
101 FY 2028 Environment - 2013 2028 540 540 3.100% No 540
102 FY 2028 Construction - 2017 2052 193,085 168,037 4.510% No 168,037
103 FY 2028 Construction - 2018 2053 199,431 199,431 4.510% No 42,558
104 FY 2028 Subtotal: - - - 393,566 368,518 - 211,645
105 FY 2029 Construction - 2011 2029 50,000 50,000 4.238% No 50,000
106 FY 2029 Environment - 2014 2029 780 780 4.400% No 780
107 FY 2029 Environment - 2014 2029 1,250 1,250 3.600% No 1,250
108 FY 2029 Environment - 2014 2029 1,430 1,430 3.6 No 1,430
109 FY 2029 Environment - 2014 2029 1,920 1,920 3.600% No 1,920
110 FY 2029 Construction - 2018 2053 199,431 156,873 4.510% No 156,585
111 FY 2029 Subtotal: - - - 254,811 212,253 - - 211,965
112 FY 2030 Construction - 2013 2030 42,110 42,110 4.100% No 42,110
113 FY 2030 Construction - 2018 2053 199,431 289 4.510% No 288
114 FY 2030 Construction - 2019 2054 204,100 204,100 4.51 No 167,446
115 FY 2030 Subtotal: - - - 445,641 246,499 - 209,845
116 FY 2031 Construction - 2019 2054 204,100 36,654 4.510% No 36,654
117 FY 2031 Construction - 2020 2055 210,564 210,564 4.510% No 165,521
118 FY 2031 Subtotal: - - - 414,664 247,218 - - 202,175
119 FY 2032 Construction - 2011 2032 98,900 98,900 4.355% No 98,900
120 FY 2032 Construction - 2020 2055 210,564 45,043 4.510% No 45,043
121 FY 2032 Construction - 2021 2056 216,398 216,398 4.51 No 57,587
122 FY 2032 Subtotal: - - - 525,862 360,341 - 201,530
123 FY 2033 Construction - 2011 2033 40,000 40,000 4.386% No 40,000
124 FY 2033 Construction - 2021 2056 216,398 158,811 4.510% No 69,706
125 FY 2033 Subtotal: - - - 256,398 198,811 - - 109,706
126 FY 2034 Construction - 2011 2034 40,000 40,000 4.416% No 40,000
127 FY 2034 Construction - 2014 2044 87,940 87,940 4.500% No 56,928
128 FY 2034 Construction - 2021 2056 216,398 89,105 4.510% No 70,520
129 FY 2034 Subtotal: - - - 344,338 217,045 - 167,448
130 FY 2035 Construction - 2011 2035 40,000 40,000 4.446% No 40,000
131 FY 2035 Construction - 2011 2035 40,000 40,000 4.446% No 40,000
132 FY 2035 Construction - 2011 2035 45,000 45,000 4.446% No 45,000
133 FY 2035 Construction - 2014 2044 87,940 31,012 4.500% No 31,012
134 FY 2035 Construction - 2014 2044 79,760 79,760 4.500% No 40,770
135 FY 2035 Construction - 2021 2056 216,398 18,585 4.510% No
136 FY 2035 Subtotal: - - - 509,098 254,357 - - 196,783
ERRATA BP-14-FS-BPA-08A-E02
Page 38 of 50
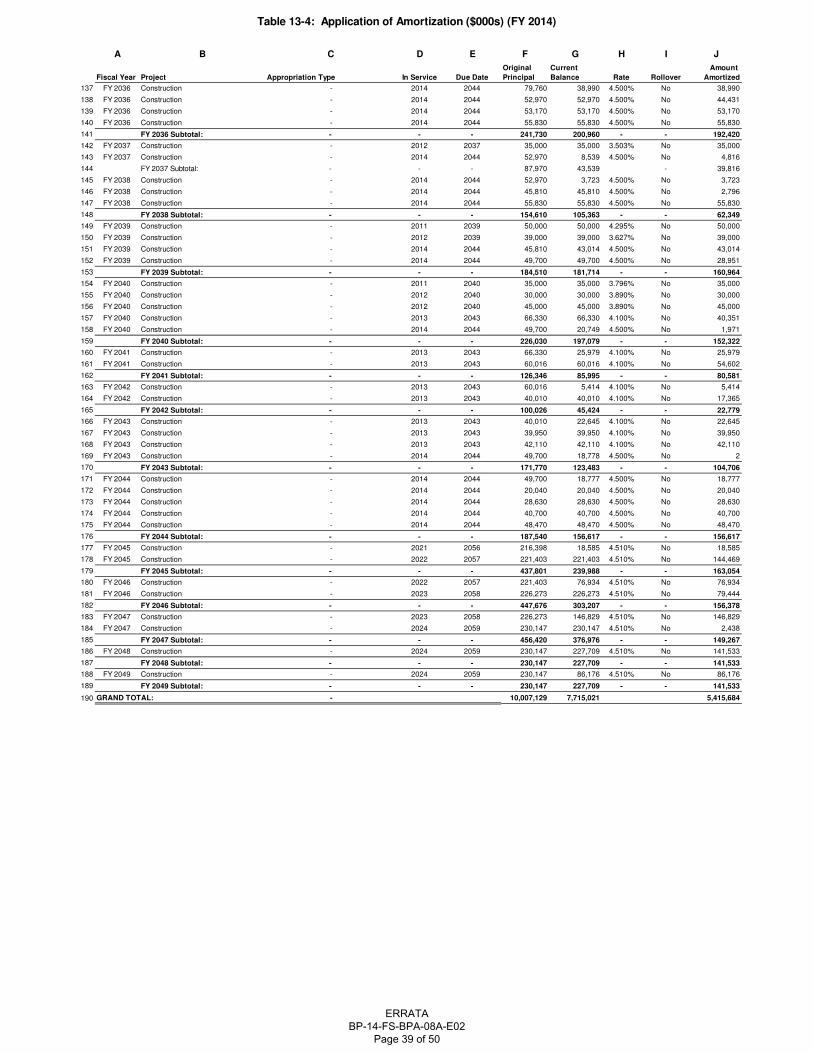
Table 13-4: Application of Amortization ($000s) (FY 2014)
A B C D E F G H I J
Fiscal Year Project Appropriation Type In Service Due Date
Original
Principal
Current
Balance Rate Rollover
Amount
Amortized
137 FY 2036 Construction - 2014 2044 79,760 38,990 4.500% No 38,990
138 FY 2036 Construction - 2014 2044 52,970 52,970 4.500% No 44,431
139 FY 2036 Construction - 2014 2044 53,170 53,170 4.500% No 53,170
140 FY 2036 Construction - 2014 2044 55,830 55,830 4.500% No 55,830
141 FY 2036 Subtotal: - - - 241,730 200,960 - - 192,420
142 FY 2037 Construction - 2012 2037 35,000 35,000 3.503% No 35,000
143 FY 2037 Construction - 2014 2044 52,970 8,539 4.500% No 4,816
144 FY 2037 Subtotal: - - - 87,970 43,539 - 39,816
145 FY 2038 Construction - 2014 2044 52,970 3,723 4.500% No 3,723
146 FY 2038 Construction - 2014 2044 45,810 45,810 4.500% No 2,796
147 FY 2038 Construction - 2014 2044 55,830 55,830 4.500% No 55,830
148 FY 2038 Subtotal: - - - 154,610 105,363 - - 62,349
149 FY 2039 Construction - 2011 2039 50,000 50,000 4.295% No 50,000
150 FY 2039 Construction - 2012 2039 39,000 39,000 3.627% No 39,000
151 FY 2039 Construction - 2014 2044 45,810 43,014 4.500% No 43,014
152 FY 2039 Construction - 2014 2044 49,700 49,700 4.500% No 28,951
153 FY 2039 Subtotal: - - - 184,510 181,714 - - 160,964
154 FY 2040 Construction - 2011 2040 35,000 35,000 3.796% No 35,000
155 FY 2040 Construction - 2012 2040 30,000 30,000 3.890% No 30,000
156 FY 2040 Construction - 2012 2040 45,000 45,000 3.890% No 45,000
157 FY 2040 Construction - 2013 2043 66,330 66,330 4.100% No 40,351
158 FY 2040 Construction - 2014 2044 49,700 20,749 4.500% No 1,971
159 FY 2040 Subtotal: - - - 226,030 197,079 - - 152,322
160 FY 2041 Construction - 2013 2043 66,330 25,979 4.100% No 25,979
161 FY 2041 Construction - 2013 2043 60,016 60,016 4.100% No 54,602
162 FY 2041 Subtotal: - - - 126,346 85,995 - - 80,581
163 FY 2042 Construction - 2013 2043 60,016 5,414 4.100% No 5,414
164 FY 2042 Construction - 2013 2043 40,010 40,010 4.100% No 17,365
165 FY 2042 Subtotal: - - - 100,026 45,424 - - 22,779
166 FY 2043 Construction - 2013 2043 40,010 22,645 4.100% No 22,645
167 FY 2043 Construction - 2013 2043 39,950 39,950 4.100% No 39,950
168 FY 2043 Construction - 2013 2043 42,110 42,110 4.100% No 42,110
169 FY 2043 Construction - 2014 2044 49,700 18,778 4.500% No 2
170 FY 2043 Subtotal: - - - 171,770 123,483 - - 104,706
171 FY 2044 Construction - 2014 2044 49,700 18,777 4.500% No 18,777
172 FY 2044 Construction - 2014 2044 20,040 20,040 4.500% No 20,040
173 FY 2044 Construction - 2014 2044 28,630 28,630 4.500% No 28,630
174 FY 2044 Construction - 2014 2044 40,700 40,700 4.500% No 40,700
175 FY 2044 Construction - 2014 2044 48,470 48,470 4.500% No 48,470
176 FY 2044 Subtotal: - - - 187,540 156,617 - - 156,617
177 FY 2045 Construction - 2021 2056 216,398 18,585 4.510% No 18,585
178 FY 2045 Construction - 2022 2057 221,403 221,403 4.510% No 144,469
179 FY 2045 Subtotal: - - - 437,801 239,988 - - 163,054
180 FY 2046 Construction - 2022 2057 221,403 76,934 4.510% No 76,934
181 FY 2046 Construction - 2023 2058 226,273 226,273 4.510% No 79,444
182 FY 2046 Subtotal: - - - 447,676 303,207 - - 156,378
183 FY 2047 Construction - 2023 2058 226,273 146,829 4.510% No 146,829
184 FY 2047 Construction - 2024 2059 230,147 230,147 4.510% No 2,438
185 FY 2047 Subtotal: - - - 456,420 376,976 - - 149,267
186 FY 2048 Construction - 2024 2059 230,147 227,709 4.510% No 141,533
187 FY 2048 Subtotal: - - - 230,147 227,709 - - 141,533
188 FY 2049 Construction - 2024 2059 230,147 86,176 4.510% No 86,176
189 FY 2049 Subtotal: - - - 230,147 227,709 - - 141,533
190 GRAND TOTAL: - 10,007,129 7,715,021 5,415,684
ERRATA BP-14-FS-BPA-08A-E02
Page 39 of 50

Table 13-5: Summary of Interest ($000s) (FY 2015)
1
2
3
4
5
6
7
8
9
10
11
A B C D E F G H I J K L M N O P Q R S T U
2013 2014 2015 2016 2017 2018 2019 2020 2021 2022 2023 2024 2025 2026 2027 2028 2029 2030 2031
Bonneville Power Administration
18,641 14,540 14,257 7,145 3,566 2,357 - - - - - - - - - - - - -
Bonneville Power Administration
Subtotal:18,641 14,540 14,257 7,145 3,566 2,357 - - - - - - - - - - - - -
Appropriation Subtotal: 18,641 14,540 14,257 7,145 3,566 2,357 - - - - - - - - - - - - -
Construction 85,724 108,349 133,869 161,589 171,019 180,817 189,597 190,750 192,670 193,207 194,321 195,935 197,425 198,610 199,655 201,227 202,487 204,288 206,391
Environment 1,102 1,233 1,441 1,609 1,609 1,609 1,609 1,609 1,609 1,609 1,609 1,609 1,609 1,181 1,181 719 437 237 -
(Less Interest Income) (1,333) (1,265) (1,688) (1,480) (1,344) (1,456) (3,186) (3,024) (3,014) (3,022) (3,020) (3,071) (3,240) (3,238) (3,235) (3,231) (3,228) (3,223) (3,173)
Coupon Scale Down Premiums - - - - - 1,373 1,916 930 1,615 3,513 6,432 6,360 4,754 6,625 7,370 8,186 6,475 6,663 8,062
BPA Borrowing Subtotal: 85,492 108,317 133,622 161,717 171,284 182,342 189,936 190,266 192,880 195,306 199,342 200,833 200,548 203,178 204,971 206,902 206,171 207,965 211,280
Treasury Subtotal: 85,492 108,317 133,622 161,717 171,284 182,342 189,936 190,266 192,880 195,306 199,342 200,833 200,548 203,178 204,971 206,902 206,171 207,965 211,280
GRAND TOTAL: 104,133 122,858 147,879 168,862 174,850 184,699 189,936 190,266 192,880 195,306 199,342 200,833 200,548 203,178 204,971 206,902 206,171 207,965 211,280
Appropriation
Treasury
ERRATA BP-14-FS-BPA-08A-E02
Page 40 of 50

Table 13-5: Summary of Interest ($000s) (FY 2015)
1
2
3
4
5
6
7
8
9
10
11
A B
Bonneville Power Administration
Bonneville Power Administration
Subtotal:
Appropriation Subtotal:
Construction
Environment
(Less Interest Income)
Coupon Scale Down Premiums
BPA Borrowing Subtotal:
Treasury Subtotal:
GRAND TOTAL:
Appropriation
Treasury
V W X Y Z AA AB AC AD AE AF AG AH AI AJ AK AL AM AN AO
2032 2033 2034 2035 2036 2037 2038 2039 2040 2041 2042 2043 2044 2045 2046 2047 2048 2049 2050 Total
- - - - - - - - - - - - - - - - - - - 60,506
- - - - - - - - - - - - - - - - - - - 60,506
- - - - - - - - - - - - - - - - - - - 60,506
208,446 211,445 218,931 223,761 227,888 232,658 245,109 256,435 264,007 272,526 284,171 298,562 309,882 318,626 326,373 334,712 343,663 353,217 363,376 8,701,719
- - - - - - - - - - - - - - - - - - - 23,616
(3,153) (2,302) (2,880) (3,159) (3,146) (1,719) (1,983) (2,945) (2,886) (2,247) (1,749) (2,565) (3,087) (3,196) (3,161) (3,123) (3,082) (3,038) (2,991) (101,882)
4,510 3,343 3,917 299 1,877 326 789 723 393 320 60 - - 3,354 3,136 2,890 2,677 2,453 2,150 103,493
209,803 212,486 219,968 220,902 226,619 231,266 243,916 254,213 261,514 270,598 282,482 295,997 306,795 318,783 326,348 334,480 343,258 352,632 362,535 8,726,945
209,803 212,486 219,968 220,902 226,619 231,266 243,916 254,213 261,514 270,598 282,482 295,997 306,795 318,783 326,348 334,480 343,258 352,632 362,535 8,726,945
209,803 212,486 219,968 220,902 226,619 231,266 243,916 254,213 261,514 270,598 282,482 295,997 306,795 318,783 326,348 334,480 343,258 352,632 362,535 8,787,451
ERRATA BP-14-FS-BPA-08A-E02
Page 41 of 50

Table 13-6: Interest Calculation Summary ($000s) (FY 2015)
A B C D E F G HFISCAL YEAR PROJECT TYPE PRINCIPAL RATE INTEREST PREMIUM TOTAL
1 2013 Bonneville Power Administration Historical 257,352 7.243% 18,641 - 18,641
2 2013 Construction Historical 1,927,890 4.074% 78,544 - 78,544
3 2013 Construction New 361,396 1.987% 7,180 - 7,180
4 2013 Environment Historical 23,000 3.867% 889 - 889
5 2013 Environment New 5,540 3.836% 213 - 213
6 2013 Float Historical - - (1,333) - (1,333)
7 FY 2013 Subtotal: 2,575,178 104,133 - 104,133
8 2014 Bonneville Power Administration Historical 200,978 7.235% 14,540 - 14,540
9 2014 Construction Historical 2,369,266 4.132% 97,901 - 97,901
10 2014 Construction New 547,950 1.907% 10,448 - 10,448
11 2014 Environment Historical 29,050 4.034% 1,172 - 1,172
12 2014 Environment New 3,460 1.766% 61 - 61
13 2014 Float Historical - - (1,265) - (1,265)
14 FY 2014 Subtotal: 3,150,704 122,858 - 122,858
15 2015 Bonneville Power Administration Historical 197,077 7.234% 14,257 - 14,257
16 2015 Construction Historical 2,938,646 4.165% 122,399 - 122,399
17 2015 Construction New 528,000 2.172% 11,470 - 11,470
18 2015 Environment Historical 34,430 3.985% 1,372 - 1,372
19 2015 Environment New 3,460 1.993% 69 - 69
20 2015 Float Historical - - (1,688) - (1,688)
21 FY 2015 Subtotal: 3,701,613 147,879 - 147,879
22 2016 Bonneville Power Administration Historical 98,958 7.220% 7,145 - 7,145
23 2016 Construction Historical 3,557,916 4.407% 156,794 - 156,794
24 2016 Construction New 189,512 2.530% 4,795 - 4,795
25 2016 Environment Historical 39,810 4.041% 1,609 - 1,609
26 2016 Float Historical - - (1,480) - (1,480)
27 FY 2016 Subtotal: 3,886,196 168,862 - 168,862
28 2017 Bonneville Power Administration Historical 49,456 7.211% 3,566 - 3,566
29 2017 Construction Historical 3,727,928 4.454% 166,037 - 166,037
30 2017 Construction New 196,922 2.530% 4,982 - 4,982
31 2017 Environment Historical 39,810 4.041% 1,609 - 1,609
32 2017 Float Historical - - (1,344) - (1,344)
33 FY 2017 Subtotal: 4,014,116 174,850 - 174,850
34 2018 Bonneville Power Administration Historical 32,685 7.210% 2,357 - 2,357
35 2018 Construction Historical 3,888,450 4.518% 175,666 1,373 177,039
36 2018 Construction New 203,574 2.530% 5,150 - 5,150
37 2018 Environment Historical 39,810 4.041% 1,609 - 1,609
38 2018 Float Historical - - (1,456) - (1,456)
39 FY 2018 Subtotal: 4,164,519 183,325 1,373 184,699
40 2019 Construction Historical 4,064,560 4.535% 184,319 1,916 186,235
41 2019 Construction New 208,629 2.530% 5,278 - 5,278
42 2019 Environment Historical 39,810 4.041% 1,609 - 1,609
43 2019 Float Historical - - (3,186) - (3,186)
44 FY 2019 Subtotal: 4,312,999 188,020 1,916 189,936
45 2020 Construction Historical 4,029,877 4.598% 185,299 930 186,229
46 2020 Construction New 215,471 2.530% 5,451 - 5,451
47 2020 Environment Historical 39,810 4.041% 1,609 - 1,609
48 2020 Float Historical - - (3,024) - (3,024)
49 FY 2020 Subtotal: 4,285,158 189,335 930 190,266
50 2021 Construction Historical 4,019,131 4.654% 187,068 1,615 188,683
51 2021 Construction New 221,414 2.530% 5,602 - 5,602
52 2021 Environment Historical 39,810 4.041% 1,609 - 1,609
53 2021 Float Historical - - (3,014) - (3,014)
54 FY 2021 Subtotal: 4,280,355 191,265 1,615 192,880
55 2022 Construction Historical 4,017,062 4.667% 187,469 3,513 190,982
56 2022 Construction New 226,804 2.530% 5,738 - 5,738
57 2022 Environment Historical 39,810 4.041% 1,609 - 1,609
58 2022 Float Historical - - (3,022) - (3,022)
59 FY 2022 Subtotal: 4,283,676 191,793 3,513 195,306
60 2023 Construction Historical 4,021,662 4.686% 188,445 6,432 194,877
61 2023 Construction New 232,252 2.530% 5,876 - 5,876
62 2023 Environment Historical 39,810 4.041% 1,609 - 1,609
63 2023 Float Historical - - (3,020) - (3,020)
64 FY 2023 Subtotal: 4,293,724 192,909 6,432 199,342
ERRATA BP-14-FS-BPA-08A-E02
Page 42 of 50

Table 13-6: Interest Calculation Summary ($000s) (FY 2015)
A B C D E F G HFISCAL YEAR PROJECT TYPE PRINCIPAL RATE INTEREST PREMIUM TOTAL
65 2024 Construction Historical 4,035,501 4.707% 189,948 6,360 196,308
66 2024 Construction New 236,640 2.530% 5,987 - 5,987
67 2024 Environment Historical 39,810 4.041% 1,609 - 1,609
68 2024 Float Historical - - (3,071) - (3,071)
69 FY 2024 Subtotal: 4,311,951 194,472 6,360 200,833
70 2025 Construction Historical 4,048,986 4.725% 191,324 4,754 196,078
71 2025 Construction New 241,160 2.530% 6,101 - 6,101
72 2025 Environment Historical 39,810 4.041% 1,609 - 1,609
73 2025 Float Historical - - (3,240) - (3,240)
74 FY 2025 Subtotal: 4,329,956 195,794 4,754 200,548
75 2026 Construction Historical 4,058,033 4.742% 192,418 6,625 199,044
76 2026 Construction New 244,724 2.530% 6,192 - 6,192
77 2026 Environment Historical 29,810 3.961% 1,181 - 1,181
78 2026 Float Historical - - (3,238) - (3,238)
79 FY 2026 Subtotal: 4,332,567 196,553 6,625 203,178
80 2027 Construction Historical 4,063,135 4.759% 193,358 7,370 200,728
81 2027 Construction New 248,878 2.530% 6,297 - 6,297
82 2027 Environment Historical 29,810 3.961% 1,181 - 1,181
83 2027 Float Historical - - (3,235) - (3,235)
84 FY 2027 Subtotal: 4,341,823 197,601 7,370 204,971
85 2028 Construction Historical 4,087,043 4.767% 194,825 8,186 203,011
86 2028 Construction New 253,053 2.530% 6,402 - 6,402
87 2028 Environment Historical 16,810 4.278% 719 - 719
88 2028 Float Historical - - (3,231) - (3,231)
89 FY 2028 Subtotal: 4,356,906 198,716 8,186 206,902
90 2029 Construction Historical 4,109,991 4.769% 195,986 6,475 202,461
91 2029 Construction New 256,959 2.530% 6,501 - 6,501
92 2029 Environment Historical 10,760 4.058% 437 - 437
93 2029 Float Historical - - (3,228) - (3,228)
94 FY 2029 Subtotal: 4,377,710 199,695 6,475 206,171
95 2030 Construction Historical 4,135,240 4.780% 197,674 6,663 204,337
96 2030 Construction New 261,392 2.530% 6,613 - 6,613
97 2030 Environment Historical 5,380 4.400% 237 - 237
98 2030 Float Historical - - (3,223) - (3,223)
99 FY 2030 Subtotal: 4,402,012 201,302 6,663 207,965
100 2031 Construction Historical 4,166,546 4.792% 199,663 8,062 207,725
101 2031 Construction New 265,934 2.530% 6,728 - 6,728
102 2031 Float Historical - - (3,173) - (3,173)
103 FY 2031 Subtotal: 4,432,480 203,218 8,062 211,280
104 2032 Construction Historical 4,204,702 4.794% 201,593 4,510 206,103
105 2032 Construction New 270,853 2.530% 6,853 - 6,853
106 2032 Float Historical - - (3,153) - (3,153)
107 FY 2032 Subtotal: 4,475,555 205,293 4,510 209,803
108 2033 Construction Historical 4,247,409 4.814% 204,452 3,343 207,795
109 2033 Construction New 276,407 2.530% 6,993 - 6,993
110 2033 Float Historical - - (2,302) - (2,302)
111 FY 2033 Subtotal: 4,523,816 209,143 3,343 212,486
112 2034 Construction Historical 4,387,454 4.828% 211,808 3,917 215,724
113 2034 Construction New 281,566 2.530% 7,124 - 7,124
114 2034 Float Historical - - (2,880) - (2,880)
115 FY 2034 Subtotal: 4,669,020 216,051 3,917 219,968
116 2035 Construction Historical 4,474,911 4.839% 216,535 299 216,834
117 2035 Construction New 285,629 2.530% 7,226 - 7,226
118 2035 Float Historical - - (3,159) - (3,159)
119 FY 2035 Subtotal: 4,760,540 220,603 299 220,902
120 2036 Construction Historical 4,535,343 4.863% 220,541 1,877 222,418
121 2036 Construction New 290,425 2.530% 7,348 - 7,348
122 2036 Float Historical - - (3,146) - (3,146)
123 FY 2036 Subtotal: 4,825,768 224,742 1,877 226,619
124 2037 Construction Historical 4,605,567 4.889% 225,178 326 225,504
125 2037 Construction New 295,659 2.530% 7,480 - 7,480
126 2037 Float Historical - - (1,719) - (1,719)
127 FY 2037 Subtotal: 4,901,226 230,940 326 231,266
128 2038 Construction Historical 4,835,169 4.912% 237,515 789 238,304
129 2038 Construction New 300,168 2.530% 7,594 - 7,594
130 2038 Float Historical - - (1,983) - (1,983)
131 FY 2038 Subtotal: 5,135,337 243,127 789 243,916
ERRATA BP-14-FS-BPA-08A-E02
Page 43 of 50

Table 13-6: Interest Calculation Summary ($000s) (FY 2015)
A B C D E F G HFISCAL YEAR PROJECT TYPE PRINCIPAL RATE INTEREST PREMIUM TOTAL
132 2039 Construction Historical 5,047,674 4.928% 248,759 723 249,481
133 2039 Construction New 303,420 2.530% 7,677 - 7,677
134 2039 Float Historical - - (2,945) - (2,945)
135 FY 2039 Subtotal: 5,351,094 253,491 723 254,213
136 2040 Construction Historical 5,165,752 4.960% 256,214 393 256,607
137 2040 Construction New 308,011 2.530% 7,793 - 7,793
138 2040 Float Historical - - (2,886) - (2,886)
139 FY 2040 Subtotal: 5,473,763 261,121 393 261,514
140 2041 Construction Historical 5,298,239 4.994% 264,605 320 264,925
141 2041 Construction New 313,067 2.530% 7,921 - 7,921
142 2041 Float Historical - - (2,247) - (2,247)
143 FY 2041 Subtotal: 5,611,306 270,278 320 270,598
144 2042 Construction Historical 5,508,540 5.013% 276,144 60 276,204
145 2042 Construction New 317,258 2.530% 8,027 - 8,027
146 2042 Float Historical - - (1,749) - (1,749)
147 FY 2042 Subtotal: 5,825,798 282,422 60 282,482
148 2043 Construction Historical 5,782,152 5.022% 290,408 - 290,408
149 2043 Construction New 322,295 2.530% 8,154 - 8,154
150 2043 Float Historical - - (2,565) - (2,565)
151 FY 2043 Subtotal: 6,104,447 295,997 - 295,997
152 2044 Construction Historical 5,980,300 5.044% 301,626 - 301,626
153 2044 Construction New 326,338 2.530% 8,256 - 8,256
154 2044 Float Historical - - (3,087) - (3,087)
155 FY 2044 Subtotal: 6,306,638 306,795 - 306,795
156 2045 Construction Historical 6,132,147 5.060% 310,287 3,354 313,640
157 2045 Construction New 329,605 2.530% 8,339 - 8,339
158 2045 Float Historical - - (3,196) - (3,196)
159 FY 2045 Subtotal: 6,461,752 315,430 3,354 318,783
160 2046 Construction Historical 6,283,310 5.060% 317,935 3,136 321,071
161 2046 Construction New 333,499 2.530% 8,438 - 8,438
162 2046 Float Historical - - (3,161) - (3,161)
163 FY 2046 Subtotal: 6,616,809 323,212 3,136 326,348
164 2047 Construction Historical 6,445,818 5.060% 326,158 2,890 329,049
165 2047 Construction New 338,102 2.530% 8,554 - 8,554
166 2047 Float Historical - - (3,123) - (3,123)
167 FY 2047 Subtotal: 6,783,920 331,589 2,890 334,480
168 2048 Construction Historical 6,620,936 5.060% 335,019 2,677 337,696
169 2048 Construction New 341,663 2.530% 8,644 - 8,644
170 2048 Float Historical - - (3,082) - (3,082)
171 FY 2048 Subtotal: 6,962,599 340,581 2,677 343,258
172 2049 Construction Historical 6,808,297 5.060% 344,500 2,453 346,953
173 2049 Construction New 344,541 2.530% 8,717 - 8,717
174 2049 Float Historical - - (3,038) - (3,038)
175 FY 2049 Subtotal: 7,152,838 350,178 2,453 352,632
176 2050 Construction Historical 7,007,823 5.060% 354,596 2,150 356,746
177 2050 Construction New 347,044 2.530% 8,780 - 8,780
178 2050 Float Historical - - (2,991) - (2,991)
179 FY 2050 Subtotal: 7,354,867 360,385 2,150 362,535
187,130,736 8,683,958 103,493 8,787,451Grand Total:
ERRATA BP-14-FS-BPA-08A-E02
Page 44 of 50

Table 13-7: Summary of Amortization ($000s) (FY 2015)
1
2
3
4
5
6
7
8
9
10
11
12
A B C D E F G H I J K L M N O P Q R S T U
2013 2014 2015 2016 2017 2018 2019 2020 2021 2022 2023 2024 2025 2026 2027 2028 2029 2030 2031
Bonneville Power Administration 56,374 3,901 98,119 49,502 16,771 32,685 - - - - - - - - - - - - -
Bonneville Power Administration
Subtotal:56,374 3,901 98,119 49,502 16,771 32,685 - - - - - - - - - - - - -
Appropriation Subtotal: 56,374 3,901 98,119 49,502 16,771 32,685 0 0 0 0 0 0 0 0 0 0 0 0 0
Construction - 73,050 - 19,500 36,400 27,464 243,312 226,217 223,483 222,204 218,412 223,155 232,113 239,622 224,970 230,105 231,711 230,086 227,779
Environment - - - - - - - - - - - - 10,000 - 13,000 6,050 5,380 5,380 -
BPA Borrowing Subtotal: - 73,050 - 19,500 36,400 27,464 243,312 226,217 223,483 222,204 218,412 223,155 242,113 239,622 237,970 236,155 237,091 235,466 227,779
Discounts - - - - - - - - - - - - - - - - - - -
Premiums - - - - - - - - - - - - - - - - - - -
Make Whole Call Subtotal: - - - - - - - - - - - - - - - - - - -
Treasury Subtotal: 0 73,050 0 19,500 36,400 27,464 243,312 226,217 223,483 222,204 218,412 223,155 242,113 239,622 237,970 236,155 237,091 235,466 227,779
GRAND TOTAL: 56,374 76,951 98,119 69,002 53,171 60,149 243,312 226,217 223,483 222,204 218,412 223,155 242,113 239,622 237,970 236,155 237,091 235,466 227,779
Appropriation
Treasury
ERRATA BP-14-FS-BPA-08A-E02
Page 45 of 50

Table 13-7: Summary of Amortization ($000s) (FY 2015)
1
2
3
4
5
6
7
8
9
10
11
12
A B
Bonneville Power Administration
Bonneville Power Administration
Subtotal:
Appropriation Subtotal:
Construction
Environment
BPA Borrowing Subtotal:
Discounts
Premiums
Make Whole Call Subtotal:
Treasury Subtotal:
GRAND TOTAL:
Appropriation
Treasury
V W X Y Z AA AB AC AD AE AF AG AH AI AJ AK AL AM AN AO
2032 2033 2034 2035 2036 2037 2038 2039 2040 2041 2042 2043 2044 2045 2046 2047 2048 2049 2050 TOTAL
- - - - - - - - - - - - - - - - - - - 257,352
- - - - - - - - - - - - - - - - - - - 257,352
0 0 0 0 0 0 0 0 0 0 0 0 0 0 0 0 0 0 0 257,352
228,146 136,362 194,109 225,197 220,200 66,057 87,663 185,342 175,525 102,766 43,646 124,147 174,491 178,442 170,991 162,984 154,302 145,014 135,183 6,040,150
- - - - - - - - - - - - - - - - - - - 39,810
228,146 136,362 194,109 225,197 220,200 66,057 87,663 185,342 175,525 102,766 43,646 124,147 174,491 178,442 170,991 162,984 154,302 145,014 135,183 6,079,960
- - - - - - - - - - - - - - - - - - - -
- - - - - - - - - - - - - - - - - - - -
- - - - - - - - - - - - - - - - - - - -
228,146 136,362 194,109 225,197 220,200 66,057 87,663 185,342 175,525 102,766 43,646 124,147 174,491 178,442 170,991 162,984 154,302 145,014 135,183 6,079,960
228,146 136,362 194,109 225,197 220,200 66,057 87,663 185,342 175,525 102,766 43,646 124,147 174,491 178,442 170,991 162,984 154,302 145,014 135,183 6,337,312
ERRATA BP-14-FS-BPA-08A-E02
Page 46 of 50

Table 13-8: Application of Amortization ($000s) (FY 2015)
A B C D E F G H I J
YEAR PROJECT
APPROPRIATION
TYPEIN
SERVICE DATE PRINCIPAL BALANCE RATE ROLLOVER
AMOUNT
AMORTIZED
1 FY 2013 Bonneville Power Administration BPA 1973 2018 21,656 5,041 7.280% No 5,041
2 FY 2013 Bonneville Power Administration BPA 1973 2018 33,788 15,769 7.280% No 15,769
3 FY 2013 Bonneville Power Administration BPA 1974 2019 12,079 12,079 7.270% No 5,191
4 FY 2013 Bonneville Power Administration BPA 1974 2019 12,563 12,563 7.270% No 12,563
5 FY 2013 Bonneville Power Administration BPA 1974 2019 20,984 17,810 7.270% No 17,810
6 FY 2013 Subtotal: - - - 101,070 63,262 - - 56,374
7 FY 2014 Construction - 1999 2014 59,050 59,050 5.900% No 59,050
8 FY 2014 Construction - 2009 2014 14,000 14,000 2.746% No 14,000
9 FY 2014 Bonneville Power Administration BPA 1974 2019 12,079 6,888 7.270% No 3,901
10 FY 2014 Subtotal: - - - 85,129 79,938 - - 76,951
11 FY 2015 Bonneville Power Administration BPA 1974 2019 12,079 2,987 7.270% No 2,987
12 FY 2015 Bonneville Power Administration BPA 1975 2020 11,742 11,742 7.250% No 11,742
13 FY 2015 Bonneville Power Administration BPA 1975 2020 17,158 17,158 7.250% No 17,158
14 FY 2015 Bonneville Power Administration BPA 1975 2020 21,916 21,916 7.250% No 21,916
15 FY 2015 Bonneville Power Administration BPA 1975 2020 32,026 32,026 7.250% No 32,026
16 FY 2015 Bonneville Power Administration BPA 1976 2021 2,212 2,212 7.230% No 2,212
17 FY 2015 Bonneville Power Administration BPA 1976 2021 61,025 61,025 7.230% No 10,078
18 FY 2015 Subtotal: - - - 158,158 149,066 - - 98,119
19 FY 2016 Construction - 2011 2016 13,000 13,000 1.957% No 13,000
20 FY 2016 Construction - 2011 2016 6,500 6,500 1.423% No 6,500
21 FY 2016 Bonneville Power Administration BPA 1976 2021 61,025 50,947 7.230% No 49,502
22 FY 2016 Subtotal: - - - 80,525 70,447 - - 69,002
23 FY 2017 Construction - 2012 2017 36,400 36,400 0.920% No 36,400
24 FY 2017 Bonneville Power Administration BPA 1976 2021 61,025 1,445 7.230% No 1,445
25 FY 2017 Bonneville Power Administration BPA 1977 2022 4,981 4,981 7.210% No 4,981
26 FY 2017 Bonneville Power Administration BPA 1977 2022 33,702 33,702 7.210% No 10,345
27 FY 2017 Subtotal: - - - 136,108 76,528 - - 53,171
28 FY 2018 Bonneville Power Administration BPA 1977 2022 3,948 3,948 7.210% No 3,948
29 FY 2018 Bonneville Power Administration BPA 1977 2022 5,380 5,380 7.210% No 5,380
30 FY 2018 Bonneville Power Administration BPA 1977 2022 33,702 23,357 7.210% No 23,357
31 FY 2018 Construction - 2013 2043 15,000 15,000 6.000% No 9,464
32 FY 2018 Construction - 2013 2043 18,000 18,000 6.000% No 18,000
33 FY 2018 Subtotal: - - - 76,030 65,685 - - 60,149
34 FY 2019 Construction - 2009 2019 46,940 46,940 4.026% No 46,940
35 FY 2019 Construction - 2009 2019 35,000 35,000 3.699% No 35,000
36 FY 2019 Construction - 2010 2019 13,000 13,000 4.069% No 13,000
37 FY 2019 Construction - 2010 2019 23,000 23,000 3.719% No 23,000
38 FY 2019 Construction - 2010 2019 30,000 30,000 3.714% No 30,000
39 FY 2019 Construction - 2010 2019 15,000 15,000 3.533% No 15,000
40 FY 2019 Construction - 2013 2019 10,500 10,500 1.800% No 10,500
41 FY 2019 Construction - 2013 2019 12,180 13,650 1.800% No 13,650
42 FY 2019 Construction - 2013 2019 8,700 8,700 1.100% No 8,700
43 FY 2019 Construction - 1998 2028 112,300 112,300 5.850% No 11,986
44 FY 2019 Construction - 2013 2043 15,000 5,536 6.000% No 5,536
45 FY 2019 Construction - 2013 2043 30,000 30,000 6.000% No 30,000
46 FY 2019 Subtotal: - - - 351,620 343,626 - - 243,312
47 FY 2020 Construction - 2009 2020 50,000 50,000 3.830% No 50,000
48 FY 2020 Construction - 2010 2020 43,000 43,000 3.842% No 43,000
49 FY 2020 Construction - 2010 2020 50,000 50,000 3.118% No 50,000
50 FY 2020 Construction - 2014 2020 5,260 5,260 2.200% No 5,260
51 FY 2020 Construction - 2014 2020 5,640 5,640 2.200% No 5,640
52 FY 2020 Construction - 2014 2020 6,140 6,140 2.200% No 6,140
53 FY 2020 Construction - 2014 2020 6,540 6,540 2.200% No 6,540
54 FY 2020 Construction - 1998 2028 112,300 100,314 5.850% No 59,637
55 FY 2020 Subtotal: - - - 278,880 266,894 - - 226,217
ERRATA BP-14-FS-BPA-08A-E02
Page 47 of 50

Table 13-8: Application of Amortization ($000s) (FY 2015)
A B C D E F G H I J
YEAR PROJECT
APPROPRIATION
TYPEIN
SERVICE DATE PRINCIPAL BALANCE RATE ROLLOVER
AMOUNT
AMORTIZED
56 FY 2021 Construction - 2010 2021 15,000 15,000 4.188% No 15,000
57 FY 2021 Construction - 2010 2021 22,000 22,000 4.094% No 22,000
58 FY 2021 Construction - 2010 2021 22,000 22,000 3.694% No 22,000
59 FY 2021 Construction - 2010 2021 22,000 22,000 3.374% No 22,000
60 FY 2021 Construction - 2015 2021 5,390 5,390 3.300% No 5,390
61 FY 2021 Construction - 2015 2021 5,780 5,780 3.300% No 5,780
62 FY 2021 Construction - 2015 2021 6,290 6,290 3.300% No 6,290
63 FY 2021 Construction - 2015 2021 6,700 6,700 3.300% No 6,700
64 FY 2021 Construction - 1998 2028 112,300 40,677 5.850% No 40,677
65 FY 2021 Construction - 1998 2028 106,500 106,500 5.850% No 77,646
66 FY 2021 Subtotal: - - - 323,960 252,337 - - 223,483
67 FY 2022 Construction - 2009 2022 35,000 35,000 4.253% No 35,000
68 FY 2022 Construction - 2009 2022 20,000 20,000 4.200% No 20,000
69 FY 2022 Construction - 2010 2022 30,000 30,000 3.372% No 30,000
70 FY 2022 Construction - 2010 2022 20,000 20,000 3.029% No 20,000
71 FY 2022 Construction - 1998 2028 106,500 28,854 5.850% No 28,854
72 FY 2022 Construction - 2009 2039 35,000 35,000 5.192% No 33,350
73 FY 2022 Construction - 2013 2043 55,000 55,000 5.700% No 55,000
74 FY 2022 Subtotal: - - - 301,500 223,854 - - 222,204
75 FY 2023 Construction - 2010 2023 46,000 46,000 3.161% No 46,000
76 FY 2023 Construction - 2009 2039 35,000 1,650 5.192% No 1,650
77 FY 2023 Construction - 2015 2045 51,130 51,130 5.100% No 9,493
78 FY 2023 Construction - 2015 2045 76,700 76,700 5.100% No 76,700
79 FY 2023 Construction - 2015 2045 84,570 84,570 5.100% No 84,570
80 FY 2023 Subtotal: - - - 293,400 260,050 - - 218,412
81 FY 2024 Construction - 2012 2024 45,000 45,000 3.360% No 45,000
82 FY 2024 Construction - 2015 2045 51,130 41,637 5.100% No 41,637
83 FY 2024 Construction - 2015 2045 50,940 50,940 5.100% No 50,940
84 FY 2024 Construction - 2015 2045 53,690 53,690 5.100% No 31,888
85 FY 2024 Construction - 2015 2045 53,690 53,690 5.100% No 53,690
86 FY 2024 Subtotal: - - - 254,450 244,957 - - 223,155
87 FY 2025 Construction - 2010 2025 15,000 15,000 4.310% Yes 15,000
88 FY 2025 Construction - 2012 2025 14,300 14,300 4.310% Yes 14,300
89 FY 2025 Construction - 2012 2025 26,000 26,000 4.310% Yes 26,000
90 FY 2025 Construction - 2012 2025 37,000 37,000 4.310% Yes 37,000
91 FY 2025 Environment - 2010 2025 10,000 10,000 4.279% No 10,000
92 FY 2025 Construction - 2015 2045 53,690 21,802 5.100% No 21,802
93 FY 2025 Construction - 2015 2045 44,050 44,050 5.100% No 44,050
94 FY 2025 Construction - 2015 2045 46,610 46,610 5.100% No 26,171
95 FY 2025 Construction - 2015 2045 47,790 47,790 5.100% No 47,790
96 FY 2025 Subtotal: - - - 294,440 262,552 - - 242,113
97 FY 2026 Construction - 2011 2026 45,000 45,000 3.450% No 45,000
98 FY 2026 Construction - 2015 2045 19,270 19,270 5.100% No 19,270
99 FY 2026 Construction - 2015 2045 46,610 20,439 5.100% No 20,439
100 FY 2026 Construction - 2015 2045 27,530 27,530 5.100% No 27,530
101 FY 2026 Construction - 2015 2045 39,140 39,140 5.100% No 39,140
102 FY 2026 Construction - 2016 2051 189,512 189,512 5.060% No 88,243
103 FY 2026 Subtotal: - - - 367,062 340,891 - - 239,622
104 FY 2027 Construction - 2012 2027 17,000 17,000 3.550% No 17,000
105 FY 2027 Environment - 2012 2027 13,000 13,000 3.550% No 13,000
106 FY 2027 Construction - 2016 2051 189,512 101,269 5.060% No 101,269
107 FY 2027 Construction - 2017 2052 196,922 196,922 5.060% No 106,701
108 FY 2027 Subtotal: - - - 416,434 328,191 - - 237,970
109 FY 2028 Environment - 2013 2028 5,000 5,000 5.000% No 5,000
110 FY 2028 Environment - 2013 2028 510 510 3.100% No 510
111 FY 2028 Environment - 2013 2028 540 540 3.100% No 540
112 FY 2028 Construction - 2017 2052 196,922 90,221 5.060% No 90,221
113 FY 2028 Construction - 2018 2053 203,574 203,574 5.060% No 139,884
114 FY 2028 Subtotal: - - - 406,546 299,845 - - 236,155
ERRATA BP-14-FS-BPA-08A-E02
Page 48 of 50

Table 13-8: Application of Amortization ($000s) (FY 2015)
A B C D E F G H I J
YEAR PROJECT
APPROPRIATION
TYPEIN
SERVICE DATE PRINCIPAL BALANCE RATE ROLLOVER
AMOUNT
AMORTIZED
115 FY 2029 Construction - 2011 2029 50,000 50,000 4.238% No 50,000
116 FY 2029 Environment - 2014 2029 780 780 4.400% No 780
117 FY 2029 Environment - 2014 2029 1,250 1,250 3.600% No 1,250
118 FY 2029 Environment - 2014 2029 1,430 1,430 3.600% No 1,430
119 FY 2029 Environment - 2014 2029 1,920 1,920 3.600% No 1,920
120 FY 2029 Construction - 2018 2053 203,574 63,690 5.060% No 63,690
121 FY 2029 Construction - 2019 2054 208,629 208,629 5.060% No 118,020
122 FY 2029 Subtotal: - - - 467,583 327,699 - - 237,091
123 FY 2030 Construction - 2013 2030 42,110 42,110 4.100% No 42,110
124 FY 2030 Environment - 2015 2030 780 780 4.400% No 780
125 FY 2030 Environment - 2015 2030 1,250 1,250 4.400% No 1,250
126 FY 2030 Environment - 2015 2030 1,430 1,430 4.400% No 1,430
127 FY 2030 Environment - 2015 2030 1,920 1,920 4.400% No 1,920
128 FY 2030 Construction - 2019 2054 208,629 90,609 5.060% No 90,609
129 FY 2030 Construction - 2020 2055 215,471 215,471 5.060% No 97,367
130 FY 2030 Subtotal: - - - 471,590 353,570 - - 235,466
131 FY 2031 Construction - 2020 2055 215,471 118,104 5.060% No 118,104
132 FY 2031 Construction - 2021 2056 221,414 221,414 5.060% No 109,674
133 FY 2031 Subtotal: - - - 436,885 339,518 - - 227,779
134 FY 2032 Construction - 2011 2032 98,900 98,900 4.355% No 98,900
135 FY 2032 Construction - 2021 2056 221,414 111,740 5.060% No 111,740
136 FY 2032 Construction - 2022 2057 226,804 226,804 5.060% No 17,506
137 FY 2032 Subtotal: - - - 547,118 437,444 - - 228,146
138 FY 2033 Construction - 2011 2033 40,000 40,000 4.386% No 40,000
139 FY 2033 Construction - 2022 2057 226,804 209,298 5.060% No 96,362
140 FY 2033 Subtotal: - - - 266,804 249,298 - - 136,362
141 FY 2034 Construction - 2011 2034 40,000 40,000 4.416% No 40,000
142 FY 2034 Construction - 2011 2036 50,000 50,000 4.952% No 41,232
143 FY 2034 Construction - 2022 2057 226,804 112,936 5.060% No 112,877
144 FY 2034 Subtotal: - - - 316,804 202,936 - - 194,109
145 FY 2035 Construction - 2011 2035 40,000 40,000 4.794% No 40,000
146 FY 2035 Construction - 2011 2035 40,000 40,000 4.446% No 40,000
147 FY 2035 Construction - 2011 2035 40,000 40,000 4.446% No 40,000
148 FY 2035 Construction - 2011 2035 45,000 45,000 4.446% No 45,000
149 FY 2035 Construction - 2011 2036 50,000 8,768 4.952% No 8,768
150 FY 2035 Construction - 2011 2038 55,000 55,000 4.935% No 51,429
151 FY 2035 Subtotal: - - - 270,000 228,768 - - 225,197
152 FY 2036 Construction - 2011 2036 50,000 50,000 4.629% No 50,000
153 FY 2036 Construction - 2011 2038 55,000 3,571 4.935% No 3,571
154 FY 2036 Construction - 2011 2040 25,000 25,000 4.775% No 25,000
155 FY 2036 Construction - 2014 2044 79,760 79,760 4.500% No 53,689
156 FY 2036 Construction - 2014 2044 87,940 87,940 4.500% No 87,940
157 FY 2036 Subtotal: - - - 297,700 246,271 - - 220,200
158 FY 2037 Construction - 2012 2037 35,000 35,000 3.503% No 35,000
159 FY 2037 Construction - 2014 2044 79,760 26,071 4.500% No 26,071
160 FY 2037 Construction - 2014 2044 53,170 53,170 4.500% No 4,986
161 FY 2037 Subtotal: - - - 167,930 114,241 - - 66,057
162 FY 2038 Construction - 2014 2044 53,170 48,184 4.500% No 48,184
163 FY 2038 Construction - 2014 2044 55,830 55,830 4.500% No 39,479
164 FY 2038 Subtotal: - - - 109,000 104,014 - - 87,663
165 FY 2039 Construction - 2011 2039 50,000 50,000 4.295% No 50,000
166 FY 2039 Construction - 2012 2039 39,000 39,000 3.627% No 39,000
167 FY 2039 Construction - 2014 2044 55,830 16,351 4.500% No 16,351
168 FY 2039 Construction - 2014 2044 52,970 52,970 4.500% No 52,970
169 FY 2039 Construction - 2014 2044 55,830 55,830 4.500% No 27,021
170 FY 2039 Subtotal: - - - 253,630 214,151 - - 185,342
ERRATA BP-14-FS-BPA-08A-E02
Page 49 of 50

Table 13-8: Application of Amortization ($000s) (FY 2015)
A B C D E F G H I J
YEAR PROJECT
APPROPRIATION
TYPEIN
SERVICE DATE PRINCIPAL BALANCE RATE ROLLOVER
AMOUNT
AMORTIZED
171 FY 2040 Construction - 2011 2040 35,000 35,000 3.796% No 35,000
172 FY 2040 Construction - 2012 2040 30,000 30,000 3.890% No 30,000
173 FY 2040 Construction - 2012 2040 45,000 45,000 3.890% No 45,000
174 FY 2040 Construction - 2014 2044 55,830 28,809 4.500% No 28,809
175 FY 2040 Construction - 2014 2044 45,810 45,810 4.500% No 36,716
176 FY 2040 Subtotal: - - - 211,640 184,619 - - 175,525
177 FY 2041 Construction - 2013 2043 60,016 60,016 4.100% No 14,293
178 FY 2041 Construction - 2013 2043 66,330 66,330 4.100% No 66,330
179 FY 2041 Construction - 2014 2044 45,810 9,094 4.500% No 9,094
180 FY 2041 Construction - 2014 2044 49,700 49,700 4.500% No 13,049
181 FY 2041 Subtotal: - - - 221,856 185,140 - - 102,766
182 FY 2042 Construction - 2013 2043 60,016 45,723 4.100% No 43,646
183 FY 2042 Subtotal: - - - 60,016 45,723 - - 43,646
184 FY 2043 Construction - 2013 2043 60,016 2,077 4.100% No 2,077
185 FY 2043 Construction - 2013 2043 39,950 39,950 4.100% No 39,950
186 FY 2043 Construction - 2013 2043 40,010 40,010 4.100% No 40,010
187 FY 2043 Construction - 2013 2043 42,110 42,110 4.100% No 42,110
188 FY 2043 Subtotal: - - - 182,086 124,147 - - 124,147
189 FY 2044 Construction - 2014 2044 20,040 20,040 4.500% No 20,040
190 FY 2044 Construction - 2014 2044 28,630 28,630 4.500% No 28,630
191 FY 2044 Construction - 2014 2044 49,700 36,651 4.500% No 36,651
192 FY 2044 Construction - 2014 2044 40,700 40,700 4.500% No 40,700
193 FY 2044 Construction - 2014 2044 48,470 48,470 4.500% No 48,470
194 FY 2044 Subtotal: - - - 187,540 174,491 - - 174,491
195 FY 2045 Construction - 2022 2057 226,804 59 5.060% No 59
196 FY 2045 Construction - 2023 2058 232,252 232,252 5.060% No 178,383
197 FY 2045 Subtotal: - - - 459,056 232,311 - - 178,442
198 FY 2046 Construction - 2023 2058 232,252 53,869 5.060% No 53,869
199 FY 2046 Construction - 2024 2059 236,640 236,640 5.060% No 117,122
200 FY 2046 Subtotal: - - - 468,892 290,509 - - 170,991
201 FY 2047 Construction - 2024 2059 236,640 119,518 5.060% No 119,518
202 FY 2047 Construction - 2025 2060 241,160 241,160 5.060% No 43,466
203 FY 2047 Subtotal: - - - 477,800 360,678 - - 162,984
204 FY 2048 Construction - 2025 2060 241,160 197,694 5.060% No 154,302
205 FY 2048 Subtotal: - - - 241,160 197,694 - - 154,302
206 FY 2049 Construction - 2025 2060 241,160 43,392 5.060% No 43,392
207 FY 2049 Construction - 2026 2061 244,724 244,724 5.060% No 101,623
208 FY 2049 Subtotal: - - - 485,884 288,116 - - 145,014
209 FY 2050 Construction - 2026 2061 244,724 143,101 5.060% No 135,183
210 FY 2050 Subtotal: - - - 244,724 143,101 - 135,183
211 FY 2050 Subtotal: - - - 356,443 174,161 - - 119,945
212 Grand Total: 10,771,010 8,372,560 6,337,312
ERRATA BP-14-FS-BPA-08A-E02
Page 50 of 50