Embed Size (px)
Citation preview

2014-2015 South Carolina Adult Tobacco Survey
Division of Tobacco Prevention and Control
South Carolina Department of Health and Environment Control

1
Contents Table 1: Percentage of SC adults who reported ever1 smoking cigarettes and currently2 smoking cigarettes
by demographics – Results from the 2014-2015 SC Adult Tobacco Survey. .................................................. 3
Table 2: Percentage of South Carolina adult current1 smokers by smoking frequency (current everyday &
someday smokers) – Results from the 2014-2015 SC Adult Tobacco Survey. ............................................... 4
Table 3: Percentage of South Carolina current1 adult smokers by average number of cigarettes smoked
per day – Results from the 2012 SC Adult Tobacco Survey. ........................................................................... 4
Table 4: Percentage of SC adults who reported ever1 smoking e-cigarettes and currently2 smoking e-
cigarettes by demographics – Results from the 2014-2015 SC Adult Tobacco Survey. ................................. 5
Table 5: Percentage of SC adults who reported current dual use1 of e-cigarettes2 and conventional
cigarettes3 or any tobacco product4 by demographics – Results from the 2014-2015 SC Adult Tobacco
Survey. ............................................................................................................................................................ 7
Table 6: Percentage of South Carolina adults who reported ever1 using other tobacco products (cigars,
smokeless tobacco, water pipe, snus) by demographics – Results from the 2014-2015 SC Adult Tobacco
Survey. ............................................................................................................................................................ 9
Table 7: Percentage of South Carolina adults who report current use of menthol cigarettes1 and other
tobacco products2 (cigars, smokeless tobacco, water pipe, regular pipe, and snus), by demographics –
Results from the 2014-2015 SC Adult Tobacco Survey. ............................................................................... 11
Table 8: Percentage of South Carolina adults exposed1 to Secondhand Smoke (SHS) at various locations –
Results from the 2014-2015 SC Adult Tobacco Survey. ............................................................................... 13
Table 9: Percentage of South Carolina adult current smokers1 and adults exposed to Secondhand Smoke
(SHS)2 at various locations among those with chronic conditions3 – Results from the 2014-2015 SC Adult
Tobacco Survey. ............................................................................................................................................ 13
Table 10: Percentage of South Carolina adults who reported being screened1 for tobacco use by a health
care provider during their visit in the past 12 months, overall and by chronic condition2 status – Results
from the 2014-2015 SC Adult Tobacco Survey. ............................................................................................ 14
Table 11: Percentage of South Carolina adults who reported receiving smoking cessation help from their
health care provider during their visit in the past 12 months – Results from the 2014-2015 SC Adult
Tobacco Survey. ............................................................................................................................................ 15
Table 12: Percentage of South Carolina adults who reported their quit intentions, awareness of cessation
services and use of cessation services during their quit attempt – Results from the 2014-2015 SC Adult
Tobacco Survey. ............................................................................................................................................ 15
Table 13: Percentage of South Carolina adult current smokers who reported having quit for one or more
days in the past 12 months, and sustained their abstinence – Results from the 2014-2015 SC Adult
Tobacco Survey. ............................................................................................................................................ 15
Table 14: Percentage of South Carolina adults who reported having seen one or more ads about not
smoking, by demographics – Results from the 2014-2015 SC Adult Tobacco Survey. ................................ 16

2
Table 15: Percentage of South Carolina adults who stated that the ads seen contributed to their attempt
to quit, by demographics – Results from the 2014-2015 SC Adult Tobacco Survey. ................................... 17
Table 16: Percentage of South Carolina adults who mentioned that smoking is never allowed at various
locations, overall and by current smoking status – Results from the 2014-2015 SC Adult Tobacco Survey.
...................................................................................................................................................................... 18
Table 17: Percentage of South Carolina adults who thought smoking should never be allowed at various
locations, overall and by current smoking status – Results from the 2014-2015 SC Adult Tobacco Survey.
...................................................................................................................................................................... 18
Table 18: Percentage of South Carolina adults who support a cigarette tax increase – Results from the
2014-2015 SC Adult Tobacco Survey. ........................................................................................................... 18

3
Table 1: Percentage of SC adults who reported ever1 smoking cigarettes and currently2
smoking cigarettes by demographics – Results from the 2014-2015 SC Adult Tobacco Survey.
Socio-Demographic Characteristic
Total Respondents
Ever Use of Cigarettes
Current Use of Cigarettes
% 95% CI3 % 95% CI
TOTAL
7503
43.1 (±1.7)
19.0 (±1.5)
Gender
Male
3072
49.8 (±2.6)
21.3 (±2.4)
Female
4431
36.8 (±2.2)
16.9 (±2.0)
Age Group
18-24
429
22.8 (±5.1)
15.6 (±4.3)
25-34
659
44.9 (±5.5)
29.5 (±5.4)
35-44
752
39.4 (±4.9)
21.0 (±4.4)
45-54
1146
45.6 (±3.8)
24.3 (±3.5)
55-64
1642
50.5 (±3.2)
18.1 (±2.6)
65+
2697
50.2 (±2.4)
8.4 (±1.4)
Race/Ethnicity
non-Hispanic White
4827
47.1 (±2.1)
18.8 (±1.9)
non-Hispanic Black
1817
34.1 (±3.2)
18.7 (±2.9)
non-Hispanic Asian
35
13.7 (±13.3)
4.8 (±4.8)
non-Hispanic American Indian & Alaska Native
38
63.5 (±17.5)
48.9 (±19.4)
non-Hispanic Other
436
60.7 (±7.1)
37.8 (±7.8)
Hispanic
131
28.8 (±12.5)
17.4 (±11.2)
Education
< High School
706
57.4 (±5.8)
35.2 (±5.9)
High School or GED
2014
46.0 (±3.2)
22.1 (±2.7)
Some College
2255
41.6 (±2.9)
17.3 (±2.5)
College Degree or Higher
2475
31.2 (±2.4)
6.0 (±1.3)
Marital Status
Married
3854
45.3 (±2.3)
14.7 (±2.0)
Not Married
3568
40.4 (±2.6)
23.4 (±2.4)
Household Poverty Status
Below 100% FPL
1209
44.5 (±5.0)
23.0 (±5.1)
At or Above 100% FPL
3304
43.6 (±2.7)
14.5 (±2.3)
Unspecified
2990
41.9 (±2.4)
22.3 (±2.1)
Residence
Urban
5489
43.6 (±2.0)
19.4 (±1.8)
Rural
1854
41.3 (±3.6)
17.5 (±2.8)
DHEC Region
Upstate
1782
43.0 (±3.4)
19.4 (±3.1)
Pee Dee
1782
44.1 (±3.3)
20.2 (±2.9)
Midlands
2062
44.6 (±3.3)
19.3 (±3.0)
Low Country 1717 39.4 (±3.2) 16.2 (±2.6)

4
1 - To determine ever use, respondents were asked ‘Have you ever tried cigarette smoking, even one or two puffs?’ 2 - To determine current use, respondents were asked two questions ‘Have you smoked at least 100 cigarettes in your entire life?’ and ‘Do you now smoke cigarettes every day, some days, or not at all? Those who smoked at least 100 cigarettes in lifetime and currently smoke every day or someday are coded as current smokers. 3 - Ninety-five percent confidence interval. Note large confidence intervals for distribution by race/ethnicity
Table 2: Percentage of South Carolina adult current1 smokers by smoking frequency (current
everyday & someday smokers) – Results from the 2014-2015 SC Adult Tobacco Survey.
Smoking Frequency Current Smokers (N=1097)
% 95% CI2
Everyday Smoker
74.2 (.7)
Someday Smoker 25.8 (.7) 1 - To determine current use, respondents were asked two questions ‘Have you smoked at least 100 cigarettes in
your entire life?’ and ‘Do you now smoke cigarettes every day, some days, or not at all? Those who smoked at least
100 cigarettes in lifetime and currently smoke every day or someday are coded as current smokers.
2 - Ninety-five percent confidence interval.
Table 3: Percentage of South Carolina current1 adult smokers by average number of cigarettes
smoked per day – Results from the 2012 SC Adult Tobacco Survey.
Average Number of Cigarettes Smoked
Per Day (CPD)
All Current Smokers (N=1097)
Current Everyday Smokers (N=788)
Current Someday Smokers (N=309)
% 95% CI2 % 95% CI % 95% CI
1-10 CPD
53.1 (.9)
40.9 (.7)
91.2 (.6)
11-20 CPD
39.0 (.8)
49.5 (.8)
6.5 (.9)
>20 CPD 7.8 (.1) 9.6 (.6) 2.2 (.2) 1 - To determine current use, respondents were asked two questions ‘Have you smoked at least 100 cigarettes in your entire life?’ and ‘Do you now smoke cigarettes every day, some days, or not at all? Those who smoked at least 100 cigarettes in lifetime and currently smoke every day or someday are coded as current smokers. 2 - Ninety-five percent confidence interval.

5
Table 4: Percentage of SC adults who reported ever1 smoking e-cigarettes and currently2
smoking e-cigarettes by demographics – Results from the 2014-2015 SC Adult Tobacco Survey.
Socio-Demographic Characteristic
Ever Tried e-Cigarettes Current Use of e-Cigarettes
Total Respondents
% 95% CI3
Total Respondents
% 95% CI
TOTAL
7497 16.2 (±1.5)
7492 6.2 (±1.1)
Gender
Male
3070 18.2 (±2.4)
3068 7.3 (±1.9)
Female
4427 14.4 (±1.8)
4424 5.1 (±1.2)
Age Group
18-24
429 28.6 (±5.7)
428 11.5 (±4.0) 25-34
657 28.0 (±5.2)
657 11.8 (±4.5)
35-44
752 17.1 (±4.1)
751 7.3 (±2.8) 45-54
1145 14.1 (±2.6)
1146 4.1 (±1.6)
55-64
1641 11.4 (±2.2)
1640 3.6 (±1.3) 65+
2695 4.9 (±1.2)
2693 1.8 (±0.8)
Race/Ethnicity
non-Hispanic White
4825 17.7 (±1.8)
4820 6.6 (±1.3)
non-Hispanic Black
1815 11.2 (±2.5)
1814 3.5 (±1.6)
non-Hispanic Asian
35 2.7 (±2.7)
35 --4 --
non-Hispanic American Indian & Alaska Native
38 27.8 (±19.7)
38 12.3 (±12.3)
non-Hispanic Other
436 35.5 (±7.8)
435 16.9 (±7.4)
Hispanic
131 14.9 (±11.3)
131 10.7 (±10.7)
Education
< High School
702 21.8 (±5.0)
701 7.9 (±3.2) High School or GED
2014 19.0 (±2.9)
2011 8.4 (±2.3)
Some College
2254 17.6 (±2.6)
2253 6.2 (±2.0) College Degree or Higher
2474 6.7 (±1.4)
2474 2.4 (±0.8)
Marital Status
Married
3853 12.9 (±1.9)
3853 4.9 (±1.5)
Not Married
3563 19.7 (±2.2)
3559 7.6 (±1.6)
Household Poverty Status
Below 100% FPL
1206 10.9 (±3.2)
1205 5.3 (±2.7)
At or Above 100% FPL
3303 13.6 (±2.5)
3300 5.8 (±1.9)
Unspecified
2988 21.2 (±2.1)
2987 7.0 (±1.3)
Residence
Urban
5484 17.2 (±1.7)
5483 6.6 (±1.3)
Rural
1853 11.6 (±2.5)
1850 4.3 (±1.9)
DHEC Region
Upstate
1782 16.7 (±3.1)
1776 7.2 (±2.6)
Pee Dee
1779 16.2 (±2.8)
1780 4.8 (±1.4)
Midlands
2061 15.0 (±2.7)
2061 5.9 (±1.9)
Low Country 1715 16.8 (±2.8) 1716 6.0 (±1.8)

6
1 - To determine ever use, respondents were asked ‘Have you ever used any of the following products: Electronic cigarettes such as “Smoking Everywhere” or “Njoy”?’. 2 - To determine current use, respondents were asked ‘During the past 30 days, […], on how many days did you use Electronic cigarettes, such as “Smoking Everywhere” or “Njoy"?’ Those who used on at least 1 day are coded as current users. 3 - Ninety-five percent confidence interval. 4 - Data are statistically unreliable because sample size was <50. Note large confidence intervals for distribution by race/ethnicity.

7
Table 5: Percentage of SC adults who reported current dual use1 of e-cigarettes2 and conventional cigarettes3 or any tobacco product4 by demographics – Results from the 2014-2015 SC Adult Tobacco Survey.
Socio-Demographic Characteristic
Dual Use With Conventional
Cigarettes Dual Use With Any Tobacco
Product
Total
Respondents % 95% CI5
Total
Respondents % 95% CI
TOTAL
7455 4.1 (±0.9)
7438 4.6 (±1.0)
Gender
Male
3052 5.1 (±1.7)
3040 6.0 (±1.8) Female
4403 3.2 (±0.9)
4398 3.3 (±0.9)
Age Group
18-24
428 6.4 (±2.9)
427 8.8 (±3.6) 25-34
653 7.8 (±4.0)
653 8.4 (±4.0)
35-44
748 4.4 (±2.5)
747 5.1 (±2.5) 45-54
1146 3.5 (±1.5)
1143 3.5 (±1.5)
55-64
1634 2.7 (±1.1)
1634 2.8 (±1.1) 65+
2676 1.3 (±0.7)
2663 1.3 (±0.7)
Race/Ethnicity
non-Hispanic White
4799 3.9 (±0.9)
4784 4.5 (±1.0) non-Hispanic Black
1803 2.7 (±1.5)
1801 2.8 (±1.6)
non-Hispanic Asian
35 --6 --
35 -- --
non-Hispanic American Indian & Alaska Native
38 12.3 (±12.3)
38 12.3 (±12.3)
non-Hispanic Other
433 14.8 (±7.4)
433 15.8 (±7.4)
Hispanic
131 10.7 (±10.7)
131 10.7 (±10.7)
Education
< High School
695 6.9 (±3.1)
690 7.6 (±3.3)
High School or GED
1999 4.6 (±1.6)
1994 5.6 (±1.8)
Some College
2244 4.2 (±1.9)
2241 4.4 (±1.9)
College Degree or Higher
2466 1.5 (±0.7)
2463 1.8 (±0.7)
Marital Status
Married
3837 3.1 (±1.3)
3827 3.3 (±1.3)
Not Married
3540 5.2 (±1.3)
3532 6.0 (±1.4)
Household Poverty Status
Below 100% FPL
1193 5.1 (±2.8)
1187 5.1 (±2.8)
At or Above 100% FPL
3283 3.5 (±1.6)
3277 3.8 (±1.7)
Unspecified
2979 4.3 (±1.1)
2974 5.2 (±1.1)
Residence
Urban
5459 4.3 (±1.1)
5448 4.9 (±1.1)
Rural
1841 3.4 (±1.8)
1834 3.7 (±1.8)
DHEC Region
Upstate
1772 5.3 (±2.4)
1765 6.2 (±2.6)
Pee Dee
1771 3.7 (±1.2)
1768 3.8 (±1.2)
Midlands
2051 3.6 (±1.4)
2047 3.7 (±1.4)
Low Country 1706 3.4 (±1.4) 1702 4.7 (±1.7)

8
1 - Dual use is defined as a respondent’s concurrent use of both electronic cigarettes and conventional cigarettes or electronic cigarettes and any tobacco product (cigarettes, cigars, smokeless tobacco, regular pipe, water pipe, snus). 2 - To determine current use of electronic cigarettes, respondents were asked ‘During the past 30 days, […], on how many days did you use Electronic cigarettes, such as “Smoking Everywhere” or “Njoy"?’ Those who used on at least 1 day are coded as current users. 3 - To determine current use of conventional cigarettes, respondents were asked two questions ‘Have you smoked at least 100 cigarettes in your entire life?’ and ‘Do you now smoke cigarettes every day, some days, or not at all? Those who smoked at least 100 cigarettes in lifetime and currently smoke every day or someday are coded as current smokers. 4 - To determine current use of other tobacco products, respondents were asked the following questions: “During the past 30 days, on how many days did you use chewing tobacco, snuff, or dip, such as Skoal, Copenhagen, Grizzly, Levi Garrett, Red Man, or Day’s Work?”, “During the past 30 days, on how many days did you smoke cigars, cigarillos, or very small cigars that look like cigarettes?”, “During the past 30 days, on how many days did you smoke tobacco in a water pipe?”, “During the past 30 days, on how many days did you smoke tobacco in a pipe other than a water pipe?”, “During the past 30 days, on how many days did you use snus?”. Those who used at least one of those tobacco products on 1 or more days are coded as current any tobacco users. 5 - Ninety-five percent confidence interval. 6 - Data are statistically unreliable because sample size was <50. Note large confidence intervals for distribution by race/ethnicity.

9
Table 6: Percentage of South Carolina adults who reported ever1 using other tobacco products
(cigars, smokeless tobacco, water pipe, snus) by demographics – Results from the 2014-2015
SC Adult Tobacco Survey.
Socio-Demographic Characteristic
Cigars (N=7494)
Smokeless
Tobacco (N=7499)
Water Pipe (N=7486)
Snus (N=7498)
% 95% CI2 % 95% CI % 95% CI % 95% CI
TOTAL
38.2 (±1.7)
23.9 (±1.5)
9.8 (±1.2)
5.0 (±0.9)
Gender
Male
57.5 (±2.7)
42.2 (±2.6)
13.1 (±2.0)
9.0 (±1.7)
Female
20.5 (±1.8)
7.1 (±1.1)
6.8 (±1.2)
1.4 (±0.5)
Age Group
18-24
33.3 (±5.8)
22.4 (±5.3)
26.2 (±5.3)
7.3 (±2.9)
25-34
42.6 (±5.3)
24.3 (±4.8)
21.0 (±4.3)
8.6 (±3.6)
35-44
38.9 (±4.8)
29.1 (±4.6)
8.3 (±2.9)
7.1 (±2.5)
45-54
40.7 (±3.8)
30.3 (±3.6)
4.8 (±1.7)
5.3 (±1.7)
55-64
40.3 (±3.1)
23.3 (±2.7)
3.2 (±1.0)
2.5 (±0.9)
65+
35.1 (±2.4)
16.9 (±2.0)
1.3 (±0.6)
1.4 (±0.6)
Race/Ethnicity
non-Hispanic White
42.5 (±2.1)
28.5 (±2.0)
9.4 (±1.3)
5.9 (±1.0)
non-Hispanic Black
28.1 (±3.1)
13.7 (±2.3)
8.2 (±2.2)
1.8 (±1.0)
non-Hispanic Asian
16.4 (±14.3)
3.4 (±3.4)
--3 --
-- --
non-Hispanic American Indian & Alaska Native
41.6 (±19.6)
24.4 (±16.0)
-- --
-- --
non-Hispanic Other
57.0 (±7.2)
32.9 (±7.4)
22.9 (±7.5)
11.0 (±4.8) Hispanic
26.6 (±11.6)
15.9 (±11.3)
17.1 (±11.2)
-- --
Education
< High School
35.5 (±5.5)
26.5 (±5.1)
6.6 (±3.4)
3.0 (±1.3) High School or GED
39.8 (±3.2)
25.2 (±2.9)
9.3 (±2.1)
5.7 (±1.6)
Some College
37.2 (±2.9)
23.2 (±2.7)
11.3 (±2.3)
5.9 (±2.1) College Degree or Higher
40.1 (±2.6)
22.1 (±2.3)
10.7 (±1.9)
4.4 (±1.2)
Marital Status
Married
40.6 (±2.3)
27.4 (±2.3)
6.1 (±1.4)
5.2 (±1.4) Not Married
36.0 (±2.5)
20.5 (±2.5)
14.1 (±1.9)
4.9 (±1.1)
Household Poverty Status
Below 100% FPL
29.7 (±4.4)
15.8 (±3.4)
5.4 (±2.7)
1.7 (±1.2) At or Above 100% FPL
37.8 (±2.7)
24.0 (±2.6)
6.4 (±1.8)
4.4 (±1.6)
Unspecified
42.1 (±2.4)
27.0 (±2.1)
15.2 (±1.9)
7.0 (±1.2) Residence
Urban
40.3 (±1.9)
24.0 (±1.8)
10.8 (±1.4)
5.1 (±1.0)
Rural
31.7 (±3.3)
23.9 (±3.3)
6.2 (±2.2)
4.9 (±1.6) DHEC Region
Upstate
38.8 (±3.3)
26.2 (±3.3)
11.8 (±2.9)
6.9 (±2.2)
Pee Dee
38.4 (±3.2)
25.5 (±2.9)
6.7 (±1.8)
5.6 (±1.8) Midlands
37.2 (±3.1)
22.2 (±2.7)
7.9 (±1.7)
4.1 (±1.2)
Low Country 41.0 (±3.4) 22.2 (±2.8) 13.8 (±2.6) 3.2 (±1.1)

10
1 - To determine the ever use of tobacco, respondents were asked “Have you ever tried smoking cigars, cigarillos, or very small cigars that look like cigarettes in your entire life, even one or two puffs?”, “Have you ever tried chewing tobacco, snuff, or dip, such as Skoal, Copenhagen, Grizzly, Levi Garrett, Red Man, or Day’s Work, even just one time in your entire life?”, “Have you ever tried smoking tobacco in a water pipe in your entire life, even one or two puffs?”, “Have you ever tried snus, even just one time in your entire life?”. 2 - Ninety-five percent confidence interval 3 - Data are statistically unreliable because sample size was <50. Note large confidence intervals for distribution by race/ethnicity

Table 7: Percentage of South Carolina adults who report current use of menthol cigarettes1 and other tobacco products2 (cigars, smokeless tobacco, water pipe, regular pipe, and snus), by demographics – Results from the 2014-2015 SC Adult Tobacco Survey.
Socio-Demographic Characteristic
Menthol Cigarettes Cigars Smokeless Tobacco Water Pipe Regular Pipe Snus
% 95% CI3 % 95% CI % 95% CI % 95% CI % 95% CI % 95% CI
TOTAL
53.4 (±4.7)
4.7 (±0.8)
3.6 (±0.7)
1.7 (±0.5)
1.0 (±0.3)
0.5 (±0.2)
Gender
Male
52.8 (±6.7)
7.4 (±1.4)
6.8 (±1.4)
2.4 (±1.0)
1.8 (±0.7)
0.9 (±0.5)
Female
54.2 (±6.5)
2.3 (±0.7)
0.7 (±0.3)
1.1 (±0.5)
0.2 (±0.2)
0.1 (±0.1)
Age Group
18-24
65.6 (±14.3)
11.0 (±3.6)
6.0 (±3.1)
5.8 (±2.6)
1.8 (±1.4)
--4 --
25-34
74.7 (±9.3)
7.1 (±2.4)
4.4 (±2.2)
3.2 (±1.7)
0.8 (±0.7)
1.0 (±0.9)
35-44
42.8 (±12.2)
5.1 (±2.5)
2.8 (±1.5)
-- --
1.1 (±0.8)
-- --
45-54
46.5 (±8.4)
3.6 (±1.4)
4.0 (±1.5)
-- --
-- --
0.7 (±0.7)
55-64
45.6 (±8.2)
2.9 (±1.0)
2.6 (±1.1)
-- --
0.5 (±0.3)
-- --
65+
27.8 (±8.3)
1.5 (±0.5)
2.2 (±0.8)
0.4 (±0.4)
0.6 (±0.4)
0.3 (±0.3)
Race/Ethnicity
non-Hispanic White
36.3 (±6.1)
4.1 (±0.9)
4.3 (±1.0)
1.3 (±0.6)
1.0 (±0.4)
0.7 (±0.3)
non-Hispanic Black
91.8 (±3.5)
5.1 (±1.7)
1.4 (±0.6)
2.0 (±1.4)
0.4 (±0.3)
0.2 (±0.2)
non-Hispanic Asian
-- --
-- --
-- --
-- --
-- --
-- --
non-Hispanic American Indian & Alaska Native
72.0 (±26.0)
-- --
-- --
-- --
-- --
-- --
non-Hispanic Other
55.7 (±13.9)
15.9 (±7.4)
4.0 (±2.3)
4.7 (±4.0)
-- --
0.4 (±0.4)
Hispanic
77.6 (±21.4)
5.0 (±4.1)
-- --
3.6 (±3.1)
-- --
0.4 (±0.4)
Education
< High School
59.1 (±10.3)
6.6 (±3.1)
5.3 (±2.2)
2.6 (±2.5)
1.0 (±0.9)
0.2 (±0.2)
High School or GED
51.6 (±7.2)
5.3 (±1.5)
4.5 (±1.7)
1.9 (±0.9)
1.2 (±0.8)
0.8 (±0.5)
Some College
50.0 (±8.3)
4.7 (±1.3)
2.9 (±1.0)
1.5 (±0.7)
0.9 (±0.6)
0.3 (±0.3)
College Degree or Higher
48.0 (±11.0)
2.9 (±0.9)
2.3 (±0.9)
0.9 (±0.6)
0.8 (±0.5)
0.7 (±0.5)
Marital Status
Married
38.9 (±8.1)
3.3 (±0.9)
3.4 (±0.9)
0.5 (±0.3)
0.7 (±0.3)
0.6 (±0.3)
Not Married
62.8 (±5.4)
6.4 (±1.4)
3.7 (±1.1)
2.9 (±1.1)
1.1 (±1.1)
0.5 (±0.3)

12
Socio-Demographic Characteristic
Menthol Cigarettes Cigars Smokeless Tobacco Water Pipe Regular Pipe Snus
% 95% CI3 % 95% CI % 95% CI % 95% CI % 95% CI % 95% CI
Household Poverty Status
Below 100% FPL
61.3 (±11.7)
4.5 (±2.7)
2.8 (±1.5)
-- --
-- --
0.2 (±0.2)
At or Above 100% FPL
45.3 (±8.7)
2.9 (±0.9)
3.3 (±1.2)
0.7 (±0.4)
0.5 (±0.4)
0.4 (±0.3)
Unspecified
55.9 (±5.4)
6.8 (±1.3)
4.3 (±1.1)
2.8 (±0.9)
1.6 (±0.7)
0.8 (±0.4)
Residence
Urban
52.5 (±5.6)
4.6 (±0.9)
3.2 (±0.8)
1.7 (±0.5)
0.9 (±0.4)
0.5 (±0.3)
Rural
55.0 (±8.6)
5.0 (±2.0)
4.7 (±1.5)
1.6 (±1.6)
0.7 (±0.5)
0.7 (±0.5)
DHEC Region
Upstate
52.7 (±9.4)
6.7 (±2.1)
5.5 (±2.6)
1.8 (±1.4)
1.4 (±0.8)
0.9 (±0.6)
Pee Dee
50.8 (±8.4)
4.6 (±1.5)
3.8 (±1.4)
1.2 (±0.7)
0.6 (±0.4)
0.5 (±0.4)
Midlands
52.3 (±9.1)
3.0 (±0.9)
2.0 (±1.9)
1.5 (±0.8)
0.4 (±0.4)
0.2 (±0.2)
Low Country 57.9 (±8.6) 4.7 (±1.4) 2.8 (±1.8) 2.2 (±1.0) 1.2 (±0.8) 0.4 (±0.4) 1 - Use of Menthol cigarettes was determined among current smokers and respondents were asked the question “During the past 30 days, were the cigarettes
that you usually smoked menthol?” Those who responded “Yes” are coded as current users.
2 - To determine current use of other tobacco products, respondents were asked the following questions: “During the past 30 days, on how many days did you
smoke cigars, cigarillos, or very small cigars that look like cigarettes?”, “During the past 30 days, on how many days did you use chewing tobacco, snuff, or dip,
such as Skoal, Copenhagen, Grizzly, Levi Garrett, Red Man, or Day’s Work?”, “During the past 30 days, on how many days did you smoke tobacco in a water
pipe?”, “During the past 30 days, on how many days did you smoke tobacco in a pipe other than a water pipe?”, “During the past 30 days, on how many days did
you use snus?”. Those who used those tobacco products on 1 or more days are coded as current users.
3 - Ninety-five percent confidence interval.
4 - Data are statistically unreliable because sample size was <50. Note large confidence intervals for distribution by race/ethnicity.

Table 8: Percentage of South Carolina adults exposed1 to Secondhand Smoke (SHS) at various locations – Results from the 2014-2015 SC Adult Tobacco Survey.
Exposure to SHS All Current Smokers Non-Smokers
% (95% CI)2 % (95% CI) % (95% CI)
At Home
10.6 (±1.2)
33.2 (±4.2)
5.4 (±0.8)
In Vehicles
16.3 (±1.4)
48.3 (±4.7)
8.7 (±1.1)
In indoor or outdoor workplaces
22.4 (±2.1)
38.8 (±6.2)
18.8 (±2.1)
In indoor or outdoor public places
27.5 (±1.6) 36.1 (±4.7) 25.4 (±1.6)
1 - Exposure to SHS is determined for the past 7 days.
2 - Ninety-five percent confidence interval
Table 9: Percentage of South Carolina adult current smokers1 and adults exposed to Secondhand Smoke (SHS)2 at various locations among those with chronic conditions3 – Results from the 2014-2015 SC Adult Tobacco Survey.
Chronic condition Current Smoker
SHS exposure in Homes
SHS exposure
in Vehicles
SHS exposure in Workplaces
SHS exposure
in Public Places
% (95% CI)4 % (95% CI) % (95% CI) % (95% CI) % (95% CI)
Heart Disease
18.1 (±4.1)
12.0 (±3.7)
13.1 (±3.8)
20.0 (±7.8)
19.9 (±4.1)
Cancer
12.7 (±4.0)
5.0 (±1.9)
10.9 (±3.4)
13.2 (±6.4)
20.2 (±5.6)
Diabetes
18.1 (±4.0)
11.3 (±2.6)
13.3 (±2.8)
20.4 (±8.9)
22.9 (±4.1)
Respiratory Disease
40.5 (±6.5)
26.1 (±6.1)
26.9 (±5.9)
26.7 (±11.3)
29.5 (±6.4)
Asthma
25.9 (±5.8)
15.9 (±4.2)
24.5 (±5.5)
28.3 (±6.9)
32.0 (±5.0)
High Cholesterol
17.0 (±2.3)
10.5 (±1.9)
12.5 (±2.0)
20.4 (±3.8)
22.2 (±2.5)
Hypertension 19.1 (±2.2) 10.6 (±1.7) 13.4 (±1.9) 22.2 (±3.6) 23.0 (±2.4) 1 - To determine current smoking, respondents were asked two questions ‘Have you smoked at least 100 cigarettes in your entire life?’ and ‘Do you now smoke cigarettes every day, some days, or not at all? Those who smoked at least 100 cigarettes in lifetime and currently smoke every day or someday are coded as current smokers. 2 - Reported exposure to SHS is determined for the past 7 days.
3 - To determine chronic conditions/diseases, respondents were asked the following questions: “Have you ever been told by a doctor or other health professional that you have heart disease?”; “Have you ever been told by a doctor or other health professional that you have cancer, other than skin cancer?”; :Have you ever been told by a doctor or other health professional that you have diabetes, or sugar diabetes [note: gestational diabetes is excluded from this estimate]?”; “Have you ever been told by a doctor or other health professional that you have a chronic lung disease, such as emphysema, chronic bronchitis, or chronic obstructive pulmonary disease, also known as c-o-p-d?”; “Have you ever been told by a doctor or other health professional that you have asthma?”; “Have you ever been told by a doctor or other health professional that you have high cholesterol?”; “Have you ever been told by a doctor or other health professional that you have high blood pressure, or hypertension?”. 4 - Ninety-five percent confidence interval

14
Table 10: Percentage of South Carolina adults who reported being screened1 for tobacco use
by a health care provider during their visit in the past 12 months, overall and by chronic
condition2 status – Results from the 2014-2015 SC Adult Tobacco Survey.
Characteristic Screened for Tobacco Use
% (95% CI)3
TOTAL (All Respondents)
95.0 (±1.0)
Chronic Condition
Heart Disease
96.3 (±2.0)
Cancer
95.9 (±3.1)
Diabetes
96.5 (±1.9)
Respiratory Disease
96.8 (±2.8)
Asthma
94.4 (±3.4)
Cholesterol
96.4 (±1.3)
Hypertension 95.8 (±1.5) 1 - To determine screening, all respondents were asked the question: “In the past 12 months, have you seen a
doctor, dentist, nurse, or other health professional?” Those who responded “Yes” and were current somedays or
everyday smokers were then asked the following question: “In the past 12 months, did any doctor, dentist, nurse, or
other health professional advise you to quit smoking cigarettes or using any other tobacco products?” Those who
responded “Yes” but were not current somedays or everyday smokers were asked the following question: “In the
past 12 months, did any doctor, dentist, nurse, or other health professional ask if you smoke cigarettes or use any
other tobacco products?”
2 - To determine chronic conditions/diseases, respondents were asked the following questions: “Have you ever
been told by a doctor or other health professional that you have heart disease?”; “Have you ever been told by a
doctor or other health professional that you have cancer, other than skin cancer?”; :Have you ever been told by a
doctor or other health professional that you have diabetes, or sugar diabetes [note: gestational diabetes is excluded
from this estimate]?”; “Have you ever been told by a doctor or other health professional that you have a chronic
lung disease, such as emphysema, chronic bronchitis, or chronic obstructive pulmonary disease, also known as c-o-
p-d?”; “Have you ever been told by a doctor or other health professional that you have asthma?”; “Have you ever
been told by a doctor or other health professional that you have high cholesterol?”; “Have you ever been told by a
doctor or other health professional that you have high blood pressure, or hypertension?”.
3 - Ninety-five percent confidence interval

15
Table 11: Percentage of South Carolina adults who reported receiving smoking cessation help
from their health care provider during their visit in the past 12 months – Results from the
2014-2015 SC Adult Tobacco Survey.
Health Care Professional advice and interventions to help quit
% (95% CI)1
Advised to quit smoking 51.1 (±4.1)
Advised to set a quit date 31.0 (±9.9)
Provided booklets, videos or websites 65.3 (±6.7)
Advised to use telephone Quitline or cessation counseling
55.2 (±7.3)
Prescribed NRT 50.2 (±7.5)
1 - Ninety-five percent confidence interval
Table 12: Percentage of South Carolina adults who reported their quit intentions, awareness of
cessation services and use of cessation services during their quit attempt – Results from the
2014-2015 SC Adult Tobacco Survey.
Characteristic % (95% CI)1
Intentions to quitting 67.2 (±4.2)
Awareness of cessation services (Quitline or other counseling services) among current smokers
56.1 (±4.0)
Use of cessation resources (Quitline, cessation program, medication or counseling) during quit attempt
31.5 (±5.7)
1 - Ninety-five percent confidence interval
Table 13: Percentage of South Carolina adult current smokers who reported having quit for
one or more days in the past 12 months, and sustained their abstinence – Results from the
2014-2015 SC Adult Tobacco Survey.
Characteristic % (95% CI)1
Quit for 1 or more days in past 12 months, all current smokers 58.6 (±5.1)
Everyday Smokers 53.1 (±6.3)
Someday Smokers 76.0 (±7.3)
Sustained abstinence for smoking in the past 12 months 14.4 (±4.4) 1 - Ninety-five percent confidence interval

16
Table 14: Percentage of South Carolina adults who reported having seen one or more ads about not smoking, by demographics – Results from the 2014-2015 SC Adult Tobacco Survey.
Socio-Demographic Characteristic
TV Ads Radio Ads Print Media Ads Any Media Ads
% 95% CI1 % 95% CI % 95% CI % 95% CI
TOTAL
83.5 (±1.4)
47.2 (±1.8)
57.3 (±1.8)
90.6 (±1.0)
Gender
Male
84.4 (±2.1)
49.6 (±2.7)
57.2 (±2.7)
91.1 (±1.6)
Female
82.7 (±1.9)
45.0 (±2.4)
57.4 (±2.3)
90.2 (±1.2)
Age Group
18-24
90.0 (±3.5)
63.1 (±6.4)
60.2 (±6.4)
95.7 (±2.4)
25-34
81.4 (±5.3)
59.3 (±5.5)
58.7 (±5.6)
91.7 (±3.7)
35-44
82.9 (±4.0)
56.0 (±4.9)
56.1 (±4.9)
91.7 (±2.3)
45-54
88.0 (±2.4)
52.2 (±3.9)
56.9 (±3.8)
92.3 (±2.0)
55-64
82.1 (±2.5)
37.5 (±3.2)
58.2 (±3.2)
89.1 (±2.0)
65+
79.7 (±2.0)
24.6 (±2.3)
55.1 (±2.6)
86.1 (±1.8)
Race/Ethnicity
non-Hispanic White
81.8 (±1.7)
43.3 (±2.2)
56.4 (±2.2)
90.0 (±1.1)
non-Hispanic Black
90.3 (±1.9)
56.1 (±3.5)
59.5 (±3.5)
93.8 (±1.6)
non-Hispanic Asian
52.6 (±25.5)
40.3 (±24.3)
38.8 (±22.8)
70.9 (±27.9)
non-Hispanic American Indian & Alaska Native
76.7 (±15.3)
46.0 (±19.8)
57.2 (±19.3)
81.7 (±14.6)
non-Hispanic Other
83.4 (±5.7)
48.3 (±7.7)
54.9 (±7.5)
87.9 (±5.4)
Hispanic
72.5 (±13.6)
57.8 (±12.8)
64.4 (±13.1)
86.8 (±11.5)
Education
< High School
83.1 (±5.4)
49.6 (±6.2)
55.5 (±6.1)
92.2 (±2.4)
High School or GED
87.6 (±1.9)
47.8 (±3.3)
57.3 (±3.2)
92.1 (±1.6)
Some College
83.4 (±2.5)
48.8 (±3.1)
59.7 (±3.0)
90.6 (±2.1)
College Degree or Higher
79.3 (±2.3)
43.2 (±2.8)
56.0 (±2.7)
88.4 (±1.6)
Marital Status
Married
82.4 (±1.9)
43.8 (±2.4)
56.7 (±2.4)
89.5 (±1.5)
Not Married
84.8 (±2.1)
51.0 (±2.7)
58.2 (±2.7)
92.0 (±1.3)
Household Poverty Status
Below 100% FPL
80.9 (±5.1)
40.6 (±5.7)
53.8 (±5.4)
89.5 (±2.4)
At or Above 100% FPL
84.6 (±2.0)
43.6 (±2.8)
59.2 (±2.8)
89.9 (±1.8)
Unspecified
83.4 (±1.8)
53.6 (±2.4)
56.6 (±2.4)
91.9 (±1.2)
Residence
Urban
83.1 (±1.6)
46.8 (±2.1)
56.1 (±2.1)
90.5 (±1.2)
Rural
85.6 (±2.7)
48.8 (±3.8)
61.7 (±3.5)
91.4 (±1.8)
DHEC Region
Upstate
82.0 (±2.8)
48.9 (±3.5)
58.2 (±3.4)
89.3 (±2.4)
Pee Dee
88.0 (±2.0)
45.3 (±3.4)
58.3 (±3.4)
93.4 (±1.5)
Midlands
83.5 (±2.7)
47.5 (±3.4)
56.2 (±3.4)
90.7 (±1.5)
Low Country 81.8 (±2.8) 45.8 (±3.6) 56.9 (±3.5) 90.3 (±2.1) 1 - Ninety-five percent confidence interval
17
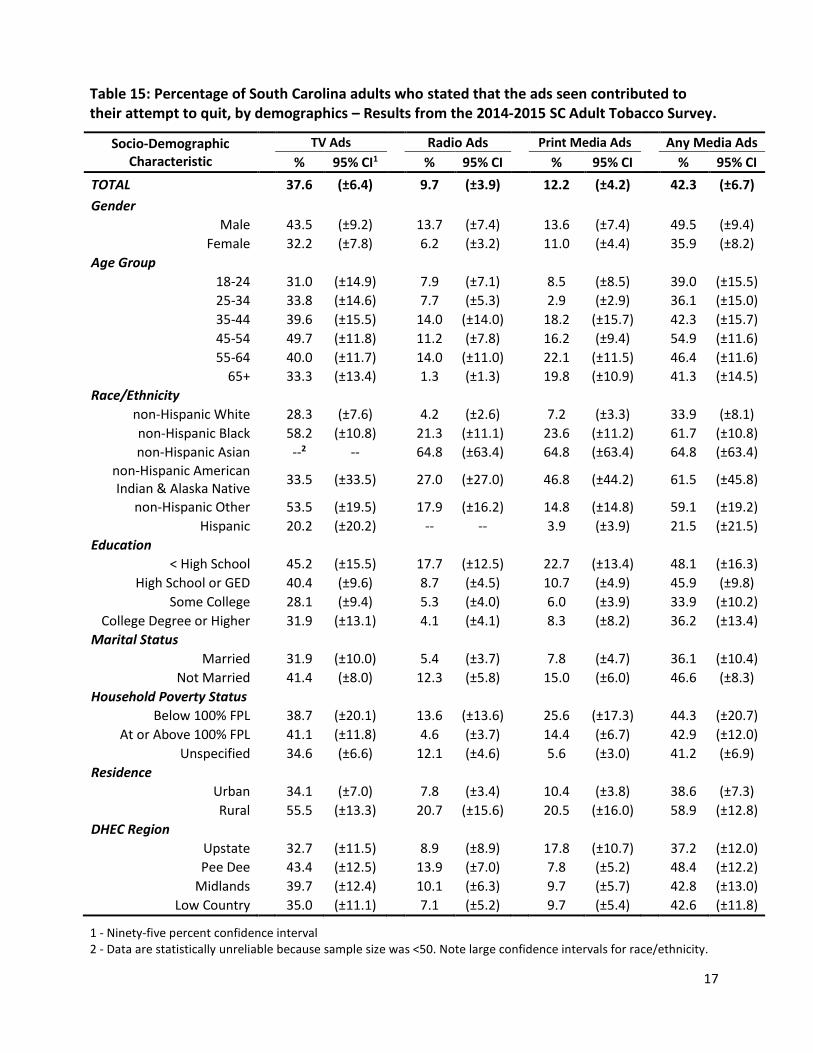
Table 15: Percentage of South Carolina adults who stated that the ads seen contributed to their attempt to quit, by demographics – Results from the 2014-2015 SC Adult Tobacco Survey.
Socio-Demographic Characteristic
TV Ads Radio Ads Print Media Ads Any Media Ads
% 95% CI1 % 95% CI % 95% CI % 95% CI
TOTAL
37.6 (±6.4)
9.7 (±3.9)
12.2 (±4.2)
42.3 (±6.7)
Gender
Male
43.5 (±9.2)
13.7 (±7.4)
13.6 (±7.4)
49.5 (±9.4)
Female
32.2 (±7.8)
6.2 (±3.2)
11.0 (±4.4)
35.9 (±8.2)
Age Group
18-24
31.0 (±14.9)
7.9 (±7.1)
8.5 (±8.5)
39.0 (±15.5)
25-34
33.8 (±14.6)
7.7 (±5.3)
2.9 (±2.9)
36.1 (±15.0)
35-44
39.6 (±15.5)
14.0 (±14.0)
18.2 (±15.7)
42.3 (±15.7)
45-54
49.7 (±11.8)
11.2 (±7.8)
16.2 (±9.4)
54.9 (±11.6)
55-64
40.0 (±11.7)
14.0 (±11.0)
22.1 (±11.5)
46.4 (±11.6)
65+
33.3 (±13.4)
1.3 (±1.3)
19.8 (±10.9)
41.3 (±14.5)
Race/Ethnicity
non-Hispanic White
28.3 (±7.6)
4.2 (±2.6)
7.2 (±3.3)
33.9 (±8.1)
non-Hispanic Black
58.2 (±10.8)
21.3 (±11.1)
23.6 (±11.2)
61.7 (±10.8)
non-Hispanic Asian
--2 --
64.8 (±63.4)
64.8 (±63.4)
64.8 (±63.4)
non-Hispanic American Indian & Alaska Native
33.5 (±33.5)
27.0 (±27.0)
46.8 (±44.2)
61.5 (±45.8)
non-Hispanic Other
53.5 (±19.5)
17.9 (±16.2)
14.8 (±14.8)
59.1 (±19.2)
Hispanic
20.2 (±20.2)
-- --
3.9 (±3.9)
21.5 (±21.5)
Education
< High School
45.2 (±15.5)
17.7 (±12.5)
22.7 (±13.4)
48.1 (±16.3)
High School or GED
40.4 (±9.6)
8.7 (±4.5)
10.7 (±4.9)
45.9 (±9.8)
Some College
28.1 (±9.4)
5.3 (±4.0)
6.0 (±3.9)
33.9 (±10.2)
College Degree or Higher
31.9 (±13.1)
4.1 (±4.1)
8.3 (±8.2)
36.2 (±13.4)
Marital Status
Married
31.9 (±10.0)
5.4 (±3.7)
7.8 (±4.7)
36.1 (±10.4)
Not Married
41.4 (±8.0)
12.3 (±5.8)
15.0 (±6.0)
46.6 (±8.3)
Household Poverty Status
Below 100% FPL
38.7 (±20.1)
13.6 (±13.6)
25.6 (±17.3)
44.3 (±20.7)
At or Above 100% FPL
41.1 (±11.8)
4.6 (±3.7)
14.4 (±6.7)
42.9 (±12.0)
Unspecified
34.6 (±6.6)
12.1 (±4.6)
5.6 (±3.0)
41.2 (±6.9)
Residence
Urban
34.1 (±7.0)
7.8 (±3.4)
10.4 (±3.8)
38.6 (±7.3)
Rural
55.5 (±13.3)
20.7 (±15.6)
20.5 (±16.0)
58.9 (±12.8)
DHEC Region
Upstate
32.7 (±11.5)
8.9 (±8.9)
17.8 (±10.7)
37.2 (±12.0)
Pee Dee
43.4 (±12.5)
13.9 (±7.0)
7.8 (±5.2)
48.4 (±12.2)
Midlands
39.7 (±12.4)
10.1 (±6.3)
9.7 (±5.7)
42.8 (±13.0)
Low Country 35.0 (±11.1) 7.1 (±5.2) 9.7 (±5.4) 42.6 (±11.8) 1 - Ninety-five percent confidence interval 2 - Data are statistically unreliable because sample size was <50. Note large confidence intervals for race/ethnicity.

18
Table 16: Percentage of South Carolina adults who mentioned that smoking is never allowed at various locations, overall and by current smoking status – Results from the 2014-2015 SC Adult Tobacco Survey.
Smoking is never allowed in
All Respondents Current Smokers Non-Smokers
% (95% CI)1 % (95% CI) % (95% CI)
Homes 83.7 (±1.3) 52.8 (±4.7) 91.0 (±1.0)
Vehicles 74.8 (±1.6) 28.7 (±4.4) 85.6 (±1.4)
Indoor workplaces 92.4 (±1.5) 85.3 (±5.9) 93.8 (±1.3)
Outdoor workplaces 30.5 (±2.2) 14.1 (±4.1) 34.2 (±2.4) 1 - Ninety-five percent confidence interval
Table 17: Percentage of South Carolina adults who thought smoking should never be allowed at various locations, overall and by current smoking status – Results from the 2014-2015 SC Adult Tobacco Survey.
Smoking should never be allowed
All Respondents Current Smokers Non-Smokers
% (95% CI)1 % (95% CI) % (95% CI)
At Home 76.4 (±1.5) 56.9 (±4.8) 81.0 (±1.4)
Indoor in Workplaces 83.0 (±1.4) 64.5 (±4.8) 87.5 (±1.2)
Indoors in Restaurants 78.4 (±1.5) 58.6 (±4.7) 83.1 (±1.4)
Indoors in Bars, Casinos or Clubs 55.0 (±1.8) 26.2 (±3.7) 61.9 (±1.8)
At Parks 49.8 (±1.8) 32.1 (±4.5) 53.9 (±1.8) 1 - Ninety-five percent confidence interval
Table 18: Percentage of South Carolina adults who support a cigarette tax increase – Results from the 2014-2015 SC Adult Tobacco Survey.
Characteristic Support cigarette tax increase
% (95% CI)1
TOTAL (All Respondents) 72.9 (±1.6)
Smoking Status Current Smokers 52.4 (±4.8)
Non Smokers 77.9 (±1.5) DHEC Region
Upstate 75.9 (±2.9) Midlands 69.9 (±3.0) Pee Dee 72.9 (±3.0)
Low Country 71.8 (±3.3) Residence
Urban 73.0 (±1.8)
Rural 73.6 (±3.0) 1 - Ninety-five percent confidence interval