Embed Size (px)
Citation preview

To visit us online go to:
www.sccassessor.org
Office of the County AssessorLawrence E. Stone, Assessor
Lawrence E. Stone, Assessor$357,340,668,642
2014-2015 Assessor’sAnnual Report

James Abe Bien Abordo Ed Abramowitz Shalini Agrawal Linda Aguilar Janet Allieu Gene Almerido Annabelle Alquiza Oscar Amaya Medel Angel NormanArias Michael Arriola Audrey Atkins Tuan Au Anita Badger Patty Barber Vanessa Barkin Jeff Barlow Cynthia Bartolino MichaelBautista David Bethel Neeraj Bhardwaj Matt Boxberger Jon Bredeson Stephen Buckley Charmaine Cabuag Carol Callahan Mia CampanaCarlos Cansino Jackie Cantu Celerina Celeste Jocelyn Champlin Robert Chapman Debbie Chavez Tracy Chavez Roland ChildBordon Chin Jae Choe Michelle Chou Dawn Cieslik Theresa Cisneros Dick Cloyd Craig Cooper Daniel Cooper Kent Corey LisaCortez Diane Cox Magdalena Cruz Barry Delfin Sourita Dey Francisco Diaz Huong Dinh Charles Dinh Deborah Dini JamesDiTomaso Tara Duncan Tony Duong Thy Duong James Duong Gary Duryea Soman Easaw Gloria Elia Sandy Emerson Fe EscalanteRey Eugenio Maya Ewing Khalid Fazel Richelle Feldan AaronFeldman Richard Fisher Edward Flores Gemma Foster KenFrickle Marie Fuentes Shayne Fulford Lorna Gabon NoraGalvez Madan Ganti Joseph Garcia Gabriel Garcia David GinsborgFrank Giordano Bruce Glenday Vipin Goel Flor Gonzales TeresaGonzalez Manuela Gonzalez Jared Gregory Kevin Gruidl Ashok
Gupta Brook Haile Gina Hale GinnyHamley Murray Hartmann CaraHeaney Brenda Hidalgo JuliusHo Stella Hong Pam HopkinsMike Hsu Chris Hughes TriHuynh Jenny Huynh Nora
Huynh Ricky Isabel Julie Jacobson David Johnston Michael KangCurt Kendall Darrell Kettner Joey Kimpo Karen Klein Karen KlosterMike Kofnovec Melissa Kong Bowman Kong Jeff Kwan Wei-Jim Lai Sue-ee Lai Hien Lam Peter Lan Young Lee Debra LeeKristen Leglu Kathy LeGrande Richard Leong Matt Leslie SteveLin David Liu Brian Lombard Carl Lombard Danette Lopes VickieLopez Fraser Louie Kari Luescher Melody Luong Trinh Luu-NguyenJohn Maag Joe Machado Tess Manesis Gavin Martinez EricMatsuda Cheryl McCloskey Lyn McLain Rita Medina Tiffany MingCarol Mondino Theresa Montenegro Greg Monteverde Hazel MoralesSusan Murphy Leonard Namimatsu Bertha Negrete Quoc NgoWayne Nguyen Caroline Nguyen Huy Nguyen Carlito Non RobNorman Josie Olivarez Melvin Osby Ed Palacio Lydia PaquizImelda Pea Sylvia Pedraza Jyoti Pendse Stephanie PerezXuanhuong Pham Phu Phan Janene Pratt Grace Quilty NoeQuinanola David Ramirez Rubi Ramirez Shashank Ranjan JohnRecchio Marty Reinders Shannon Rice Hipolito Rico Delia RivasRoy Rivas Albert Rivera Lisa Rodriguez Renee Rodriguez
Manuela Rosalez Debra RossRebecca Ross Emilie Roy MohitS a b h e r w a l E l i z a b e t hSamaro Ford Sandberg PattieSantillanez Jen Santos MariaSarabia Selu Sataraka Juan
Schiappacasse Cheryl Schneider Laura Scott Alfred Semene Naren Shah Chetan Shah David Shank Jerome Shaw Mai Shearer KyleSheridan Winston Shiah Tommy Shing Helen Silva John Sleeman Hector Solorzano David Song Cheryl Soriano Kimberly StarrettMarian Stewart Larry Stone Roopa Subramanian Steven Suehiro Marianne Suriaga Christine Swensen Kim Tang Kevin TannerCristina Thomas Jasmine Ting Patrick Tisdale Jeanette Tonini Cristina Torio Nicole Tran Heather Tran Natalie Tran Chuong Tran KhanhTran Maria Trinidad Pam Umeda Carmen Valles Peter Van Der Pas Susan Vasconcelos Jackie Ventimiglia Kristina Vinson JudyWellman Dana Wenzell Heather White David Wierzba Mullissa Willette Michelle Wong Julie Wood Richard Xavier Wendy XiaVanessa Yang Will Young Michelle Zaffa Eric Zamudio Gumersindo Zavala Lucia Zhao
Table of ContentsMessage from the Assessor . . . . . . . . . . . . . . . . . . . . . . . . . . . . . . . . .1
Factors Causing Change to the Assessment Roll . . . . . . . . . . . . . . . .3
Largest Taxpayers/How Tax Bills are Calculated . . . . . . . . . . . . . . . . .5
Assessment Roll . . . . . . . . . . . . . . . . . . . . . . . . . . . . . . . . . . . . . . . .6
Supplemental Assessments . . . . . . . . . . . . . . . . . . . . . . . . . . . . . . . . .8
Bay Area & Top 15 Counties Roll Comparison . . . . . . . . . . . . . . . . .9
Assessment Information by City . . . . . . . . . . . . . . . . . . . . . . . . . . .10
Real Property by City & Property Type . . . . . . . . . . . . . . . . . . . . . .12
Exemptions . . . . . . . . . . . . . . . . . . . . . . . . . . . . . . . . . . . . . . . . . . .13
Temporary Declines & Restorations in Value (Proposition 8) . . . . .14
Proposition 13 . . . . . . . . . . . . . . . . . . . . . . . . . . . . . . . . . . . . . . . .16
Department Overview . . . . . . . . . . . . . . . . . . . . . . . . . . . . . . . . . . .18
Business Personal Property by City . . . . . . . . . . . . . . . . . . . . . . . . .20
Business Personal Property by Property Type/Top Companies . . . . .21
Changes in Ownership/New Construction by City/Property Type .22
Major New Construction/Changes in Ownership . . . . . . . . . . . . . .23
Assessed Value by City & School District by Property Type . . . . . . .24
Assessment Appeals . . . . . . . . . . . . . . . . . . . . . . . . . . . . . . . . . . . . .27
Performance Counts . . . . . . . . . . . . . . . . . . . . . . . . . . . . . . . . . . . .30
Frequently Asked Questions/Directions to Office . . . . . . . . . . . . . . 33
Explanation of Terms . . . . . . . . . . . . . . . . . . . . . . . . . . . . . . . . . . . .34
Property Assessment Calendar . . . . . . . . . . . . . . . . . . . . . . . . . . . . .36
Above are all the permanent employees that contributed to the closing of the 2014-2015 Assessment Roll. The pictured employeesare, clockwise from top: Bien Abordo, David Ginsborg, Gabriel Garcia, Jocelyn Champlin, Mullissa Willette, and Roy Rivas.

www.sccassessor.org 1
Current Year Roll Growth*
Message from the AssessorLawrence E. Stone
ilicon Valley is experiencing the resurgence of a once endan-gered bird: the construction crane! The mechanical birdsare once again crowding the skies from San Jose to Palo Altoin the rush to build new office buildings and apartments.
During the past two years, Silicon Valley has benefited froma very robust economic recovery. The steady, month-over-month declines in unemployment have fueled a buildingboom in office and multi-family construction not seen since 2007.
In 2014, the net assessment roll for Santa Clara Countyincreased 6.8 percent, from $335 billion to $357 billion—the third-highest roll growth in County history. In 2013,the net assessment roll increased 8.35 percent. TheCounty’s high-water mark occurred in 2001 when theassessment roll grew by 15.6 percent! That record wouldhave been broken in 2014 had the California ConsumerPrice Index (CCPI), set statewide, been the standard twopercent allowed by Proposition 13. Instead, the CCPI wasa meager 0.454 percent, the second-lowest since the votersapproved Proposition 13 in 1978. Because the assessedvalue of 90 percent of all properties increased by only 0.454percent instead of two percent, total assessments in SantaClara County were $5 billion lower than they would havebeen in a normal year.
The Assessor’s Annual Report provides detailed statistics,charts, and narrative information about the 2014 assess-ment roll as of the lien (valuation) date of January 1, 2014.Requested by nearly 4,000 business and civic leaders, thereport is an important document for public finance officials,real estate professionals and corporate, government, busi-ness and community leaders who are interested not only inwhere real estate markets have been, but the likely directionof future property values in Santa Clara County.
The report compares the datahistorically and geographically,and contains details regarding alllocally assessed property, bothsecured and unsecured. The statistical data distinguishesbetween business personal property (unsecured) and realproperty (secured), as well as exemptions. Comprehensivevalue information is provided by property type, city andschool district. There is extensive data describing the com-munities and property types that contributed most to thegrowth of the annual assessment roll. In addition to numer-ical information, there is narrative about the performance ofthe Assessor’s Office, assessment appeal trends, and how theproperty tax system is administered. Assessments of publicutilities are the responsibility of the California State Board ofEqualization (BOE) and are not included. This year’s reportalso contains new information about assessment appeals andaffordable housing detailed by city.
Role of the County Assessor’s OfficeThe Assessor’s Office is responsible for annually determiningthe assessed value of all real and business property in SantaClara County. The assessment roll is comprised of 526,052assessable roll units, and is the basis upon which propertytaxes are levied. Property taxes are an essential source of rev-enue supporting basic public services provided by schoolsand local governments. These public jurisdictions form thefoundation of our region’s quality of life.
FactorsContributing toAssessmentGrowth andDeclineThe annual increase or decline in the assessment roll is dueto a combination of factors including changes in ownership,increases of assessed value for properties that had previouslyreceived a temporary reduction (Proposition 8), new con-struction, business personal property, exemptions, and the
S
2014-2015 Valuation Changes
Assessment Roll Value Change: 2014-2015 2013-2014 Dollar Change % Change
Local Roll Before Exemptions $376.39 $352.75 $23.64 6.70%
Less: Nonreimbursable Exemptions (19.05) (18.17) -0.88 -4.88%
NET LOCAL ROLL VALUE $357.34 $334.58 $22.76 6.80%Note: Minor discrepancies may occur due to rounding calculations. Percentages based on non-rounded values.* Exclusive of Public Utility Valuations. Values in Billions

2 www.sccassessor.org
CCPI. Also included are institutional exemptions not reimbursed by the State.
When the market value of a property drops below the pre-viously established assessed value, as it did for thousands ofproperties during the recession, Proposition 8 (passed by thevoters in 1978) requires the Assessor to temporarily reducethe assessment to reflect the lower market value for the cur-rent year. Just as Proposition 8 requires the Assessor toreduce assessments during an economic downturn, it alsomandates that assessments be restored when the marketrecovers. For the second year in a row, the restoration of assessed values outpaced declines. The market alone determines whether the assessed value of a property isreduced or restored.
Last year, 81,000 properties were assessed below their pur-chase price as a result of the collapse of the residential realestate market during the “Great Recession.” This year, themarket value of 38,640 of those properties has risen to the point that all the value lost has been fully restored, and the market value now exceeds the original purchaseprice. In addition, assessed values of another 38,000 prop-erties were partially restored to reflect the surging residentialproperty market.
Despite the strong overall recovery, seven percent of all sin-gle family homes and 14 percent of all condominiumsremain assessed below their purchase price. While everycommunity experienced strong year-over-year assessmentroll growth, neighborhoods primarily in South Santa ClaraCounty and east of Highway 101 were slow to recover fromthe recession. The aggregate assessed value of commercialand industrial properties receiving temporary reductionsdeclined for the third year by 20 percent, to $3.3 billion.The assessed values of the remaining 434,723 propertieswere adjusted by the CCPI as required by Proposition 13.
For the first time in six years, property sales and new con-struction were the primary drivers of increases in the assess-ment roll. Combined, these two factors accounted for 54percent of the $22 billion increase in the 2014 assessmentroll. The change in the assessed value of individual proper-ties is determined by the difference between the priorassessed value and the new market value. When a change inownership or new construction occurs, the real property isassessed at fair market value. The newly established value isreferred to as the “base year value.” In calendar year 2013,the number of properties that transferred ownership andwere reassessed at market value actually declined by sevenpercent, yet the average value per property transfer increasedby 41 percent, reflecting the strong economic recovery.
Another indicator of the robust recovery is the significantincrease in the value of property owned by businesses includ-ing machinery, equipment, computers and fixtures.
Geographic Differences While assessed values of all property in Santa Clara Countyincreased 6.8 percent, the factors that contributed to thatgrowth varied by geographic area. Residential communitiesthat were hardest hit by the collapse of the housing marketexperienced the greatest market value increases, causing acorresponding increase in assessments. Milpitas andMorgan Hill led all cities with growth rates of 9.73 and 9.36percent, respectively. At the depth of the recession, theassessed values in both communities were negative, withMorgan Hill at -6.15 percent. Other Silicon Valley cities,such as Sunnyvale and Mountain View, benefitted from theextraordinary resurgence in the value of commercial andindustrial property.
Challenges and AccomplishmentsAs Silicon Valley emerges from the worst economic crisissince the Great Depression, the demands on the Assessor’sOffice have shifted from reducing the assessment of morethan 25 percent of all homes, consistent with the decliningresidential market, and managing a 350-percent increase inassessment appeals, to appraising and assessing propertiesunder construction or properties transferred by sale to newowners. Despite these challenges and the lowest staffing lev-els since 1994, the Assessor’s Office utilized innovative tech-nology and performance management tools to minimizereductions in service levels. I have received countless letters,emails and personal anecdotal stories from property owners,complimenting my staff on their promptness and willing-ness to listen, explain and respond timely to complex issuesand problems.
As the local economy moves toward a period of more stable revenue, the County Board of Supervisors provided asmall increase (5%) in staffing levels to address serious back-logs accumulated during the recession. The results are note-worthy, and the following are some of our most significantaccomplishments.
Assessment Roll • Completed the annual assessment roll by the July 1, 2014deadline mandated by state law.
• Completed 98 percent of real property assessments.• Completed 98 percent of business personal propertyassessments.
• Completed 99.6 percent of the 1,021 business audits

www.sccassessor.org 3
mandated by state law, resulting in the discovery of $2.5billion in escape assessments.
• Processed 100 percent of recorded deeds.• Completed 100 percent of eligible exemptions.• Processed assessments for 72,589 business accounts• Processed 77,341 title documents.• Successfullydefendedassessedvaluesbefore theassessmentappeals board, retaining 94.6 percent of the assessed valuein dispute.
• Resolved 8,829 assessment appeals, including the success-ful defense of three major appeals in which the value indispute exceeded $50 million each.
• Reduced the backlog of unworked assessments by 20 percent.
Fiscal Management and Customer Service• Returned in excess of $200,000 of the Assessor’s budgetto the County General Fund. During my 19-year tenureas Assessor, I have returned, unspent, over $9.5 million tothe County General Fund.
• Assisted 53,968 taxpayers who contacted the office bytelephone, and 12,043 taxpayers who visited the publicservice counter.
• Provided confidential online access to comparable salesfor 352,000 residential property owners.
• Completed 10,235 hours of professional training, includ-ing 3,581 hours of State Board of Equalization (BOE)training classes.
• Conducted an outreach educational meeting for mem-bers of every historical commission in the county andother stakeholders, to better understand the process ofassessing historical properties.
Business Assessments and other Discovery• Processed 100 percent of all business property state-ments filed electronically, improving efficiency andaccuracy.
• Increased discovery of unrecorded changes of ownershipby legal entities including corporate mergers and acqui-sitions that had previously escaped reassessment.Penalties for the 26 companies that failed to respond torequests for information totaled $426,000.
• Field inspections led to the discovery of $164.6 millionin assessed value for entities no longer eligible for a prop-erty tax exemption.
• Audits of businesses mandated by the State resulted inthe discovery of $2.5 billion in previously unassessedvalue.
• For the first time in California, over 6,000 propertyowners utilized a new service to receive their annualassessment notice electronically eliminating a notice bymail.
• Launched two new online services enabling propertyowners to electronically change their mailing address, orview their property’s physical characteristics, such as theproperty’s square footage and the number of bedroomsand bathrooms, from the convenience of their home orbusiness.
• Completed several major technology projects designedto increase paperless processing and improve access tomarket data.
• Continued to improve the Assessor’s website, increasinginteractivity and functionality. In the past year, nearly300,000 “visitors” utilized the website viewed nearly 1.5million pages.
• Completed initial feasibility testing on an innovative virtual platform to re-host our 35-year-old legacy computer system.
Dollar % ofChange Change
Exemptions -0.88 100.00Subtotal, declines in values -$0.88 100.00%
Dollar % ofChange Change
Changes in ownership** 10.13 42.85Proposition 8 net change+ 7.90 33.42New construction** 2.79 11.80Corrections/Board/Other 2.33 9.86Business Personal Property 0.36 1.52CCPI inflation factor (2.0%) 0.13 0.55Subtotal, increases in value $23.64 100.00%
Factors Causing Change to the 2014-2015 Assessment Roll(in billions)
Grand Total of Changes to Assessment Roll $22.76** Net of CCPI annual increase+ Reflects those properties that did not establish a new base year value.
Note: A limited portion of new construction is reflected in the change in ownership figures.

4 www.sccassessor.org
• Continued our commitment to a first-class work envi-ronment by upgrading desktop computers, software, lap-tops, servers, and printers.
• Electronically imaged 579,007 documents consistentwith our commitment to a paperless work environment.For the first time, 100 percent of all documents wereprocessed electronically.
• Developed the Assessor’s budget entirely by service levelsincluding measurable, annual increases in productivity.
Leadership and Legislative • Together with the California Assessors’ Association, wecontinue to provide leadership on critical state legislationand Board of Equalization rules and regulations. Perhapsmost noteworthy, our office was credited with providingcritical leadership that resulted in the Governor’s appro-priation of $7.5 million in new funds for California asses-sors intended to increase productivity and improveefficiency.
• Launched a top-to-bottom review of internal practices,designing a new model for delivering projects andenhancing customer service levels.
• The Assessor’s Office continues to be a role model for accountability, strong management controls, trans-parency and high ethical standards.
Board of Equalization AuditOne of the accomplishments that I am particularly proud of was the State Board of Equalization audit and survey of our office. This is the fourth audit conducted since I assumed office in 1995, and with each report our perform-ance has improved.
Every five years the Board of Equalization (BOE) sends ateam of appraisers and auditors to our office to perform acomprehensive review of our practices and assessed values.Using a statistical sample of a prior assessment roll, the BOEofficials independently perform their own appraisals andreview selected business audits. In addition, they review ourcompliance with the provisions of the California Revenue &Taxation Code. Our office not only met the 95 percentcompliance standard, but achieved a total ratio of 99.94 per-cent, a new record.
The audit results are reviewed by elected policy makers, tax-payer organizations, the Board of Supervisors, the CivilGrand Jury and the media. Failure to meet a minimumthreshold automatically results in an immediate cut of $8.4million—equivalent to 29 percent of our budget.
In the official announcement of the 67-page audit, Board ofEqualization Member Betty Yee complimented our office
for our strong management, and specifically noted the “pro-fessionalism of our staff” and our “effective use of new tech-nology to improve customer service and performanceoutcomes.”
Trends and Future GoalsWe continue to focus on developing and implementing cre-ative solutions to improve efficiency, enhance productivityand increase performance, while reducing costs. One of ourmajor challenges is the replacement of our 35-year-old lega-cy system. The project was interrupted when the privatevendor abruptly terminated our contract. We were able tonegotiate a settlement to return all the funds ($2,250,000)that we paid to the vendor. We then contracted withGartner Group, an international technology consultingfirm, to conduct an independent risk assessment evaluatingthe options for continuing the system replacement project.Based upon Gartner’s recommendation we are re-hostingour antiquated system to a “virtual” platform designed tomitigate the risk of hardware failure, including a strategicincremental approach to replacing our system. This revisedapproach involves systematically replacing old functionalityin a scalable fashion. Our information systems team isworking extensively to prepare for this transition.
As County Assessor, I remain committed to the full implementation of a performance budgeting and manage-ment system that ties mission and goals directly to the budget, identifies, acknowledges and rewards superior per-formance, and focuses resources on continuous improve-ment initiatives based on quality, service, innovation andaccountability.
The Assessor’s Office employs a group of people that Ibelieve are among the most talented, ethical and dedicatedanywhere in government. It is our primary objective to treatall property owners and taxpayers with the highest degree ofcourtesy and professionalism. For 20 years it has been myhonor to serve the taxpayers, property owners and publicagencies in Santa Clara County. I was especially humbledby the voters’ decision to re-elect me to another term withthe highest number of votes of any candidate on the ballotin Santa Clara County. It is my privilege to continue man-aging an important county function that renders fair and accurate assessments and provides the highest level ofpublic service.
Lawrence E. Stone
Assessor

www.sccassessor.org 5
After the Assessor determines the assessedvalue of each assessable property in theCounty, the Finance Agency calculates andissues property tax bills in late September.
The property tax bill includes an amount nec-essary to make the annual payment on generalobligation bonds or other bonded indebted-ness imposed by public agencies and approvedby the voters and the maximum property taxrate of one percent.
Property tax revenue supports elementary,high school and community college districts aswell as local government agencies includingcities, the County, and special districts. Theproperty tax revenue is divided among thepublic taxing agencies. Following the dissolu-tion of redevelopment agencies (RDA) the
successor agencies created tomanage RDA’s outstandingdebt continue to receive aportion of property taxeswhich provides more revenueto other entities. For example,schools received 0.8 percent morerevenue due to the elimination of RDA’s.
The accurate, consistent and fair valuation ofproperty by the Assessor’s Office creates thefoundation that supports the delivery of vitalpublic services provided by local governments.The Assessor’s Office does not calculate taxes,collect taxes or allocate tax revenues. For infor-mation regarding the collection and allocationof property taxes, please contact the TaxCollector at (408) 808-7900 or the Controllerat (408) 299-5200 or www.scctax.org.
Santa Clara County Property Tax Revenue Allocation 2013-2014*
K-12 Public
Schools 45%
County 18%
Cities 13%
Redevelopment
Property Tax Trust
Fund11%
Community
Colleges 7%
Special
Districts 6%
*Data provided by the Santa Clara County Controller’s Office
The County Assessor’s Office does not calculate taxes,collect taxes or allocate tax revenues
The total taxes collected inFY 13-14 was$3,446,947,437*
Taxpayer Taxes Paid*1 Pacific Gas & Electric Co. $33,589,5022 Apple Computers $19,505,1523. Cisco Technology Inc. $15,668,7394 Google Inc. $14,724,0275 Blackhawk Parent LLC $12,443,623
Taxpayer Taxes Paid* 6 The Irvine Company LLC $12,441,9897 Westfield Malls $10,135,8948 Pacific Bell Telephone Co. $9,353,1099 Network Appliance Inc. $8,241,488
* Nine largest taxpayers on the 2013-2014 secured tax roll, includes local and state assessees. Source: Santa Clara County Tax Collector, July 2014
Largest Taxpayers 2014-2015*
How Tax Bills Are Calculated
6 www.sccassessor.org
2014/2015 2013/2014 Difference Change Land $173,161,340,956 $160,269,340,967 $12,891,999,989 8.04%Improvements (Real Property) $169,283,537,949 $158,891,509,282 $10,392,028,667 6.54%Improvements (Business Div) $2,387,801,233 $2,239,172,779 $148,628,454 6.64%Subtotal $344,832,680,138 $321,400,023,028 $23,432,657,110 7.29%
Personal Property $4,377,469,944 $4,056,208,465 $321,261,479 7.92%Mobilehomes $529,179,995 $508,198,266 $20,981,729 4.13%Subtotal $4,906,649,939 $4,564,406,731 $342,243,208 7.50%
TOTAL Gross Secured* $349,739,330,077 $325,964,429,759 $23,774,900,318 7.29%Less: Other Exemptions (sec) ($15,627,756,032) ($15,104,177,526) ($523,578,506) 3.47%
NET SECURED $334,111,574,045 $310,860,252,233 $23,251,321,812 7.48%
TOTAL Gross Unsecured* $26,653,733,394 $26,784,029,972 $130,296,578 -0.49% Less: Other Unsec. Exemptions ($3,426,061,494) ($3,063,408,211) ($362,653,283) 11.84%NET UNSECURED $23,227,671,900 $23,720,621,761 $492,949,861 -2.08%
TOTAL Local Roll $357,339,245,945 $334,580,873,994 $22,758,371,951 6.80% Homeowners' Exemptions $1,891,380,787 $1,920,733,255 ($29,352,468) -1.53%
Assessment Roll Summary2014-2015 Assessment Roll Compared to 2013-2014 (Exclusive of Public Utility Valuations)
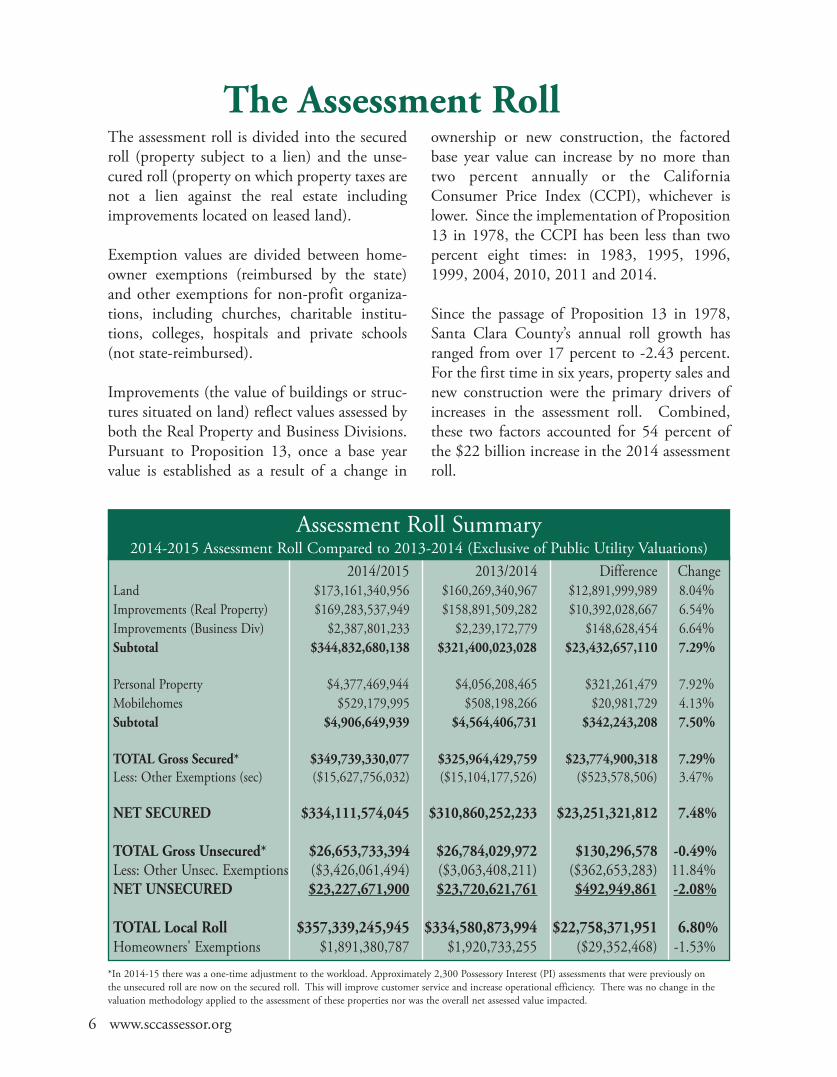
The assessment roll is divided into the securedroll (property subject to a lien) and the unse-cured roll (property on which property taxes arenot a lien against the real estate includingimprovements located on leased land).
Exemption values are divided between home-owner exemptions (reimbursed by the state)and other exemptions for non-profit organiza-tions, including churches, charitable institu-tions, colleges, hospitals and private schools(not state-reimbursed).
Improvements (the value of buildings or struc-tures situated on land) reflect values assessed byboth the Real Property and Business Divisions.Pursuant to Proposition 13, once a base yearvalue is established as a result of a change in
ownership or new construction, the factoredbase year value can increase by no more thantwo percent annually or the CaliforniaConsumer Price Index (CCPI), whichever islower. Since the implementation of Proposition13 in 1978, the CCPI has been less than twopercent eight times: in 1983, 1995, 1996,1999, 2004, 2010, 2011 and 2014.
Since the passage of Proposition 13 in 1978,Santa Clara County’s annual roll growth hasranged from over 17 percent to -2.43 percent.For the first time in six years, property sales andnew construction were the primary drivers ofincreases in the assessment roll. Combined,these two factors accounted for 54 percent ofthe $22 billion increase in the 2014 assessmentroll.
The Assessment Roll
*In 2014-15 there was a one-time adjustment to the workload. Approximately 2,300 Possessory Interest (PI) assessments that were previously on the unsecured roll are now on the secured roll. This will improve customer service and increase operational efficiency. There was no change in thevaluation methodology applied to the assessment of these properties nor was the overall net assessed value impacted.

www.sccassessor.org 7
Ten-Year Assessment Roll Summary$360,000,000,000$340,000,000,000$320,000,000,000$300,000,000,000$280,000,000,000$260,000,000,000$240,000,000,000$220,000,000,000$200,000,000,000
Ten-Year Assessment Roll Percentage Growth
Ten-Year Assessment Roll SummarySanta Clara County History Summary
16.00%14.00%12.00%10.00%8.00%6.00%4.00%2.00%0.00%-2.00%-4.00%
PercentRollChange
InflationFactor
2005 2006 2007 2008 2009 2010 2011 2012 2013 2014
(Exclusive of public utility valuation and nonreimbursable exemptions)
Year Net Local Roll Change in Value Percent Change Inflation Factor*2014-15 $357,339,245,945 $22,758,371,951 6.80% 0.45%2013-14 $334,580,873,994 $25,772,654,328 8.35% 2.00%2012-13 $308,808,219,666 $9,711,486,101 3.25% 2.00%2011-12 $299,096,733,565 $2,622,622,011 0.88% 0.75%2010-11 $296,474,111,554 ($7,382,109,767) -2.43% -0.24%2009-10 $303,856,221,321 $541,990,393 0.18% 2.00%2008-09 $303,314,230,928 $19,801,311,453 6.98% 2.00%2007-08 $283,512,919,475 $21,597,627,615 8.25% 2.00%2006-07 $261,915,291,860 $21,773,313,717 9.07% 2.00%2005-06 $240,141,978,143 $17,765,933,316 7.99% 2.00%* Proposition 13 limits the inflation factor for property values to 2% per year or the California Consumer Price Index, whichever is lower.
2005 2006 2007 2008 2009 2010 2011 2012 2013 2014

8 www.sccassessor.org
The Assessor’s Office produces a supplemental rollthat generates significant revenue not included aspart of the annual assessment roll. Last year, theassessed value of all supplemental assessmentstotaled $9.1 billion, generating over $91 million inproperty taxes. This is the highest in five years.
Supplemental assessments are processed daily,unlike the annual assessment roll which is basedupon the annual January 1 lien date. This data is auseful indicator of the current trends in the real
estate market and provides another indicator of therobust recovery. It is especially evident when thefirst six months of 2013 are compared to 2014.During that period the total average assessed valuefor transaction jumped from $210,000 to$359,000.
Below is a chart showing both the number of supplemental assessments processed and thecumulative assessed value per transaction for eachcalendar year.
What are Supplemental Assessments?Admittedly complicated and confusing, supplementalassessments were created by Senate Bill 813 in 1983to close what was perceived as loopholes andinequities in Proposition 13. Prior to the creation ofsupplemental assessments, changes in assessed valuedue to a change in ownership or completion of newconstruction would not result in higher taxes until thetax year (July 1 to June 30) following the lien datewhen the new values were placed on the assessmentroll. In some instances, taxes on the new assessmentswould not be collected for up to 21 months. Thisresulted in serious differences in tax treatment fortransactions that may have only been separated by oneday. It also created a substantial amount of new rev-enue for schools and local government.
Supplemental assessments are designed to identifychanges in assessed value (either increases or decreas-es,) that occur during the fiscal year such as changes inownership and new construction. They are in addi-tion (supplemental) to the traditional annual assess-ment and property tax bill. A tax bill is issued only onthe added value, and is prorated for the remainingportion of the fiscal year. For the next fiscal year, theentire new assessed value of the real property is addedto the regular assessment roll.The increase in value istaxed from the first of the month following the dateof completion of new construction or the change inownership. To better understand supplemental assessments or to calculate a supplemental assessmentand the supplemental taxes for a property, access anon-line, interactive tool at www.sccassessor.org/index.php/online-services/supplemental-calculator.
Supplemental Assessments
$500,000
$450,000
$400,000
$350,000
$300,000
$250,000
$200,000
$150,000
$100,000
50,000
45,000
40,000
35,000
30,000
25,000
20,000
15,000
10,0002009 2010 2011 2012 2013
Average Assessed Value Per Supplemental Assessment Number of Supplemental Assessments
(Avg. AV Per Sup Asmnt)
(Sup. Assessments)
Supplemental Information by Calendar Year
$291,319
$173,714
$132,529
$162,749$163,664

www.sccassessor.org 9
Bay Area Counties 2014-2015 Gross Secured, Unsecured and Total Assessment Roll
Santa Clara remains a leader in the value of business equipment and machin-ery (unsecured) with more value than San Diego and Riverside combined.
Most Populous 15 California Counties (ranked by population)2014-2015 Gross Secured, Unsecured and Total Assessment RollCounty Unsecured Roll Secured Roll Total Gross Roll Percent AV
increase over perprior year Capita+
1 Los Angeles $50,777,030,308 $1,195,940,988,303 $1,246,718,018,611 5.38% $124.152 San Diego $16,186,010,683 $417,231,048,042 $433,417,058,725 6.02% $135.683 Orange $20,902,659,620 $477,956,417,110 $498,859,076,730 6.26% $160.204 Riverside $7,719,809,388 $221,741,016,977 $229,460,826,365 7.74% $100.645 San Bernardino $11,325,432,385 $173,369,989,048 $184,695,421,433 6.34% $88.556 Santa Clara $26,653,733,394 $349,739,330,077 $376,393,063,471 6.70% $201.447 Alameda $12,818,206,943 $216,398,914,843 $229,217,121,786 6.47% $145.708 Sacramento $6,430,071,863 $128,067,746,545 $134,497,818,408 6.48% $92.489 Contra Costa $5,656,380,590 $158,965,560,297 $164,621,940,887 8.90% $151.4510 Fresno $3,181,884,692 $63,996,457,967 $67,178,342,659 5.62% $69.6811 Kern $8,466,601,249 $88,791,470,835 $97,258,072,084 5.81% $111.3912 Ventura $3,398,977,699 $113,562,836,462 $116,961,814,161 5.75% $138.7513 San Francisco $10,734,859,006 $169,001,854,462 $179,736,713,468 5.41% $214.8414 San Mateo $8,765,719,190 $156,088,386,167 $164,854,105,357 5.61% $221.2215 San Joaquin $3,703,999,478 $57,838,661,195 $61,542,660,673 9.07% $86.59
+ California Department of Finance, County population est., January 2013
County Unsecured Roll Secured Roll Total Gross Roll Percent AVincrease over per
prior year Capita+Alameda $12,818,206,943 $216,398,914,843 $229,217,121,786 6.47% $145.70Contra Costa $5,656,380,590 $158,965,560,297 $164,621,940,887 8.90% $151.45Marin $1,534,781,396 $62,347,177,982 $63,881,959,378 5.72% $249.69Monterey $2,231,717,275 $53,249,878,309 $55,481,595,584 5.99% $130.31Napa $1,330,656,413 $29,059,829,015 $30,390,485,428 5.49% $218.24San Benito $362,445,671 $6,104,579,833 $6,467,025,504 8.03% $112.44San Francisco $10,734,859,006 $169,001,854,462 $179,736,713,468 5.41% $214.84San Mateo $8,765,719,190 $156,088,386,167 $164,854,105,357 5.61% $221.22Santa Clara $26,653,733,394 $349,739,330,077 $ 376,393,063,471 6.70% $201.44
Santa Cruz $875,132,953 $36,659,893,717 $37,535,026,670 7.05% $138.20Solano $2,949,568,640 $43,734,391,753 $46,683,960,393 7.31% $110.04Sonoma $2,478,226,702 $69,170,536,003 $71,648,762,705 7.27% $146.08

10 www.sccassessor.org
Assessment Information by CityAssessment Roll Growth by City Residential communities
hardest hit by the collapseof the housing marketexperienced the greatestmarket value increases.Milpitas and Morgan Hillled all cities with growthrates over 9 percent.
Other Silicon Valley cities,like Sunnyvale andMountain View, benefit-ted from the extraordinaryresurgence in the value ofcommercial and industrialproperty.
2014-2015 Percent Growth by City12%
9%
6%
3%
0%
Saratoga
San Jose
Los Gatos
Mountain View
Cupertino
Santa Clara
Palo Alto
Los Altos
Los Altos Hills
Monte Sereno
Sunnyvale
Milpitas
Unincorporated
Campbell
Morgan Hill
Gilroy
Total* Total* Percent Value PerRoll 2014 Roll 2013 Growth** Capita+
Campbell $7.70 $7.24 6.37% $183.28Cupertino 17.10 16.20 5.52% 285.24Gilroy 6.66 6.17 7.88% 127.10Los Altos 11.89 11.16 6.59% 396.90Los Altos Hills 6.21 5.84 6.33% 743.31Los Gatos 9.99 9.46 5.62% 327.33Milpitas 14.06 12.81 9.73% 200.58Monte Sereno 1.72 1.63 5.33% 499.11Morgan Hill 7.22 6.60 9.36% 175.19Mountain View 20.03 18.76 6.76% 260.83Palo Alto 27.24 25.58 6.51% 407.47San Jose 140.97 131.93 6.85% 140.89Santa Clara 28.75 27.01 6.47% 237.19Saratoga 12.13 11.51 5.39% 392.82Sunnyvale 31.43 29.25 7.46% 213.73Unincorporated 14.23 13.42 6.07% 163.08TOTAL $357.34 $334.58 6.80% $191.24
* Net of nonreimbursable exemptions** Percentages and Totals based on non-rounded values+ California Department of Finance, County population est., January 2014

www.sccassessor.org 11
2014-2015 Net Assessment Roll by City(value in billions)
Secured Secured Unsecured Unsecured Total PercentCITY RPTTF* CITY RPTTF* Roll** of Roll+
Campbell $6.61 $0.80 $0.22 $0.07 $7.70 2.15%Cupertino 16.13 - 0.95 0.01 17.10 4.79%Gilroy 6.40 N/A 0.27 N/A 6.66 1.86%Los Altos 11.79 N/A 0.11 N/A 11.89 3.33%Los Altos Hills 6.21 N/A - N/A 6.21 1.74%Los Gatos 8.45 1.32 0.16 0.07 9.99 2.80%Milpitas 6.98 5.20 0.51 1.37 14.06 3.93%Monte Sereno 1.72 N/A - N/A 1.72 0.48%Morgan Hill 4.79 2.15 0.17 0.12 7.22 2.02%Mountain View 15.29 2.78 0.89 1.07 20.03 5.60%Palo Alto 25.57 N/A 1.67 N/A 27.24 7.62%San Jose 114.98 18.15 3.90 3.94 140.97 39.45%Santa Clara 22.17 2.24 3.47 0.89 28.75 8.05%Saratoga 12.09 N/A 0.04 N/A 12.13 3.40%Sunnyvale 27.18 1.08 3.02 0.89 31.43 8.80%Unincorporated 14.05 - 0.18 - 14.23 3.98%TOTAL $300.40 $33.71 $15.56 $7.67 $357.34 100.00%
Secured Roll: Property for which taxes become a lien on real property to secure payment of taxes. Unsecured Roll: Property for which taxes are not a lien on real property to secure payment of taxes.*RPTTF: Redevelopment Property Tax Trust Fund **Net of nonreimbursable exemptions +Percentages based on non-rounded values; - Indicates a value of 0 or less than $10 million
2014-2015 Net Assessment Roll by City
$30
$25
$20
$15
$10
$5
$0
(value in billions)
Real Property(RP) Business Personal Property (Unsecured)
San Jose
Sunnyvale
Palo Alto
Cupertino
Morgan Hill
Campbell
Mountain View
Gilroy
Los Gatos
Los Altos
Monte Sereno
Los Altos Hills
Unincorporated
Santa Clara
Saratoga
Milpitas
$140.97 Billion

12 www.sccassessor.org
2014-2015 Real Property Distribution by City(value in billions)
Land Improvement Total Exemptions+ Net ParcelValue Value Value Total Count
Campbell $4.05 $3.47 $7.51 $0.13 $7.38 11,965Cupertino 9.01 6.63 15.64 0.11 15.53 16,427 Gilroy 2.73 3.79 6.52 0.20 6.31 13,372 Los Altos 7.47 4.40 11.87 0.10 11.78 11,050 Los Altos Hills 3.74 2.50 6.24 0.04 6.21 3,226 Los Gatos 5.50 4.51 10.01 0.25 9.75 10,624 Milpitas 5.70 6.55 12.25 0.25 12.00 17,923 Monte Sereno 0.98 0.75 1.72 - 1.72 1,254 Morgan Hill 3.00 4.10 7.10 0.21 6.89 11,777 Mountain View 9.37 8.98 18.35 0.46 17.89 18,942 Palo Alto 14.41 13.54 27.95 2.63 25.32 20,882San Jose 65.34 69.86 135.20 4.34 130.86 237,518 Santa Clara 11.87 12.59 24.46 1.56 22.90 28,777 Saratoga 7.47 4.79 12.69 0.17 12.09 11,105 Sunnyvale 14.40 13.29 27.69 0.36 27.33 31,703Unincorporated 8.14 9.54 17.68 3.82 13.85 26,167 TOTAL $173.16 $169.28 $342.44 $14.64 $327.80 472,712
Note: Does not include mobilehomes; Now includes possessory interest assessments which until 2014-15 were previ-ously on the unsecured roll. Totals based on non-rounded values.- Indicates a value of 0 or less than $10 million +Nonreimbursable Exemptions
2014-2015 Real Property Distribution of Value by Property TypeProperty Type Value* Value Value Parcel Parcel
(in billions) Growth Percentage Count Percentage+Single Family Detached $189.93 16.33% 57.94% 332,928 70.43%Condominiums 32.77 23.67% 10.00% 81,937 17.33%Office 20.05 17.89% 6.12% 5,138 1.09%Apartments 5+ Units 21.33 26.63% 6.51% 5,892 1.25%Other Industrial/Non-Mfg 10.68 5.53% 3.26% 3,592 0.76%R&D Industrial 12.89 19.56% 3.93% 805 0.17%Specialty Retail and Hotels 10.48 8.88% 3.20% 5,816 1.23%Single Family 2-4 units 6.93 12.54% 2.12% 15,122 3.20%Other Urban 5.54 10.90% 1.69% 7,925 1.68%Major Shopping Centers 6.42 3.02% 1.96% 872 0.18%Electronic & Machinery Mfg. 2.78 -13.64% 0.85% 257 0.05%Other Industrial & Mfg. 3.00 -7.74% 0.91% 2,150 0.45%Agricultural 1.95 6.32% 0.59% 5,880 1.24%Public & Quasi-Public 2.99 230.75% 0.91% 4,217 0.89%Residential Misc. 0.05 7.89% 0.02% 181 0.05%TOTAL $327.80 16.73% 100.00% 472,712 100.00%
+ Percentages based on non-rounded values* Net of nonreimbursable exemptions; Does not include mobilehomes; Now includes possessory interest assessments
which until 2014-15 were previously on the unsecured roll.

www.sccassessor.org 13
ExemptionsThe homeowner’s exemption isfamiliar to most homeownersand provides a $70 reduction inproperty taxes. The number ofproperties receiving the home-owner’s exemption decreasedfor the second year by 1.56 percent.
There are other exemptionsavailable to taxpayers, includingexemptions for propertiesowned by charitable or non-profit organizations, religiousinstitutions, and private andnon-profit colleges. During thelast year, the value of exemptproperties (non-homeownerexempt)increased 4.88 percentbelow the overall increase inassessed value countywide.
(value in billions)
Qualifying Exemptions 2014-15
Percent PercentExemption Roll Total Value Exempt
Units Value Increase Value+Non-Profit Colleges 359 $8.02 0.59% 38.30%Qualifying AffordableHousing 383 3.42 0.64% 16.36%Charitable Non-Profit Org. 1,271 2.77 -1.17% 13.21%Homeowners' Exemption* 269,955 1.89 -1.53% 9.03%Hospitals 42 2.89 32.30% 13.80%Religious Org. 781 0.88 3.66% 4.19%Private Schools 142 0.64 2.72% 2.98%Cemeteries 39 0.13 -11.20% 0.64%Museums / Libraries 10 1.00 411.46% 0.48%Disabled Veterans 785 0.87 6.78% 0.42%Misc. 47 0.13 29.02% 0.60%Historical Aircraft 20 - -46.56% 0.00%TOTAL 273,834 $20.95 4.27% 100.00%
Exemptions not reimbursed by the State 3,879 $19.05 4.88%
Includes only those non-profit organizations that have applied and qualify in accordance with the Revenue and Taxation Code.
* The state reimburses the County for the Homeowners’ Exemption.+ Percentages based on non-rounded values
2014-15 Affordable Housing By City*
*Includes both secured and unsecured assessed value
...A full 72 percentof the assessed valueof affordable hous-ing is in San Jose...
City Exempt Assessed Number Of Value Units
Campbell $30,275,372 478 Cupertino $9,330,862 88 Gilroy $111,242,764 1,082 Los Altos $0 - Los Altos Hills $0 - Los Gatos $19,788,012 47 Milpitas $95,554,920 1,139 Monte Sereno $0 - Morgan Hill $149,444,144 1,042 Mountain View $115,879,704 1,122 Palo Alto $178,112,695 1,535 San Jose $2,495,093,025 18,825 Santa Clara $139,159,188 1,354 Saratoga $2,685,043 20 Sunnyvale $105,789,690 1,306 Unincorporated $3,864,654 27 TOTALS $3,456,220,073 28,065

14 www.sccassessor.org
2008-2014 number of properties temporarily reduced to reflect changes in market value
135,000
120,000
105,000
90,000
75,000
60,000
45,000
30,000
15,000
0
$26.00
$24.00
$20.00
$16.00
$12.00
$8.00
$4.00
$02014-152008-09 2009-10 2010-11 2011-12
Parcels Reduced AV
41,86637,989
136,559
2013-14
124,148
Properties with Temporary Declines by City and Property Type: 2014-15 (value in billions)
Temporary Declines in Assessed ValueThe Assessor’s Office
identified 37,989
properties--primarily
homes --that were val-
ued less than their
purchase price, there-
fore qualifying them
for a reduction in the
property’s assessment.
Last year 80,798
properties qualified
for a reduction.
90,836
2012-13
118,690
City City Val/ Townhouse/ Single Family Commercial TotalAPN Condo Residential Properties
Campbell City Val $0.02 $0.03 $0.11 $0.16APN 339 338 81 758
Cupertino City Val $0.00 $0.02 $0.04 $0.06APN 36 85 18 139
Gilroy City Val $0.01 $0.31 $0.11 $0.43APN 132 2,033 184 2,349
Los Altos City Val $0.00 $0.04 $ - $0.04APN 9 103 8 120
Los Altos Hills City Val $0.00 $0.02 $- $0.02APN 0 126 7 133
Los Gatos City Val $0.01 $0.11 $0.05 $0.17APN 157 362 54 573
Milpitas City Val $0.05 $0.09 $0.41 $0.54APN 560 918 150 1,628
Monte Sereno City Val $0.00 $0.04 $ - $0.05APN 0 84 2 86
Morgan Hill City Val $0.02 $0.25 $0.15 $0.43APN 250 1,527 136 1,913
Mountain View City Val $0.00 $0.00 $0.09 $0.10APN 153 55 71 279
Palo Alto City Val $- $0.07 $0.05 $0.12APN 33 109 33 175
San Jose City Val $0.60 $1.83 $1.77 $4.20APN 7,928 14,832 1,554 24,314
Santa Clara City Val $0.05 $0.07 $0.40 $0.52APN 820 787 184 1,791
Saratoga City Val $0.00 $0.30 $0.02 $0.32APN 53 528 10 591
Sunnyvale City Val $0.03 $0.03 $0.10 $0.16APN 620 344 102 1,066
Unincorporated City Val $ - $0.43 $0.12 $0.55APN 11 1,822 241 2,074
Grand Total City Val $0.82 $3.79 $3.40 $8.00APN 11,101 24,053 2,835 37,989
Note: Values represent decline in assessed value had the market value exceeded theProposition 13 protected factored base year value.
80,798 Bill
ions
Parc
els

Last year, 81,000 properties wereassessed below their purchase price as aresult of the collapse of the residentialreal estate market during the “GreatRecession.”
This year, the market value of 38,640 ofthose properties has risen to the pointthat all the value lost has been fullyrestored, and the market value nowexceeds the original purchase price. Lastyear 47,000 properties were fullyrestored due to the economic recovery.
There were 5,099 properties that werereassessed to a new Proposition 13 baseyear value due to a change in ownership.
There were 434,723 properties that received the CCPI increaseof 0.45 percent in accordance with Proposition 13...well below
their purchase price.
www.sccassessor.org 15
Economic Recovery Restores Values for38,640 Properties Previously Reduced
What is Proposition 8?Proposition 8, passed by California voters inNovember 1978, entitles property owners to thelower of the fair market value of their property asof January 1, 2014, or the assessed value as deter-mined at the time of purchase or construction,increased by no more than two percent annual-ly. When the market value of a property declinesbelow the previously established assessed valuemeasured as of January 1 each year (lien date),the assessor is required to proactively reduce theassessed value to reflect the lower of the fair mar-ket value of their property (as of January 1,2014).
As the real estate market rebounds, the assessor isrequired to “restore” the assessed values for prop-erties previously reduced during the downturn.The restoration of the property’s assessed value isnot limited to the two percent, until the marketvalue of the property reaches its purchase price,plus the annual inflation increased by a maxi-mum of two percent. Properties where the mar-ket value exceeds the assessed value as of January1, 2014, are not eligible for an adjustment. Themarket alone determines whether the assessedvalue of a property is reduced or restored.
Header: Proposition 8 properties with fullrestorations by City: 2014-15
City Count of APN Net ChangeCampbell 955 $88,271,784 Cupertino 1113 $116,308,788 Gilroy 1466 $124,656,013 Los Altos 601 $135,384,191 Los Altos Hills 197 $78,770,734 Los Gatos 660 $89,232,601 Milpitas 2328 $184,981,323 Monte Sereno 45 $11,361,457 Morgan Hill 1387 $128,184,325 Mountain View 1498 $130,256,023 Palo Alto 409 $62,431,327 San Jose 21052 $1,635,009,760 Santa Clara 2801 $216,502,807 Saratoga 649 $110,325,669 Sunnyvale 2205 $203,924,592 Unincorporated 1274 $154,117,521 Grand Total 38640 $3,469,718,915

16 www.sccassessor.org
Proposition 13Passed by the voters in June 1978, Proposition 13 amended the California Constitution limiting theassessment and taxation of property in California. It restricts both the tax rate and the annual increaseof assessed value as follows:• The property tax cannot exceed 1 percent of a property’s taxable value (plus service fees, improve-ment bonds and special assessments, many of which require voter approval).
• A property’s original base value is its 1975-76 market value. A new base year value is
established by reappraisal whenever there is achange in ownership or new construction.An increase in the assessed value of real property is limited to no more than two per-cent per year.
• The adjusted (factored) base year value of realproperty is the upper limit of value for prop-erty tax purposes.
• Business personal property, boats, airplanesand certain restricted properties are subject toannual reappraisal and assessment.
Long-time property owners benefit from lowerassessments, while owners who own property fora short time are adversely impacted by assess-ments that can be as much as ten times greaterthan that of a comparable property held for anextended time.
As the economy recovers, the gap between themarket value and assessed value of single familyhomes increases. Historically, the differencebetween the assessed value and the market valueis estimated to be 50 percent.
Historical trend of assessed values in Santa Clara CountyThe chart compares the total netassessed value by single familyand condominium properties to other property, includingcommercial and industrial properties. Since Proposition 13passed in 1978, the portion of the secured assessment rollcomprised of commercial andindustrial properties declined 15percent, a trend consistent withdata from other counties.
Historic Trend of Assessed Values in Santa Clara County
Percent of Total Assessed Value
70.00%
65.00%
60.00%
55.00%
50.00%
45.00%
40.00%
35.00%
30.00% 1977-78 1985-86 1990-91 1995-96 2000-01 2005-06 2010-11 2011-12 2012-13 2013-14 2014-15
Residential (Single Family and Condominiums) All Other Property
Average Assessed Value vs.
Average “Sale” Value
Average Assessed ValueAnnual Average “Sale” Value (Source RE InfoLink)
1978 1985 1990 1995 1999 2004 2007 2009 2013
$1,100,000
$1,000,000
$900,000
$800,000
$700,000
$600,000
$500,000
$400,000
$300,000
$200,000
$100,000
0Value

www.sccassessor.org 17
Do I benefit from Proposition 13? It is a frequent question. The answer is every property owner benefits from Proposition 13; but property owners that have owned their property longer benefit morethan recent buyers. For example, 15 percent of all property owners as of January 1 have not had theirproperty reassessed to market value since Proposition 13’s passage in 1978. The total assessed value ofthose properties equals five percent of the total assessed value of all the land and improvements in SantaClara County. By contrast, property owners who acquired a property during the last ten years accountfor 40 percent of all properties, yet their combined assessed values accounts for 56 percent of the total assessment roll.
The charts below provide a snapshot as of January 1, 2014, of properties assessed as of 1975 (all property owned prior to March 1, 1975) and for each subsequent year of acquisition. It also shows the2014 gross assessed value, based upon market value as of March 1, 1975, or as of the date of acquisition,plus the inflation rate not to exceed two percent per year. For example, of the 472,712 properties in theCounty, 27,037 were reassessed at market value in 2014 and account for $29.8 billion in gross assessedvalue out of a total secured assessment roll of $342.4 billion.
Base Year Parcels Assessed Value Base Year Parcels Assessed Value Lien Date (Land & Imp.) Lien Date (Land & Imp.)
1975 50,879 $11,930,741,277 1996 8,313 $5,431,332,563 1976 5,274 $794,124,581 1997 9,186 $5,767,528,9621977 7,046 $1,230,688,948 1998 11,662 $7,522,113,9891978 6,983 $1,570,426,292 1999 12,485 $10,019,756,454 1979 6,235 $1,420,085,896 2000 13,934 $10,921,194,0661980 6,586 $1,619,019,293 2001 11,648 $11,692,827,9871981 4,564 $1,424,743,832 2002 8,987 $8,989,155,052 1982 3,385 $1,187,153,394 2003 13,162 $11,919,609,2281983 3,203 $1,251,312,154 2004 15,687 $13,598,737,864 1984 5,426 $2,181,852,608 2005 19,378 $16,810,032,6631985 6,266 $3,353,774,211 2006 17,454 $17,501,620,8001986 6,743 $2,476,088,430 2007 14,493 $16,929,799,6261987 8,000 $3,498,778,648 2008 14,988 $20,628,908,5861988 7,815 $3,257,893,417 2009 14,554 $15,124,395,203 1989 8,970 $4,201,236,426 2010 17,985 $13,183,905,4701990 6,599 $3,601,983,299 2011 18,892 $18,321,315,368 1991 5,230 $3,011,573,863 2012 19,487 $18,456,645,084 1992 6,621 $3,400,913,215 2013 23,785 $24,924,881,2841993 7,607 $3,787,985,329 2014 27,037 $29,7653,09,0181994 7,766 $4,794,095,838 TOTAL 472,712 $342,444,878,9051995 8,397 $4,941,338,687
Who benefits?
Distribution of Assessment Roll by Base Year and Property TypeBase Year Single Family/Condominium Commercial, Industrial, OtherLien Date Parcel Parcel % Assessed Value AV % Parcel Parcel % Assessed Value AV %Prior to 1979 60,605 14.60% $6,327,660,135 2.84% 9,577 16.55% $9,198,320,963 7.70%1979-1988 50,486 12.17% $13,608,068,006 6.10% 7,737 13.37% $8,062,633,877 6.75%1989-1998 72,509 17.48% $32,949,901,871 14.78% 7,842 13.56% $13,510,200,300 11.30%1999-2008 126,435 30.48% $94,770,270,728 42.51% 15,781 27.28% $44,241,371,598 37.02%2009-2014 67,809 25.27% $75,279,790,408 33.77% 7,842 29.24% $44,496,661,019 37.23%Total 414,859 100% $222,935,691,448 100% 57,853 100% $119,509,187,757 100%

Organizational Overview of Asse
t sA
Assessment Standards, Services, and Exemptions
Division DescriptionResponsible for locating and identifying ownership and reappraisability of all taxable real propertyas well as approving and enrolling all legal property tax exemptions. Professional staff membersmonitor assessment appeal information; process legal appeals; maintain and update assessmentmaps; manage the public service center, document imaging center and oversee quality control.
Staff CompositionA majority of the sixty-two staff members of the Assessment, Standards, Services and ExemptionDivision possess expert knowledge in exemption law, cartography and/or the legal complexities ofproperty transfers. In addition, two staff members are certified by the State Board of Equalization(BOE) as advanced appraisers.
Major Accomplishments 2014/2015 2013/2014Ownership Title Documents Processed 77,341 92,009Organizational Exemption Claims 3,879 3,692Parcel Number Changes (split & combinations) 2,749 2,258Parent/Child Exclusions from Reassessment (Prop 58/193) 4,573 4,916
Real PropertyDivision DescriptionResponsible for valuing and enrolling all taxable real property (land and improvements). TheDivision provides assessment-related information to the public, and cooperates with other agencies regarding assessment and property tax-related matters.
Staff CompositionEighty-four of the one hundred staff positions are professional appraisers certified by the StateBoard of Equalization (BOE). Forty-six of those appraisers hold advanced certificates issued by theBOE.
Major Accomplishments 2014/2015 2013/2014Real Property Parcels (secured; taxable) 472,712 467,671Reappraisable changes of ownership processed 26,907 29,354Permits Processed (reassessable and non reassessable events) 28,618 24,589Temporary Decline in Value Parcels (Proposition 8) 37,986 80,798Parcels with New Construction (reassessable events) 5,788 5,227Senior Citizen Exclusion (Prop 60/90) 232 324
18 www.sccassessor.org
39.4 %Asian
48.5%Male
51.5%Female
Staff Composition*
27.8%Caucasian
2.1% AfricanAmerican
2.1% Mult
13.3%Hispanic
* Data based upon self reporting by employees
15.4%Unreported
Assistant

www.sccassessor.org 19
Office Mission The mission of the Santa Clara County Assessor’s Office is to producean annual assessment roll including all assessable property in accordance with legal mandatesin a timely, accurate, and efficient manner; and provide current assessment-related informa-tion to the public and to governmental agencies in a timely and responsive way.
Business Division (Business Personal Property)
Division DescriptionResponsible for locating, valuing and enrolling all taxable business personal property includingproperty (owned and leased) such as computers, supplies, machinery, equipment and fixtures as well as mobilehomes, airplanes and boats. Last year, the Division completed 1017 businessaudits. The Division is responsible for the administration of assessment appeals involving businesspersonal property. Once every four years all businesses with personal property are subject to audit.Ninety-three percent of all personal property is owned by 14.9 percent of the business entities.
Staff CompositionForty-seven of the sixty-seven staff members are certified as auditor-appraisers including thirty-fiveemployees who have advanced certification awarded by the State Board of Equalization. The staffis comprised of accountants and experts skilled in auditing and assessing high-tech businesses.
Major Accomplishments 2014/2015 2013/2014Business Assessments on Secured Roll* 2,655 2,626Mobilehome Parcels Assessed* 10,768 10,645 Business Personal Property (BPP) Appraisals Enrolled* 59,030 79,663Total Business Personal Property Assessment Activities 72,171 90,448
* Note: Subset of total activities
Administration DivisionDivision DescriptionProvides executive leadership and policy development. Functionsinclude operational oversight, policy analysis and legislative advocacy,strategic planning, performance management, and internal/externalcommunications. Provides administrative support services includingbudget, accounting, personnel, payroll, purchasing, and facilities man-agement.
Staff Composition A staff of ten includes two certified appraisers and one advancedappraiser certified by the State Board of Equalization. Employees possess backgrounds in assessment operations, policy development,strategic planning, communications, fiscal and contract management,accounting, and personnel.
Assessor’s Office FY 2013/2014 FY 2012/2013Expenses $31,205,780* $28,986,783Employees 256 256
* Estimate
Information Systems Division
Division DescriptionResponsible for provid-ing systems support toall other divisions in thepursuit of preparing anddelivering the secured,unsecured and supple-mental assessment rolls.
Staff Composition The seventeen memberstaff has a broad knowl-edge of advanced com-puter systems.
f e the County Assessor’s OfficessorAssessornt

20 www.sccassessor.org
Business Personal PropertyAssessed values of business personal property are determined from the business property statementsfiled annually by 29,000 businesses. In Santa Clara County, the gross assessed value of business property represents eight percent of the assessment roll. Statewide, unsecured values accountfor just over five percent of the total assessment roll. While Santa Clara County ranks sixth in population, and has historically ranked fourth in total assessed value, the assessed value of unsecuredbusiness personal property was slightly more than half of the total in Los Angeles County, which hasa population five times the size of Santa Clara County.
2014-2015 Business Personal Property Distribution by City
<None> Gross Gross Net Percent Value Secured* Unsecured** Exemptions+ Total of Value Growth
Campbell $0.03 $0.30 $0.02 $0.32 1.07% 1.75%Cupertino 0.61 0.97 0.01 1.57 5.30% 19.84%Gilroy 0.11 0.27 0.03 0.35 1.18% 3.02%Los Altos 0.02 0.12 0.02 0.12 0.40% 11.22%Los Altos Hills - 0.01 0.01 - 0.01% -30.69%Los Gatos 0.05 0.24 0.04 0.24 0.81% 1.17%Milpitas 0.19 1.89 0.02 2.06 6.97% 5.36%Monte Sereno 0.00 - - - 0.01% -30.90%Morgan Hill 0.05 0.28 - 0.33 1.11% 7.16%Mountain View 0.25 2.44 0.55 2.14 7.24% -17.86%Palo Alto 0.38 2.73 1.19 1.93 6.52% 5.05%San Jose 2.46 8.07 0.42 10.11 34.23% -1.02%Santa Clara 1.92 4.42 0.48 5.86 19.83% -2.09%Saratoga 0.01 0.06 0.02 0.05 0.16% -3.81%Sunnyvale 0.96 3.19 0.04 4.10 13.89% 4.69%Unincorporated 0.27 1.67 1.56 0.38 1.27% 6.51%Grand Total $7.29 $26.65 $4.41 $29.54 100.00% 0.06%
* Secured Roll: Property for which taxes become a lien on real property to secure payment of taxes. Includes possessoryinterest assessments
**Unsecured Roll: Property for which taxes are not a lien on real property to secure payment of taxes. Net of nonreimbursable exemptions; includes mobilehomes
- Indicates a value of 0 or less than $10 million +Nonreimbursable Exemptions
(value in billions)
...In 2014, 61 percent of businesses filed theirproperty statements electronically (e-file),22,000 more than a decade ago, creating signif-icant savings. The average cost to process an e-filed statement was $3.31 while the averagecost to process a paper statement was $9.45...

www.sccassessor.org 21
2014-2015 Business Personal Property Distribution of Value by Type
(value in billions)
Net Percent of Value EntityProperty Type Secured* Unsecured** Exemptions Total Value+ Growth+ CountProfessional Services $1.62 $9.57 $1.13 $10.06 34.07% 11.27% 13,919Electronic Manufacturers 1.73 3.75 0.00 5.48 18.56% 0.17% 828Computer Manufacturers 1.15 3.24 0.00 4.39 14.86% 14.31% 11Other Manufacturing 0.55 2.33 0.00 2.88 9.74% 5.08% 2,758Retail 0.11 2.22 0.10 2.23 7.56% 2.39% 6,230Semiconductor Manufacturing 0.63 0.71 0.00 1.34 4.54% 0.72% 17Other 0.88 2.95 3.16 0.67 2.27% -73.38% 617Aircraft 0.00 0.81 0.01 0.81 2.74% 15.76% 781Leased Equipment 0.00 0.82 0.00 0.82 2.77% -8.36% 514Mobilehomes 0.53 0.00 0.00 0.53 1.79% 14.57% 10,466Financial Institutions 0.00 0.18 0.00 0.19 0.63% 9.59% 76Apartments 0.09 0.01 0.01 0.10 0.32% 17.33% 980Boats 0.00 0.05 0.00 0.05 0.16% -0.68% 3,119TOTAL $7.29 $26.65 $4.41 $29.54 100.00% 0.22% 40,316
* Secured Roll: Property for which taxes become a lien on real property to secure payment of taxes, includes possessory interestassessments valued by Real Property Division.** Unsecured Roll: Property for which taxes are not a lien on real property to secure payment of taxes. Net of nonreimbursableexemptions+ Percentages based on non-rounded values.0 Indicates a value of 0 or less than $10 million. As a result, totals of displayed numbers may be off by up to $10 million.
Six percent of all businesses account for almost ninety percent of the assessed value of business personal property. Below are the top 25 companies in Santa Clara County as of the lien date, January1, 2014, ranked by the gross assessed taxable value of their “business property,” which includes personal property, computers, machinery, equipment and fixtures. Ranging from $120 million to justunder $2 billion, the business property of the top 25 companies is assessed annually. [Note: The rank-ing does not include the assessed value of real property or exempt value.]
1 Cisco Systems Inc (1)2 Apple Computer Inc (2)3 Intel Corp (4)4 Google Inc (3)5 Lockheed Martin Corp (5)6 Juniper Network Inc (7)7 Hitachi Global Storage Techs Inc (6)8 Microsoft Corp (10)9 Hewlett Packard Comp (9)
10 Applied Materials Inc (8)11 NVIDIA Corp (14)12 Intuitive Surgical Inc (17)13 Oracle Corp (19)14 VMware Inc (24)15 Xeres Ventures LLC (22)16 KLA Instruments Corp (15)17 Lumileds Lighting US LLC (13)18 Equinix Operating Co Inc (18)
19 Broadcom Corp (23)20 eBay Inc (16)21 Space Systems Loral Inc (13)22 Brocade Comm Systems Inc (20)23 Southwest Airline Comp (21)24 Intuit Inc (NR)25 Network Appliance Corp (22)
2014-2015 Top 25 Companies* (parentheses indicate last year’s ranking)
* Ranked by gross assessed value of their business personal property. Excludes exempt entities.
...Business property accounted for 21 percent ofall assessment appeals, involving $7.4 billion in
disputed assessed value...

22 www.sccassessor.org
Assessor Parcels and "Added" Assessed Value Resulting From All Changes in Ownership(CIO) and New Construction (NC) by City and Major Property Type: 2014-15
Agricultural Industrial Multifamily Office Retail Townhouses/ Single Family Total& Misc. & Mfg Housing Condos Homes
Campbell CIO $16,938,443 $6,636,893 $42,393,504 $17,919,561 $7,248,358 $17,952,358 $104,729,727 $213,818,84417 22 44 12 21 181 379 676
NC $4,568,753 $723,389 $1,754,182 $1,006,442 $5,882,655 $138,124 $10,478,877 $24,552,4228 1 5 2 3 1 114 134
Cupertino CIO $4,463,595 $36,518,500 $23,667,983 $22,751,315 $23,784,502 $33,243,921 $257,003,235 $401,433,05115 19 35 13 15 195 403 695
NC $9,567,220 ($86,769,962) $53,933,059 $5,225,617 $7,611,335 $42,000 $42,979,532 $32,588,83115 8 6 1 2 4 214 250
Gilroy CIO $13,128,114 ($2,351,926) $2,663,138 ($4,483,409) ($12,438,383) $7,858,361 $95,520,706 $99,896,601212 15 31 8 20 74 824 1,184
NC $1,213,083 $732,193 $2,151,724 $12,000 $26,090,160 $30,199,1605 2 2 1 127 137
Los Altos CIO $7,321,580 $643,074 $3,496,536 $21,702,886 $10,374,524 $39,826,953 $349,421,374 $432,786,93011 1 5 19 33 103 414 586
NC $2,541,188 $4,916,559 $4,373,328 $10,565,773 $63,000,712 $85,397,5605 46 1 44 126 375
Los Altos Hills CIO $16,207,777 $150,311,277 $166,519,05421 140 171
NC $3,392,267 $62,547,547 $65,939,81413 126 139
Los Gatos CIO $8,912,936 $25,726,082 $6,946,730 /48,096,673 $25,324,433 $210,894,750 $285,901,60422 34 15 12 154 389 626
NC $11,834,599 ($3,853,215) $640,400 $8,333,552 $215,362 $2,148,900 $28,320,199 $47,639,79725 4 2 6 1 10 212 260
Milpitas CIO $117,521,111 $79,878,648 $16,075,569 $3,992,501 $23,289,847 $113835,081 $151,723,268 $506,316,02537 38 14 19 21 413 543 1,085
NC $5,043,920 $85,140,937 $64,994 $15,329,686 $9,343,147 $114,922,68446 8 2 104 106 266
Monte Sereno CIO $0 $45,425,160 $45,425,1600 70 70
NC $3,587,562 $7,711,840 $11,299,4025 47 47
Morgan Hill CIO $22,500,123 ($1,722,119) ($4,995,856) $536,158 $643,183 $33,158,966 $173,426,792 $223,547,24750 16 32 8 14 273 861 1,254
NC ($803,976) $241,813 $24,676,082 $15,000 $505,000 $9,898,574 $20,910,785 $55,443,278142 2 2 1 1 76 124 208
Mountain View CIO $14,224,719 $158,740,330 $115,306,102 $84,847,175 $121,596,034 $84,708,640 $238,071,193 $817,494,19331 44 111 48 63 453 410 1,160
NC $646,982 $10,021,255 $70,944,357 $48,832,430 $8,625,143 $22,734,646 $161,804,8133 5 7 4 73 198 290
Palo Alto CIO $22,952,212 $20,023,687 $51,197,832 $248,357,967 $37,580,470 $63,178,236 $691,589,152 $1,134,879,85625 19 46 63 42 179 626 1,000
NC $6,173,725 $10,137,306 $19,040,783 $25,018,623 $23,936,868 $5,788,073 $114,093,739 $204,189,12321 3 8 13 6 17 388 456
San Jose CIO $88,495,887 $141,431,839 $396,090,479 $142,381,960 $203,711,608 $465,408,383 $1,947,648,426 $3,385,168,582303 297 723 201 302 3,742 8,080 13,648
NC $71,131,048 $39,050,400 $875,924,480 $76,714,132 $15,836,957 $12,972,475 $102,105,296 $1,193,734,78889 16 272 22 27 81 1,280 1,787
Santa Clara CIO $57,564,475 $299,365,860 $60,736,370 $102,830,405 $3,175,956 $46,403,506 $270,316,866 $840,393,43824 84 120 24 31 43 833 1,589
NC $4,705,689 $29,143,594 $50,268,879 $7,172,038 $47,253,867 $17,760 $14,274,490 $152,836,31712 11 10 5 6 2 275 321
Saratoga CIO $4,365,635 $1,107,264 ($269,317) $4,336,799 $22,888,649 $292,849,455 $325,278,48520 3 5 6 74 388 496
NC $2,814,148 $54,675,069 $57,489,2175 264 269
Sunnyvale CIO $37,338,592 $212,725,764 $112,068,026 $25,594,049 ($29,172,663) $131,043,266 $421,284,511 $910,881,54583 75 118 30 86 610 857 1,859
NC $3,674,612 $73,424,070 $120,106,314 $231,389,211 $98,595,869 $5,451,294 $19,297,841 $461,939,21147 4 12 12 3 35 269 382
Unincorporated CIO $51,527,233 $116,311 $5,010,088 $1,288,795 ($867,547) $3,425,944 $280,176,330 $340,677,154330 2 25 5 2 18 904 1,286
NC $21,255,077 $235,000 $34,591 $109,146 $65,795,875 $340,677,15444 1 2 4 412 463
Total CIO $483,462,732 $952,006,861 $820,543,117 $674,396,776 $401,359,364 $1,088,256,697 $5,680,392,222 $10,130,417,7691,211 632 1,341 470 668 6,942 16,121 27,385
NC $151,345,897 $72,353,650 $1,308,112,822 $403,707,045 $116,427,959 $71,098,948 $664,359,785 $2,787,406,106345 55 382 66 54 452 4,4345 5,789
Note: New construction with negative assessed value may be the result of a natural disaster or other circumstances that may trigger demolition and/or site preparation. Not all CIO or NC result in a change in assessed value.

www.sccassessor.org 23
(assessed value in millions)
Major Changes in Ownership* 2014-2015
Company (Assessee) Property Type City Net Value+KBSII Corporate Technology Center Office San Jose $206.50Cole MT San Jose CA LP Retail San Jose $204.00GREF Results Way LLC Office Cupertino $165.00CF Tasman LLC R&D San Jose $153.75Greenery Rosenwalk LLC Apartment San Jose $146.00Google Inc Office Mountain View $138.77225 West Santa Clara LLC Office San Jose $138.001050 Page Mill Rd Prop LLC Assoc Industrial Palo Alto $130.00MWest Propco XXV LLC Office San Jose $123.00Wilson Oakmead West LLC Office Sunnyvale $119.00* Income generating properties only. + Includes only properties with 100% change in ownership in 2013.
Major New Construction** 2014-2015
Company (Assessee) Property Type CityVista Montana Park Apartments Apartment San JoseMenlo & Juniper Networks LLC Office SunnyvaleToscana Crescent Village LLC Apartment San JoseMilpitas Centria West LLC Apartment MilpitasCupertino Property Devel I LLC Apartment CupertinoRiver Oaks SJ Grp LLC Apartment San JoseFairoaks Tasman LLC Apartment San JoseLa Moraga San Jose LP Apartment San JoseAvalon Morrison Park LP Apartment San JoseBRE Properties Apartment Sunnyvale** Includes partial or completed construction.
...the largest
home in Santa
Clara County
also has the
highest
assessed value.
The Los Altos
Hills home is
25,545 square
feet and the
net assessed
value is $53.2
million....(As of 1/1/14)
How much time does it take staff to value new construction?
On average an appraiser spentapproximately 5.47 hours during theprior assessment roll to value resi-dential new construction, while the
average amount of time to valueconstruction of commercial andindustrial properties was approxi-mately 16.7 hours.

24 www.sccassessor.org
2014-2015 Net Assessed Value (AV) and Num
ber of Parcels (APN
)by High School and Elementary Districts and by Major Property Type (Value in Millions**)
Hig
h Sc
hool
Dis
tric
tC
ount
Mob
ileho
me
Mul
tifam
ilySi
ngle
fam
ilyN
on
Tot
al N
et
Tot
al N
et
Gra
nd T
otal
Oth
er
Hom
e O
wne
r T
otal
Val
ue
Res
iden
tial
Secu
red
Uns
ecur
edEx
empt
ion
Exem
ptio
nG
row
thC
ampb
ell U
nion
Hig
h Sc
hool
*Burbank
Value
$0$94,993,807
$169,527,356
$53,195,008
$317,716,171
$5,974,737
$323,690,908
$8,360,118
$1,988,000
5.00%
APN
0180
592
118
2284
Cambrian
Value
$1,165,369
$499,445,919
$3,680,106,421
$892,275,509
$5,072,993,218
$109,999,209
$5,182,992,427
$66,772,874
$37,552,900
4.98%
APN
10473
8,293
502
505,280
Campbell Union*
Value
$6,814,851
$2,617,565,264
$10,283,195,172
$3,611,130,176
$16,518,705,463
$636,675,333
$17,155,380,796
$692,718,991
$92,435,046
7.31%
APN
106
2,363
20,867
1,590
198
13,216
Moreland
Value
$0$1,011,220,722
$5,080,788,509
$903,326,923
$6,995,336,154
$127,124,256
$7,122,460,410
$137,792,838
$50,373,400
5.80%
APN
01,090
10,656
341
677,199
Union Elem
entary
Value
$24,255
$263,199,567
$6,748,635,454
$626,245,995
$7,638,105,271
$72,359,823
$7,710,465,094
$82,924,675
$65,361,800
5.56%
APN
1378
13,612
288
719,336
Total Value
$8,004,475
$4,486,425,279
$25,962,252,912
$6,086,173,611
$36,542,856,277
$952,133,358 $37,494,989,635
$988,569,496
$247,711,146
5.73%
APN
117
4,484
54,020
2,839
0 0
0 388
35,315
East
Sid
e H
igh
Scho
ol
Alum
Rock Union
Value
$3,083,722
$563,205,262
$5,483,045,326
$1,058,761,362
$7,108,095,672
$155,445,992
$7,263,541,664
$592,716,945
$75,576,200
7.95%
APN
120
861
19,167
1,439
204
10,615
Berryessa Union
Value
$111,683
$233,808,553
$8,531,080,348
$720,462,847
$9,485,463,431
$263,485,373
$9,748,948,804
$139,909,174
$93,973,600
7.16%
APN
291
22,093
564
9313,428
Evergreen
Value
$24,119,295
$176,288,847
$13,778,525,006
$1,073,977,313
$15,052,910,461
$215,236,692
$15,268,147,153
$179,132,984
$114,881,200
6.56%
APN
558
7125,372
777
125
16,426
Franklin McKinley
Value
$85,544,367
$783,686,649
$4,580,714,115
$1,991,467,682
$7,441,412,813
$286,939,749
$7,728,352,562
$627,024,415
$61,568,023
8.53%
APN
2,124
936
14,184
1,511
119
8,802
Mount Pleasant
Value
$80,395
$9,518,635
$1,770,712,354
$121,363,991
$1,901,675,375
$10,500,800
$1,912,176,175
$11,583,770
$20,785,800
5.53%
APN
128
4,998
179
242,971
Oak Grove
Value
$61,873,168
$1,095,477,988
$9,115,862,014
$2,217,126,696
$12,490,339,866
$542,621,264
$13,032,961,130
$406,376,972
$108,791,900
6.49%
APN
1,280
511
25,142
582
119
15,541
Orchard
Value
$33,572,058
$1,036,370,135
$1,106,476,574
$5,407,831,386
$7,584,250,153
$1,391,177,536
$8,975,427,689
$81,565,118
$11,779,600
4.56%
APN
882
312,132
1,339
261,684
Total Value
$208,384,688
$3,898,356,069
$44,366,415,737
$12,590,991,277
$61,064,147,771
$2,865,407,406 $63,929,555,177
$2,038,309,378
$487,356,323
6.68%
APN
4,967
2,529
113,088
6,391
00
0710
69,467
Frem
ont U
nion
Hig
h Sc
hool
*Cupertino Union
Value
$0$2,276,981,202
$24,596,839,615
$4,828,984,380
$31,702,805,197
$1,064,558,222
$32,767,363,419
$233,310,878
$180,388,600
5.76%
APN
01,561
36,108
1,381
165
25,783
Sunnyvale Elem
entary*
Value
$53,620,804
$2,606,319,459
$7,266,385,902
$9,073,344,008
$18,999,670,173
$2,899,438,347
$21,899,108,520
$310,820,285
$74,725,000
7.68%
APN
816
1,324
15,703
1,488
112
10,681
Total Value
$53,620,804
$4,883,300,661
$31,863,225,517
$13,902,328,388
$50,702,475,370
$3,963,996,569 $54,666,471,939
$544,131,163
$255,113,600
6.72%
APN
816
2,885
51,811
2,869
00
0277
36,464
Gilr
oy U
nifie
d H
igh
Scho
olGilroy Unified
Value
$7,637,810
$342,092,161
$5,357,808,583
$2,261,303,701
$7,968,842,255
$303,881,085
$8,272,723,340
$240,680,658
$54,976,600
7.40%
APN
162
559
12,680
3,448
132
7,861
Total Value
$7,637,810
$342,092,161
$5,357,808,583
$2,261,303,701
$7,968,842,255
$303,881,085
$8,272,723,340
$240,680,658
$54,976,600
7.40%
APN
162
559
12,680
3,448
00
0132
7,861

www.sccassessor.org 25
*Los
Gat
os -
Sara
toga
Joi
nt U
nion
Hig
h Sc
hool
Lakeside Union*
Value
$0$430,966
$92,677,650
$19,725,635
$112,834,251
$95,009
$112,929,260
$1,380,465
$809,200
2.87%
APN
01
170
127
3116
Loma Prieta Union*
Value
$0$5,180,571
$182,196,471
$38,538,643
$225,915,685
$1,535,197
$227,450,882
$912,865
$1,510,600
7.25%
APN
03
328
257
2216
Los G
atos Union*
Value
$2,572,936
$306,201,541
$8,190,182,896
$1,173,781,522
$9,672,738,895
$153,627,269
$9,826,366,164
$216,601,853
$40,801,600
5.65%
APN
50253
8,670
1,570
545,835
Saratoga*
Value
$57,606
$7,668,324
$8,989,742,022
$351,562,396
$9,349,030,348
$26,883,696
$9,375,914,044
$165,310,554
$34,015,800
5.46%
APN
116
6,834
606
314,865
Total Value
$2,630,542
$319,481,402
$17,454,799,039
$1,583,608,196
$19,360,519,179
$182,141,171 $19,542,660,350
$384,205,737
$77,137,200
5.31%
APN
51273
16,002
2,560
00
090
11,032
Milp
itas U
nifie
d H
igh
Scho
olMilpitas U
nified
Value
$17,471,059
$673,926,147
$6,945,395,545
$4,499,306,990
$12,136,099,741
$1,856,573,570
$13,992,673,311
$244,844,717
$69,505,800
9.89%
APN
368
355
16,180
1,731
959,941
Total Value
$17,471,059
$673,926,147
$6,945,395,545
$4,499,306,990
$12,136,099,741
$1,856,573,570 $13,992,673,311
$244,844,717
$69,505,800
9.89%
APN
368
355
16,180
1,731
00
095
9,941
Mor
gan
Hill
Uni
fied
Hig
h Sc
hool
Morgan Hill Unified
Value
$24,318,290
$270,234,324
$8,083,601,396
$2,422,560,266
$10,800,714,276
$353,734,064
$11,154,448,340
$228,000,599
$74,410,000
7.84%
APN
431
332
16,087
3,532
131
10,519
Total Value
$24,318,290
$270,234,324
$8,083,601,396
$2,422,560,266
$10,800,714,276
$353,734,064 $11,154,448,340
$228,000,599
$74,410,000
7.84%
APN
431
332
16,087
3,532
00
0131
10,519
Mou
ntai
n V
iew
- Lo
s Alto
s*Los A
ltos Elem
entary* Value
$37,769
$358,562,438
$15,855,764,871
$1,439,108,101
$17,653,473,179
$162,809,230
$17,816,282,409
$174,741,089
$67,898,600
7.06%
APN
1186
13,708
1,046
111
9,711
Mountain View
Elem
entary*
Value
$37,776,257
$2,202,076,939
$7,386,481,645
$6,782,183,241
$16,408,518,082
$1,942,743,524
$18,351,261,606
$501,063,880
$61,740,000
6.97%
APN
703
1,430
13,322
1,510
948,820
Total Value
$37,814,026
$2,560,639,377
$23,242,246,516
$8,221,291,342
$34,061,991,261
$2,105,552,754 $36,167,544,015
$675,804,969
$129,638,600
7.02%
APN
704
1,616
27,030
2,556
00
0205
18,531
Palo
Alto
Uni
fied
Hig
h Sc
hool
*Palo Alto Unified
Value
$69,385
$1,785,263,068
$19,936,352,127
$6,606,521,034
$28,328,205,614
$1,675,939,974
$30,004,145,588
$6,564,557,182
$96,560,251
6.29%
APN
7864
19,805
2,171
404
13,806
Total Value
$69,385
$1,785,263,068
$19,936,352,127
$6,606,521,034
$28,328,205,614
$1,675,939,974 $30,004,145,588
$6,564,557,182
$96,560,251
6.29%
APN
7864
19,805
2,171
00
0404
13,806
Patt
erso
n Jo
int H
igh
Scho
olPatterson Joint
Value
$0$0
$434,098
$29,567,749
$30,001,847
$42,602
$30,044,449
$278
$147,000
18.39%
APN
00
1428
121
Total Value
$-
$-
$434,098
$29,567,749
$30,001,847
$42,602
$30,044,449
$278
$147,000
18.39%
APN
00
1428
00
01
21Sa
n B
enito
Joi
nt U
nion
Hig
h Sc
hool
North County Union Joint
Value
$0$0
$0$33,484,595
$33,484,595
$1,791,326
$35,275,921
$0$42,000
2.36%
APN
00
0217
06
Total Value
$-
$-
$-
$33,484,595
$33,484,595
$1,791,326
$35,275,921
$-
$42,000
2.36%
APN
00
0217
00
00
6Sa
n Jo
se U
nifie
d H
igh
Scho
olSan Jose Unified
Value
$22,784,627
$3,990,418,938
$27,349,859,585
$7,209,042,085
$38,572,105,235
$2,148,736,162
$40,720,841,397
$1,582,002,836
$263,920,267
6.34%
APN
452
5,145
59,846
5,174
528
37,717
Total Value
$22,784,627
$3,990,418,938
$27,349,859,585
$7,209,042,085
$38,572,105,235
$2,148,736,162 $40,720,841,397
$1,582,002,836
$263,920,267
6.34%
APN
452
5,145
59,846
5,174
00
0528
37,717
Sant
a C
lara
Uni
fied
Hig
h Sc
hool
*Santa Clara Unified
Value
$145,021,592
$5,206,511,752
$12,138,892,516
$17,019,704,764
$34,510,130,624
$6,817,741,859
$41,327,872,483
$2,136,649,019
$134,855,000
7.59%
APN
2,693
2,153
28,315
2,736
269
19,274
Total Value
$145,021,592
$5,206,511,752
$12,138,892,516
$17,019,704,764
$34,510,130,624
$6,817,741,859 $41,327,872,483
$2,136,649,019
$134,855,000
7.59%
APN
2,693
2,153
28,315
2,736
00
0269
19,274
Gra
nd T
otal
Val
ue$5
27,7
57,2
98
$28,
416,
649,
178
$222
,701
,283
,571
$82
,465
,883
,998
$3
34,1
11,5
74,0
45 $
23,2
27,6
71,9
00 $
357,
339,
245,
945
$15,
627,
756,
032
$1,8
91,3
73,7
87
6.80
%AP
N10
,768
21
,195
41
4,86
5 36
,652
0
0 0
3,23
0 26
9,95
4
*Bas
ic Ai
d Sc
hool
Dist
ricts
** in
clude
s oth
er ex
empt
ions
, exc
lude
s hom
eown
er ex
empt
ion

26 www.sccassessor.org
2014-2015 Net Secured Assessed Value (AV) and Num
ber of Parcels (APN
)by City and Major Property Type
Agr
icul
tura
l &
Indu
stri
al &
M
obile
hom
eM
ulti
fam
ily
Off
ice
Ret
ail
Sing
le F
amily
To
tal N
et
Oth
er
Hom
eow
ner
mis
cella
neou
sM
anuf
actu
ring
Hou
sing
Hou
sing
Secu
red*
Exem
ptio
nEx
empt
ion
Cam
pbel
l Total
Val
$96,960,371
$504,781,604
$5,330,594
$883,215,976
$529,109,306
$622,814,471
$4,765,652,784
$7,407,865,106
$136,820,627
$46,186,046
APN
177
318
74753
216
278
10,223
12,039
105
6,515
Cup
erti
no Total
Val
$216,787,131
$1,150,290,669
$1,070,249,690
$1,859,608,218
$729,358,991
$11,107,342,545
$16,133,637,244
$111,805,072
$73,935,400
APN
280
73578
214
159
15,123
16,427
89
10,567
Gilr
oyTotal
Val
$364,979,550
$364,120,792
$7,279,223
$338,048,238
$87,354,181
$779,021,310
$4,454,950,752
$6,395,754,046
$230,667,588
$46,050,200
APN
1,029
219
145
534
111
314
11,165
13,517
115
6,585
Los
Alt
os Total
Val
$107,488,172
$10,118,755
$182,955,815
$393,030,285
$257,568,766
$10,834,430,661
$11,785,592,454
$107,360,097
$52,462,200
APN
157
31134
291
188
10,249
11,050
79
7,502
Los
Alt
os H
ills
Total
Val
$226,411,851
$2,091,837
$37,769
$5,977,676,944
$6,206,218,401
$38,038,173
$14,732,200
APN
275
171
2,934
3,227
16
2,107
Los
Gat
os Total
Val
$276,127,404
$170,823,008
$2,572,936
$571,914,225
$521,051,887
$403,085,325
$7,821,190,240
$9,766,765,025
$288,280,437
$43,171,800
APN
385
6050
463
274
220
9,222
10,674
68
6,173
Milp
itas T
otal
Val
$543,598,744
$2,616,491,598
$17,465,086
$730,144,506
$249,372,713
$1,116,238,589
$6,905,696,735
$12,179,007,971
$258,549,690
$68,975,200
APN
664
415
368
356
179
191
16,118
18,291
96
9,865
Mon
te S
eren
oTotal
Val
$30,943,029
$1,484,404
$1,689,076,830
$1,721,504,263
$792,234
$6,162,800
APN
372
1,215
1,254
1 881
Mor
gan
Hill
Total
Val
$310,190,203
$513,579,704
$23,914,499
$260,976,586
$114,132,142
$422,977,007
$5,289,335,594
$6,935,105,735
$214,951,913
$48,746,600
APN
488
228
413
309
97221
10,434
12,190
100
6,851
Mou
ntai
n V
iew
Total
Val
$809,795,530
$2,718,151,499
$37,776,257
$2,437,427,420
$2,051,221,499
$1,006,309,363
$9,013,258,457
$18,073,940,025
$520,307,290
$73,455,200
APN
315
395
703
1,533
409
442
15,848
19,645
108
10,495
Pal
o A
lto Total
Val
$363,644,645
$1,741,053,574
$69,385
$1,785,225,635
$3,200,308,520
$1,324,051,470
$17,158,564,719
$25,572,917,948
$2,761,494,770
$86,632,851
APN
930
196
7845
522
411
17,978
20,889
263
12,386
San
Jose Total
Val
$3,584,116,485
$10,897,498,625
$270,844,240
$13,500,075,955
$6,766,986,888
$7,575,293,635
$90,532,738,151
$133,127,553,979
$4,528,657,138
$941,738,890
APN
4,864
2,829
6,372
11,256
2,074
3,173
213,322
243,890
1,486
134,397
Sant
a C
lara
Total
Val
$943,515,603
$6,380,882,235
$143,201
$2,814,255,183
$2,601,145,353
$1,348,564,500
$10,313,785,539
$24,402,291,614
$1,973,067,971
$108,235,400
APN
474
993
11,987
292
463
24,568
28,778
242
15,470
Sara
toga T
otal
Val
$157,162,460
$32,337,408
$57,606
$9,982,003
$120,853,495
$115,936,962
$11,652,261,963
$12,088,591,897
$177,786,329
$53,040,400
APN
362
421
2288
6610,525
11,106
51
7,584
Sunn
yval
e Total
Val
$464,672,018
$5,878,718,277
$161,183,613
$3,708,872,630
$2,888,094,946
$1,352,448,728
$13,806,939,669
$28,260,929,881
$381,895,999
$141,878,800
APN
347
672
2,591
2,094
340
434
27,816
34,294
152
20,281
Uni
ncor
pora
ted
Total
Val
$2,309,672,978
$156,454,813
$1,082,889
$123,305,316
$20,455,338
$64,545,134
$11,378,381,988
$14,053,898,456
$3,897,280,704
$85,969,800
APN
7,238
314
42331
31128
18,125
26,209
259
12,295
Tot
alVal
$10,806,066,174
$33,138,878,802
$527,757,298
$28,416,649,178
$21,402,724,771
$17,118,214,251
$222,701,283,571
$334,111,574,045
$15,627,756,032
$1,891,373,787
APN
18,022
6,804
10,768
21,195
5,138
6,688
414,865
483,480
3,230
269,954

www.sccassessor.org 27
Res
iden
tial
Non
-Res
iden
tial
Tota
l A
ppea
lsA
sses
sed
Valu
e A
ppea
lsA
sses
sed
Valu
eA
ppea
lsA
sses
sed
Valu
efil
edin
Dis
pute
fil
edin
Dis
pute
fil
edin
Dis
pute
Cam
pbel
l43
$7,661,745
64$256,173,472
107
$263,835,217
Cup
erti
no96
$43,591,574
106
$1,732,975,511
202
$1,776,567,085
Gilr
oy47
$15,539,688
91$125,248,253
138
$140,787,941
Los
Alt
os118
$58,161,566
25$50,650,533
143
$108,812,099
Los
Alt
os H
ills
125
$120,017,337
1$287,811
126
$120,305,148
Los
Gat
os96
$73,494,577
59$199,590,125
155
$273,084,702
Milp
itas
42$20,352,043
147
$813,639,589
189
$833,991,632
Mon
te S
eren
o17
$9,604,878
0$0
17$9,604,878
Mor
gan
Hill
52$11,608,427
72$110,494,230
124
$122,102,657
Mou
ntai
n V
iew
42$14,863,479
202
$1,107,509,139
244
$1,122,372,618
Palo
Alt
o85
$65,566,439
78$1,122,114,275
163
$1,187,680,714
San
Jose
675
$123,890,734
1054
$5,061,614,941
1729
$5,185,505,675
Sant
a C
lara
66$8,990,735
325
$2,527,725,044
391
$2,536,715,779
Sara
toga
137
$84,419,934
17$16,635,893
154
$101,055,827
Sunn
yval
e82
$13,681,837
327
$2,859,547,266
409
$2,873,229,103
Uni
ncor
pora
ted
11$3,170,195
12$10,588,311
23$13,758,506
Gra
nd T
otal
1734
$674
,615
,188
2580
$15,
961,
522,
607
4314
$16,
636,
137,
795
Assessment Appeals Filed by City
Total Assessments Appealed as a Percentage of Total Assessment R
oll U
nits by Fiscal Year
2.50%
2.00%
1.50%
1.00%
0.50%
0.00%
1999 2000 2001 2002 2003 2004 2005 2006 2007 2008 2009 2010 2011 2012 2013 2014
T

Assessment Appeals ProcessIn Santa Clara County, a Notification of Assessed Value indicating the assessed (taxable) valueof each property is mailed in June to all property owners on the secured roll. A taxpayer whodisagrees with the assessed value is encouraged to take advantage of the Assessor’s “onlinetool,” available 24/7. Last year, this tool enabled 352,000 property owners to review the com-parable sales used to determine their assessment. Also online they can request a review by pre-senting to the Assessor’s Office, before August 1, any factual information pertinent to thedetermination of the property’s market value. If the Assessor agrees that a reduction is appro-priate, an adjustment is made prior to the mailing of the property tax bill in October.
If a difference of opinion still exists, the taxpayer may file an application for a reduction inthe assessed value, (i.e. an assessment appeal). The appeal is then set for hearing before thelocal, independent Assessment Appeals Board. In Santa Clara County, appeal applicationsmust be filed between July 2 and September 15 with the Clerk of the Board(Clerk to the County Board of Supervisors). State law requires that allassessment appeals be resolved within two years of filing unless theproperty owner signs a waiver of the statute. To appeal a roll changeor supplemental assessment, typically triggered by a change in own-ership, audit or completed new construction, the application mustbe filed within 60 days of the date of the notice.
Due to the large increase in assessment appeals during the recession,a Value Hearing Officer program was established in 2011. Designedto expedite resolution of residential assessment appeals, the program hasbeen very successful. Between July 1, 2013 and June 30, 2014, the ValueHearing Officer program resolved 656 appeals. As a result 90 percent of all res-idential assessment appeals are resolved within 12 months.
If the Assessment Appeals Board renders a decision granting a temporary reduction in value(Proposition 8) that value and the corresponding reduction in property taxes apply only to theproperty tax due for the year for which the application was filed.
Should the Assessment Appeals Board order a change in the base year value set by the Assessor for new construction or a change in ownership, the reduction in value applies to thetax bill(s) for the year the application was filed, and establishes a new base year value for thefuture. When a taxpayer appeals the Assessor’s determination of the reassessability of a changein ownership, the matter is heard and adjudicated by an independently appointed legal hearing officer.
Want a Faster Appeal? Request a Value Hearing Officer
28 www.sccassessor.org
Last year 38.2 percent of all assessment appeals were withdrawn by appellant; 38.5 percent were resolved prior
to the hearing; 17.5 percent were denied due to lack ofappearance and 4.6 percent were resolved at an
assessment appeals board hearing.

Appeals Filed By Homeowners Drop 45 PercentReflecting the strong economic recovery, in both the residential and commercial sector, thenumber of valid assessment appeals filed by business owners (3,709) dropped 12 percent forthe third year. Assessment appeals filedby homeowners (1,734) plunged 45percent, the largest drop in severalyears. In 2009 there were 6,698 resi-dential appeals filed.
Overall, the number of assessmentappeals declined 26 percent.Commercial and industrial propertyowners or businesses with personalproperty accounted for 88 percent ofthe assessed value in dispute.
Between July 1, 2013, and June 30,2014, the Assessor’s Office resolved8,829 appeals. Ninety-five percent ofthe Assessor’s originally enrolledassessed values disputed by appellantswere sustained by the AssessmentAppeals Board. The Assessor’s Officetook advantage of the reduction in appeals filed to reduce by 42 percent the number of daysto process and resolve a residential appeal.
www.sccassessor.org 29
(value in billions)
Assessment Appeals Filed
Year Appeals Total Local Value in Percent ofRoll ** Dispute * Roll at Risk+
2013 5,443 $357.35 $22.75 6.8%2012 7,371 $308.81 $22.10 7.2%2011 8,578 $299.10 $21.41 7.2%2010 9,163 $296.47 $23.67 8.0%2009 11,168 $303.86 $25.34 8.3%2008 5,630 $303.31 $18.78 6.2%
* Value in dispute: The difference of value between the assessed roll value and applicants’ opinion of value compiled at the end of the filing year.
** Local roll value: Net of nonreimbursable exemptions+ Percentages based on non-rounded values
Note: Report shows all appeals filed for 2013, including appeals laterdetermined to be invalid.
Appeals Comparison12,00010,5009,0007,5006,0004,5003,0001,500
2008/2009 2009/2010 2010/2011 2011/2012 2012/2013 2013/2014
Total Appeals filed (sum of below)
Appeals by owners ofresidential properties
Appeals by all othertaxpayers
8,578
5,443
7,371
5,630
11,168
Total Appeals Resolved
8,943
9,1449,298
9,163
3,3795,863
8,829
...In 2013 theAssessor’s Officeexpended 4.37 staffhours to resolve eachresidential appealand approximately15.91 staff hours toresolve each appealfor business equip-ment and machinery(business personalproperty)...

30 www.sccassessor.org
Performance CountsLed by County Assessor Larry Stone, the Assessor’s Office has implemented an ambitious performance-based budgeting and management initiative. Based on the simple idea that whatgets measured gets done, the Assessor’s Office has a clear mission statement, measurable perform-ance indicators designed to quantify improvement over time, all tied directly to the budget.
The Assessor’s Office utilizes an automated telephone based customer satisfaction surveywhich measures clarity of information, cour-tesy, helpfulness, professionalism, promptness,and overall satisfaction.
Last year 519 taxpayers participated in ourcustomer satisfaction survey and results wereconsistent with the prior year. Participantsgave the staff a rating of 4.1 on a scale of 1 to5, with 5 being the highest.
What Our Customers are Saying
Each year, scores of customers respond to customer surveys withcomments about the office and the staff. Below is a small sample.
“Both gentlemen were extremely helpful in answering my questions and providing assistance toresolve the matter at hand. The issue required correspondences and copies of documents whichthey both provided instantaneously. I commend them both for their professionalism and theirsuperior service that they provided. “
“Your (property transfer) examiner was so great helping my Mom with the documents last week,it is a little overwhelming and she had so much patience. Please extend our thanks. You really DO have the best staff!”
“I was confused and ignorant to the entire process. Your auditor was patient,polite and professional.”
“I appreciate the attention and thoroughness that you take to participate here [on our neighborhood listserv] concerning property tax related questions, if only other government enti-ties were as competent.”
“For the most part, Santa Clara County is consistently at the top of the game in terms of professional process and clarity of data. The reports that you are providing to school districtshave been alluded to in meetings that we have with them.”
Customer Satisfaction100%
95%
90%
85%
80%
75%
70%FY 08 FY 09 FY 11 FY 12FY 10
90.0% 92.0%
85.6% 86.0% 86.0%
FY 13 FY 14
86.4%87.8%

www.sccassessor.org 31
Performance Measures
The following are the Assessor’s comprehensive performance measures. By reporting high-level quantitative and qualitative data that tracks levels of customer satisfaction, timeliness of product delivery, accuracy of assessments and overall financial efficiency, these measures allow the Assessor toidentify and record service levels from year to year, designed to achieve specific continuous improve-ment objectives. The data is compiled from the results of similar, more detailed measures in eachDivision of the Assessor’s Office. The performance measures in each Division were developed in collaboration with both line staff and managers.
1. 98.5 percent of assessments were completed byJune 30, 2014. (98.6 percent in 2013) Why is this important? The assessment roll isthe basis by which property taxes are levied.The completeness of the assessment roll assurespublic agencies dependent upon property taxrevenue that the assessment roll accuratelyreflects current market activity.
2. 179 was the average number of days, as of June30, 2014 to deliver supplemental assessmentsto the Tax Collector. (190 in 2013)Why is this important? Supplemental assess-ments occur upon a “change in ownership” or“new construction” of real property. This performance measure ensures timely notifica-tion to those property owners who acquire orcomplete new construction of their property.
3. The average number of days to resolve an assess-ment appeal in 2014 was 582. (542 in 2013)Why is this important? By statute, assessment
appeals must be resolved within two years offiling, unless a waiver is executed by the taxpayer. This performance measure ensures a timely equalization of assessments for property owners.
4. Department’s customer satisfaction ratingfrom surveys in FY 2013-14 was 86.3 percent.(87.8 percent in 2013)Why is this important? This outcome measurerates the satisfaction level of both our internaland external customers who rely on theAssessor for timely service and accurate information.
5. Total expenditures were 97.2 percent of thebudget in FY 2014. (96.6 percent in 2013)Why is this important? The budget/cost ratiocompares the department’s actual bottom lineexpenditures at the end of the fiscal year to the budget to ensure that costs do not exceedanticipated resources.
Appraising and Assessing: Is There a Difference?
Yes. An appraisal is the process of estimatingvalue. Most taxpayers assume the market placeexclusively determines a property’s assessment.However, the market value may be only onecomponent in the process of determining theproperty’s assessed value. While at least one ofthe three approaches to value, (1) sales compar-ison, (2) income, and (3) cost, is always consid-ered in the appraisal of a property, the Assessor
is required to incorporate additional factorswhen determining when and how to assessproperty under state law. Frequently, courtdecisions, laws, and rules promulgated by theState Legislature and State Board ofEqualization amend the assessment process, andredefine what, when and/or how the Assessormust determine the assessed value of a property.

32 www.sccassessor.org
A critical component of the Assessor’s performance based budget and management system is thecomprehensive cost accounting system that allows the Assessor to financially account for nearlyevery task performed by office staff. The data captures the fully loaded cost, including compensa-tion, benefits, overhead etc., of activities such as the cost of a residential or commercial appraisal, oran audit of a major company.Managers use the cost accounting data to measure performance and establish quality standards, allo-cate work assignments and measure completion rates. Managers are able to review hours worked,essential in calculating the cost per unit. This information is critical for achieving increased produc-tivity, and improving customer service to property owners, taxpayers, and public agencies thatdepend on property tax revenue.
Cost Accounting
How The Assessor’s Staff Expended 268,505 Hours During the Prior Fiscal Year
Other Roll Processing
2,833 1%
Mapping, Property ID 9,772
4%
Exemptions11,133
4%
Proposition 819,530 7%
Business Property Assessments 23,000
9%
New Construction30,956
12%
Changes of Ownership 31,314
12%
Deed Processing35,61613%
Audits 41,26115%
Appeals 63,090
23%

www.sccassessor.org 33
To Hwy 101 (South)
To Hwy 101 (North)
Younger St.
Sheriff’s Bldg.
County EmployeeParking
(public parking permittedafter 5:00 p. m.)
Hedding St.
N. 1st St.
San Pedro St.San Pedro St..
To Hwy 280 Mission St.
West Wing East Wing CivicCenterLightRailStation
ASSESSOR’S OFFICE5TH FLOOR, EAST WING
Guadalupe Parkw
ay Highway 87
Nati’lGuard
Armory
U.S.Army
Reserve
Public ParkingGarage
171 W. Hedding St.
Justice Facility
Santa Clara CountyGovt. Center
70 W. Hedding St.
SanJose
Airport
[880
OneHourPublicParking
Directions to the Assessor’s Office
Q. Can I transfer my current assessed value to anew home to avoid higher property taxes?A. Yes, under Proposition 60, if you are age 55or older and qualify. When a senior citizen sellsan existing residence and purchases or constructs a replacement residence valued thesame or less than the residence sold, the Assessorcan transfer the assessment (factored base yearvalue) of the original residence, to the replace-ment residence anywhere in Santa ClaraCounty. Additionally, Santa Clara and eightother counties currently participate inProposition 90, and will accept base year valuetransfers from any county in California.Propositions 60/90 require timely filing, aresubject to approval by the Assessor, and can begranted only once. To receive more informationor an application, go to www.sccassessor.org.
Q. What can I do if I think my assessmentis too high (i.e., higher than market value)? A. Submit an informal “assessment reviewrequest” on-line at www.sccassessor.org. Anysupporting data (appraisals, comparables, multi-
ple listings, etc.) will be helpful in expediting areduction if an adjustment is warranted. To filea formal appeal with the Assessment AppealsBoard, contact the Clerk of the Board atwww.sccgov.org or (408) 299-5088.
Q. I plan to transfer my home to my child. Canhe/she retain my same assessment?A. Yes, upon qualification. The voters ofCalifornia modified the Constitution(Propositions 58 and 193) to allow parents, andin some cases, grandparents who want to keeptheir home “in the family” to transfer theirassessed value to their children, or even grandchildren, in certain circumstances. Taxrelief is provided when real property transfersoccur between parents and their children(Proposition 58) or from grandparents to grandchildren (Proposition 193) if the parentsare no longer living. Interested taxpayers shouldcontact the Assessor to receive more informa-tion and an application. All claims must be filedtimely and are subject to final approval by theAssessor.
Frequently Asked Questions

34 www.sccassessor.org
Explanation of Terms*Ad Valorem Property Tax Taxes imposed on the basis of the property’s value.
Assessed Value The taxable value of a property against which the tax rate is applied.
Assessment Appeal Due process initiated by taxpayer if the assessed value of her or her property can-not be agreed upon with the assessor.
Assessment Appeals Board (AAB) A three-member panel appointed by the Board of Supervisors to resolve disputesbetween the Assessor’s Office and property owners. Qualifying owners mayalternatively select a Value Hearing Officer to hear their appeal. Typically a realestate professional, the VHO process is considered an expedient and convenientalternative to the more formal Board proceedings, and may provide a faster reso-lution to an appeal.
Assessment Roll The official list of all property within the county assessed by the Assessor.
Base Year (Value) The fair market value of a property at the time of the 1975 lien date, or on thedate of the subsequent new construction or change in ownership.
Basic Aid “Basic Aid” school districts fund their revenue limit entirely through propertytaxes and receive no general purpose state aid.
Business Personal Property Property which is movable and not affixed to the land, and which is owned andused to operate a business, such as furniture, computers, machines and supplies.
Change in Ownership A transfer of real property resulting in the transfer of the present interest andbeneficial use of the property.
CCPI California Consumer Price Index; determined annually by the California Bureauof Labor Statistics.
Escaped Assessments Assessments levied outside the normal assessment period for the lien date(s) inquestion.
Exclusions Qualifying transfers of real property which are excluded from reappraisal if atimely claim is filed with the Assessor’s Office.
Exemption Legally qualified deduction from the taxable assessed value of the property.
Factored Base Year Value(FBYV) A property’s base value, adjusted annually by the change in the CCPI, not toexceed 2 percent. It is the upper limit of taxable value each year.
Fiscal Year The period beginning July 1 and ending June 30.
Fixture Tangible property securely affixed to real property.
Full Cash Value (FCV) The amount of cash or its equivalent value that property would bring if exposedfor sale in the open market, and as further defined in Revenue & Taxation Code§110.
Improvements Buildings or structures generally attached to the land.
Lien The amount owed and created by the assessment of the property, or the amountlevied against property by a taxing agency or revenue district.
Lien Date The date when taxes for any fiscal year become a lien on property. In California,all tax liens attach annually as of 12:01 am on January 1"
*Explanation of terms are provided to simplify assessment terminology, but do not replace legal definitions.

www.sccassessor.org 35
New Construction The construction of new buildings, additions to existing buildings, or alterationswhich convert the property to another use or extends the economic life of theimprovement.
Parcel Land that is segregated into units by boundary lines for assessment purposes.
Personal Property Any property except real estate, including airplanes, boats, and business property.
Possessory Interest (PI) Interest of a lessee in government-owned property. Examples of a PI include theexclusive right to use public property at an airport such as a car rental company’sservice counter or a concession stand at the county fair. In both cases, the ven-dors are subject to property taxes.
Proposition 13 Passed by California voters in June, 1978, Proposition 13 is a Constitutionalamendment that limits the taxation of property and creates a procedure forestablishing the current taxable value of locally assessed real property, referencinga base year full cash value.
Proposition 8 Passed by California voters in November 1978, Proposition 8 requires the tem-porary reduction in the assessed value when there is a decline in market valuebelow the property’s factored base year value.
Real Property Land that has been legally defined and improvements that have been made tothe land.
Secured Roll Assessment roll on which the taxes are secured by a lien against the real estate.
Special Assessments Direct charges or flat fees against property which are included in the total taxbill but are not based upon the Assessor’s valuation of the property. Examplesare sewer charges or school parcel taxes.
State Board of Equalization (SBE) The Board consists of four members elected by California voters by district, andthe State Controller. Their duties include administering various State taxes andfees and serving as an appellate body for property, business, and income taxassessments. Through guidelines and rules and the Board promotes uniformityin local assessment practices.
Supplemental Assessment Upon a change of ownership or completion of new construction, a supplementalassessment is issued in addition to the annual regular assessment and is based onthe net difference between the previous assessed values and the new value for theremainder of the assessment year(s).
Tax Rate The ratio of the tax to the tax base. The minimum ad valorem property tax rateis 1% of the net taxable value of the property. The total tax rate may be higherdue to voter-approved general obligation bonds that are secured by propertytaxes for the annual payment of principle and interest.
Tax Roll The official list of property subject to property tax, together with the amount ofassessed value and the amount of taxes due, as applied and extended by theAuditor/Controller.
TRA Tax Rate Area; a geographic area having the same property tax allocation fac-tors.
Transfer of Ownership Change in ownership or change in manner in which property is held.
Unsecured Roll Assessment roll consisting largely of business personal property, on which theproperty taxes are not secured by a lien against the real estate.

36 www.sccassessor.org
January 1 Lien Date for next assessment roll year. This is the time when taxes for the next fiscal year become a lien on the property.
February 15 Deadline to file all exemption claims.
April 1 Due date for filing statements for business personal property, aircraft and boats.Business property owners must file a property statement each year detailing thecost of all supplies, machinery, equipment, leasehold improvements, fixtures andland owned at each location within Santa Clara County.
April 10 Last day to pay second installment of secured property taxes without penalty. This tax payment is based on property values determined for the January lien date 15 months earlier.
End of June Annual mailing of assessment notices to all Santa Clara County property ownerson the secured roll stating the taxable value of the property. Owners who disagreewith the Assessor’s valuation are encouraged to contact us, via the website, priorto August 1 to request a review. Please provide any pertinent factual informationconcerning the market value of the property with the request. If the Assessoragrees that a reduction is appropriate, a new assessed value will be enrolled.
May 7 Last day to file a business personal property statement without incurring a 10 percent penalty.
July 1 Close of assessment roll and the start of the new assessment roll year. The assessment roll is the official list of all assessable property within the County.
July 2 First day to file assessment appeal with the Clerk of the Board of Supervisors.
August 31 Last day to pay unsecured property taxes without penalty.
September 15 Last day to file an assessment appeal application for reduced assessment on the regular roll with the Clerk of the Board of Supervisors.
December 10 Last day to pay first installment of secured property taxes without penalty.
January 1 Lien date for next assessment roll year.
Property Assessment Calendar
Frequently Asked QuestionsQ. My house was destroyed by a fire. Is proper-
ty tax relief available until it is rebuilt?A. Yes, assuming you qualify. Owners of real
property who incur significant damages (tenthousand dollars or more) as the result of anatural disaster, such as a fire, flood orearthquake, can file for temporary property taxrelief (reassessment) with the Assessor’s Office.Applicants must file a written applicationwithin 60 days of the disaster. Items such ashome furnishings, personal effects andbusiness inventories are not assessable.
Q. How many properties are still protected by Proposition 13, passed by the voters in1978?
A. All properties, in Santa Clara County andthroughout California, receive the full protections and benefits of Proposition 13,whether a property was purchased last year orin 1975. The base year value is established at the time of purchase or new construction,and increases in the assessed value are limitedto an inflation factor of no more than 2 percent annually.

Responsibility of the Assessor’s OfficeThe Assessor has the responsibility to locate all taxableproperty in the County, identify ownership, establish avalue for all property subject to local property taxation, listthe value of all property on the assessment roll, and applyall legal exemptions. The Santa Clara County Assessor doesnot compute property tax bills, collect property taxes,establish property tax laws, establish rules by which proper-ty is assessed, or set property tax rates.
Santa Clara County contains more than 470,000 separatereal property parcels. There were just over 2,700 changes inparcel numbers, and there were over 77,000 changes inownership documents as reflected by deeds and maps filedin the County Recorder’s Office. The Assessor’s profession-al staff maintains a comprehensive set of 214 Assessor’s par-cel map books. The office appraised more than 5,700parcels with new construction activities, and processedmore than 72,000 business personal property assessments.
The assessments allow the County of Santa Clara and 204 local government taxing authorities to set tax rates (as limited by Proposition 13 and other laws), and collect and allocate property tax revenue which supports essential public services provided by the County, localschools, cities, and special districts.
AcknowledgmentsEditor: David K. Ginsborg, Deputy to the AssessorAssistance provided by Marty Reinders, Lisa Cortez,Debra Lee & the staff of the Assessor’s OfficeLayout Production: www.Kurigraphics.comPrinted by GSA Printing ServicesPhotographs provided by Bordon Chin, with specialthanks to Alan Fusco and Barbara Henderson atCounty Social Services for providing rooftop access.
¿No habla ingles? La Oficina del Tasador tiene empleados que hablan español. Llámenos al (408) 299-5500
Disclaimer: This document presents a distribution of the 2014-2015 Santa Clara County property tax local assessment roll by City/Redevelopment Successor Agency andmajor property types. It does not include state-assessed property (unitary roll). It is not the source document for deriving the property tax revenues to be received by anypublic entity. For example, the Controller’s AB8 calculations do not include aircraft assessed valuation, which is incorporated into this report. Numbers reported in tablesand charts reflect up to 0.01 units. Items less than 0.01 units have been reported as a dash. Minor discrepancies may occur due to rounding calculations and/or clarifica-tion in definition of terms.Published August 2014.
Santa Clara County Assessor’sMission StatementThe mission of the Santa Clara County Assessor’s Office is to produce an annual assessment roll including all assessable property in accordance with legal mandates in a timely, accurate, and efficient manner; and provide current assessment-related information to the public and to governmental agencies in a timely and responsive way.
Questions?We have answers.
Go to www.sccassessor.org

Santa Clara CountyBoard of SupervisorsMike Wasserman, District I Cindy Chavez, District IIDave Cortese, District IIIKen Yeager, District IVJoe Simitian, District V
County ExecutiveJeffrey V. Smith
Printed on recycled paper with soy based inks2199
PRSRT STDU.S. Postage
PAIDPermit # 1406San Jose, CA
Please e-mail us at [email protected] if your address has changed or to receive electronically
Office of the County AssessorLawrence E. Stone, AssessorCounty of Santa Clara Government Center70 West Hedding Street, 5th Floor, East WingSan Jose, California 95110-1771Website: www.sccassessor.org
For information regarding general County financial information including taxes by tax rate areasand methods of property tax revenue allocation contact:Santa Clara County Finance Agency (408) 299-5200
For information about Santa Clara County Assessments:Public Information and Ownership (408)299-5500Real Property (land and improvements) (408)299-5300 [email protected] Property, including Businesses Mobilehomes, Boats and Airplanes (408)299-5400 [email protected] Tax Exemptions (408)299-6460 [email protected] in Ownership Issues (408)299-5540 [email protected] (408)299-5550 [email protected]
Administration (408)299-5570Administration Fax (408)297-9526Assessor Website www.sccassessor.orgCounty Website www.sccgov.org
For information about a tax bill, payments, delinquency, or the phone number of the appropriateagency to contact about a special assessment, contact:Santa Clara County Tax Collector (408)808-7900 www.scctax.org
For information about filing assessment appeals, contact:Santa Clara County Assessment Appeals Board Clerk (Clerk of the Board of Supervisors) (408)299-5088 www.sccgov.org/portal/site/cob
For information about Recording documents, contact:Santa Clara County Clerk/Recorder (408)299-5688 www.clerkrecorder.org
California State Board of EqualizationThe State Board of Equalization is responsible for assuring that county property tax assessment practicesare equal and uniform throughout the state. For more information, contact the State Board at (800) 400-7115 or www.boe.ca.gov
To download this report in pdfformat scan this QR code
RETURN SERVICE REQUESTED