Embed Size (px)
DESCRIPTION
Peak Ground Acceleration
Citation preview

ESTIMATION OF PEAK HORIZONTAL GROUND ACCELERATIONS
COVERING THE MANOLO FORTICH 1 HEPP & 2 HEPP
PROJECT SITES

ESTIMATION OF PEAK HORIZONTAL GROUND ACCELERATIONS
COVERING THE MANOLO FORTICH 1 HEPP & 2 HEPP PROJECT SITES
INTRODUCTION
The RSJ & Associates requested the again the undersigned for his professional
comments on the estimation of peak ground acceleration (PGA) values for the Manolo
Fortich 1 & 2 Hydro Electric Power Plant (HEPP) structures. Said estimation was
sought by the HEDCOR Manolo Fortich Project Engineering Team to the former for the
latter’s consideration on the design of the different structures to be constructed in the
area. Taking consideration on the request, and with reference to the works of several
authors (e.g. Thenhaus, et al., 1994; Zhang, et al., 1999) on estimation of ground-
motion hazards, presented hereunder the estimated values for peak ground horizontal
accelerations for the project site.
THENHAUS ET AL.’S PROBABILISTIC GROUND-MOTION HAZARD MODEL
The probabilistic ground-motion hazard model developed by Algermissen et al. (1982)
was further improved by Thenhaus, et al. (1994) with the addition of a computer
algorithm that calculates ground-motion from planar seismic sources that dip. Such
consideration provides a more accurate representation of the geographic distribution of
strong ground-motion from earthquakes that rupture the shallow plate interface of
subduction zones (Thenhaus, et a., 1994)
Inasmuch as there is a lack of adequate strong ground-motion in the Philippines, the
recently developed attenuation relation for Japan (Fukushima and Tanaka, 1990),
described below, was applied by Thenhaus, et al. (1994).
log 10A = 0.41M – log 10(R + 0.032 x 100.41M) – 0.0034R + 1.30
where A is the mean peak acceleration (in cm/sec2), R is the shortest distance between
the site and the fault rupture (km), and M is the surface-wave magnitude. As described
by Thenhaus, et al., (1994), the standard deviation of log A for the relation is 0.21with a
multiple correlation coefficient of 0.89.
The results of such improvement are presented on the following maps (Figures 1 and
2) covering the entire Philippines.

(1) (2)
Fig. 1 – Map showing peak horizontal acceleration amplitudes in rock for the Philippines. Acceleration
values have a 10% probability of exceedance in 50 years. Fig. 2 – Map showing peak horizontal
acceleration amplitudes in medium soil for the Philippines. Acceleration values have a 10 percent
probability of exceedance in 50 years. All contours are in terms of the acceleration of gravity (g).
ZHANG, ET AL.’S GLOBAL SEISMIC HAZARD ASSESSMENT PROGRAM
Zhang, and others in 1999 developed the Global Seismic Hazard Assessment Program
(GSHAP) in Continental Asia, for which the Philippines cooperated in the program
implementation. Result of the program is presented on a map on Figure 3. The seismic
hazard map depicts PGA with a 10% chance of exceedance in 50 years and the site
classification is rock.
Zhang, et al. (1999) applied the relationship determined by Huo and Hu (1992) for
strong ground attenuation relation, where the intensity and strong ground motion data
from both China and western USA were utilized. Zhang used the relationship in their
seismic hazard computation in Asia and it is expressed as:
lnY = 0.1497 + 1.9088M - 2.049M2 - 2.049ln[R+0.1818exp(0.7072M)]

where Y is the peak ground acceleration at the site. R is the shortest distance (in km)
from the site to the vertical projection of the earthquake fault rupture to the surface. M is
the surface wave magnitude.
The result of their computations is presented in a map shown in Figure 3.
Fig. 3 – Seismic hazard map of Asia depicting Peak Ground Acceleration given in units of m/s
2 with a
chance of exceedance in 50 years. The site classification is rock (adapted from Zhang, et al., 1999).
This seismic hazard map of Asia depicts the shaking hazard that will have the largest
effect on one to two story structures (the largest class of structures in Asia). In addition,
the seismic hazard (PGA) values in Asia reflect the complicated regional
seismotectonics. The highest hazard values are along the subduction zones that border
eastern and southwestern Asia.
ESTIMATION OF PGA VALUES FOR MANOLO FORTICH 1 & 2 HEPP
Presented below in Table 1 are the classifications of the lithology underlying where the
component structures for the two HEPP project sites are to be erected.
PROJECT NAME/COMPONENT
GEOGRAPHIC COORDINATES CLASSIFICATION OF UNDERLYING
LITHOLOGY LATITUDE LONGITUDE
Manolo Fortich 1 HEPP
Weir 1 (Tanaon R.) 8° 27’ 43.27” N 125° 02’ 07.75” E Rock
Weir 2 (Guihean R.) 8° 24’ 48.60” N 125° 01’ 18.52” E Rock
Weir 3 (Amusig R.) 8° 27’ 18.22” N 125° 00’ 00.06” E Rock
Surge Tank 8° 25’ 55.07” N 124° 59’ 11.83” E Rock
Head Pond 8° 25’ 36.02” N 125° 00’ 03.54” E Rock
Power Station 8° 25’ 48.30” N 124° 58’ 56.65” E Rock
Manolo Fortich 2 HEPP
Weir 4 (Lower Amusig R.) 8° 25’ 49.13” N 124° 58’ 53.05” E Rock
Surge Tank 8° 25’ 04.43” N 124° 55’ 26.19” E Medium Soil
Power Station 8° 25’ 01.82” N 124° 55’ 12.44” E Medium Soil
Table 1 – Comparison of underlying lithology for each project component for the two HEPP sites
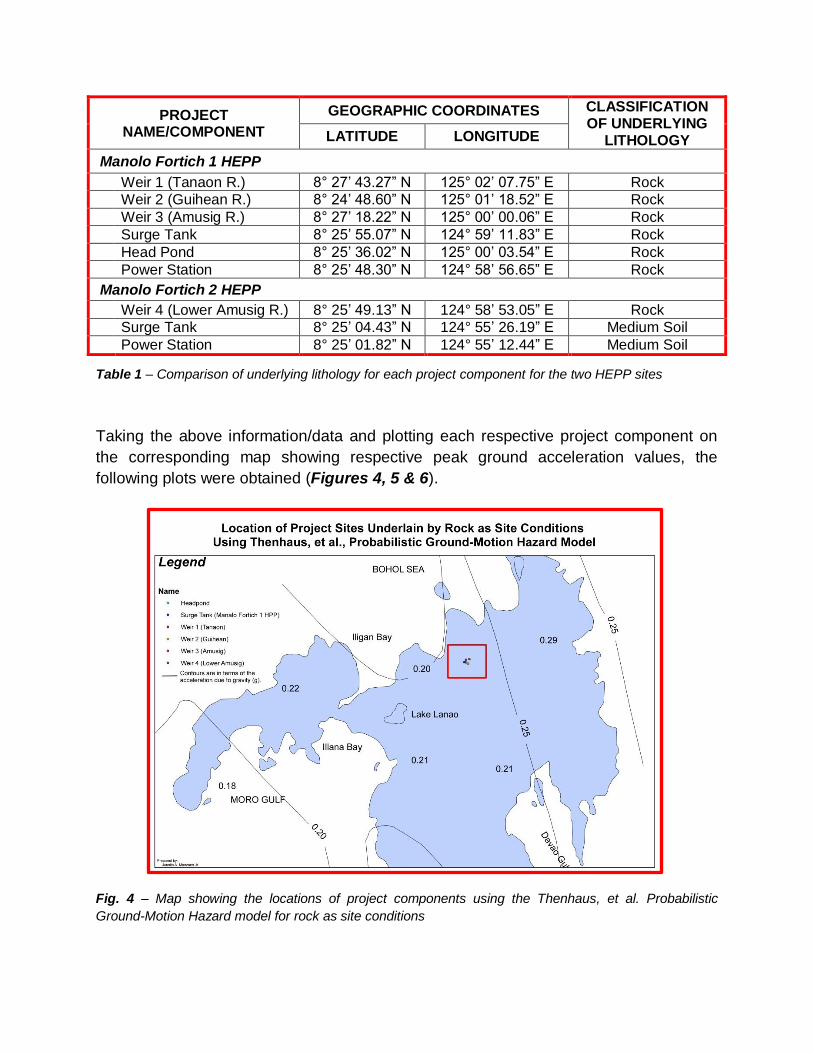
Taking the above information/data and plotting each respective project component on
the corresponding map showing respective peak ground acceleration values, the
following plots were obtained (Figures 4, 5 & 6).
Fig. 4 – Map showing the locations of project components using the Thenhaus, et al. Probabilistic
Ground-Motion Hazard model for rock as site conditions

Fig. 5 – Map showing the locations of project components using the Thenhaus et al. Probabilistic Ground-
Motion Hazard model for medium soil as site conditions
Fig. 6 – Map showing the locations of project components using the Zhang et al. Global Seismic Hazard
Assessment Program for rock as site conditions.
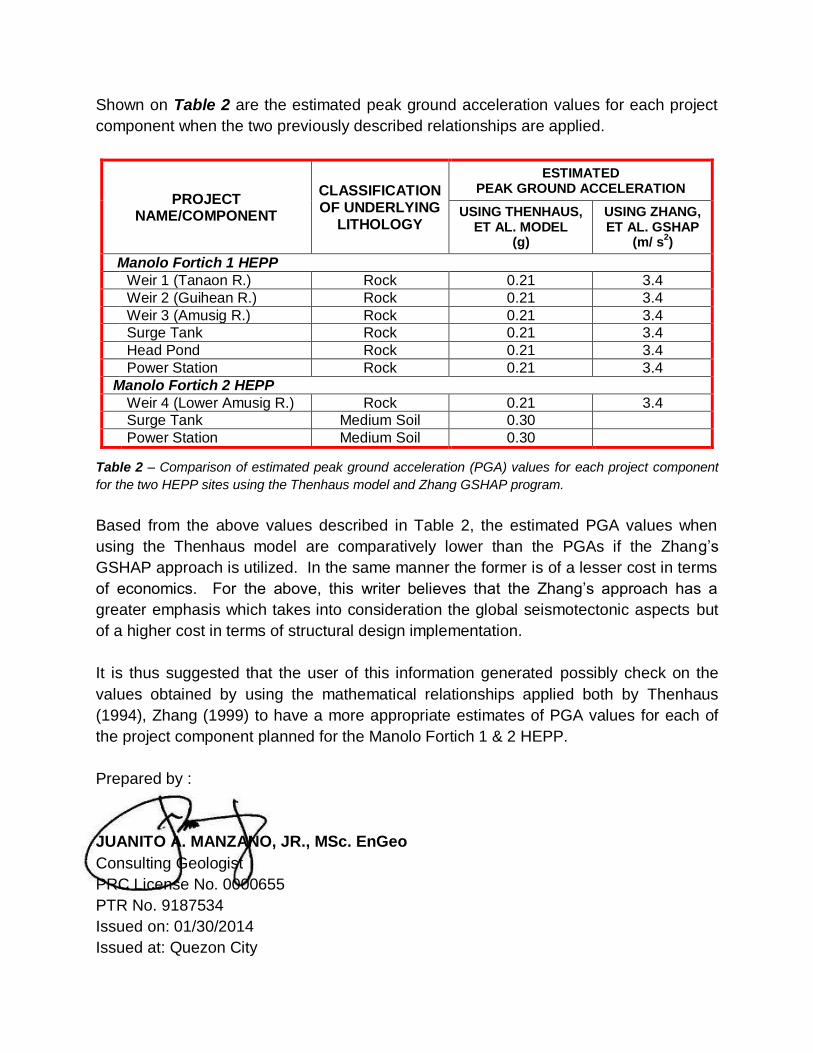
Shown on Table 2 are the estimated peak ground acceleration values for each project
component when the two previously described relationships are applied.
PROJECT NAME/COMPONENT
CLASSIFICATION OF UNDERLYING
LITHOLOGY
ESTIMATED PEAK GROUND ACCELERATION
USING THENHAUS, ET AL. MODEL
(g)
USING ZHANG, ET AL. GSHAP
(m/ s2)
Manolo Fortich 1 HEPP
Weir 1 (Tanaon R.) Rock 0.21 3.4
Weir 2 (Guihean R.) Rock 0.21 3.4
Weir 3 (Amusig R.) Rock 0.21 3.4
Surge Tank Rock 0.21 3.4
Head Pond Rock 0.21 3.4
Power Station Rock 0.21 3.4
Manolo Fortich 2 HEPP
Weir 4 (Lower Amusig R.) Rock 0.21 3.4
Surge Tank Medium Soil 0.30
Power Station Medium Soil 0.30
Table 2 – Comparison of estimated peak ground acceleration (PGA) values for each project component
for the two HEPP sites using the Thenhaus model and Zhang GSHAP program.
Based from the above values described in Table 2, the estimated PGA values when
using the Thenhaus model are comparatively lower than the PGAs if the Zhang’s
GSHAP approach is utilized. In the same manner the former is of a lesser cost in terms
of economics. For the above, this writer believes that the Zhang’s approach has a
greater emphasis which takes into consideration the global seismotectonic aspects but
of a higher cost in terms of structural design implementation.
It is thus suggested that the user of this information generated possibly check on the
values obtained by using the mathematical relationships applied both by Thenhaus
(1994), Zhang (1999) to have a more appropriate estimates of PGA values for each of
the project component planned for the Manolo Fortich 1 & 2 HEPP.
Prepared by :
JUANITO A. MANZANO, JR., MSc. EnGeo
Consulting Geologist
PRC License No. 0000655
PTR No. 9187534
Issued on: 01/30/2014
Issued at: Quezon City