Embed Size (px)
Citation preview

2013.11.07- SLIDE 1IS 257 – Fall 2013
Data Warehouses, Decision Support and Data Mining
University of California, Berkeley
School of Information
IS 257: Database Management
2013.11.07- SLIDE 2IS 257 – Fall 2013
Lecture Outline
• Review– Data Warehouses
• (Based on lecture notes from Joachim Hammer, University of Florida, and Joe Hellerstein and Mike Stonebraker of UCB)
• Views and View Maintenance• Applications for Data Warehouses
– Decision Support Systems (DSS)– OLAP (ROLAP, MOLAP)– Data Mining
• Thanks again to lecture notes from Joachim Hammer of the University of Florida
• A new architecture – SAP HANA

2013.11.07- SLIDE 3IS 257 – Fall 2013
Lecture Outline
• Review– Data Warehouses
• (Based on lecture notes from Joachim Hammer, University of Florida, and Joe Hellerstein and Mike Stonebraker of UCB)
• Views and View Maintenance• Applications for Data Warehouses
– Decision Support Systems (DSS)– OLAP (ROLAP, MOLAP)– Data Mining
• Thanks again to lecture notes from Joachim Hammer of the University of Florida

2013.11.07- SLIDE 4IS 257 – Fall 2013
Problem: Heterogeneous Information Sources
“Heterogeneities are everywhere”
Different interfaces Different data representations Duplicate and inconsistent information
PersonalDatabases
Digital Libraries
Scientific DatabasesWorldWideWeb
Slide credit: J. Hammer

2013.11.07- SLIDE 5IS 257 – Fall 2013
Problem: Data Management in Large Enterprises
• Vertical fragmentation of informational systems (vertical stove pipes)
• Result of application (user)-driven development of operational systems
Sales Administration Finance Manufacturing ...
Sales PlanningStock Mngmt
...
Suppliers
...Debt Mngmt
Num. Control
...Inventory
Slide credit: J. Hammer
2013.11.07- SLIDE 6IS 257 – Fall 2013
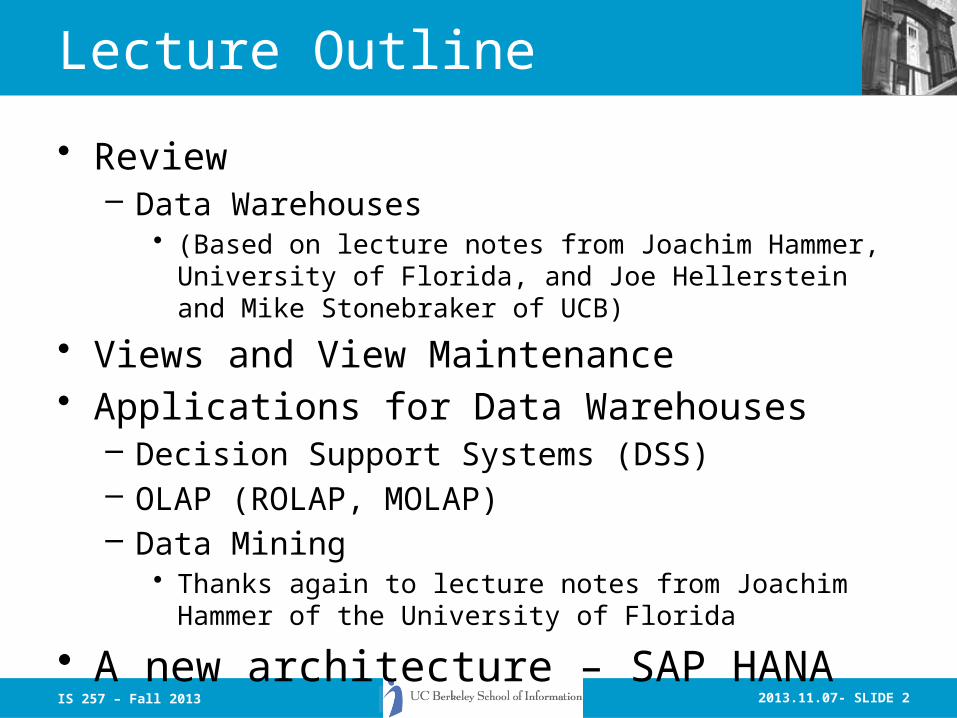
Goal: Unified Access to Data
Integration System
• Collects and combines information• Provides integrated view, uniform user interface• Supports sharing
WorldWideWeb
Digital Libraries Scientific Databases
PersonalDatabases
Slide credit: J. Hammer

2013.11.07- SLIDE 7IS 257 – Fall 2013
The Traditional Research Approach
Source SourceSource. . .
Integration System
. . .
Metadata
Clients
Wrapper WrapperWrapper
• Query-driven (lazy, on-demand)
Slide credit: J. Hammer

2013.11.07- SLIDE 8IS 257 – Fall 2013
The Warehousing Approach
DataWarehouse
Clients
Source SourceSource. . .
Extractor/Monitor
Integration System
. . .
Metadata
Extractor/Monitor
Extractor/Monitor
• Information integrated in advance
• Stored in WH for direct querying and analysis
Slide credit: J. Hammer

2013.11.07- SLIDE 9IS 257 – Fall 2013
What is a Data Warehouse?
“A Data Warehouse is a –subject-oriented,– integrated,– time-variant,–non-volatile
collection of data used in support of management decision making processes.”
-- Inmon & Hackathorn, 1994: viz. Hoffer, Chap 11

2013.11.07- SLIDE 10
Need for Data Warehousing• Integrated, company-wide view of high-quality
information (from disparate databases)• Separation of operational and informational systems
and data (for improved performance)
IS 257 – Fall 2013

2013.11.07- SLIDE 11IS 257 – Fall 2013
Warehouse is a Specialized DB
Standard (Operational) DB• Mostly updates• Many small transactions• Mb - Gb of data• Current snapshot• Index/hash on p.k.• Raw data• Thousands of users (e.g., clerical users)
Warehouse (Informational)• Mostly reads• Queries are long and complex• Gb - Tb of data• History• Lots of scans• Summarized, reconciled data• Hundreds of users (e.g., decision-makers, analysts)
Slide credit: J. Hammer

2013.11.07- SLIDE 12
Warehouse vs. Data Mart
IS 257 – Fall 2013

2013.11.07- SLIDE 13
E
T
LOne,
company-wide
warehouse
Periodic extraction data is not completely current in warehouse
Generic two-level data warehousing architecture
IS 257 – Fall 2013

2013.11.07- SLIDE 14
Data marts:Mini-warehouses, limited in scope
E
T
L
Separate ETL for each independent data mart
Data access complexity due to multiple data marts
Independent data mart data warehousing architecture
IS 257 – Fall 2013

2013.11.07- SLIDE 15
ET
L
Single ETL for enterprise data warehouse
(EDW)
Simpler data access
ODS provides option for obtaining current data
Dependent data marts loaded from EDW
Dependent data mart with operational data store: a three-level architecture
IS 257 – Fall 2013
2013.11.07- SLIDE 16
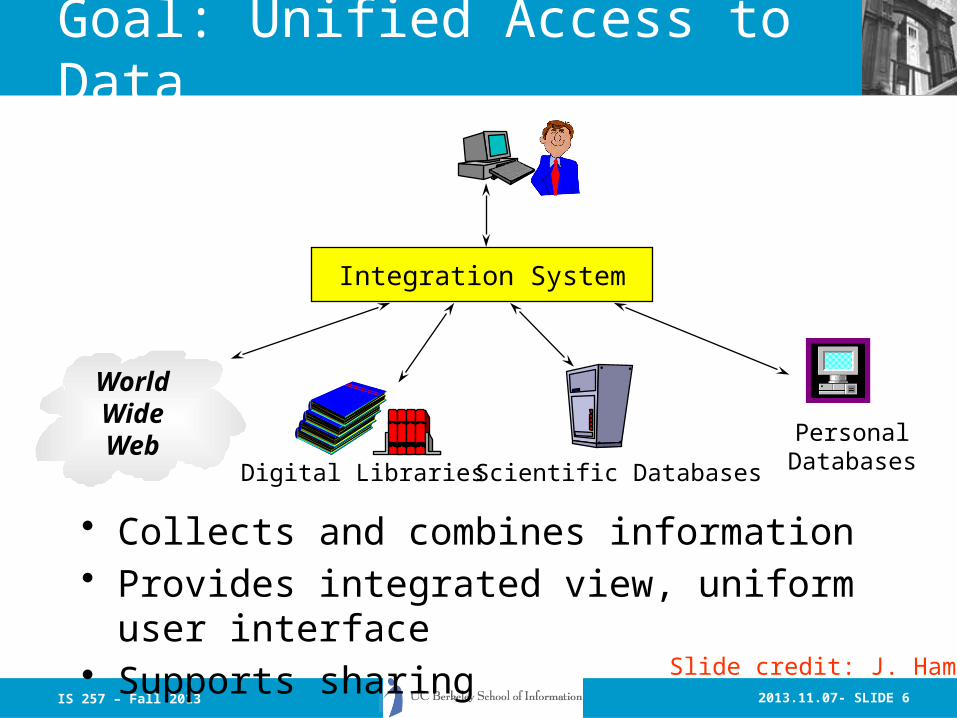
ET
L
Near real-time ETL for Data Warehouse
ODS and data warehouse are one
and the same
Data marts are NOT separate databases, but logical views of the data warehouse
Easier to create new data marts
Logical data mart and real time warehouse architecture
IS 257 – Fall 2013

2013.11.07- SLIDE 18
The ETL Process
• Capture/Extract• Scrub or data cleansing• Transform• Load and Index
IS 257 – Fall 2013
ETL = Extract, transform, and load
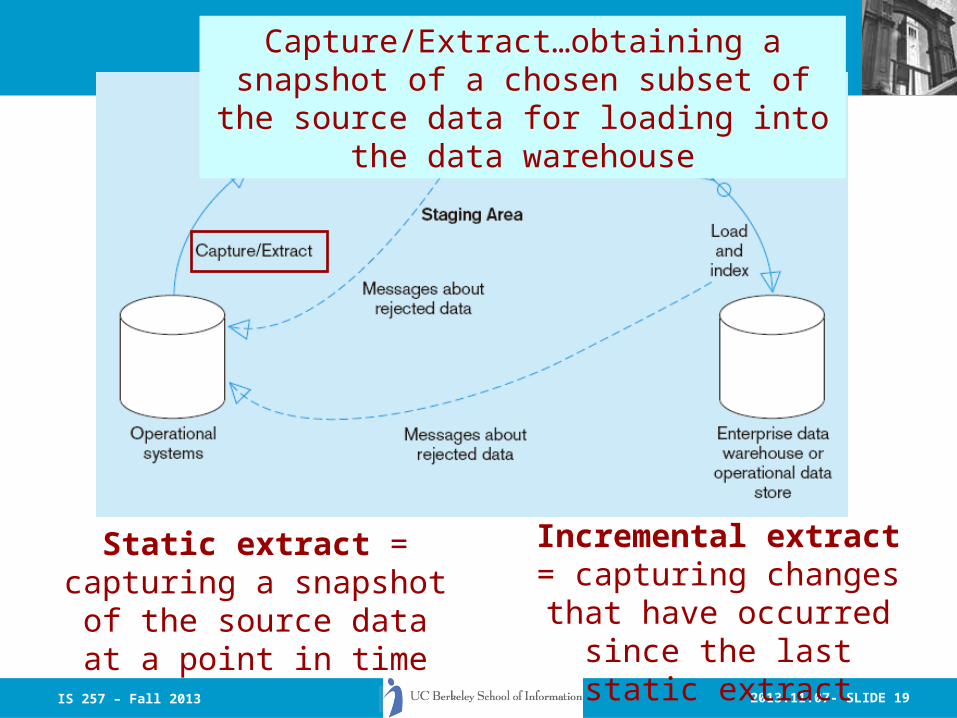
2013.11.07- SLIDE 19
Static extract = capturing a snapshot of
the source data at a point in time
Incremental extract = capturing changes that have occurred since the
last static extract
Capture/Extract…obtaining a snapshot of a chosen subset of the source data for loading into the data warehouse
IS 257 – Fall 2013

2013.11.07- SLIDE 20
Scrub/Cleanse…uses pattern recognition and AI techniques to
upgrade data quality
Fixing errors: misspellings, erroneous
dates, incorrect field usage, mismatched addresses,
missing data, duplicate data, inconsistencies
Also: decoding, reformatting, time stamping, conversion, key generation,
merging, error detection/logging, locating
missing data
Figure 11-10: Steps in data reconciliation
(cont.)
IS 257 – Fall 2013

2013.11.07- SLIDE 21
Transform = convert data from format of operational system to
format of data warehouse
Record-level:Selection–data partitioning
Joining–data combiningAggregation–data
summarization
Field-level: single-field–from one field to one
fieldmulti-field–from many fields to
one, or one field to many
Figure 11-10: Steps in data reconciliation
(cont.)
IS 257 – Fall 2013

2013.11.07- SLIDE 22
Load/Index= place transformed data into
the warehouse and create indexes
Refresh mode: bulk rewriting of target data at
periodic intervals
Update mode: only changes in source data are written to data warehouse
Figure 11-10: Steps in data reconciliation
(cont.)
IS 257 – Fall 2013

2013.11.07- SLIDE 23IS 257 – Fall 2013
Lecture Outline
• Review– Data Warehouses
• (Based on lecture notes from Joachim Hammer, University of Florida, and Joe Hellerstein and Mike Stonebraker of UCB)
• Views and View Maintenance• Applications for Data Warehouses
– Decision Support Systems (DSS)– OLAP (ROLAP, MOLAP)– Data Mining
• Thanks again to lecture notes from Joachim Hammer of the University of Florida

2013.11.07- SLIDE 24IS 257 – Fall 2012
Data Warehousing Architecture
2013.11.07- SLIDE 25IS 257 – Fall 2013
Today
• Applications for Data Warehouses– Decision Support Systems (DSS)– OLAP (ROLAP, MOLAP)– Data Mining
• Thanks again to slides and lecture notes from Joachim Hammer of the University of Florida, and also to Laura Squier of SPSS, Gregory Piatetsky-Shapiro of KDNuggets and to the CRISP web site
Source: Gregory Piatetsky-Shapiro

2013.11.07- SLIDE 26IS 257 – Fall 2013
Trends leading to Data Flood
• More data is generated:– Bank, telecom, other
business transactions ...– Scientific Data: astronomy,
biology, etc– Web, text, and e-
commerce
• More data is captured:– Storage technology faster
and cheaper– DBMS capable of handling
bigger DB
Source: Gregory Piatetsky-Shapiro

2013.11.07- SLIDE 27IS 257 – Fall 2013
Examples
• Europe's Very Long Baseline Interferometry (VLBI) has 16 telescopes, each of which produces 1 Gigabit/second of astronomical data over a 25-day observation session – storage and analysis a big problem
• Walmart reported to have 500 Terabyte DB • AT&T handles billions of calls per day
– data cannot be stored -- analysis is done on the fly
Source: Gregory Piatetsky-Shapiro

2013.11.07- SLIDE 28IS 257 – Fall 2013
Growth Trends
• Moore’s law– Computer Speed doubles
every 18 months• Storage law
– total storage doubles every 9 months
• Consequence– very little data will ever be
looked at by a human• Knowledge Discovery is
NEEDED to make sense and use of data.
Source: Gregory Piatetsky-Shapiro

2013.11.07- SLIDE 29IS 257 – Fall 2013
Knowledge Discovery in Data (KDD)
• Knowledge Discovery in Data is the non-trivial process of identifying – valid– novel– potentially useful– and ultimately understandable patterns in
data.• from Advances in Knowledge Discovery and Data
Mining, Fayyad, Piatetsky-Shapiro, Smyth, and Uthurusamy, (Chapter 1), AAAI/MIT Press 1996
Source: Gregory Piatetsky-Shapiro

2013.11.07- SLIDE 30IS 257 – Fall 2013
Related Fields
Statistics
MachineLearning
Databases
Visualization
Data Mining and Knowledge Discovery
Source: Gregory Piatetsky-Shapiro

2013.11.07- SLIDE 31IS 257 – Fall 2013
______
______
______
Transformed Data
Patternsand
Rules
Target Data
RawData
KnowledgeData MiningTransformation
Interpretation& Evaluation
Selection& Cleaning
Integration
Un
de
rsta
nd
ing
Knowledge Discovery Process
DATAWarehouse
Knowledge
Source: Gregory Piatetsky-Shapiro

2013.11.07- SLIDE 32IS 257 – Fall 2013
What is Decision Support?
• Technology that will help managers and planners make decisions regarding the organization and its operations based on data in the Data Warehouse.– What was the last two years of sales volume
for each product by state and city?– What effects will a 5% price discount have on
our future income for product X?• Increasing common term is KDD
– Knowledge Discovery in Databases

2013.11.07- SLIDE 33IS 257 – Fall 2013
Conventional Query Tools
• Ad-hoc queries and reports using conventional database tools– E.g. Access queries.
• Typical database designs include fixed sets of reports and queries to support them– The end-user is often not given the ability to
do ad-hoc queries

2013.11.07- SLIDE 3434
On-Line Analytical Processing (OLAP)• The use of a set of graphical tools that
provides users with multidimensional views of their data and allows them to analyze the data using simple windowing techniques
• Relational OLAP (ROLAP)– Traditional relational representation
• Multidimensional OLAP (MOLAP)– Cube structure
• OLAP Operations– Cube slicing – come up with 2-D view of data– Drill-down – going from summary to more
detailed views

2013.11.07- SLIDE 35IS 257 – Fall 2013
Data Cube

2013.11.07- SLIDE 36IS 257 – Fall 2013
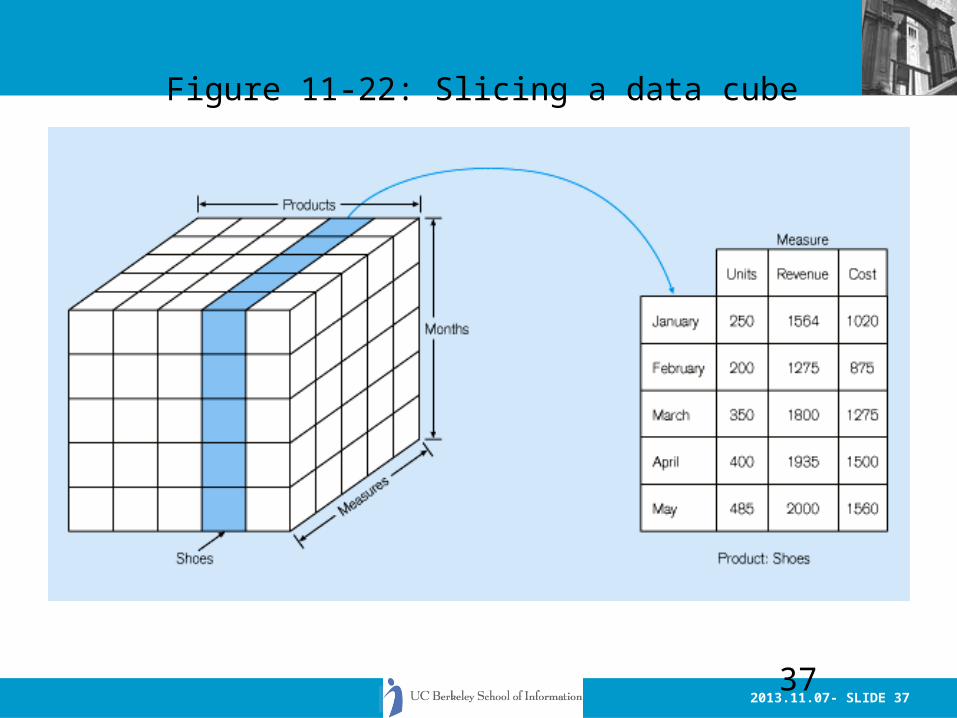
Operations on Data Cubes
• Slicing the cube– Extracts a 2d table from the multidimensional
data cube– Example…
• Drill-Down– Analyzing a given set of data at a finer level of
detail
2013.11.07- SLIDE 3737
Figure 11-22: Slicing a data cube

2013.11.07- SLIDE 3838
Figure 11-24 Example of drill-down
Summary report
Drill-down with color
added
Starting with summary data,
users can obtain details for particular
cells

2013.11.07- SLIDE 39IS 257 – Fall 2013
OLAP
• Online Line Analytical Processing– Intended to provide multidimensional views of
the data– I.e., the “Data Cube”– The PivotTables in MS Excel are examples of
OLAP tools

2013.11.07- SLIDE 40IS 257 – Fall 2013
Star Schema
• Typical design for the derived layer of a Data Warehouse or Mart for Decision Support– Particularly suited to ad-hoc queries– Dimensional data separate from fact or event
data• Fact tables contain factual or quantitative
data about the business• Dimension tables hold data about the
subjects of the business• Typically there is one Fact table with
multiple dimension tables

2013.11.07- SLIDE 41IS 257 – Fall 2013
Star Schema for multidimensional data
OrderOrderNoOrderDate…
SalespersonSalespersonIDSalespersonNameCityQuota
Fact TableOrderNoSalespersonidCustomernoProdNoDatekeyCitynameQuantityTotalPrice City
CityNameStateCountry…
DateDateKeyDayMonthYear…
ProductProdNoProdNameCategoryDescription…
CustomerCustomerNameCustomerAddressCity…

2013.11.07- SLIDE 42
Data Mining and Visualization• Knowledge discovery using a blend of statistical, AI,
and computer graphics techniques• Goals:
– Explain observed events or conditions– Confirm hypotheses– Explore data for new or unexpected relationships
• Techniques– Case-based reasoning– Rule discovery– Signal processing– Neural nets– Fractals
• Data visualization – representing data in graphical/multimedia formats for analysis

2013.11.07- SLIDE 43IS 257 – Fall 2013
Data Mining
• Data mining is knowledge discovery rather than question answering– May have no pre-formulated questions– Derived from
• Traditional Statistics• Artificial intelligence• Computer graphics (visualization)
• Another term used is “Analytics” which covers much of the same topics

2013.11.07- SLIDE 44IS 257 – Fall 2013
Goals of Data Mining
• Explanatory – Explain some observed event or situation
• Why have the sales of SUVs increased in California but not in Oregon?
• Confirmatory– To confirm a hypothesis
• Whether 2-income families are more likely to buy family medical coverage
• Exploratory– To analyze data for new or unexpected relationships
• What spending patterns seem to indicate credit card fraud?

2013.11.07- SLIDE 45IS 257 – Fall 2013
Data Mining Applications
• Profiling Populations• Analysis of business trends• Target marketing• Usage Analysis• Campaign effectiveness• Product affinity• Customer Retention and Churn• Profitability Analysis• Customer Value Analysis• Up-Selling

2013.11.07- SLIDE 46IS 257 – Fall 2013
Data + Text Mining Process
Source: Languisticsvia Google Images

2013.11.07- SLIDE 47IS 257 – Fall 2013
How Can We Do Data Mining?
• By Utilizing the CRISP-DM Methodology– a standard process – existing data– software technologies – situational expertise
Source: Laura Squier

2013.11.07- SLIDE 48IS 257 – Fall 2013
Why Should There be a Standard Process?
• Framework for recording experience– Allows projects to be
replicated
• Aid to project planning and management
• “Comfort factor” for new adopters– Demonstrates maturity of
Data Mining– Reduces dependency on
“stars”
The data mining process must be reliable and repeatable by people with little data mining background.
Source: Laura Squier

2013.11.07- SLIDE 49IS 257 – Fall 2013
Process Standardization
• CRISP-DM: • CRoss Industry Standard Process for Data Mining• Initiative launched Sept.1996• SPSS/ISL, NCR, Daimler-Benz, OHRA• Funding from European commission• Over 200 members of the CRISP-DM SIG worldwide
– DM Vendors - SPSS, NCR, IBM, SAS, SGI, Data Distilleries, Syllogic, Magnify, ..
– System Suppliers / consultants - Cap Gemini, ICL Retail, Deloitte & Touche, …
– End Users - BT, ABB, Lloyds Bank, AirTouch, Experian, ...
Source: Laura Squier

2013.11.07- SLIDE 50IS 257 – Fall 2013
CRISP-DM
• Non-proprietary• Application/Industry neutral• Tool neutral• Focus on business issues
– As well as technical analysis
• Framework for guidance• Experience base
– Templates for Analysis
Source: Laura Squier

2013.11.07- SLIDE 51IS 257 – Fall 2013
The CRISP-DM Process Model
Source: Laura Squier

2013.11.07- SLIDE 52IS 257 – Fall 2013
Why CRISP-DM?
• The data mining process must be reliable and repeatable by people with little data mining skills
• CRISP-DM provides a uniform framework for – guidelines – experience documentation
• CRISP-DM is flexible to account for differences – Different business/agency problems– Different data
Source: Laura Squier

2013.11.07- SLIDE 53IS 257 – Fall 2013
BusinessUnderstanding
DataUnderstanding
EvaluationDataPreparation
Modeling
Determine Business ObjectivesBackgroundBusiness ObjectivesBusiness Success Criteria
Situation AssessmentInventory of ResourcesRequirements, Assumptions, and ConstraintsRisks and ContingenciesTerminologyCosts and Benefits
Determine Data Mining GoalData Mining GoalsData Mining Success Criteria
Produce Project PlanProject PlanInitial Asessment of Tools and Techniques
Collect Initial DataInitial Data Collection Report
Describe DataData Description Report
Explore DataData Exploration Report
Verify Data Quality Data Quality Report
Data SetData Set Description
Select Data Rationale for Inclusion / Exclusion
Clean Data Data Cleaning Report
Construct DataDerived AttributesGenerated Records
Integrate DataMerged Data
Format DataReformatted Data
Select Modeling TechniqueModeling TechniqueModeling Assumptions
Generate Test DesignTest Design
Build ModelParameter SettingsModelsModel Description
Assess ModelModel AssessmentRevised Parameter Settings
Evaluate ResultsAssessment of Data Mining Results w.r.t. Business Success CriteriaApproved Models
Review ProcessReview of Process
Determine Next StepsList of Possible ActionsDecision
Plan DeploymentDeployment Plan
Plan Monitoring and MaintenanceMonitoring and Maintenance Plan
Produce Final ReportFinal ReportFinal Presentation
Review ProjectExperience Documentation
Deployment
Phases and Tasks
Source: Laura Squier

2013.11.07- SLIDE 54IS 257 – Fall 2013
Phases in CRISP• Business Understanding
– This initial phase focuses on understanding the project objectives and requirements from a business perspective, and then converting this knowledge into a data mining problem definition, and a preliminary plan designed to achieve the objectives.
• Data Understanding– The data understanding phase starts with an initial data collection and proceeds with activities in order to get familiar with the data,
to identify data quality problems, to discover first insights into the data, or to detect interesting subsets to form hypotheses for hidden information.
• Data Preparation– The data preparation phase covers all activities to construct the final dataset (data that will be fed into the modeling tool(s)) from
the initial raw data. Data preparation tasks are likely to be performed multiple times, and not in any prescribed order. Tasks include table, record, and attribute selection as well as transformation and cleaning of data for modeling tools.
• Modeling– In this phase, various modeling techniques are selected and applied, and their parameters are calibrated to optimal values.
Typically, there are several techniques for the same data mining problem type. Some techniques have specific requirements on the form of data. Therefore, stepping back to the data preparation phase is often needed.
• Evaluation– At this stage in the project you have built a model (or models) that appears to have high quality, from a data analysis perspective.
Before proceeding to final deployment of the model, it is important to more thoroughly evaluate the model, and review the steps executed to construct the model, to be certain it properly achieves the business objectives. A key objective is to determine if there is some important business issue that has not been sufficiently considered. At the end of this phase, a decision on the use of the data mining results should be reached.
• Deployment– Creation of the model is generally not the end of the project. Even if the purpose of the model is to increase knowledge of the data,
the knowledge gained will need to be organized and presented in a way that the customer can use it. Depending on the requirements, the deployment phase can be as simple as generating a report or as complex as implementing a repeatable data mining process. In many cases it will be the customer, not the data analyst, who will carry out the deployment steps. However, even if the analyst will not carry out the deployment effort it is important for the customer to understand up front what actions will need to be carried out in order to actually make use of the created models.