Embed Size (px)
Citation preview

2013
w w w.u tsyst em.edu
FAST FACTS
20
16
More facts at:DATA.UTSYSTEM.EDU
WWW.UTSYSTEM.EDU/FASTFACTS
WINTER EDITION, FEB 2017

Page 2
UT PERMIAN BASINUT EL PASO
UT AUSTIN
UT SAN ANTONIO
UT HSC-SAN ANTONIO
UT RIO GRANDE VALLEY
Academic
Health
UT HSC-TYLER
UT TYLER
UT DALLAS
UT ARLINGTON
UT SOUTHWESTERNMEDICAL CENTER
UT MD ANDERSONUT HSC-HOUSTON
UT MEDICAL BRANCH
Driving Success

Page 3
The University of Texas System Mission
The mission of the University of Texas System is to improve the human condition in Texas, our nation and the world.
The System will use its size, diversity, and quality to advance education, push the bounds of discovery, enhance population health, build stronger communities, and shape public policy for the common good. Producing high quality human capital with a sense of service and the ability to lead, we will pursue solutions to the problems of our state, our nation and our world.
We are a state university system with global impact
This Mission Statement recognizes that UT System’s responsibility goes well beyond higher education, research and health care. We have an obligation to improve all aspects of the lives of our citizens—not just their knowledge base and their health needs, but the impact they have on their families, their communities and our nation. We have an obligation to search and find answers to every question that confronts and confounds our society. We have an obligation first and foremost to the State of Texas—but in meeting that obligation, we will affect the people of the world. That is what great university systems do.
Bold initiatives—Quantum Leaps—will galvanize the UT System mission
The Texas Prospect Initiative • The American Leadership Program • Win the Talent War • Enhancing Fairness and Opportunity • The UT Health Care Enterprise • Leading the Brain Health Revolution • The UT Network for National Security • UT System Expansion in Houston
A culture of quality and dedication is defined in our Ethos, a set of values that describes our commitment to Texas: We build and sustain Texas’ finest institutions of higher education and health care. Our priority is to the students and the patients in our care. We are unyielding in our drive to advance student success, innovation and the well-being of the citizens of Texas. We communicate in all directions and with the utmost transparency, so that the members of the System and those outside the organization see and understand all that we are doing. We build trust through our actions—personal and professional; our credibility is our greatest asset. Our actions are moral, legal and ethical, and we hold ourselves accountable when we fail to achieve this standard. We will be known as the most innovative, responsive and dedicated public university system in the nation.
To read more about The UT System Mission and Quantum Leaps, visit utsystem.edu/quantum-leaps-site or request a printed copy by emailing [email protected].

Page 4
students, faculty & staff
Personnel Headcount1
Fall 2015
Faculty (All Ranks)2
Fall 2015
Student Enrollment Headcount
Fall 2015
% Change En-rollment from
Prior Year4
Academic
UTA 2,751 1,537 37,008 6.1%
UT Austin 11,645 3,385 50,950 - 0.7
UTD 3,583 1,220 24,554 6.3
UTEP 2,583 1,235 23,308 1.2
UTPB 341 276 5,937 6.8
UTRGV3 2,144 1,277 28,584 n/a
UTSA 3,486 1,383 28,787 0.6
UTT 1,011 491 8,500 5.8
Subtotal 27,544 10,804 207,628 2.0%
Health
UTSWMC 12,694 2,362 2,262 - 2.1%
UTMB 10,426 1,180 3,169 - 1.3
UTHSCH 5,076 1,941 4,811 5.6
UTHSCSA 3,774 1,601 3,130 - 0.5
UTMDA 18,593 2,322 320 5.6
UTHSCT5 1,120 112 17 -10.5
Subtotal 51,683 9,518 13,709 1.2%
System Admin 763 n/a n/a n/a
Total 79,990 20,322 221,337 1.9%
1 Includes a wide range of positions including researchers, student services providers, managers, nurses, laboratory technicians, clinical staff, computer analysts, social workers, engineers, accountants and support staff. Does not include faculty or 23,976 student employees.
2 Includes all ranks of faculty but excludes student employees such as teach-ing assistants. UT Rio Grande Valley admitted its first cohort of students in fall 2015.
3 Percent change in enrollment at the subtotal and total level are based on 2014 data, which includes the now-closed UT Brownsville and UT Pan Ameri-can campuses, and 2015 data, which includes the new UTRGV campus.
4 UTHSCT admitted their first cohort of six students in fall 2012.
Undergrad & Post-Bacc
Graduate & Professional Total
Enrollment 167,028 54,309 221,337
% Minority 66.3% 35.3% 58.7%
# Degrees 35,263 19,268 54,531
Enrollment Fall 2015 & Degrees AY 2014-15

Page 5
student ethnicity & race, fall 2015
HispanicAfrican-
American1 WhiteAsian-
AmericanInter-
nationalOther2 & Unknown
Academic
UTA 23.3% 14.7% 35.8% 10.4% 12.7% 3.0%
UT Austin 20.3 4.6 45.1 18.2 7.8 3.9
UTD 13.0 5.6 32.0 21.2 23.7 4.4
UTEP 79.9 3.1 8.0 1.1 6.8 1.1
UTPB 49.0 4.0 33.1 2.4 1.4 9.9
UTRGV 88.8 0.8 3.7 1.5 3.4 1.9
UTSA 50.1 9.6 26.8 5.5 5.1 2.9
UTT 15.4 11.5 57.9 3.6 3.9 7.8
Subtotal 40.8% 6.8% 29.7% 10.1% 9.1% 3.4%
Health
UTSWMC 7.7% 2.6% 35.1% 17.4% 27.9% 9.3%
UTMB 16.7 10.6 46.7 16.3 3.9 5.8
UTHSCH 16.3 9.2 38.7 15.8 11.8 8.3
UTHSCSA 28.6 5.3 42.8 12.3 4.4 6.6
UTMDA 29.1 9.7 25.0 25.3 8.4 2.5
UTHSCT 5.9 17.6 58.8 11.8 0.0 5.9
Subtotal 18.0% 7.5% 40.6% 15.6% 10.9% 7.4%
Total 39.4% 6.8% 30.4% 10.5% 9.2% 3.6%
1 African-American includes “Multi-racial (including African-Am).”
2 Other includes Native American and “Multi-racial (excluding African-Am).”
NOTE: Hispanic is reported as an ethnicity category, separate from the other race categories. Race is reported for non-Hispanics only. For those with more than one reported race, multi-racial is separated into “Multi-racial (incl. Afri-can-Am)” when African-American and another race is selected and “Multi-racial (excl. African-Am)” for any combination of the other races. International is a separate category and is excluded from race/ethnicity breakouts.
science, technology, engineering, & math degrees
UT System Academic #
UT System Academic %
All TX Public %
National Public %
Baccalaureate 7,721 24.0% 20.1% 20.8%
Master’s 2,816 22.4 18.6 18.9
Doctoral 779 50.8 46.3 46.7
Total 11,316 24.5% 20.5% 21.1%
Based on the National Science Foundation STEM classification. Includes chemistry; engineering; mathematics; physics/astronomy; the agricultural, computer, environmental, geo- and life/biological sciences; and technology/technician-relat-ed fields such as electronic and computer engineering and environmental control technology.
STEM Degrees as a Percent of Total Degrees Awarded by UT Academic Institutions, AY 2013-14

Page 6
faculty honors
Nobel laureates 7Shaw laureates 1Abel Prize 1Japan Prize 2Pulitzer Prize 2Members of the Institute of Medicine 46Members of the National Academy of Sciences 43Members of the National Academy of Engineering 56Members of the American Academy of Arts and Sciences 60Members of the American Law Institute 35Members of the American Academy of Nursing 57
New Invention Disclosures 874U.S. Patents Issued 220Licenses & Options Executed 252Start-up Companies Formed 30Total Gross Revenue Received from Intellectual Property (in millions) $62.7
technology transfer, fy 2015
Outpatient Visits Hospital Days
UTSWMC 2,246,682 539,443
UTMB 943,490 144,129
UTHSCH 1,647,382 264,136
UTHSCSA 941,989 304,051
UTMDA 1,440,684 202,483
UTHSCT 144,146 14,005
Total 7,364,373 1,468,247
patient care provided by faculty at ut health institutions, fy 2015
NOTE: Patient care provided at state-owned and affiliated facilities. It does not include correctional managed care off-site visits.
Page 7
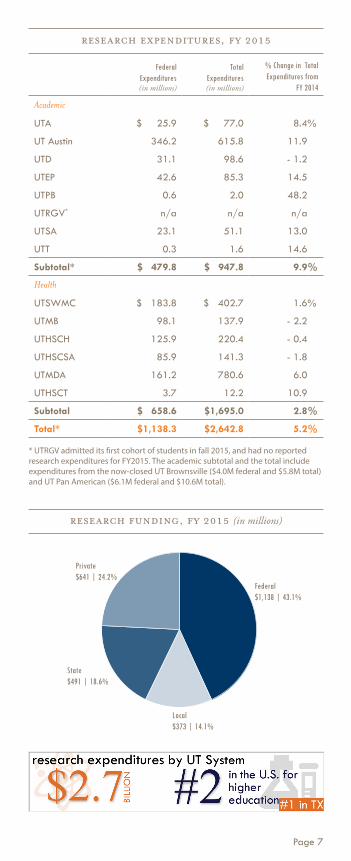
research expenditures, fy 2015
Federal Expenditures (in millions)
Total Expenditures (in millions)
% Change in Total Expenditures from
FY 2014
Academic
UTA $ 25.9 $ 77.0 8.4%
UT Austin 346.2 615.8 11.9
UTD 31.1 98.6 - 1.2
UTEP 42.6 85.3 14.5
UTPB 0.6 2.0 48.2
UTRGV* n/a n/a n/a
UTSA 23.1 51.1 13.0
UTT 0.3 1.6 14.6
Subtotal* $ 479.8 $ 947.8 9.9%
Health
UTSWMC $ 183.8 $ 402.7 1.6%
UTMB 98.1 137.9 - 2.2
UTHSCH 125.9 220.4 - 0.4
UTHSCSA 85.9 141.3 - 1.8
UTMDA 161.2 780.6 6.0
UTHSCT 3.7 12.2 10.9
Subtotal $ 658.6 $1,695.0 2.8%
Total* $1,138.3 $2,642.8 5.2%
research funding, fy 2015 (in millions)
Federal $1,138 | 43.1%
Local $373 | 14.1%
State $491 | 18.6%
Private $641 | 24.2%
* UTRGV admitted its first cohort of students in fall 2015, and had no reported research expenditures for FY2015. The academic subtotal and the total include expenditures from the now-closed UT Brownsville ($4.0M federal and $5.8M total) and UT Pan American ($6.1M federal and $10.6M total).
tren
ds
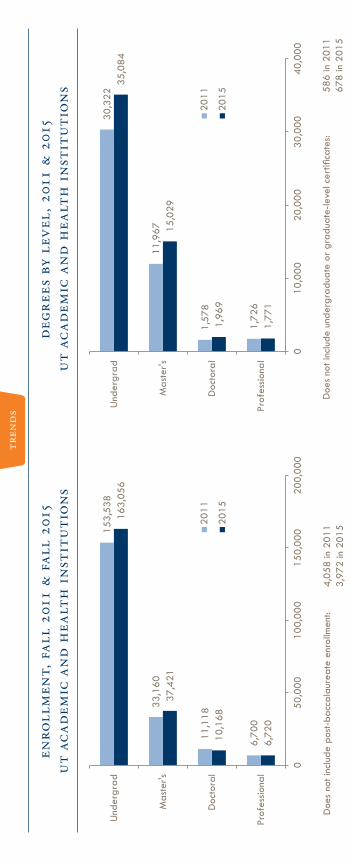
enro
llm
ent,
fal
l 20
11 &
fal
l 20
15ut
aca
dem
ic a
nd
hea
lth
ins
titu
tion
sde
gree
s by
lev
el, 2
011
& 2
015
ut a
cade
mic
an
d h
ealt
h i
nsti
tuti
ons
Doe
s no
t inc
lude
pos
t-ba
ccal
aure
ate
enro
llmen
t: 4,
058
in 2
011
3,
972
in 2
015
Doe
s no
t inc
lude
und
ergr
adua
te o
r gr
adua
te-le
vel c
ertifi
cate
s: 58
6 in
201
1
678
in 2
015
6,72
0
10,1
68
37,4
21
163,
056
6,70
0
11,1
18 33
,160
153,
538
050
,000
100,
000
150,
000
200,
000
Prof
essio
nal
Doc
tora
l
Mas
ter's
Und
ergr
ad
2011
2015
1,77
1
1,96
9
15,0
29
35,0
84
1,72
6
1,57
8
11,9
67
30,3
22
010
,000
20,0
0030
,000
40,0
00
Prof
essio
nal
Doc
tora
l
Mas
ter's
Und
ergr
ad
2011
2015

Doe
s no
t inc
lude
pos
t-ba
ccal
aure
ate
enro
llmen
t: 4,
058
in 2
011
3,
972
in 2
015
Doe
s no
t inc
lude
und
ergr
adua
te o
r gr
adua
te-le
vel c
ertifi
cate
s: 58
6 in
201
1
678
in 2
015
tren
ds
tota
l re
sear
ch e
xpen
ditu
res,
fy
2011
to
fy 2
015
ut a
cade
mic
an
d h
ealt
h i
nsti
tuti
ons
tech
nolo
gy t
rans
fer
acti
viti
es, f
y 20
11 t
o fy
201
5ut
aca
dem
ic a
nd
hea
lth
ins
titu
tion
s
$2,5
40$2
,643
$1,6
42$1
,695
$898
$948
$0
$500
$1,0
00
$1,5
00
$2,0
00
$2,5
00
$3,0
00
2011
2012
2013
2014
2015
Millions
Syst
emH
ealth
Aca
dem
ic
157
252
$73
$63
$0$20
$40
$60
$80
070140
210
280
2011
2012
2013
2014
2015
Millions
Lice
nses
& O
ptio
ns E
xecu
ted
Gro
ss R
even
ue ($
) fro
m In
telle
ctua
l Pro
pert
y

Page 10
Total Budget Expenditures
From General Revenue
General Revenue as % of Total
Academic
UTA $ 624.9 $ 138.7 22.2%
UT Austin 2,835.2 350.3 12.4
UTD 619.7 119.0 19.2
UTEP 445.4 114.6 25.7
UTPB 81.7 38.3 46.9
UTRGV 508.2 158.1 31.1
UTSA 533.3 130.0 24.4
UTT 146.9 44.9 30.6
Subtotal $ 5,795.3 $1,093.9 18.9%
Health
UTSWMC $ 2,706.2 $ 193.5 7.2%
UTMB 2,084.4 373.7 17.9
UTHSCH 1,498.7 215.0 14.3
UTHSCSA 804.3 175.6 21.8
UTMDA 4,483.4 207.8 4.6
UTHSCT 203.1 56.3 27.7
Subtotal $11,780.1 $1,221.9 10.4%
System Admin 287.0 -- 0.0
Total $17,862.4 $2,315.8 13.0%
Budget
institutional budgets, fy 2017 (in millions)
revenue trends per fte student (Academic)
FTE: full-time equivalent
Notes: Adjusted for inflation using the Consumer Price Index (CPI-U) and FY 15 as the base year. Tuition & Fee Revenue does not include scholarship and fel-lowship discounts and waivers. Prior to FY 2015, UTPA (but not UTB) included. UTRGV included in FY 2015.
$6,622
$5,354
$6,088
$7,555
$0
$2,000
$4,000
$6,000
$8,000
2006 2007 2008 2009 2010 2011 2012 2013 2014 2015
State Appropriations
Tuition and Fees

Page 11
how the budget is spent,fy 2017 (in millions)
Total: $17.9 billion6
Instruction $4,003 | 22%
Academic Support4 $935 | 5%
Research $2,267 | 13%
Public Service5 $303 | 2%
Hospitals & Clinics $5,584 | 31%
Student Services2 $271 |2%
Operations & Maintenance of Plant
$738 | 4%
Scholarships & Fellowships$393 | 2%
Auxiliary Enterprises1
$647 | 4%
Depreciation & Amortization$1,409 | 8%
Interest$394 | 2%
Institutional Support3 $917 | 5%
1 Essentially self-supporting institution enterprises such as bookstores, dormi-tories or intercollegiate athletic programs.
2 Admissions and registrar offices, as well as activities with the primary pur-pose of contributing to the emotional and physical well-being of students outside the context of formal instruction.
3 Centralized executive-level activities concerned with institutional manage-ment and long-range planning.
4 Support services for the primary missions of instruction, research and public service. Includes salaries, wages, academic administration and all other costs related to the retention, preservation and display of educational materials.
5 Non-instructional services beneficial to individuals and groups external to the institutions.
6 Capital purchases and debt principal repayments are uses of funds that are not part of the budgeted spending presented. When considered in combination with depreciation, a budget expense that does not actually use funds, these two items make up the difference in the totals for funding and spending above.
how the budget is funded,fy 2017 (in millions)
Total: $18.3 billion
State Appropriations $2,316 | 13%
Hospitals & Clinics $7,765 | 42%
Sponsored Programs (all) $3,398 | 19%
Auxiliary Enterprises$613 | 3%
Tuition and Fees$1,697| 9%
Investment Income$1,282 | 7%
Educational Activities$425 | 2%
Gifts and Other$790 | 4%

Page 12
Costs & Financial Aid
Avg In-State Total Academic
Cost1
% Receiving Need-Based
Grant AidAvg %
Discount
Avg Net Academic
Cost2
Avg % Discount
UTA $ 9,562 66.6% 71.5% $5,009 47.6%
UT Austin 9,810 34.8 92.2 6,659 32.1
UTD 11,806 48.1 73.9 7,610 35.5
UTEP 7,226 67.2 100.0 2,371 67.2
UTPB 6,770 45.0 94.1 3,903 42.3
UTSA 9,048 57.2 69.7 5,436 39.9
UTT 7,222 59.3 87.4 3,477 51.9
Average $ 8,806 52.8% 84.1% $4,994 43.3%
Average annual net academic cost and average percent discount for full-time undergraduate students, AY 2014-15
Over 60% of UT System full-time undergraduates receive grant, scholarship or tuition waiver aid, and well over half of UT System undergraduates take out student loans.
On average, UT System baccalaureates have borrowed less than both the national and state averages.
With average loan payments of less than $200 per month, the debt-to-income ratio of UT baccalaureates is 5.3% one year after graduation, well below the 9% threshold for moderately risky and even slightly below the 6% threshold that is considered cautious borrowing.
1 Total academic cost represents the sum of all statutory tuition, designated tuition and board-authorized tuition (where applicable), along with mandatory fees, which now include college and course fees. Academic cost information is derived from actual fee bills for resident undergraduate students enrolled for 15 semester credit hours in the fall and spring semesters. Therefore, these figures represent costs for a total of 30 semester credit hours.
2 The average net cost for all full-time students is derived by subtracting the total need-based grant aid from the total academic costs of all students and dividing by the total number of students.
% of tuition & fees covered by grant and scholarship aid, 2014
(full-time resident undergraduates at UT academic institutions)
0%
20%
40%
60%
80%
100%
120%
140%
$0 - $40,000 $40,001 -$60,000
$60,001 -$80,000
$80,001+ All
100% of Tuition & Fees Covered
Additional $ forliving expenses
Family Income

Page 13
The 1876 Texas Constitution dedicated about 1 million acres of land to create the PUF. Through the dedication of additional land and the investment of revenue from mineral production on PUF land, the PUF now includes 2.1 million acres, primarily in West Texas, as well as $17.5 billion in investments. The PUF benefits The University of Texas System and The Texas A&M University System.
The Constitution prescribes the management, investment and use of the PUF, including distributions to and use of the AUF.
The Constitution vests management authority of the PUF in the UT System Board of Regents, which contracts with The University of Texas Investment Management Company (UTIMCO) for investment services.
The Constitution allows distributions to the AUF from the total return on investment assets of the PUF. The target annual distribution rate is 4.75%, but may increase to 5% depending on investment performance. The Constitution requires the UT System Board of Regents to provide a stable stream of distributions while maintaining the purchasing power of PUF investments and AUF distributions. The distributions, plus surface income earned on PUF lands, are available for appropriation.
PUF lands produce two streams of income: one from mineral interests such as oil and gas and the other from surface interests such as grazing.
Income from the sale of PUF land and income from mineral interests such as bonuses, rentals and royalties must be added to the PUF and invested. Distributions from the PUF and income from surface interests are deposited in the AUF.
The UT System and the Texas A&M System may issue bonds for construction projects and other capital purposes in an amount not to exceed 20% and 10%, respectively, of the book value of the PUF.
The proceeds of PUF bonds may not be used for operational expenses or to support auxiliaries.
The Legislature appropriates the AUF, which the Constitution divides between the UT System (two-thirds) and the Texas A&M System (one-third). After debt service on PUF bonds, the remainder of the UT System’s two-thirds share of the AUF is appropriated for support and maintenance of UT Austin and UT System Administration.
The Constitution does not permit use of the AUF for support and maintenance of other UT System institutions.
Market Value of PUF Investments, 08-31-16 $17.9 billion
Distribution to AUF (FY 16) $839.4 million (5%)
The Permanent and AvailableUniversity Funds (PUF and AUF)
Page 14
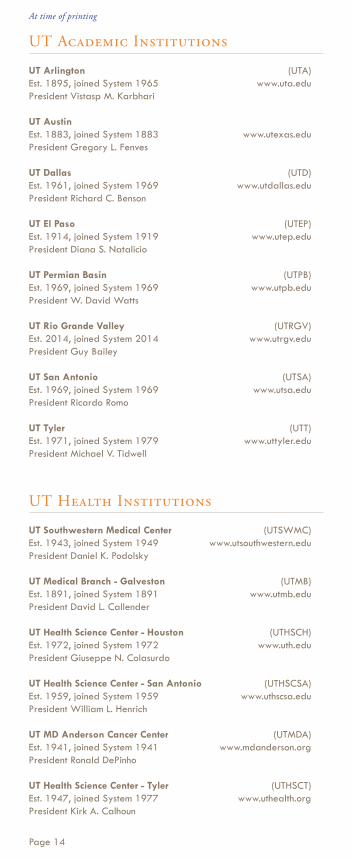
At time of printing
UT ArlingtonEst. 1895, joined System 1965President Vistasp M. Karbhari
UT AustinEst. 1883, joined System 1883President Gregory L. Fenves
UT DallasEst. 1961, joined System 1969President Richard C. Benson
UT El PasoEst. 1914, joined System 1919President Diana S. Natalicio
UT Permian BasinEst. 1969, joined System 1969President W. David Watts
UT Rio Grande ValleyEst. 2014, joined System 2014President Guy Bailey
UT San AntonioEst. 1969, joined System 1969President Ricardo Romo
UT TylerEst. 1971, joined System 1979President Michael V. Tidwell
(UTA)www.uta.edu
www.utexas.edu
(UTD)www.utdallas.edu
(UTEP)www.utep.edu
(UTPB)www.utpb.edu
(UTRGV)www.utrgv.edu
(UTSA)www.utsa.edu
(UTT)www.uttyler.edu
UT Academic Institutions
UT Southwestern Medical CenterEst. 1943, joined System 1949President Daniel K. Podolsky
UT Medical Branch - GalvestonEst. 1891, joined System 1891President David L. Callender
UT Health Science Center - HoustonEst. 1972, joined System 1972President Giuseppe N. Colasurdo
UT Health Science Center - San AntonioEst. 1959, joined System 1959President William L. Henrich
UT MD Anderson Cancer CenterEst. 1941, joined System 1941President Ronald DePinho
UT Health Science Center - TylerEst. 1947, joined System 1977President Kirk A. Calhoun
UT Health Institutions
(UTSWMC)www.utsouthwestern.edu
(UTMB)www.utmb.edu
(UTHSCH)www.uth.edu
(UTHSCSA)www.uthscsa.edu
(UTMDA)www.mdanderson.org
(UTHSCT)www.uthealth.org

Page 15
At time of printing
Paul L. FosterChairmanEl Paso
R. Steven “Steve” HicksVice ChairmanAustin
Jeffery D. HildebrandVice ChairmanHouston
Ernest AlisedaRegentMcAllen
David J. BeckRegentHouston
Sara Martinez Tucker Regent Dallas
Kevin Paul Eltife Regent Tyler
Janiece M. Longoria Regent Houston
James Conrad “Rad” Weaver Regent San Antonio
Varun P. Joseph Student Regent McKinney
Francie A. Frederick General Counsel to the UT System Board of Regents
Board of Regents
William H. McRavenChancellor, The University of Texas System
David E. DanielDeputy Chancellor and Chief Operating Officer
Raymond S. GreenbergExecutive Vice Chancellor for Health Affairs
Scott C. KelleyExecutive Vice Chancellor for Business Affairs
Steven LeslieExecutive Vice Chancellor for Academic Affairs
Stephanie Bond HuieVice Chancellor for Strategic Initiatives
Barry McBeeVice Chancellor and Chief Governmental Relations Officer
Randa S. SafadyVice Chancellor for External Relations
Daniel H. SharphornVice Chancellor and General Counsel
William H. ShuteVice Chancellor for Federal Relations
Amy Shaw ThomasVice Chancellor for Academic and Health Affairs
Executive Officers

w w w.u tsyst em.eduWWW.UTSYSTEM.EDU