Embed Size (px)
Citation preview

2013 Surveyof Owners of IndividualAnnuity Contracts
Conducted byThe Gallup Organization
andMathew Greenwald & Associates
forThe Committee of Annuity Insurers

32013 SURVEY OF OWNERS OF INDIVIDUAL ANNUITY CONTRACTS
2013 Surveyof Owners of Individual
Annuity Contracts
Conducted byThe Gallup Organization
andMathew Greenwald & Associates
forThe Committee of Annuity Insurers
The Gallup Organization World Headquarters The Gallup Building
901 F Street, NW Washington, DC 20004
Mathew Greenwald & Associates, Inc. 4201 Connecticut Avenue, NW
Suite 620 Washington, DC 20008
The Committee of Annuity Insurers The Willard Office Building
1455 Pennsylvania Avenue, NW Suite 1200
Washington, DC 20004 www.annuity-insurers.org
This report may be cited as“The Committee of Annuity Insurers, Survey of Owners of Individual Annuity Contracts
(The Gallup Organization and Mathew Greenwald & Associates, 2013).”
Questions regarding this report may be directed to the Committee of Annuity Insurersthrough its website, www.annuity-insurers.org.
2013 SURVEY OF OWNERS OF INDIVIDUAL ANNUITY CONTRACTS4
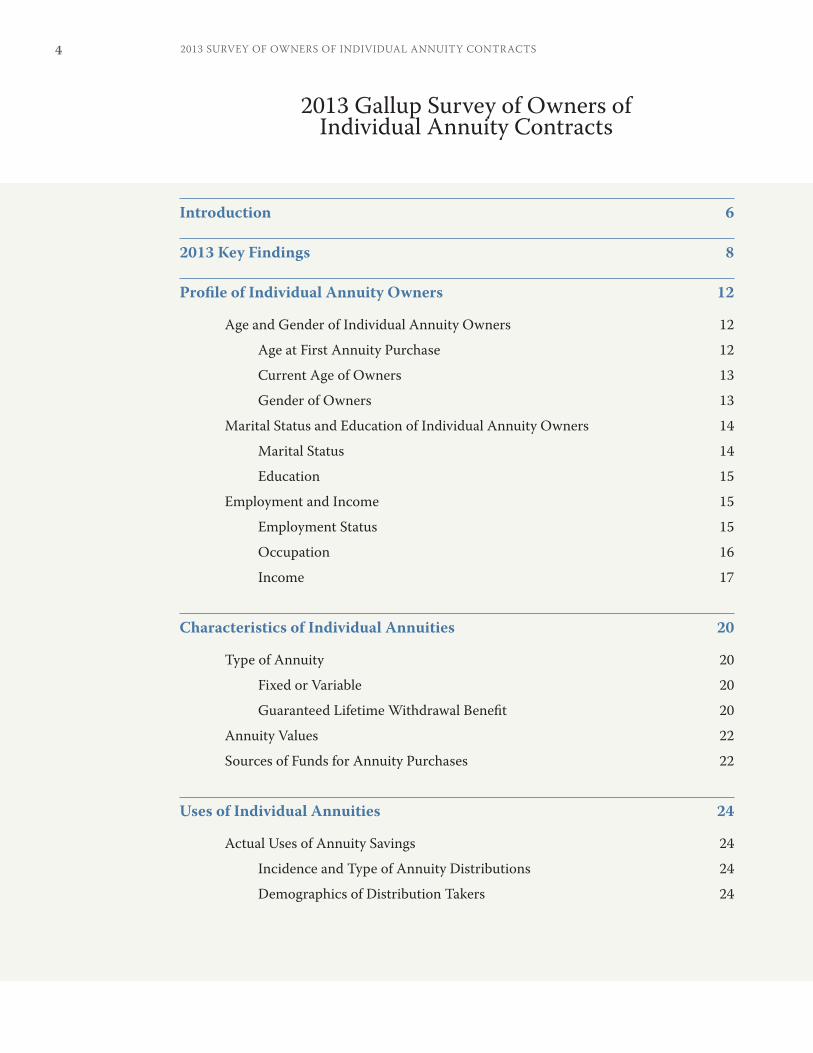
Introduction 6
2013 Key Findings 8
Profile of Individual Annuity Owners 12
Age and Gender of Individual Annuity Owners 12
Age at First Annuity Purchase 12
Current Age of Owners 13
Gender of Owners 13
Marital Status and Education of Individual Annuity Owners 14
Marital Status 14
Education 15
Employment and Income 15
Employment Status 15
Occupation 16
Income 17
Characteristics of Individual Annuities 20
Type of Annuity 20
Fixed or Variable 20
Guaranteed Lifetime Withdrawal Benefit 20
Annuity Values 22
Sources of Funds for Annuity Purchases 22
Uses of Individual Annuities 24
Actual Uses of Annuity Savings 24
Incidence and Type of Annuity Distributions 24
Demographics of Distribution Takers 24
2013 Gallup Survey of Owners of Individual Annuity Contracts

52013 SURVEY OF OWNERS OF INDIVIDUAL ANNUITY CONTRACTS
Intended Future Uses of Annuity Savings 25
Primary Intended Uses 25
Intended Uses Cited in Response to Open-Ended Question 26
Expected Form of Future Distributions 27
Expected Timing of Future Distributions 28
Attitudes Toward Individual Annuities 29
The Relationship Between Taxation and Savings Through Annuities 29
Tax Treatment of Earnings as Incentive to Save through Annuities 29
Taxation of Distributions as Incentive for Maintaining Retirement Savings 29
Non-Tax Reasons for Saving through Annuities 29
Reasons for Purchasing Annuities 29
Viewing Annuities as a Flexible Financial Tool 31
Savings of Individual Annuity Owners 33
Perception of Retirement Preparedness as a Society 33
Annuity Owners’ Savings in Other Financial Products 33
Confidence and Concerns with Financial Preparedness for Retirement 34
General Confidence in Retirement Preparedness 34
Concerns over Health and Long-Term Care Costs 36
Other Concerns 36
Sources of Income in Retirement 37

2013 SURVEY OF OWNERS OF INDIVIDUAL ANNUITY CONTRACTS6
Introduction
The Gallup Organization (“Gallup”) surveyed 1,008 owners of individual annuity contracts during January and February 2013 on behalf of the Committee of Annuity Insurers (“Committee”). The Committee is an association whose members are a diverse group of life insurance companies that issue annuity contracts. The Committee’s member companies represent approximately 80 percent of the annuity business in the United States. The results of the Survey of Owners of Individual Annuity Contracts (the “2013 Survey”) are presented in this report. Mathew Greenwald & Associates, Inc. (“Greenwald & Associates”) consulted with the Committee on the 2013 Survey, including the analysis of results presented in this report.
Gallup, Greenwald & Associates, and the Committee have conducted the Survey in ten previous years:
• February 1992,• October 1993,• December 1994,• December 1995,• February 1997,• April 1998,• July 1999,• November 2000,• January 2005, and• April 2009.
All of the prior Surveys are available on the Committee of Annuity Insurers’ website (www.annuity-insurers.org).
The principal purpose of the Survey is to obtain a profile of the demographic characteris-tics of owners of individual annuity contracts and to gain insight into their attitudes toward a variety of issues relating to retirement savings and security, including how they save for retirement, what they think about saving for retirement generally, what sources of funds they used to purchase their annuity contracts, the reasons they bought them, and how they plan to use them. Individual annuities are sometimes referred to as non-qualified annuities because they are purchased with after-tax income apart from any qualified retirement plan or IRA.

72013 SURVEY OF OWNERS OF INDIVIDUAL ANNUITY CONTRACTS
To ensure that only owners of individual annuity contracts were interviewed in the 2013 Survey, twelve life insurance companies that are members (or affiliates of members) of the Committee provided the names of individuals who currently own such contracts. The companies used specific sampling procedures developed by Gallup and Greenwald & Associates to ensure that a representative sample of owners of individual annuity contracts was identified. The twelve companies are geographically diverse, represent a mix of large and small companies, and account for more than four million individual annuity contracts currently in-force. They also utilize a mix of the main distribution channels for marketing and selling individual annuity products.
Gallup selected the individuals who were interviewed at random from the samples pro-vided by the twelve companies. Gallup and Greenwald & Associates are confident that, based on the sampling procedures used and other research that Gallup has conducted in this area, the results of the 2013 Survey represent the characteristics of owners of individ-ual annuity contracts, with a sampling error of plus or minus 3 percentage points at the 95 percent confidence level.

2013 SURVEY OF OWNERS OF INDIVIDUAL ANNUITY CONTRACTS8
2013 Key Findings
There is a great deal of stability in the demographics and attitudes of individual annuity owners. Many demographic characteristics, such as age and income, sources of funds for purchasing annuities, reasons for purchasing annuities, and opinions on saving for retire-ment are similar to those of previous Surveys. Some of the few changes, when compared to the 2009 Survey, include an increase in the proportion of owners who hold variable (as opposed to fixed) annuities and an increase in the number of annuity owners who intend to use periodic payments they receive from their annuity for income during retirement. Additionally, there is an increase in the proportion of owners who agree that annuities are secure and safe and agree that annuities add to the financial security of retirees by allowing them to invest in the stock market and still get a guaranteed income for life.
Demographic Profile
• Age at First Purchase. The majority of individual annuity owners purchased their first annuity before age 65 (86%), including 47% who were between the ages of 50 and 64 years old. The median age of owners when they first purchased an annuity is 52, while the average age at first purchase is 51. These findings are consistent with prior Surveys.
• Current Age. Also consistent with the 2009 Survey, both the median and average current age of individual annuity owners is 70.
• Gender. In 2013 a slight majority of individual annuity owners are female (51%), a decrease from 2009 when 58% were female. Over the past 15 years, women have outnumbered men in every Survey except 2001.
• Occupation. Individual annuity owners continue to represent a cross-section of occupations. Owners reported their current or former occupation as falling in the following categories: support staff (12%), blue collar or service workers (14%), foremen or managers (15%), business owner or company officer (15%), and professional, such as a doctor, lawyer, or teacher (34%).
• Employment Status. The majority (65%) of individual annuity owners are retired, a 4 percentage point decrease from 2009. Conversely, the number of employed annuity owners increased five percentage points to 28% in 2013.
• Household Income. The median annual household income of individual annuity owners is $64,000. Eighty percent have total annual household incomes under

92013 SURVEY OF OWNERS OF INDIVIDUAL ANNUITY CONTRACTS
$100,000. Six in ten (60%) are below $75,000, and over one-third (35%) are below $50,000. As would be expected, there has been an upward trend in incomes over the 20 years the Survey has been conducted, which continued in 2013 with some slight increases. Still, as in all prior Surveys, a majority of owners continue to have total annual household incomes between $20,000 and $74,999.
Attitudes Toward Individual Annuities
• Reasons for Purchase. Similar to 2009, the most common reason for purchasing an individual annuity is that it is perceived as a “safe purchase” (90% indicating this was very or somewhat important in their decision).
• Taxation Important. The fact that interest or earnings on individual annuities are not taxed until distributed continues to be a strong motivation for saving for retirement through an individual annuity. Almost nine in 10 (86%) cite the tax treatment of individual annuities as important to their savings decision, which is consistent with the 2009 Survey.
• Guarantees. Nearly nine in ten (87%) agree that insurance and investment guarantees are an important aspect of individual annuities, which is consistent with the 2009 Survey.
• Increase in Positive Sentiment. Positive opinions about individual annuities increased significantly in a variety of areas from 2009 to 2013. Among the biggest increases are being able to invest in the stock market through annuities and still get guaranteed income (82% agree, up from 71% in 2009), protection from losing the money they invest (85% vs. 76% in 2009), and annuities are secure and safe (87% vs. 79% in 2009).
Uses of Individual Annuity Savings
• Retirement. As expected, one of the biggest intended uses owners have for their individual annuity is for retirement income (84%). Almost half (45%) of individual annuity owners who are retired have withdrawn money on an ad hoc basis from their annuities, while one-third of such owners (33%) have begun receiving regular periodic payments from their annuities. Similarly, one-third of retired owners of variable annuities with guaranteed lifetime withdrawal benefits have begun taking their guaranteed lifetime withdrawals in retirement.

2013 SURVEY OF OWNERS OF INDIVIDUAL ANNUITY CONTRACTS10
• Other Uses. A large majority of individual annuity owners expect to use their contracts as a financial cushion in case they live well beyond their life expectancy (87%). Along with financial cushion and retirement income, owners also cite using their annuities as a financial resource to avoid being a burden on their children financially (79%), as a financial protection for investments (73%), and as an emergency fund in case of catastrophic illness or nursing home care (73%).
Taxation
• Convergence of Tax Policy and Usage. As in prior years, the 2013 Survey shows that the tax treatment of individual annuities is achieving the desired tax policy goal — the tax deferral benefits incentivize people to save for retirement and allow them to save more, while the tax treatment of distributions discourages them from using those savings prior to retirement:
o Tax Deferral as Incentive to Save. As indicated above, a large majority (86%) of owners cite the tax treatment of individual annuities as an important reason why they chose to save through an individual annuity. More generally, the proportion of owners who agree that individual annuities are an effective retirement savings tool remains very high and increased slightly, from 86% in 2009 to 90% in 2013. Likewise, the proportion of owners who agree that keeping the tax advantages of annuities is a good way of encouraging long-term savings remains very high and is consistent with the 2009 Survey, increasing slightly from 88% in 2009 to 90% in 2013.
o Tax Deferral as Facilitating More Savings. Seventy percent of individual annuity owners report that they have set aside more money for retirement than they would have if the tax advantages of individual annuities were not available.
o Treatment of Distributions as Incentive to Save. Nearly nine in ten individual annuity owners (88%) state that they try not to withdraw money from their contracts before retirement in order to avoid paying any extra taxes. This is a slight (3 percentage point) decrease from 2009 (91%).

112013 SURVEY OF OWNERS OF INDIVIDUAL ANNUITY CONTRACTS
Financial Preparedness for Retirement
• General Optimism on Retirement Preparedness. The majority of individual annuity owners (88%) believe they have done a very good job of saving for retirement. This is slightly lower than in 2009 (91%).
• Concern about Having to Cut Standard of Living. A majority of individual annuity owners say they are either not too concerned or not at all concerned (52%) about possibly having to cut back their standard of living as they get older. At the same time, 48% are concerned about this, with 14% saying they are very concerned. Still, the level of concern expressed in 2013 is 7 percentage points below 2009’s finding (55%).
Sources of Retirement Income
• Expectations Differ by Employment Status. As in 2009, non-retired individual annuity owners have different expectations of how they will draw income in retirement than owners who are already retired. The majority of non-retired annuity owners expect personal savings, including individual annuities, to be a major source of income in retirement (56%), while only 37% of retired annuity owners cite this as a major current source. A majority of retired annuity owners cite Social Security as a major source of income (53%), while just over one in three non-retired annuity owners expects Social Security to be a major source (35%).
Characteristics of Individual Annuities
• Product Type. Similar to 2009, variable annuities are more widely held than fixed annuities (75% vs. 25%).
• Guaranteed Lifetime Withdrawal Benefit. Almost nine in ten owners of individual annuities (87%) consider the guaranteed lifetime withdrawal benefit a valuable product feature. Additionally, 77% of owners who have an individual annuity with the GLWB agree that this benefit was important in their decision to purchase an annuity.

2013 SURVEY OF OWNERS OF INDIVIDUAL ANNUITY CONTRACTS12
Profile of Individual Annuity Owners
The following examines the 2013 Survey results as they relate to the demographic charac-teristics of individual annuity owners.
Age and Gender of Individual Annuity Owners
Age at First Annuity Purchase
The average age at which individual annuity owners purchased their first annuity is 51, and the median age at first purchase is 52. Nearly four in ten (39%) made their first purchase when they were younger than 50. The largest share (47%) purchased their first annuity between the ages of 50 and 64. Over one in ten (14%) purchased their first annuity at the age of 65 or older. (See Figure 1)
Figure 1: Age at Which First Annuity was Purchased
Under 50 years old39%
50 to 64 years old47%
65 years and older14%
Compared to the 2009 Survey, the average age and the median age at which an annuity was first purchased both decreased by one year (the average age decreased from 52 in 2009 to 51 in 2013, while the median age decreased from 53 to 52). At the same time, the percentage of respondents who purchased their first annuity at the age of 65 or older decreased by 8 percentage points (from 22% to 14%), indicating a shift towards owners purchasing their individual annuities at younger ages. Over nine in ten annuity owners (93%) still own the first annuity they purchased.

132013 SURVEY OF OWNERS OF INDIVIDUAL ANNUITY CONTRACTS
Current Age of Owners
Consistent with 2009, the average current age of individual annuity owners is 70 (as opposed to the average age when they first purchased an annuity). The median current age also is 70. Nearly half of owners are 72 or older (46%), just over one-quarter are 64 to 71 (26%) and slightly more than one in five are between the ages of 54 and 63 (22%). (See Figure 2) The proportion of individual annuity owners under the age of 54 decreased to 6% (down from 8% in 2009), making this the lowest proportion of this age group in the Survey’s history.
Figure 2: Current Age
64 to 7126%
72 and older46%
Under 546%
54 to 6322%
Gender of Owners
A majority of individual annuity owners are female (51% vs. 49% who are male). Over the past fifteen years, female annuity owners have outnumbered their male counterparts, with the lone exception being 2001 (48% female, 52% male). However, the ownership disparity between the two groups has decreased substantially when compared to the female-to-male proportions in both 2005 and 2009 (12% gap in 2005, 16% in 2009, 2% in 2013). (See Figure 3)

2013 SURVEY OF OWNERS OF INDIVIDUAL ANNUITY CONTRACTS14
Figure 3: Gender
58%
70%
50%
60%
40%
30%
20%
10%
0%
42%44%
55%
47%53%
48%52%52%
48%44%
56%
42%
58%
49% 51%
Male Female
1982 1997 1998 1999 2001 2005 2009 2013
Marital Status and Education of Individual Annuity Owners
Marital Status
As in previous Survey years, the majority of individual annuity owners are married (58%). Nearly a quarter of individual annuity owners are widowed (24%), one in ten has never been married, and 7% are divorced. (See Figure 4)
Figure 4: Marital Status
5%
10%
18%
66%
5%
12%
22%
60%
7%
7%
25%
60%
7%
10%
24%
58%
0% 1% 20% 30% 40% 50% 60% 70%
Divorced
Single, neverbeen married
Widowed
Married
2013
2009
2005
1992

152013 SURVEY OF OWNERS OF INDIVIDUAL ANNUITY CONTRACTS
Education
The majority of individual annuity owners (53%) have a college degree, which is a 10 percentage point increase since 2009. Over a quarter of individual annuity owners (26%) have completed at least some post-graduate work. One in five annuity owners has received either some college education but no degree (19%) or a high school diploma but no further education (21%). Four percent have received trade, technical, or vocational training, and 2% have never graduated high school. (See Figure 5)
Figure 5: Level of Education
Some College19%
College Graduate27%
Post-grad work/degree26%
Not a HS graduate2%
HS graduate21%
Trade/tech/voc training4%
Employment and Income
Employment Status
Employment Status of Owners. The majority of owners (65%) are retired, which is a 4 percentage point decrease from 2009 (69%). One in five owners is employed full-time, while another 8% are employed part-time. This represents an increase of 5 percentage points in the proportion of owners who are employed either full-time or part-time (23% in 2009 and 28% in 2013). (See Figure 6) Three percent of owners are homemakers, while 4% are in other categories (e.g., disabled, student).
Employment Status of Spouses. As with owners, the majority of owners’ spouses are retired (54%). Almost one-third of spouses (31%) are employed, including 22% who work full-time and 9% who work part-time. Additionally, one in ten owners identifies their spouse as a homemaker. Five percent of spouses are classified in other categories.

2013 SURVEY OF OWNERS OF INDIVIDUAL ANNUITY CONTRACTS16
Figure 6: Employment Status of Owners and Spouses
5%
10%
9%
22%
54%
4%
3%
8%
20%
65%
0% 10% 20% 30% 40% 50% 60% 70%
Other
Homemaker
Employed Part-Time
Employed Full-Time
Retired
Owners
Spouses
Occupation
Occupation of Owners. Consistent with the 2009 Survey, the largest share of individual annuity owners identifies their current occupation (or their occupation prior to retirement) as being professional, such as a doctor, lawyer, or teacher (34%). Fifteen percent identify themselves as a business owner or company officer. A significant proportion of individual annuity owners are supervisors such as foremen or managers (15%), blue collar or service workers (14%), or support staff such as secretaries (12%). (See Figure 7)
Occupation of Spouses. Almost half of married individual annuity owners say their spouse currently works (or worked prior to retirement) as either a business owner or company officer (15%) or some other type of professional (31%). Further, one in ten states their spouse works in a supervisory position. Others report that their spouse works as a blue collar or service worker or in a support staff position (13% and 14% respectively).

172013 SURVEY OF OWNERS OF INDIVIDUAL ANNUITY CONTRACTS
Figure 7: Occupation of Owners and Spouses
4%
8%
4%
14%
13%
10%
31%
15%
4%
1%
5%
12%
14%
15%
34%
15%
0% 5% 10% 15% 20% 25% 30% 35% 40%
Other/No Answer
Never Worked
Sales Position
Support Staff
Blue Collar/Service Worker
Supervisory Position
Professional
Business Owner/Company Officer
Owners
Spouses
Income
Annual Household Income. Most individual annuity owners are in households with moderate incomes. Their median annual household income is $64,000, while the average is just over $81,000. Eighty percent have total annual household incomes under $100,000. Six in ten (60%) are below $75,000, and over one-third (35%) are below $50,000. Only 7% have annual household incomes of $200,000 or more. (See Figure 8)
Figure 8: Annual Household Income
$20,000 to $39,99916%
$40,000 to $49,99914%
$50,000 to $74,99925%
$75,000 to $99,99920%
$100,000 to $199,99913%
$200,000 or more7%
Under $20,0005%

2013 SURVEY OF OWNERS OF INDIVIDUAL ANNUITY CONTRACTS18
Employment Status. Of course, whether an individual annuity owner is working or retired affects these numbers. The median annual household income for full-time and part-time employed individual annuity owners is $85,000 and $62,000 respectively. The median for retired owners is $57,000. Two-thirds (67%) of employed owners and almost nine in 10 (87%) retired owners have total annual household incomes below $100,000.
Number of Household Income Earners. While the number of households with two income earners is consistent with 2009 (11% in 2013, 10% in 2009), the number of households with zero or one income earner fluctuated. As noted, the number of retirees in this year’s Survey is lower than in 2009 (65% vs. 69%), and consequently households with no income earners, due to retirement or another reason, decreased by 6 percentage points (from 71% in 2009 to 65% in 2013). One in four households (24%) have one income earner (up 5 percentage points from 19% in 2009).
Historical Trend of Household Income. For more than 20 years, these Surveys have consistently found that individual annuity owners are predominantly middle class, with a majority of the owners in every Survey having a total annual household income between $20,000 and $74,999. (See Figure 9)
Figure 9: Income Trend
16%
29%
37%
9% 8%10%
24%
32%
16% 18%
7%
20%
37%
16%20%
5%
16%
39%
20% 20%
0%
10%
20%
30%
40%
50%
Under$20,000
$20,000 to$39,999
$40,000 to$74,999
$75,000 to$99,999
%100,000or more
1992 2005 2009 2013

192013 SURVEY OF OWNERS OF INDIVIDUAL ANNUITY CONTRACTS
Consistency of Annual Income Findings. The findings from 2013 show a slight upward shift in annual household income of owners, with a smaller proportion having incomes under $40,000 (a 6 percentage point decrease) and a larger proportion having incomes in the $40,000 to $99,999 range (a 6 percentage point increase). However, these figures are in nominal dollars. When the mean and median household incomes from prior Surveys are converted to 2013 real dollars (which accounts for annual inflation), it is evident that, despite some real dollar increases in the late 1990s and decreases in the mid-to-late 2000s, overall the mean and median annual household incomes of annuity owners have not changed significantly over the past twenty years. (See Table 1)
Table 1: Historical Trend of Annual Household Income in 2013 Real Dollars
Mean Income Mean Income in 2013 Real
Dollars
Median Income Median Income in 2013 Real
Dollars
1993 Survey (1993) $51,800 $83,500 $40,000 $64,000
1994 Survey (1994) $53,400 $83,900 $42,000 $66,000
1995 Survey (1995) $54,600 $83,500 $42,000 $64,000
1997 Survey (1996) $54,800 $81,400 $42,000 $62,000
1998 Survey (1997) $63,900 $92,700 $48,000 $70,000
1999 Survey (1998) $66,500 $95,000 $52,000 $74,000
2001 Survey (1999) $75,600 $105,700 $59,000 $82,000
2005 Survey (2003) $69,500 $88,000 $52,000 $66,000
2009 Survey (2008) $75,700 $81,900 $58,000 $63,000
2013 Survey (2012) $81,400 $82,600 $64,000 $65,000
Note: The year listed is parentheses indicates the year for which the annual household income of owners was asked. For example, in the 2013 Survey, the question asked owners for their 2012 annual household income. Real dollar calculations were based on the year asked, not the Survey year.

2013 SURVEY OF OWNERS OF INDIVIDUAL ANNUITY CONTRACTS20
Characteristics of Individual Annuities
Type of Annuity
Fixed or Variable
Between 2009 and 2013, there has been a sharp increase in the proportion of all individual annuities represented by variable annuities (from 56% to 75%), probably resulting from lower interest rates and rises in the stock market in the last four years. Although the proportion of variable annuity owners has increased over time, this is the greatest proportion of all the Survey years. (See Table 2)
Table 2: Annuity Type (percent by year)
1995 1997 1998 1999 2001 2005 2009 2013
Fixed Annuities 67 54 46 49 35 51 44 25
Variable Annuities 33 46 54 51 65 49 56 75
Household Income. Annuity owners with annual household incomes of $75,000 or higher are more likely than owners with lower incomes to own variable annuities (84% vs. 69%).
Education. Annuity owners who do not have a college degree are more likely than those with post-graduate education to own a fixed annuity (29% vs. 20%).
Age. Owners age 72 or older are more likely to have purchased fixed annuities than younger owners (35% vs. 17%).
Guaranteed Lifetime Withdrawal Benefit
Some annuities that provide returns based on or linked to market values also provide guaranteed withdrawal benefits for life; that is, they guarantee the right of owners of these annuities to take a specified amount of money from their annuity each year for as long as they live, even if their account balance goes to zero. Almost nine in ten individual annuity owners (87%) consider a guaranteed lifetime withdrawal benefit to be valuable, including 48% who describe it as very valuable. (See Figure 10)

212013 SURVEY OF OWNERS OF INDIVIDUAL ANNUITY CONTRACTS
Figure 10: Value of a Guaranteed Lifetime Withdrawal Benefit as Perceived by Owners of Annuities
Very Valuable48%
Somewhat Valuable39%
Not too Valuable7%
Not at all Valuable5%
This guaranteed lifetime withdrawal benefit is especially prevalent among variable annuities. Indeed, nearly eight in ten annuity owners (79%) who own a variable annuity report that their contract has a guaranteed lifetime withdrawal benefit. Among them, three out of four (77%) say that the benefit was an important factor in their decision to purchase an annuity. Nearly half (43%) say it was a very important factor. (See Figure 11)
Figure 11: Importance of a Guaranteed Lifetime Withdrawal Benefit in the Decision to Purchase an Annuity
Very Important43%
Somewhat Important34%
Not too Important13%
Not Important At All10%

2013 SURVEY OF OWNERS OF INDIVIDUAL ANNUITY CONTRACTS22
Among variable annuity owners with a guaranteed lifetime withdrawal benefit, approximately one-quarter (26%) say they have begun taking guaranteed lifetime income withdrawals, up three percentage points from 2009. Not surprisingly, retired owners are more likely than working owners to have begun taking such withdrawals (33% vs. 11%). The proportion of retired owners who have commenced a series of withdrawals pursuant to a guaranteed lifetime withdrawal benefit has increased six percentage points since 2009 (33% vs. 27%).
Annuity Values
Approximately three in ten individual annuity owners (31%) have annuities with account values of less than $100,000, including 7% whose account values are less than $25,000. Most (58%) report that the current value of their annuities is $100,000 or more, including one-third who say it is at least $200,000 (35%). Another 11% cannot provide an estimate. The median of account values is $157,000.
Household Income. Not surprisingly, owners with annual household incomes greater than $75,000 are more likely than those with lower incomes to have an annuity currently valued at $200,000 or more (48% vs. 29%).
Age. Owners between the ages of 54 and 71 (65%) are more likely than owners under the age of 54 (41%) and owners age 72 or older (53%) to have annuities valued at $100,000 or higher. It is presumed that the reason is because owners under the age of 54 have not had as much time for their annuities to grow in value, while those age 72 or older are more likely to have begun taking money out of their annuities. In that regard, those age 72 or older are almost twice as likely as younger owners to have withdrawn money from an annuity (50% vs. 26%) or begun receiving a regular or periodic payout (36% vs. 19%).
Sources of Funds for Annuity Purchases
A majority of individual annuity owners (59%) used existing savings to fund at least part of their annuity purchase. Nearly half (45%) utilized their current income. Four in ten (40%) report that they drew on investment proceeds to fund the purchase (a 9 percentage point increase from 2009), while one-third (32%) used inheritance income. Other sources that owners used to fund the purchase of their annuities include a gift from a relative (16%), a death benefit from a life insurance policy (16%), or the sale of a home, farm, or business (14%). (See Table 3) [Note that the sum of the percentages for a given year exceeds 100% because respondents often use multiple sources to fund their annuity purchases and therefore give multiple answers to the question.]

232013 SURVEY OF OWNERS OF INDIVIDUAL ANNUITY CONTRACTS
Table 3: Sources of Funds for Owners’ Annuities
1992 2005 2009 2013 (in percent)
Existing savings 62 58 57 59
Their or their spouse’s current income 57 50 45 45
Proceeds from another investment 44 30 31 40
An inheritance 20 26 26 32
Gift from a relative 11 13 13 16
Death benefit from a life insurance policy 15 14 12 16
Sale of family home, farm, or business 16 14 17 14
A bonus from their employer 11 9 7 11
Marital Status. Those who are married are more likely to have used current income (52% vs. 35%) or a bonus from an employer (15% vs. 5%), while those who are not married are more likely to have used a death benefit from a life insurance policy (20% vs. 14%).
Gender. Male individual annuity owners are more likely than female owners to cite existing savings (65% of males vs. 54% of females), current income (53% vs. 38%), proceeds from another investment (46% vs. 35%), and a bonus from an employer (16% vs. 6%) as sources used for funding their annuity purchases. Conversely, female owners are more likely than male owners to mention an inheritance (37% vs. 27%), a death benefit from a life insurance policy (19% vs. 13%), and a gift from a relative (19% vs. 12%) as a source of funds for their annuity purchase.
Number of Sources Used and Annuity Value. Seven in ten owners (71%) combined money from two or more different sources to purchase their annuity. Those with annuities valued at $100,000 or higher are somewhat more likely to have used multiple sources than those with annuities valued at less than $100,000 (79% vs. 61%). In terms of specific sources, owners with annuities valued at $100,000 or higher are more likely to have used existing savings (65% vs. 52%) or proceeds from another investment (48% vs. 28%).

2013 SURVEY OF OWNERS OF INDIVIDUAL ANNUITY CONTRACTS24
Uses of Individual Annuities
Actual Uses of Annuity Savings
Incidence and Type of Annuity Distributions
Nearly four in ten (37%) individual annuity owners have withdrawn money from an annuity that they or their spouse currently own. This has not changed significantly since 2009 (36%). The average age for first withdrawal is 65 years old, which is slightly below the average age of first withdrawal in 2009 (66 years old).
Periodic Payments. Twenty-seven percent of individual annuity owners currently receive money from their annuity on a regular basis via a check every month or some other method, up six percentage points from 2009. One-third (33%) of retired owners are currently receiving such periodic payments from their annuities.
Ad Hoc Withdrawals. Fifteen percent of individual annuity owners have withdrawn money from their annuities at some point but are not currently receiving regular periodic payments.
Periodic Payments Coupled with Ad Hoc Withdrawals. Over two in ten individual annuity owners (22%) have withdrawn money from their annuities in the past and currently are receiving a regular periodic payment. This is an increase of 5 percentage points since 2009 (17%).
Demographics of Distribution Takers
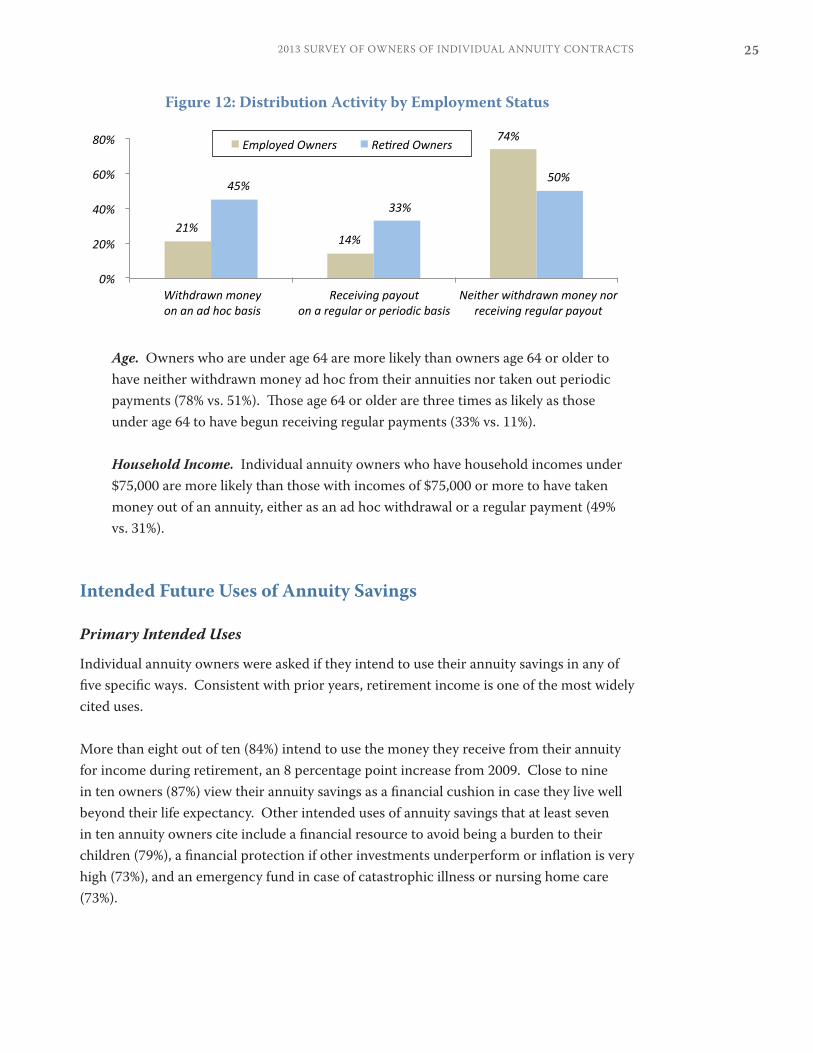
Employment Status. As would be expected, retired owners of individual annuities are at least twice as likely as working owners to have either withdrawn money on an ad hoc basis from their annuities (45% vs. 21%) or have begun receiving regular payments (33% vs. 14%). Conversely, working owners are more likely than retired owners to have neither withdrawn money nor begun receiving a regular payment (74% vs. 50%). (See Figure 12)
252013 SURVEY OF OWNERS OF INDIVIDUAL ANNUITY CONTRACTS
Figure 12: Distribution Activity by Employment Status
21%14%
74%
45%
33%
50%
0%
20%
40%
60%
80%
Withdrawn moneyon an ad hoc basis
Receiving payouton a regular or periodic basis
Neither withdrawn money norreceiving regular payout
Employed Owners Retired Owners
Age. Owners who are under age 64 are more likely than owners age 64 or older to have neither withdrawn money ad hoc from their annuities nor taken out periodic payments (78% vs. 51%). Those age 64 or older are three times as likely as those under age 64 to have begun receiving regular payments (33% vs. 11%).
Household Income. Individual annuity owners who have household incomes under $75,000 are more likely than those with incomes of $75,000 or more to have taken money out of an annuity, either as an ad hoc withdrawal or a regular payment (49% vs. 31%).
Intended Future Uses of Annuity Savings
Primary Intended Uses
Individual annuity owners were asked if they intend to use their annuity savings in any of five specific ways. Consistent with prior years, retirement income is one of the most widely cited uses.
More than eight out of ten (84%) intend to use the money they receive from their annuity for income during retirement, an 8 percentage point increase from 2009. Close to nine in ten owners (87%) view their annuity savings as a financial cushion in case they live well beyond their life expectancy. Other intended uses of annuity savings that at least seven in ten annuity owners cite include a financial resource to avoid being a burden to their children (79%), a financial protection if other investments underperform or inflation is very high (73%), and an emergency fund in case of catastrophic illness or nursing home care (73%).

2013 SURVEY OF OWNERS OF INDIVIDUAL ANNUITY CONTRACTS26
Use for Retirement Income. Among those more likely to say they intend to use their annuity savings for retirement income are those under the age of 64 (92%, compared to 81% of older owners; see Figure 13) and owners who are employed (93%, compared to 80% of retired owners). Those owning an annuity with a guaranteed lifetime withdrawal benefit (87%, compared to 82% of owners without the benefit) are also more likely to say they intend to use their annuity funds for retirement income.
Figure 13: Intended Uses of Annuity Savings by Age
73%
74%
81%
81%
87%
73%
70%
73%
92%
88%
73%
73%
79%
84%
87%
0% 10% 20% 30% 40% 50% 60% 70% 80% 90% 100%
Financial protection if otherinvestments do not do well
or if inflation is very high
Emergency fund in case ofcatastrophic illness or
nursing home care
Financial resource to avoidbeing a financial
burden on children
Retirement income
Financial cushion in case they ortheir spouse live well beyond
their life expectancy
Overall
Under age 64
Ages 64 and older
Intended Uses Cited in Response to Open-Ended Question
Individual annuity owners were asked, in a separate open-ended question, to identify the primary uses that they intend to make of their annuity savings. Retirement income is the most frequently cited use, with more than four in ten (41%) specifically identifying this as a primary intended use of their annuity. Other answers include using it for extra income as needed (35%), inheritance for others (13%), investments or savings for future needs (6%), or long term care or nursing home care (6%).

272013 SURVEY OF OWNERS OF INDIVIDUAL ANNUITY CONTRACTS
Expected Form of Future Distributions
When asked how they expect to withdraw most of their money from their annuities, almost half of annuity owners (49%) intend to receive most of their annuity contract values in some form of periodic payment. (See Figure 14) In particular, one-quarter intend to commence a series of payments guaranteed to last the longer of their lifetime or some stated period of years (a 7 percentage point increase from 2009), while nearly a quarter (24%) plan to withdraw funds through periodic payments for a set number of years. Four in ten assert they do not anticipate taking money out except in case of emergency.
Figure 14: Expected Annuity Payout Method
7%
4%
40%
49%
0% 10% 20% 30% 40% 50%
Other/Not sure
One lump sum
Don’t expect to take money outunless an emergency arises
Series of payments
Age. Individual annuity owners who are age 72 or older are more likely than younger owners to say that they do not plan to take the money out unless an emergency arises (51% vs. 31% of younger owners). On the other hand, individual owners under the age of 72 are more likely than older owners to anticipate withdrawing money in a series of payments (59% vs. 36%).
Guaranteed Lifetime Withdrawal Benefit. Owners with an annuity that has a guaranteed lifetime withdrawal benefit are more likely than owners without the benefit to anticipate withdrawing money through a series of payments (55% vs. 44%).

2013 SURVEY OF OWNERS OF INDIVIDUAL ANNUITY CONTRACTS28
Expected Timing of Future Distributions
One-third of individual annuity owners who plan to take guaranteed income payments from their annuity indicate they will start doing so within the next three years (33%). Most others plan to start taking money out in the next 3 to 5 years or 6 to 10 years (22% each). Only 14% do not plan to start removing money until more than 10 years from now. (See Figure 15)
Figure 15: Expected Timeframe for Beginning of Annuity Payments
33%
22% 22%
14%
9%
0%
5%
10%
15%
20%
25%
30%
35%
Within the next3 years
3 to 5 years 6 to 10 years Over 10 years Not sure
Age. Among owners who expect to draw on their annuities in a series of payments, those age 64 or older are three times more likely than those under age 64 to expect to begin receiving those payments within the next five years (71% vs. 23%).

292013 SURVEY OF OWNERS OF INDIVIDUAL ANNUITY CONTRACTS
Attitudes Toward Individual Annuities
The Relationship Between Taxation and Savings Through Annuities
Tax Treatment of Earnings as Incentive to Save through Annuities
The fact that interest or earnings on individual annuities are not taxed until money is withdrawn continues to be a strong motivation for purchasing individual annuities. Seventy percent of individual annuity owners report that they have set aside more money for retirement than they would have if the tax advantages of annuities were not available.
Gender. Male owners are more likely than female owners to say they have saved more money for retirement than they otherwise would have if the tax advantages of annuities did not exist (74% vs. 67%).
Additionally, a large majority cite the tax treatment of annuities as a “very” or “somewhat” important reason why they purchased an annuity (86%). (See Table 4, page 30)
Over eight in ten individual annuity owners (82%) agree “completely” or “somewhat” that annuities “have attractive tax treatment,” and nine in ten (90%) agree that “keeping the tax advantage of annuities is a good way of encouraging long-term savings.” (See Table 5, page 31)
Taxation of Distributions as Incentive for Maintaining Retirement Savings
Nearly nine in ten individual annuity owners (88%) report that they try not to withdraw any money from their annuities before they retire because they would have to pay tax on the money that is withdrawn.
Non-Tax Reasons for Saving Through Annuities
Reasons for Purchasing Annuities
Owners of individual annuities cite a number of reasons other than taxes as being very or somewhat important factors in their decision to buy them. Consistent with 2009, the most frequently mentioned non-tax related reason for purchasing an individual annuity is “it was a safe purchase” (90%). Over eight in ten individual annuity owners also cite having “a good rate of return” and the ability to “get payments guaranteed to continue for as long as you live” as important reasons (88% and 81% respectively). The latter reason — the lifetime income guarantee — has become even more important to owners since 2009, with an increase of nine percentage points in the number of owners citing it as important to their decision to purchase an individual annuity. (See Table 4)

2013 SURVEY OF OWNERS OF INDIVIDUAL ANNUITY CONTRACTS30
Table 4: Importance of Various Reasons for Buying an Annuity
Very/Somewhat Important
1992 2005 2009 2013
(in percent)
Was a safe purchase. 95 88 89 90
Had a good rate of return. 91 87 86 88
Earnings would not be taxed until the funds were used.
95 88 89 86
Could get payments guaranteed to continue for as long as you live. *
74 74 72 81
Wanted a long-term savings plan. 85 82 80 79
Wanted a source of funds that could be used to pay for emergencies, such as catastrophic illness during retirement.
71 73 72 72
Easy way to save. 78 74 72 70
Had choices of methods of getting the money. 69 72 71 69
Provides money in case owner or spouse needs to enter a nursing home.
NA 66 65 68
* Prior to 2005: “Could get income guaranteed for as long as you live.”
Guaranteed Payments for Life. Several demographic groups are more likely than their counterparts to consider guaranteed income for life as being a very or somewhat important reason for purchasing their annuities. These include employed owners (87%, compared to 78% of retired owners) and owners with annuities currently valued at $100,000 or more (87%, compared to 73% of owners with annuities valued under $100,000).
Employment Status. Working owners of individual annuities are more likely than retired owners to cite wanting a long-term savings plan (85% vs. 77%) as an important reason for purchasing an annuity.
Gender. Females are more likely than males to say the following were very important reasons for buying an annuity: it was a safe purchase (63% vs. 52%), you could get payments guaranteed to continue for as long as you live (62% vs. 52%), the earnings would not be taxed until the funds were used (60% vs. 53%), it was an easy way to save (37% vs. 29%), and it provides money in case you (or your spouse) need to enter a nursing home (41% vs. 34%).
312013 SURVEY OF OWNERS OF INDIVIDUAL ANNUITY CONTRACTS
Viewing Annuities as a Flexible Financial Tool
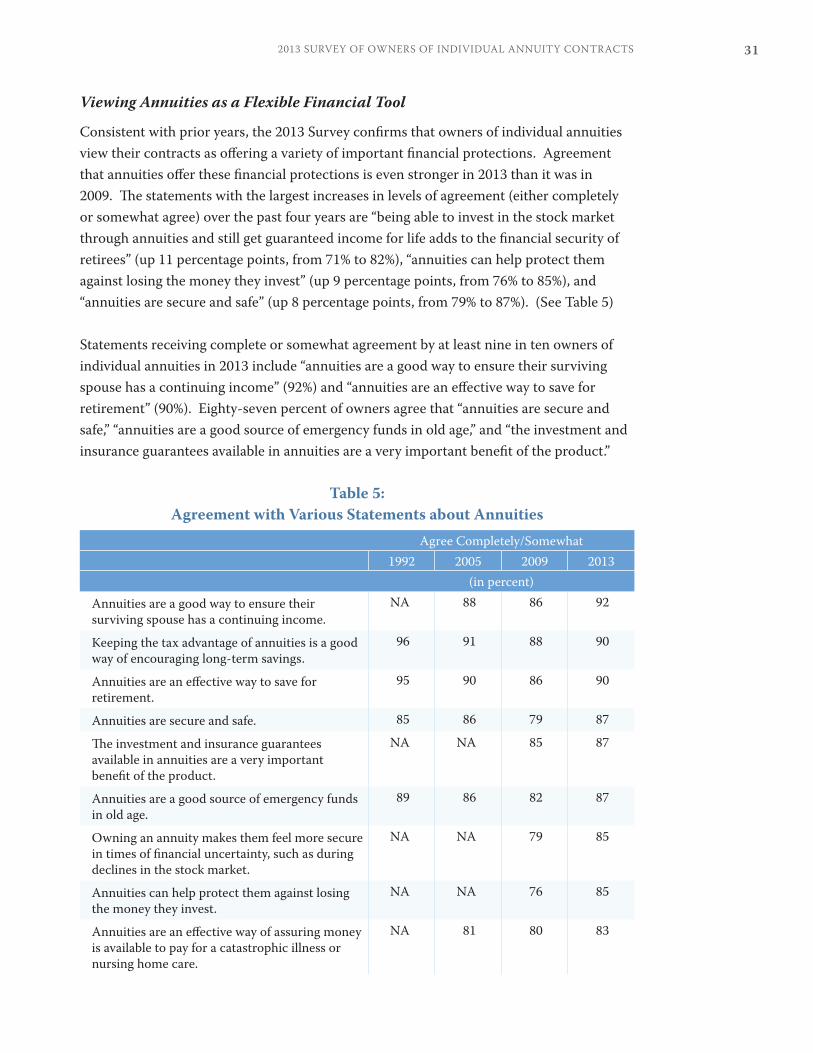
Consistent with prior years, the 2013 Survey confirms that owners of individual annuities view their contracts as offering a variety of important financial protections. Agreement that annuities offer these financial protections is even stronger in 2013 than it was in 2009. The statements with the largest increases in levels of agreement (either completely or somewhat agree) over the past four years are “being able to invest in the stock market through annuities and still get guaranteed income for life adds to the financial security of retirees” (up 11 percentage points, from 71% to 82%), “annuities can help protect them against losing the money they invest” (up 9 percentage points, from 76% to 85%), and “annuities are secure and safe” (up 8 percentage points, from 79% to 87%). (See Table 5)
Statements receiving complete or somewhat agreement by at least nine in ten owners of individual annuities in 2013 include “annuities are a good way to ensure their surviving spouse has a continuing income” (92%) and “annuities are an effective way to save for retirement” (90%). Eighty-seven percent of owners agree that “annuities are secure and safe,” “annuities are a good source of emergency funds in old age,” and “the investment and insurance guarantees available in annuities are a very important benefit of the product.”
Table 5: Agreement with Various Statements about Annuities
Agree Completely/Somewhat1992 2005 2009 2013
(in percent)Annuities are a good way to ensure their surviving spouse has a continuing income.
NA 88 86 92
Keeping the tax advantage of annuities is a good way of encouraging long-term savings.
96 91 88 90
Annuities are an effective way to save for retirement.
95 90 86 90
Annuities are secure and safe. 85 86 79 87
The investment and insurance guarantees available in annuities are a very important benefit of the product.
NA NA 85 87
Annuities are a good source of emergency funds in old age.
89 86 82 87
Owning an annuity makes them feel more secure in times of financial uncertainty, such as during declines in the stock market.
NA NA 79 85
Annuities can help protect them against losing the money they invest.
NA NA 76 85
Annuities are an effective way of assuring money is available to pay for a catastrophic illness or nursing home care.
NA 81 80 83

2013 SURVEY OF OWNERS OF INDIVIDUAL ANNUITY CONTRACTS32
Agree Completely/Somewhat1992 2005 2009 2013
(in percent)Annuities have attractive tax treatment. 92 85 80 82
Annuities are an important source of retirement security.
87 79 79 82
Annuities offer a good return. 90 80 76 82
Being able to invest in the stock market through annuities and still get guaranteed income for life adds to the financial security of retirees.
NA NA 71 82
Annuities will prevent them from being a financial burden on their children in their later years.
80 79 74 81
Security of Guaranteed Income for Life. Several demographic groups express greater agreement than their counterparts with the concept that investing in the stock market through annuities and still getting a guaranteed income for life adds to the financial security of retirees. Specifically, those showing greater agreement include owners of variable annuities (84% vs. 74% of fixed annuity owners), those under the age of 64 (89% vs. 79% of those age 64 or older), and those with annuities valued at $100,000 or higher (86% vs. 77% of those with annuities valued below $100,000).

332013 SURVEY OF OWNERS OF INDIVIDUAL ANNUITY CONTRACTS
Savings of Individual Annuity Owners
Perception of Retirement Preparedness as a Society
Nine in ten individual annuity owners (90%) believe that people in the United States do not save enough money for retirement.
Relevance of Age. Age plays a role in whether individual annuity owners believe that people in the United States save enough for retirement. Specifically, 95% of annuity owners between the ages of 54 and 71 believe that people are not saving enough, compared to only 86% of those ages 72 or older.
Annuity Owners’ Savings in Other Financial Products
Individual annuity owners are likely to own a variety of financial products in addition to their annuities. Majorities report having individual retirement accounts (79%), mutual funds (69%), cash value life insurance (58%), and individual stocks or bonds (58%). Just over four in ten (41%) have certificates of deposit. (See Figure 16)
Figure 16: Savings in Other Financial Products
41%
58%
58%
69%
79%
0% 10% 20% 30% 40% 50% 60% 70% 80% 90%
Certificates of deposit
Individual stocksor bonds
Cash valuelife insurance
Mutual funds
Individual retirementaccounts
Compared to 2009, the proportion of individual annuity owners who have certificates of deposit decreased by 17 percentage points (from 58% to 41% in 2013). On the other hand, the proportion of owners who have an IRA has increased by 8 percentage points (from 71% to 79%).

2013 SURVEY OF OWNERS OF INDIVIDUAL ANNUITY CONTRACTS34
Additionally, over one-third of individual annuity owners (34%) have never participated in a retirement program offered through an employer. This is a nine percentage point decrease from 2009, when 43% reported they have never participated in an employer plan.
Age. Owners age 72 or older are twice as likely as younger owners to have never participated in an employer plan (46% vs. 23%).
Education. Owners who have not graduated from college are more likely to have never participated in an employer plan than owners who have earned a college degree (46% vs. 24%).
Gender. Female owners are more likely than male owners to have never participated in an employer plan (38% vs. 30%).
Consistent with their lower participation rate in employer plans, female owners are less likely than their male counterparts to view 401(k) plans and pension plans as a major source of income in retirement. Among owners who are not retired, males are more likely than females to expect money from a 401(k) plan to be a major source of income in retirement (51% vs. 40%). Among retired owners, males are more likely than females to say that a pension is currently a major source of income in their retirement (55% vs. 45%).
Confidence and Concerns with Financial Preparedness for Retirement
General Confidence in Retirement Preparedness
When asked about their confidence in the preparations they have made for retirement, most individual annuity owners (88%) say that the phrase “you have done a very good job of saving for retirement” describes them either very or somewhat well (down 3 percentage points from 2009). (See Table 6, page 37) Over four in ten (44%) believe that the money they will receive from pensions and retirement plans, including Social Security, will not be enough to cover their retirement expenses (a 5 percentage point increase from 2009). At the same time, just over half (52%) believe that this money will be enough or more than enough. (See Figure 17)

352013 SURVEY OF OWNERS OF INDIVIDUAL ANNUITY CONTRACTS
Figure 17: Whether Money from Pension and Retirement Plans Will Cover Retirement Expenses
51%
37%
5% 7%
38%
44%
11%7%
39%
45%
10%6%
44% 44%
8%4%
0%
10%
20%
30%
40%
50%
60%
Not Enough Enough More than Enough Don’t Know/Refused
1992 2005 2009 2013
Employment Status. Individual annuity owners who identify themselves as employed full-time are more likely than retired owners to expect that pensions and retirement plans will not be enough to cover retirement expenses (51% vs. 41%).
Gender. Female owners are more likely than male owners to think that pensions and retirement plans will be insufficient to meet their retirement needs (48% vs. 40%).
Age. Owners who are under age 64 are more concerned than older owners that money from pensions and retirement plans will not be enough to meet their financial needs in retirement (52% vs. 42%). (See Figure 18)
Figure 18: Age and Whether Money from Pension and Retirement Plans Will Cover Retirement Expenses
45%
35%
53%
60%
51%
37%
48%
60%
52%
42%47%
56%
0%
10%
20%
30%
40%
50%
60%
70%
Under age 64 Age 64+ Under age 64 Age 64+
2005 2009 2013
ENOUGH/MORE THAN ENOUGHNOT ENOUGH

2013 SURVEY OF OWNERS OF INDIVIDUAL ANNUITY CONTRACTS36
Almost half of individual annuity owners (48%) are concerned about having to cut back on their standard of living as they get older, including 14% who are very concerned. (See Figure 19)
Figure 19: Concern about Cutting Back on Standard of LivingVery concerned
14%
Somewhat concerned 34%Not too concerned
31%
Not at all concerned21%
Age. Not surprisingly, age plays a significant role in annuity owners’ concern about having to cut back on standard of living. Individual annuity owners under the age of 64 are more likely than older annuity owners to say they are at least somewhat concerned (61% vs. 43%).
Gender. Women are almost twice as likely as men to say they are “very concerned” that they may have to cut back on their standard of living as they get older (18% vs. 10%).
Concerns over Health and Long-Term Care Costs
Individual annuity owners express concern about their health and ability to manage health care costs in retirement. Almost half (47%) are concerned that a catastrophic illness or the need for nursing home care could bankrupt them in retirement. Further, a third (34%) feel that they (or their spouse) are at high risk of suffering from a catastrophic medical condition in old age, and one-quarter describe themselves as being at high risk for needing to be confined to a nursing home in old age. (See Table 6)
Other Concerns
Individual annuity owners are also concerned about other issue areas that could possibly affect their retirement. At least four in ten individual annuity owners believe it will be difficult to figure out how to reach their desired standard of living in retirement (44%) or are concerned that they may run out of money during retirement (40%). Additionally, one in three (34%) is worried that their spouse would not be able to make ends meet if they predecease him or her.

372013 SURVEY OF OWNERS OF INDIVIDUAL ANNUITY CONTRACTS
Table 6: Agreement with Statements about Preparedness for Retirement
Statement Describes Respondent Very/Somewhat Well
1992 2005 2009 2013(in percent)
They have done a very good job of saving for retirement.
84 87 91 88
They are concerned that a catastrophic illness or nursing home care might bankrupt them during retirement.
66 49 50 47
It will be difficult to figure out how to reach their desired standard of living in retirement.
NA 46 43 44
They are concerned that they might run out of money during retirement.
52 43 45 40
They (or their spouse) are at a high risk of suffering a catastrophic medical condition in old age.
NA 37 38 34
Their spouse may not have enough money to make ends meet if they predecease him/her.
NA 38 32 34
They (or their spouse) are at a high risk of needing to be confined to a nursing home in old age.
NA 28 29 25
Sources of Income in Retirement
The source of income retired owners most often cite as being major is Social Security (53%); conversely, only about one in three non-retired owners (35%) expect Social Security to be a major source of income in their retirement. Retired owners are also more likely to say that money provided by an employer, such as a pension or a contribution to a retirement account, is currently a major source of income in retirement (50%, compared to only 39% of non-retired owners who expect it to be a major source). (See Figure 20)
In contrast, owners who are not retired generally view themselves as needing to be more responsible for funding their own retirement. Non-retired owners are more likely than retired owners to cite personal savings such as annuities and investments outside an employer-sponsored retirement plan and unrelated to Social Security (56% vs. 37%) as a major source of income in retirement. In addition, those who are not retired are three times as likely to believe that employment during retirement will be a major source of retirement income (24%, compared to only 8% of retired owners).

2013 SURVEY OF OWNERS OF INDIVIDUAL ANNUITY CONTRACTS38
These findings show that non-retired owners generally are less confident than their retired counterparts that employer plans and Social Security will provide them with adequate retirement savings and income. Regardless of employment status, however, individual annuity owners are increasingly of the view that they will need to rely more heavily on personal savings in retirement. In that regard, since 2009 there has been a large increase in the proportion of both non-retired and retired individual annuity owners who expect personal savings such as their annuity contracts to be a major source of retirement income (a 19 percentage point increase in non-retired owners and an 11 percentage point increase in retired owners).
Figure 20: Major Sources of Retirement Income
2%
12%
8%
53%
50%
29%
37%
2%
16%
24%
35%
39%
46%
56%
0% 10% 20% 30% 40% 50% 60%
Support from your children orother family members
Sale of home, farm,or business
Full-time or part-timeemployment
Social Security
Money your employer put into a retirement plan
Money you put into aretirement plan at work
Personal savings other thanemployer plans or Social Security
(such as individual annuities)
Non-Retired Owners
Retired Owners
Household Income. Among non-retired individual annuity owners, those with household incomes of $75,000 or higher are more likely than owners with incomes below $75,000 to expect money they put into a retirement plan at work to be a major source of retirement funds (55% vs. 37%). Conversely, owners with incomes below $75,000 are more likely than their counterparts to expect Social Security to be a major source of funds in retirement (48% vs. 25%).
Guaranteed Lifetime Withdrawal Benefit. Retired annuity owners with a guaranteed lifetime withdrawal benefit are more likely than retired owners without the benefit to say that personal savings unrelated to an employer-sponsored retirement plan or Social Security, such as money from an individual annuity, are a major source of funds in retirement (49% vs. 35%).

A VOICE FOR SOUND RETIREMENT SECURITY POLICIES …
The Committee of Annuity Insurers, based in Washington, DC, was established in 1982 to address Federal legislative and regulatory issues relevant to the annuity industry and to participate in the development of Federal tax and securities policies regarding annuities. The Committee is comprised of 28 of the largest and most prominent issuers of annuity contracts. The member companies of the Committee represent approximately 80 percent of the annuity business in the United States.
AIG Life & Retirement, Los Angeles, CAAllianz Life Insurance Company, Minneapolis, MN
Allstate Financial, Northbrook, ILAviva USA, Des Moines, IA
AXA Equitable Life Insurance Company, New York, NYCommonwealth Annuity and Life Insurance Co., Southborough, MA
Fidelity Investments Life Insurance Company, Boston, MAGenworth Financial, Richmond, VA
Great American Life Insurance Co., Cincinnati, OHGuardian Insurance & Annuity Co., Inc., New York, NY
ING North America Insurance Corporation, Atlanta, GAJackson National Life Insurance Company, Lansing, MI
John Hancock Life Insurance Company, Boston, MALife Insurance Company of the Southwest, Dallas, TX
Lincoln Financial Group, Fort Wayne, INMassMutual Financial Group, Springfield, MA
Metropolitan Life Insurance Company, New York, NYNationwide Life Insurance Companies, Columbus, OH
New York Life Insurance Company, New York, NYNorthwestern Mutual Life Insurance Company, Milwaukee, WI
Ohio National Financial Services, Cincinnati, OHPacific Life Insurance Company, Newport Beach, CA Protective Life Insurance Company, Birmingham, AL
Prudential Insurance Company of America, Newark, NJSymetra Financial, Bellevue, WA
The Transamerica companies, Cedar Rapids, IATIAA-CREF, New York, NY
USAA Life Insurance Company, San Antonio, TX

The Committee of Annuity InsurersThe Willard Office Building1455 Pennsylvania Avenue, NWSuite 1200Washington, DC 20004www.annuity-insurers.org