Embed Size (px)
Citation preview

2013 NATIONAL SURVEY OF PROBLEM GAMBLING SERVICES
March 2014 Prepared by Problem Gambling Solutions, Inc.
A Prepared for:

This study has been funded by the Association of Problem Gambling Service Administrators (APGSA) and the National Council on Problem Gambling (NCPG).
For further information about the APGSA, contact:
Mark Vander Linden President Association of Problem Gambling Service
Administrators [email protected] 617-979-8445 http://www.problemgamblingservices.org
For further information about the NCPG, contact:
Keith S. Whyte Executive Director National Council on Problem Gambling 730 11th Street, NW, Suite 601 Washington, DC 20001 [email protected] 202.547.9204 x 23 www.ncpgambling.org
For further information about this study, contact the Principle Investigator:
Jeffrey Marotta, Ph.D. Problem Gambling Solutions, Inc., (503) 706-1197 [email protected]
The views and conclusions expressed in this report are the authors and do not necessarily represent those of the APGSA or the NCPG. Suggested Citation:
Marotta, J., Bahan, M., Reynolds, A., Vander Linden, M., & Whyte, K. (2014). 2013 National Survey of Problem Gambling Services. Washington DC: National Council on Problem Gambling.
Acknowledgements
Survey Respondents: We are grateful to all the state agency administrators and NCPG affiliate directors and staff who completed a survey or helped in the gathering of survey information.
Project Executive Team: Jeff Marotta, Mark Vander Linden, Chris Armentano, & Keith Whyte
Research Assistants: Ashley Reynolds, Monica Bahan, Emma Burick, Gail Calcagno, Jasmine Marotta-Jaenecke
NCPG Work Group Participants:
Don Feeney, Wily Harwell, Carol O’Hare
The project was conducted under a contract between the APGSA and Problem Gambling Solutions, Inc.
ii

Section Page
List of State Profiles iv
List of Tables and Figures vi
Executive Summary viii
Introduction 1
Survey Methodology 3
Legalized Gambling in the U.S. 9
Funding for Problem Gambling Services 12
Types of Problem Gambling Services Funded 20
Administrative Structures 25
Problem Gambling Helplines 29
Treatment Systems 34
Research and Evaluation 44
Service Gaps & Infrastructure Needs 46
Associations between Variables of Interest: Statistical Explorations 48
References 57
Appendix A: State Profiles 58
Appendix B: Contact Information by State 110
Appendix C: APGSA Survey Instrument 126
Appendix D: NCPG Affiliate Survey Instrument 144
TABLE OF CONTENTS
iii

State Page
Alabama 59
Alaska 60
Arizona 61
Arkansas 62
California 63
Colorado 64
Connecticut 65
Delaware 66
District of Columbia 67
Florida 68
Georgia 69
Hawaii 70
Idaho 71
Illinois 72
Indiana 73
Iowa 74
Kansas 75
Kentucky 76
Louisiana 77
Maine 78
Maryland 79
Massachusetts 80
Michigan 81
Minnesota 82
Mississippi 83
STATE PROFILES
iv

Missouri 84
Montana 85
Nebraska 86
Nevada 87
New Hampshire 88
New Jersey 89
New Mexico 90
New York 91
North Carolina 92
North Dakota 93
Ohio 94
Oklahoma 95
Oregon 96
Pennsylvania 97
Rhode Island 98
South Carolina 99
South Dakota 100
Tennessee 101
Texas 102
Utah 103
Vermont 104
Virginia 105
Washington 106
West Virginia 107
Wisconsin 108
Wyoming 109
v

Figure Page
Figure 1. Consumer Spending: Fiscal Year 2012 Lottery Sales, 2012 Casino Revenue, 2011 Tribal Gaming Revenue by State 11
Figure 2. 2013 Per Capita Allocation for Problem Gambling Services by U.S. States 13
Figure 3. Comparison between 2010 and 2013: Per Capita Allocation on Problem Gambling Services 14
Figure 4. 2013 Per Capita NCPG State Affiliate Budget 15
Figure 5. Combined 2013 Per Capita Problem Gambling Services Allocation by U.S. States and NCPG State Affiliates 16
Figure 6. Annual Aggregate of U.S. State Spending Dedicated for Problem Gambling Services 17
Figure 7. Annual Aggregate Budget of State Affiliates to the NCPG 18
Figure 8. Comparison of Prevalence and Public Funding for Substance Use Disorders and Gambling Disorders in the U.S. 19
Figure 9. Number of State Agencies and NCPG Affiliates Allocating Funding or Specific Problem Gambling Services 21
Figure 10. State Budget Allocations by Service Category in FY2013 22
Figure 11. NCPG Affiliate Budget Allocations by Service Category in 2013 29 State Affiliates Reporting 24
Figure 12. Number of State FTE Positions Dedicated to PGS 37 States Reporting 26
Figure 13. Number of NCPG Affiliate FTE Positions Dedicated to PGS 34 Affiliates Reporting 27
Figure 14. Helpline Services 31
Figure 15. Helpline Call Volume and Calls for Help 32
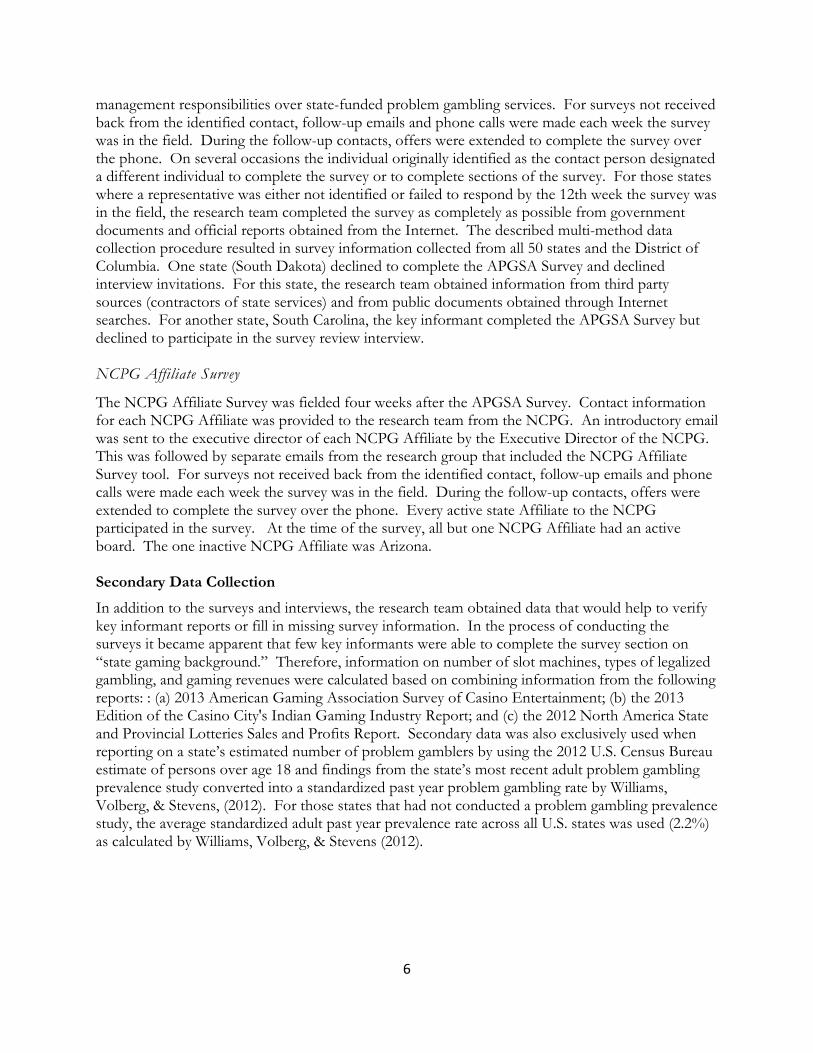
Figure 16. Calls for Help Compared to Treatment Enrollments 33
LIST OF TABLES AND FIGURES
vi

Figure 17. Numbers Treated with Problem Gambling Funds SFY 2012 35
Figure 18. “Over the past year, has the number of consumers receiving outpatient publicly funded gambling treatment increased, decreased, stayed the same?” Response Comparison between 2010 Survey and 2013 Survey 36
Figure 19. Levels of Care Offered 37
Figure 20. Reimbursement Rates for State-Funded Treatment: Fiscal Year 2013 39
Figure 21. Cost Containment Measures 41
Figure 22. Numbers Treated by NCPG Affiliates 42
Figure 23. Identified Gaps in Services Responses to the question: “What is you state’s largest gap in problem gambling services?” 46
Figure 24. Infrastructure Needs 47
Figure 25. Correlation between State Gaming Revenues and Problem Gambling Service Funding 50
Figure 26. Relationship between the Number of Legalized Types of Gambling within State and Problem Gambling Service Funding 50
Figure 27. Relationship between a State’s Estimated Number of Adult Problem Gamblers and Problem Gambling Service Funding 51
Figure 28. Relationship between Number of Types of Legalized Gaming Within a State and Problem Gambling Helpline “Calls for Help” 53
Figure 29. Relationship between Number of Estimated Adult Problem Gamblers within a State and “Calls for Help” to a Problem Gambling Helpline 54
Figure 30. Relationship between problem gambling service funding and numbers treated 55
vii

2013 National Survey of Problem Gambling Services
The present report describes the most comprehensive collection of information ever gathered about problem gambling services in the United States. Unlike other mental health and addiction services, there is the absence of a federal agency designated to fund and guide programs and policies addressing problem gambling; this has contributed to the need for non-governmental entities to gather national data to better inform individual state efforts and track national trends. The Association of Problem Gambling Service Administrators (APGSA) was formed in 2000 to “support the development of services that will reduce the impact of problem gambling”. Central to this mission, the APGSA began sponsoring national problem gambling service surveys in 2006. This report is the 4th in the series and the first to be co-sponsored by the National Council on Problem Gambling (NCPG). The National Council on Problem Gambling (NCPG) is a private non-profit organization whose mission is “to increase public awareness of pathological gambling, ensure the widespread availability of treatment for problem gamblers and their families, and to encourage research and programs for prevention and education.” Like the APGSA, the NCPG does not take a philosophical position for or against legalized gambling. The NCPG spearheads efforts to address problem gambling at the national level, while state level efforts are primarily delegated to NCPG affiliate members. Each state is limited to having one affiliate membership to the NCPG. NCPG affiliate members are also known as NCPG Affiliate Chapters and in this report will be referred to as “Affiliates.” Each Affiliate is a non-profit organization whose mission reflects that of the NCPG. With the additional support of the NCPG, two national surveys were fielded: one designed to collect information on publicly funded problem gambling services from 50 U.S. states and the District of Columbia, and the other to capture information on problem gambling services delivered by NCPG Affiliates. Although this effort represents the most comprehensive collection of information on problem gambling services in the United States, information gathered was from the limited universe of services funded by state agencies with legislated or line-itemed budgets identified for use in reducing gambling related harm and from efforts by NCPG Affiliates. Problem gambling services provided by tribal governments, privately funded entities such as health insurers, and community organizations such as Gamblers Anonymous, were not collected in this survey. The objectives were to collect multi-purpose data that can be used to: assist federal and state governments in assessing the nature and extent of problem gambling treatment, prevention, and research services provided in state-supported systems and systems funded by NCPG Affiliates;
EXECUTIVE SUMMARY
viii

analyze problem gambling services trends and conduct comparative analyses; generate a national directory of state agencies and NCPG Affiliates with problem gambling service oversight responsibilities; explore for associations between state level variables of interest, including size and scope of gaming industry, estimated numbers of problem gamblers, numbers of persons enrolled into state support and NCPG Affiliate supported gambling treatment, problem gambling helpline call volume, and total funding investment into problem gambling services. The highlights of this study’s findings include: • The total number of states that reported publicly funded problem gambling services increased
from 37 in 2010 to 39 in 2013.
• The total amount of public funding allocated for problem gambling services in the U.S. was $60.6 million; on a state-by-state basis, the amounts ranged from Washington, D.C. and the 11 states that did not provide any dedicated funding for problem gambling services to $8.7 million in California.
• For those states that invest in problem gambling services, per capita allocations for problem gambling services ranged from $0.01 in Colorado to $1.42 in Delaware. The average per capita allocation for problem gambling services in the 39 states with publicly funded services was 32 cents. When the 11 states without dedicated funding are included, the national average drops to 25 cents per capita.
• The average per capita funding level across all states with public funding dropped slightly between 2010 and 2013 from 34 cents to 32 cents per capita. Individually, a nearly equal number of states reported decreased funding (n=20) as those that reported funding increases (n=19) since the 2010 survey.
• At the time this survey was conducted, there were 34 states with active NCPG Affiliate Chapters. NCPG Affiliate budgets were dramatically smaller than the state agency budgets in most states—including four states where Affiliates had no revenue in state fiscal year 2013. The median NCPG State Affiliate per capita budget was four cents.
• Substance use disorders are about 3.6 times more common than gambling disorders, while public funding for substance abuse treatment is about 281 times greater than public funding for all problem gambling services ($17 billion: $60.6 million).
• Across all states, there is a lack of uniformity regarding what types of problem gambling services are funded. The most commonly supported services provided by state agencies and NCPG Affiliates were, respectively, helplines (87%; 56%), problem gambling awareness programs (85%; 91%), and problem gambling treatment (82%; 26%).
• Combining data from the APGSA and NCPG Affiliate surveys, we found that slightly less than half (45%) of the 50 U.S. states and the District of Columbia had anyone within the state whose full-time job was to administer problem gambling services. Only 15 states funded one or more full-time state employee positions dedicated to administering problem gambling programs. Among the 34 NCPG State Affiliates, over one-third operated with an all-volunteer staff and board.
ix

• The survey identified 25 organizations that operate problem gambling helplines; it is not uncommon for more than one gambling helpline number to be marketed in the same state.
• In 2012, there were an estimated 5.77 million disordered gamblers in the U.S. in need of treatment.1 Of this number, 10,387 individuals were treated in U.S. state-funded problem gambling treatment programs. These figures suggest that in 2012 state-funded treatment was provided to less than one quarter of one percent (0.18%) of those in need.
• The average cost of problem gambling treatment, per client treatment episode, was $1,174; by comparison, the average cost of substance abuse treatment was reported by Etner et al (2006) to be $1,583.
• Results of each of the past four National Problem Gambling Services Surveys indicate spending on research and evaluation systems has been very low. In 2013, APGSA Survey respondents reported an average of 1.6% of their budgets was spent on “research” (defined as prevalence studies, risk behavior surveys, issue research), and an average of 1.5% was spent on program evaluation.
• When asked “What is your state’s largest gap in problem gambling services?” nearly 60% of respondents indicated a lack of adequate funding, followed by a lack of public awareness of problem gambling, and a lack of treatment options for problem gamblers.
• When asked, “What is your state’s greatest obstacle in meeting service needs to address problem gambling?” 40% of APGSA Survey respondents and 58% of NCPG Affiliate respondents chose “inadequate funding”—the most commonly endorsed response.
• State problem gambling service funding levels were significantly associated with: gaming revenue produced within a state; the number of legalized types of gambling; the estimated number of adult problem gamblers within a state; and the number of problem gamblers treated.
• “Calls for help” to problem gambling helplines were significantly associated with: gaming revenue produced within a state; the number of legalized types of gambling within a state; and the estimated number of adult problem gamblers within a state.
• The only variable that was significantly associated with gambling treatment utilization was spending on problem gambling services as calculated by combining state agency problem gambling service budgets with unduplicated spending by NCPG Affiliates.
• The lack of a clear relationship between the number of persons calling gambling helplines and receiving subsidized gambling treatment points to a central issue discussed throughout this report: there is a great level of disparity between states in terms of problem gambling service investment and problem gambling treatment infrastructure.
1 Based on an estimated past year pathological gambling prevalence rate of 2.2 % (Williams, Volberg & Stevens, 2012) and the 2013 U.S. adult (age 18+) population estimate of 262,070,808 (U.S. Census, 2013).
x

2013 National Survey of Problem Gambling Services
Although gambling has been a part of the fabric of life in America since its inception, widespread efforts to mitigate gambling related harm have been slow to develop. Facing a void in services to help problem gamblers, in 1957 a grassroots effort resulted in the first Gamblers Anonymous meeting. Following the launch of the first modern government-run U.S. lotteries in the 1960s, the National Council on Problem Gambling (NCPG) was founded in 1972 with a goal to educate the public and policy makers about problem gambling (Dunne, 1985). Due in part to the efforts of the NCPG, Maryland became the first state to recognize that “(1) compulsive gambling is a serious social problem; (2) availability of gambling increases the risk of becoming a compulsive gambler; and (3) Maryland with its extensive legalized gambling as an obligation to provide a program of treatment for those who become addicted to gambling . . .” (Compulsive Gambling Act of 1978). In 1981, Connecticut and New York were the next two states to pass legislation providing public funding for problem gambling services. As legalized gambling expanded throughout the U.S., so did the number of states that provided support for education, prevention, treatment, or research focusing on problem gambling. Today numerous states provide funding through legislative budget appropriation, and/or appropriations mandated in laws that were created when new types of legalized gambling were established, and/or by funds contributed by the gaming industry, including tribal gaming. With the exception of sporadic efforts by the U.S. Department of Veterans Affairs and the U.S. Substance Abuse and Mental Health Services Administration, there has been a lack of federal spending on problem gambling treatment or prevention efforts. In the absence of a federal agency designated to fund and guide programs and policies addressing problem gambling, individual state efforts have emerged that are often very divergent from one another in terms of funding levels, types of services, and administrative structure. In an effort to help state governments facilitate an informed and unified voice for the development of publicly funded problem gambling services, the Association of Problem Gambling Service Administrators (APGSA) was formed in 2000. Central to the APGSA mission “to support the development of services that will reduce the impact of problem gambling,” the APGSA has sponsored three studies designed to survey state agencies from all U.S. states. These surveys provided a national picture of state-funded efforts to address problem gambling and documented state-by-state programs and key contacts. The first survey was conducted in 2006, the second in 2008, the third in 2010. With this report, APGSA aims to expand that understanding by updating information from the three prior surveys with information gathered
INTRODUCTION
1

in 2013 and partnering with the NCPG to capture information on problem gambling services delivered by non-governmental organizations affiliated with the NCPG. The National Council on Problem Gambling (NCPG) is a private non-profit organization whose mission is “to increase public awareness of pathological gambling, ensure the widespread availability of treatment for problem gamblers and their families, and to encourage research and programs for prevention and education.” Like the APGSA, the NCPG does not take a philosophical position for or against legalized gambling. The NCPG spearheads efforts to address problem gambling at the national level while state level efforts are primarily delegated to NCPG affiliate members. Each state is limited to having one affiliate membership to the NCPG. NCPG affiliate members are also known as NCPG Affiliate Chapters and in this report will be referred to as “Affiliates.” Each Affiliate is a non-profit organization whose mission reflects that of the NCPG.
2

This report presents tabular information and highlights from the 2013 National Survey of Problem Gambling Services conducted between February and July 2013. It is the 4th in a series of APGSA supported national surveys begun in 2006, and the first to be co-sponsored by the National Council on Problem Gambling. With the additional support of the NCPG, the survey universe was expanded from prior years to include information from state Affiliates to the NCPG. This expansion allowed investigators to administer two national surveys: (a) one designed to collect data from 50 U.S. states and the District of Columbia on the amount of public funds directed at problem gambling services, types of services funded, establishing legislation, administrative structure, contact information, and needs assessment; and (b) a survey of all of the NCPG Affiliates that contained the same areas of inquiry. The combined information from these surveys provided a more complete national picture of problem gambling services offered in each U.S. state, and the District of Columbia, funded by public funds designated for problem gambling services and private funds collected by NCPG Affiliates. The surveys provided the mechanism for quantifying the composition of publicly and privately funded U.S. problem gambling service delivery systems. The objectives were to collect multi-purpose data that can be used to:
• Assist Federal and State governments in assessing the nature and extent of problem gambling treatment, prevention, and research services provided in state-supported systems;
• Analyze problem gambling services trends and conduct comparative analyses for the nation, regions, and states;
• Generate an APGSA National Directory of Problem Gambling Service Administrators, a listing of state officials and state appointed designees, with oversight responsibility for publicly funded problem gambling service contracts;
• Describe problem gambling service efforts conducted by NCPG Affiliates and use this information to form a more complete picture of state by state problem gambling services;
• Explore for associations between state level variables of interest including estimated problem gambling prevalence, numbers of persons enrolled into state support treatment, problem gambling helpline call volume, estimated gaming revenues, and total funding investment into problem gambling services.
Data Collection Procedures Field period and survey universe
The APGSA Survey was fielded between February 2013 and July 2013; the NCPG Affiliate Survey was fielded from April 2013 through July 2013. As data collection procedures differed slightly between these surveys, the procedures will be described separately.
SURVEY METHODOLOGY
3

APGSA Survey
The APGSA Survey universe included information from all 50 U.S. states and the District of Columbia. Information collected was limited to publicly funded problem gambling services defined as states with a distinct fund for problem gambling services and/or states with an agency that by statute is directed to administer education, prevention, treatment, or research focused on problem gambling. Lottery administered responsible gaming programs, player research, and problem gambling awareness advertising were only included if the state lottery reported a distinct fund for problem gambling service expenditures or statutory language specifically requiring the administration of programs directed at “problem gambling,” “pathological gambling,” “gambling addiction,” or “compulsive gambling.” Efforts by other governments, such as tribal governments or local governments, were only included if their problem gambling service effort was specifically funded by a state agency with statutory authority to administer problem gambling programs. Efforts funded by private insurance programs or private pay was not captured in the APGSA Survey. Therefore, the survey universe parameters are restrictive and are not intended to capture the full scope of efforts to address problem gambling within the U.S. The APGSA Survey documents publicly funded problem gambling services, as previously defined, that took place during the 2013 fiscal year (for most states that period is July 1, 2012 through June 30, 2013) with two exceptions. Treatment utilization and helpline utilization were collected for the 2012 fiscal year in order to collect actual utilization counts for a full 12-month period. This method was chosen over projecting fiscal year 2013 treatment and helpline utilization by annualizing available data due to concerns related to seasonal variations in help seeking. NCPG Affiliate Survey
The NCPG Affiliate Survey universe included information from every active state Affiliate to the NCPG (N=34). The NCPG Affiliate Survey utilized the same point in time references as those used in the APGSA Survey. Content The APGSA Survey was constructed to closely follow the content areas of prior APGSA surveys to allow for comparisons across survey time periods. The exception was the addition of a new survey section designed to collect information about each state’s gaming environment including types of legalized gambling, number of casinos, and gross gaming revenue. The NCPG Affiliate Survey was constructed similarly to the APGSA Survey, using several of the same content areas. APGSA Survey
The survey questionnaire was a 16-page document with 7 sections (see Appendix C). Section headings were:
A. Contact Information B. State Gaming Background C. Legislation D. Funding
4

E. Services Provided F. Administrative Structure G. Policy Issues
NCPG Affiliate Survey
The survey questionnaire was a 10-page document with 7 sections (see Appendix D). Section headings were:
A. Contact Information B. State Gaming Background C. Funding D. Services Provided E. Administrative Structure F. Policy Issues G. Advocacy
Data Collection Except where noted, the same data collection methods were utilized for the APGSA Survey and the NCPG Affiliate Survey. APGSA Survey
Three primary data collection modes were employed: web based data collection, survey questionnaires sent by email, and structured interviews. The first phase of the data collection consisted of identifying key informants, those with the best knowledge of their state’s problem gambling services. For the APGSA Survey, the key informants were primarily state government officials, often an agency director or program manager. For those states that outsourced the management of problem gambling services, interviews were conducted with both the state employee overseeing the service contract and a representative of the problem gambling service contractor. Contact information was obtained from the APGSA for its member states. For the non-APGSA member states and for those member states with outdated information, the Executive Director of the state affiliate to the NCPG (if present) was contacted to inquire about the presence of state funding for any problem gambling service and for assistance in identifying the most appropriate person to complete the APGSA Survey. Additionally, an Internet search was conducted on all states to review Internet accessible documents including state rules, regulations, and statutes pertaining to problem gambling services. In many cases, it was difficult to ascertain the appropriate individual to complete the survey and for some states more than one agency administered problem gambling services which necessitated collecting surveys from multiple individuals then collapsing the information into one state survey data set. For states identified as using public funds to specifically support problem gambling prevention or treatment programs, an introductory email was sent to the identified contact person(s) by the APGSA President. This was followed by separate emails from the research group that included a survey questionnaire attachment. In most cases the identified contact(s) were state employees with
5
management responsibilities over state-funded problem gambling services. For surveys not received back from the identified contact, follow-up emails and phone calls were made each week the survey was in the field. During the follow-up contacts, offers were extended to complete the survey over the phone. On several occasions the individual originally identified as the contact person designated a different individual to complete the survey or to complete sections of the survey. For those states where a representative was either not identified or failed to respond by the 12th week the survey was in the field, the research team completed the survey as completely as possible from government documents and official reports obtained from the Internet. The described multi-method data collection procedure resulted in survey information collected from all 50 states and the District of Columbia. One state (South Dakota) declined to complete the APGSA Survey and declined interview invitations. For this state, the research team obtained information from third party sources (contractors of state services) and from public documents obtained through Internet searches. For another state, South Carolina, the key informant completed the APGSA Survey but declined to participate in the survey review interview. NCPG Affiliate Survey
The NCPG Affiliate Survey was fielded four weeks after the APGSA Survey. Contact information for each NCPG Affiliate was provided to the research team from the NCPG. An introductory email was sent to the executive director of each NCPG Affiliate by the Executive Director of the NCPG. This was followed by separate emails from the research group that included the NCPG Affiliate Survey tool. For surveys not received back from the identified contact, follow-up emails and phone calls were made each week the survey was in the field. During the follow-up contacts, offers were extended to complete the survey over the phone. Every active state Affiliate to the NCPG participated in the survey. At the time of the survey, all but one NCPG Affiliate had an active board. The one inactive NCPG Affiliate was Arizona. Secondary Data Collection
In addition to the surveys and interviews, the research team obtained data that would help to verify key informant reports or fill in missing survey information. In the process of conducting the surveys it became apparent that few key informants were able to complete the survey section on “state gaming background.” Therefore, information on number of slot machines, types of legalized gambling, and gaming revenues were calculated based on combining information from the following reports: : (a) 2013 American Gaming Association Survey of Casino Entertainment; (b) the 2013 Edition of the Casino City's Indian Gaming Industry Report; and (c) the 2012 North America State and Provincial Lotteries Sales and Profits Report. Secondary data was also exclusively used when reporting on a state’s estimated number of problem gamblers by using the 2012 U.S. Census Bureau estimate of persons over age 18 and findings from the state’s most recent adult problem gambling prevalence study converted into a standardized past year problem gambling rate by Williams, Volberg, & Stevens, (2012). For those states that had not conducted a problem gambling prevalence study, the average standardized adult past year prevalence rate across all U.S. states was used (2.2%) as calculated by Williams, Volberg, & Stevens (2012).
6

Quality Assurance
Experience in the 2006 and 2008 APGSA Surveys suggested that there were several quality assurance issues that needed to be addressed. The foremost problem was the observation that survey responders commonly interpret questions differently from one another. Researchers also observed instances where information about a particular item, from the same state, differed across sources. Additionally, it was not uncommon for responses to be more complex than the given response set, for example, some respondents answered “sometime” or “that depends” to questions prompting a “yes/no” response. To address the above data issues, beginning with the 2010 APGSA Survey and carrying forward to the present survey, after completed surveys were obtained by the research team, the survey respondent was scheduled for a 60 minute phone interview with a research team member. During the interview, the completed survey was reviewed with the key informant to verify and clarify information obtained during the earlier stages of the data collection process. With the addition of the NCPG Affiliate Survey, an additional quality assurance measure was implemented. The NCPG Affiliate Survey incorporated several items used in the APGSA Survey. By asking key informants similar questions, the researchers were able to collaborate on item-by-item reports. As the NCPG Affiliate Survey was fielded after the APGSA Survey, when NCPG Affiliate Surveys were collected the responses were compared to responses from the corresponding state’s APGSA Survey responses. During the phone interviews with the NCPG Affiliate respondent, on those items where informant reports differed, clarification was sought. Original survey item responses were changed as needed and/or additional detail was added. Survey review interviews were completed with all NCPG Affiliate Survey respondents and 37 APGSA Survey respondents. As noted above, two APGSA Survey key informants declined to participate in the survey review interview and the remaining states that did not receive a survey review interview were states that did not provide publicly funded problem gambling services. Statistical Methodology
This study utilized statistical methods to explore for associations between several variables of interest. All computations were conducted using the software program STATA (Version 12). The majority of the tests explored the strength and the direction of associations between variables utilizing pairwise correlations and scatterplots. Other tests incorporated the use of linear regression analysis, one-way ANOVAs and t-tests. For a full description of which statistical methods were employed when testing for associations between specific variables, see the section on “Associations between Variables of Interest: Statistical Explorations”. For all the inferential tests and resultant findings, it is important to note that a statistically significant correlation between two variables does not mean a causal relationship exists.
7

Limitations A number of limitations must be taken into account when interpreting data from the 2013 National Problem Gambling Services Survey. Some general issues are listed below and other considerations of specific topics are discussed where the findings are presented. Although this survey represents the most comprehensive collection of information on problem gambling services in the United States, information gathered is from the limited universe of services funded by state agencies with legislated or line-itemed budgets identified for use in reducing gambling related harm and from efforts by state Affiliates to the NCPG. Problem gambling services provided by tribal governments, privately funded entities such as health insurers, and community organizations such as Gamblers Anonymous, are not collected in this survey. This is a point-in-time survey. It provides information on the problem gambling service system and its clients on the referenced dates. The survey provides a snapshot of the publicly funded problem gambling service field and the services of NCPG Affiliates. On a state-by-state basis, these service fields have, on occasion, experienced dramatic fluctuations in funding and service provision. The accuracy of the data reported relies on the data sources. In some instances, key informant data was corroborated through other informants or information found within the public domain. However, for some state specific variables, data was collected from a single individual and was not able to be confirmed or validated using any other data sources. Even the most diligent survey respondents may not be fully informed and report data that is not complete and otherwise not accurate.
8

For the first time in the series of National Problem Gambling Services Survey Reports, information was collected on each state’s legalized gambling environment. Both the APGSA Survey and the NCPG Affiliate Survey included a section entitled “State Gaming Background” to collect information on types of legalized gambling, number of electronic gaming machines, and gaming revenues. During the data review and verification process, it became apparent that many respondents were unable to collect this information and/or provided information that conflicted with other data sources. To improve the reliability of the information within this report, APGSA Survey and NCPG Affiliate Survey data was not used as the source for the data on state level gaming. Rather, information on number of slot machines, types of legalized gambling, and gross gaming revenues and Lottery sales were calculated based on combining information from the following reports: (a) 2013 American Gaming Association Survey of Casino Entertainment; (b) the 2013 Edition of the Casino City's Indian Gaming Industry Report; and (c) the 2012 North America State and Provincial Lotteries Sales and Profits Report. When comparing figures between these three forms of gambling, it is important to note that lottery figures represent sales whereas Indian and commercial casino figures are reported as gross gaming revenue (GGR) as calculated by sales minus prize pay outs. Lotteries do not report GGR and information obtained from the North American State and Provincial Lotteries (2012) was missing electronic gaming machines (EGMs) prize reports from five of the eight states that offer EGMs. It is also important to note that the analysis of consumer spending on gambling, as provided in this report, represents the three largest segments of the U.S. gaming industry (lotteries, Indian gaming, commercial casino gaming) but does not include sales or revenue information from other forms of gambling that may be legal within a state such as pari-mutuel wagering, card rooms, charitable gaming, and social gaming. Another limitation of the data used in our analysis of state gaming revenue is the reporting period used by the aforementioned three source reports. At the time the data in this report was analyzed (July 2013), the source reports used represented the most recent 12-month period of data available on lottery sales (July 1, 2011 to June 30, 2012), commercial casino revenue (January 1, 2012 to December 31, 2012), and Indian gaming revenue (January 1, 2011 to December 31, 2011). As state gaming markets can experience significant changes on a year-to-year basis, the revenue data presented below in Figure 1 should be viewed as an approximation of the relative size of the gaming industry within a state rather than as a proxy for a state’s total GGR. State Lotteries
Fiscal year 2012 was a record year in the United States lottery industry, as 32 of the 44 U.S. lotteries reported an increase in sales for the year. Overall, total sales of traditional (non-casino) lottery games reached $60.8 billion, an increase of 8.7% over fiscal year 2012. Including casino gaming products (video lottery terminals/slot machines and table games) operated by some lotteries, total sales surpassed $70.6 billion in fiscal 2012, an increase of 8.9% over the previous year. The states that experienced the largest sales increases for fiscal year 2012 were the California Lottery (27.1%), the
LEGALIZED GAMBLING IN THE UNITED STATES
9

Idaho Lottery (19.5%), and the Illinois Lottery (17.6%). The five states with the largest sales during fiscal year 2012 were New York ($8.4 billion), Massachusetts ($4.7 billion), Florida ($4.4 billion), California ($4.4 billion), and Texas ($4.2 billion). See Figure 1 for lottery sales by state. Commercial Casino Gaming
In calendar year 2012, U.S. casinos earned $37.3 billion in gross gaming revenue, a 4.8% increase from 2011. It was the highest since 2007, when gambling brought in a record $37.5 billion, according to the American Gaming Association. Overall, 15 of 22 states with commercial casinos saw gambling revenues increase, led by Kansas (604% increase), Maryland (143%), Maine (67%), and New York (43%), each of which opened new casinos in 2012 or had their first full year of a new casino. Ohio became the 23rd state with a commercial casino in 2012. Despite adding a 12th casino, New Jersey recorded the largest decline in casino revenue (8%), but may experience a rebound with the recent legalization of Internet gambling. Delaware saw its casino revenue fall 4.7% and also responded with legalizing Internet gambling. Indian Gaming
At the time this report was written, the 2013 Edition of the Casino City's Indian Gaming Industry Report contained the most comprehensive data on Indian gaming (Meister, 2013). Meister’s (2013) report presented data and analyses for calendar year 2011, the most recent year for which data were available. In 2011, Indian gaming sustained modest growth to bring it above its pre-recession gaming revenue level, approximately $27.4 billion. In 2011, Meister reported that approximately 65% of Indian gaming facilities experienced growth in gaming revenue, while about 35% experienced declines. At the state level, Indian gaming revenue growth varied from 26% increase in Alabama to -3% in New York. The fastest-growing states after Alabama were Mississippi, Montana, North Carolina, and Oklahoma. The fastest-declining states after New York were Oregon, North Dakota, Connecticut, and Idaho.
10

Figure 1. Consumer Spending by State: Fiscal Year 2012 Lottery Sales, 2012 Casino Revenue, 2011
Tribal Gaming Revenue
Summary
The U.S. gaming market appears to have rebounded from the great recession, in part due to expanded gambling in several cash-strapped states that turned to gambling revenues to boost state coffers. The primary reason for collecting information about state gambling environments in this national survey of problem gambling services was to use that data to explore for relationships between a state’s gambling environment, funding for problem gambling services, and utilization of problem gambling services. In the section of this report entitled “Statistical Explorations of Survey Data” the relationships between a state’s gaming revenues, number of slot machines, and number of legalized forms of gambling with problem gambling service performance indications are presented.
11

Public Funding
The APGSA Survey assessed all 50 U.S. states and the District of Columbia to determine which states and districts funded problem gambling services. The total number of states and districts that reported publicly funded problem gambling services in 2013 was 39, or 78% of U.S. states. In order to be counted as a state with publicly funded problem gambling services, a state or district had to meet one of two conditions: 1) program monies were legislatively authorized—outlined in a statute or regulations as directed toward mitigating gambling-related harm; or 2) the state agency had a dedicated budget line to address problem gambling. Although all APGSA Surveys used the same inclusion criteria for designation as a state with publicly funded problem gambling services, the 2008 survey employed a less rigorous approach in identifying which states met this inclusion criteria, which is important to keep in mind when comparing public funding information between the four surveys. The 2006 APGSA Survey identified 35 states with publicly funded problem gambling services, the 2008 survey reported on 30 states, the 2010 survey identified 37 states, and the current survey found that 39 states invested in publicly funded problem gambling services in 2013. State-specifc funding for problem gambling services ranged from Washington, D.C. and the 11 states that did not provide any dedicated funding for problem gambling services to $8.7 million in California. Although California and Pennsylvania ($8.3 million) both invested almost twice as many funds in problem gambling services as any other state, they are also the states with the largest and fifth largest populations respectively. Due to the wide variation in state populations, it is useful to view funding for services on a per capita basis to provide context for state-to-state budget differences. For those states that invested in problem gambling services, per capita allocations for problem gambling services ranged from $0.01 in Colorado to $1.42 in Delaware. The average amount of per capita allocation for problem gambling services in the 39 states with publicly funded services was 32 cents. When the 11 states without dedicated funding were included, the national average dropped to 25 cents per capita, and then to 24 cents per capita if Washington, D.C. was included. California’s per capita allocation (23 cents) was well below the 32 cent average among states with public funding for problem gambling services, despite its spending more money overall than any other state. In contrast, Pennsylvania ranked second in overall funding level and fifth in per capita funding at 65 cents per person. See Figure 2 for a state-by-state comparison of per capita allocations for problem gambling services.
FUNDING FOR PROBLEM GAMBLING SERVICES
12

Figure 2. 2013 Per Capita Allocation for Problem Gambling Services by U.S. States
Note: Includes only funds line itemed for problem gambling services and passing through a state agency. Missing states do not fund problem gambling services through legislative actions or utilize state agency budgets line itemed for problem gambling services. U.S. average is based on all 50 states, including the 11 states without public funding but not including Washington, D.C.
Figure 3, below, provides a state-by-state comparison of per capita investment in problem gambling services in 2010 and 2013. The average per capita funding level across all states with public funding dropped slightly between 2010 and 2013 from 34 cents to 32 cents per capita. Individually, a nearly equal number of states reported decreased funding (n=20) as those that reported funding increases (n=19) since the 2010 Survey. Included in those states that reported funding increases were Georgia, Maryland, and Ohio, three states that began allocating state money for responsible gambling programs after the 2010 APGSA Survey; budget allocations in all three states fell on the low end of per capita state spending in 2013. Among the states that provided public funding in both 2010 and 2013, Pennsylvania showed by far the greatest change in per capita allocation for problem gambling services between the two survey periods, more than tripling its investment from 21 cents to 65 cents per capita.
13

Figure 3. Comparison between 2010 and 2013: Per Capita Allocation on Problem Gambling Services
Note: Includes only funds line itemed for problem gambling services and passing through a state agency.
NCPG Affiliates
The 2013 APGSA Survey was the first survey in the series to include funding data from state affiliates to the National Council on Problem Gambling (NCPG). At the time this survey was conducted, there were 34 states with active NCPG Affiliate Chapters. As with public funding, a state-by-state analysis revealed wide variation between per capita allocation of public and private funds routed through NCPG Affiliates for problem gambling services. NCPG Affiliate budgets were dramatically smaller than the state agency budgets in each state—including four states where Affiliates had no revenue in state fiscal year 2013 (Missouri, North Carolina, Rhode Island, and Texas). The average per capita budget among NCPG Affiliate was 12 cents, compared to the 32 cent average among state agency budgets. However, the NCPG average is misleading when taken at face value and requires a closer look. Delaware skewed the average with a reported per capita Affiliate budget of $1.42, over four times as much as New Mexico, the state Affiliate with the second highest per capita funding level. The median NCPG State Affiliate per capita budget was a mere four cents, and without Delaware the average dropped to eight cents. See Figure 4 for a state-by-state comparison of per capita investments among NCPG State Affiliates in 2013.
14

Figure 4. 2013 Per Capita NCPG State Affiliate Budget
Note: Four Affiliates operated without any FY13 revenue (MO, NC, RI, TX).
Finally, combining the data from the APGSA and NCPG Surveys provided a more comprehensive picture of funding for problem gambling services across states. To avoid overlap and create a more accurate account, the combined analysis subtracted from state affiliate budgets all monies that came from state agencies so they were only counted once in the state agency budgets. A state-by-state comparison of these combined totals showed a range from practically zero in Virginia to $1.42 per capita in Delaware. The Survey data clearly indicated that for most states the vast majority of funds for problem gambling services moved through state agencies rather than NCPG Affiliates. See Figure 5 for a state-by-state comparison of combined public and private per capita budget allocations for problem gambling services.
15

Figure 5. Combined 2013 Per Capita Problem Gambling Services Allocation by U.S. States and NCPG State Affiliates
Note: NCPG Affiliate spending (in red) represents all funds except those derived through contracts with state agencies.
NCPG State Affiliate private funds are primarily derived from donations from gaming industry, with most of those from Indian gaming casinos.
While combining the data in this way created a more complete picture of state funding, it is important to note that there were other monies going toward problem gambling services that were left out of the current study. The APGSA and NCPG Surveys did not capture money for problem gambling services that did not route through either a state agency or an NCPG Affiliate. For example, they did not account for funding for services through private insurance, private gambling companies, or American Indian tribes. However, this approach captured the majority of the funding that routed through state agencies, usually from gaming revenue, and through Affiliates, primarily through charitable donors from the broader gaming industry (e.g., Indian gaming, gaming device manufacturers). To understand overall trends in spending on services across the United States, it was useful to compare annual aggregate budgets for problem gambling services. The data showed a clear upward investment trend from 2006 to 2010 that continued through 2013, although at a substantially lower rate. Total investment increased from $58.4 million in 2010 to $60.6 million in 2013, a 3.7% increase over three years compared to 16% growth in aggregate spending between the 2008 and 2010 APGSA Surveys. See Figure 6 for observed changes in the annual aggregate amount of state expenditures dedicated for problem gambling services in the United States.
16

Figure 6. Annual Aggregate of U.S. State Spending Dedicated for Problem Gambling Services
Note: Based on past four APGSA Surveys.
In order to gauge funding trends for NCPG Affiliates, the NCPG Affiliate survey asked informants to provide a retrospective account of their annual funding from the past three years. A different trend emerged from the NCPG Affiliate aggregate budget data compared to the pattern in aggregate state spending. Across all state Affiliates, funding dropped by about 18 % in one year, from $15.1 million in 2011 to $12.8 million in 2012. Fortunately, 2013 figures showed a return to near the 2011 level with an aggregate budget of $14.8 million (see Figure 7). Again, while this provided an idea of overall funding trends among Affiliates, a more detailed state-by-state account is provided in the per capita funding analysis depicted in Figure 5.
17

Figure 7. Annual Aggregate Budget of State Affiliates to the NCPG
Note: Based on 2013 NCPG Affiliate Survey responses.
Of the $60.6 million in total state investments in problem gambling services, less than half (37%) was directed toward treatment services. To put this number in perspective, it is useful to compare it to national spending on substance abuse treatment in the U.S. Total public funds invested in substance abuse treatment in the United States was an estimated $17 billion2 in 2009 (Substance Abuse and Mental Health Services Administration; SAMHSA, 2013), which was directed at an estimated 18.9 million people in the U.S. with a past year substance use disorder (SAMHSA, 2012). In a recent meta-analysis of problem gambling prevalence studies, Williams, Volberg, and Stevens (2012) found that approximately 5.8 million adults in the U.S., or roughly 2.2% of the adult population, had a past year gambling disorder. If these prevalence and spending estimates are accurate and generalize to current day rates then substance use disorders are about 3.6 times more common than gambling disorders, while public funding for substance abuse treatment is about 281 times greater than public funding for all problem gambling services, including research, workforce development, prevention, and treatment ($17 billion: $60.6 million). See Figure 8 for a comparison of prevalence and public spending between substance use disorders treatment and all problem gambling services in the United States.
2 This estimate includes costs of provider services, prescription drugs, and insurance administration related to alcohol- and illicit drug-related disorders. It does not include the indirect burden of substance use disorders, physical consequences of these disorders, or costs related to tobacco addiction.
18

Figure 8. Comparison of Prevalence and Public Funding for Substance Use Disorders and Gambling Disorders in the U.S.
1Substance Abuse and Mental Health Services Administration (2012). 2 Williams, Volberg, & Stevens (2012). 3Substance Abuse and Mental Health Services Administration (2013). 4APGSA & NCPG National Survey (2013). Excludes private insurance payments, client private payments, etc.
19

Across all states, there was a lack of uniformity regarding what types of problem gambling services were funded. Some states funded a comprehensive array of services ranging from prevention through multiple levels of treatment, while other states provided only one service (e.g., a problem gambling helpline or a prevention program). Among state agencies this variability in services provided was often rooted in the legislation that originally established the problem gambling program. Some states had legislation that restricted the use of funding to specific service areas. Another driving factor for what services were funded was linked to budget pragmatics such as having insufficient funds to expand the range of services offered. The range of services offered by the Affiliates was likewise affected by budget constraints; those Affiliates with larger budgets were generally able to offer a greater array of services. However, budget constraints were not the only factor determining which services Affiliates offered. Whereas statutes and regulations determined how public funds were allocated, NCPG Affiliates relied on governing boards to allocate their budgets based on the priorities outlined in the Affiliate’s mission statement. In general, Affiliates had less reliable funding sources than state agencies, requiring greater flexibility. As most NCPG Affiliate mission statements broadly speak to addressing problem gambling, prioritization of what types of services to offer were commonly based on filling service gaps. For example, a commonly provided service was raising awareness of problem gambling through free media and providing relevant information to policy makers. Often, an NCPG Affiliate was the only organization within a state to specifically advocate for problem gambling services or to be in a position to speak on behalf of problem gamblers and their families. In contrast, only about a quarter of the Affiliates provided treatment services, either because these services were offered elsewhere in the state or because there were insufficient resources available to the Affiliate. Another driving force determining which types of services Affiliates offered was opportunity; opportunity, for example, in the form of a grant awarded for specific services or in the form of volunteers—including board members—and the skill sets, relationships, time, and energy they could bring. Figure 9, below, provides information on the number of state agencies and NCPG State Affiliates that allocated resources toward specific problem gambling services in 2013. The most commonly supported services among state agencies were problem gambling helplines (87% of states with publicly funded problem gambling services), problem gambling awareness programs (85%), problem gambling treatment (82%), and problem gambling counselor training (79%). The most commonly supported services among NCPG Affiliates were problem gambling awareness programs (91% of State Affiliates), problem gambling counselor training (65%), problem gambling helplines (56%), and problem gambling prevention programs (53%). Six state agency survey responders and ten Affiliate responders reported providing “other” services; services that fell outside the service categories identified on the survey instrument. A qualitative
TYPES OF PROBLEM GAMBLING SERVICES FUNDED
20

analysis of the narrative descriptions of these “other” services revealed that responses varied widely and that while most were unique services, some were misclassified. For example, among state reports, two respondents listed workforce development in the “other” category. Among NCPG Affiliates most of the “other” responses were unique services; four respondents reported advocacy services as “other,” and two listed training for casino employees.
Figure 9. Number of State Agencies and NCPG Affiliates Allocating Funding for Specific Problem Gambling Services
Note: Data for state agencies include only funds line itemed for problem gambling services and passing through a state agency. Survey respondents were asked to provide a breakdown of their states’ problem gambling service budgets by service type. Figure 10, below, displays these results.3 By taking the “percent of total budget” information from each state and averaging this data we found that, on average, 37% of state problem gambling service budgets was used for treatment. This was followed by expenditures on prevention programs (14%), media or public awareness projects (13%), training or workforce development (11%), helpline services (11%), costs of administering the programs (7%), and evaluation and research expenses (3%). Among those states with funding in the “other” category, an average of 4% of the state budget fell into that category.
3 Stated “allocations by service category” are based on proportional averages as opposed to actual aggregate budget allocations. Utilizing the aggregate of actual spending levels across service areas would yield different results. For example, aggregate spending on treatment was reported to be $24 million, or 37% of the total authorized budget for all problem gambling services.
21

Figure 10. State Budget Allocations by Service Category in FY2013
Note: Includes only funds line itemed for problem gambling services and passing through a state agency.
There were a few notable differences between the distribution of funding for services in 2013 and 2010. The most obvious change since the 2010 Survey was the decrease in the proportion of state agency budgets invested in treatment programs. In all three previous Surveys, average state allocation for treatment services was about 50% of the total budget for problem gambling services. Between 2010 and 2013, that figure dropped to 37%. This shift did not appear to be a result of reductions in overall funding; as discussed in the above section on state funding, the aggregate budget across state agencies actually increased slightly from 2010 to 2013. Instead, it appeared that state agencies reorganized their budgets to dedicate a greater percentage of funding for problem gambling prevention, media, and helpline services in 2013. The greatest increase was in the average proportion invested in problem gambling prevention programs, which nearly doubled since the last survey period from 8% to 14% of state budgets. Another difference between the 2010 and 2013 survey periods was the emergence of a trend in how states distributed their funding. While there did not appear to be any pattern linking overall funding level with the service category that received the largest allocation in 2010, there did appear to be a relationship in the 2013 data. For example, the states with the most funding for problem gambling services tended to direct more money toward treatment than any other service category, while there was little consistency among those with the smallest budgets. Specifically, when we compared these
22

two groups we found that treatment services received the largest allocation in three of the five states with the highest funding levels, whereas among the five states with the least amount of funding none reported treatment as their top spending category. When viewing Figure 10, it is important to keep in mind that the state agency budget allocations for problem gambling services are presented as averages. That is, each state agency representative was asked to provide a percentage breakdown of their problem gambling service budget based on the categories presented in the pie chart (Figure 10); those percentages were first summed, then divided by the number of states providing this information (n= 36). As there are no federal mandates as to how problem gambling service funding is allocated and each state is different in terms of funding and administrative structure, there is considerable variation between states as to how designated problem gambling service funding is allocated. For example, on average, 11% of problem gambling service funds from all states were used for training or workforce development; however, the range on an individual state level was between 0% and 100%. Among NCPG State Affiliates, taking the average budget distribution for problem gambling services created a very different picture than we saw with the state agencies. See Figure 11, below, for the average NCPG Affiliate budget allocations by service category. We found that Affiliates tended to spend more on program administration costs than any other category, with an average of 29% of their budgets directed toward administration. This was followed by expenditures on training or workforce development (17%), prevention programs (14%), problem gambling treatment (11%), helpline services (9%), media or public awareness projects (9%), and evaluation and research expenses (3%). Ten Affiliates reported allocating funds for types of services that fell outside the categories identified in the Survey. On average, these ten Affiliates invested 7% of their budgets into other types of problem gambling services, and while descriptions of these services varied from state to state, the most commonly listed services were outreach and advocacy.
23

Figure 11. NCPG Affiliate Budget Allocations by Service Category in 2013
29 State Affiliates Reporting
Note: Includes only NCPG State Affiliates that had funding in 2013 and reported allocations. Affiliates in MO, NC, RI, and TX operated on a strictly volunteer basis and were without funding at the time of the survey. The MS Affiliate did not report.
When comparing budget allocations between NCPG Affiliates and state agencies there are two important considerations. First, on average, Affiliates reported allocating a larger portion of their budgets for administrative expenses than state agencies; however, this was most likely an artifact of a difference in service delivery structures between most state agencies and most NCPG Affiliates. The majority of the surveyed state agencies contracted out the delivery of services, whereas most NCPG Affiliates provided services directly. Second, it was not uncommon for the administrative staff of an NCPG Affiliate to also function as program staff by delivering training services, prevention services, and in some cases helpline and treatment services. Compared to state agency survey respondents, the NCPG Affiliate respondents reported much greater difficulty in completing the budget allocation section of the survey due to the discrepancy between the way their budgets were designed and the way the survey budget areas were segmented. For example, thirteen NCPG Affiliates (43% of those with budgets in 2013), had one paid staff member, and if that person viewed himself as primarily an administrator, then he may have allocated most or all of his salary expense toward administration even though he provided the majority of the Affiliate’s direct services. For these reasons, Figure 11 and other descriptions of NCPG Affiliate budget allocations by service category should be interpreted with caution.
24

The APGSA Survey included 11 questions related to administration of problem gambling services. These questions primarily asked about the agency with administrative authority over problem gambling services, the administrative structures for service provision, and the state employees who managed the problem gambling contracts (see Appendix C, Section F). The NCPG Affiliate Survey likewise included a section on “administrative structure” (see Appendix D, Section E). Within the Affiliate Survey, staffing information was collected, as was a narrative about how each NCPG Affiliate administered their services. Due to distinct differences between public service and private service administrative structures, the findings for the APGSA Survey and the NCPG Affiliate Survey will be reported separately. APGSA Survey Determining which state agency has administrative authority over publicly funded problem gambling services is often complicated by factors such as: (a) the absence of written state policies or legislation on the topic; (b) more than one state agency offering a service or program addressing problem gambling; (c) the absence of a state employee whose primary responsibility is to administer or oversee problem gambling services; and (d) the lack of uniformity across states as to which agency, if any, is assigned responsibility over problem gambling services. The present Survey found that the administrative authority over most state-funded problem gambling programs was an agency within the state’s department of health or human services (n=34). Exceptions include Arizona, where the Office of Problem Gambling was located within the Department of Gaming, Florida, where the Department of Business and Professional Regulation had budget authority for problem gambling services, and Rhode Island, where a small treatment allocation ($50,000) was routed directly to the state hospital. Some state agencies outsourced the administration of their state’s problem gambling programs (n=8), and some used state employees for the provision of clinical services in addition to managing multiple service contracts (n=4), though the large majority of state agencies managed multiple contracts to develop a delivery system for client services and did not use state employees for the provision of clinical services (n=27). There was considerable variability between states in the number of state employees assigned administrative responsibility, per their job description, for overseeing state-funded problem gambling services. The APGSA Survey asked, “Is the [top level state agency position who manages the problem gambling contracts] assigned 0.5 FTE or greater to problem gambling services?” Respondents were also asked to provide descriptions of all positions and Full-Time Equivalent (FTE) staff hours dedicated to administration of problem gambling services for all agency staff with problem gambling service duties in job description. Analysis of these responses revealed that among the 37 states offering publicly funded problem gambling services, the most common scenario was that problem gambling services were administered by one person who had multiple program responsibilities, only one of which was problem gambling services (n=12). It is important to note that several of the state agencies that dedicated less than 0.5 FTE staff hours towards problem gambling services did so without funding any portion of that position from a dedicated or specified budget for problem gambling services. In ten states that had publicly funded problem gambling service programs, there was no state employee specifically assigned to administer those programs.
ADMINISTRATIVE STRUCTURES
25

Only 15 states funded one or more full-time state employee positions dedicated to administering problem gambling programs. See Figure 12 for a further breakdown of FTE staff dedicated to problem gambling services (PGS).
Figure 12. Number of State FTE Positions Dedicated to PGS 37 States Reporting
Note: Includes only state employees, not contracted positions. South Dakota did not report.
Just as there was variability in the number of state employees assigned to administer problem gambling programs, there was also considerable variability in the proportion of problem gambling funds that states used to pay for the administrative costs related to managing those funds. For example, on average, 7% of problem gambling service funds were used for administrative expenses; however, the range was between 0% and 23%. Notably, for those states where problem gambling services were designated to a problem gambling specific office, unit, or project team (n=14), the average proportion of funds used for administrative purposes was over twice as high as the average among states where the problem gambling services were not assigned to a specific office, unit, or team (n=24). A similar relationship appeared when we compared the average FY2013 state budget for problem gambling services for those states with a designated problem gambling office, unit, or team ($2.3 million) with states that did not have a designated problem gambling office, unit, or team ($1.3 million). A possible explanation for these patterns is that problem gambling funding and administrative structures function in a feedback loop, where greater funding leads to more defined program administration structures, and more administrative resources specifically dedicated to problem
26

gambling programs lead to greater awareness of need, which in turn supports increased funding for these programs. NCPG Affiliates The NCPG Affiliate Survey asked respondents to provide information about all Affiliate staff positions, not limited to those in administrative positions. Responses revealed an extreme variability, where some had several paid employees to administer problem gambling programs, some relied solely on volunteers, and others had no employees but contracted out administrative services. Remarkably, among the 34 NCPG State Affiliates, over one-third operated with an all-volunteer staff and board and no paid positions in 2013 (n=12), with three of these Affiliates reporting that they contracted out some administrative services. Another third reported having between one and five full-time staff within their organizations (n=11), while eight (24%) reported having five or more full-time positions in 2013. 4 See Figure 13 for a further breakdown of Full-Time Equivalent (FTE) staff among NCPG Affiliate organizations.
Figure 13. Number of NCPG Affiliate FTE Positions Dedicated to PGS 34 Affiliates Reporting
Note: Includes only paid staff positions within Affiliate organizations; does not include contracted positions.
4 Only paid staff positions at Affiliate organizations were counted in the calculation of FTE positions; contracted positions were excluded.
27

Summary Findings Combining data from the APGSA and NCPG Surveys, we found that slightly less than half (45%) of the 50 U.S. states and the District of Columbia had anyone within the state whose full-time job was to administer problem gambling services: 13 states had no paid public employee or paid NCPG Affiliate staff dedicated to problem gambling services, 8 states had part-time positions totaling less than 1 FTE, while 28 states had 1 or more FTE positions dedicated to problem gambling services. While combining the data in this way provided a more complete picture of state-by-state resources invested toward addressing problem gambling, the parallel is not perfect: the APGSA data pertained only to positions responsible for administration of problem gambling programs whereas the NCPG data included all paid staff at state Affiliate organizations. What was clear was how few states were investing in administrative personnel to support problem gambling services and how much room there is for problem gambling service expansion in both the public and private sectors. Without adequate investment of administrative personnel to oversee the growth and development of problem gambling services, gambling-related harm will take its toll on the public’s physical, social, and economic health. Based on figures developed by the National Gambling Impact Study Commission in 1999, NCPG estimates the social cost of gambling addiction was $6 billion in 2013, mainly in gambling-related criminal justice and healthcare costs.
28

When states allocate funding for problem gambling services, a problem gambling helpline is often one of the first services established. In the 2013 survey, 39 states reported offering problem gambling helpline services, with 34 utilizing public funds designated to address problem gambling to support the service.5 Since 2010, the average proportion of state funding for problem gambling services allocated for helplines has increased from 7% to 12% in 2013. Among the 29 NCPG Affiliates reporting, an average of 10% of their 2013 budgets was dedicated to problem gambling helplines. In 12 states, NCPG Affiliates administered state-funded helpline services. In the four states where a problem gambling helpline was administered by Affiliates and not supported by state funds, funding typically came directly from the gaming industry, including tribal gaming operations. The NCPG administers the National Problem Gambling Helpline Network (NPGHN), which provides one nationwide toll-free number that links together 28 state and regional call centers to create a national helpline system. Centers receive a variety of public and private funding, and may also have or answer other national, regional or state helpline numbers for gambling and/or other issues. In states without their own problem gambling helpline services, the NPGHN provides coverage for problem gambling calls that originate there. Eleven states of the thirty-nine with funded helpline services reported utilizing the NPGHN national problem gambling number as the primary helpline number for the state (800-522-4700). NCPG pays for the Louisiana Association on Compulsive Gambling (LACG) to handle calls from Washington, DC and eight states that have no funding for helpline services in addition to having contracts with four other states and fielding calls from within Louisiana. In states where problem gambling treatment services were available, calls routed to an out-of-state call center were followed up with referrals to problem gambling counselors and treatment services within the state where the call originated. The survey identified 25 organizations that operated problem gambling helplines. Some of these organizations provided services to several states with the majority providing single state services. In spite of the NPGHN, many local jurisdictions and states promoted and operated independent helpline services, with the result being there were multiple problem gambling helpline numbers operating in the U.S. and it was not uncommon for more than one problem gambling helpline number to be marketed in the same state. All but one of the identified problem gambling helplines offered 24-hour service seven days a week. Most states (76%) offered helplines that operated exclusively as problem gambling helpline centers (i.e., stand-alone), and the other nine used helpline services that were embedded within broader helpline centers that also fielded calls related to other addictions or mental health issues. Only three states (8%) offered helpline services exclusively in English, while the large majority utilized
5 The five states that offer problem gambling helpline services that are not supported with designated public funds to address problem gambling are AL, KY, and NV, where NCPG affiliates pay for helplines and contract out the administration; MO, where the state funds and contracts out a PG helpline but does not use funds from a problem gambling service budget; and SD, where the state contracts out to Helpline Center, Inc., but details were not reported on the survey.
PROBLEM GAMBLING HELPLINES
29

additional language lines or translation services where communication between a non-English speaker and the helpline counselor passed through a translator. This represented a shift in helpline services since 2010, when a quarter of state-funded helplines were English-only. There was much variation in the credentials and training of helpline staff that answered calls placed to the various call centers. Individuals who answered helpline calls ranged from uncredentialed volunteers to masters level counseling professionals. The survey asked respondents to check one of six categories that best described helpline staff in their state’s primary helpline service: volunteers, certified gambling counselors, professional counselors not certified in problem gambling treatment, paid staff with no professional license or certification, a mix of certified and non-certified problem gambling counselors, or “other.” The majority of the helpline centers utilized paid staff with specialized training but did not require staff to be licensed or certified counselors. Figure 14, below, depicts the different types of helpline services offered along with the proportion of problem gambling helplines offering the ten defined services. Overall, survey results indicated a significant expansion in the types of services that helplines offered between 2010 and 2013, especially in the number of states providing web-based services. Providing information and referral services appeared to be universal among the helplines. The disparities between helpline offerings were among the non-traditional services such as follow-up services, where the helpline specialist called back the help seeker to see if they followed through with the referral or encountered any difficulty reaching the referred resource. Follow-up services also increased significantly from about 43% of helplines in 2010 to over half in 2013 that engaged in phone-backs. Six of the helplines offered counseling services, defined as providing problem gambling treatment through regularly scheduled phone or other electronic communication between a helpline counselor and identified client. Over a third of the helplines provided callers with self-change guides or informational packets on cognitive-behavioral approaches to self-regulate gambling behavior, either by email, physical mail, or by making these guides available on their websites. In 2010 less than 10% of helplines utilized web-based technologies (e.g., live chat services) to expand the number of access points or user options. In 2013, the proportion of helplines using web-based technologies was 18%.
30

Figure 14. Helpline Services
Note: For a service to be included it must be operationally standardized. Web = live online chat.
Figure 15, below, illustrates the relationship and variability between a helpline’s total call volume and the proportion of “calls for help,” defined as calls seeking help or information related to problem gambling. Not all states tracked call volume in this way; some only tracked calls for help and others only tracked total number of calls. Among the states that did provide information about both calls for help and total call volume, there was great variation between states, with an average of 14% of the calls to a problem gambling helpline being “calls for help” ranging from 5% to 73%.6 When APGSA survey respondents were asked in 2010 about the large volume of non-problem gambling related calls, respondents hypothesized callers often confused the problem gambling helpline with a general information line for gamblers as evidenced by the large number of calls inquiring about winning lottery numbers, casino meal and entertainment updates, etc. Some of this confusion appears related to the placement of the number on lottery tickets and casino marketing materials along with the use of a helpline acronym that does not clearly associate the number with problem gambling help. For example, states that used the 1-800-GAMBLER helpline number (New Jersey, California, West Virginia, Pennsylvania, and Illinois) received a larger proportion of non-help-seeking calls than states that used acronyms that more clearly identified the purpose of the line such as 1-800 BETS-OFF (Iowa).
6 Data were gathered from 2013 APGSA Survey, with two exceptions; NE and WA operate two separate gambling helplines that were reported separately on the NCPG Survey and the APGSA Survey. For these two states the helpline numbers from the NCPG affiliate were added to those from the other helplines.
31

Figure 15. Helpline Call Volume and Calls for Help
Note: On average, 14% of calls are for help, ranging from 5% (MI) to 73% (IA).
Figure 16, below, shows the relationship between the number of individuals seeking help by calling a state problem gambling helpline and the number entering problem gambling treatment programs funded by state agencies or NCPG affiliates. Twenty-six states reported both helpline data and treatment enrollment data. In total, over three times as many people called for help than enrolled in state funded or NCPG affiliate funded gambling treatment systems. The proportion of treatment enrollments compared to helpline calls varied widely between states. However, of these 28 states, all but four reported more calls for help to the state’s helpline than gambling treatment enrollments. Interestingly, the problem gambling treatment systems in Arizona, New Mexico, Oregon, and Nebraska saw more people enroll for treatment than called for help, demonstrating that there are many ways to access treatment and that greater gambling treatment enrollments may not be dependent on increasing calls to a state’s problem gambling helpline.
32
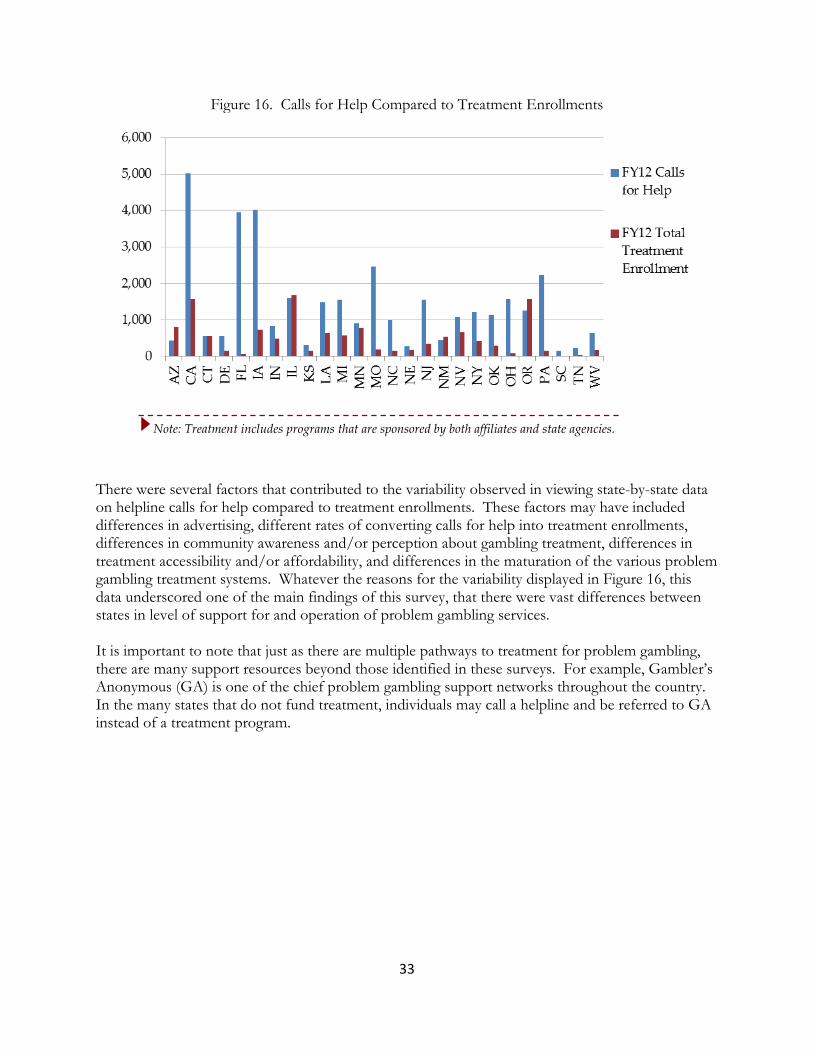
Figure 16. Calls for Help Compared to Treatment Enrollments
Note: Treatment includes programs that are sponsored by both affiliates and state agencies.
There were several factors that contributed to the variability observed in viewing state-by-state data on helpline calls for help compared to treatment enrollments. These factors may have included differences in advertising, different rates of converting calls for help into treatment enrollments, differences in community awareness and/or perception about gambling treatment, differences in treatment accessibility and/or affordability, and differences in the maturation of the various problem gambling treatment systems. Whatever the reasons for the variability displayed in Figure 16, this data underscored one of the main findings of this survey, that there were vast differences between states in level of support for and operation of problem gambling services. It is important to note that just as there are multiple pathways to treatment for problem gambling, there are many support resources beyond those identified in these surveys. For example, Gambler’s Anonymous (GA) is one of the chief problem gambling support networks throughout the country. In the many states that do not fund treatment, individuals may call a helpline and be referred to GA instead of a treatment program.
33

Numbers Treated Approximately 5.77 million pathological gamblers are estimated to need treatment each year.7 Of this number, 10,387 individuals were treated in U.S. state-funded problem gambling treatment programs in state fiscal year 2012. These figures suggest that state-funded treatment was provided to less than one quarter of one percent (0.18%) of those with a Gambling Disorder in 2012. For comparison purposes, in 2008, 23.1 million persons aged 12 or older needed treatment for an illicit drug or alcohol use problem (9.2% of persons aged 12 or older). Of these, 2.3 million (9.9% of those who needed treatment) received treatment at a specialty facility (SAMSHA, 2009) with the vast majority (77%) of treatment financed by public sources (Mark et al., 2007). These statistics suggest that on an annual basis, about 1 in 555 disordered gamblers obtain state funded treatment compared to 1 in 14 chemically dependent persons. Figure 17, below, provides a state-by-state breakdown of the number of consumers obtaining problem gambling treatment through NCPG Affiliates or state-funded programs. The vast majority of the services were provided on an outpatient basis. In the 12 states that offered publicly funded outpatient and residential treatment services and provided information on both, an average of about 10% of the treatment seeking population obtained residential treatment. As Figure 17 makes clear, there was wide variability in numbers treated between states.
7 Based on an estimated past year pathological gambling prevalence rate of 2.2 % (Williams, Volberg & Stevens, 2012) and the 2013 U.S. adult (age 18+) population estimate of 262,070,808 (U.S. Census, 2013).
TREATMENT SYSTEMS
34

Figure 17. Numbers Treated with Problem Gambling Funds SFY 2012
Note: MA provided publicly funded gambling treatment but declined to report numbers. WA Affiliate supported residential treatment (n=16).
Figure 18, below, demonstrates that there has been a dramatic shift in treatment enrollment trends since 2010. Survey informants were asked, “Over the past year, has the number of consumers receiving outpatient publicly funded gambling treatment increased, decreased, stayed the same?” In 2013 only a third of the states reported that the numbers treated increased, and a much larger portion mentioned that they actually decreased. By contrast, in 2010 these numbers were either staying the same or increasing in the majority of the states (93%). It is unclear what caused this change, but whatever the cause, it is unfortunate that the number of individuals treated is not increasing.
35

Figure 18. “Over the past year, has the number of consumers receiving outpatient publicly funded gambling treatment increased, decreased, stayed the same?” Response Comparison between 2010
Survey and 2013 Survey
Total enrollments 2010 = 10,930. Total enrollments 2013 = 10,387.
Levels of Care Utilizing the American Society of Addictions Medicine (ASAM) classification system defining levels of care, survey respondents were asked what type of problem gambling treatment services were offered in their state during fiscal year 2013. The five broad ASAM levels of care are: Level 0.5, Early Intervention; Level I, Outpatient Treatment; Level II, Intensive Outpatient/Partial Hospitalization; Level III, Residential/Inpatient Treatment; and Level IV, Medically-Managed Intensive Inpatient Treatment. Level 0.5, what we termed “minimal intervention,” referred to a structured program that included psycho-education and assessment and typically included some telephone counseling and/or distribution of a gambling self-change guide. Level I was defined as a treatment program structured to provide less than 9 hours of counseling per week. Level II, intensive outpatient treatment (IOP), was defined as structured interventions involving at least 9 hours per week of outpatient counseling either in a group, individual, or family/couples format. What we termed “residential” corresponded to ASAM Level III treatment, and Level IV inpatient treatment is differentiated from Level III by virtue of treatment occurring within a medically managed facility, commonly a psychiatric crisis center. Figure 19, below, depicts the percentage of states with publicly funded problem gambling treatment that offered each level of care. Of the 32 states that reported offering treatment, nearly all offered Level I outpatient services, while the other levels were offered much less frequently. The number of residential and intensive outpatient services has increased over the years in terms of the proportion of states offering those levels of care. Survey results indicated wider ranges of treatment services and treatment intensity being offered in various states than in the past. Fourteen states offered
36

problem gambling IOP services, 19 states offered minimal interventions, 12 states offered residential problem gambling programs, and none reported offering medically based inpatient care specifically for problem gamblers. We found significant expansion in the types of services offered between 2010 and 2013. For Levels .05 through III, the proportion of states offering each level had increased, most dramatically Level .05, minimal intervention, with almost double the proportion of states offering that type of outpatient treatment compared to 2010 reports.
Figure 19. Levels of Care Offered
Note: Includes only those states offering publicly funded gambling treatment and reported on levels of care (N = 29).
Who Provides Treatment States were asked if contracts for problem gambling treatment were awarded to state licensed or certified behavioral health agencies, to qualified individuals, or both. The majority of states (55%) contracted only with agencies, 39% contracted with both agencies and individual providers, and only two states (6%) contracted only with individuals. Reports indicated a shift away from contracting only with individual providers (17% of states in 2010) toward contracting with both agencies and individuals (30% of states in 2010). Survey respondents were also asked if their states required treatment providers to be Certified Problem Gambling Counselors (CPGC), and sixteen indicated that holding a CPGC was a requirement in their state (44% of those who provided information). In the states that did not require special certification, there were other qualifying factors such as special training, education, or supervision.
37

Reimbursement Rates In addition to shedding light on trends in problem gambling service provision in the U.S., one of the primary purposes of the survey is to provide program administrators with data to help them make informed decisions. This information can give them a sense for what other states are doing, data on national averages, and how they might go about designing and implementing problem gambling programs within their own states. One of the challenges that administrators face in setting up gambling treatment programs is deciding how much to reimburse treatment providers. As illustrated in Figure 20, below, reimbursement rates for outpatient treatment varied considerably across states and types of service. For assessments, some states reimbursed $40 an hour, others up to $170 an hour; reimbursement for individual counseling ranged from $20 an hour to $100 an hour; and group counseling was reimbursed at rates between $8 and $50 per client per hour or session. Not only did reimbursement rates differ between states, reimbursement methods differed as well. For this reason, reimbursement rates depicted in Figure 20 are not as straightforward as they appear. For example, within the assessments category, five states reported their rate as a flat fee per assessment irrespective of time spent (Arizona, Nebraska, Nevada, New Jersey, and Washington), while most reported an hourly reimbursement rate. Another reimbursement variation was observed in Minnesota, where reimbursement rates differed depending on individual providers’ credentials (the rate displayed below is the average provider reimbursement in the state).
38

Figure 20. Reimbursement Rates for State-Funded Treatment: Fiscal Year 2013
Note: Group rates are per client hour/session except for DE where rates are per counselor hour and NJ where rates are per group. Average group rate excludes DE and NJ. Assessment rates are per hour except in the following states where it is per event: AZ, IA, KS, NE, NV, and WA. MN reimbursement rates differ by provider qualifications; the above is the average reimbursement for MN providers.
Problem Gambling Treatment Eligibility and Cost Containment The survey also functions to provide administrators with information about what other states are doing to contain costs and stretch funding for services. This information can help to inform policy decisions in cases of budget contractions or inadequate funding to meet demand. Compared to spending on substance related addictive disorders, states invested relatively little in publicly funded gambling disorder treatment. The national average was $0.165 per capita, exactly the same as in 2010. For those states that provided public funding for problem gambling treatment and were insufficiently funded, a variety of methods were employed to stretch available funds in order to provide services to the greatest number of individuals. This survey collected information on client eligibility, client co-pay structures, and treatment parameters. The survey was not constructed to specifically probe for background information on service structure although during interview discussion it was observed that some service structure policies were written into the enabling legislation while others were established at the discretion of the agency administering the problem gambling programs.
39

A few of the common cost containment measures across states included implementing a session cap or a duration cap on funded treatment for problem gambling. Almost all private insurance companies that cover problem gambling treatment have caps on number of sessions, duration, or cost of treatment. In over 30% of states with publicly funded treatment programs, providers were not allowed to collect co-pays or any money from their clients for state-funded treatment. Figure 21, below, depicts a variety of conditions placed upon problem gambling treatment systems that may be thought of as cost containment measures. The first two categories listed relate to client eligibility. Sixty-five percent of state problem gambling treatment systems required that individuals covered under the problem gambling funds have a primary diagnosis related to problem gambling. This eligibility requirement typically included sub-clinical problem gamblers and concerned others such as family members. Only 21% of states required that the person receiving subsidized service have a primary diagnosis of pathological gambling (which by default excludes treatment of concerned others and sub-clinical problem gamblers). Most states allowed client co-pays, although there was considerable variablity in policies or conditions related to the co-pays. Less than a third of the states placed session or duration caps on services. This finding was interesting because in today’s age of managed care there are few other publicly funded behavioral health treatment systems that do not impose session limits or treatment duration limits. Since 2010, the proportions of states using the five defined cost containment measures have changed, with dramatic decreases in the number of states using duration caps, session caps, and the requirement of a primary diagnosis related to problem gambling. Duration caps were implemented in only 3% of states, compared to about 38% in 2010. One in four states used session caps, whereas about 48% of states did in 2010. The proportion of states requiring clients to have primary diagnoses related to problem gambling also decreased between 2010 (80%) and 2013 (65%). None of the five measures saw an increase in percentage of states that implemented them, indicating that fewer states used any of the defined measures to contain treatment costs in 2013.
40

Figure 21. Cost Containment Measures
Note: 2013 Survey of State Agencies Providing Problem Gambling Services; Duration Cap includes only those
states that reported maximum treatment duration of less than one year.
41

NCPG Affiliates The majority of NCPG Affiliates primarily support problem gamblers and their families through advocacy, awareness building, and providing linkages to community help resources. In 2013, nine of the NCPG Affiliate organizations also served problem gamblers and their families by directly providing or funding treatment services. These efforts resulted in 2,901 individuals being treated by NCPG Affiliate organizations. For four of the NCPG Affiliates that provided treatment, those services were not funded through a contract with a state agency (MT, NM, FL, WA). Two others were contracted to provide or administer treatment services through contract revenues from a state agency (NJ & DE) and the remaining provided treatment services that were partially funded through a contract with a state agency (LA, OK, NE). In the case of OK and NE Affiliates, they were not contracted by the state to provide treatment services, however, they obtained revenues from the state that may have contributed to their ability to offer treatment. See Figure 22.
Figure 22. Numbers Treated by NCPG Affiliates
Of the nine NCPG Affiliates that provided treatment services, three reported the number of persons they treated increased over the previous year, three reported a decrease, and three reported the number of treatment cases stayed about the same. When reviewing the “comments” section of the treatment section of both the APGSA survey and the NCPG Affiliate survey, it was interesting to note that compared to the APGSA respondents that offered treatment services, the NCPG Affiliates were more likely to comment that they could have provided treatment services to many more if funding was available. For example, the New Jersey NCPG Affiliate commented: “We have utilized all money available for treatment, there are waiting lists, we have to place caps on providers. We believe we could easily double treatment services if funding was available.”
42

Another observation regarding the NCPG Affiliate comments to the treatment section of the survey was that in some cases the NCPG Affiliate stepped in to support treatment services as a last resort, that is when the person in need was unable to obtain services either through public programs or through private insurance. For those NCPG Affiliates not serving this role, the explanation is most likely due to a shortage of funding. As discussed in the funding section of this report, many of the NCPG Affiliates operated on shoestring budgets and were reliant on donations to maintain their operation. In conclusion, NCPG Affiliates provided treatment services to 2,901 individuals in state fiscal year 2012. While this number was small in relationship to estimated need, it was remarkable when compared to the 8,813 persons treated, during the same time period, by all publicly funded gambling treatment programs across the U.S. It was also remarkable to find three NCPG Affiliates able to offer treatment services at an average case cost of under $500 (MT, NJ, OK). Among the 15 publicly funded problem gambling treatment systems that provided average treatment cost data, only one state reported an average case cost of under $500 (RI) while nationally the average cost per client treatment episode was $1, 174, a figure that is itself remarkably low when compared to the $1,583 average cost of substance abuse treatment (Etner et al., 2006).
43

Research and evaluation are widely considered an integral component of a behavioral health service system. Systematically gathered and analyzed information can be crucial for justifying budget requests, guiding program spending, design, and implementation. Yet results of each of the past four National Problem Gambling Services Surveys indicate spending on research and evaluation systems has been very low. Among the states with publicly funded problem gambling services that reported 2013 budget allocation figures, an average of 1.6% of their budgets was spent on “research” (defined as prevalence studies, risk behavior surveys, issue research), and an average of just 1.5% was spent on program evaluation. These low rates of spending on research and evaluation may reflect pressures on service agencies to allocate funds for direct services rather than reflecting negative perceptions within these agencies about the value of research and evaluation. With critical direct service needs and few resources, state agencies appear to be finding little room in their budgets to support research and evaluation. Surveillance studies that monitor risk behaviors on an annual or bi-annual basis are coordinated at the federal level by the Center for Disease Control (CDC). The CDC oversees two national risk behavior surveys that are administered at the state level. The adult behavior survey is the Behavioral Risk Factor Surveillance System (BRFSS) and is administered annually. The youth behavior survey is the Youth Risk Behavior Surveys (YRBS) and is administered in odd numbered years. For these surveys, there are a number of standard questions, optional questions, and state added questions. Questions related to gambling behavior are not on the lists of standard or optional questions. Only three states—Oregon, Minnesota, and Washington—opted out of administering the YRBS in favor of using their own state youth behavior survey, and all included items on gambling behaviors. Of the states that utilized the YRBS in 2013, only Ohio, North Carolina, and Connecticut included gambling questions in their youth risk survey. However, 14 states responded “yes” to the question: “Does your state ask any gambling related question on youth risk behavior surveys other than the YRBS?” With regard to adult behavior surveys, 11 states reported asking gambling related questions in the Behavioral Risk Factor Surveillance System (BRFSS) survey, however, a search of the BRFSS database found only three states listed––Iowa, Michigan, and Pennsylvania.8 Additionally, Georgia reported asking gambling related questions on adult risk or health behavior surveys other than BRFSS. Other common forms of problem gambling related research are problem gambling specific prevalence surveys and gambling behavior surveys. In response to the question “Has your state funded a problem gambling prevalence survey?” only 7 states reported funding a prevalence survey within the past five years, 6 states reported funding more than one prevalence survey, and 18 reported funding a prevalence survey that was over five years old at the time of the survey, while 13 respondents reported that their state had not funded any problem gambling prevalence surveys.
8 https://www.ark.org/brfss_questions/default.aspx
RESEARCH & EVALUATION
44

NCPG Affiliates On average, NCPG Affiliates reported investing 1.3% of their budgets in research services and 2.2% of their budgets on program evaluation, roughly the same proportion of funding averaged across state agencies. The NCPG Survey did not ask questions about research and surveillance systems, as these tend to be more systematically implemented in coordination with state agencies, but Affiliates were asked to rate “improved research system” according to level of need on a scale ranging from 0 (no need) to 5 (critically needed). Among the 33 Affiliates that provided responses, the average rating was 3.45, slightly higher than “somewhat needed.” Like the state agency respondents, the NCPG Affiliate respondents generally understood and supported the need for research and program evaluation but viewed these service components as lower funding priorities than direct services. For many NCPG Affiliates, operating budgets were simply too low to afford specific expenditures for research and evaluation. As explained by some of the NCPG Affiliate respondents during interviews, when program evaluation did take place, it was often rolled into a service program budget and in many cases tabulated and reported on by administrative staff.
45

The majority of APGSA survey respondents were state employees in administrative positions and all had oversight responsibilities for managing all or part of their state’s funds allocated for problem gambling services. From this vantage point, they were considered expert observers and analysts of their state’s problem gambling services. Questions concerning policy issues have been an important part of all three previous APGSA surveys. This time we were able to ask NCPG Affiliates the same questions we asked state administrators and compare responses. Survey respondents were provided a list of seven potential gaps within a state-supported problem gambling system and asked to identify one item as their state’s “greatest obstacle in meeting service needs to address problem gambling.” While “inadequate funding” was most frequently identified as the largest gap, it was interesting that only 40% of respondents endorsed funding as the greatest issue when only 8% of states dedicated more than $1.00 per capita towards problem gambling services. Another interesting finding was that the proportion of states that listed funding as their biggest issue fell dramatically since 2010 when it was 59% of states. On the Affiliate side, 58% of survey respondents listed inadequate funding as their biggest obstacle. Figure 23, below, displays the results of this poll. The second most commonly endorsed service gap was a lack of public awareness. Several respondents stated that they attributed their state’s lower than expected treatment enrollments to a general lack of public awareness about problem gambling and problem gambling treatment availability.
Figure 23. Identified Gaps in Services Responses to the question: “What is you state’s largest gap in problem gambling services?”
Note: There were 32 APGSA responses (7 refusals), and 34 NCPG affiliate responses.
SERVICE GAPS & INFRASTRUCTURE NEEDS
46

Infrastructure Needs Survey respondents were also asked to rate elements of their state’s problem gambling service infrastructure according to their level of need on a five point scale ranging from “no need” (0) to “critically needed” (5). The infrastructure needs identified can be seen in Figure 24. Those responses most highly rated, in ascending order, were the needs to increase the number of treatment providers, improve research, increase the number of prevention providers, improve information management services, and increase the size of administrative staff. States and Affiliates were more similar in their responses than expected, likely reflecting the common issues they face.
Figure 24. Infrastructure Needs
0 = no need, 3 = somewhat needed, 5 = critically needed
47

One of the objectives of the 2013 National Problem Gambling Services Survey was to explore for associations between state level variables of interest, including estimated problem gambling prevalence, numbers of persons enrolled in state-supported treatment programs, problem gambling helpline call volume, estimated gaming revenues, and total funding invested in problem gambling services. Data on problem gambling services originated from key informant survey responses. Data on each state’s gaming environment were sourced from the 2013 American Gaming Association Survey of Casino Entertainment; the 2013 Edition of the Casino City's Indian Gaming Industry Report; and the Lottery Insights November 2012 Edition (McQueen, 2012). For those analyses exploring relationships with a state’s estimated number of problem gamblers, estimates of problem gamblers were calculated using the 2012 U.S. Census Bureau estimate of persons age 18 and over and the average of findings from the state’s adult problem gambling prevalence studies converted into a standardized past year problem gambling rate by Williams, Volberg, & Stevens, (2012). For those states that had not conducted a problem gambling prevalence study at the time of the present survey, the average adult past year prevalence rate across all U.S. states was used (2.2%) as calculated by Williams, Volberg, & Stevens (2012). All computations were conducted using the software program STATA (Version 12). Except where noted, to understand the strength and the direction of associations between variables, pairwise correlations were conducted, as well as scatterplots, to visually understand these associations. The p-value for the coefficients is reported with α = .05. Pairwise correlations were used, as opposed to partial correlations or regression techniques, since we were mainly interested in the nature of the associations between variables. The research team contemplated utilizing predictive models to explore variables of interest; however, the available data did not meet the necessary assumptions to perform such tests. Thus, pairwise correlations were conducted instead of partial correlations or any model building procedures. While pairwise correlations provide valuable information about the strength of associations, it is important to note that a significant correlation between two variables does not mean a causal relationship exists. Correlates of Problem Gambling Service Funding Levels As described in the “Funding for Problem Gambling Services” section of this report, public funding invested in problem gambling services varied widely across the United States. To better understand factors that may have contributed to higher funding levels, a series of tests were conducted between the problem gambling services funding budget of state agencies and variables hypothesized to influence budget levels. The following questions were explored: Do those states that invested in problem gambling prevalence studies spend more on problem gambling services?
ASSOCIATIONS BETWEEN VARIABLES OF INTEREST: STATISTICAL EXPLORATIONS
48

This question was based on the premise that states that conduct more problem gambling prevalence studies would be more likely to have higher problem gambling service budgets. The concept behind this hypothesis was that decision makers within states that conducted problem gambling prevalence studies would have greater problem gambling awareness, which in turn could lead to decisions to invest in services for problem gamblers. However, no relationship was found between the number of problem gambling prevalence studies and problem gambling service state agency budgets for fiscal year 2012-13 (p=.92). However, the sample used in the one-way ANOVA test was small: 6 states conducted more than one prevalence study, 27 states conducted a single problem gambling prevalence study, and 11 states had yet to conduct any prevalence study. To further refine the analysis, tests were run to explore if the occurrence of a prevalence study within the past five years correlated with increased problem gambling service funding, and again no correlation was found using Independent Samples T-test (p=.36) and pair-wise correlation (r=.15).
How is a state’s gambling landscape related to problem gambling service funding?
The research team hypothesized that larger gambling states, in terms of gaming revenues and number of legalized gaming forms, would be more likely to have larger problem gambling service budgets than states where legalized gaming was less developed. Statistical tests of the survey data confirmed this hypothesis. Combined lottery sales with casino revenues, as an indices for relative scope of a state’s gaming revenue, was significantly correlated with problem gambling service funding (p<.01, r=.54) as observed in the scatterplot with Figure 25. The number of types of legalized gambling was significantly correlated with state funding for problem gambling services (p<.01, r=4341) as depicted on the Figure 26 scatterplot. Qualitative analysis of the responses to the “legislative” section of the survey provided additional insight into this finding. Several survey respondents explained that problem gambling service funding originated with legislation that enabled some form of expanded gaming within their state or otherwise accompanied legislation that expanded gaming.
49

Figure 25. Correlation between State Gaming Revenues and Problem Gambling Service Funding
Figure 26. Relationship between the Number of Legalized Types of Gambling within State and Problem Gambling Service Funding
Is a state’s estimated number of problem gamblers related to problem gambling service funding?
50

Federal funding for Substance Abuse and Mental Health Services Administration (SAMHSA) Treatment Block Grants is based, in part, on a “baseline” allotment for a state as determined by three factors: the Population at-Risk Index, the Cost-of Services Index, and the Fiscal Capacity Index (Muhuri, 2007). If a Population at-Risk Index were applied to the field of problem gambling services, one factor of that index would be the estimated number of adult problem gamblers in the community at-large. That is, if a systematic approach to funding problem gambling services across U.S. states existed, then we would expect there to be a relationship between a state’s estimated number of problem gamblers and funding levels to address this issue. As there are no federal oversight agencies to distribute funds to treat and prevent problem gambling, the research team did not expect to find any such relationship between a state’s need and funding level for problem gambling services. However, a significant relationship between a state’s estimated number of adult problem gamblers and problem gambling service funding level was found (p<.01, r=.54) as depicted in Figure 27. While the relationship was significant, there were a number of outliers, including no funding for problem gambling services in Texas, a state with over 400,000 estimated adult problem gamblers. Figure 27. Relationship between a State’s Estimated Number of Adult Problem Gamblers and Problem Gambling Service Funding
Do states with greater “calls for help” to their problem gambling helpline in 2010 have greater funding increases in 2013?
51

The research team hypothesized that states with higher numbers of “calls for help” to their problem gambling helpline, as reported in the 2010 Survey, would be those states reporting greater funding increases in the 2013 Survey. The rationale being that “calls for help” can be used by problem gambling service advocates within states to demonstrate need and justify increased problem gambling service funding levels. For the analysis of the data, linear regression analysis was conducted to determine if states with greater helpline calls in 2010 experienced a greater funding increase in 2013. The “calls for help” variable was transformed to its log to better fit the normality assumption. These analyses failed to find a statistically significant relationship between 2010 gambling helpline call volume and 2013 problem gambling service funding increases over 2010 levels. The failure to find this association is likely due to the idiosyncratic nature of states in terms of laws designed to reduce gambling related harms and the appetite of legislative bodies to invest in problem gambling services. That is, funding for problem gambling services may have less to do with service need than cultural-political factors. Correlates of Problem Gambling Calls for Help & Treatment Enrollments Two common performance indicators of a state’s problem gambling services system are the number of “calls for help” to a state’s problem gambling helpline and the number of enrollments into problem gambling treatment. “Calls for help” are distinguished from “total calls” in that only those gambling helpline calls asking for assistance with a gambling problem are counted. To better understand factors that may have contributed to greater numbers of “calls for help” and gambling treatment enrollments (combining unduplicated reports from both the APGSA Survey and NCPG Affiliate Survey), a series of tests were conducted between these performance variables and variables hypothesized to influence service levels. The following questions where explored:
How is a state’s gambling landscape related to numbers of problem gamblers treated or calls for help?
The research team hypothesized that the more developed a state’s gaming landscape, the more problem gambling helpline “calls for help,” and the greater the enrollments into gambling treatment compared to states with less developed gambling landscapes. To operationalize the “gambling landscape,” two variables were analyzed. These were: (1) state lottery sales, tribal gaming revenues, and commercial casino revenues, combined into a single revenue index; and (2) the number of types of legalized gambling within each state. Significant associations were found between problem gambling helpline “calls for help” and number of types of legalized gaming (p=.052, r=.36) and amount of state gaming revenues (p<.01, r=.53). That is, in general, problem gambling helplines are more active in states where more gaming takes place (See Figure 28). What is not known is why this relationship exists. It could be due to greater awareness of a helpline in those states with larger gaming industries due to increased helpline advertising, and/or it could be related to more problem gamblers within states where the legalized gaming environment is prominent.
52

Contrary to the research team’s hypothesis, no such statistical relationship existed between numbers of problem gamblers treated and state gaming revenues or number or types of legalized games. This finding was consistent with the observation that the number of “calls for help” to a state’s problem gambling helpline was not statistically significant to numbers treated within paired states. This is likely due to the artifact that between state disparities are much greater for gambling treatment systems than for helpline services. For example, in both Florida and Wisconsin, the state does not fund problem gambling treatment while these states had the 3rd and 6th greatest number of “calls for help” to their problem gambling helpline. Figure 28. Relationship between Number of Types of Legalized Gaming Within a State and Problem Gambling Helpline “Calls for Help”
Is there a relationship between the estimated number of problem gamblers within a state and “calls for help” or gambling treatment enrollments?
A statistically significant relationship was found between the estimated number of adult problem gamblers within a state and the number of “calls for help” to a state’s problem gambling helpline (p<.01, r=.69; see Figure 29). However, the relationship between a state’s estimated number of adult problem gamblers and the actual numbers of problem gamblers treated was not found. These findings suggest that from a national perspective, as the number of problem gamblers increase, so does the number that reach out for help, but increases in reaching out for help for a gambling problem does not translate into increases in receiving gambling treatment through publicly funded gambling treatment programs or NCPG Affiliate gambling treatment programs. What this survey data is unable to shed light on is how many problem gamblers receive help through other means, such as participation with Gamblers Anonymous or obtaining professional services through private insurance or under diagnoses other than Disordered Gambling.
53

Figure 29. Relationship between Number of Estimated Adult Problem Gamblers within a State and “Calls for Help” to a Problem Gambling Helpline.
Does dedicated problem gambling service funding correlate with numbers of problem gamblers treated?
Total funding, state funding for problem gambling services combined with NCPG Affiliate budgets, is significantly correlated with the numbers of problem gamblers and their concerned others treated with state and NCPG Affiliate gambling treatment systems (p=.05, r=.38). See Figure 30.
54

Figure 30. Relationship between problem gambling service funding and numbers treated.
Summary
Several associations between state level variables of interest were explored to determine if relationships existed for (a) the levels of problem gambling service funding, (b) numbers of “calls for help” to the problem gambling helpline, and (c) numbers of persons served within publicly funded and NCPG Affiliate supported gambling treatment programs. A state’s problem gambling service funding level was significantly associated with:
• Gaming revenue produced within a state • The number of legalized types of gambling • The estimated number of adult problem gamblers within a state • The number of problem gamblers treated
Statistical significance was NOT found between state problem gambling service funding and:
• The number of “calls for help” to state problem gambling helplines • The number or date of state specific problem gambling prevalence studies • Problem gambling helpline call volume as reported in 2010
“Calls for help” to problem gambling helplines were significantly associated with:
• Gaming revenue produced within a state • The number of legalized types of gambling within a state • The estimated number of adult problem gamblers within a state
Statistical significance was not found between “calls for help” to problem gambling helplines and gambling treatment utilization. The only variable that was significantly associated with gambling
55

treatment utilization was spending on problem gambling services as calculated by combining state agency problem gambling service budgets with unduplicated spending by NCPG Affiliates. These findings suggest that from a national perspective, as the number of problem gamblers increase, so does the number that reach out for help, but increases in reaching out for help for a gambling problem does not translate into increases in receiving gambling treatment through publicly funded gambling treatment programs or NCPG Affiliate gambling treatment programs. The lack of a clear relationship between the number of persons calling gambling helplines and receiving subsidized gambling treatment points to a central issue discussed elsewhere in this report: there is a great level of disparity between states in terms of problem gambling service investment and problem gambling treatment infrastructure.
56
Compulsive Gambling Act, 736 Annotated Code of Maryland. §§ 928-2714-2715 (1978). Dunne, J. (1985). Increasing public awareness of pathological gambling behavior: A history of the
National Council on Compulsive Gambling. Journal of Gambling Behavior. Vol. 1(1), Human Sciences Press.
Etner, S., Huang, D., Evans, E., Ash, D. R., Hardy, M., Jourabchi, M., & Yih-Ing, H. (2006) Benefit
cost in the California treatment outcome project: does substance abuse treatment “pay for itself”? Health Services Research. 41(1): 192–213. doi: 10.1111/j.1475-6773.2005.00466.x
Marotta, J., Moore, T., Christensen, T. (2011). 2010 National Survey of Publicly Funded Problem
Gambling Services. Phoenix, AZ: Association of Problem Gambling Service Administrators Meister, A. (2013). Casino City's Indian Gaming Industry Report. Casino City Press
McQueen, P. (2012, November). A year to remember. Lottery Insights, 27-38.
http://viewer.zmags.com/publication/dc33ab79#/dc33ab79/1 Muhuri, R. (2007). Block Grants and Formula Grants: A Guide for Allotment Calculations. SAMHSA,
Office of Applied Studies, Rockville, MD
National Gambling Impact Study Commission. (1999). National Gambling Impact Study Commission Report.
North America State and Provincial Lotteries. 2012 Lottery Sales and Profits. Downloaded June 28,
2013 from: http://www. naspl.org/index.cfm?fuseaction=content&menuid=17&pageid=1025 The American Gaming Association (2013). 2013 AGA Survey of Casino Entertainment.
Downloaded June 2, 2013 from: http://www.americangaming.org U.S. Census Bureau (2013). Annual Estimates of the Resident Population: April 1, 2010 to July 1,
2013. Release Date: December 2013. Williams, R.J., Volberg, R.A. & Stevens, R.M.G. (2012). The Population Prevalence of Problem Gambling:
Methodological Influences, Standardized Rates, Jurisdictional Differences, and Worldwide Trends. Report prepared for the Ontario Problem Gambling Research Centre and the Ontario Ministry of Health and Long Term Care. May 8, 2012.
REFERENCES
57

Appendix A: State Profiles
58

Alabama
Problem Gambling Services As of SFY 2013, the State of Alabama did not provide public funding dedicated for problem gambling services, and there were no publicly funded programs specifically for problem gambling treatment or problem gambling prevention. The Alabama Council on Compulsive Gambling (ALCCG) is a non-profit organization that provides problem gambling services in the state and is a designated affiliate to the National Council on Problem Gambling (NCPG). In SFY 2013 the operating budget for the ALCCG was $50,000, which was donated by tribal governments/casinos. In SFY 2013 those funds were directed toward a problem gambling helpline, counselor training, prevention and public awareness efforts.
In 2013, Alabama ranked 42th out of the 50 U.S. states in terms of public funds plus unduplicated NCPG affiliate funds per capita invested in problem gambling services. The average per capita allocation of public funds for problem gambling services in the 39 states with publicly funded services was 32 cents; Alabama had no public investment, and the ALCCG’s per capita investment in problem gambling services was 1 cent.
The Florida Council on Compulsive Gambling, a regional call center in the NCPG’s National Problem Gambling Helpline Network, fields calls from Alabama to the National Problem Gambling Helpline. At the time of the present survey, the ALCCG was beginning to take over operation of helpline services within the state. As of SFY 2013, problem gambling treatment services in the state were provided entirely by volunteers through he ALCCG, but there were plans for licensed counselors to begin providing problem gambling treatment in 2014.
Gaming in Alabama2 • • •
In 2012, gambling in Alabama consisted of 4,200 electronic gaming machines, three tribal casinos, pari-mutuel wagering, and charitable gambling. Indian gaming increased approximately 26 percent in 2011, making it the fastest growing state for the fourth straight year. However, total gaming revenue cannot be reported due to the confidentiality of the data.
1 Based on a 2012 U.S. Census Bureau estimate of persons age 18+ multiplied by the national average adult past year prevalence rates of problem gambling as reported and converted into standardized rates by Williams, Volberg, & Stevens (2012). 2Based on combined revenue reports from: (a) The American Gaming Association (2013); (b) Meister (2013); and (c) North America State and Provincial Lotteries (2013).
Problem Gambling Prevalence1
• • • An estimated 2.2% of Alabama adults (79,033 citizens) are believed to manifest a gambling disorder.
59

Alaska
Problem Gambling Services As of SFY 2013, the State of Alaska did not provide public funding dedicated for problem gambling services, and there were no publicly funded programs specifically for problem gambling treatment or problem gambling prevention. The state of Alaska is not a member of the Association for Problem Gambling Service Administrators and does not have an organization designated as an affiliate to the National Council on Problem Gambling. NCPG contracts with the Louisiana Problem Gamblers Helpline to cover calls from Alaska made to the National Problem Gambling Helpline.
Gaming in Alaska2 • • •
In 2012, legalized gambling in Alaska consisted of two tribal casinos, 90 electronic gaming machines, and regulated gaming on cruise ships. Alaska tied for fewest reported gaming revenues reported along with Hawaii, Utah, Wyoming, and Alabama. However, Alaska most likely has the third fewest gambling revenues of any U.S. state behind Hawaii and Utah which has no lottery, casino, or Indian gaming.
Problem Gambling Prevalence1
• • • An estimated 2.2% of Alaska adults (11,892 citizens) are believed to manifest a gambling disorder.
1 Based on a 2012 U.S. Census Bureau estimate of persons age 18+ multiplied by the national average adult past year prevalence rates of problem gambling as reported and converted into standardized rates by Williams, Volberg, & Stevens (2012). 2 Based on combined revenue reports from: (a) The American Gaming Association (2013); (b) Meister, A. (2013); and (c) North America State and Provincial Lotteries (2013).
60

Arizona
Problem Gambling Services In 1998, the State of Arizona first implemented the Indian Gaming Preservation and Self-Reliance Act, which stated that, “Two percent of the tribal contributions made to the Arizona Benefits Fund, shall be used by the Department of Gaming to fund state and local programs for the prevention and treatment of, and education concerning, problem gambling.” The Department of Gaming established the Office of Problem Gambling (OPG) to administer that fund. In addition, the Arizona State Lottery contributed $300,000 to the Fund to support problem gambling services.
In SFY 2013, $2,051,300.00 was appropriated to the Office of Problem Gambling. The OPG programmed those funds toward treatment services, program administration, service evaluation, problem gambling research, counselor training and workforce development, a problem gambling helpline, prevention services, and media outreach. At the time of this survey, the State was also in the process of implementing a new $100,000 needs assessment project.
In 2013, Arizona ranked 15th out of the 50 U.S. states in terms of public funds plus unduplicated NCPG affiliate funds per capita invested in problem gambling services. The average per capita allocation of public funds for problem gambling services in the 39 states with publicly funded services was 32 cents; Arizona per capita public investment was 31 cents.
The OPG contracts with Bensinger, DuPont & Associates to provide a problem gambling helpline service for the state. In SFY 2012 the helpline received 433 calls for help. The OPG also contracts with community based mental health and/or substance abuse agencies and counselors to provide outpatient counseling services for problem gambling. In SFY 2012, 616 gamblers and 190 significant others received state-funded outpatient treatment for problem gambling.
The Arizona Council on Compulsive Gambling (ACCG) is the Arizona state affiliate to the NCPG. Established in 1994, the ACCG had been providing problem gambling education and awareness building in Arizona. During 2013, corresponding with the NCPG Affiliate Survey field period, the ACCG became inactive and was unable to complete the NCPG Affiliate Survey. The ACCG has since resumed activities.
Gaming in Arizona2 • • •
In 2012, Arizona ranked 20th out of 50 states and the D.C. in combined lottery sales, commercial casino gaming revenues, and Indian gaming revenues with $2.41 billion reported.
In 2012, legalized gambling in Arizona included 14,530 electronic gaming machines, a traditional state lottery, Indian casinos, pari-mutuel wagering, and charitable gaming.
Problem Gambling Prevalence1
• • • An estimated 1.6% of Arizona adults (78,534 citizens) are believed to manifest a gambling disorder.
1 Based on a 2012 U.S. Census Bureau estimate of 4,908,388 persons age 18 and over and findings from a 2003 Arizona problem gambling prevalence study converted into a standardized past year problem gambling rate by Williams, R.J., Volberg, R.A. & Stevens, R.M.G. (2012). 2 Based on combined revenue reports from: (a) The American Gaming Association (2013); (b) Meister (2013); and (c) North America State and Provincial Lotteries (2013).
61

Arkansas
Problem Gambling Services In 2009, the State of Arkansas enacted legislation that designated how much monies from a General Fund were to be allocated and earmarked to address problem gambling and assigned the Arkansas Division of Behavioral Health Services (DBHS) to administer that fund. In 2009 that amount was $200,000, and at the time of this survey (SFY 2013) the dedicated problem gambling service budget remained $200,000. In SFY 2013, 100% of those funds were programmed toward a problem gambling helpline and treatment
services. The DBHS also provided public awareness services.
In 2013, Arkansas ranked 35th out of the 50 U.S. states in terms of public funds plus unduplicated NCPG affiliate funds per capita invested in problem gambling services. The average per capita allocation of public funds for problem gambling services in the 39 states with publicly funded services was 32 cents; Arkansas’ per capita public investment was 7 cents.
The DBHS contracts with the Louisiana Association of Compulsive Gambling to provide a problem gambling helpline for the state. At the time of this survey, information regarding the number of calls for help was not available. The DBHS also contracts with community mental health centers to provide outpatient treatment services for problem gambling. In SFY 2012, ten gamblers and two significant others received state-funded outpatient counseling.
Gaming in Arkansas2 • • •
In 2012, Arkansas ranked 41st out of 50 states and the D.C. in combined lottery sales, commercial casino gaming revenues, and Indian gaming revenues with $473 million reported. In 2012, legalized gambling in Arkansas included 1,900 electronic gaming machines, a traditional state lottery, a racetrack casino, pari-mutuel wagering, and charitable gaming.
Problem Gambling Prevalence1
• • • An estimated 2.2% of Arkansas adults (49,180 citizens) are believed to manifest a gambling disorder.
1 Based on a 2012 U.S. Census Bureau estimate of persons age 18 and over and the average rate found among all U.S. state problem gambling prevalence as reported and converted into a standardized past year problem gambling rate by Williams, Volberg, & Stevens (2012). 2 Based on combined revenue reports from: (a) The American Gaming Association (2013); (b) Meister, A. (2013); and (c) North America State and Provincial Lotteries (2013).
62

California
Problem Gambling Services In 2003, the State of California enacted AB 673, which designated how monies from an Indian Gaming Special Distribution Fund, Lottery Fund, and Gambling Addiction Fund were to be allocated to address problem gambling and established the Office of Problem Gambling (OPG), Department of Alcohol and Drug Programs (ADP) to administer that fund. In 2009 that amount was $8,681,000, and at the time of this survey (SFY 2013) the dedicated problem gambling service budget was $8,661,000. In SFY 2013 those funds were programmed toward treatment services, program administration, service evaluation, research, problem gambling helplines, training and workforce development, prevention services, and media resources.
In addition to efforts by the OPG, the California Council on Problem Gambling (CCPG), a non-profit organization, has provided problem gambling services and serves as the state affiliate to the National Council on Problem Gambling (NCPG). In 2013, the CCPG operated on a budget of $725,000, which supported a problem gambling helpline, public awareness services, counselor training and certification programs, casino employee training, and prevention services.
In 2013, California ranked 21st out of the 50 U.S. states in terms of public funds plus unduplicated NCPG affiliate funds invested in problem gambling services. The average per capita allocation of public funds for problem gambling services in the 39 states with publicly funded services was 32 cents; California’s per capita public investment was 23 cents.
The OPG contracts with Bensinger, DuPont & Associates and NICOS Chinese Health Coalition to provide problem gambling helpline services for the state in English and multiple Asian languages, respectively. In SFY 2012, these two helpline services received 5,016 total calls for help. The OPG also provides treatment services, primarily through contracts with community based mental and health and/or substance abuse agencies and counselors. In SFY 2012, OPG reported 1,188 gamblers and 342 significant others received publicly funded outpatient counseling, and 46 individuals received state-funded residential treatment for problem gambling.
Gaming in California • • •
In 2012, California ranked 1st out of 50 states and the D.C. in total gaming revenues with $10.4 billion reported. 2
In 2012, legalized gambling in California consisted of 68,341 electronic gaming machines, 158 Indian casinos, a traditional state lottery, card rooms, pari-mutuel wagering, and charitable gaming.
Problem Gambling Prevalence
• • • An estimated 1.9% of California adults (544,981 citizens) are believed to manifest a gambling disorder. 1
1 Based on a 2012 U.S. Census Bureau estimate of 28,683,238 persons age 18 and over and findings from two California problem gambling prevalence studies (1990, 2006) converted into a standardized past year problem gambling rate by Williams, Volberg, & Stevens (2012).
2 Based on the following article and verified through independent analysis: Palermo, D, It’s Not Nevada. Global Gaming Business. 2013: 12(8): Retrieved 1/21/14 from http://ggbmagazine.com/issue/vol-12-no-8-august-2013/article/its-not-nevada.
63

Colorado
Problem Gambling Services In 2008, the State of Colorado enacted HB08-1314, which designated how monies from a Gambling Impact Fund were to be allocated, earmarked approximately 0.15% of that fund to address problem gambling, and assigned the Colorado Department of Human Services, Office of Behavioral Health (OBH), to administer that fund. In 2009 there was $130,000 in the fund, and at the time of this survey (SFY 2013) the dedicated problem gambling service budget was $57,000. In SFY 2013, OBH used 5% of those funds for program administration and programmed the remaining amount to support a contract for $54,140 with The Center of Excellence, housed within the Problem Gambling Research and Treatment Center (PGRTC) at the University of Denver. In SFY 2013, the Center of Excellence allocated 100% of those funds toward workforce development, including an annual statewide problem gambling conference, trainings, supervision, and a problem gambling counselor certification program. The PGRTC also provided problem gambling research, treatment, and outreach trainings, however these activities were supported by sources other than state funds designated for problem gambling services.
In addition to OBH and the Center of Excellence, the Problem Gambling Coalition of Colorado (PGCC), a non-profit organization, also provides problem gambling services in the state and serves as the state affiliate to the National Council on Problem Gambling. (NCPG) The PGCC’s mission is to increase awareness, advocate treatment, and promote research and education on problem gambling. In 2013, the PGCC operated on a budget of $30,000, which supported public awareness services including a poster/scholarship contest for gambling awareness and self-exclusion program services.
In 2013, Colorado ranked 41st out of the 50 U.S. states in terms of public funds plus unduplicated NCPG affiliate funds invested in problem gambling services. The average per capita allocation for problem gambling services in the 39 states with publicly funded services was 32 cents; Colorado’s per capita public investment was less than 1 cent. In SFY 2012 there were no state-funded treatment or helpline services, and the NCPG’s contracted with the Louisiana Helpline call center to cover calls from Colorado to the national problem gambling helpline number.
Gaming in Colorado2 • • •
In 2012, Colorado ranked 33rd out of 50 states and the D.C. in combined lottery sales and commercial casino gaming revenues with $1.3 billion reported. Indian gaming revenues are not included in this calculation as that information was regarded as confidential. In 2012, legalized gambling in Colorado included 16,219 electronic gaming machines in the state, a traditional state lottery, two Indian casinos, 41 commercial casinos, and charitable gaming.
Problem Gambling Prevalence1
• • • An estimated 2.4% of Colorado adults (94,621 citizens) are believed to manifest a gambling disorder.
1 Based on a 2012 U.S. Census Bureau estimate of 3,942,562 persons age 18 and over and findings from a 1997 Colorado problem gambling prevalence study converted into a standardized past year problem gambling rate by Williams, Volberg, & Stevens (2012). 2 Based on combined revenue reports from: (a) The American Gaming Association (2013); (b) Meister, A. (2013); and (c) North America State and Provincial Lotteries (2013).
64

Connecticut
Problem Gambling Services In 1992, the State of Connecticut enacted legislation that designated how monies from a Lottery, Pari-mutuel, and DMHAS funds were to be allocated to address problem gambling and assigned the Connecticut Problem Gambling Services (PGS), Department of Mental Health and Addiction Services (DMHAS), to administer those funds. In 2009 that amount was $2,077,850, and at the time of this survey (SFY 2013) the dedicated problem gambling service budget was $2,150,000. In SFY 2013, PGS programmed 100% of those funds toward program administration, service evaluation, research, counselor training and workforce development, problem gambling helplines, treatment and prevention services, and media resources.
In addition to efforts by PGS, the Connecticut Council on Problem Gambling (CCPG), a non-profit organization, also provides problem gambling services and serves as the state affiliate to the National Council on Problem Gambling. In 2013, the CCPG operated on a budget of $643,721. The operating budget supported a problem gambling helpline, research, service evaluation, public awareness, training for counselors and casino employees, prevention services, and community training.
In 2013, Connecticut ranked 6th out of the 50 U.S. states in terms of per capita public funds and unduplicated NCPG affiliate funds dedicated to problem gambling services. The average per capita allocation of public funds for problem gambling services in the 39 states with publicly funded services was 32 cents; Connecticut’s per capita public investment was 60 cents.
Through a contract with PGS, the CCPG subcontracts with Bensiger, DuPont & Associates to provide a problem gambling helpline service for the state. In 2011, the helpline received 556 calls for help; data for 2012 was not available at the time of the survey. PGS also contracts with community based mental health and/or substance abuse agencies to provide treatment services for problem gambling. In SFY 2012, 543 individuals (gamblers and significant others) received state-funded outpatient counseling services in SFY 2012, and 11 received state-funded residential treatment for problem gambling.
Gaming in Connecticut2 • • •
In 2012, Connecticut ranked 17th out of 50 states and the D.C. in combined lottery sales, commercial casino gaming revenues, and Indian gaming revenues with $ 3.09 billion reported. In 2012, legalized gambling in Connecticut included 11,788 electronic gaming machines, 2 Indian casinos, a state lottery, and charitable gaming.
Problem Gambling Prevalence1
• • • An estimated 2.4% of Connecticut adults (66,867 citizens) are believed to manifest a gambling disorder.
1 Based on a 2012 U.S. Census Bureau estimate of 2,786,109 persons age 18 and over and findings from three Connecticut problem gambling prevalence studies (1991, 1996, 2008) converted into a standardized past year problem gambling rate by Williams, Volberg, & Stevens (2012). 2 Based on combined revenue reports from: (a) The American Gaming Association (2013); (b) Meister, A. (2013); and (c) North America State and Provincial Lotteries (2013).
65

Delaware
Problem Gambling Services In 1994, the State of Delaware enacted HB08-628, which designated how monies from a problem gambling fund were to be allocated and earmarked to address problem gambling and assigned the Department of Health and Social Services (DHSS) to administer that fund. In 2009, that amount was $1,045,850, and at the time of this survey (SFY 2013) the dedicated problem gambling service budget was $1,306,150.
In SFY 2013, the DHSS contracted 100% of those funds to the Delaware Council on Gambling Problems (DCGP), a non-profit organization that provides problem gambling services throughout the state and serves as the state affiliate to the National Council on Problem Gambling (NCPG). The operating budget of $1,306,150 supported program administration, service evaluation, research, a problem gambling helpline, training and workforce development, prevention and public awareness services, and consultation fees. The DCGP is one of the largest state affiliates to the NCPG in terms of budget, number of staff, and scope of services provided.
In 2013, Delaware ranked 1st out of the 50 U.S. states in terms of per-capita public funds plus unduplicated NCPG affiliate funds invested in problem gambling services. The average per capita allocation for problem gambling services in the 39 states with publicly funded services was $0.32; Delaware’s per capita public investment was nearly four times greater than the average with $1.42 per capita.
The problem gambling helpline administered by the DCPG received 548 calls for help from within Delaware in SFY 2012, in addition to fielding problem gambling calls from Montana as part of the NCPG’s National Problem Gambling Helpline Network. The DCPG subcontracts with community based mental health and/or substance abuse counselors to provide treatment for problem gamblers and their significant others. In SFY 2012, 119 individual gamblers and 24 significant others received publicly funded outpatient counseling for problem gambling.
Gaming in Delaware2
• • • In 2012, Delaware ranked 35th out of 50 states and the D.C. in combined lottery sales, commercial casino gaming revenues, and Indian gaming revenues with $1.21 billion reported. In 2012, legalized gambling in Delaware included 6,596 electronic gaming machines, a traditional state lottery, video and internet lotteries, a stand-alone casino, 3 Indian casinos, internet gambling, pari-mutuel wagering, and charitable gaming.
Problem Gambling Prevalence1
• • • An estimated 1.4% of Delaware adults (9,938 citizens) are believed to manifest a gambling disorder.
1 Based on a 2012 U.S. Census Bureau estimate of 709,829 persons age 18 and over and findings from two Delaware problem gambling prevalence studies (1998, 2000) converted into a standardized past year problem gambling rate by Williams, Volberg, & Stevens (2012). 2 Based on combined revenue reports from: (a) The American Gaming Association (2013); (b) Meister (2013); and (c) North America State and Provincial Lotteries (2013).
66

District of Columbia
Problem Gambling Services As of SFY 2013, Washington, D.C. did not provide public funding dedicated for problem gambling services, and there were no publicly funded programs specifically for problem gambling treatment or problem gambling prevention. No Washington, D.C. agency is a member of the Association for Problem Gambling Service Administrators and the District does not have an organization designated as an affiliate to the National Council on Problem Gambling (NCPG). The District of Columbia DC Lottery and Charitable Games Control Board does provide on its website information about the National Problem Gambling Helpline and links to the Gamblers Anonymous and NCPG websites.1 NCPG contracts with the Louisiana Problem Gamblers Helpline to cover calls from the District made to the National Problem Gambling Helpline.
Gaming in Washington, D.C. 3
• • • In 2012, Washington, D.C. ranked 45th out of 50 states and the District in combined lottery sales, commercial casino gaming revenues, and Indian gaming revenues with $252.15 million reported. In 2012, legalized gambling in Washington, D.C. consisted of a traditional lottery and charitable gaming.
Problem Gambling Prevalence2
• • • An estimated 2.2% of Washington, D.C. adults (11,546 citizens) are believed to manifest a gambling disorder.
1 At the time of this survey, the website for the District of Columbia DC Lottery and Charitable Games Control Board can be accessed at http://lottery.dc.gov/page/play-responsibly 2 Based on a 2012 U.S. Census Bureau estimate of persons age 18 and over and the average rate found among all U.S. state problem gambling prevalence studies as reported and converted into a standardized past year problem gambling rate by Williams, Volberg, & Stevens (2012). 3 Based on combined revenue reports from: (a) The American Gaming Association (2013); (b) Meister (2013); and (c) North America State and Provincial Lotteries (2013).
67

Florida
Problem Gambling Services Division of Business and Professional Regulation (DBPR) receives $250,000 for each Racino in the state that is designed for compulsive gambling programming. There are 8 Racinos in Florida equating to a total allocation of $2,000,000 designated to go to compulsive gambling programming. Of that $2M, DBPR contracts $600,000 to the Florida Council on Compulsive Gambling (FCCG) to operate a problem gambling helpline, to assist with Racinos with responsible gambling programming and training, and to conduct a variety of problem gambling awareness and prevention activities.
The FCCG is a non-profit organization that serves as the state affiliate to the National Council on Problem Gambling (NCPG). In 2013, the FCCG operated on a budget of $2,350,000, of which $1,750,000 came from grant money from tribal governments/casinos in addition to the $600,000 contract with the DBPR. The operating budget supported a problem gambling helpline, research, service evaluation, counselor training and certification, treatment services, and public awareness resources. The FCCG is one of the largest state affiliates to the NCPG in terms of budget, number of staff, and scope of services provided.
In 2013, Florida ranked 26th out of the 50 U.S. states in terms of per capita public funds plus unduplicated NCPG affiliate funds invested in problem gambling services. The average per capita allocation for problem gambling services in the 39 states with publicly funded services was 32 cents; Florida’s per capita public investment was 3 cents, while the FCCG’s per capita investment excluding state funds was 9 cents.
In 2012, the Florida Problem Gambling Helpline received 3,957 calls for help from within Florida, in addition to fielding calls to the National Problem Gambling Helpline from Alabama, Georgia, and South Carolina. The FCCG provides outpatient and residential treatment services for gamblers and their families using funds from tribal governments. In SFY 2012, 58 gamblers and 3 significant others received outpatient treatment.
Gaming in Florida2 • • •
In 2012, Florida ranked 4th out of 50 states and the D.C. in combined lottery sales, commercial casino gaming revenues, and Indian gaming revenues with $7.03 billion reported. In 2012, legalized gambling in Florida included 19,462 electronic gaming machines, 14 Indian casinos, a state lottery, 8 racetrack casinos, pari-mutuel wagering, and charitable gaming.
Problem Gambling Prevalence1
• • • An estimated 1.1% of Florida adults (162,791 citizens) are believed to manifest a gambling disorder.
1 Based on a 2012 U.S. Census Bureau estimate of 14,799,219 persons age 18 and over and findings from a 2001 Florida problem gambling prevalence study converted into a standardized past year problem gambling rate by Williams, Volberg, & Stevens (2012). 2 Based on combined revenue reports from: (a) The American Gaming Association (2013); (b) Meister (2013); and (c) North America State and Provincial Lotteries (2013).
68

Georgia
Problem Gambling Services In 2013, the State of Georgia enacted HB08-487, which created the opportunity for greater funding for problem gambling, but no specific allocations where made as of the survey period. The Georgia Lottery allocates $200,000 annually to the Department of Behavioral Health and Developmental Disability, Division of Addictive Diseases for problem gambling services. In SFY 2013, 100% of those funds went toward a single contract with the University of Georgia for developing an online certification course for problem gambling counselors that was scheduled to begin operation in SFY 2014.
In 2013, Georgia ranked 26th out of the 50 U.S. states in terms of per capita public funds plus unduplicated NCPG affiliate funds invested in problem gambling services. The average per capita allocation of public funds for problem gambling services in the 39 states with publicly funded services was 32 cents; Georgia’s per capita public investment was 2 cents.
As of SFY 2013, Georgia did not offer problem gambling helpline or treatment services. The Florida Council on Compulsive Gambling (FCCG), a state affiliate to the National Council on Problem Gambling (NCPG), covers calls from Georgia to the National Problem Gambling Helpline number as part of the NCPG’s National Problem Gambling Helpline Network.
Gaming in Georgia2 • • •
In 2012, Georgia ranked 12th out of 50 states and the D.C. in combined lottery sales, commercial casino gaming revenues, and Indian gaming revenues with $3.83 billion reported. In 2012, legalized gambling in Georgia included a traditional state lottery and charitable gaming.
Problem Gambling Prevalence1
• • • An estimated 1.7% of Georgia adults (125,805 citizens) are believed to manifest a gambling disorder.
1 Based on a 2012 U.S. Census Bureau estimate of 7,400,278 persons age 18 and over and findings from three Georgia problem gambling prevalence studies (1994, 2000, 2007) converted into a standardized past year problem gambling rate by Williams, Volberg, & Stevens (2012). 2 Based on combined revenue reports from: (a) The American Gaming Association (2013); (b) Meister (2013); and (c) North America State and Provincial Lotteries (2013).
69

Hawaii
Problem Gambling Services As of SFY 2013, the State of Hawaii was one of only two U.S. states, along with Utah, that did have any legalized gambling. There were no publicly funded programs specifically for problem gambling treatment or problem gambling prevention. The state of Hawaii does not have an agency registered as a member of the Association for Problem Gambling Service Administrators and does not have an organization designated as an affiliate to the National Council on Problem Gambling. With no legal forms of gambling, there are no reports of gaming revenue for the state. NCPG contracts with the Louisiana Problem Gamblers Helpline to cover calls from Hawaii made to the National Problem Gambling Helpline.
Problem Gambling Prevalence1
• • • An estimated 2.2% of Hawaii adults (23,831citizens) are believed to manifest a gambling disorder.
12 Based on combined revenue reports from: (a) The American Gaming Association (2013); (b) Meister, A. (2013); and (c) North America State and Provincial Lotteries (2013).
70

Idaho
Problem Gambling Services As of SFY 2013, the State of Idaho did not provide public funding dedicated to problem gambling services. There were no publicly funded programs specifically for problem gambling treatment or problem gambling prevention. The state of Idaho does not have a member agency of the Association for Problem Gambling Service Administrators and does not have an organization designated as an affiliate to the National Council on Problem Gambling (NCPG). The website of the official Idaho online lottery did provide information about the NCPG and the National Problem Gambling Helpline in addition to the Idaho Careline, a helpline service offered through the Department of Health and Welfare that offers basic referral resources to gamblers in Idaho and Utah.1 NCPG contracts with the Louisiana Problem Gamblers Helpline to cover calls from Idaho to the National Problem Gambling Helpline.
Gaming in Idaho 3 • • •
In 2012, Idaho ranked 43rd out of 50 states and the D.C. in combined lottery sales, commercial casino gaming revenues, and Indian gaming revenues with $327.14 million reported. In 2012, legalized gambling in Idaho included 3,911 electronic gaming machines, 7 tribal casinos, a state lottery, pari-mutuel wagering, and charitable gaming. There were no commercial casinos in the state.
1 The responsible gambling information page of the Idaho online lottery website could be accessed at http://www.idaholottery.com/theidaholottery/playResponsibly.aspx as of March 1, 2014. 2 Based on a 2012 U.S. Census Bureau estimate of persons age 18+ multiplied by the national average adult past year prevalence rates of problem gambling as reported and converted into standardized rates by Williams, Volberg, & Stevens (2012). 3 Based on combined revenue reports from: (a) The American Gaming Association (2013); (b) Meister (2013); and (c) North America State and Provincial Lotteries (2013).
Problem Gambling Prevalence2
• • • An estimated 2.2% of Idaho adults (25,627citizens) are believed to manifest a gambling disorder.
71

Illinois
Problem Gambling Services In 1996, the State of Illinois enacted PA 89-374 and 89-626, which designated how monies from a Gaming Fund were to be allocated and earmarked to address problem gambling and assigned the Division of Alcoholism and Substance Abuse (DASA) in the Illinois Department of Human Services (IDHS) to administer that fund. In 2009 that amount was $960,000 and at the time of this survey (SFY 2013) the dedicated problem gambling service budget was $996,300. In SFY 2013, the Gaming Fund programmed 100% of those funds towards a gambling helpline, public awareness, counselor training, and treatment and prevention services.
In addition to efforts by DASA, the Illinois Council on Problem Gambling (ICPG), a non -profit organization, provides problem gambling services and serves as the state affiliate to the National Council on Problem Gambling (NCPG). In 2013, the ICPG operated on a budget of $72,610, which was sourced by a donation of $12,810 from the gaming industry, $6,000 income from training or conference registrations, $3,800 in sales of materials or services, and a $50,000 donation from the statewide self-exclusion program. The operating budget supported program administration, public awareness services, training and workforce development, and media resources.
In 2013, Illinois ranked 34th out of the 50 U.S. states in terms of per-capita public funds plus unduplicated NCPG affiliate funds invested in problem gambling services. The average per capita allocation for problem gambling services in the 39 states with publicly funded services was 32 cents; Illinois’ per capita public investment was 8 cents.
In 2012, the state-funded Illinois Problem Gambling Helpline received 1,605 calls for help. In SFY 2012, 1,678 individuals received publicly funded outpatient treatment for problem gambling through contracts with community based mental health and/or substance use treatment agencies.
Gaming in Illinois2 • • •
In 2012, Illinois ranked 9th out of 50 states and the D.C. in combined lottery sales, commercial casino gaming revenues, and Indian gaming revenues with $4.32 billion reported. 2 In 2012, legalized gambling in Illinois included 13,588 electronic gaming machines, a traditional state lottery, internet lottery, 10 stand-alone casinos, pari-mutuel wagering, and charitable gaming.
Problem Gambling Prevalence1
• • • An estimated 2.2% of Illinois adults (214,991 citizens) are believed to manifest a gambling disorder.
1 Based on a 2012 U.S. Census Bureau estimate of persons age 18 and over and the average rate found among all U.S. state problem gambling prevalence studies as reported and converted into a standardized past year problem gambling rate by Williams, Volberg, & Stevens (2012). 2 Based on combined revenue reports from: (a) The American Gaming Association (2013); (b) Meister (2013); and (c) North America State and Provincial Lotteries (2013).
72

Indiana
Problem Gambling Services In 1993, the State of Indiana enacted the Indiana Riverboat Gaming Act, which designated how monies were to be allocated and earmarked to address problem gambling and assigned the Division of Mental Health and Addiction Services (DMHAS) to administer those funds. In 2009 that amount was $4.2 million, and at the time of this survey (SFY 2013) the dedicated problem gambling service budget was $3 million. In SFY 2013, DMHAS programmed 100% of those funds toward program administration, service evaluation, a problem gambling helpline, counselor training and workforce development, treatment and prevention services, media resources, and gaming compliance and voluntary exclusion.
In addition to efforts by DMHAS, the Indiana Council on Problem Gambling (ICPG), a non-profit organization, provides problem gambling services throughout the state and serves as the state affiliate to the National Council on Problem Gambling (NCPG). In 2013, the ICPG operated on a budget of $156,000, of which $36,000 came from a DMHAS grant, $10,000 from a donation from non-tribal casinos, and $110,000 in donations from corporate memberships. The operating budget supported program administration, media resources, and public awareness services.
In 2013, Indiana ranked 10th out of the 50 U.S. states in terms of per-capita public funds plus unduplicated NCPG affiliate funds invested in problem gambling services. The average per capita allocation of public funds for problem gambling services in the 39 states with publicly funded services was 32 cents; Indiana’s per capita public investment was 46 cents.
In SFY 2012, the state-funded Indiana Problem Gambling Helpline received 829 calls for help. DMHAS contracts with community based mental health and/or substance abuse treatment agencies to provide outpatient and residential treatment services. In SFY 2012, 475 individuals received state-funded outpatient counseling for problem gambling.
Gaming in Indiana • • •
In 2012, Indiana ranked 14th out of 50 states and the D.C. in combined lottery sales, commercial casino gaming revenues, and Indian gaming revenues with $3.47 billion reported. 2 In 2012, legalized gambling in Indiana included 21,963 electronic gaming, a traditional state lottery, 13 stand-alone casinos, racetrack casinos, pari-mutuel wagering, and charitable gaming.
Problem Gambling Prevalence
• • • An estimated 1.2% of Indiana adults (59,228 citizens) are believed to manifest a gambling disorder. 1
1 Based on a 2012 U.S. Census Bureau estimate of 4,935,687 persons age 18 and over and findings from a 1998 Indiana problem gambling prevalence study converted into a standardized past year problem gambling rate by Williams, Volberg, & Stevens (2012). 2 Based on combined revenue reports from: (a) The American Gaming Association (2013); (b) Meister (2013); and (c) North America State and Provincial Lotteries (2013).
73

Iowa
Problem Gambling Services Iowa State code 135.150 designated how monies from state-regulated casinos and the Iowa Lottery were to be allocated, earmarked approximately 0.05% to address problem gambling, and assigned the Iowa Department of Public Health (IDPH), Office of Problem Gambling Treatment and Prevention (OPGTP), to administer gambling harm-mitigation programs. In 2009 the program budget was $4,239,000, and at the time of this survey (SFY 2013) the dedicated problem gambling service budget was $3,116,614. In SFY 2013, those funds supported treatment services, program administration, service evaluation, research, a problem gambling helpline, training and workforce development, prevention services, media resources, and a data reporting system.
In 2013, Iowa ranked 3rd out of the 50 U.S. states in terms of per-capita public funds invested in problem gambling services. The average per capita allocation of public funds for problem gambling services in the 39 states with publicly funded services was $0.32; Iowa’s per capita public investment in problem gambling services was $1.01.
In SFY 2012, Iowa’s state-funded problem gambling helpline (1-800-BETS OFF) received 4,029 calls for help. The OPGTP contracts with community based mental health and/or substance use treatment agencies to provide outpatient treatment services. In SFY 2012, 677 gamblers and 51 significant others received publicly funded outpatient treatment for problem gambling.
Gaming in Iowa • • •
In 2012, Iowa ranked 25th out of 50 states and the D.C. in combined lottery sales, commercial casino gaming revenues, and Indian gaming revenues with $1.9 billion reported. 2 In 2012, legalized gambling in Iowa included 20,324 electronic gaming machines, a traditional state lottery, commercial casinos, Indian casinos, racetrack casinos, pari-mutuel wagering, and charitable gaming.
Problem Gambling Prevalence
• • • An estimated 1.5% of Iowa adults (35,184 citizens) are believed to manifest a gambling disorder. 1
1 Based on a 2012 U.S. Census Bureau estimate of 1,345,603 persons age 18 and over and findings from three Iowa problem gambling prevalence studies (1989, 1995, 2011) converted into a standardized past year problem gambling rate by Williams, Volberg, & Stevens (2012). 2 Based on combined revenue reports from: (a) The American Gaming Association (2013); (b) Meister (2013); and (c) North America State and Provincial Lotteries (2013).
74

Kansas
Problem Gambling Services In 2007, the State of Kansas enacted SB66, which created a Problem Gambling and Addictions Grant Fund sourced by set amounts from Lottery and Bingo revenue and 2% of State-Owned Casino Revenue. SB66 designated the Kansas Department for Aging and Disability Services (KDADS) with authority over this fund but did not specify what portion of the distribution goes toward problem gambling services and what portion goes toward other addictions. In FY13, 9% of the fund was budgeted to problem gambling services, equating $740,000.
In SFY 2013, Kansas Behavioral Health Services, within KDADS, programmed those funds toward treatment and prevention services, administration, research, a problem gambling helpline, training and workforce development, program consultation services, and a problem gambling clearinghouse.
KDADS allocated a small portion of its problem gambling services budget to the Kansas Coalition on Problem Gambling (KCPG), a non-profit organization that serves as the state affiliate to the National Council on Problem Gambling. In 2013, the KCPG operated on a budget of $5,000 in grant money from KDADS, which was designated for public awareness and advocacy services, training, data gathering, and community outreach.
In 2013, Kansas ranked 17th out of the 50 U.S. states in terms of per-capita public funds plus unduplicated NCPG affiliate funds invested in problem gambling services. The average per capita allocation for problem gambling services in the 39 states with publicly funded services was 32 cents; Kansas’ per capita public investment in problem gambling services was 26 cents.
In 2012, the Kansas Problem Gambling Helpline received 313 calls for help. KDADS contracts with community based mental health and/or substance use treatment agencies and counselors to provide outpatient gambling treatment services. In SFY 2012, 128 gamblers and 21 significant others received state-funded outpatient counseling for problem gambling. In addition, for those in greatest need, KDADS provides full coverage for residential treatment through a contract with a residential treatment facility in Minnesota.
Gaming in Kansas • • •
In 2012, Kansas ranked 38th out of 50 states and the D.C. in combined lottery sales, commercial casino gaming revenues, and Indian gaming revenues with $831.59 million reported. 2 In 2012, legalized gambling in Kansas included 7,875 electronic gaming machines, 6 Indian casinos, a traditional state lottery, thee stand-alone casinos, and charitable gaming.
Problem Gambling Prevalence
• • • An estimated 2.2% of Kansas adults (46,951 citizens) are believed to manifest a gambling disorder. 1
1 Based on a 2012 U.S. Census Bureau estimate of persons age 18 and over and the average rate found among all U.S. state problem gambling prevalence studies as reported and converted into a standardized past year problem gambling rate by Williams, Volberg, & Stevens (2012). 2 Based on combined revenue reports from: (a) The American Gaming Association (2013); (b) Meister (2013); and (c) North America State and Provincial Lotteries (2013).
75
Kentucky
Problem Gambling Services As of SFY 2013, the State of Kentucky did not provide public funding dedicated for problem gambling services. The State of Kentucky does not have an agency with membership to the Association for Problem Gambling Service Administrators; however, the Kentucky Council on Problem Gambling, Inc. (KCPG), a non-profit organization, provides problem gambling services throughout the state and serves as an affiliate to the National Council on Problem Gambling.
In SFY 2013 the KCPG operated on a budget of $70,100 sourced from non-tribal gaming operators, training and conference registrations, and conference sponsorships. The operating budget supported administration costs, training and workforce development, a helpline, research, public awareness, and prevention efforts. There were no problem gambling treatment services supported by the KCPG or state funds, although the KCPG provided counselor training.
In 2012, the Kentucky Problem Gambling Helpline, administered by River Valley Behavioral Health through a contract with the KCPG, received 172 calls for help.
Gaming in Kentucky • • •
In 2012, Kentucky ranked 39th out of 50 states and the D.C. in combined lottery sales, commercial casino gaming revenues, and Indian gaming revenues with $823.55 million reported. 2 In 2012, legalized gambling in Kentucky included a traditional state lottery, pari-mutuel wagering, and charitable gambling. As of SFY 2013, the Kentucky Lottery Board had approved internet lottery but it had not yet been implemented. The Lottery was also authorized to implement Keno in 2014.
Problem Gambling Prevalence
• • • An estimated 1.4% of Kentucky adults (46,423 citizens) are estimated to manifest a gambling disorder. 1
1 Based on a 2012 U.S. Census Bureau estimate of 3,315,996 persons age 18 and over and findings from two Kentucky problem gambling prevalence studies (2003, 2008) converted into a standardized past year problem gambling rate by Williams, Volberg, & Stevens (2012). 2 Based on combined revenue reports from: (a) The American Gaming Association (2013); (b) Meister (2013); and (c) North America State and Provincial Lotteries (2013).
76

Louisiana
Problem Gambling Services In 1995, the State of Louisiana enacted Acts 1014 and 1215, which designated how monies from each form of gambling (video poker, river boat, land-based casinos, lottery, and electronic gaming machines) were to be allocated toward a problem gambling fund administered by the Office of Behavioral Health (OBH). In 2009 that amount was $2,500,000, and at the time of this survey (SFY 2013) the dedicated problem gambling service remained $2,500,000. In SFY 2013, those funds supported program administration, a problem gambling helpline, counselor training, treatment and prevention services, public awareness services, and media and supervision resources.
In addition to efforts by the OBH, the Louisiana Association on Compulsive Gambling (LACG), a non-profit organization, provides problem gambling services throughout the state and serves as the state affiliate to the National Council on Problem Gambling (NCPG). In 2013, the LACG operated on a budget of $1,518,840. The operating budget supported a helpline, research, evaluation, public awareness services, counselor training, and prevention and treatment services. The LACG is one of the largest state affiliates to the NCPG in terms of budget, number of staff, and scope of services provided.
In 2013, Louisiana ranked 8th out of the 50 U.S. states in terms of per-capita public funds plus unduplicated NCPG affiliate funds invested in problem gambling services. The average per capita allocation for problem gambling services in the 39 states with publicly funded services was 32 cents; Louisiana’s per capita public investment was 54 cents.
The LACG funds and administers the Louisiana Problem Gamblers Helpline, which received 1,485 calls for help from within Louisiana in SFY 2012. In addition, the helpline fielded calls from 13 other states and Washington, D.C through contracts with NCPG, NCPG Affiliates, and state agencies. The OBH funds outpatient treatment services for problem gambling provided by state employees and through contracts with community based mental health and/or substance use treatment agencies. The OBH reported 533 individuals received state-funded outpatient treatment for problem gambling in SFY 2012; significant others also received treatment but those numbers were not tracked.
Gaming in Louisiana • • •
In 2012, Louisiana ranked 15th out of 50 states and the D.C. in combined lottery sales, commercial casino gaming revenues, and Indian gaming revenues with $3.29 billion reported.2 In 2012, legalized gambling in Louisiana included 40,276 electronic gaming machines, Indian casinos, a traditional state lottery, video lottery, commercial casinos, racetrack casinos, pari-mutuel wagering, and charitable gaming.
Problem Gambling Prevalence
• • • An estimated 2.9% of Louisiana adults (98,601 citizens) are estimated to manifest a gambling disorder. 1
1 Based on a 2012 U.S. Census Bureau estimate of 3,400,029 persons age 18 and over and findings from four Louisiana problem gambling prevalence study (1995, 1998, 2002, 2008) converted into a standardized past year problem gambling rate by Williams, Volberg, & Stevens (2012). 2 Based on combined revenue reports from: (a) The American Gaming Association (2013); (b) Meister (2013); and (c) North America State and Provincial Lotteries (2013).
77

Maine
Problem Gambling Services In 2007 and 2011 the State of Maine enacted legislation that designated how monies from casino revenue were to be allocated to address problem gambling and assigned the Office of Substance Abuse and Mental Health Services (SAMHS), within the Maine Department of Health and Human Services (DHHS), to administer that fund. In 2009 there was no existing budget, however at the time of this survey (SFY 2013) the dedicated problem gambling service budget was $50,000. In SFY 2013, those funds were invested in counselor training, a gambling helpline, treatment and prevention services, media resources, and public awareness services.
In 2013, Maine ranked 37th out of the 50 U.S. states in terms of per-capita public funds, plus unduplicated NCPG affiliate funds, invested in problem gambling services. The average per capita allocation for problem gambling services in the 39 states with publicly funded services was 32 cents; Maine’s per capita public investment was 4 cents.
DHHS funded a problem gambling helpline service through a contract with 2-1-1 Maine. Information regarding number of calls for help was not available at the time of the survey. At the time the survey was administered, DHHS has just started offering problem gambling treatment though two pilot treatment sites.
Gaming in Maine • • •
In 2012, Maine ranked 42nd out of 50 states and the D.C. in combined lottery sales, commercial casino gaming revenues, and Indian gaming revenues with $ 327.52 million reported. 2 In 2012, legalized gambling in Maine consisted of 1,739 electronic gaming machines, a traditional state lottery, video lottery, a stand-alone casino, racetrack casinos, and charitable gaming.
Problem Gambling Prevalence
• • • An estimated 2.2% of Maine adults (29,242 citizens) are believed to manifest a gambling disorder. 1
1 Based on a 2012 U.S. Census Bureau estimate of persons age 18 and over and the average rate found among all U.S. state problem gambling prevalence studies as reported and converted into a standardized past year problem gambling rate by Williams, Volberg, & Stevens (2012). 2 Based on combined revenue reports from: (a) The American Gaming Association (2013); (b) Meister, A. (2013); and (c) North America State and Provincial Lotteries (2013).
78

Maryland
Problem Gambling Services In 2007, the State of Maryland enacted state bills S83 and HB4, which designated how monies from a Casino Problem Gambling Fund were to be allocated and assigned the Maryland Center of Excellence on Problem Gambling, of the Department of Health and Mental Hygiene through the University of Maryland School of Medicine, to administer that fund. At the time of this survey (SFY 2013) the dedicated problem gambling service budget was $1,500,000. In SFY 2013, the Center of Excellence programmed 100% of those funds toward program administration, service evaluation, research, helplines, training and workforce development, public awareness services, treatment and prevention services, and media resources.
In addition to efforts by the Maryland Center of Excellence, the Maryland Council on Problem Gambling (MCPG), a non-profit organization, provides problem gambling services in the state and serves as the state affiliate to the National Council on Problem Gambling (NCPG). In 2013, the MCPG operated on a budget of $150,000, all of which came from a grant awarded by the State. The operating budget supported program administration, a problem gambling helpline, training and workforce development, media resources, and public awareness services.
In 2013, Maryland ranked 18th out of the 50 U.S. states in terms of per-capita public funds plus unduplicated NCPG affiliate funds invested in problem gambling services. The average per capita allocation for problem gambling services in the 39 states with publicly funded services was 32 cents; Maryland’s per capita public investment was 25 cents.
In 2012, the Maryland Problem Gambling Helpline, administered by the Center of Excellence, received 262 calls for help. Calls to the helpline made in the evenings and on weekends are routed to the Louisiana Council on Compulsive Gambling as part of the NCPG’s National Problem Gambling Helpline Network; these callers are referred to resources within Maryland. The Center of Excellence administers state-funded outpatient counseling services through contracts with community based mental health and/or substance use treatment agencies. As of the current survey period, there was no data collection system in place to track treatment utilization, but there were plans to implement such a system beginning in SFY 2014.
Gaming in Maryland • • •
In 2012, Maryland ranked 22nd out of 50 states and the D.C. in combined lottery sales, commercial casino gaming revenues, and Indian gaming revenues with $2.37 billion reported. 2 In 2012, legalized gambling in Maryland included 7,050 electronic gaming machines, a traditional state lottery, video lottery, 4 stand-alone casinos, racetrack casinos, pari-mutuel wagering, and charitable gaming.
Problem Gambling Prevalence
• • • An estimated 2.0% of Maryland adults (88,912 citizens) are believed to manifest a gambling disorder. 1
1 Based on a 2012 U.S. Census Bureau estimate of 4,445,636 persons age 18 and over and findings from two Maryland problem gambling prevalence studies (1988, 2010) converted into a standardized past year problem gambling rate by Williams, Volberg, & Stevens (2012). 2 Based on combined revenue reports from: (a) The American Gaming Association (2013); (b) Meister, A. (2013); and (c) North America State and Provincial Lotteries (2013).
79

Massachusetts
Problem Gambling Services In 1987 and 2004, the State of Massachusetts enacted legislation that designated how monies were to be allocated to address problem gambling and assigned the Massachusetts Department of Public Health (DPH), Bureau of Substance Abuse to administer dedicated problem gambling service funds. In SFY 2013, the dedicated state-funded problem gambling service budget was $1,362,200. Funding sources include unclaimed lottery winnings and racetracks revenues. The majority of the funds (98.5%) go to the Massachusetts Council on Compulsive Gambling (MCCG) for a problem gambling helpline, training, prevention, and public awareness efforts. A small portion is used to fund treatment services through the DPH addiction and mental health treatment system.
The MCCG serves as the state affiliate to the National Council on Problem Gambling (NCPG). In 2013, the MCCG operated on a budget of $1,482,200. The operating budget supported a problem gambling helpline, research, evaluation, public awareness services, counselor training and certification, and prevention services. The MCCG is one of the largest affiliates to the National Council on Problem Gambling in terms of budget, number of staff, and scope of services provided.
In 2013, Massachusetts ranked 22nd out of the 50 U.S. states in terms of per-capita public funds plus unduplicated NCPG affiliate funds invested in problem gambling services. The average per capita allocation for problem gambling services in the 39 states with publicly funded services was 32 cents; Massachusetts’ per capita public fund investment in problem gambling services was 20 cents.
In 2012, the Massachusetts Problem Gambling Helpline received 639 calls for help. The DPH funds outpatient counseling through contracts with community based mental health and/or substance use treatment agencies. The agencies bill the DPH as a payer of last resort. The DPH declined to provide the number of claims for problem gambling treatment in 2012, explaining there was not a good system to measure the true extent of treatment utilization at the time of the present survey.
Gaming in Massachusetts • • •
In 2012, Massachusetts ranked 8th out of 50 states and the D.C. in combined lottery sales, commercial casino gaming revenues, and Indian gaming revenues with $4.74 billion reported. 2 In 2012, legalized gambling in Massachusetts included a traditional state lottery, pari-mutuel wagering, and charitable gaming.
The gaming landscape will be changing in Massachusetts over the next five years. The 2011 Expanded Gaming Act allows for the development of three casinos and one slot parlor within an existing horse race track. Within two years at least one, if not all, of the allowed casinos/slot parlors will be operational.
Problem Gambling Prevalence
• • • An estimated 2.2% of Massachusetts adults (115,186 citizens) are believed to manifest a gambling disorder. 1
1 Based on a 2012 U.S. Census Bureau estimate of 5,230,515 persons age 18 and over and findings from a 1989 Massachusetts problem gambling prevalence study converted into a standardized past year problem gambling rate by Williams, Volberg, & Stevens (2012). 2 Based on combined revenue reports from: (a) The American Gaming Association (2013); (b) Meister, A. (2013); and (c) North America State and Provincial Lotteries (2013).
80

Michigan
Problem Gambling Services In 1997, the State of Michigan enacted Michigan Public Act No. 70 – Senate Bill No. 570, which designated how monies from casino and lottery fees were to be allocated and earmarked to address problem gambling, and assigned the Michigan Department of Community Health (MDCH), Bureau of Substance Abuse and Addiction Services, to administer that fund. In 2009 that amount was $3,000,000 and at the time of this survey (SFY 2013) the dedicated problem gambling service budget was $3,000,000. SFY 2013, the MDCH programmed 82% of those funds toward research, a problem gambling helpline, training and workforce development, treatment and prevention services, and media resources. Approximately 18% of the budget’s funds remained unallocated. The MDCH contracts with the Neighborhood Service Organization (NSO) to administer the Problem Gambling Treatment Program and the Michigan Problem Gambling Helpline. The MDCH also contracts with Wayne State University for problem gambling research.
In addition to efforts by the MDCH and their contractors, the Michigan Association on Problem Gambling (MAPG), a non-profit organization, also provides problem gambling services and serves as the state affiliate to the National Council on Problem Gambling (NCPG). In 2013, the MAPG operated on a budget of $11,500, of which $10,000 came from a tribal government grant and $1,500 from membership fees. The operating budget supported program administration, public awareness services, and casino employee training.
In 2013, Michigan ranked 16th out of the 50 U.S. states in terms of per-capita public funds plus unduplicated NCPG affiliate funds invested in problem gambling services. The average per capita allocation for problem gambling services in the 39 states with publicly funded services was 32 cents; Michigan’s per capita public investment in problem gambling services was 30 cents.
In SFY 2012, the Michigan Problem Gambling Helpline received 1,556 calls for help. The NSO administers state-funded outpatient counseling through contracts with community based mental health and/or substance use treatment agencies and counselors. In SFY 2012, the MDCH reported 579 individuals received state-funded outpatient counseling for problem gambling.
Gaming in Michigan • • •
In 2012, Michigan ranked 7th out of 50 states and the D.C. in combined lottery sales, commercial casino gaming revenues, and Indian gaming revenues with $5.3 billion reported. 2 In 2012, legalized gambling in Michigan included 34,159 electronic gaming machines, 26 casinos, Indian casinos, a traditional state lottery, video lottery, internet lottery, pari-mutuel wagering, and charitable gaming.
Problem Gambling Prevalence
• • • An estimated 2.1% of Michigan adults (151,930 citizens) are estimated to manifest a gambling disorder. 1
1 Based on a 2012 U.S. Census Bureau estimate of 7,234,755 persons age 18 and over and findings from four Michigan problem gambling prevalence studies (1997, 1999, 2001, 2006) converted into a standardized past year problem gambling rate by Williams, Volberg, & Stevens (2012). 2 Based on combined revenue reports from: (a) The American Gaming Association (2013); (b) Meister, A. (2013); and (c) North America State and Provincial Lotteries (2013).
81

Minnesota
Problem Gambling Services Compulsive Gambling Treatment Program (CGTP), under the Department of Human Services, had a SFY 2013 budget of $2,200,000. The CGTP programmed those funds toward treatment and prevention services, program administration, a gambling helpline, training and workforce development, problem gambling public awareness services, counselor certification, and a gambling assessment program of felony convictions for theft, embezzlement, or forgery.
In the 2012 legislative session a bill passed that appropriated 0.5% of tax revenues from forms of charitable gambling to the state Compulsive Gambling Treatment Program with an additional 0.5% appropriated to the state affiliate to the National Council on Problem Gambling. At the time the survey was conducted, it was unknown much funding would be received from this source.
In addition to efforts by the CGTP, the Northstar Problem Gambling Alliance (NPGA), a non-profit organization, provides problem gambling services and serves as the state affiliate to the NCPG. In 2013, the NPGA operated on a budget of $275,000; sources included $225,000 from a state grant, $45,000 in donations from non-tribal casinos or gaming operators, and $5,000 in donations from tribal governments/casinos. The operating budget supported problem gambling research, counselor training, and public awareness services.
In 2013, Minnesota ranked 14th out of the 50 U.S. states in terms of per-capita public funds plus unduplicated NCPG affiliate funds invested in problem gambling services. The average per capita allocation for problem gambling services in the 39 states with publicly funded services was 32 cents; Minnesota’s per capita public investment in services was 37 cents.
In SFY 2012, the Canvas Health/Crisis Connection received 906 calls for help to the problem gambling specific helpline. The CGTP funds outpatient counseling through contracts with community based mental health and/or substance use treatment agencies and counselors. In SFY 2012, 627 gamblers received state-funded outpatient treatment.
Gaming in Minnesota • • •
In 2012, Minnesota ranked 24th out of 50 states and the D.C. in combined lottery sales, commercial casino gaming revenues, and Indian gaming revenues with $1.95 billion reported. 2 In 2012, legalized gambling in Minnesota included 22,585 electronic gaming machines, 15 Indian casinos, a state lottery with traditional and an internet games, racetrack casinos, pari-mutuel wagering, and charitable gaming.
Problem Gambling Prevalence
• • • An estimated 3.6% of Minnesota adults (147,357 citizens) are believed to manifest a gambling disorder. 1
1 Based on a 2012 U.S. Census Bureau estimate of 4,093,524 persons age 18 and over and findings from two Minnesota problem gambling prevalence studies (1990, 1994) converted into a standardized past year problem gambling rate by Williams, Volberg, & Stevens (2012). 2 Based on combined revenue reports from: (a) The American Gaming Association (2013); (b) Meister, A. (2013); and (c) North America State and Provincial Lotteries (2013).
82

Mississippi
Problem Gambling Services When Mississippi casinos were established in 1996 there was an agreement to fund the Mississippi Council on Problem and Compulsive Gambling (MCPCG). Under this agreement, each of Mississippi’s 30 casinos donates $5,000 to the MCPCG for a combined contribution of $150,000 annually. During the same time period, Mississippi Gaming Commission donated an additional $100,000 to the MCPCG. All funding to the MCPCG, for problem gambling services, was based on donations without any formal contractual agreement. Other than state employees responsible for the state’s self-exclusion program from licensed casinos, there is neither a state employee specifically responsible for problem gambling services nor any dedicated funding of state-supported problem gambling services other than the $100,000 donation from the Mississippi Gambling Commission to the MCPCG.
The MCPCG serves as the state affiliate to the National Council on Problem Gambling (NCPG). In SFY 2013, the MCCG operated on a budget of $280,000, of which $100,000 came from the fore mentioned donation from the Gaming Commission, $150,000 came in donations from non-tribal casinos operators, and $30,000 was income from sales of training or conference registrations. The operating budget supported a problem gambling helpline, research, evaluation, public awareness services, counselor training and certification, and prevention services.
In 2013, Mississippi ranked 32nd out of the 50 U.S. states in terms of per-capita public funds plus unduplicated NCPG affiliate funds invested in problem gambling services. The average per capita allocation for problem gambling services in the 39 states with publicly funded services was 32 cents; Mississippi’s per capita public investment was 3 cents.
In 2012, the MCPCG contracted with Bensinger, DuPont & Associates to provide a problem gambling helpline service for the state. In SFY 2012, the helpline received 567 calls for help. As of SFY 2013, there were no publicly funded or MCPCG funded problem gambling treatment services in the state.
Gaming in Mississippi2 • • •
In 2012, Mississippi ranked 23rd out of 50 states and the D.C. in combined lottery sales and commercial casino gaming revenues with $2.25 billion reported. Indian gaming revenues are not included in this calculation as that information was regarded as confidential. In 2012, legalized gambling in Mississippi included 36,032 electronic gaming machines, 30 land based casinos, 3 Indian casinos, and charitable gaming.
Problem Gambling Prevalence1
• • • An estimated 3.9% of Mississippi adults (116,412 citizens) are believed to manifest a gambling disorder.
1 Based on a 2012 U.S. Census Bureau estimate of 2,984,926 persons age 18 and over and findings from a 1996 Mississippi problem gambling prevalence study converted into a standardized past year problem gambling rate by Williams, Volberg, & Stevens (2012). 2 Based on combined revenue reports from: (a) The American Gaming Association (2013); (b) Meister, A. (2013); and (c) North America State and Provincial Lotteries (2013).
83

Missouri
Problem Gambling Services In 1993 and 2000, the State of Missouri enacted legislation that designated how monies from Casino Gaming Administration Fees and the state lottery were to be allocated to address problem gambling, and assigned the Missouri Department of Mental Health, Division of Behavioral Health (DBH), to administer that fund. In 2009 that amount was $747,402, and at the time of this survey (SFY 2013) the dedicated problem gambling service budget was $313,795. In SFY 2013, the DBH programmed those funds toward treatment services, program administration, media resources, and prevention services.
The DBH contracts with Certified Compulsive Gambling Counselors to provide free treatment services to problem gamblers and their family members. Family members can access services regardless of whether the problem gambler enters treatment. During calendar year 2012, 169 gamblers and 18 significant others received state-funded outpatient treatment. The Missouri Gaming Association (MGA) directly funds 1-888-BETSOFF (1-888-238-7633), a statewide problem gambling crisis helpline and referral service.
In addition to efforts by the DBH and MGA, the Missouri Council on Problem Gambling (MCPG), a non-profit organization, provides problem gambling advocacy services and serves as the state affiliate to the National Council on Problem Gambling (NCPG). The MCPG is an all-volunteer organization that operates without funding or a fiscal budget. The Council’s primary role is to advocate on behalf of problem gamblers and their families.
Another entity with Missouri that works to raise public awareness of problem gambling and responsible gaming is the Missouri Alliance to Curb Problem Gambling (MACPG), a partnership between the Missouri Council on Problem Gambling Concerns Inc., the Missouri Department of Mental Heath's Division of Alcohol & Drug Abuse, the Missouri Gaming Association, the Missouri Gaming Commission, the Missouri Lottery and the Port Authority of Kansas City
In 2013, Missouri ranked 36th out of the 50 U.S. states in terms of per-capita public funds plus unduplicated NCPG affiliate funds invested in problem gambling services. The average per capita allocation for problem gambling services in the 39 states with publicly funded services was 32 cents; Missouri’s per capita public investment in problem gambling services was 5 cents.
Gaming in Missouri • • •
In 2012, Missouri ranked 18th out of 50 states and the D.C. in combined lottery sales, commercial casino gaming revenues, and Indian gaming revenues with $2.87 billion reported. 2 In 2012, legalized gambling in Missouri consisted of 18,336 electronic gaming machines in the state, Indian casinos, a traditional state lottery, stand-alone casinos, and charitable gaming.
Problem Gambling Prevalence
• • • An estimated 2.2% of Missouri adults (101,350 citizens) are believed to manifest a gambling disorder. 1
1 Based on a 2012 U.S. Census Bureau estimate of 4,606,820 persons age 18 and over and the average rate found among all U.S. state problem gambling prevalence as reported and converted into a standardized past year problem gambling rate by Williams, Volberg, & Stevens (2012). 2 Based on combined revenue reports from: (a) The American Gaming Association (2013); (b) Meister, A. (2013); and (c) North America State and Provincial Lotteries (2013).
84

Montana
Problem Gambling Services As of SFY 2013, the State of Montana did not provide public funding dedicated for problem gambling services, and there were no publicly funded programs specifically for problem gambling treatment or problem gambling prevention. The state of Montana does not have an agency with membership in the Association for Problem Gambling Service Administrators; however the Montana Council on Problem Gambling (MCPG), a non-profit organization, provides problem gambling services in the state and serves as the state affiliate to the National Council on Problem Gambling (NCPG). In SFY 2013 the MCPG operated on a budget of $167,518, sourced from non-tribal gaming operators, training and/or conference registration fees, and other miscellaneous sources. In SFY 2013 the MCPG’s per capita investment in problem gambling services throughout the state was 17 cents. The operating budget supported program administration, training and workforce development, treatment and prevention services, and media outreach efforts.
The MCPG funds outpatient treatment for problem gambling through contracts with the 24 problem gambling treatment providers in the state. The State of Montana does not require providers to have any separate licensure or certification specifically for problem gambling counseling, but does require that they be a licensed counselor or social worker. The MCPG reported 1,243 gamblers and 142 significant others received outpatient treatment through these contracts in SFY 2012. Montana’s gaming industry directly funds a problem gambling helpline service for the state that utilizes the National Problem Gambling Helpline Number (800.522.4700) through a contract with the Delaware Council on Gambling Problems to cover calls from Montana to the national number and provides resources and treatment referrals within Montana.
Gaming in Montana2 • • •
In 2012, Montana ranked 49th out of 50 states and the D.C. in combined lottery sales, commercial casino gaming revenues, and Indian gaming revenues with $71.5 million reported. 1 In 2012, legalized gambling in Montana consisted of 15,087 electronic gaming machines, Indian casinos, stand-alone casinos, a traditional state lottery, video lottery, pari-mutuel wagering, and charitable gaming.
1 Based on a 2012 U.S. Census Bureau estimate of persons age 18+ multiplied by the national average adult past year prevalence rates of problem gambling as reported and converted into standardized rates by Williams, Volberg, & Stevens (2012). 2Based on combined revenue reports from: (a) The American Gaming Association (2013); (b) Meister (2013); and (c) North America State and Provincial Lotteries (2013).
Problem Gambling Prevalence1
• • • An estimated 2.2% of Montana adults (17,226 citizens) are believed to manifest a gambling disorder. 1
85

Nebraska
Problem Gambling Services In 1992, the State of Nebraska enacted legislation, which designated how monies from charitable gaming, the Lottery, and Health Care Cash were to be allocated to a Compulsive Gambling Fund to address problem gambling and assigned the Department of Health and Human Services (DHHS) to administer that fund. In 2009 the amount for that fund was $1,309,195, and at the time of this survey (SFY 2013) the dedicated problem gambling service budget was $1,475,620. In SFY 2013, those
funds were programmed toward program administration, a problem gambling helpline, training and workforce development, evaluation, and treatment and prevention services. The DHHS also provided problem gambling research, public awareness services, and counselor certification.
The DHHS also funds the Nebraska Council on Compulsive Gambling (NCCG), a non-profit organization that serves as the state affiliate to the National Council on Problem Gambling, to provide problem gambling services. In 2013, the NCCG operated on a budget of $70,000 from a grant from the DHHS. The operating budget supported program administration and treatment and prevention services.
In 2013, Nebraska ranked 5th out of the 50 U.S. states in terms of per-capita public funds plus unduplicated NCPG affiliate funds invested in problem gambling services. The average per capita allocation for problem gambling services in the 39 states with publicly funded services was 32 cents; Nebraska’s per capita public investment in problem gambling services was 79 cents.
In 2012, the state-funded Nebraska Problem Gambling Helpline, contracted out to Bensinger, DuPont & Associates, received 110 calls for help. The DHHS funds outpatient counseling through contracts with community based mental health and/or substance use treatment agencies and counselors. In SFY 2012, 173 gamblers and 40 significant others received state-funded outpatient counseling for problem gambling.
Gaming in Nebraska2 • • •
In 2012, Nebraska ranked 47th out of 50 states and the D.C. in combined lottery sales, Indian gaming revenues, and commercial casino gaming revenues with $150.61 million reported. However, Indian gaming revenues were not included in this calculation as among some Nebraska tribes that information was regarded as confidential. In 2012, legalized gambling in Nebraska included a traditional state lottery, 7 Indian casinos, and charitable gaming.
Problem Gambling Prevalence1
• • • An estimated 2.42% of Nebraska adults (40,822 citizens) are believed to manifest a gambling disorder.
1 Based on a 2012 U.S. Census Bureau estimate of 1,855,525 persons age 18 and over and findings from a 1997 Nebraska problem gambling prevalence study converted into a standardized past year problem gambling rate by Williams, Volberg, & Stevens (2012). 2 Based on combined revenue reports from: (a) The American Gaming Association (2013); (b) Meister, A. (2013); and (c) North America State and Provincial Lotteries (2013).
86

Nevada
Problem Gambling Services In 2005, the State of Nevada enacted State Bill 357, which created the Revolving Account for the Prevention and Treatment of Problem Gambling and an Advisory Committee on Problem Gambling (ACPG) to advise the Department of Health and Human Services (DHHS) in its administration of this account. In 2011 the Nevada Legislature adopted Assembly Bill 500, which temporarily reduced the amount of the slot tax revenue directed to problem gambling services from $2 per machine to $1 per machine.
At the time of this survey (SFY 2013) the dedicated problem gambling service budget was $770,104, and the ACPG, in association with DHHS, programmed those funds toward gambling treatment services and treatment service supports including program administration, evaluation, counselor training, and consultation.
In addition to efforts by the DHHS, the Nevada Council on Problem Gambling (NCPG), a non-profit organization, also provides problem gambling services and serves as the state affiliate to the National Council on Problem Gambling. In 2013, the NCPG operated on a budget of $365,686; primarily sourced by $269,000 in donation and sales revenue from non-tribal casinos or gaming operators. The operating budget supported a problem gambling helpline, public awareness services, counselor training, and prevention services.
In 2013, Nevada ranked 13th out of the 50 U.S. states in terms of per-capita public funds plus unduplicated NCPG affiliate funds invested in problem gambling services. The average per capita allocation for problem gambling services in the 39 states with publicly funded services was 32 cents; Nevada’s per capita public investment was 28 cents.
The Nevada Council funds a problem gambling helpline service that it contracts out to the Louisiana Problem Gamblers Helpline; in SFY 2012 the National Problem Gambling Helpline (800.522.4700) received 1,080 calls for help from Nevada. The DHHS funds outpatient and residential gambling treatment through grants with two community-based substance use treatment agencies, two non-profit problem gambling treatment centers, and one for-profit specialized gambling treatment grantee. In SFY 2012, 548 gamblers and 58 significant others received state-funded outpatient counseling services, and 47 individuals received state-funded residential treatment.
Gaming in Nevada2 • • •
In 2012, Nevada ranked 3rd out of 50 states and the D.C. in combined lottery sales, commercial casino gaming revenues, and Indian gaming revenues with $10.86 billion reported. However, this figure is slightly under reported as gaming revenues from 3 Indian casinos were not included in this calculation as among some Nevada tribes that information was regarded as confidential. In 2012, legalized gambling in Nevada included 178,724 electronic gaming machines, 265 casinos, 3 Indian casinos, and charitable gaming.
Problem Gambling Prevalence1
• • • An estimated 2.7% of Nevada adults (56,315 citizens) are believed to manifest a gambling disorder.
1 Based on a 2012 U.S. Census Bureau estimate of 2,085,751 persons age 18 and over and findings from a 2001 Nevada problem gambling prevalence study converted into a standardized past year problem gambling rate by Williams, Volberg, & Stevens (2012). 2 Based on combined revenue reports from: (a) The American Gaming Association (2013); (b) Meister, A. (2013); and (c) North America State and Provincial Lotteries (2013).
87
New Hampshire
Problem Gambling Services As of SFY 2013, the State of New Hampshire did not provide public funding dedicated to problem gambling services, and there were no publicly funded programs specifically for problem gambling treatment or problem gambling prevention. The state of New Hampshire employee serves as a member of the Association for Problem Gambling Service Administrators and New Hampshire does not have an organization designated as an affiliate to the National Council on Problem Gambling (NCPG).
The National Council on Problem Gambling contracts with the Louisiana Problem Gamblers Helpline to cover calls originating from New Hampshire to the National Problem Gambling Helpline.
Gaming in New Hampshire2
• • • In 2012, New Hampshire ranked 44th out of 50 states and the D.C. in combined lottery sales, commercial casino gaming revenues, and Indian gaming revenues with $254.92 million reported. In 2012, legalized gambling in New Hampshire consisted of a traditional state lottery, pari-mutuel wagering, and charitable gaming. There were no electronic gaming machines in the state.
1 1 Based on a 2012 U.S. Census Bureau estimate of persons age 18+ multiplied by the national average adult past year prevalence rates of problem gambling as reported and converted into standardized rates by Williams, Volberg, & Stevens (2012). 2Based on combined revenue reports from: (a) The American Gaming Association (2013); (b) Meister (2013); and (c) North America State and Provincial Lotteries (2013).
Problem Gambling Prevalence1
• • • An estimated 2.2% of New Hampshire adults (22,896 citizens) are believed to manifest a gambling disorder. 1
88

New Jersey
Problem Gambling Services In 1983, the State of New Jersey enacted A2578, which designated how monies from casino fines, the racing industry, and forfeited casino winnings were to be allocated to address problem gambling and transfers those funds to the Department of Human Services/ Division of Mental Health & Addiction (DHS). The DHS outsources the administration of problem gambling services through a contract with the Council on Compulsive Gambling of New Jersey (CCGNJ). In SFY 2013, the DHS problem gambling service budget was $850,000 for which 100% of those funds were granted to the CCGNJ. In SFY 2013, an internet gambling bill was passed that contained provisions that would further increase funding for problem gambling services. Under the new bill, enacted in February 2013, each license will pay $140,000 to the CCGNJ for problem gambling services and $110,000 specifically for problem gambling treatment.
The CCGNJ is a non-profit organization that serves as the state affiliate to the National Council on Problem Gambling (NCPG). In SFY 2013, the CCGNJ operated on a budget of $934,000, including the $850,000 state grant and $47,500 in donations from non-tribal casinos, as well as sales revenues. The operating budget supported a problem gambling helpline, evaluation services, public awareness, counselor training, and treatment and prevention services. The CCGNJ is one of the largest affiliates to the National Council on Problem Gambling in terms of budget, number of staff, and scope of services provided.
In 2013, New Jersey ranked 29th out of the 50 U.S. states in terms of per-capita public funds plus unduplicated NCPG affiliate funds invested in problem gambling services. The average per capita allocation for problem gambling services in the 39 states with publicly funded services was 32 cents; New Jersey’s per capita public investment was 10 cents.
The CCGNJ funds and administers the New Jersey Problem Gambling Helpline (1-800-GAMBLER), which received 1,553 calls for help in SFY 2012. Bensinger Dupont provides evenings, weekends, and overflow helpline coverage; NJCCG handles helpline calls all other times. The CCGNJ subcontracts with community based mental health and/or substance use treatment agencies and certified compulsive gambling counselors for the delivery of compulsive gambling treatment services. In SFY 2012, 332 individuals received gambling outpatient treatment, and 16 individuals received residential treatment.
Gaming in New Jersey2 • • •
In 2012, New Jersey ranked 6th out of 50 states and the D.C. in combined lottery sales, commercial casino gaming revenues, and Indian gaming revenues with $5.81 billion reported. In 2012, legalized gambling in New Jersey consisted of 26,883 electronic gaming machines, 12 Indian casinos, a traditional state lottery, commercial casinos, pari-mutuel wagering, and charitable gaming.
Problem Gambling Prevalence1
• • • An estimated 2.8% of New Jersey adults (190,624 citizens) are believed to manifest a gambling disorder.
1 Based on a 2012 U.S. Census Bureau estimate of 6,808,005 persons age 18 and over and findings from two New Jersey problem gambling prevalence studies (1988, 1990) converted into a standardized past year problem gambling rate by Williams, Volberg, & Stevens (2012). 2 Based on combined revenue reports from: (a) The American Gaming Association (2013); (b) Meister, A. (2013); and (c) North America State and Provincial Lotteries (2013).
89

New Mexico
Problem Gambling Services In 1998, the State of New Mexico enacted the Gaming and Liquor Control Act NMAC 15.1.1.1, which included a provision where racinos and charitable gaming operators are required to spend no less than .25 of 1% of their net win revenue on support programs for the treatment and assistance of compulsive gamblers. Each gaming operator develops their own plan for those funds. Those plans are submitted to the Department of Gaming for approval. The result is a non-centralized effort to address problem gambling where funding does not pass through a state agency. Most of the Racinos program a sizable portion of their responsible gaming (RG) funds to the New Mexico Council on Problem Gambling (NMCPG) while the Indian Gaming Casinos exercise greater diversity in how they program their RG funds. Additionally, in SFY 2013 the New Mexico Lottery Corporation provided $87,400 in funding to the NMCPG to support the New Mexico Problem Gambling Helpline. Historically, the Behavioral Health Services Division (BHSD) has received general fund dollars to support the Governor’s Compulsive Gambling Council; however for SFY13 those funds have reverted to the treatment fund of the BHSD.
The New Mexico Council on Problem Gambling (NMCPG), a non-profit organization, provided problem gambling services throughout the state and served as the state affiliate to the National Council on Problem Gambling (NCPG). In SFY 2013, the NMCPG operated on a budget of $724,718, primarily from $370,000 in donations from tribal governments or casinos and $353,918 in donations from non-tribal casinos or gaming operators. The operating budget supported a gambling treatment system, program administration, evaluation, a problem gambling helpline, training and workforce development, and prevention services.
In 2013, New Mexico ranked 12th out of the 50 U.S. states in terms of per-capita public funds plus unduplicated NCPG affiliate funds invested in problem gambling services. The average per capita allocation for problem gambling services in the 39 states with publicly funded services was 32 cents; New Mexico’s per capita public investment was about 8 cents.
The NMCPG administers the state-funded New Mexico 24-hour Crisis Hotline that includes services for problem gamblers. In SFY 2012 the Hotline received 455 calls for help specific to problem gambling. In SFY 2012 the NMCPG reported 537 individuals received outpatient counseling for problem gambling. Additionally, there are other problem gambling treatment centers in the state that are supported by Indian casinos.
Gaming in New Mexico • • •
In 2012, New Mexico ranked 36th out of 50 states and the D.C. in combined lottery sales, commercial casino gaming revenues, and Indian gaming revenues with $1.18 billion reported. 2 In 2012, legalized gambling in New Mexico included 10,084 electronic gaming machines, Indian casinos, a traditional state lottery, racetrack casinos, pari-mutuel wagering, and charitable gaming.
Problem Gambling Prevalence
• • • An estimated 1.2% of New Mexico adults (18,795 citizens) are believed to manifest a gambling disorder. 1
1 Based on a 2012 U.S. Census Bureau estimate of 1,566,239 persons age 18 and over and findings from a 2006 New Mexico problem gambling prevalence study converted into a standardized past year problem gambling rate by Williams, Volberg, & Stevens (2012). 2 Based on combined revenue reports from: (a) The American Gaming Association (2013); (b) Meister (2013); (c) North America State and Provincial Lotteries (2013).
90

New York
Problem Gambling Services As of SFY 2013, the State of New York had yet to enact legislation to create a distinct fund for problem gambling services. However, the legislature has historically allocated general fund dollars to support problem gambling services. In SFY 2013 those funds totaled $2,235,000 and were administered by the New York State Office of Alcoholism and Substance Abuse Services (OASAS). OASAS programmed 100% of those funds toward problem gambling treatment service, problem gambling prevention services, and service supports including a problem gambling helpline, counselor training and certification, and public awareness efforts.
In addition to the OASAS, the New York Council on Problem Gambling (NYCPG), a non-profit organization, provides problem gambling services in the state and serves as the state affiliate to the National Council on Problem Gambling (NCPG). In SFY 2013 the NYCPG operated on a budget of $1,015,000, including a state contract for $985,000, $20,000 in revenues from sales of training or conference registrations, and $10,000 in grants from the gaming industry (non-operator). The operating budget supported program administration, counselor training, workforce development, prevention services, and advocacy and public awareness efforts.
In 2013, New York ranked 27th out of the 50 U.S. states in terms of per-capita public funds plus unduplicated NCPG affiliate funds invested in problem gambling services. The average per capita allocation for problem gambling services in the 39 states with publicly funded services was 32 cents; New York’s per capita public investment was 11 cents.
The state-funded New York State Hopeline, administered by the Mental Health Association of New York City, received 1,224 calls for help specifically for problem gambling. At the time of the present survey there were a total of 359 certified problem gambling treatment counselors in the state as well as an additional 36 credentialed prevention practitioners specializing in problem gambling. In SFY 2013, 390 gamblers and 24 significant others received state-funded outpatient counseling services for problem gambling. The State also funds some residential treatment services for problem gambling and a myriad of prevention and awareness activities.
Gaming in New York • • •
In 2012, New York ranked 2nd out of 50 states and the D.C. in combined lottery sales, commercial casino gaming revenues, and Indian gaming revenues with $11.16 billion reported. 2 In 2012, legalized gambling in New York included 29,145 electronic gaming machines, 14 Indian casinos, a traditional state lottery, video lottery, internet lotteries, racetrack casinos, pari-mutuel wagering, and charitable gaming.
1 Based on a 2012 U.S. Census Bureau estimate of 15,264,803 persons age 18 and over and findings from three New York problem gambling prevalence studies (1986, 1996, 2006) converted into a standardized past year problem gambling rate by Williams, Volberg, & Stevens (2012). 2 Based on combined revenue reports from: (a) The American Gaming Association (2013); (b) Meister (2013); and (c) North America State and Provincial Lotteries (2013).
Problem Gambling Prevalence
• • • An estimated 1.6% of New York adults (244,236 citizens) are believed to manifest a gambling disorder. 1
91

North Carolina
Problem Gambling Services In 2005, the State of North Carolina enacted HB1023, which earmarked funds to address problem gambling and assigned the North Carolina Department of Health and Human Services (NCDHHS) to administer those funds. In 2009 that amount was $1 million, and at the time of this survey (SFY 2013) the dedicated problem gambling service budget remained $1 million. In SFY 2013, the DHHS programmed 100% of those funds toward gambling treatment and problem gambling prevention services along with support services including program administration, service evaluation, research, a problem gambling helpline, training, and workforce development.
In addition to efforts by the DHHS, the North Carolina Council on Problem Gambling (NCCPG), a non-profit organization, provides problem gambling public awareness services and serves as the state affiliate to the National Council on Problem Gambling (NCPG). The NCCPG is an all-volunteer organization whose mission it is to help the public contact available problem and compulsive gambling services in the state and to put citizens in contact with Gamblers Anonymous meetings. The NCCPG also provides educational literature and informational talks throughout the state.
In 2013, North Carolina ranked 30th out of the 50 U.S. states in terms of per-capita public funds plus unduplicated NCPG affiliate funds invested in problem gambling services. The average per capita allocation for problem gambling services in the 39 states with publicly funded services was 32 cents; North Carolina’s per capita public fund investment was 10 cents.
The DHHS funds the North Carolina Problem Gambling Helpline, which is administered by Bensinger, DuPont & Associates. In SFY 2012 the helpline received 991 calls for help. The DHHS contracts with licensed mental health counselors for outpatient problem gambling treatment services. In SFY 2012, 135 gamblers and 24 significant others received state-funded outpatient treatment for problem gambling.
Gaming in North Carolina 2 • • •
In 2012, North Carolina ranked 28th out of 50 states and the D.C. in combined lottery sales, commercial casino gaming revenues, and Indian gaming revenues with $1.6 billion reported. However, this figure is under reported as gaming revenues from the state’s two Indian casinos were not included in this calculation as among some North Carolina tribes that information was regarded as confidential. In 2012, legalized gambling in North Carolina included 3,145 electronic gaming machines, a traditional state lottery, Indian casinos, and charitable gaming.
Problem Gambling Prevalence1
• • • An estimated 2.2% of North Carolina adults (214,456 citizens) are believed to manifest a gambling disorder.
1 Based on a 2012 U.S. Census Bureau estimate of persons age 18 and over and the average rate found among all U.S. state problem gambling prevalence studies as reported and converted into a standardized past year problem gambling rate by Williams, Volberg, & Stevens (2012). 2 Based on combined revenue reports from: (a) The American Gaming Association (2013); (b) Meister (2013); and (c) North America State and Provincial Lotteries (2013).
92

North Dakota
Problem Gambling Services In 1997, the State of North Dakota enacted SB2318, which designated how monies from the Lottery were to be allocated and earmarked to a Gambling General Fund to address problem gambling and assigned the Department of Human Services, Division of Mental Health and Substance Abuse Services (DMHSAS) to administer that fund. In 2009 that amount was $200,000, and at the time of this survey (SFY 2013) the dedicated problem gambling service budget was $325,000. In SFY 2013, the DMHSAS programmed 100% of those funds toward treatment services, a problem gambling helpline, media and public awareness resources, and a needs assessment program. North Dakota does not have a designated state affiliate to the National Council on Problem Gambling.
In 2013, North Dakota ranked 11th out of the 50 U.S. states in terms of per-capita public funds plus unduplicated NCPG affiliate funds invested in problem gambling services. The average per capita allocation for problem gambling services in the 39 states with publicly funded services was 32 cents; North Dakota’s per capita public investment was 46 cents.
The DMHSAS funds problem gambling helpline services that are part of the FirstLink 2-1-1 Helpline, but reported that the helpline receives very few calls about problem gambling, estimated at 10 calls per month. The DMHSAS contracts with community based mental health and/or substance use treatment agencies to provide problem gambling outpatient treatment services. In SFY 2012, 145 individuals received state-funded outpatient treatment for problem gambling.
Gaming in North Dakota • • •
In 2012, North Dakota ranked 46th out of 50 states and the D.C. in combined lottery sales, commercial casino gaming revenues, and Indian gaming revenues with $194.6 million reported. 2 In 2012, legalized gambling in North Dakota included 3,647 electronic gaming machines, a traditional state lottery, Indian casinos, pari-mutuel wagering, and charitable gaming.
Problem Gambling Prevalence
• • • An estimated 1.5% of North Dakota adults (8,175 citizens) are believed to manifest a gambling disorder. 1
1 Based on a 2012 U.S. Census Bureau estimate of 545,010 persons age 18 and over and findings from two North Dakota problem gambling prevalence studies (1992, 2000) converted into a standardized past year problem gambling rate by Williams, Volberg, & Stevens (2012). 2 Based on combined revenue reports from: (a) The American Gaming Association (2013); (b) Meister, A. (2013); and (c) North America State and Provincial Lotteries (2013).
93

Ohio
Problem Gambling Services The State of Ohio began addressing issues around problem gambling over ten years ago. In 2002, the Ohio Department of Alcohol and Drug Addiction Services (ODADAS) partnered with the Ohio Lottery Commission (OLC) to address the treatment needs of those individuals experiencing alcohol and other drug addiction along with the co-occurring disorder of pathological gambling.1 The partnership funded four pilot projects located in Athens, Hamilton, Mahoning, and Lucas counties, with each receiving $35,000. In 2003, Cuyahoga County was added as a fifth pilot project site, and funding for the previously established pilot projects was increased to $50,000 each. Two years later the Cuyahoga County program received an additional $25,000 to provide a dual focus for prevention/early intervention and treatment programming for the adolescent population (General Assembly of Ohio Fiscal Note, 2004). State funding to address problem gambling remained relatively stable from 2003 to 2012, averaging approximately $335,000 each fiscal year. In 2009, Ohio passed a constitutional amendment legalizing casino development. The legislation included a 2% tax on gross casino revenue to be earmarked for treatment of problem gambling and substance abuse, along with relevant research. In SFY 2013, $1.95 million was invested in the following problem gambling services: a problem gambling helpline, research, evaluations, public awareness, counselor trainings and certifications, and treatment and prevention services. As casino revenues increase (expected to more than double from SFY 2013 levels), it is expected that more funds will be invested in problem gambling services. In 2013, Ohio ranked 24th out of the 50 U.S. states in terms of per-capita public funds plus unduplicated NCPG affiliate funds invested in problem gambling services. The average per capita allocation for problem gambling services in the 39 states with publicly funded services was 32 cents; Ohio’s per capita public investment in such services was 17 cents.
In addition to ODADAS, there is the Problem Gambling Network of Ohio (PGNO), a non-profit organization that serves as the state affiliate to the National Council on Problem Gambling. In 2013, the PGNO operated on a budget of $7,630, which was sourced by donations from memberships and additional funds carried over from past years. This operating budget supported a gambling helpline, public awareness activities, and family support and advocacy services.
In 2012, the United Way First Call for Help problem gambling helpline for the state of Ohio received 1,576 calls for help. ODADAS reported that 80 individuals were treated for problem gambling in 2012.
Problem Gambling Prevalence2
• • • The prevalence of at-risk and problem gambling in Ohio is 2.8%, which equates to an estimated 246,561 individuals in the target population of 8,805,761.* *(18 years and older)
1 Effective July 1, 2013, ODADAS was combined with the Department of Mental Health to form the Ohio Department of Mental Health and Addiction Services (ODMHAS). 2 Based on the 2012 Ohio Gambling Survey, ODADAS Division of Planning, Outcomes and Research. https://docs.google.com/file/d/0B37bpQXLYeAPYk52ckdJc1dwNG8/edit?pli=1 3 Based on combined revenue reports from: (a) The American Gaming Association (2013); (b) Meister, A. (2013); and (c) North America State and Provincial Lotteries (2013).
Gaming in Ohio3 • • •
In 2012, Ohio ranked 16th out of 50 states and the D.C. in combined lottery sales, commercial casino gaming revenues, and Indian gaming revenues with $3.18 billion reported. In 2012, legalized gambling in Ohio consisted of 9,023 electronic gaming machines, a traditional state lottery, stand-alone casinos, racetrack casinos, pari-mutuel wagering, and charitable gaming.
94
Oklahoma
Problem Gambling Services In 2005, the State of Oklahoma enacted legislation that designated how monies from Indian Gaming and the State of Oklahoma were to be allocated to address problem gambling and assigned the Oklahoma Department of Mental Health and Substance Abuse (DMHSA) to administer those funds. In 2009 that amount was $750,000, and at the time of this survey (SFY 2013) the dedicated problem gambling service budget remained $750,000. In SFY 2013, the DMHSA programmed 100% of those funds toward treatment services, program administrative, a problem gambling helpline, as well as outreach and advocacy activities via a contract with the Oklahoma Association for Problem and Compulsive Gambling (OAPCG).
The OAPCG is a non-profit organization that provides problem gambling services and serves as the state affiliate to the National Council on Problem Gambling (NCPG). In 2013, the OAPCG operated on a budget of $200,000, sourced by a $142,000 state contract, and $58,000 in donations from tribal governments. The operating budget supported a problem gambling helpline, research, service evaluation, public awareness services, counselor training and certification, casino employee training, and treatment and prevention services.
In 2013, Oklahoma ranked 23rd out of the 50 U.S. states in terms of per-capita public funds plus unduplicated NCPG affiliate funds invested in problem gambling services. The average per capita allocation for problem gambling services in the 39 states with publicly funded services was 32 cents; Oklahoma’s per capita public investment was 20 cents.
The OAPCG operates the Oklahoma Problem Gambling Helpline through a contract with the DMHSA. In SFY 2012, the helpline received 1,131 total calls. The DMHSA contracts with community based mental health and/or substance use treatment agencies to provide outpatient treatment services for problem gambling. In SFY 2012, 255 gamblers and 17 significant others received state-funded outpatient treatment for problem gambling.
Gaming in Oklahoma • • •
In 2012, Oklahoma ranked 13th out of 50 states and the D.C. in combined lottery sales, commercial casino gaming revenues, and Indian gaming revenues with $3.79 billion reported. 2 In 2012, legalized gambling in Oklahoma consisted of 64,786 electronic gaming machines, 115 Indian casinos, a traditional state lottery, racetrack casinos, and pari-mutuel wagering.
Problem Gambling Prevalence
• • • An estimated 2.2% of Oklahoma adults (63,196 citizens) are believed to manifest a gambling disorder. 1
1 Based on a 2012 U.S. Census Bureau estimate of persons age 18 and over and the average rate found among all U.S. state problem gambling prevalence as reported and converted into a standardized past year problem gambling rate by Williams, Volberg, & Stevens (2012). 2 Based on combined revenue reports from: (a) The American Gaming Association (2013); (b) Meister, A. (2013); and (c) North America State and Provincial Lotteries (2013).
95

Oregon
Problem Gambling Services In 1992, the State of Oregon enacted SB118, which designated 1% of Lottery revenues to be allocated to a Gambling Treatment Fund to address problem gambling and assigned the Oregon Health Authority (OHA) to administer that fund. In 2009 that amount was $4,700,000, and at the time of this survey (SFY 2013) the dedicated problem gambling service budget was $5,100,000. In SFY 2013, the OHA programmed those funds toward a treatment and prevention system, including several support services: program administration, service evaluation, a problem gambling helpline, training and workforce development.
In addition to efforts by the OHA, the Oregon Council on Problem Gambling (OCPG), a non-profit organization, also provides problem gambling services and serves as the state affiliate to the National Council on Problem Gambling (NCPG). In 2013, the OCPG operated on a budget of $99,070, of which $86,570 was sourced through contracts with OHA primarily designated for workforce development; the remaining $12,500 was sourced through donations from the gaming industry. The operating budget supported program administration, problem gambling research, counselor training, workforce development, and public awareness and advocacy services.
In 2013, Oregon ranked 2nd out of the 50 U.S. states in terms of per-capita public funds plus unduplicated NCPG affiliate funds invested in problem gambling services. The average per capita allocation of public funds for problem gambling services in the 39 states with publicly funded services was $0.32; Oregon’s per capita public investment was over four times the average at $1.31.
Emergence operates the Oregon Problem Gambling Helpline using funds from a contract with the OHA; certified problem gambling counselors answer calls to the service. In SFY 2012, the helpline received 1,257 calls for help. The OHA contracts with community based mental health and/or substance use treatment agencies to provide outpatient and residential treatment services for problem gambling. In SFY 2012, 1,321 gamblers and 179 significant others received state-funded outpatient treatment, and 65 individuals received state-funded residential treatment for problem gambling.
Gaming in Oregon • • •
In 2012, Oregon ranked 29th out of 50 states and the D.C. in combined lottery sales, commercial casino gaming revenues, and Indian gaming revenues with $1.52 billion reported. 2 In 2012, legalized gambling in Oregon included 19,536 electronic gaming machines, 9 Indian casinos, a state lottery with traditional and video products, pari-mutuel wagering, and charitable gaming.
Problem Gambling Prevalence
• • • An estimated 2.2% of Oregon adults (66,655 citizens) are believed to manifest a gambling disorder. 1
1 Based on a 2012 U.S. Census Bureau estimate of 3,029,797 persons age 18 and over and findings from three Oregon problem gambling prevalence studies (1997, 2000, 2005) converted into a standardized past year problem gambling rate by Williams, Volberg, & Stevens (2012). 2 Based on combined revenue reports from: (a) The American Gaming Association (2013); (b) Meister, A. (2013); and (c) North America State and Provincial Lotteries (2013).
96

Pennsylvania
Problem Gambling Services In 2004, the State of Pennsylvania passed Acts 2004-71 and 2010-01, which designated how monies from the gaming industry and the State Gaming Fund were to be allocated to the Compulsive and Problem Gambling Treatment Fund to address problem gambling and assigned the Department of Drug and Alcohol Programs (DDAP) to administer that fund. In 2009 that fund was $1.7 million, and at the time of this survey (SFY 2013) the dedicated problem gambling budget was $8.3 million. In SFY 2013, the DDAP programmed those funds toward treatment and prevention services, program administration, service evaluation, a problem gambling helpline, training and workforce development, and media resources. The DDAP also provided problem gambling counselor certification.
In addition to efforts by the DDAP, the Council on Compulsive Gambling of Pennsylvania (CCGP), a non-profit organization, also provides problem gambling services in the state and serves as the state affiliate to the National Council on Problem Gambling (NCPG). In 2013, the CCGP operated on a budget of $442,500, of which $180,000 was sourced through contracts with the DDAP, $182,500 from contracts with non-tribal casinos or gaming operators, and $80,000 from sales from trainings or conference registrations. The operating budget supported program administration, a problem gambling helpline, counselor training and certification programs, prevention services, and public awareness efforts.
In 2013, Pennsylvania ranked 7th out of the 50 U.S. states in terms of per-capita public funds plus unduplicated NCPG affiliate funds invested in problem gambling services. The average per capita allocation of public funds for problem gambling services in the 39 states with publicly funded services was 32 cents; Pennsylvania’s per capita public investment was over double that amount at 65 cents.
The CCGP administers the Pennsylvania Problem Gambling Helpline through a contract with the DDAP. In addition, there are three other problem gambling helpline services in Pennsylvania. The DDAP reported CCGP’s helpline service received 2,231 calls for help in SFY 2012. The DDAP also contracts with community based mental health and/or substance use treatment agencies and individual counselors to provide outpatient treatment services for problem gambling. In SFY 2012, 116 gamblers and 33 significant others received state-funded outpatient treatment for problem gambling.
Gaming in Pennsylvania • • •
In 2012, Pennsylvania ranked 5th out of 50 states and the D.C. in combined lottery sales, commercial casino gaming revenues, and Indian gaming revenues with $6.64 billion reported. 2 In 2012, legalized gambling in Pennsylvania included 26,510 electronic gaming machines, a traditional state lottery, video lottery, stand-alone casinos, racetrack casinos, pari-mutuel wagering, and charitable gaming.
Problem Gambling Prevalence
• • • An estimated 2.4% of Pennsylvania adults (280,798 citizens) are believed to manifest a gambling disorder. 1
1 Based on a 2012 U.S. Census Bureau estimate of persons age 18 and over and the average rate found among all U.S. state problem gambling prevalence as reported and converted into a standardized past year problem gambling rate by Williams, Volberg, & Stevens (2012). 2 Based on combined revenue reports from: (a) The American Gaming Association (2013); (b) Meister, A. (2013); and (c) North America State and Provincial Lotteries (2013).
97
Rhode Island
Problem Gambling Services In the absence of any legislation to create a distinct problem gambling service fund, the Rhode Island legislature has historically provided small grants to the Rhode Island Hospital to provide treatment services and the Rhode Island Lottery has provided funding to help support a problem gambling helpline. As of SFY 2013, a $50,000 state legislative grant was awarded to the Rhode Island Hospital to provide problem gambling treatment. Additionally, the State Lottery provided $51,600 to support a problem gambling helpline.
The Rhode Island Council on Problem Gambling (RICPG) is a non-profit organization that serves as the state affiliate to the National Council on Problem Gambling (NCPG) and whose mission it is to provide problem gambling services in the state. During SFY 2013, the RICPG had no funding and operated on a strictly volunteer basis, but volunteers were actively looking to fill a board position and rebuild the organization.
In 2013, Rhode Island ranked 31st out of the 50 U.S. states in terms of per-capita public funds plus unduplicated NCPG affiliate funds invested in problem gambling services. The average per capita allocation of public funds for problem gambling services in the 39 states with publicly funded services was 32 cents; Rhode Island’s per capita public investment was 10 cents.
United Way operates a problem gambling helpline service supported by a contract with the State Lottery. Information regarding calls for help specific to problem gambling was not provided in the present survey.
Problem gambling treatment is provided through a legislative grant for $50,000 to the Rhode Island Hospital, Department of Psychiatry, to cover costs related to providing problem gambling treatment, including partial funding of a single staff psychologist position. In SFY 2012, approximately 110 gamblers and 10 significant others received state-funded outpatient treatment of problem gambling. The average cost per treatment episode, as reported, was $451, however, the survey respondent commented that the true average cost per treatment episode is closer to $1000 as the costs for gambling treatment were not entirely covered by the $50,000 grant.
Gaming in Rhode Island2 • • •
In 2012, Rhode Island ranked 11th out of 50 states and the D.C. in combined lottery sales, commercial casino gaming revenues, and Indian gaming revenues with $4.06 billion reported. In 2012, legalized gambling in Rhode Island consisted of 5,851 electronic gaming machines, a traditional state lottery, 2 racetrack casinos, pari-mutuel wagering, and charitable gaming.
1 Based on a 2012 U.S. Census Bureau estimate of persons age 18+ multiplied by the national average adult past year prevalence rates of problem gambling as reported and converted into standardized rates by Williams, Volberg , & Stevens (2012). 2 Based on combined revenue reports from: (a) The American Gaming Association (2013); (b) Meister, A. (2013); and (c) North America State and Provincial Lotteries (2013).
Problem Gambling Prevalence1
• • • An estimated 2.2% of Rhode Island adults (18,277 citizens) are believed to manifest a gambling disorder.
98

South Carolina
Problem Gambling Services The State of South Carolina enacted legislation that designated how monies from the South Carolina Educational Lottery were to be allocated to address problem gambling and assigned the South Carolina Department of Alcohol and Other Drug Abuse Services (DAODAS) to administer that fund. In SFY2011 the dedicated problem gambling service budget was $100,000, and at the time of this survey (SFY 2013) the budget was $500,000. In SFY 2013, the DAODAS programmed the entire budget toward treatment and prevention services, program administration, a problem gambling helpline, training and workforce development, media resource, problem gambling public awareness services, and counselor certification.
South Carolina does not have a designated affiliate to the National Council on Problem Gambling.
In 2013, South Carolina ranked 28th out of the 50 U.S. states in terms per-capita public funds plus unduplicated NCPG affiliate funds invested in problem gambling services. The average per capita allocation of public funds for problem gambling services in the 39 states with publicly funded services was 32 cents; South Carolina’s per capita public investment was 11 cents.
The DAODAS funded the South Carolina Problem Gambling Helpline, which received 158 calls for help in SFY 2012. The DAODAS also funded outpatient treatment services for problem gambling provided by state employees. In SFY 2012, 17 gamblers received state-funded outpatient treatment for problem gambling.
Gaming in South Carolina • • •
In 2012, South Carolina ranked 37th out of 50 states and the D.C. in combined lottery sales, commercial casino gaming revenues, and Indian gaming revenues with $1.14 billion reported. 2 In 2012, legalized gambling in South Carolina included a traditional state lottery and charitable gaming.
Problem Gambling Prevalence
• • • An estimated 2.2% of South Carolina adults (79,916 citizens) are believed to manifest a gambling disorder. 1
1 Based on a 2012 U.S. Census Bureau estimate of persons age 18 and over and the average rate found among all U.S. state problem gambling prevalence as reported and converted into a standardized past year problem gambling rate by Williams, Volberg, & Stevens (2012). 2 Based on combined revenue reports from: (a) The American Gaming Association (2013); (b) Meister, A. (2013); and (c) North America State and Provincial Lotteries (2013).
99

South Dakota
Problem Gambling Services In 2006, the State of South Dakota enacted HB 1127, which designated how monies from the South Dakota Lottery were to be allocated each year to address problem gambling and assigned the Division of Community Behavioral Health, Department of Social Services (DSS), to administer those funds. In 2009 that amount was $254,281 and at the time of this survey (SFY 2013) the dedicated problem gambling service budget was $200,000.
South Dakota state administrators declined to participate in the present survey, but did provide limited information. Shawna Fullerton, Deputy Director of the Division of Community Behavioral Health, commented that, “Services and providers are limited at this point, but we are trying to wrap them into additional services offered since most individuals have co-occurring issues. We get limited funding from gaming and lottery (around $200,000) to serve the entire state.” A web search was conducted, including a review of information provided on state agency websites, that revealed no information for SFY2013 regarding budget allocations of the dedicated problem gambling funds.
South Dakota does not have a designated affiliate to the National Council on Problem Gambling.
In 2013, South Dakota ranked 20th out of the 50 U.S. states in terms of per-capita public funds plus unduplicated NCPG affiliate funds invested in problem gambling services. The average per capita allocation of public funds for problem gambling services in the 39 states with publicly funded services was 32 cents; South Dakota’s per capita public investment was 24 cents.
As of the time of this survey, HelpLine Center, Inc. provided problem gambling helpline services in the state. No information was available regarding number of calls to the helpline specific to problem gambling. The State contracts with community based mental health and/or substance abuse agencies to provide outpatient and residential treatment services for problem gambling. As of the time of this survey, no information was available regarding the number of individuals who received state-funded treatment.
Gaming in South Dakota • • •
In 2012, South Dakota ranked 40th out of 50 states and the D.C. in combined lottery sales, commercial casino gaming revenues, and Indian gaming revenues with $818.55 million reported. 2 In 2012, legalized gambling in South Dakota included 15,260 electronic gaming machines, a state lottery, Indian casinos, stand-alone casinos, pari-mutuel wagering, and charitable gaming.
Problem Gambling Prevalence
• • • An estimated 1.4% of South Dakota adults (8,785 citizens) are believed to manifest a gambling disorder. 1
1 Based on a 2012 U.S. Census Bureau estimate of 627,515 persons age 18 and over and findings from two South Dakota problem gambling prevalence studies (1991, 1993) converted into a standardized past year problem gambling rate by Williams, Volberg, & Stevens (2012). 2 Based on combined revenue reports from: (a) The American Gaming Association (2013); (b) Meister, A. (2013); and (c) North America State and Provincial Lotteries (2013).
100

Tennessee
Problem Gambling Services In 2006, the State of Tennessee enacted legislation that designated how monies from a State General Fund were to be allocated to address problem gambling and assigned the Department of Mental Health and Substance Abuse Services, Division of Substance Abuse Services (DSAS), to administer that fund. In 2009 that amount was $200,000, and at the time of this survey (SFY 2013) the dedicated problem gambling service budget remained $200,000. In SFY 2013, DSAS programmed 100% of those funds toward treatment services, program administration, a problem gambling helpline, training and workforce development, and media resources.
Tennessee does not have a designated affiliate to the National Council on Problem Gambling.
In 2013, Tennessee ranked 38th out of the 50 U.S. states in terms of per-capita public funds plus unduplicated NCPG affiliate funds invested in problem gambling services. The average per capita allocation of public funds for problem gambling services in the 39 states with publicly funded services was 32 cents; Tennessee’s per capita public investment was 3 cents.
DSAS contracted with the Tennessee Alcohol and Drug Services-Info Clearinghouse to provide a problem gambling helpline service. In SFY 2012 the helpline received 217 calls for help. DSAS also contracts with community based mental health and/or substance abuse agencies to provide outpatient treatment services for problem gambling. In SFY 2012, 29 gamblers received state-funded outpatient counseling.
Gaming in Tennessee • • •
In 2012, Tennessee ranked 34th out of 50 states and the D.C. in combined lottery sales, commercial casino gaming revenues, and Indian gaming revenues with $1.31 billion reported. 2 In 2012, legalized gambling in Tennessee included a state lottery. There were no casino operations in the state.
Problem Gambling Prevalence
• • • An estimated 2.2% of Tennessee adults (94,621 citizens) are believed to manifest a gambling disorder. 1
1 Based on a 2012 U.S. Census Bureau estimate of persons age 18 and over and the average rate found among all U.S. state problem gambling prevalence as reported and converted into a standardized past year problem gambling rate by Williams, Volberg, & Stevens (2012). 2 Based on combined revenue reports from: (a) The American Gaming Association (2013); (b) Meister, A. (2013); and (c) North America State and Provincial Lotteries (2013).
101

Texas
Problem Gambling Services As of SFY 2013, the State of Texas did not provide public funding dedicated for problem gambling services, and there were no publicly funded programs specifically for problem gambling treatment or problem gambling prevention. The State of Texas does not have a state employee assigned as a member of the Association for Problem Gambling Service Administrators.
The Texas Council on Problem and Compulsive Gambling (TCPCG) is a non-profit organization that serves as the state affiliate to the National Council on Problem Gambling (NCPG). The TCPCG had no funding from SFY 2010 to SFY 2013, and was operating on a strictly volunteer basis at the time of the present survey. Their efforts were focused on raising public awareness around problem gambling.
Due to the lack of funding for services within Texas, NCPG contracts with the Louisiana Problem Gamblers Helpline to cover calls from Texas made to the National Problem Gambling Helpline as part of the National Problem Gambling Helpline Network.
Gaming in Texas2 • • •
In 2012, Texas ranked 10th out of 50 states and the D.C. in combined lottery sales, commercial casino gaming revenues, and Indian gaming revenues with $4.10 billion reported. However, this figure is under reported as gaming revenues from the state’s single Indian gaming facility was not included in this calculation as that information was regarded as confidential. In 2012, legalized gambling in Texas included 1,858 electronic gaming machines, a traditional lottery, a single Class II Indian gaming facility, and charitable gaming.
1 Based on a 2012 U.S. Census Bureau estimate of 18,997,158 persons age 18 and over and findings from two Texas problem gambling prevalence studies (1992, 1995) converted into a standardized past year problem gambling rate by Williams, Volberg, & Stevens (2012). 2 Based on combined revenue reports from: (a) The American Gaming Association (2013); (b) Meister (2013); and (c) North America State and Provincial Lotteries (2013).
Problem Gambling Prevalence 1 • • •
An estimated 2.2% of Texas adults (417,937 citizens) are believed to manifest a gambling disorder.
102

Utah
Problem Gambling Services As of SFY 2013, the State of Utah did not provide public funding dedicated for problem gambling services. There were no publicly funded programs specifically for problem gambling treatment or problem gambling prevention. The State of Utah is not a member of the Association for Problem Gambling Service Administrators. The Utah-Idaho Council on Problem Gambling is a non-profit organization that provides problem gambling public awareness services including information about treatment resources in both states. 1 The Utah-Idaho Council on Problem Gambling is an affiliate chapter to the National Council on Problem Gambling. However, at the time state affiliates to the NCPG were being identified to the research team, the NCPG had yet to formally accept the Utah-Idaho Council on Problem Gambling as a state affiliate so information pertaining to this NCPG Affiliate was not included in the 2013 National Problem Gambling Survey data set.
1 The official website of the Utah-Idaho Council on Problem Gambling could be accessed at http://utahidahocpg.org/as of March 1, 2014. 2 Based on a 2012 U.S. Census Bureau estimate of persons age 18+ multiplied by the national average adult past year prevalence rates of problem gambling as reported and converted into standardized rates by Williams, Volberg, & Stevens (2012). 3 Based on combined revenue reports from: (a) The American Gaming Association (2013); (b) Meister (2013); and (c) North America State and Provincial Lotteries (2013).
Problem Gambling Prevalence 2 • • •
An estimated 2.2% of Utah adults (43,218 citizens) are believed to manifest a gambling disorder.
Gaming in Utah3 • • •
There are no forms of legal gambling in the state of Utah; therefore, there are no figures to report concerning revenue and forms of gaming in the state.
103

Vermont
Problem Gambling Services In the absence of any legislation to create a distinct problem gambling service fund, the Vermont legislature has historically allocated Lottery $150,000 in Vermont Lottery revenues to the Department of Health who in turn contracts 100% of those funds to the Vermont Council on Problem Gambling. The funds support a problem gambling helpline, problem gambling workforce development activities, and prevention activities that are mostly related to problem gambling awareness building.
In addition to the $150,000 allocated to the Department of Health for problem gambling services in SFY 2013, the Vermont Lottery allocated $50,000 of their marketing budget towards responsible gaming promotion including advertising the problem gambling helpline and Vermont Council on Problem Gambling website.
The Vermont Council on Problem Gambling (VCPG) is a non-profit organization that serves as the state affiliate to the National Council on Problem Gambling (NCPG). The VCPG provides referrals to local self-help groups, mailings of educational materials, displays at local conferences, public speakers, and on-site trainings for professional care providers when requested. During SFY 2013, the VCPG’s operating budget was derived almost entirely from the $150,000 contract with the Department of Health.
In 2013, Vermont ranked 12st out of the 50 U.S. states in terms of per-capita public funds plus unduplicated NCPG affiliate funds invested in problem gambling services. The average per capita allocation of public funds for problem gambling services in the 39 states with publicly funded services was 32 cents; the same as Vermont’s per capita public investment (32 cents).
The Vermont Problem Gambling Helpline, operated by the VCPG, received 275 to 360 calls for help in SFY 2012. Vermont does not offer publicly funded or VCPG funded problem gambling treatment and there is the only one certified gambling counselor in the state and one Gamblers Anonymous meeting in state.
Gaming in Vermont2 • • •
In 2012, Virginia ranked 45th out of 50 states and the D.C. in combined lottery sales, commercial casino gaming revenues, and Indian gaming revenues with $100.93 million reported. In 2012, the primary forms of legalized gaming allowed in Vermont were a state lottery and charitable gaming.
1 Based on a 2012 U.S. Census Bureau estimate of persons age 18+ multiplied by the national average adult past year prevalence rates of problem gambling as reported and converted into standardized rates by Williams, Volberg, & Stevens (2012). 2Based on combined revenue reports from: (a) The American Gaming Association (2013); (b) Meister (2013); and (c) North America State and Provincial Lotteries (2013).
Problem Gambling Prevalence1
• • • An estimated 2.2% of Vermont adults (11,004 citizens) are believed to manifest a gambling disorder.
104

Virginia
Problem Gambling Services As of SFY 2013, the State of Virginia did not provide public funding dedicated for problem gambling services, and there were no publicly funded programs specifically for problem gambling treatment or problem gambling prevention. There is a mandate set by the state legislature stating that a phone number for some form of help must appear on each lottery ticket. The Virginia Lottery has chosen to provide their own privately funded helpline and produce their own PSA’s and brochure. The State of Virginia is not a member of the Association for Problem Gambling Service Administrators but does not have an organization designated as an affiliate to the National Council on Problem Gambling. The VA Council on Problem Gambling (VACPG) is a 501(c)(3) non-profit organization dedicated to assisting problem gamblers and their families by promoting awareness, education, research, prevention and treatment for problem gambling. In 2013, the VACPG operated on a budget of $5,000 and was staffed by volunteers.
Gaming in Virginia2 • • •
In 2012, Virginia ranked 27th out of 50 states and the D.C. in combined lottery sales, commercial casino gaming revenues, and Indian gaming revenues with $1.62 billion reported. In 2012, legalized gambling in Virginia primarily consisted of a state lottery, pari-mutuel wagering, and charitable gaming.
1 Based on combined revenue reports from: (a) The American Gaming Association (2013); (b) Meister, A. (2013); and (c) North America State and Provincial Lotteries (2013). 2Based on combined revenue reports from: (a) The American Gaming Association (2013); (b) Meister (2013); and (c) North America State and Provincial Lotteries (2013).
Problem Gambling Prevalence1
• • • An estimated 2.2% of Virginia adults (138,849 citizens) are believed to manifest a gambling disorder.
105

Washington
Problem Gambling Services In 2005, the State of Washington enacted ESHB-1031, which designated how monies from a Business and Occupation Tax imposed on card rooms, pull tabs, and punch boards were to be allocated to address problem gambling and assigned the Washington Department of Social and Health Services, Division of Behavioral Health and Recovery (DBHR), to administer that fund. In 2009 that amount was $546,355, and at the time of this survey (SFY 2013) the dedicated problem gambling service budget was $724,000. In SFY 2013, DBHR programmed those funds toward problem gambling prevention and treatment services, program administration, service evaluation, a problem gambling helpline, training and workforce development, and problem gambling public awareness services.
In addition to efforts by DBHR, the Evergreen Council on Problem Gambling (ECPG), a non-profit organization, also provides problem gambling services in the state and serves as the state affiliate to the National Council on Problem Gambling (NCPG). In 2013, the ECPG operated on a budget of $1,023,700, the majority of which came from $402,640 in grant and donation funds from tribal governments/casinos. The operating budget supported a problem gambling helpline, research, service evaluation, public awareness services, counselor training and certification, and treatment and prevention services. The ECPG is one of the largest state affiliates to the NCPG in terms of budget, number of staff, and scope of services provided.
In 2013, Washington ranked 19th out of the 50 U.S. states in terms of per-capita public funds plus unduplicated NCPG affiliate funds invested in problem gambling services. The average per capita allocation of public funds for problem gambling services in the 39 states with publicly funded services was 32 cents; Washington’s per capita public investment was 10 cents.
The ECPG contracts with the Louisiana Problem Gamblers Helpline to provide the primary problem gambling helpline in the state. In SFY 2012, the helpline received 9,200 total calls from Washington; calls for help were not separately reported. DBHR contracts with community based mental health and/or substance abuse treatment agencies and counselors to provide outpatient treatment for problem gambling; 507 individuals received state-funded outpatient counseling in SFY 2012. In addition, the ECPG contracts with out-of-state residential treatment programs, and reported 16 individuals received residential treatment in SFY 2012.
Gaming in Washington • • •
In 2012, Washington ranked 19th out of 50 states and the D.C. in combined lottery sales, commercial casino gaming revenues, and Indian gaming revenues with $2.71 billion reported. 2 In 2012, legalized gambling in Washington consisted of 28,007 electronic gaming machines, 26 Indian casinos, a traditional state lottery, stand-alone casinos/card rooms, pari-mutuel wagering, and charitable gaming.
Problem Gambling Prevalence
• • • An estimated 2.1% of Washington adults (107,606 citizens) are believed to manifest a gambling disorder. 1
1 Based on a 2012 U.S. Census Bureau estimate of 5,124,099 persons age 18 and over and findings from three Washington problem gambling prevalence studies (1992, 1998, 2004) converted into a standardized past year problem gambling rate by Williams, Volberg, & Stevens (2012). 2 Based on combined revenue reports from: (a) The American Gaming Association (2013); (b) Meister, A. (2013); and (c) North America State and Provincial Lotteries (2013).
106

West Virginia
Problem Gambling Services In 2000, the State of West Virginia enacted legislation that established funding for problem gambling services. From 2000 through June 2008, revenues from the West Virginia Lottery Commission were allocated to the West Virginia Department of Health and Human Resources, Bureau for Behavioral Health and Health Facilities (BBHHF), who in turn contracted with the Problem Gambling Help Networks (PGHN) of West Virginia to administer a problem gambling service system. More recent legislation provided an additional $500,000 for the Compulsive Gamblers Treatment Fund from table game revenues. From SFY 2009 to SFY 2013, $1.5 million annually has been dedicated to problem gambling services. BBHHF, through a contract with the GPHN, use these funds toward treatment and prevention services, program administration, service evaluation, a problem gambling helpline, training and workforce development, and media resources.
West Virginia does not have an organization designated as an affiliate to the National Council on Problem Gambling (NCPG).
In 2013, West Virginia ranked 4th out of the 50 U.S. states in terms of per-capita public funds plus unduplicated NCPG affiliate funds invested in problem gambling services. The average per capita allocation of public funds for problem gambling services in the 39 states with publicly funded services was 32 cents; West Virginia’s per capita public investment was 81 cents.
The BBHHF contracts with the PGHN to provide a problem gambling helpline service. In SFY 2012 the helpline received 633 calls for help. The BBHHF also contracts with PGHN, which subcontracts with community based mental health and/or substance abuse agencies and counselors, to provide outpatient treatment services for problem gambling. In SFY 2013, 168 individuals received state-funded outpatient counseling for problem gambling.
Gaming in West Virginia2 • • •
In 2012, West Virginia ranked 21st out of 50 states and the prevention and treatment services $2.41 billion reported. In 2012, legalized gambling in West Virginia consisted of 15,942 electronic gaming machines, a traditional lottery, video lottery, stand-alone casinos, racetrack casinos, and charitable gaming.
1 Based on combined revenue reports from: (a) The American Gaming Association (2013); (b) Meister, A. (2013); and (c) North America State and Provincial Lotteries (2013). 2Based on combined revenue reports from: (a) The American Gaming Association (2013); (b) Meister (2013); and (c) North America State and Provincial Lotteries (2013).
Problem Gambling Prevalence1
• • • An estimated 2.2% of West Virginia adults (32,370 citizens) are believed to manifest a gambling disorder.
107

Wisconsin
Problem Gambling Services In 2009, the State of Wisconsin enacted Act 28s.20.435(5)(kg), which designated how monies from the Wisconsin Lottery were to be allocated to address problem gambling and assigned Department of Human Services (DHS) to administer that fund. In 2009 the amount for that fund was $400,000, and at the time of this survey (SFY 2013) the dedicated problem gambling service budget was $396,000. DHS received $396,000 of Lottery revenues designated to address problem gambling. In SFY 2013 that full amount was
provided to the Wisconsin Council on Problem Gambling (WCPG) through a sole-source contract for administration of problem gambling services, as defined by the following five program areas: a problem gambling helpline service, training program, school outreach, public awareness services, and a mini-grant program that provides non-profits in the state with small grants to enhance public awareness of problem gambling. As of SFY 2013, there were no publicly funded treatment services for problem gambling in Wisconsin.
The WCPG is a non-profit organization that serves as the state affiliate to the National Council on Problem Gambling (NCPG). In SFY 2013, the WCPG operated on a budget of $480,000, most of which came from the DHS contract. The operating budget supported a problem gambling helpline, public awareness, counselor training, and prevention resources. The majority of the WCPG’s efforts are toward increasing public awareness.
In 2013, Wisconsin ranked 33rd out of the 50 U.S. states in terms of per-capita public funds, plus unduplicated NCPG affiliate funds, invested in problem gambling services. The average per capita allocation of public funds for problem gambling services in the 39 states with publicly funded services was 32 cents; Wisconsin’s per capita public investment was 7 cents.
The Wisconsin Problem Gambling Helpline received 2,071 calls for help in SFY 2012. Because there were no publicly funded treatment services available for problem gambling, persons calling the helpline were referred to Gamblers Anonymous and to nationally certified problem gambling counselors or counselors who have had a minimum of 30 hours of problem gambling training.
Gaming in Wisconsin • • •
In 2012, Wisconsin ranked 26th out of 50 states and the D.C. in combined lottery sales, commercial casino gaming revenues, and Indian gaming revenues with $1.74 billion reported. 2 In 2012, legalized gambling in Wisconsin consisted of 17,997 electronic gaming machines, 22 Indian casinos, a traditional state lottery, pari-mutuel wagering, and charitable gaming.
Problem Gambling Prevalence
• • • An estimated 1.3% of Wisconsin adults (57,172 citizens) are believed to manifest a gambling disorder. 1
1 Based on a 2012 U.S. Census Bureau estimate of 4,397,873 persons age 18 and over and findings from a 1995 Wisconsin problem gambling prevalence study converted into a standardized past year problem gambling rate by Williams, Volberg, & Stevens (2012). 2 Based on combined revenue reports from: (a) The American Gaming Association (2013); (b) Meister (2013); and (c) North America State and Provincial Lotteries (2013).
108

Wyoming
Problem Gambling Services As of SFY 2013, the State of Wyoming did not provide public funding dedicated for problem gambling services, and there were no publicly funded programs specifically for problem gambling treatment or problem gambling prevention. Over the past couple of years the Pari-Mutuel Commission of Wyoming has made it policy to provide flyers and information regarding responsible gambling and helplines at their horse racetracks where gambling is present. The state of Wyoming is not a member of the Association for Problem Gambling Service Administrators and does not have an organization designated as an affiliate to the National Council on Problem Gambling. The National Council on Problem Gambling contracts with the Louisiana Problem Gamblers Helpline to cover calls from Wyoming made to the National Problem Gambling Helpline.
Gaming in Wyoming2 • • •
In 2012, legalized gambling in Wyoming consisted Indian gaming and charitable gaming. In 2011, there were two Wyoming tribes with a total of four gaming facilities among them. These facilities offered live bingo, 1,505 gaming machines, and 14 table games. Gaming revenue grew a little over 5 percent from 2010 to 2011. Due to the confidentiality of data, gaming revenue in Wyoming is not reported.
1 Based on combined revenue reports from: (a) The American Gaming Association (2013); (b) Meister, A. (2013); and (c) North America State and Provincial Lotteries (2013). 2Based on combined revenue reports from: (a) The American Gaming Association (2013); (b) Meister (2013); and (c) North America State and Provincial Lotteries (2013).
Problem Gambling Prevalence1
• • • An estimated 2.2% of Wyoming adults (9,676 citizens) are believed to manifest a gambling disorder. 1
109

Appendix B: Contact Information by State
110

Alabama NCPG Affiliate Alabama Council on Compulsive Gambling 225 Brookley Drive Eclectic, AL 36024 Phone: 334-399-6918 Website: www.alccg.org
Alaska State Agency
Commissioner’s Office Department of Commerce, Community & Economic Development PO Box 110800 Juneau, AK 99811 Phone: 907-465-2500 http://www.commerce.state.ak.us
Arizona State Agency Department of Gaming Office of Problem Gambling 1110 W. Washington, Suite 450 Phoenix, AZ 85007 Phone: 602-255-3852 Fax: 602-255-3883 Web: www.problemgambling.az.gov
Arkansas State Agency Division of Behavioral Health Services 105 South Palm Street Little Rock, AR 77205 Phone: 501-686-9867 Fax: 501-686-3996 Web: http://humanservices.arkansas.gov/dbhs/Pages/Gambling-Treatment.aspx
California State Agency Department of Alcohol and Drug Programs Office of Problem Gambling 1700 K St. Sacramento, CA 95811 Phone: 916-324-3020 Fax: 916-323-2000 Web: www.problemgambling.ca.gov
111

NCPG Affiliate California Council on Problem Gambling 41743 Enterprise Cr. N, STE 202 Temecula, CA 92390 Phone: 714-765-5804 Fax: 951-296-0456 Web: www.calpg.org
Colorado State Agency Colorado Dept. of Human Services Office of Behavioral Health 3824 W. Princeton Circle Denver, CO 80236 Phone: 303-866-7826 Fax: 303-866-7481
NCPG Affiliate Problem Gambling Coalition of Colorado 691 S Zinnia Ct. Lakewood, CO 80228-2511 Phone: 303-903-7627 Web: www.problemgamblingcolorado.org
Connecticut State Agency
Department of Mental Health/Addiction Service Problem Gambling Service PO Box 351, Russel Hall Middleton, CT 06457 Phone: 860-262-6610 Fax: 860-344-2360 NCPG Affiliate CT Council on Problem Gambling 16 West Main St. Clinton, CT 06413 Phone: 860-664-3996 Fax: 860-664-3990 Web: www.problemgambling.org
District of Columbia (Washington, D.C.) No contacts
112

Delaware State Agency Department of Health and Social Services
1902 North DuPont Highway, Main Bldg. New Castle, DE 19720 Phone: 302-255-4428 Fax: 302-255-4428
NCPG Affiliate
Delaware Council on Problem Gambling 100 West 10th St. Wilmington, DE 19801 Phone: 302-655-3261 Fax: 302-984-2269 Web: www.dcgp.org
Florida State Agency
Department of Business and Professional Regulation 1940 North Monroe Street, Tallahassee FL 32399 Phone: (850) 488-9125 FAX:407-865-6103 Email: [email protected] NCPG Affiliate Florida Council on Compulsive Gambling 901 Douglas Avenue, Altamonte Springs, FL 32714 Phone: 407-865-6200 FAX: 407-865-6103 Web Site: www.gamblinghelp.org
Georgia Department of Behavioral Health &
Department of Developmental Disability Division of Addictive Diseases Two Peachtree Street, N.W. 24th Floor Atlanta, GA 30303 Phone: 404-657-2386 Web: http://dbhdd.georgia.gov/addictive-diseases
Hawaii No contacts
113

Idaho Idaho Department of Health and Welfare Boise, Idaho Phone: 208-334-6997 Fax: [email protected] Web: http://www.healthandwelfare.idaho.gov/ContactUs/tabid/127/Default.aspx
Illinois State Agency Illinois Department of Human Services
Division of Alcoholism and Substance Abuse 100 W. Randolph, Ste. 5-600 Chicago, IL 60601-3297 Phone: 312-814-6415 Fax: 312-814-2419
NCPG Affiliate Illinois Council on Problem Gambling PO Box 19 Athens, IL 62613 Phone: 217-652-9611 Web: www.icpg.info
Indiana State Agency
Division of Mental Health & Addiction 402 W. Washington St. W353 Indianapolis, Indiana 46204 Phone: 317-232-7891 Fax: 317-233-3472 Web: http://www.in.gov/fssa/dmha/2599.htm
NCPG Affiliate
Indiana Council on Problem Gambling 309 West Washington Street, Ste. 334 Indianapolis, IN 46204 Phone: 317-632-1364 Fax: 317-632-1434 Web: www.indianaproblemgambling.org
Iowa Iowa Department of Public Health
Division of Behavioral Health 321 E. 12th Street Des Moines, IA 50319
114
Phone: 515-281-8802 Fax: 515-281-4535 Web: 1800betsoff.org
Kansas State Agency
Behavioral Health Services Kansas Dept. for Aging/Disability Services 503 S. Kansas Avenue Topeka, KS 66603 Phone: 785-296-2572 Fax: 785-296-0256 Web: www.kdads.ks.gov
NCPG Affiliate
Kansas Coalition on Problem Gambling 2209 SW 29th St. Topeka, KS 666611 Phone: 785-266-866 Fax: 785-266-3833
Kentucky State Agency Department of Behavioral Health
100 Fair Oaks lane, 4E-D Frankfort, KY 40602 Phone: 502-564-448 Fax: 502-564-9335 Web: http://dbhdid.ky.gov/kdbhdid/default.asp
NCPG Affiliate Kentucky Council on Problem Gambling PO Box 4595 Frankfurt, KY 40604-4595 Phone: 502-223-1823 Web: www.kycpg.org
Louisiana State Agency LA Department of Health and Hospitals
Office of Behavioral Health 628 North Fourth St. Baton Rouge, LA 70821 Phone: 225-342-7338 Fax: 225-342-3931
115

Web: www.dhh.ia.gov NCPG Affiliate
LA Association on Compulsive Gambling 324 Texas St. Shreveport, LA 71101 Phone: 318-227-0883 Fax: 318-221-0005 Web: www.helpforgambling.org
Maine State Agency Office of Substance Abuse and Mental Health Services
41 Anthony Avenue, Augusta, ME 04333 Phone: 207-287-8917 Web: www.maine.gov
Maryland State Agency
Department of Health and Mental Hygiene MD Center of Excellence on Problem Gambling 419 Redwood St. Baltimore, MD 21228 Phone: 410-328-4710 Fax: 410-328-4721 Web: www.mdproblemgambling.com
NCPG Affiliate Maryland Council on Problem Gambling 1721 Beechwood Avenue Essex, MD 21221 Phone: 410-371-4788 Web: www.mdproblemgambling.com
Massachusetts
State Agency Department of Public Health Bureau of Substance Abuse 250 Washington St., 3rd Floor Boston, MA 02108 Phone: 617-624-5136 Fax: 617-624-5185 Web: www.mass.gov/dph/bsas
116

NCPG Affiliate Massachusetts Council on Compulsive Gambling 190 High Street Boston, MA 02110 Phone: 617-426-4554 Fax: 617-426-4555 Web: www.masscompulsivegambling.org
Michigan State Agency
Bureau of Substance Abuse/Addiction Services Michigan Department of Community Health 320 S. Walnut St. Lansing, MI 48913 Phone: 517-373-4700 Fax: 517-241-2611 Web: www.michigan.gov/mdch-bsaas
NCPG Affiliate MI Association on Problem Gambling Phone: 517-242-0655 Web: michapg.com
Minnesota State Agency Minnesota Department of Human Services Adult Mental Health Division PO Box 64981 St. Paul, MN 55164 Phone: 651-431-2245 Fax: 651-431-7418 Web: www.nojudgment.com
NCPG Affiliate
Northstar Problem Gambling Alliance 2233 Hamilton Avenue North
Roseville, MN 55113 Phone: 612-424-8595 Fax: 651-636-6757 Web: www.NorthstarProblemGambling.org
Missouri State Agency Department of Mental Health Division of Behavioral Health
117

1706 E. Elm St. PO Box 687 Jefferson City, MO 65101 Phone: 573-526-8048 Fax: 573-751-7814 Web: dmh.mo.gov/programs.htm
NCPG Affiliate Missouri Council on Problem Gambling 5128 Brookside Kansas City, MO 64112 Phone: 816-531-7133 Fax: 816-861-5087 Web: www.888betsof.com
Mississippi State Agency
MS Council on Problem and Compulsive Gambling 141 Executive Drive, Ste. 4 Madison, MS 39110 Phone: 601-853-8351 Fax: 601-853-8355 Web: www.msgambler.org
Montana NCPG Affiliate Montana Council on Problem Gambling PO Box 606
Helena, MT 59624 Phone: 406-453-6006 Web: www.mtproblemgambling.org
Nebraska State Agency Department of Health and Human Services Division of Behavioral Health 301 Centennial Mall South Lincoln, NE 68509 Phone: 402-471-7792 Fax: 402-471-7859 Web: www.dhhs.ne.gov
NCPG Affiliate Nebraska Council on Compulsive Gambling Executive Director
118

1025 South 216th Street Omaha, NE 68022 Phone: 402-699-6810 Fax: 402-289-0941 Web: nebraskacouncil.com
Nevada State Agency NV Department of Health and Human Services 4126 Technology Way, Suite 100 Carson City, NV 89403 Phone: 775-684-4020 Fax: 775-684-4010 Web: http://dhhs.nv.gov/Grants NCPG Affiliate Nevada Council on Problem Gambling 5552 S. Fort Apache Road #100 Las Vegas, NV 89148 Phone: 702-369-9740 Fax: 702-369-9765 Web: www.nevadacounvil.org
New Hampshire State Agency
New Hampshire Lottery Commission 12 Integra Dr. Concord, NH 03301 Phone: 603-271-3391 Web: www.NHlottery.org
New Jersey State Agency New Jersey Department of Human Services Division of Mental Health/Addiction Services P.O. Box 700 Trenton, NJ 08625 Web: state.nj.us/humanservices/dmhs/home NCPG Affiliate Council on Compulsive Gambling of NJ 3635 Quakerbridge Rd., Ste. 7 Hamilton, NJ 08619 Phone: 609-588-5515 Fax: 609-588-5665
119

Web: www.800gambler.org
New Mexico State Agency Department of Human Services Division of Behavioral Health 37 Plaza La Prenza Santa Fe, NM 87504 Phone: 505-476-9280 Fax: 505-476-9272 NCPG Affiliate New Mexico Council on Problem Gambling PO Box 10127 Albuquerque, New Mexico87184 Phone: 505-897-1000 FAX: 505-897-1115 Web Site: www.nmcpg.org
New York State Agency NYS Office of Alcoholism and Substance Abuse Services 1450 Western Avenue Albany, NY 12203 Phone: 518-457-4384 Web: http://www.oasas.ny.gov/gambling/index.cfm NCPG Affiliate NY Council on Problem Gambling 100 Great Oaks Blvd. Albany, NY 12203 Phone: 518-867-4084 Fax: 518-867-4087 Web: www.nyproblemgambling.org
North Carolina State Agency North Carolina Health and Human Services 325 N. Salisbury St. Raleigh, NC 27699 Phone: 919-733-0690 Web: www.morethangamenc.com
NCPG Affiliate NC Council on Problem Gambling
120
Executive Director PO Box 36573 Greensboro, NC 27416 Phone: 336-681-8516 Web: ncgambling.org
North Dakota State Agency Division of Mental Health and Substance Abuse Services Prairie Hills Plaza 1237 West Divide Ave., Ste. 1C Bismarck, ND 58501 Phone: 701-328-8922
Ohio State Agency
Ohio Dept. of Alcohol/Drug Addiction Services 30 W. Spring Street Columbus, OH 43215 Phone: 614-466-8562 Fax: 614-728-4936
NCPG Affiliate Problem Gambling Network of Ohio PO Box 2332 Athens, OH 45701 Phone: 216-798-8395 Web: problemgamblingohio.net
Oklahoma State Agency
Oklahoma Department of Mental Health and Substance Abuse 1200 NE 13th St. Oklahoma City, OK 72152 Phone: 405-522-3908 Fax: 405-522-8661 Web: odmhsas.gov
NCPG Affiliate
OK Association on Problem and Compulsive Gambling 320 W. Main St., Ste. B Norman, OK 73069 Phone: 405-801-3329 Fax: 405-801-3330 Web: www.oapcg.org
121
Oregon State Agency Addictions and Mental Health Division Oregon Health Authority 500 Summer St. NE Salem, OR 97301 Phone: 503-945-6722 Fax: 503-378-8467 Web: http://www.oregon.gov/oha/amh/pages/gambling.aspx NCPG Affiliate Oregon Council on Problem Gambling PO Box 304 Wilsonville, OR 97070 Phone: 503-685-6100 Fax: 503-783-0655
Pennsylvania State Agency Department of Drug and Alcohol Programs Pennsylvania Gambling Control Board PO Box 69060 Harrisburg, PA 17104 Phone: 717-736-7475 Fax: 717-787-6285 Web: www.paproblemgambling.com www.gamblingcontrolboard.gov
NCPG Affiliate Council on Compulsive Gambling of Pennsylvania 1233B Wharton St. Philadelphia, PA 19147 Phone: 215-389-4008 Fax: 215-389-1408 Web: www.pacouncil.com
Rhode Island Rhode Island Hospital Department of Psychiatry 146 West River St., Ste. 11B Providence, RI 02904 Phone: 401-444-7036 Fax: 401-444-7109 Web: www.gamblingtreatment.org
122

NCPG Affiliate Rhode Island Council on Problem Gambling 30 Seba Kent Road Pawtucket, RI 0286 Phone: 347-410-2902 Web: www.ricpg.net
South Carolina State Agency Department of Alcohol and Other Drug Abuse Services
PO Box 8268 Columbia, SC 29202 Phone: 803-896-5592 Fax: 803-896-5558 Web: www.daodas.state.sc.us
South Dakota Division of Community Behavioral Health
Department of Social Services 700 Governors Drive Pierre, SD 57501 Phone: 605-773-3123
Tennessee State Agency Division of Substance Abuse Services 610 Mainstream Drive Nashville, TN 37243 Phone: 615-532-7897 Fax: 615-532-2419
Texas NCPG Affiliate
Texas Council on Problem Gambling 5646 Milton Street, Suite 432 Dallas, TX 75206
Phone: 972-490-1007 Fax: 972-490-9337 Web: www.gamblerscounseling.com
Utah State Agency Dept. of Human Services
Division of Substance Abuse and Mental Health 195 North 1950 West Salt Lake City, UT 84116
123

Phone: 801-538-4001 Fax: 801-538-9892 Web: http://www.dsamh.utah.gov/index.htm NCPG Affiliate Utah-Idaho Council on Problem Gambling 1073 W Chapel Ridge Dr South Jordan, UT 84095 Phone: 801.839.5167 Website: www.utahidahocpg.org
Virginia State Agency Virginia State Lottery 900 E. Main St. Richmond, VA 23219 Phone: 804-692-7772 Fax: 804-692-7102 Web: www.valottery.com NCPG Affiliate Virginia Council on Problem Gambling P.O. Box 694 Ashburn, VA 20146 Phone: 703.967.4392
Washington State Agency
Department of Social and Health Services Division of Behavioral Health and Recovery PO Box 45330 Olympia, WA 98504 Phone: 360-725-3743 Fax: 360-725-2280 Web: www.dshs.wa.gov/DBHR NCPG Affiliate Evergreen Council on Problem Gambling 1929 4th Avenue East Olympia, WA 98506 Phone: 360-352-6133 Fax: 360-352-4133 Web: www.evergreencpg.org
124

West Virginia State Agency Program Director PO Box 3324 Charleston, WY 25333 Phone: 304-344-2213 Fax: 304-344-2263 Web: 1800GAMBLER.net
Wisconsin State Agency Department of Health Services Division of Mental Health/Substance Abuse Services Bureau of Prevention, Treatment and Recovery 1 W. Wilson Street, Room 951 Madison, WI 53703G Phone: 608-267-7712 Fax: 608-267-4865 Web: wiproblemgamblers.org NCPG Affiliate WI Council On Problem Gambling 1423 Kellogg Street Green Bay, WI 54303 Phone: 920-437-8888 Fax: 920-437-8995 Web: wi-problemgamblers.org
Wyoming No Contact
125

Appendix C: APGSA Survey Instrument
126

2013 National Survey of Problem Gambling Services SECTION A: CONTACT INFORMATION (STATE EMPLOYEE – GOVERNMENT CONTACT)
A1. State: A2. Date:
A3. Name of individual completing the survey:
A4. Title: A5. Department/Division/Bureau of Government:
A6. Address: Street/PO Box: City: State: Postal Code:
A7. Phone: A8.FAX:
A9. Email: A10. Web Site:
A11. Referred By:
A.C. Comments (Contact Information):
SECTION B: STATE GAMING BACKGROUND B1. Types of legalized gambling in the state: (check all that apply)
a. Traditional Lottery d. Stand Alone Commercial Casinos
g. Legal Internet Gambling (play restricted to in-state)
b. Video Lottery (Line Games / Video
e. Racetrack Casinos h. Pari-Mutual Wagering
127

Slots)
c. Internet Lottery f. Indian Casinos i. Charitable Gaming
B.2. Saturation of EGMs
a. Number of electronic gaming machines in state (EGMs):
b. State census, age 18+:
c. Number of EGMs per capita:
B.3. Gaming Revenue
a. Gross gaming revenue:
b. Gaming tax revenue / revenue to state (excluding government administrative costs):
B.C. Comments (Section B, State Gaming Background):
SECTION C: LEGISLATION
C.1. Has the state enacted any legislation that pertains to the prevention or treatment of problem gambling? Yes (1) No (2)
If no - skip this section.
a. Was funding established through a specific legislative bill to grant authority for problem gambling services Yes No
i. If yes, what was the year the bill was passed and what was the bill number?
b. Was funding established through sources other than legislative actions? Yes No
i. If yes, please describe:
c. Can gambling service funds be redirected for other purposes? Yes No
i. If yes, how much redirected in FY 12/13?
ii. To where/for what purpose?
iii. By whom:
128

C.C. Comments (Section C, Legislation):
SECTION D – FUNDING
D.1. Service Initiation & Budget
a. What year did your state first fund problem gambling services for:
i. Treatment v. Helpline
ii. Prevention vi. Other:
iii. Public awareness & outreach vii. Other:
iv. Treatment evaluation
b. What was the overall budget for problem gambling services over the past five years?
Note: include combined amount from all state agency budgets where there are line items specifically identified for problem gambling services or responsible gaming promotion.
i. FY 2008-09 $ iv. FY 2011-12 $
ii. FY 2009-10 $ v. FY 2012-13 $
iii. FY 2010-11 $ vi. FY 2013-14 (anticipated) $
D.2. Source(s) of FY 2012-13 problem gambling services budget & annual amount:
Source Amount Calculation (e.g., % of Lottery revenue)
a. i. $ ii.
b. i. $ ii.
c. i. $ ii.
D.3. Percent of budget allocated to:
a. Administration (Indirect services, FTE, etc.) %
b. Service Evaluation (client data, service outcomes, etc.) %
c. Research (prevalence studies, issue research, surveillance , etc.) %
129

D.C. Comments (Section D, Funding):
SECTION E: SERVICES PROVIDED (PUBLICLY FUNDED ONLY, FUNDS MUST PASS THROUGH STATE AGENCY)
E.1. Services provided (check all that apply):
a. Helpline d. Public Awareness g. Prevention
b. Research e. Counselor Training h. Counselor Certification
c. Evaluation f. Treatment: i. Other:
E.C.1 Comments (Section E, Services Provided):
E.2. Helpline Services
a. Is gambling helpline service:
not available (0) performed by government employees (2)
contracted out (1) available but not paid for by state-funds (3)
If contracted, please provide the following:
b. Name of organization:
c. Is the organization based within your state: Yes No
d. Who are the phones manned by? Check only one
Volunteers (1) Paid staff, no professional license or certification (4)
d. Helpline %
e. Training/Workforce Development %
f. Treatment %
g. Prevention (excluding info dissemination) %
h. Media (print, radio, outdoor, web, TV) %
i. Other (please describe) %
130

Certified Gambling Counselors (2) Mix of certified and non-certified PG counselors (5)
Professional counselors (not certified in PG) (3) Other (6)
e. Services provided by the helpline organization: Check all that apply
i. Information ix. Public Awareness
ii. Crisis Intervention x. Referral to GA/self help
iii. Referral to professional counseling xi. Web-based live chat services
iv. Follow-up services (routine call-backs to check on referral status)
v. Helpline staff provides structured counseling (beyond initial call for help and follow-up call)
vi. Helpline staff mail/email/administer self-change guide
vii. Warm transfer services (caller immediately connected with treatment provider)
viii. 24/7 xii. Other:
f. Are the problem gambling helpline services:
Stand-alone /dedicated PG helpline (1)
Embedded with an A&D/MH/Other crisis helpline (2)
g. Does the PG helpline make accommodations for non-English speakers? (Check one)
yes, bi-lingual or multi-lingual staff (1) yes, multi lingual staff + language line (3)
yes, use of language line (third-party service) (2) no (4)
h. How is the Helpline number promoted? Check all that apply
i. Television ii. Newspaper iii. Billboard iv. Phonebook
v. Brochure vi. Poster vii. Radio viii. Web
ix. Signage in gaming venue x. Printed on Lottery tickets
xi. Other:
j. Total calls ( FY 12/13):
j. Calls for help, including calls for problem gambling information (FY 12/13):
E.C.2 Comments (Section E, Helpline):
131

E.3. For Public Awareness/ Prevention Services:
a. Indicate if the following Center for Substance Abuse Prevention strategies are being used to address problem gambling: Check all that apply i. Information Dissemination: Programs that provide information regarding responsible gambling and problem gambling awareness
ii. Prevention Education: Programs that provide training to multiple agencies, groups and communities with the primary task of raising the capacity of others to address the prevention of problem gambling (usually school-based).
iii. Alternatives: Program that advocate for and provide suggestions for activities other than gambling for youth
iv. Community Based Processes: Programs to involve, empower and support all appropriate communities and collaborators in addressing the prevention of problem gambling
v. Social Policy and Environmental Approaches: Programs to develop and advocate for policies that support the prevention of problem gambling by enhancing protective factors and deterring risk factors in the environment
vi. Problem Identification and Referral: Programs targeting groups with high risk for gambling problems and advocate for treatment services.
E.C.3. Comments: Please describe efforts in your state to increase public awareness of problem gambling, responsible gambling, and treatment availability.
E.C.4. Comments: Please describe efforts in your state to prevent problem gambling through such activities as youth education.
E.C.5. Comments. Please describe those activities that you believe were most effective:
b. What state agencies are funding problem gambling public awareness and/or prevention activities?
i. Human services agency ii. Gaming operator (lottery)
iii. Department of Education iv. Gaming regulatory agency
v. Department of Corrections vi. other
c. Are public awareness and/or prevention services: not available (0) contracted out (1)
performed by government employees (2) performed by gov employees & contractors (3)
132

d. What problem gambling public awareness and prevention activities are being conducted in your state? For those “Prevention” choices, please only endorse if activity is aimed at preventing the onset of the problem.
i. Television ads ii. Dissemination of printed materials (brochures)
iii. Print media iv. Website containing problem gambling info
v. Outdoor (billboards) vi. Social media (Facebook, Twitter, etc.)
vii. Web advertising viii. Informational sessions
ix. Advertising at gaming venue x. Advertising on gaming products
xi. Prevention: Middle school xii. Prevention: College student interventions
xiii. Prevention: High school xiv. Prevention: Parent education
xv. other
E.C.6. Comments. What are the gaps or needs around problem gambling public awareness and prevention?
E.4. Counselor Training - Only those activities directly supported by state funding:
1. Is the service: not available (0) contracted out (1) performed by government employees (2) performed by gov employees &
contractors (3)
2. Please list/describe the training activities provided this fiscal year?: (only those activities directly or partially paid by state)
Activity Clock Hours
# of actual or anticipated Participants
Provided by state affiliate to National Council on Problem Gambling?
i. ia. ib. ic. Yes No
ii. iia. iib. iic. Yes No
iii. iiia. iiib. iiic. Yes No
iv. iva. ivb. ivc. Yes No
v. va. vb. vc. Yes No
vi. via. vib. vic. Yes No
133

E.C.7. Counselor Training Comments.
3. Does the state require specialized certification/licensure for practitioners delivering treatment services to problem gamblers?
no (0) certification (1) licensure (2) licensure and certification (3)
4. Does a state agency provide cert. or licensure for problem gambling counselors? Yes No
5. Does a non-governmental organization in your state provide problem gambling counselor certification? Yes No
6. Are the certification criteria available via the internet? Yes No E.C.8. If yes, please provide the URL:
7. Number of certified problem gambling counselors in the state: E.C.9. Counselor Certification Comments.
E.5. Treatment Service System:
a. Using the ASAM defined levels of treatment service, indicate which levels of care are paid for with state problem gambling treatment funds (check all that apply):
i. Level 0.5 Minimal/Early Intervention ii. Level I Outpatient Therapy (1-8 hours wk) iii. Level II Intensive Outpatient Therapy (≥9 hrs/wk) iv. Level III Residential/Inpatient Treatment v. Level IV Medically-Managed Intensive Inpatient Treatment
b. Recovery Oriented Systems of Care (ROSC) is a coordinated network of community-based
services and supports that is person-centered and builds on the strengths and resilience of individuals, families, and communities to achieve abstinence and improved health, wellness, and quality of life for those with or at risk of addiction problems.
i. Is the gambling treatment system based on ROSC principles as specified in service agreement, regulations, or strategic plans? Yes No
ii. Are recovery oriented approaches funded? Yes No
iii. What ROSC operational elements are currently funded 1) Peer mentoring or peer coaching services 2) Telehealth / distance treatment / e-Therapy 3) Providers allowed flexible spending on wide range of recovery-oriented
service
134

4) Housing options (respite housing, transitional housing, housing assistance, etc.)
5) Other: ___________________________________________ E.C.10. Treatment System Comments.
E.6. Outpatient Therapy: not publicly funded (0) state funded, contracted out (1)
state funded, performed by government employees (2)
state funded, performed by government employees and contracted out (3)
available at no to low cost through non-state subsidies (4)
a. How are therapy services paid (if contracted): Fee for service (1) Expense Reimbursement (2) Capitated Rate (3)
Other (4):
b. If fee for service, what is the reimbursement rate paid by public funds for outpatient therapy? Service Type $ per Hour Caveats
i. Assessment ia. $ ib.
ii. Individual iia. $ iib.
iii. Family/Couples iiia. $ iiib.
iv. Group iva. $ ivb.
v. Other va. $ vb.
vi. Other via. $ vib.
vii. Other ia. $ ib.
c. In general, how do problem gambling treatment service rates compare to mental health and other addiction treatment service rates?
i. Alcohol and drug treatment rates higher lower same ii. Mental health treatment rates higher lower same
d. Are contracts/grants for services awarded to: Agencies (1) Individuals (2)
Both (3) E.C.11. Outpatient Treatment Comments.
135

E.7. Therapist eligibility requirements:
a. Formal Education (minimum degree): HS Diploma (1) AA (2) BA (3) MA (3)
b. Certified Problem Gambling Counselor: Required Yes No
c. Alcohol and Drug Abuse Certification: Required pre-requisite if not Mental Health Professional Yes No
d. Mental Health Professional as defined through licensure: Required if not Certified/Licensed Alcohol and Drug Abuse Counselor (1) Required for all counselors regardless of A&D or Gambling Certification (2) Not required (3)
e. Are problem gambling peer mentors certified?
Yes, as addiction recovery peer mentors (1) Yes, gambling specific peer mentors (3)
No (2) Not applicable (4)
f. Do most (50%+) gambling treatment provider offer peer mentoring services Yes No E.C.12. Therapist Eligibility Comments.
E.8. Treatment consumer eligibility requirements:
a. Minimum Age:
b. Must have diagnosis as Pathological Gambler: Yes No
c. Sub-clinical Pathological Gambler eligible (does not meet diagnostic threshold): Yes
No
d. Concerned/Significant Other: Yes No
e. Is Significant Other eligible without gambler in treatment? Yes No
f. Primary diagnosis must be gambling related Yes No
E.C.13. Treatment Consumer Eligibility Comments.
E.9. Financial considerations:
a. Does the state pay 100% of treatment cost for all consumers? Yes No
136

b. Co-Pays: Not required (0) Required of all providers (1)
c. If, required, what amount: $
d. Co-pays optional, some providers use co-pays others don’t? Yes No
e. Sliding fee: yes, required of all providers (1) yes, optional (2) no (3)
f. Maximum co-pay: Not specified (0) Required of all providers (1)
g. If, required, what amount: $
h. Means test: State payer of last resort Yes No
i. Means Test: Client must be at or below Federal Poverty Level (FPL): Yes No
j. Means test: Client must be below-income by criteria other than 100% FPL: Yes No
E.C.13. Financial Consideration Comments.
E.7. Length of service restrictions:
a. Maximum # of sessions: Yes No
b. If yes, specify the maximum number of sessions:
c. Maximum treatment duration : Not specified (0) Less than one year(1)
One year (2) Over one year (3)
E.C.14. Length of Service Comments.
E.8. Treatment Capacity Issues:
a. Have there been waitlists for problem gambling services during the past year for any state funded treatment providers in your state? Yes No
b. Does your system collect data on time between first contact and treatment entry? Yes No
c. If yes, how is wait time /access measured? Time between: Helpline call to treatment entry (1) Helpline call to first available appointment (2)
Call to tx provider & tx entry (3) Call to treatment provider and 1st avail apt. (4)
Other (5)
d. If yes, what is the average number of days between first contact and treatment entry? E.C.15. Capacity Issues Comments.
137

E.9. Treatment System Performance:
a. Number of consumers receiving outpatient publicly funded therapy (7/11– 6/12):
b. Number of gamblers treated:
c. Number of significant others treated:
d. Average number of sessions:
e. Average cost per client treatment episode:
f. Over the past year, has the number of consumers receiving outpatient publicly funded gambling treatment; Increased (1) Decreased (2) Stayed about the same as the prior year (3)
E.C.16. Treatment System Performance Comments.
E.10. For state funded residential treatment (structured program, more than subsidized housing):
a. Is the service: not publicly funded (1) funded, provided within state (2) funded for state residents but services contracted to out-of-state provider (3)
b. How are residential treatment services paid (if contracted): Fee for service (1) Expense Reimbursement (2) Capitated Rate (3) Other (4):
c. If fee for service, what is the daily reimbursement rate paid by public funds for residential treatment? $ per bed-day.
d. Does your state supported residential gambling treatment centers accept out-of-state clients? Yes No
e. Average length of stay:
f. Maximum length of stay:
g. Number of consumers receiving publicly funded residential gambling treatment (7/11 – 6/12):
h. Over the past year, has the number of consumers receiving residential publicly funded gambling treatment;
138

Increased (1) Decreased (2) Stayed about the same as the prior year (3)
E.C.17. Residential Gambling Treatment Comments.
E.11. Treatment Evaluation Services:
a. Are treatment evaluation services: not publicly funded (0) state funded, performed by government employees of service administration agency (1)
state funded, contracted out to state university. (2) Specify:
state funded, contracted out to private company. (3) Specify:
b. Does your state use a formal data measurement system for gambling treatment services: Yes No
c. If yes, is the system integrated with alcohol and drug service evaluation data: Yes No
d. If yes, is the system integrated with mental health service evaluation data: Yes No
e. What elements are included: (check all that apply) i. Intake data ii. Discharge data iii. Utilization data
iv. Follow-up data v. Othe: E.C.18. Evaluation Services Comments.
E.12. Research & Surveillance Systems:
a. Does your state ask any gambling related questions on youth risk behavior surveys (YRBS)? Yes No If yes, please specify: E.C.15. YRBS Questions.
b. Does your state ask any gambling related questions on youth risk behavior surveys other than YRBS?
Yes No
If yes, name of survey and gambling questions: E.C.16. Youth Survey Questions.
c. Does your state ask any gambling related question on the Behavioral Risk Factor Surveillance System (BRFSS)? Yes No If yes, please specify: E.C.17. BRFSS Questions.
d. Does your state ask any gambling related questions on adult risk or health behavior surveys other than BRFSS? Yes No
139

If yes, name of survey and gambling questions: : E.C.18. Adult Survey Questions.
e. Has your state funded a problem gambling prevalence survey? yes, more than one (1) yes, within the past 5 years (2) yes, over 5 years old (3) no
(4) E.C.19. Surveillance System Comments.
f. In the current fiscal year (FY12-13), has your state funded any gambling related research
that does not fall under “treatment evaluation services” and “surveillance research”? Yes No
E.C.20. If problem gambling related research is funded, other than evaluating funded services or conducting surveillance research, then please describe. Research Comments.
E.13. Consultation and Technical Assistance Services
a. In the current fiscal year (FY12-13), has your state funded consultation or technical assistance services? Yes No
b. Check all those types of technical assistance services contracted in FY12-13. i. Supervision services ii. Program review / site review / accreditation review
iii. Strategic planning iv. System improvement / NIATx
v. Technical consultation (e.g., secondary data analysis, policy analysis, program development)
vi. Other(5):
E.C.20. If public funds were used for problem gambling expert consultation or other technical assistance, then please describe. Consultation and Technical Assistance Comments.
SECTION F: ADMINISTRATIVE STRUCTURE 1. The State agency with funding authorization for problem gambling services:
outsources the administration of services (1)
manages multiple contracts for service provision, does not use state employees for provision of clinical services (2)
manages multiple contracts for service provision and uses state employees for provision of clinical services (3)
140

directly provides the majority of services with state employees (4)
2. Administrator/Director Name: (top level state agency position who manages the problem gambling contracts) Name: Title
3. Is the position assigned 0.5 FTE or greater to problem gambling services? Yes No
4. If 0.5 FTE or greater, in thinking of your Department’s chain of command, how many levels of separation are their between the problem gambling services manager/coordinator and the Department Director/Secretary?
5. Responsible Department/Division/Bureau:
6. Please characterize the function of the responsible Department by choosing one of the below: Human Services, Problem Gambling under addiction services (1)
Human Services, Problem Gambling under mental health / behavioral health services (2)
Human Services, Problem Gambling under combined mental health and addiction services (3)
Human Services, Problem Gambling under public health services (4)
Gaming Services, regulatory agency (5)
Gaming Services, operator (i.e., state lottery) (6)
Gaming Services, other (7): ________________________
Other (8): ________________________
7. Name and Title of the person who does daily management of problem gambling services: Name (7a) Title (7b)
8. Are problem gambling services designated to a problem gambling specific office, unit, or program team: Yes No
9. If yes, name of program/service:
10. State Agency Staff with problem gambling service duties in job description: Name Title FTE Phone/Email/Contact
a. ai. aii. aiii.
b. bi. bii. biii.
c. ci. cii. ciii.
141

d. di. dii. diii.
e. ei. eii. eiii.
f. fi. fii. fiii.
11. Private sector staff or contracted help to assist State Agency with the administration of one or
several problem gambling services: Yes No FTE Equivalent of all such positions:
F.C. Administrative Structure Description & Comments.
SECTION G: POLICY ISSUES 1. Please rate the following elements of problem gambling service infrastructure according to
your state’s level of need with: 0 = no need, 3=somewhat needed, 5=critically needed
a. Increased number of dedicated staff to administer problem gambling programs
b. Increased number of qualified problem gambling treatment providers
c. Increased number of qualified problem gambling prevention providers
d. Improved information management / treatment evaluation system
e. Improved research system
f. Improved problem gambling helpline and website
g. Improved administrative structure to more effectively manage program funds
h. Improved collaboration with gaming operators within your state
i. Improved collaboration and coordination between state and local government agencies
j. Improved coordination of efforts/programs at national level
k. Increased technical assistance
l. Other _________________
m. Other _________________
n. Other _________________
G.C.1. Infrastructure Needs Comments.
142

2. What are the greatest obstacles your state faces in meeting service needs to address problem gambling? (mark only one)
Inadequate Funding (1)
Poor treatment access (2)
Inadequate problem gambling prevention efforts (3)
Poor Public Awareness (4)
Poor system support – e.g., not integrated in health system, criminal justice system (5)
Lack of useful research (6)
Poor service evaluation system (7)
Other (8) _____________________________________________________________
G.C.2. Obstacles Comments.
3. Is your state a member of the Association for Problem Gambling Services (APGSA)? Yes No
G.C.3. How can the APGSA better assist your efforts?
G.C.4. Are there other things would like to tell the APGSA or the survey researchers?
Thank you for completing this survey.
Please email the completed survey to: [email protected] or mail to:
APGSA SURVEY 2013
C/O Problem Gambling Solutions, Inc.
1602 SW Westwood Drive
Portland, OR 97239
You will be receiving a call from our research staff to review the information provided and schedule a time when you can speak with one of the primary investigators.
We appreciate the time and energy you placed into providing this information and we look forward to speaking with you.
143

Appendix D: NCPG Affiliate Survey Instrument
144

2013 NCPG Affiliate Survey SECTION A: CONTACT INFORMATION
A1. State: A2. Name of Organization:
A3. Year founded as Affiliate to National Council on Problem Gambling:
A4. Name of individual completing the survey:
A5. Title:
A6. Address: a. Street/PO Box: b. City: c. State: d. Postal Code:
A7. Phone: A8.FAX:
A9. Email: A10. Web Site: A11. Date:
A.C. Comments (Contact Information):
SECTION B: STATE GAMING BACKGROUND B1. Types of legalized gambling in the state: (check all that apply)
d. Traditional Lottery d. Stand Alone Commercial Casinos
g. Legal Internet Gambling (play restricted to in-state)
e. Video Lottery (Line Games / Video Slots)
e. Racetrack Casinos h. Pari-Mutual Wagering
f. Internet Lottery f. Indian Casinos i. Charitable Gaming
B2. Number of casinos in the state:
B.C. Comments (Section B, State Gaming Background):
145
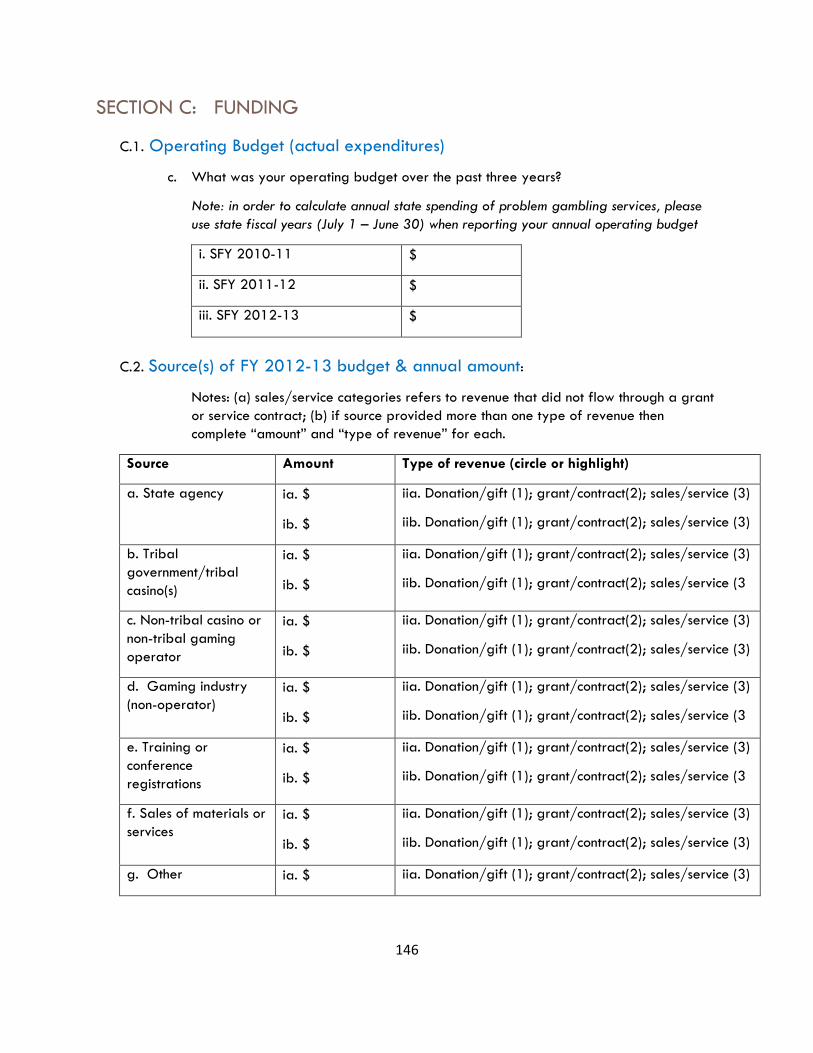
SECTION C: FUNDING
C.1. Operating Budget (actual expenditures)
c. What was your operating budget over the past three years?
Note: in order to calculate annual state spending of problem gambling services, please use state fiscal years (July 1 – June 30) when reporting your annual operating budget
i. SFY 2010-11 $
ii. SFY 2011-12 $
iii. SFY 2012-13 $
C.2. Source(s) of FY 2012-13 budget & annual amount:
Notes: (a) sales/service categories refers to revenue that did not flow through a grant or service contract; (b) if source provided more than one type of revenue then complete “amount” and “type of revenue” for each.
Source Amount Type of revenue (circle or highlight)
a. State agency ia. $
ib. $
iia. Donation/gift (1); grant/contract(2); sales/service (3)
iib. Donation/gift (1); grant/contract(2); sales/service (3)
b. Tribal government/tribal casino(s)
ia. $
ib. $
iia. Donation/gift (1); grant/contract(2); sales/service (3)
iib. Donation/gift (1); grant/contract(2); sales/service (3
c. Non-tribal casino or non-tribal gaming operator
ia. $
ib. $
iia. Donation/gift (1); grant/contract(2); sales/service (3)
iib. Donation/gift (1); grant/contract(2); sales/service (3)
d. Gaming industry (non-operator)
ia. $
ib. $
iia. Donation/gift (1); grant/contract(2); sales/service (3)
iib. Donation/gift (1); grant/contract(2); sales/service (3
e. Training or conference registrations
ia. $
ib. $
iia. Donation/gift (1); grant/contract(2); sales/service (3)
iib. Donation/gift (1); grant/contract(2); sales/service (3
f. Sales of materials or services
ia. $
ib. $
iia. Donation/gift (1); grant/contract(2); sales/service (3)
iib. Donation/gift (1); grant/contract(2); sales/service (3)
g. Other ia. $ iia. Donation/gift (1); grant/contract(2); sales/service (3)
146

(describe) ib. $ iib. Donation/gift (1); grant/contract(2); sales/service (3)
C.3. Percent of budget allocated to:
C.C. Comments (Section D, Funding):
SECTION D: SERVICES PROVIDED (ONLY THOSE SERVICES WHERE FUNDS PASS THROUGH THE NCPG AFFILIATE)
D.1. Services provided (check all that apply):
a. Helpline d. Public Awareness g. Prevention
b. Research e. Counselor Training h. Counselor Certification
c. Evaluation f. Treatment: i. Other:
D.C.1 Comments (Section E, Services Provided):
D.2. Helpline Services
a. Do you utilize the National Helpline Number (800.522.4700) as your primary helpline
number?
Yes No b. If not, what is the primary # used in your state?
c. Is gambling helpline service: Check only one
k. Administration (Indirect services, FTE, etc.) %
l. Service Evaluation (client data, service outcomes, etc.) %
m. Research (prevalence studies, issue research, surveillance , etc.) %
n. Helpline %
o. Training/Workforce Development %
p. Treatment %
q. Prevention (excluding info dissemination) %
r. Media (print, radio, outdoor, web, TV) %
s. Other (please describe) %
147

not available (0)
available in state, paid for by state-funds and NOT administered through our organization (1)
available in state, paid for by state-funds and administered through our organization (2)
available in state, NOT paid for by state funds and provided by our organization (3)
available in state, NOT paid for by state funds and paid for and contracted out by our organization (4)
If helpline services are NOT funded by your organization then skip to section D.3 (Public Awareness / Prevention Services). If you marked “(3)” or “(4)” above then continue.
If funded by your organization, please provide the following:
d. Name of organization providing helpline service (helpline operator):
e. Is the organization based within your state: Yes No
f. Who are the phones manned by? Check only one
Volunteers (1) Paid staff, no professional license or certification (4)
Certified Gambling Counselors (2) Mix of certified and non-certified PG counselors (5)
Professional counselors (not certified in PG) (3) Other (6)
g. Services provided by the helpline organization: Check all that apply
i. Information ix. Public Awareness
ii. Crisis Intervention x. Referral to GA/self help
iii. Referral to professional counseling xi. Web-based live chat services
iv. Follow-up services (routine call-backs to check on referral status)
v. Helpline staff provides structured counseling (beyond initial call for help and follow-up call)
vi. Helpline staff mail/email/administer self-change guide
vii. Warm transfer services (caller immediately connected with treatment provider)
viii. 24/7 xii. Other:
h. Are the problem gambling helpline services:
148

Stand-alone /dedicated PG helpline (1)
Embedded with an A&D/MH/Other crisis helpline (2)
i. Does the PG helpline make accommodations for non-English speakers? (Check one)
yes, bi-lingual or multi-lingual staff (1) yes, multi lingual staff + language line (3)
yes, use of language line (third-party service) (2) no (4)
j. How is the Helpline number promoted? Check all that apply
i. Television ii. Newspaper iii. Billboard iv. Phonebook
v. Brochure vi. Poster vii. Radio viii. Web
ix. Signage in gaming venue x. Printed on Lottery tickets
xi. Other:
k.Total calls (7/11– 6/12):
l. Calls for help, including calls for problem gambling information (7/11– 6/12):
D.C.2 Comments (Section E, Helpline):
D.3. Public Awareness/Prevention Services:
e. Did you participate in National Problem Gambling Awareness Week (NPGAW) this year? Yes No
f. Indicate if the following Center for Substance Abuse Prevention strategies are being used by your organization to address problem gambling: Check all that apply i. Information Dissemination: Programs that provide information regarding responsible gambling and problem gambling awareness
ii. Prevention Education: Programs that provide training to multiple agencies, groups and communities with the primary task of raising the capacity of others to address the prevention of problem gambling (usually school-based).
iii. Alternatives: Program that advocate for and provide suggestions for activities other than gambling for youth
iv. Community Based Processes: Programs to involve, empower and support all appropriate communities and collaborators in addressing the prevention of problem gambling
149

v. Social Policy and Environmental Approaches: Programs to develop and advocate for policies that support the prevention of problem gambling by enhancing protective factors and deterring risk factors in the environment
vi. Problem Identification and Referral: Programs targeting groups with high risk for gambling problems and advocate for treatment services.
D.C.3. Comments: Please describe efforts your organization has engaged in to increase public awareness of problem gambling, responsible gambling, and treatment availability.
D.C.4. Comments: Please describe efforts your organization has engaged in to prevent problem gambling through such activities as youth education.
D.C.5. Comments. Please describe those activities that you believe were most effective:
g. What state agencies are funding problem gambling public awareness and/or prevention activities?
i. Human services agency ii. Gaming operator (lottery)
iii. Department of Education iv. Gaming regulatory agency
v. Department of Corrections vi. other
h. Are public awareness and/or prevention services: not provided (0) Performed by contactors of your organization (1) Performed by employees of your organization (2) performed by employees & contractors (3)
i. What problem gambling public awareness and prevention activities is your organization
providing? For those “Prevention” choices, please only endorse if activity is aimed at preventing the onset of the problem.
i. Television ads ii. Dissemination of printed materials (brochures)
iii. Print media iv. Website containing problem gambling info
v. Outdoor (billboards) vi. Social media (Facebook, Twitter, etc.)
vii. Web advertising viii. Informational sessions
ix. Advertising at gaming venue x. Advertising on gaming products
xi. Prevention: Middle school xii. Prevention: College student interventions
150

xiii. Prevention: High school xiv. Prevention: Parent education
xv. other
D.C.6. Comments. What are the gaps or needs around problem gambling public awareness and prevention?
D.4. Counselor Training - Only those activities directly provide by your organization or contracted through your organization:
a. Is the service: not available (0) contracted out (1) performed by employees (2) performed by employees & contractors (3)
b. Do you use NCPG Education Committee CEUs? Yes No
c. Please list/describe the training activities provided this fiscal year?: (only those activities provided by your organization)
Activity Clock Hours # of actual or anticipated Participants
i. ia. ib.
ii. iia. iib.
iii. iiia. iiib.
iv. iva. ivb.
v. va. vb.
vi. via. vib.
D.C.7. Counselor Training Comments.
d. Does the state require specialized certification/licensure for practitioners delivering treatment services to problem gamblers?
no (0) certification (1) licensure (2) licensure and certification (3)
e. Does a state agency provide cert. or licensure for problem gambling counselors? Yes No
f. Does a non-governmental organization in your state provide problem gambling counselor certification? Yes No
g. Are the certification criteria available via the internet? Yes No E.C.8. If yes, please provide the URL:
h. Number of certified problem gambling counselors in the state:
151

D.C.8. Counselor Certification Comments.
D.5. Treatment Service System (skip is your organization does not directly fund treatment):
c. Using the ASAM defined levels of treatment service, indicate which levels of care are either directly provided by your organization or contracted out by your organization (check all that apply):
vi. Level 0.5 Minimal/Early Intervention vii. Level I Outpatient Therapy (1-8 hours wk) viii. Level II Intensive Outpatient Therapy (≥9 hrs/wk) ix. Level III Residential/Inpatient Treatment x. Level IV Medically-Managed Intensive Inpatient Treatment
D.C.9. Treatment System Comments.
D.6. Treatment System Performance (skip is your organization does not directly fund treatment):
g. Number of consumers receiving therapy funded by your organization (7/11– 6/12):
h. Number of gamblers treated:
i. Number of significant others treated:
j. Average number of sessions:
k. Average cost per client treatment episode:
l. Over the past year, has the number of consumers receiving your outpatient gambling treatment;
Increased (1) Decreased (2) Stayed about the same as the prior year (3) D.C.10. Treatment System Performance Comments.
SECTION E: ADMINISTRATIVE STRUCTURE
12. NCPG Affiliate’s Staff (your organization’s staff)
Name Title FTE Phone/Email/Contact
a. ai. aii. aiii.
b. bi. bii. biii.
152

c. ci. cii. ciii.
d. di. dii. diii.
e. ei. eii. eiii.
f. fi. fii. fiii.
E.C. Administrative Structure Description & Comments.
SECTION F: POLICY ISSUES RESPONSES TO THIS SECTION, POLICY ISSUES, AND THE NEX T SECTION, ADVOCACY, WILL ONLY BE REPORTED IN AGGREGATE. THAT IS, YOUR RESPONSES TO THESE SECTIONS WILL NOT BE LINKED TO YOU IN PUBLIC REPORTS.
NOTE: FOR THE FOLLOWING QUESTIONS, THINK OF THE STATE AS A WHOLE, MORE THAN JUST WHAT YOUR ORGANIZATION DOES.
4. Please rate the following elements of problem gambling service infrastructure according to your state’s level of need with:
0 = no need, 3=somewhat needed, 5=critically needed
o. Increased number of dedicated staff to administer problem gambling programs
p. Increased number of qualified problem gambling treatment providers
q. Increased number of qualified problem gambling prevention providers
r. Improved information management / treatment evaluation system
s. Improved research system
t. Improved problem gambling helpline and website
u. Improved administrative structure to more effectively manage program funds
v. Improved collaboration with gaming operators within your state
w. Improved collaboration and coordination between state and local government agencies
x. Improved coordination of efforts/programs at national level
y. Increased technical assistance
153

z. Other _________________
aa. Other _________________
bb. Other _________________
F.C.1. Infrastructure Needs Comments.
5. What are the greatest obstacles your state faces in meeting service needs to address problem gambling? (mark only one)
Inadequate Funding (1)
Poor treatment access (2)
Inadequate problem gambling prevention efforts (3)
Poor Public Awareness (4)
Poor system support – e.g., not integrated in health system, criminal justice system (5)
Lack of useful research (6)
Poor service evaluation system (7)
Other (8) _____________________________________________________________
F.C.2. Obstacles Comments.
SECTION G: ADVOCACY 1. Have you contacted your state legislators and/or executive branch on a gambling-related bill
or issue this year? Yes No
2. Has a state legislator or member of the executive branch contacted you on a gambling-related bill or issue this year? Yes No
3. Was there a bill(s) to expand gambling in your legislature this year? Yes No
a. Did the state bill(s) pass? Yes No
4. Have you contacted your Federal representatives on a gambling-related bill or issue this year? Yes No
5. Besides NCPG, do any other groups or organization advocate on problem gambling issues in Washington, DC? Yes No a. If yes, who?
154

G.C.1. How can the NCPG better assist your efforts?
G.C.2. Are there other things would like to tell the NCPG or the survey researchers?
Thank you for completing this survey.
Please email the completed survey to: [email protected]
or
Fax: 503 892-3492
You will be receiving a call from our research staff to review the information provided and schedule a time when you can speak with one of the survey staff.
We appreciate the time and energy you placed into providing this information and we look forward to speaking with you.
155


![4 Problem Gambling[1]](https://img.dokumen.tips/doc/110x75/577d2f891a28ab4e1eb200b7/4-problem-gambling1.jpg)