Embed Size (px)
Citation preview
About Conexus Indiana
About Ball State CBER
Conexus Indiana is a private sector-led initiative focused on the advanced man-ufacturing and logistics sectors—two industries that combined employ more than one of every five Hoosiers. Conexus Indiana is focused on making Indiana a global manufacturing and logistics leader by strengthening the state’s human capital, building industry partnerships to capitalize on new opportunities and address key challenges, and promoting a better understanding of the impor-tance of these industries to our economic future.
Conexus Indiana’s most urgent mission is building tomorrow’s manufacturing and logistics workforce, preparing Hoosiers to take advantage of high-tech ca-reers in these exciting fields. Conexus Indiana is also focused on developing a unified strategy to enhance logistics capabilities, linking manufacturers with in-state suppliers to streamline supply chains and spur investment in Indiana, and undertaking other strategic projects that will help the manufacturing and logistics sectors thrive here at the Crossroads of America.
C o n e x u s I n d I a n a 111 Monument Circle, Suite 1800 Indianapolis, IN 46204 317-638-2107 www.conexusindiana.com
The Center for Business and Economic Research (CBER) is an economic policy and forecasting research center at Ball State University. CBER research includes public finance, regional economics, manufacturing, transportation, and energy sector studies.
The Center produces the CBER Data Center—a suite of web-based data tools—and the Indiana Business Bulletin—a weekly newsletter with commentary on current issues and regularly updated data on dozens of economic indicators.
In addition to research and data delivery, CBER serves as a business forecasting authority in Indiana’s east-central region—holding the annual Indiana Economic Outlook luncheon and quarterly meetings of the Ball State University Business Roundtable.
The 2013 Manufacturing and Logistics National Report shows how each state ranks among its peers in several areas of the economy that underlie the success of manufacturing and logistics.
These specific measures include: manufacturing and logistics industry health, human capital, cost of worker benefits, diversification of the industries, state-level productivity and innovation, expected fiscal liability, tax climate, and global reach.
C e n t e r f o r B u s I n e s s a n d e C o n o m I C r e s e a r C h 2000 W. University Ave. (WB 149) Muncie, IN 47306 765-285-5926 www.bsu.edu/cber
2013 MANUfACTUR INg + LOg IST ICS
National Report
2013 MANUfACTUR INg + LOg IST ICS
Categories + Grades
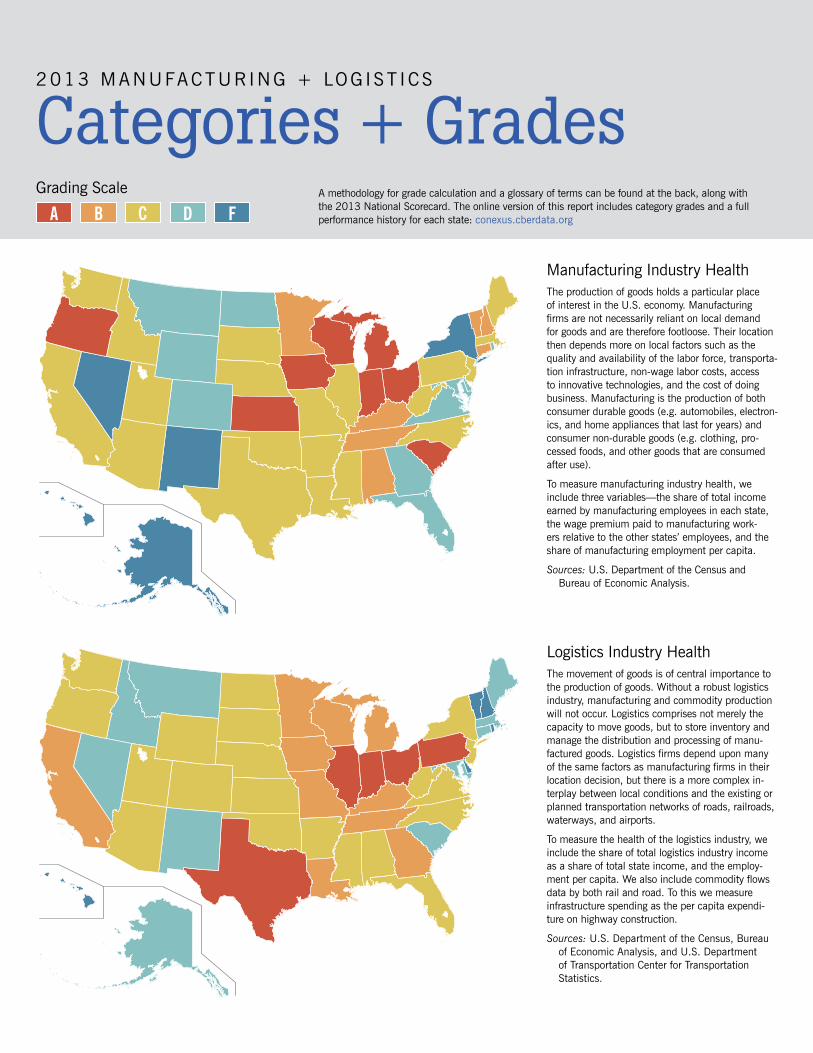
Manufacturing Industry Health
Logistics Industry HealthThe movement of goods is of central importance to the production of goods. Without a robust logistics industry, manufacturing and commodity production will not occur. Logistics comprises not merely the capacity to move goods, but to store inventory and manage the distribution and processing of manu-factured goods. Logistics firms depend upon many of the same factors as manufacturing firms in their location decision, but there is a more complex in-terplay between local conditions and the existing or planned transportation networks of roads, railroads, waterways, and airports.
To measure the health of the logistics industry, we include the share of total logistics industry income as a share of total state income, and the employ-ment per capita. We also include commodity flows data by both rail and road. To this we measure infrastructure spending as the per capita expendi-ture on highway construction.
Sources: U.S. Department of the Census, Bureau of Economic Analysis, and U.S. Department of Transportation Center for Transportation Statistics.
The production of goods holds a particular place of interest in the U.S. economy. Manufacturing firms are not necessarily reliant on local demand for goods and are therefore footloose. Their location then depends more on local factors such as the quality and availability of the labor force, transporta-tion infrastructure, non-wage labor costs, access to innovative technologies, and the cost of doing business. Manufacturing is the production of both consumer durable goods (e.g. automobiles, electron-ics, and home appliances that last for years) and consumer non-durable goods (e.g. clothing, pro-cessed foods, and other goods that are consumed after use).
To measure manufacturing industry health, we include three variables—the share of total income earned by manufacturing employees in each state, the wage premium paid to manufacturing work-ers relative to the other states’ employees, and the share of manufacturing employment per capita.
Sources: U.S. Department of the Census and Bureau of Economic Analysis.
fdCBagrading Scale A methodology for grade calculation and a glossary of terms can be found at the back, along with
the 2013 National Scorecard. The online version of this report includes category grades and a full performance history for each state: conexus.cberdata.org
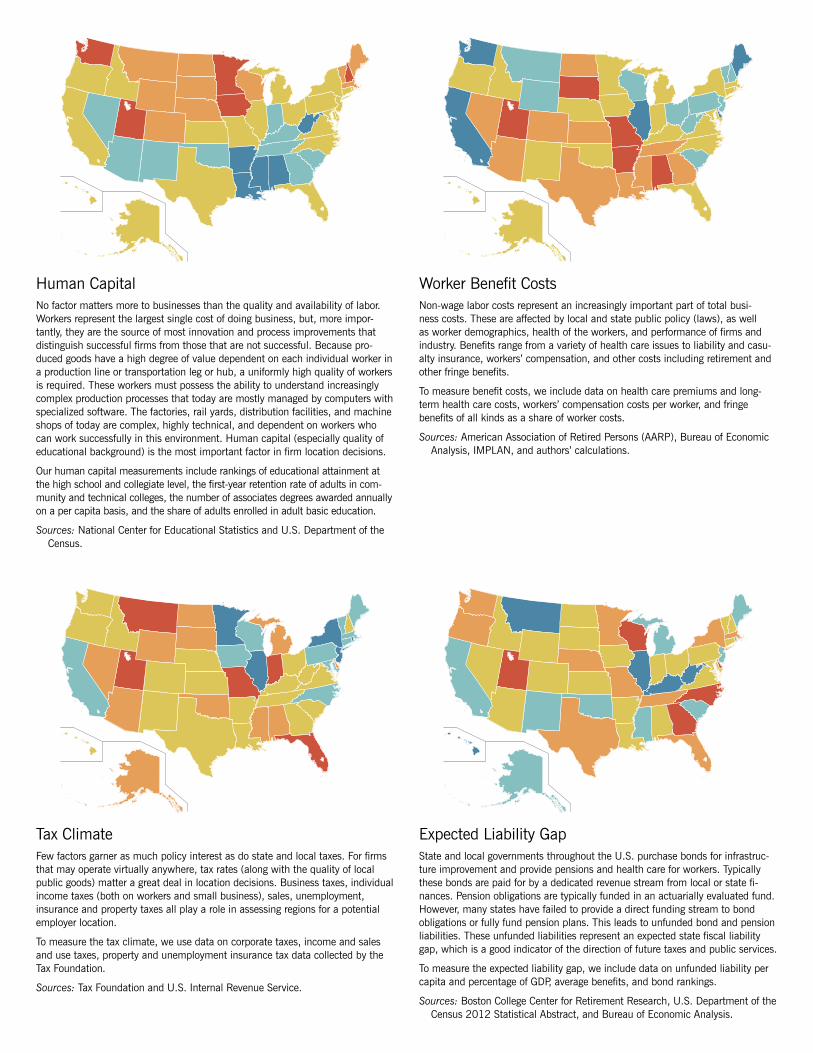
Human CapitalNo factor matters more to businesses than the quality and availability of labor. Workers represent the largest single cost of doing business, but, more impor-tantly, they are the source of most innovation and process improvements that distinguish successful firms from those that are not successful. Because pro-duced goods have a high degree of value dependent on each individual worker in a production line or transportation leg or hub, a uniformly high quality of workers is required. These workers must possess the ability to understand increasingly complex production processes that today are mostly managed by computers with specialized software. The factories, rail yards, distribution facilities, and machine shops of today are complex, highly technical, and dependent on workers who can work successfully in this environment. Human capital (especially quality of educational background) is the most important factor in firm location decisions.
Our human capital measurements include rankings of educational attainment at the high school and collegiate level, the first-year retention rate of adults in com-munity and technical colleges, the number of associates degrees awarded annually on a per capita basis, and the share of adults enrolled in adult basic education.
Sources: National Center for Educational Statistics and U.S. Department of the Census.
Worker Benefit CostsNon-wage labor costs represent an increasingly important part of total busi-ness costs. These are affected by local and state public policy (laws), as well as worker demographics, health of the workers, and performance of firms and industry. Benefits range from a variety of health care issues to liability and casu-alty insurance, workers’ compensation, and other costs including retirement and other fringe benefits.
To measure benefit costs, we include data on health care premiums and long-term health care costs, workers’ compensation costs per worker, and fringe benefits of all kinds as a share of worker costs.
Sources: American Association of Retired Persons (AARP), Bureau of Economic Analysis, IMPLAN, and authors’ calculations.
Tax Climatefew factors garner as much policy interest as do state and local taxes. for firms that may operate virtually anywhere, tax rates (along with the quality of local public goods) matter a great deal in location decisions. Business taxes, individual income taxes (both on workers and small business), sales, unemployment, insurance and property taxes all play a role in assessing regions for a potential employer location.
To measure the tax climate, we use data on corporate taxes, income and sales and use taxes, property and unemployment insurance tax data collected by the Tax foundation.
Sources: Tax foundation and U.S. Internal Revenue Service.
Expected Liability gapState and local governments throughout the U.S. purchase bonds for infrastruc-ture improvement and provide pensions and health care for workers. Typically these bonds are paid for by a dedicated revenue stream from local or state fi-nances. Pension obligations are typically funded in an actuarially evaluated fund. However, many states have failed to provide a direct funding stream to bond obligations or fully fund pension plans. This leads to unfunded bond and pension liabilities. These unfunded liabilities represent an expected state fiscal liability gap, which is a good indicator of the direction of future taxes and public services.
To measure the expected liability gap, we include data on unfunded liability per capita and percentage of gDP, average benefits, and bond rankings.
Sources: Boston College Center for Retirement Research, U.S. Department of the Census 2012 Statistical Abstract, and Bureau of Economic Analysis.
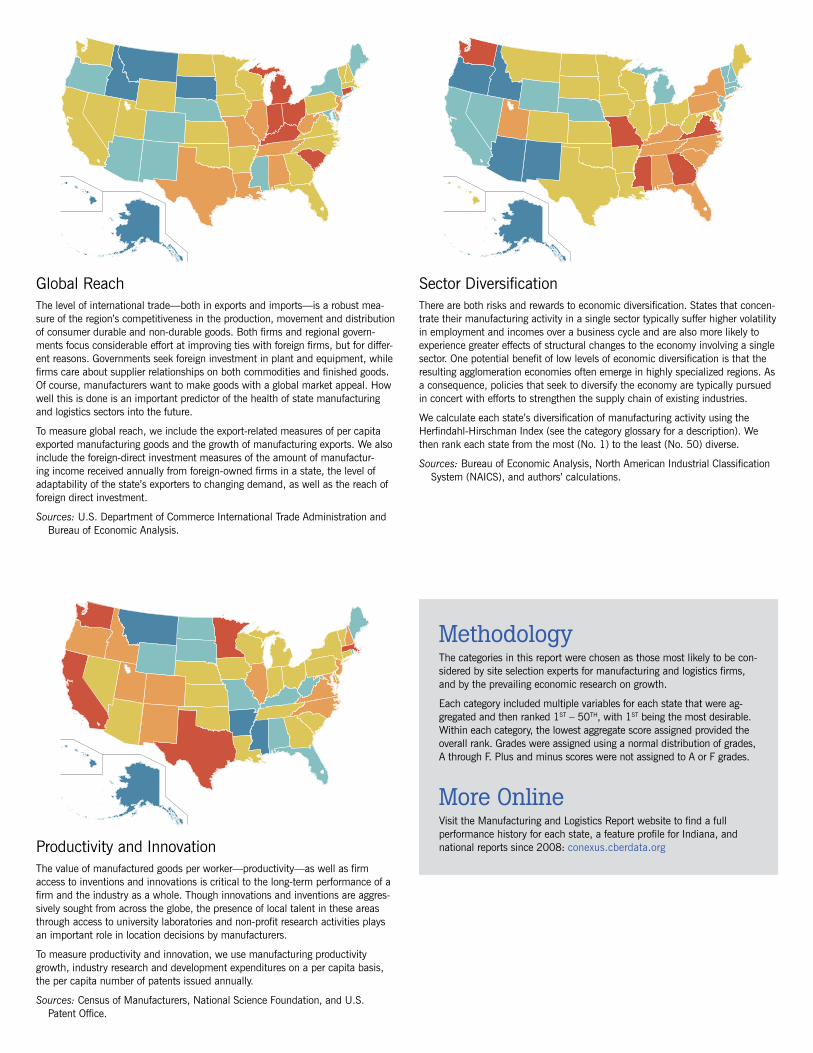
global ReachThe level of international trade—both in exports and imports—is a robust mea-sure of the region’s competitiveness in the production, movement and distribution of consumer durable and non-durable goods. Both firms and regional govern-ments focus considerable effort at improving ties with foreign firms, but for differ-ent reasons. governments seek foreign investment in plant and equipment, while firms care about supplier relationships on both commodities and finished goods. Of course, manufacturers want to make goods with a global market appeal. How well this is done is an important predictor of the health of state manufacturing and logistics sectors into the future.
To measure global reach, we include the export-related measures of per capita exported manufacturing goods and the growth of manufacturing exports. We also include the foreign-direct investment measures of the amount of manufactur-ing income received annually from foreign-owned firms in a state, the level of adaptability of the state’s exporters to changing demand, as well as the reach of foreign direct investment.
Sources: U.S. Department of Commerce International Trade Administration and Bureau of Economic Analysis.
Sector DiversificationThere are both risks and rewards to economic diversification. States that concen-trate their manufacturing activity in a single sector typically suffer higher volatility in employment and incomes over a business cycle and are also more likely to experience greater effects of structural changes to the economy involving a single sector. One potential benefit of low levels of economic diversification is that the resulting agglomeration economies often emerge in highly specialized regions. As a consequence, policies that seek to diversify the economy are typically pursued in concert with efforts to strengthen the supply chain of existing industries.
We calculate each state’s diversification of manufacturing activity using the Herfindahl-Hirschman Index (see the category glossary for a description). We then rank each state from the most (No. 1) to the least (No. 50) diverse.
Sources: Bureau of Economic Analysis, North American Industrial Classification System (NAICS), and authors’ calculations.
Productivity and InnovationThe value of manufactured goods per worker—productivity—as well as firm access to inventions and innovations is critical to the long-term performance of a firm and the industry as a whole. Though innovations and inventions are aggres-sively sought from across the globe, the presence of local talent in these areas through access to university laboratories and non-profit research activities plays an important role in location decisions by manufacturers.
To measure productivity and innovation, we use manufacturing productivity growth, industry research and development expenditures on a per capita basis, the per capita number of patents issued annually.
Sources: Census of Manufacturers, National Science foundation, and U.S. Patent Office.
MethodologyThe categories in this report were chosen as those most likely to be con-sidered by site selection experts for manufacturing and logistics firms, and by the prevailing economic research on growth.
Each category included multiple variables for each state that were ag-gregated and then ranked 1ST – 50TH, with 1ST being the most desirable. Within each category, the lowest aggregate score assigned provided the overall rank. grades were assigned using a normal distribution of grades, A through f. Plus and minus scores were not assigned to A or f grades.
More OnlineVisit the Manufacturing and Logistics Report website to find a full performance history for each state, a feature profile for Indiana, and national reports since 2008: conexus.cberdata.org
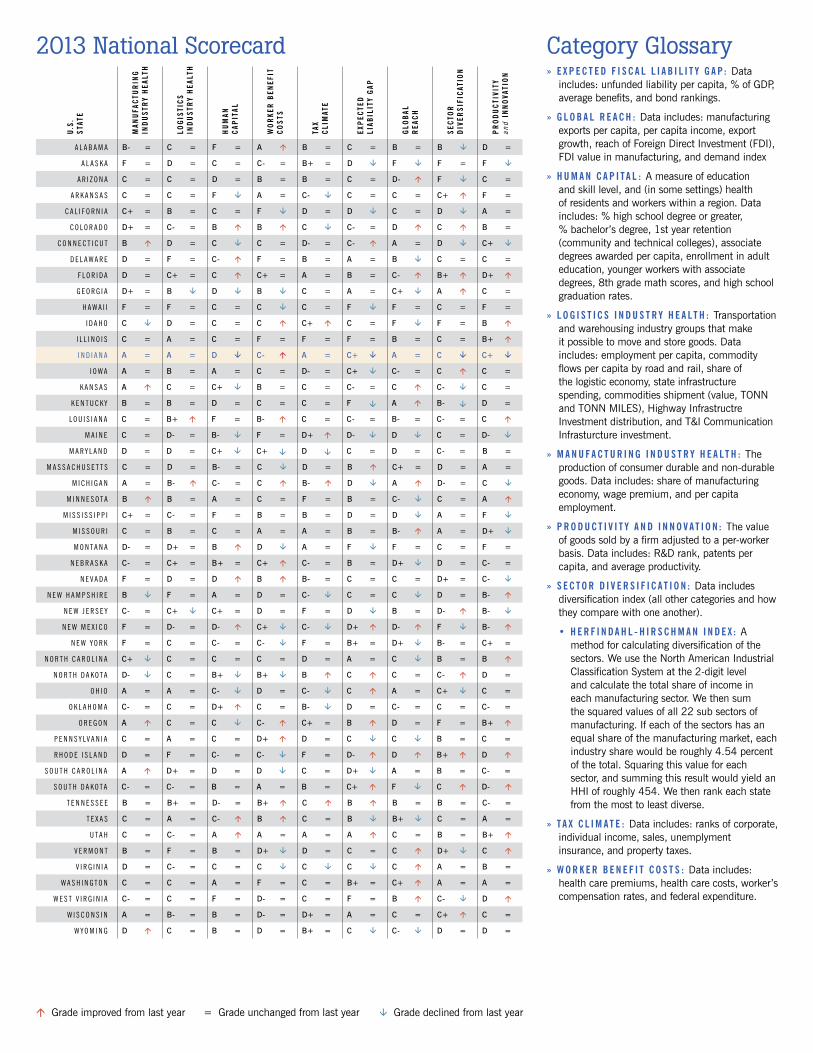
Category Glossary» e x p e C t e d f I s C a l l I a B I l I t y G a p : Data
includes: unfunded liability per capita, % of gDP, average benefits, and bond rankings.
» G l o B a l r e a C h : Data includes: manufacturing exports per capita, per capita income, export growth, reach of foreign Direct Investment (fDI), fDI value in manufacturing, and demand index
» h u m a n C a p I t a l : A measure of education and skill level, and (in some settings) health of residents and workers within a region. Data includes: % high school degree or greater, % bachelor’s degree, 1st year retention (community and technical colleges), associate degrees awarded per capita, enrollment in adult education, younger workers with associate degrees, 8th grade math scores, and high school graduation rates.
» l o G I s t I C s I n d u s t r y h e a l t h : Transportation and warehousing industry groups that make it possible to move and store goods. Data includes: employment per capita, commodity flows per capita by road and rail, share of the logistic economy, state infrastructure spending, commodities shipment (value, TONN and TONN MILES), Highway Infrastructre Investment distribution, and T&I Communication Infrasturcture investment.
» m a n u f a C t u r I n G I n d u s t r y h e a l t h : The production of consumer durable and non-durable goods. Data includes: share of manufacturing economy, wage premium, and per capita employment.
» p r o d u C t I v I t y a n d I n n o v a t I o n : The value of goods sold by a firm adjusted to a per-worker basis. Data includes: R&D rank, patents per capita, and average productivity.
» s e C t o r d I v e r s I f I C a t I o n : Data includes diversification index (all other categories and how they compare with one another).
• h e r f I n d a h l - h I r s C h m a n I n d e x : A method for calculating diversification of the sectors. We use the North American Industrial Classification System at the 2-digit level and calculate the total share of income in each manufacturing sector. We then sum the squared values of all 22 sub sectors of manufacturing. If each of the sectors has an equal share of the manufacturing market, each industry share would be roughly 4.54 percent of the total. Squaring this value for each sector, and summing this result would yield an HHI of roughly 454. We then rank each state from the most to least diverse.
» t a x C l I m a t e : Data includes: ranks of corporate, individual income, sales, unemplyment insurance, and property taxes.
» W o r k e r B e n e f I t C o s t s : Data includes: health care premiums, health care costs, worker’s compensation rates, and federal expenditure.
2013 National Scorecard
á grade improved from last year = grade unchanged from last year â grade declined from last year
u.s.
stat
e
man
ufa
Ctu
rIn
GIn
du
str
y h
ealt
h
loG
IstI
Cs
Ind
ust
ry
hea
lth
hu
man
C
apIt
al
Wo
rke
r B
enef
It
Co
sts
tax
ClI
mat
e
exp
eCte
d lI
aBIl
Ity
Gap
Glo
Bal
r
eaC
h
seC
tor
dIv
ersI
fIC
atIo
n
pr
od
uC
tIvI
ty
and
Inn
ova
tIo
n
A l A b A m A B- = C = F = A á B = C = B = B â D =
A l A s k A F = D = C = C- = B+ = D â F â F = F â
A r i z o n A C = C = D = B = B = C = D- á F â C =
A r k A n s A s C = C = F â A = C- â C = C = C+ á F =
C A l i f o r n i A C+ = B = C = F â D = D â C = D â A =
C o l o r A d o D+ = C- = B á B á C â C- = D á C á B =
C o n n e C t i C u t B á D = C â C = D- = C- á A = D â C+ â
d e l A w A r e D = F = C- á F = B = A = B â C = C =
f l o r i d A D = C+ = C á C+ = A = B = C- á B+ á D+ á
G e o r G i A D+ = B â D â B â C = A = C+ â A á C =
H A w A i i F = F = C = C â C = F â F = C = F =
i d A H o C â D = C = C á C+ á C = F â F = B á
i l l i n o i s C = A = C = F = F = F = B = C = B+ á
i n d i A n A A = A = D â C- á A = C+ â A = C â C+ â
i o w A A = B = A = C = D- = C+ â C- = C á C =
k A n s A s A á C = C+ â B = C = C- = C á C- â C =
k e n t u C k y B = B = D = C = C = F â A á B- â D =
l o u i s i A n A C = B+ á F = B- á C = C- = B- = C- = C á
m A i n e C = D- = B- â F = D+ á D- â D â C = D- â
m A r y l A n d D = D = C+ â C+ â D â C = D = C- = B =
m A s s A C H u s e t t s C = D = B- = C â D = B á C+ = D = A =
m i C H i G A n A = B- á C- = C á B- á D â A á D- = C â
m i n n e s o t A B á B = A = C = F = B = C- â C = A á
m i s s i s s i p p i C+ = C- = F = B = B = D = D â A = F â
m i s s o u r i C = B = C = A = A = B = B- á A = D+ â
m o n t A n A D- = D+ = B á D â A = F â F = C = F =
n e b r A s k A C- = C+ = B+ = C+ á C- = B = D+ â D = C- =
n e V A d A F = D = D á B á B- = C = C = D+ = C- â
n e w H A m p s H i r e B â F = A = D = C- â C = C â D = B- á
n e w J e r s e y C- = C+ â C+ = D = F = D â B = D- á B- â
n e w m e x i C o F = D- = D- á C+ â C- â D+ á D- á F â B- á
n e w y o r k F = C = C- = C- â F = B+ = D+ â B- = C+ =
n o r t H C A r o l i n A C+ â C = C = C = D = A = C â B = B á
n o r t H d A k o t A D- â C = B+ â B+ â B á C á C = C- á D =
o H i o A = A = C- â D = C- â C á A = C+ â C =
o k l A H o m A C- = C = D+ á C = B- â D = C- = C = C- =
o r e G o n A á C = C â C- á C+ = B á D = F = B+ á
p e n n s y lV A n i A C = A = C = D+ á D = C â C â B = C =
r H o d e i s l A n d D = F = C- = C- â F = D- á D á B+ á D á
s o u t H C A r o l i n A A á D+ = D = D â C = D+ â A = B = C- =
s o u t H d A k o t A C- = C- = B = A = B = C+ á F â C á D- á
t e n n e s s e e B = B+ = D- = B+ á C á B á B = B = C- =
t e x A s C = A = C- á B á C = B â B+ â C = A =
u t A H C = C- = A á A = A = A á C = B = B+ á
V e r m o n t B = F = B = D+ â D = C = C á D+ â C á
V i r G i n i A D = C- = C = C â C â C â C á A = B =
w A s H i n G t o n C = C = A = F = C = B+ = C+ á A = A =
w e s t V i r G i n i A C- = C = F = D- = C = F = B á C- â D á
w i s C o n s i n A = B- = B = D- = D+ = A = C = C+ á C =
w y o m i n G D á C = B = D = B+ = C â C- â D = D =
C o n e x u s I n d I a n a 111 Monument Circle, Suite 1800
Indianapolis, IN 46204 317-638-2107
www.conexusindiana.com
C e n t e r f o r B u s I n e s s a n d e C o n o m I C r e s e a r C h 2000 W. University Ave. (WB 149)
Muncie, IN 47306 765-285-5926
www.bsu.edu/cber
2013 Manufacturing + Logistics Report website: conexus.cberdata.org© 2013. Center for Business and Economic Research, Ball State University.


![Indian Manufacturing & Logistics: On a Roller Coaster Ride! · PDF filethe-promise-of-indias-manufacturing-sector]. ... INDIAN MANUFACTURING & LOGISTICS: ON A ROLLER COASTER RIDE!](https://img.dokumen.tips/doc/110x75/5a81bf0b7f8b9aee018d8161/indian-manufacturing-logistics-on-a-roller-coaster-ride-indian-manufacturing.jpg)