Embed Size (px)
Citation preview
Copyright © 2015 by Educational Testing Service. All rights reserved. ETS, the ETS logo and LISTENING. LEARNING. LEADING. are registered
trademarks of Educational Testing Service (ETS).
2015 Major Field Test
Comparative Data Guide
Major Field Test for Psychology
The annual Comparative Data Guide (CDG) contains tables of scaled scores and percentiles for individual student scores and institutional means drawn directly from senior test takers across the nation. The report provides descriptive statistics based on the number of students that have completed the Major Field Test (MFT) for Psychology since it was released in September 2014 through June 2015. Information about an institution gathered through MFT administrations cannot be released in any form attributable to or identifiable with an individual institution. The anonymity of each institution’s performance is maintained by reporting only the aggregate performance of the selected reference group.
Below are descriptions of the various tables provided in this guide:
Individual Students Total Score/Subscore Distributions – The distributions in these tables may be used to interpret
individual student results by determining what percent of those taking the test at the selected institutions attained scores below that of a particular student. Each table shows scaled score intervals for Total Score and Subscores separately. By looking up the Total Score or Subscore and reading across the row to the corresponding number in the column headed “Percent Below,” the percent of individuals scoring below any interval can be determined.
Institutional Means Total Score/Subscore Distributions – The distributions in these tables present the number of institutions at each mean score level. These tables provide a way to compare the Total Score and Subscore means for your institution with those of other participating institutions you selected. These tables show the mean of means (or the average of the mean scores for those institutions/programs selected) as well as the standard deviations of those means.
Institutional Assessment Indicator Mean Score Distributions – The assessment indicator summary information in
these tables includes the frequency distribution of departmental/program means for each assessment indicator. These tables show the distribution of institutional rounded means as well as the average and standard deviations of those means.
Note that not all MFT titles in all subject areas generate subscores or assessment indicators. Please refer to the test content description for your subject area of interest at www.ets.org/mft/about/content to determine which score types you should expect to generate for your MFT test subject.
The following considerations should be kept in mind when interpreting comparative data:
This data should be considered comparative rather than normative because the institutions included in the data do not
represent proportionally the various types of higher education institutions and programs. The data are drawn entirely from institutions that choose to use MFT. Such a self-selected sample may not be representative of all institutions or programs.
The number of students tested and sampling procedures vary from one institution to another. Therefore, it is impossible to
verify that the students tested at each institution are representative of all the institution’s students in that program.
It is important that these comparisons involve students at approximately the same point in their educational careers. The
tables report data for seniors only. Students who are not seniors are excluded from these calculations.
The tables report data for institutions/programs that have tested five (5) or more seniors. Institutions/programs with fewer
than five (5) test takers are excluded from these calculations. No single institution accounts for more than 3% percent of all the students included.
For more information about this report or other ways the Major Field Tests can help your program, contact an ETS Advisor at [email protected] or call 1-800-745-0269.
The following tables include tests taken as of June 30, 2015.

MFT 2015 Comparative Data Guide Page 2 ||DAK-K4GMF||
2015 Comparative Data Guide - MFT for Psychology
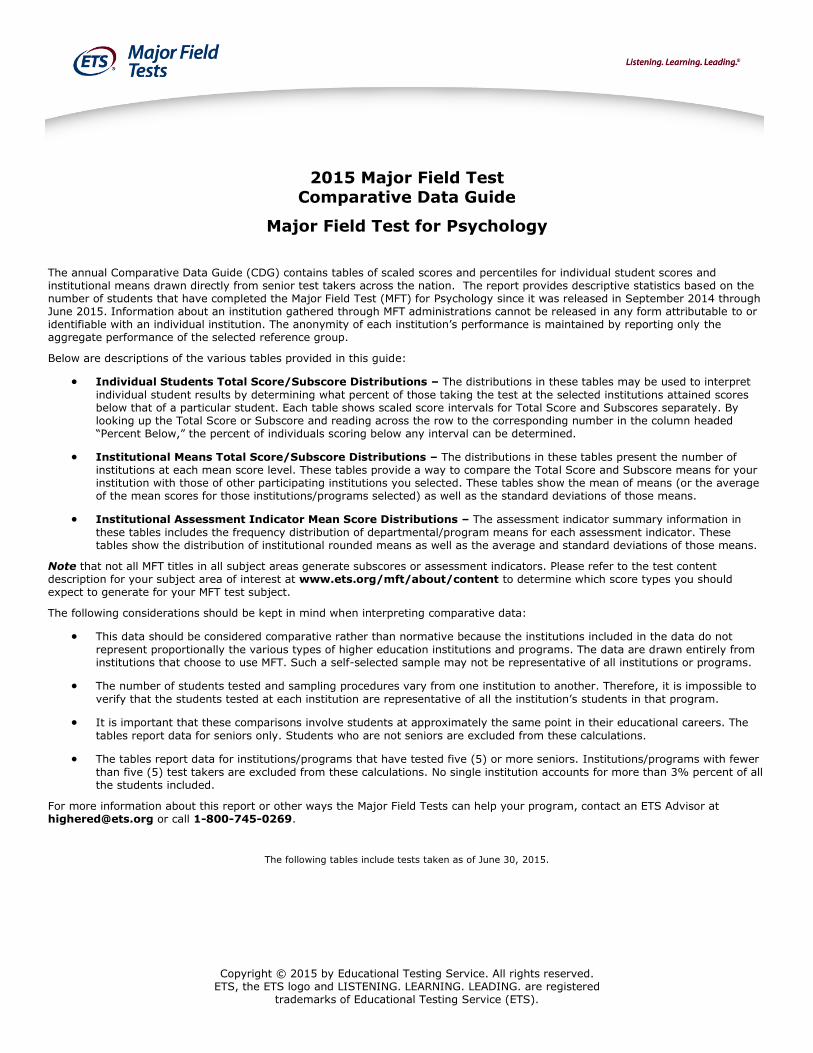
Institution List Data includes seniors from domestic institutions who tested between September 2014 through June 2015.
Adams State College, CO Albertus Magnus College, CT Albion College, MI Albright College, PA Alma College, MI American Public University System, WV Anderson University (IN), IN Austin Peay State University, TN Ave Maria University, FL
Baker University - CAS, KS Ball State University, IN Benedict College, SC Benedictine College, KS Bennett College for Women, NC Berea College, KY Berry College, GA Biola University, CA Birmingham-Southern College, AL Black Hills State University, SD Bloomsburg University, PA Bluefield College, VA Brigham Young University (ID), ID Bryan College, TN Butler University, IN Cabrini College , PA Campbell University - Buies Creek, NC Canisius College, NY Carroll College, MT Carroll University, WI Catholic University of America, DC Cedar Crest College, PA Centenary College of Louisiana, LA Central Methodist University, MO Chapman University, CA Christopher Newport University, VA Citadel, The, SC Clemson University, SC College of Coastal Georgia, GA College of Idaho, ID College of Saint Elizabeth, NJ College of St. Scholastica, The, MN Colorado Christian University, CO Colorado Mesa University, CO Concord University, WV Cornerstone University, MI Cottey College, MO Covenant College, GA Delta State University, MS Dillard University, LA Dixie State College of Utah, UT East Central University, OK East Texas Baptist University, TX Eastern Connecticut State University, CT Eastern Nazarene College, MA
Eastern University, PA Edward Waters College, FL Elizabeth City State University, NC Elmhurst College, IL Emmanuel College (GA), GA Emory & Henry College, VA
Endicott College, MA Fairleigh Dickinson University, NJ Faulkner University, AL Felician College - Lodi, NJ Ferris State University, MI Fisk University, TN Flagler College - St. Augustine, FL Freed-Hardeman University, TN Furman University, SC
George Fox University (OR), OR Georgia College & State University, GA Gonzaga University, WA Greensboro College, NC Grove City College, PA Gustavus Adolphus College, MN Hanover College, IN Henderson State University, AR Hendrix College, AR High Point University, NC Hillsdale College, MI Hofstra University, NY Holy Family University, PA Hood College, MD Houston Baptist University, TX Indiana University South Bend, IN Indiana Wesleyan University, IN Ithaca College, NY Jacksonville State University, AL James Madison University, VA John Brown University, AR John Carroll University, OH Kennesaw State University, GA Kenyon College, OH King College, TN Kings College, PA Lafayette College, PA Lake Forest College, IL Lake Superior State University, MI Langston University, OK Lebanon Valley College, PA Lincoln University (MO), MO Longwood University, VA Louisiana State University in Shreveport, LA Loyola University New Orleans , LA Lubbock Christian University, TX Manchester College, IN Martin Methodist College, TN Mary Baldwin College, VA McMurry University, TX McNeese State University, LA Mercer University, GA Messiah College, PA Metropolitan State College of Denver, CO MidAmerica Nazarene University, KS
Milligan College, TN Minot State University, ND Mississippi State University, MS Missouri Baptist University, MO Missouri State University, MO Missouri University of Science and Technology, MO
MFT 2015 Comparative Data Guide Page 3 ||DAK- K4GMF||
Missouri Western State University, MO Monmouth College, IL Morehouse College, GA Mount Aloysius College, PA Mount Vernon Nazarene University, OH Muskingum University, OH Nazareth College of Rochester, NY Newberry College, SC Northern Kentucky University, KY Northern State University, SD Northwest Nazarene University, ID Norwich University, VT Nova Southeastern University, FL Nyack College, NY Oglethorpe University, GA Ohio Northern University, OH Ohio Valley University, WV Otterbein College, OH Pacific Union College, CA Palo Alto University, CA Pfeiffer University, NC Philadelphia University, PA Piedmont College, GA
Quincy University, IL Randolph College, VA Rollins College, FL Saint Anselm College, NH Saint Leo University, FL Saint Vincent College, PA Salem College, NC Schreiner University, TX Seattle Pacific University, WA Shawnee State University, OH Shenandoah University, VA Shepherd University, WV Sierra Nevada College, NV Southern Adventist University, TN Southern Nazarene University, OK Spelman College, GA Spring Hill College, AL Stevenson University, MD Tennessee Tech University, TN Tennessee Temple University, TN Texas A&M University - Corpus Christi, TX Texas Lutheran University, TX Trine University, IN Trinity Christian College, IL Troy University - Global, AL Troy University - Troy, AL Truman State University, MO United States Air Force Academy, CO
United States Military Academy, NY University of Central Arkansas, AR University of Central Oklahoma, OK University of Idaho, ID University of Michigan - Flint, MI University of Missouri - Kansas City, MO University of Missouri - St. Louis, MO University of Montana Western, The, MT University of Mount Olive, NC University of New England, ME University of New Orleans, LA University of North Alabama, AL University of North Georgia, GA University of Northwestern St. Paul, MN University of Oklahoma, OK University of Pikeville, KY University of Scranton, PA University of South Carolina - Aiken, SC University of South Carolina - Beaufort, SC University of Southern Indiana, IN University of St. Francis (IL), IL University of St. Thomas (MN), MN University of Tampa, FL
University of Tennessee at Martin, TN University of Texas at Tyler, TX University of Wisconsin - Stout, WI Utica College, NY Virginia Military Institute, VA Walla Walla University, WA Washington and Lee University, VA Wayne State University, MI Webster University, MO Wells College, NY Wesleyan College, GA West Liberty University, WV West Virginia State University, WV West Virginia University - Parkersburg, WV Western New England University, MA Whitman College, WA Wilkes University, PA Willamette University, OR Williams Baptist College, AR Wilmington College, OH Wisconsin Lutheran College, WI Wittenberg University, OH Wofford College, SC Xavier University, OH Yeshiva University, NY York College of Pennsylvania, PA Young Harris College, GA
Copyright © 2015 by Educational Testing Service. All rights reserved. ETS, the ETS logo and LISTENING. LEARNING. LEADING. are registered
trademarks of Educational Testing Service (ETS).
MFT 2015 Comparative Data Guide Page 4 ||DAK-K4GMF||
2015 Comparative Data Guide - MFT for Psychology
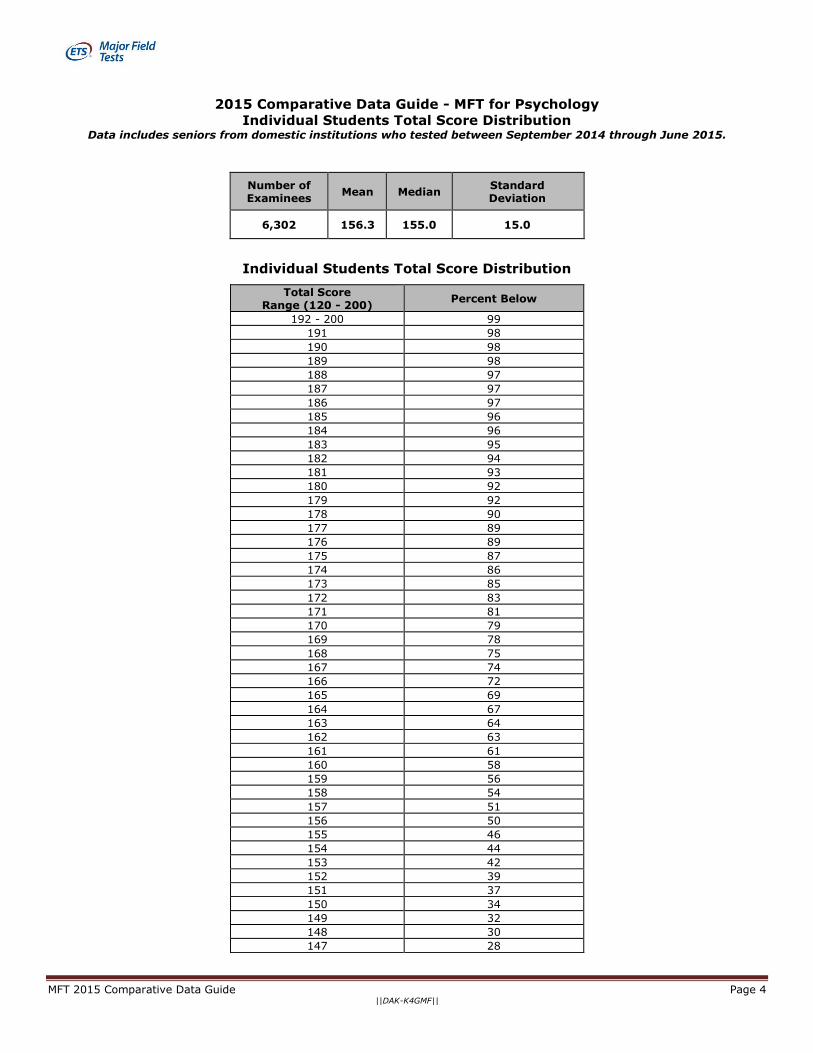
Individual Students Total Score Distribution Data includes seniors from domestic institutions who tested between September 2014 through June 2015.
Number of Examinees
Mean Median Standard Deviation
6,302 156.3 155.0 15.0
Individual Students Total Score Distribution
Total Score Range (120 - 200)
Percent Below
192 - 200 99
191 98
190 98
189 98
188 97
187 97
186 97
185 96
184 96
183 95
182 94
181 93
180 92
179 92
178 90
177 89
176 89
175 87
174 86
173 85
172 83
171 81
170 79
169 78
168 75
167 74
166 72
165 69
164 67
163 64
162 63
161 61
160 58
159 56
158 54
157 51
156 50
155 46
154 44
153 42
152 39
151 37
150 34
149 32
148 30
147 28

MFT 2015 Comparative Data Guide Page 5 ||DAK- K4GMF||
Total Score Range (120 - 200)
Percent Below
146 25
145 24
144 21
143 20
142 17
141 16
140 14
139 13
138 11
137 9
136 8
135 6
134 5
133 4
132 3
131 2
130 2
120 - 129 1
Total Scores are reported as scaled scores.
Percent Below based on percent below the lower limit of the score interval.
Copyright © 2015 by Educational Testing Service. All rights reserved.
ETS, the ETS logo and LISTENING. LEARNING. LEADING. are registered trademarks of Educational Testing Service (ETS).

MFT 2015 Comparative Data Guide Page 6 ||DAK- K4GMF||
2015 Comparative Data Guide - MFT for Psychology1
Individual Students Subscore Distribution Data includes seniors from domestic institutions who tested between September 2014 through June 2015.
Subscore Number of Examinees
Mean Median Standard Deviation
1: Learning, Cognition, Memory
6,302 56.2 56.0 15.7
2: Perception, Sensation, Physiology
6,302 56.1 56.0 15.3
3: Clinical, Abnormal, Personality
6,302 56.1 57.0 14.7
4: Development and Social
6,302 56.4 57.0 14.7
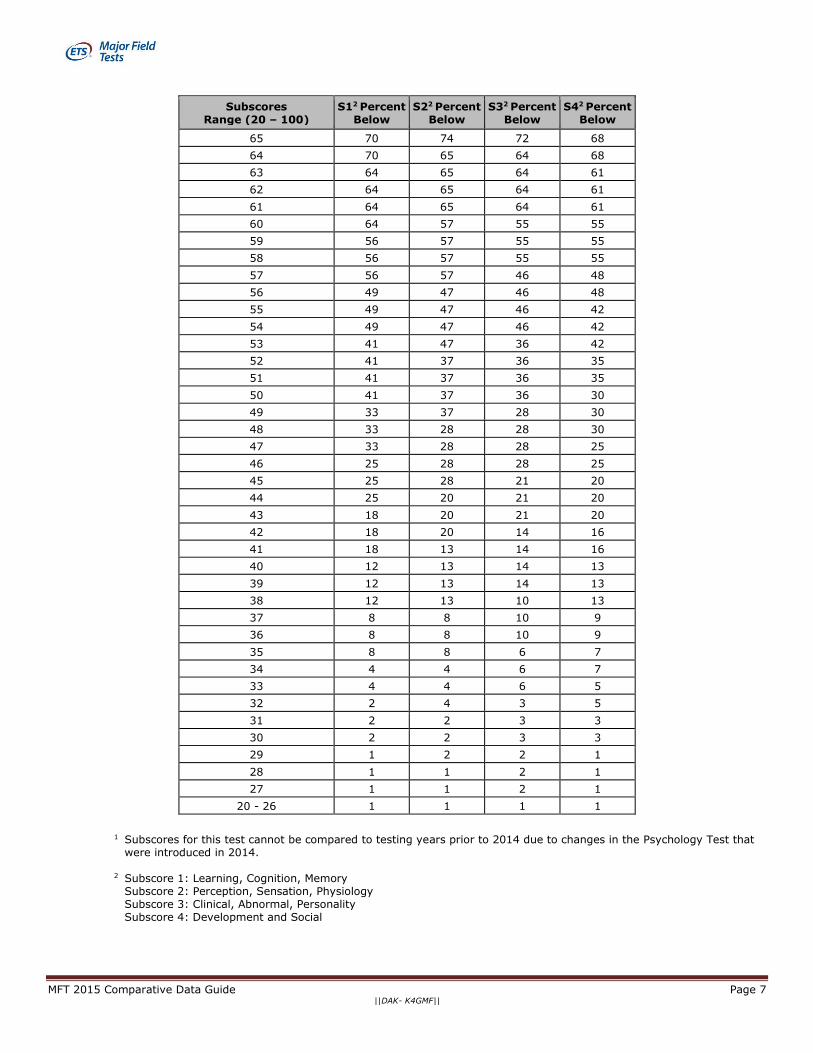
Individual Students Subscore Distribution
Subscores Range (20 – 100)
S12 Percent Below
S22 Percent Below
S32 Percent Below
S42 Percent Below
97 - 100 99 99 99 99
96 98 99 99 99
95 98 98 99 99
94 98 98 99 99
93 98 98 99 99
92 97 98 99 99
91 97 98 99 99
90 97 97 99 99
89 97 97 99 99
88 95 97 99 99
87 95 97 99 99
86 95 97 99 97
85 95 94 97 97
84 93 94 97 97
83 93 94 97 95
82 93 94 97 95
81 90 91 93 95
80 90 91 93 93
79 90 91 93 93
78 90 91 93 93
77 87 91 88 89
76 87 87 88 89
75 87 87 88 89
74 87 87 88 85
73 82 87 88 85
72 82 81 81 85
71 82 81 81 80
70 76 81 81 80
69 76 81 81 80
68 76 74 72 74
67 76 74 72 74
66 70 74 72 68
MFT 2015 Comparative Data Guide Page 7 ||DAK- K4GMF||
Subscores Range (20 – 100)
S12 Percent Below
S22 Percent Below
S32 Percent Below
S42 Percent Below
65 70 74 72 68
64 70 65 64 68
63 64 65 64 61
62 64 65 64 61
61 64 65 64 61
60 64 57 55 55
59 56 57 55 55
58 56 57 55 55
57 56 57 46 48
56 49 47 46 48
55 49 47 46 42
54 49 47 46 42
53 41 47 36 42
52 41 37 36 35
51 41 37 36 35
50 41 37 36 30
49 33 37 28 30
48 33 28 28 30
47 33 28 28 25
46 25 28 28 25
45 25 28 21 20
44 25 20 21 20
43 18 20 21 20
42 18 20 14 16
41 18 13 14 16
40 12 13 14 13
39 12 13 14 13
38 12 13 10 13
37 8 8 10 9
36 8 8 10 9
35 8 8 6 7
34 4 4 6 7
33 4 4 6 5
32 2 4 3 5
31 2 2 3 3
30 2 2 3 3
29 1 2 2 1
28 1 1 2 1
27 1 1 2 1
20 - 26 1 1 1 1
1 Subscores for this test cannot be compared to testing years prior to 2014 due to changes in the Psychology Test that
were introduced in 2014.
2 Subscore 1: Learning, Cognition, Memory Subscore 2: Perception, Sensation, Physiology Subscore 3: Clinical, Abnormal, Personality Subscore 4: Development and Social
MFT 2015 Comparative Data Guide Page 8 ||DAK- K4GMF||
2015 Comparative Data Guide - MFT for Psychology
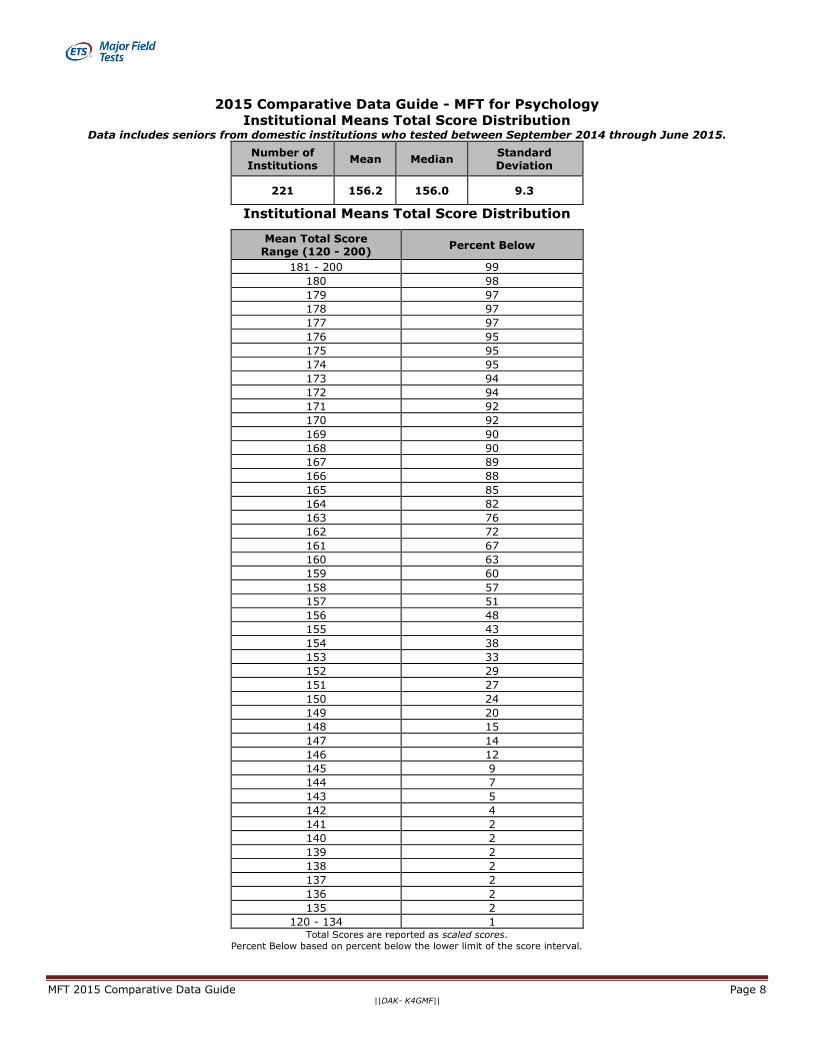
Institutional Means Total Score Distribution Data includes seniors from domestic institutions who tested between September 2014 through June 2015.
Number of Institutions
Mean Median Standard Deviation
221 156.2 156.0 9.3
Institutional Means Total Score Distribution
Mean Total Score Range (120 - 200)
Percent Below
181 - 200 99
180 98
179 97
178 97
177 97
176 95
175 95
174 95
173 94
172 94
171 92
170 92
169 90
168 90
167 89
166 88
165 85
164 82
163 76
162 72
161 67
160 63
159 60
158 57
157 51
156 48
155 43
154 38
153 33
152 29
151 27
150 24
149 20
148 15
147 14
146 12
145 9
144 7
143 5
142 4
141 2
140 2
139 2
138 2
137 2
136 2
135 2
120 - 134 1 Total Scores are reported as scaled scores.
Percent Below based on percent below the lower limit of the score interval.
MFT 2015 Comparative Data Guide Page 9 ||DAK- K4GMF||
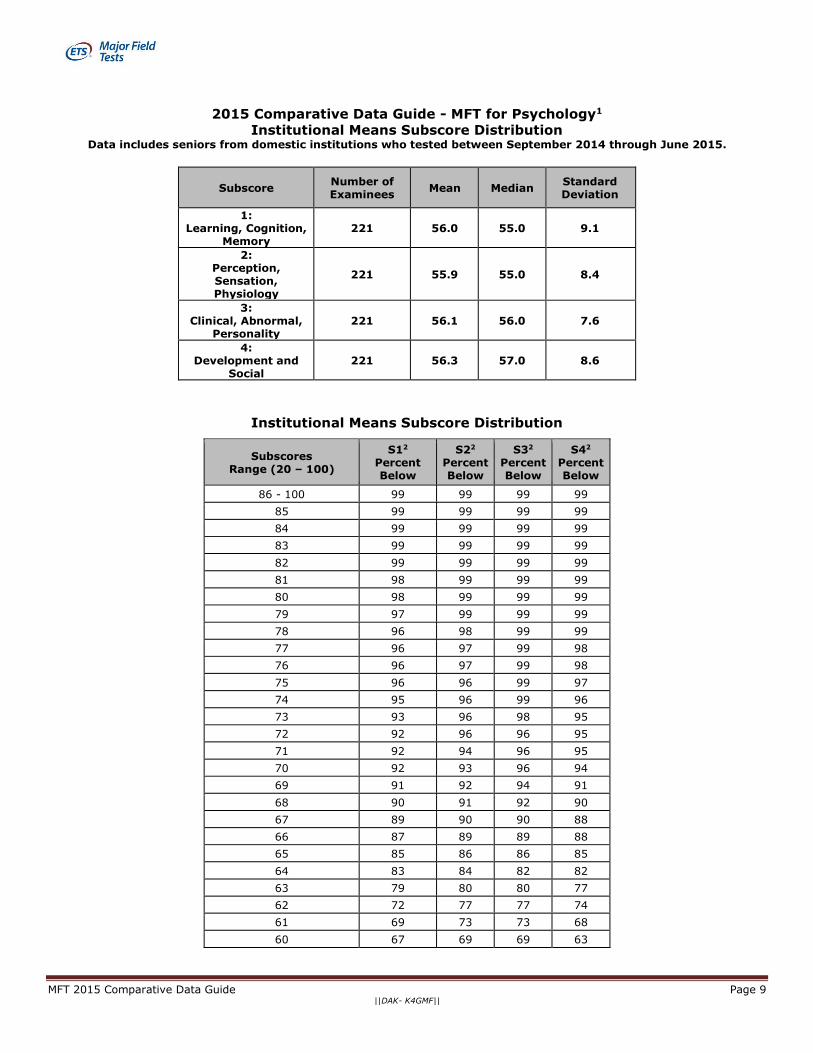
2015 Comparative Data Guide - MFT for Psychology1
Institutional Means Subscore Distribution Data includes seniors from domestic institutions who tested between September 2014 through June 2015.
Subscore Number of Examinees
Mean Median Standard Deviation
1: Learning, Cognition,
Memory 221 56.0 55.0 9.1
2: Perception, Sensation, Physiology
221 55.9 55.0 8.4
3: Clinical, Abnormal,
Personality 221 56.1 56.0 7.6
4: Development and
Social 221 56.3 57.0 8.6
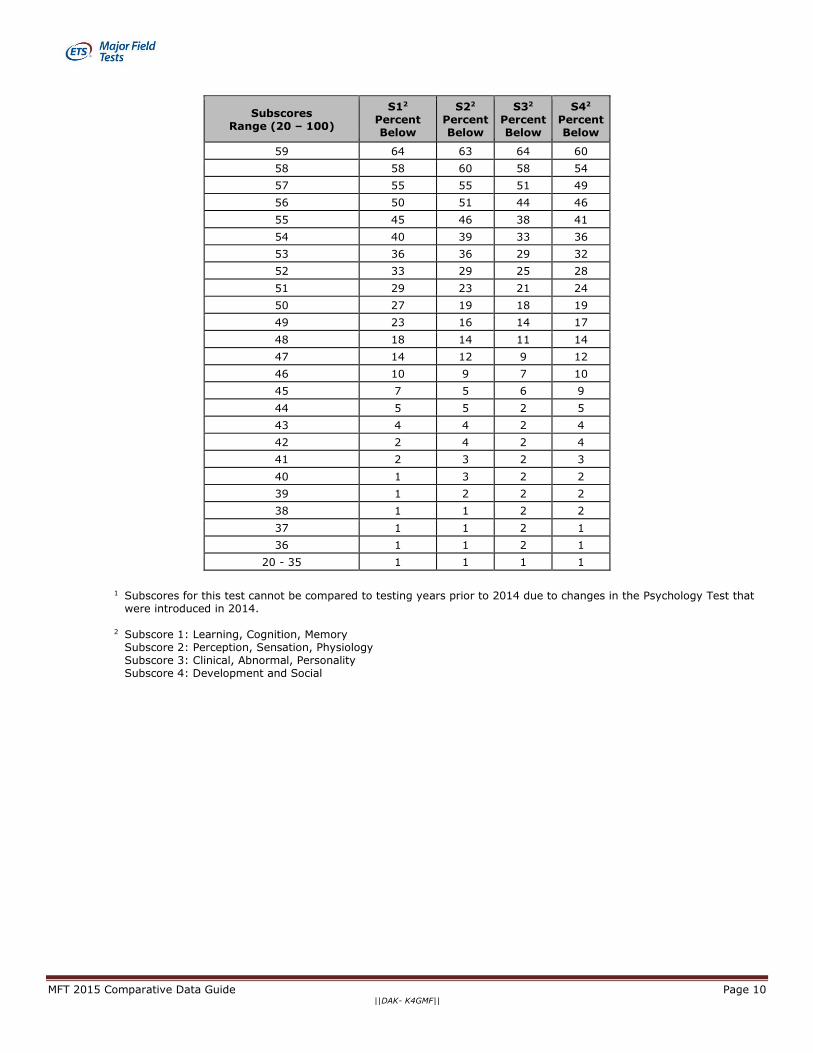
Institutional Means Subscore Distribution
Subscores Range (20 – 100)
S12
Percent Below
S22
Percent Below
S32
Percent Below
S42
Percent Below
86 - 100 99 99 99 99
85 99 99 99 99
84 99 99 99 99
83 99 99 99 99
82 99 99 99 99
81 98 99 99 99
80 98 99 99 99
79 97 99 99 99
78 96 98 99 99
77 96 97 99 98
76 96 97 99 98
75 96 96 99 97
74 95 96 99 96
73 93 96 98 95
72 92 96 96 95
71 92 94 96 95
70 92 93 96 94
69 91 92 94 91
68 90 91 92 90
67 89 90 90 88
66 87 89 89 88
65 85 86 86 85
64 83 84 82 82
63 79 80 80 77
62 72 77 77 74
61 69 73 73 68
60 67 69 69 63
MFT 2015 Comparative Data Guide Page 10 ||DAK- K4GMF||
Subscores Range (20 – 100)
S12
Percent Below
S22
Percent Below
S32
Percent Below
S42
Percent Below
59 64 63 64 60
58 58 60 58 54
57 55 55 51 49
56 50 51 44 46
55 45 46 38 41
54 40 39 33 36
53 36 36 29 32
52 33 29 25 28
51 29 23 21 24
50 27 19 18 19
49 23 16 14 17
48 18 14 11 14
47 14 12 9 12
46 10 9 7 10
45 7 5 6 9
44 5 5 2 5
43 4 4 2 4
42 2 4 2 4
41 2 3 2 3
40 1 3 2 2
39 1 2 2 2
38 1 1 2 2
37 1 1 2 1
36 1 1 2 1
20 - 35 1 1 1 1
1 Subscores for this test cannot be compared to testing years prior to 2014 due to changes in the Psychology Test that
were introduced in 2014. 2 Subscore 1: Learning, Cognition, Memory
Subscore 2: Perception, Sensation, Physiology Subscore 3: Clinical, Abnormal, Personality Subscore 4: Development and Social
MFT 2015 Comparative Data Guide Page 11 ||DAK- K4GMF||
Copyright © 2015 by Educational Testing Service. All rights reserved.
ETS, the ETS logo and LISTENING. LEARNING. LEADING. are registered
trademarks of Educational Testing Service (ETS).
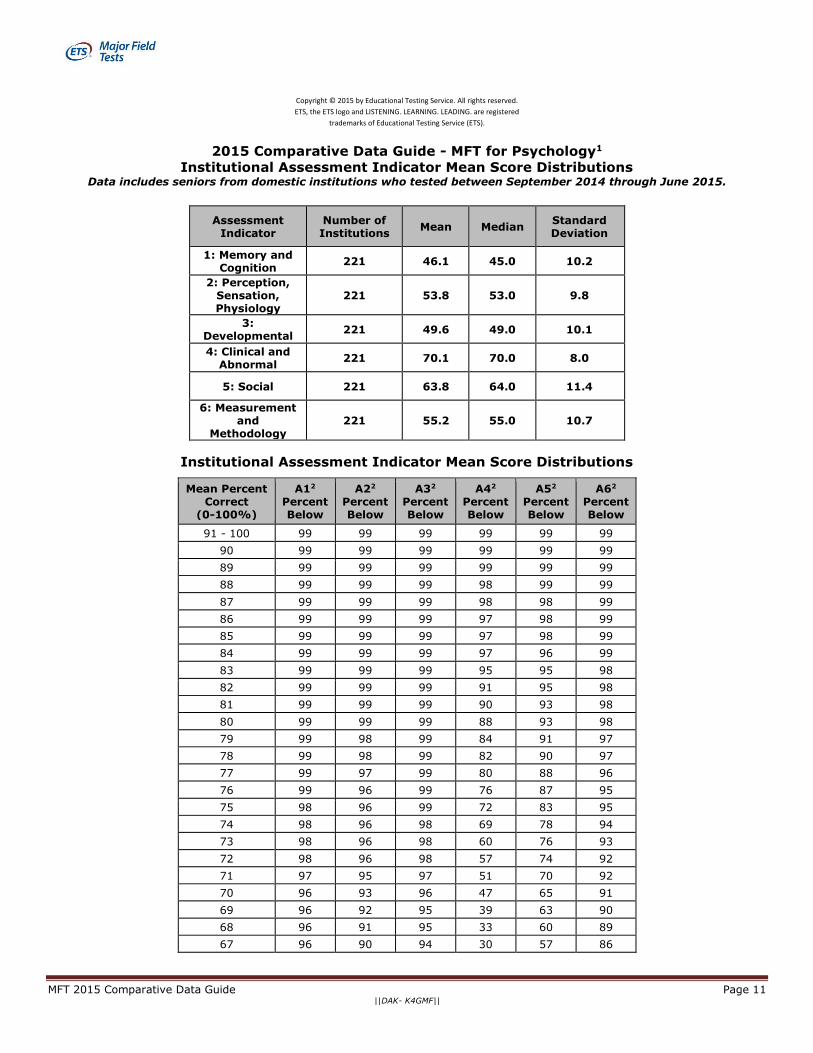
2015 Comparative Data Guide - MFT for Psychology1
Institutional Assessment Indicator Mean Score Distributions Data includes seniors from domestic institutions who tested between September 2014 through June 2015.
Assessment Indicator
Number of Institutions
Mean Median Standard Deviation
1: Memory and Cognition
221 46.1 45.0 10.2
2: Perception, Sensation, Physiology
221 53.8 53.0 9.8
3: Developmental
221 49.6 49.0 10.1
4: Clinical and Abnormal
221 70.1 70.0 8.0
5: Social 221 63.8 64.0 11.4
6: Measurement and
Methodology 221 55.2 55.0 10.7
Institutional Assessment Indicator Mean Score Distributions
Mean Percent Correct
(0-100%)
A12
Percent Below
A22
Percent Below
A32
Percent Below
A42
Percent Below
A52
Percent Below
A62
Percent Below
91 - 100 99 99 99 99 99 99
90 99 99 99 99 99 99
89 99 99 99 99 99 99
88 99 99 99 98 99 99
87 99 99 99 98 98 99
86 99 99 99 97 98 99
85 99 99 99 97 98 99
84 99 99 99 97 96 99
83 99 99 99 95 95 98
82 99 99 99 91 95 98
81 99 99 99 90 93 98
80 99 99 99 88 93 98
79 99 98 99 84 91 97
78 99 98 99 82 90 97
77 99 97 99 80 88 96
76 99 96 99 76 87 95
75 98 96 99 72 83 95
74 98 96 98 69 78 94
73 98 96 98 60 76 93
72 98 96 98 57 74 92
71 97 95 97 51 70 92
70 96 93 96 47 65 91
69 96 92 95 39 63 90
68 96 91 95 33 60 89
67 96 90 94 30 57 86

MFT 2015 Comparative Data Guide Page 12 ||DAK- K4GMF||
Mean Percent Correct
(0-100%)
A12
Percent Below
A22
Percent Below
A32
Percent Below
A42
Percent Below
A52
Percent Below
A62
Percent Below
66 95 90 94 25 55 83
65 95 87 92 20 51 82
64 93 85 91 17 48 80
63 92 83 90 14 44 77
62 92 80 90 12 40 74
61 91 77 87 9 37 69
60 90 74 85 9 32 66
59 88 71 82 6 30 62
58 86 64 79 6 28 60
57 86 63 74 6 24 54
56 84 57 71 3 23 52
55 82 54 69 3 19 47
54 81 51 66 2 17 42
53 75 47 63 2 14 37
52 72 41 58 2 13 33
51 68 37 55 2 11 30
50 65 33 50 1 9 28
49 62 28 44 1 9 27
48 58 23 40 1 7 24
47 53 19 36 1 7 22
46 51 17 32 1 5 19
45 45 14 29 1 5 17
44 41 12 25 1 5 16
43 38 10 21 1 4 13
42 34 9 19 1 3 10
41 31 6 16 1 2 8
40 27 5 14 1 2 4
39 24 4 11 1 1 3
38 21 4 9 1 1 3
37 18 4 8 1 1 3
36 14 3 7 1 1 2
35 10 3 6 1 1 2
34 7 2 5 1 1 2
33 6 2 4 1 1 1
32 5 1 3 1 1 1
31 4 1 3 1 1 1
30 4 1 3 1 1 1
29 2 1 2 1 1 1
28 1 1 2 1 1 1
27 1 1 2 1 1 1
26 1 1 2 1 1 1
0 - 25 1 1 1 1 1 1
¹ Assessment Indicators for this test cannot be compared to testing years prior to 2014 due to changes in the Psychology test that were introduced in 2014.
2 Assessment Indicator 1: Memory and Cognition Assessment Indicator 2: Perception, Sensation, Physiology Assessment Indicator 3: Developmental Assessment Indicator 4: Clinical and Abnormal
MFT 2015 Comparative Data Guide Page 13 ||DAK- K4GMF||
Assessment Indicator 5: Social Assessment Indicator 6: Measurement and Methodology
Assessment Indicators are reported as percent correct. Percent Below based on percent below the lower limit of the score interval.
Copyright © 2015 by Educational Testing Service. All rights reserved.
ETS, the ETS logo and LISTENING. LEARNING. LEADING. are registered
trademarks of Educational Testing Service (ETS).