Embed Size (px)
Citation preview

2016 Report on the
Evaluation of Certain Highway Speed LimitsJanuary 2017

Prepared by The Minnesota Department of Transportation395 John Ireland BoulevardSaint Paul, Minnesota 55155-1899
Phone: 651-296-3000 Toll-Free: 1-800-657-3774 TTY, Voice or ASCII: 1-800-627-3529
To request this document in an alternative formatPlease call 651-366-4718 or 1-800-657-3774 (Greater Minnesota). You may also send an email to [email protected].
2

Contents
Evaluation of Certain Highway Speed Limits.................................................1Contents..........................................................................................................3Legislative Request.........................................................................................4Summary.........................................................................................................6Study Details...................................................................................................7
Study Overview............................................................................................7Study Methodology......................................................................................8
Appendix A: Glossary .....................................................................................9Appendix B: Total Miles for Study by MnDOT District.................................11
55 MPH Trunk Highways – By Lane Mile and MnDOT District*...............11Appendix C: Schedule of Speed Studies – 2014-2018..................................12
Speed Study Schedule 2014-2018: Multi-District Roadways*...................12Speed Study Schedule by Specific Routes, Lengths and Years.................13
Appendix D: Speed Study Screening Evaluation List...................................21Appendix E: 2016 Study Results...................................................................23Appendix F: 2015 Study Results...................................................................35Appendix G: 2014 Study Results...................................................................45Appendix H: Map of Speed Limit Study Progress.........................................49
3

Legislative Request
This report is issued to comply with 2014 Laws of Minnesota, Chapter 312, Article 11, Section 36.
Sec. 36. EVALUATION OF CERTAIN TRUNK HIGHWAY SPEED LIMITS.
Subdivision 1. Engineering and traffic investigations.
The commissioner of transportation shall perform engineering and traffic investigations on trunk highway segments that are two-lane, two-way roadways with a posted speed limit of 55 miles per hour. On determining upon the basis of the investigation that the 55 miles per hour speed limit can be reasonably and safely increased under the conditions found to exist on any of the trunk highway segments examined, the commissioner may designate an increased limit applicable to those segments and erect appropriate signs designating the speed limit. The new speed limit shall be effective when the signs are erected. Of all the roadways to be studied under this section, approximately one-fifth must be subject to investigation each year until the statewide study is complete in 2019.
Subd. 2. Report.
By January 15 annually, the commissioner shall provide to the chairs and ranking minority members of the senate and house of representatives committees with jurisdiction over transportation policy and finance a list of trunk highways or segments of trunk highways that were subject to an engineering and safety investigation in the previous calendar year, specifying in each case the applicable speed limits before and after the investigation.
EFFECTIVE DATE.
This section is effective the day following final enactment and expires on the earlier of Jan. 15, 2019, or the date the final report is submitted to the legislative committees under this section.
4

The cost of preparing this report for 2016 is $253,578.
2016 Project Costs (1/1/2016 - 11/15/2016) 2015 Project Costs (1/1/2015 - 11/25/2015)
MnDOT Staff Time MnDOT Staff Time Project management, speed sampling and data analysis $129,112 Project management, speed sampling and data
analysis $158,703
Consultant Costs Consultant CostsField work $104,650 Field work $75,110
Project management, speed sampling and data analysis $19,816 Project management, speed sampling and data
analysis $122,672
2015 Estimated Total $253,578 2015 Estimated Total $356,485
2014 Project Costs (1/1/2014 - 12/31/2014)
MnDOT Staff Time Project management, speed sampling and data analysis $77,959
Consultant CostsField work $11,630
Project management, speed sampling and data analysis $31,464
2014 Total $121,053
5

Summary
Minnesota has approximately 7,000 miles of two-lane, two-way roadways that are affected by 2014 Laws of Minnesota, Chapter 312, Article 11, Section 36. About 5,000 of these miles cross the borders of different Minnesota Department of Transportation districts and require coordination with the districts to conduct a speed study. A schedule of miles to be studied by year and district was developed for these 5,000 or so miles and is shown in Appendix C. The remaining 2,000 miles do not cross MnDOT district boundaries and the timeline for their study is not assigned but is discretionary to the district in which they lie.
All Minnesota two-lane roadways, with a current speed limit of 55 mph, were identified and then divided into two categories: coordinated routes and discretionary routes, based on whether the roadway crossed a MnDOT district boundary. The coordinated routes were distributed over the five-year study period, taking care to schedule the same highway in the same year across district borders.
Knowing that the 2014 study period would be shortened because of the timing of the law and the need to set expectations and procedures for a five-year study, year one (2014) was assigned fewer miles than the remaining years in the study. Although the initial plan included studying more roadways within 2014, the short timeframe only allowed for the study of approximately 65 percent of the planned coordinated routes and 30 percent of the discretionary routes.
There was progress during 2015 in catching up on the short first year of this study. As of Nov. 6, 2015, 85 percent of the 2014 coordinated routes were studied and authorized and 57 percent of the 2015 coordinated routes were studied and authorized.
In 2016, 88 percent of the 2014 coordinated routes, 80 percent of the 2015 coordinated routes, and 70 percent of the 2016 coordinated routes were studied and authorized. To date, 50 percent of all routes originally proposed for the five year project have been studied and authorized – 54 percent of all coordinated routes are complete and 41 percent of all discretionary routes are complete. Many more miles were studied, but the authorizations are not yet complete. The winter months will be used to finish up roads that have been studied, but not authorized.
Additional data from district safety plans will be used to complete the assessment of each roadway involved in this study.
6

Study Details
Study OverviewThis study covers a widespread geographical area over a five-year timeframe. The main tasks for the study include data collection, data analysis, writing recommendations for speed limits, drafting speed authorizations and signing roadways with the resulting speed limit.
To comply with the legislative language, a study schedule, included in Appendix C, was created for all two-lane, two-way roadways with a 55 mph speed limit in Minnesota.1 Upcoming roadwork and personnel workload were considered when each roadway was scheduled. Roadways that do not cross MnDOT borders and remain solely in one MnDOT district were not included in the schedule. Instead, the district was allowed to decide when to conduct the study, as long as the roadway or segment was studied within the five-year timeframe. Adjustments to this schedule will be made when necessary due to construction activities on state or local roads within the study area, weather or other unforeseen conditions. There were fewer miles of roadway studied in 2014 than in subsequent years because of the limited time available since the effective date of the statute. All the required roadways and segments will be analyzed during the five-year timeframe.
Each of the required roadways will have a speed study done. A speed study analyzes the speed at which 85 percent of drivers choose to drive on a road. The study will recommend a speed limit appropriate to how the road is driven. Many other factors also influence the recommendation, such as the number of access points, shoulder width and crash history. Nine factors are included on the speed study screening considerations worksheet. A sample of this worksheet is included in Appendix D. The nine factors are discussed in greater detail in the next section.
Once the speed study is completed, the District Traffic Engineer reviews all data collected and makes the final recommendations for an appropriate speed limit. When a recommendation to increase a speed limit is made, the MnDOT Office of Traffic, Safety and Technology reviews the new speed authorization. Recommended speed limit increases are reviewed and 1 As Minnesota has gotten further into the study, it was noted that there were a few roadway control sections that were listed to be studied that were no longer 2-lane 55mph roadways. In most of these instances, the roads were upgraded to 4-lane divided highways and no longer qualify for this study. In those cases, the control sections that are not 2-lane 55 mph roads were removed from the schedule and the maps adjusted accordingly.
Other adjustments that were made to the schedule include: removing segments that were previously authorized at a speed limit that is lower than 55 mph and, moving segments into the proper district list because initially they were listed in the wrong district.
7

approved by OTST. Once the speed authorization is signed, the appropriate speed limit signs are installed where necessary. The new speed limits are effective once the new speed limit signs are erected.
It is important to remember that raising a posted speed limit is not inherently making a road “less safe.” A properly selected speed limit can increase the safety of the roadway by creating uniform travel speeds for all vehicles and by setting realistic driver expectations of those trying to cross or enter the roadway.
Study MethodologyTo complete a speed study on a given corridor, MnDOT must collect several sets of data for each control section. While speed samples (actual speed measurements of vehicles) are a large part of the necessary data, there are other factors that must be considered during a speed study such as roadway geometrics and hazard assessments.
MnDOT District Traffic Engineers and the MnDOT Central Office Traffic Safety Unit met prior to the study kickoff to discuss and agree on the work requirements for the consultant contract for this study. The resulting worksheet is attached in Appendix D.
Items included on that worksheet are: access points, shoulder width, vertical grades, clear zone assessments, crash history, passing zones and speed samples. Following is Appendix A, which is a glossary that contains a discussion of the items under consideration on the worksheet.
8

Appendix A: Glossary
Access PointsAn access point refers to public roads, a business driveway, a private driveway or a farm field access. During the planning process, it was determined that most rural highways have an average of seven to nine access points per mile. Fewer access points per mile reduce the number and variety of events which drivers must respond.
Shoulder WidthThe Highway Safety Manual was used as a basis for the shoulder width consideration. The HSM has a default value of 6-foot wide shoulders. A decrease to 5-foot wide shoulders represents a 4 percent increase in the number of crashes. A shoulder, both paved and unpaved, provides a recovery area for errant vehicles and space for disabled vehicles to park.
Vertical GradesGrade is the rate of change of the vertical alignment. Grade affects vehicle speed and vehicle control, particularly for large trucks.
Clear Zone AssessmentA clear zone is an unobstructed, relatively flat area beyond the edge of the traveled way that allows drivers to stop safely and regain control of their vehicle that leaves the traveled way.
Crash RateSeveral different crash rates will be compared during this analysis: the total crash rate, the fatal and serious injury crash rate and the critical crash rate. A crash rate can be an effective tool to measure the relative safety at a particular location. The crash rate is combination of crash frequency and vehicle exposure.
Total Crash Rate Equation:
Total Crash Rate = (total crashes)* 1,000,000 / (Length * ADT * Years * 365 Days/ Year)
Due to the random nature of crashes, a statistical evaluation is used to determine which locations are below the average crash rate, performing near the average crash rate, those that are above the average crash rate and those that are statistically significant (i.e. critical) above the crash rate. Using a critical crash rate helps to ensure that locations being selected are actually having something significant happening, and are not just a result of the random nature of crashes. The Critical Crash Rate helps to filter out areas with low Average Daily Traffic or evaluated over a short time period.
9

Rc = Ra + K * (Ra/m)1/2 + .5/m
Critical Crash Rate = System wide average crash rate + (Confidence Interval/vehicle miles traveled) ½ + (.5/vehicle miles traveled)
K = Confidence Interval; 99.5% K=2.756, 95% K= 1.645, 90% K= 1.282
10

Passing ZonesA passing zone is an area where drivers are allowed to pass other vehicles traveling in the same direction when opposing traffic is not present.
85th PercentileThe 85th percentile speed is a major parameter used by traffic engineers. It is the speed at or below which 85 percent of all vehicles are observed to travel under free flowing conditions past a nominated point. A vehicle is considered to be in free flow conditions when it is not impacted by the speed of a preceding vehicle.
10 MPH PaceTen mile per hour pace is a 10 mile-per-hour increment in speeds that encompasses the highest portion of observed speeds.
A speed study considers all of these elements when conducting the analysis. The District Traffic Engineer considers this analyzed data and their engineering judgment to determine the appropriate speed limit for a roadway.
Tables listing the road segments studied by year and the resulting speed limit recommendations are found in Appendices E, F and G.
11

Appendix B: Total Miles for Study by MnDOT District
55 MPH Trunk Highways – By Lane Mile and MnDOT District*
MnDOT DISTRICT
ROADWAYS IN A SINGLE DISTRICT
ROADWAYS IN MULTIPLE DISTRICTS
TOTAL LANE MILES**
1 381 517 897
2 451 688 1138
3 105 954 1059
4 166 769 935
M 72 222 294
6 459 414 874
7 190 617 807
8 146 584 729
TOTAL 1969 4763 6732
*Trunk highways that do not cross boundaries into another district are scheduled for study at the discretion of the District. The schedule for conducting speed studies on the roadways which cross multiple district boundaries is in Appendix C.
**Totals may not add up exactly due to rounding
12

Appendix C: Schedule of Speed Studies – 2014-2018
As Minnesota has gotten further into the study, it was noted that there were a few roadway control sections that were listed in 2014 to be studied that were no longer 2-lane 55 mph roadways. In most of these instances, the roads were upgraded to 4-lane divided highways and no longer qualify for this study. In those cases, the control sections that are not 2-lane 55 mph roads were removed from the schedule and the maps adjusted accordingly.
Other adjustments that were made to the schedule include: removing segments that were previously authorized at a speed limit which is lower than 55 mph and moving segments into the proper district list because initially they were listed in the wrong district.
Speed Study Schedule 2014-2018: Multi-District Roadways*
DISTRICT YEAR 1: 2014
YEAR 2: 2015
YEAR 3: 2016
YEAR 4: 2017
YEAR 4: 2018
TOTAL MILES / MULTI-DISTRICT
ROADWAYS**
1 86 126 103 176 26 517
2 98 175 119 77 218 688
3 152 196 257 222 127 954
4 104 171 212 133 149 769
M 36 75 22 67 23 222
6 62 92 107 52 102 414
7 60 139 143 128 146 617
8 80 140 105 127 131 584
TOTALS BY YEAR 678 1115 1068 982 920 4763
*Schedule only reflects roadways that cross one or more MnDOT district borders. Roadways that are contained within one MnDOT district are scheduled at the discretion of the district.
**Minor discrepancies in the mileage totals are due to rounding.
13

Speed Study Schedule by Specific Routes, Lengths and Years
Year 1 - 2014 Highway Routes Route Lengths by Miles Total Miles*
2014 US 71 1 2014 US 212 75 2014 MN 13 70 2014 MN 18 62 2014 MN 23 122 2014 MN 32 131 2014 MN 55 152 2014 MN 60 64 678
Year 2 - 2015 Highway Routes Route Lengths by Miles Total Miles*
2015 US 10 7 2015 US 12 115 2015 MN 1 248 2015 MN 3 26 2015 MN 5 33 2015 MN 7 23 2015 MN 22 124 2015 MN 47 98 2015 MN 56 90 2015 MN 68 101 2015 MN 87 61 2015 MN 210 189 1115
Year 3 - 2016 Highway Routes Route Lengths by Miles Total Miles*
2016 US 2 1 2016 US 61 45 2016 US 169 120 2016 MN 6 132 2016 MN 27 180 2016 MN 29 105 2016 MN 30 216 2016 MN 91 58 2016 MN 113 30 2016 MN 119 14 2016 MN 200 169 1068
*Minor discrepancies in the mileage totals are due to rounding.
14

Year 4 - 2017 Highway Routes Route Lengths by Miles Total Miles*
2017 US 59 5 2017 MN 15 129 2017 MN 19 160 2017 MN 21 24 2017 MN 24 27 2017 MN 28 114 2017 MN 34 80 2017 MN 64 62 2017 MN 65 211 2017 MN 95 104 2017 MN 371 65 982
Year 5 - 2018 Highway Routes Route Lengths by Miles Total Miles*
2018 US 14 176 2018 US 52 41 2018 MN 4 146 2018 MN 9 205 2018 MN 11 183 2018 MN 25 121 2018 MN 62 23 2018 MN 70 26 920
*Minor discrepancies in the mileage totals are due to rounding.
15
16
2014 Planned Speed StudiesROADWAY MILES
US 71 1US 212 75MN 13 70MN 18 62MN 23 122MN 32 131MN 55 152MN 60 64TOTAL 678

17
2015 Planned Speed StudiesROADWAY MILES
US 10 7US 12 115MN 1 248MN 3 26MN 5 33MN 7 23
MN 22 124MN 47 98MN 56 90MN 68 101MN 87 61MN 210 189TOTAL 1115

18
2016 Planned Speed StudiesROADWAY MILES
US 2 1US 61 45
US 169 120MN 6 132MN 27 180MN 29 105MN 30 216MN 91 58
MN 113 30MN 119 14MN 200 169TOTAL 1068

19
2017 Planned Speed StudiesROADWAY MILES
US 59 5MN 15 129MN 19 160MN 21 24MN 24 27MN 28 114MN 34 80MN 64 62MN 65 211MN 95 104
MN 371 65TOTAL 982

20
2018 Planned Speed StudiesROADWAY MILES
US 14 176US 52 41MN 4 146MN 9 205MN 11 183MN 25 121MN 62 23MN 70 26TOTAL 920

21

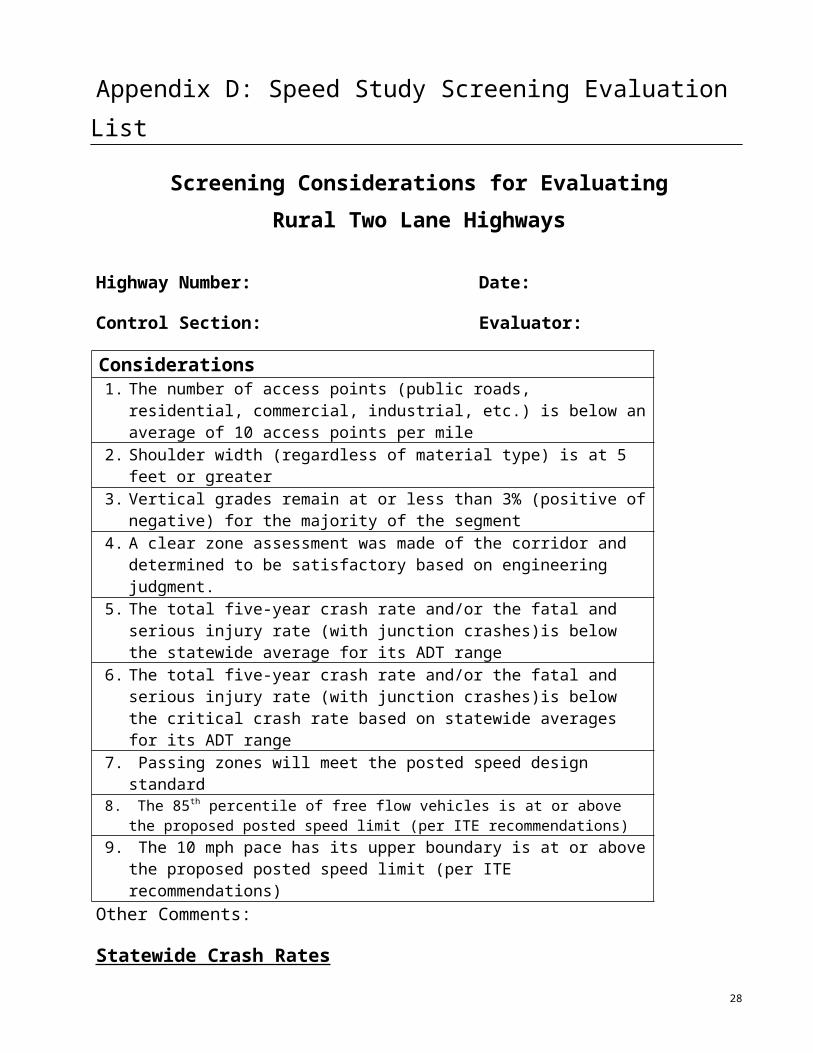
Appendix D: Speed Study Screening Evaluation List
Screening Considerations for EvaluatingRural Two Lane Highways
Highway Number: Date:
Control Section: Evaluator:
Considerations1. The number of access points (public roads, residential, commercial, industrial,
etc.) is below an average of 10 access points per mile 2. Shoulder width (regardless of material type) is at 5 feet or greater3. Vertical grades remain at or less than 3% (positive of negative) for the majority
of the segment 4. A clear zone assessment was made of the corridor and determined to be
satisfactory based on engineering judgment.5. The total five-year crash rate and/or the fatal and serious injury rate (with
junction crashes)is below the statewide average for its ADT range6. The total five-year crash rate and/or the fatal and serious injury rate (with
junction crashes)is below the critical crash rate based on statewide averages for its ADT range
7. Passing zones will meet the posted speed design standard8. The 85th percentile of free flow vehicles is at or above the proposed posted speed limit
(per ITE recommendations)9. The 10 mph pace has its upper boundary is at or above the proposed posted
speed limit (per ITE recommendations)Other Comments:
Statewide Crash RatesFive Years of Crash Data CR FARRural 2-lane : ADT∈[0,1500) 0.64 4.01Rural 2-lane : ADT∈[1500,5000) 0.56 2.60Rural 2-lane : ADT∈[5000,8000) 0.62 2.32Rural 2-lane : ADT∈[8000,∞) 0.72 1.87
Symbol Explanation∈ represents a range or set that the ADT may fall into.A square bracket [signifies that the number is included in the set and a rounded bracket or parenthesis (indicates that number is not included in that set. So, for example:ADT∈ [0, 1500) could be read as “having an ADT from 0 to 1499.”
22

Explanation of the screening considerations for evaluating rural two-lane highways
1. Access Points – The number of access points per mile comes from the district and county roadway safety plans. During this planning process, it was found that most rural highways had an average of seven to nine access points per mile. The choice of 10 access points was chosen that most average roads would meet this consideration, but roads with significantly higher access densities should be evaluated for crash history. Posted speeds may be raised if engineering judgement indicates it is safe to do so.
2. Shoulder Width - The shoulder width consideration was based on the Highway Safety Manual. The HSM has a default value of 6’ shoulders. A decrease to five-foot shoulders represents only a 4 percent increase in the number of crashes.
3. Vertical Grades – HSM has an increased crash modification factor for grades in excess of 3 percent during a given segment.
4. Clear Zone Assessment - Every roadway being considered as a candidate to raise the speed should have a clear zone assessment completed. Roadways should have an acceptable amount of hazard free, forgiving roadside for the clear majority of the road. Hazards within the clear zone should be identified, and based on risk should either be removed or documented as being an acceptable risk.
5. Crash History – Two types of crash rates will be examined: total crash rate and the fatal/serious injury crash rate. Roadways should be evaluated using the five-year statewide crash rates for segments (with intersections included). Evaluations should document: if crash rates are below average for both rates, that there is not a speed related crash problem, and that there are no other traffic safety issues.
6. Crash History – Two types of crash rates will be examined: total crash rate and the fatal/serious injury crash rate. Roadways should be evaluated using the five-year statewide crash rates for segments (with intersections included). It should be documented if both crash rates are below the computed critical crash rate for both rates.
7. Passing Zones – Passing zones should be reviewed and understood to ensure that safe passing can still occur where signing is posted.
8. 85th percentile – The Institute of Transportation Engineers uses this recommendation and process for determining how to set speed limits. MnDOT’s Traffic Engineering Manual also uses this process.
9. 10 mph pace - The Institute of Transportation Engineers uses this recommendation and process for determining how to set speed limits. MnDOT’s Traffic Engineering Manual also uses this process.
23

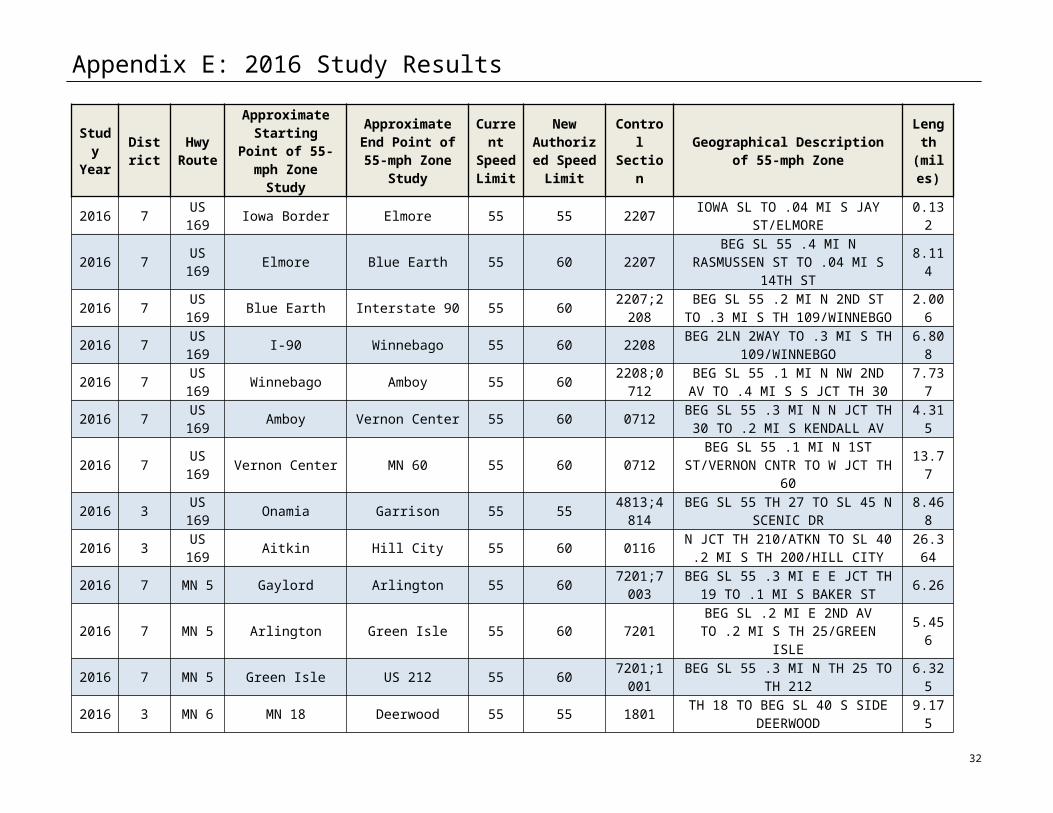
Appendix E: 2016 Study Results
Study Year
District
Hwy Route
Approximate Starting Point of 55-
mph Zone Study
Approximate End Point of 55-mph
Zone Study
Current Speed Limit
New Authorized Speed Limit
Control Section
Geographical Description of 55-mph Zone
Length (miles)
2016 7 US 169 Iowa Border Elmore 55 55 2207 IOWA SL TO .04 MI S JAY ST/ELMORE 0.132
2016 7 US 169 Elmore Blue Earth 55 60 2207 BEG SL 55 .4 MI N RASMUSSEN ST TO .04 MI S 14TH ST 8.114
2016 7 US 169 Blue Earth Interstate 90 55 60 2207;2208 BEG SL 55 .2 MI N 2ND ST TO .3 MI S TH 109/WINNEBGO 2.006
2016 7 US 169 I-90 Winnebago 55 60 2208 BEG 2LN 2WAY TO .3 MI S TH 109/WINNEBGO 6.808
2016 7 US 169 Winnebago Amboy 55 60 2208;0712 BEG SL 55 .1 MI N NW 2ND AV TO .4 MI S S JCT TH 30 7.737
2016 7 US 169 Amboy Vernon Center 55 60 0712 BEG SL 55 .3 MI N N JCT TH 30 TO .2 MI S KENDALL AV 4.315
2016 7 US 169 Vernon Center MN 60 55 60 0712 BEG SL 55 .1 MI N 1ST ST/VERNON CNTR TO W JCT TH 60 13.77
2016 3 US 169 Onamia Garrison 55 55 4813;4814 BEG SL 55 TH 27 TO SL 45 N SCENIC DR 8.468
2016 3 US 169 Aitkin Hill City 55 60 0116 N JCT TH 210/ATKN TO SL 40 .2 MI S TH 200/HILL CITY 26.364
2016 7 MN 5 Gaylord Arlington 55 60 7201;7003 BEG SL 55 .3 MI E E JCT TH 19 TO .1 MI S BAKER ST 6.26
2016 7 MN 5 Arlington Green Isle 55 60 7201 BEG SL .2 MI E 2ND AV TO .2 MI S TH 25/GREEN ISLE 5.456
2016 7 MN 5 Green Isle US 212 55 60 7201;1001 BEG SL 55 .3 MI N TH 25 TO TH 212 6.325
2016 3 MN 6 MN 18 Deerwood 55 55 1801 TH 18 TO BEG SL 40 S SIDE DEERWOOD 9.175
24

Study Year
District
Hwy Route
Approximate Starting Point of 55-
mph Zone Study
Approximate End Point of 55-mph
Zone Study
Current Speed Limit
New Authorized Speed Limit
Control Section
Geographical Description of 55-mph Zone
Length (miles)
2016 3 MN 6 Crosby Emily 55 55 1802 BEG SL 55 N SIDE CROSBY TO SL 30 S SIDE EMILY 16.692
2016 3 MN 6 Emily Outing 55 55 1802;1103 BEG SL 55 N SIDE EMILY TO BEG SL 30 S SIDE OUTING 5.905
2016 3 MN 6 Outing Remer 55 55 1103 BEG SL 55 N OUTING TO BG SL 40 1 MI N CR 131 REME 16.594
2016 3 MN 6 Remer US 2 55 55 1104;3106 BEG SL 55 .2 MI N OF E JCT TH 200 TO USTH 2 20.906
2016 1 MN 6 MN 1 Big Falls 55 60 3603 S JCT TH 1 TO .5 MI S TH 71/BIG FALLS 27.101
2016 7 MN 13 Waseca Waterville 55 55 8102;4001 BEG SL 55 .03 MI N NJCT 19H AV TO TH 60/WATERVILLE 9.379
2016 7 MN 13 Waterville Montgomery 55 55 4001;4002 BEG SL 55 .2 MI N MAIN ST TO .2 MI S OAK AV/MNTGMRY 15.817
2016 7 MN 13 Montgomery New Prague 55 55 4002 BEG SL 55 .4 MI N LEXINGTON AV TO .02 M 6.241
2016 7 MN 22 Iowa Border Kiester 55 60 2203 IOWA SL TO SL 30 .1 MI S FRONT ST/KIESTER 2.494
2016 7 MN 22 Kiester Wells 55 60 2203;2204 BEG SL 55 N SIDE KIESTER TO SL 30 S OF WELLS 14.103
2016 7 MN 22 Wells Minnesota Lake 55 60 2205 BEG SL 55 N LIM WELLS TO SL 45 S SIDE MINNESOTA LK 7.744
2016 7 MN 22 Minnesota Lake Mapleton 55 60 0703 BEG SL 55 N OF MINNESOTA LK TO SL 45 S N JCT TH 30 7.429
2016 7 MN 22 Mapleton Blue Earth County 10 55 60 0704 BEG SL 55 N SIDE MPLTN TO SL 50 .3 MI S CSAH 10 5.039
2016 7 MN 22 Blue Earth County 10 Mankato 55 55 0704 BEG SL 55 .3 MI N CSAH 10 TO SL 45 S SIDE MANKATO 10.51
2016 7 MN 22 Mankato Saint Peter 55 55 0714;4012 BEG SL 55 .04 MI N CSAH 2 TO S JCT TH 169/ST PETER 7.34
25

Study Year
District
Hwy Route
Approximate Starting Point of 55-
mph Zone Study
Approximate End Point of 55-mph
Zone Study
Current Speed Limit
New Authorized Speed Limit
Control Section
Geographical Description of 55-mph Zone
Length (miles)
2016 7 MN 22 Saint Peter Nicollet County 3 55 55 5205 SL 55 W SIDE ST PETER TO SL 40 .2 MI E CSAH 3/NSLND 8.539
2016 7 MN 22 Nicollet County 3 Gaylord 55 60 5205;7207 BEG SL 55 .1 MI W CSAH 3 TO SL 30 S SIDE GAYLORD 13.364
2016 7 MN 22 Gaylord New Auburn 55 60 7208 BEG SL 55 N SIDE GAYLORD TO SL 30 S OF NEW AUBURN 7.042
2016 7 MN 22 New Auburn US 212 55 60 7208;4306 BEG SL 55 N SIDE NEW AUBURN TO W JCT TH 212 4.695
2016 M MN 25 Belle Plaine Green Isle 55 60 7209 BEG SL 55 BELPLAINE TO BEG SL 45 E LIM GREEN ISLE 13.032
2016 M MN 25 US 212 Mayer 55 60 1006 E JCT TH 212 TO BEG SL 40 S LIM MAYER 8.212
2016 M MN 25 Mayer MN 7 55 55 1006 BEG SL 55 7TH ST NW TO TH 7,END METRO (35.320) 1.208
2016 4 MN 27 Brown Valley Wheaton 55 60 7802 TH 28/BROWN VALLEY TO SL 30 S SIDE WHEATON 22.946
2016 4 MN 27 Wheaton Herman 55 60 7803;2603 BEG SL 55 E SIDE WHEATON TO SL 30 W SIDE HERMAN 16.107
2016 4 MN 27 Herman Hoffman 55 60 2604;2605 BEG SL 55 E SIDE HERMAN TO SL 30 TH 55/HOFFMAN 16.861
2016 4 MN 27 Hoffman MN 114 55 60 2605;2101 BEG SL 55 E SIDE HOFFMAN TO .1 MI E TH 114 14.691
2016 4 MN 27 MN 114 Alexandria 55 60 2101 .1 MI W TH 114 TO S JCT TH 29/ALEXANDRIA 3.214
2016 3 MN 27 Osakis Osakis 55 60 7703 TODD CO LN/BEG D3 TO S JCT TH 71 0.247
2016 4 MN 27 Osakis US 71 55 60 7703 BEG SL 40 E SIDE OSAKIS TO TH 127/END D4 12.671
2016 3 MN 27 Long Prairie Little Falls 55 60 7704;4904 BEG SL 55 E SIDE LONG PR TO SL 45 1 MI W TH 238 21.798
26

Study Year
District
Hwy Route
Approximate Starting Point of
55-mph Zone Study
Approximate End Point of 55-mph
Zone Study
Current Speed Limit
New Authorized Speed Limit
Control Section
Geographical Description of 55-mph Zone
Length (miles)
2016 3 MN 27 Little Falls Genola 55 60 4905 BEG SL 55 N SIDE LITTLE FLLS TO SL 45 S SIDE GENOLA 9.999
2016 3 MN 27 MN 25 Lastrup 55 60 4906 N JCT TH 25 TO BEG SL 30 S SIDE LASTRUP 2.557
2016 3 MN 27 Lastrup Onamia 55 60 4906;4803 BEG SL 55 N SIDE LASTRUP TO BEG SL 30 S SIDE ONAMIA 19.404
2016 3 MN 27 US 169 Wahkon 55 55 4804 BEG SL 55 N JCT TH 169 TO SL 45 .2 MI W CSAH 23 5.513
2016 3 MN 27 Wahkon Isle 55 55 4804 BEG SL 55 E SIDE WAHKON TO SL 35 W SIDE OF ISLE 1.73
2016 3 MN 27 MN 47 MN 65 55 60 3309 S JCT TH 47 TO N JCT TH 65 7.207
2016 1 MN 27 MN 65 Moose Lake 55 60 0104;0902;0903
N JCT TH 65 TO .3 MI W CSAH 12/MOOSE LAKE 23.499
2016 1 MN 27 Moose Lake Interstate 35 55 55 0903 .02 MI E E END MOOSE HORN RIVER TO E RAMP I-35 0
2016 4 MN 29 MN 40 Benson 55 60 7607 SWIFT CO LN/BEG D4 TO SL 30 S SIDE BENSON 10.831
2016 4 MN 29 Benson Starbuck 55 60 7608;6105 BEG SL 55 N SIDE BENSON TO SL 40 S SIDE STARBUCK 20.418
2016 4 MN 29 Glenwood Alexandria 55 60 6106;2102 BEG SL 55 N SIDE GLENWOOD TO SL 50 S SIDE ALEXANDRI 12.092
2016 4 MN 29 Alexandria Parkers Prairie 55 60 2103;5608 BEG SL 55 N SIDE ALEX TO SL 45 S SIDE PARKERS PRAIR 17.907
2016 4 MN 29 Parkers Prairie Deer Creek 55 60 5608;5609;5610
BEG SL 55 N SIDE PARKERS PRAIRIE TO .1 MI N TH 106 16.079
2016 4 MN 29 Deer Creek Wadena 55 60 5610 .1 MI N TH 106 TO SL 40 W SIDE WADENA 8.996
2016 7 MN 30 Westbrook Storden 55 60 1701 BEG D7 CSAH 7/WSTBRK TO .2 MI W CSAH 5/STORDEN 5.828
27
Study Year
District
Hwy Route
Approximate Starting Point of
55-mph Zone Study
Approximate End Point of 55-mph
Zone Study
Current Speed Limit
New Authorized Speed Limit
Control Section
Geographical Description of 55-mph Zone
Length (miles)
2016 7 MN 30 Storden Darfur 55 60 1701;1702;8307 BEG SL 55 .3 MI E CSAH 5 TO .1 MI W 2ND ST/DARFUR 23.922
2016 7 MN 30 Darfur MN 4 55 60 8307 BEG SL 55 .1 MI E RAILROAD ST TO JCT TN 4 9.647
2016 7 MN 30 MN 15 US 169 55 55 8306;0705 BEG SL TH 15 TO N JCT TH 169 12.896
2016 7 MN 30 Amboy Mapleton 55 55 0706 BEG SL 55 .2 MI E 4TH AV TO .4 MI W CENTRL AV/MPLTN 10.237
2016 7 MN 30 MN 22 New Richland 55 55 0707;8105 BEG SL 55 S JCT TH 22 TO .1 MI W DOGWOOD AV/NW RCHL 20.81
2016 6 MN 30 New Richland Ellendale 55 60 8106;7403 TH 13/BEG D6 TO SL 30 .1 MI W CSAH 14/ELLENDALE 9.492
2016 6 MN 30 Ellendale Blooming Prairie 55 60 7403;7404 BEG SL 55 E SIDE ELLENDALE TO N JCT TH 218 12.097
2016 6 MN 30 Blooming Prairie Hayfield 55 60 2003;2004 BEG SL 55 STEEL/DODGE CL TO SL 30 W SIDE HAYFIELD 10.937
2016 6 MN 30 Hayfield Dodge County 13 55 60 2004 BEG SL 55 .1 MI E HAYFIELD TO SL 50 .2 MI W CSAH 13 4.724
2016 6 MN 30 Dodge County 13 US 63 55 60 2004;5504 BEG SL 55 .2 MI E CSAH 13 TO N JCT TH 63 12.368
2016 6 MN 30 Stewartville Chatfield 55 60 5504 BEG SL 55 E SIDE STEWARTVILLE TO TH 52/CHATFIELD 14.985
2016 6 MN 30 MN 74 Pilot Mound 55 55 5514 TH 74 TO SL 30 PILOT MOUND 5.917
2016 6 MN 30 Pilot Mound Rushford 55 55 2305 BEG SL 55 PILOT MOUND TO SL 30/ W SIDE RUSHFORD 13.778
2016 2 MN 46 Deer River Squaw Lake 55 55 3109 TH 2 TO SL 40 E SIDE SQUAW LAKE 26.007
2016 2 MN 46 Squaw Lake Northome 55 55 3109;3607 BEG SL 55 .1 MI N SQW LK TO SL 40 .1 MI N NORTHME 18.471
28

Study Year
District
Hwy Route
Approximate Starting Point of 55-
mph Zone Study
Approximate End Point of 55-mph
Zone Study
Current Speed Limit
New Authorized Speed Limit
Control Section
Geographical Description of 55-mph Zone
Length (miles)
2016 1 MN 48 Hinckley Pine County 21 55 60 5804 .1 MI E CR 15 TO .3 MI W CSAH 21/CLOVERDALE 7.22
2016 1 MN 48 Pine County 21 Wisconsin Border 55 60 5804;5813 .3 MI E CSAH 21/CLOVERDALE TO WISC/MINN SL 13.965
2016 6 MN 56 US 63 Leroy 55 60 2312;5005 TH 63 TO SL 30 E SIDE LEROY 6.21
2016 6 MN 56 Leroy Taopi 55 60 5005 BEG SL 55 W SIDE LEROY TO SL 45 E SIDE TAOPI 6.911
2016 6 MN 56 Taopi Adams 55 60 5005 BEG SL 55 W TAPOI TO SL 30 E SIDE ADAMS 3.067
2016 6 MN 56 Adams Brownsdale 55 60 5005;5004 BEG SL 55 W SIDE ADAMS TO SL 30 S SIDE BROWNSDALE 16.171
2016 6 MN 56 Brownsdale US 14 55 60 5004;2005 BEG SL 55 N SIDE BRWNSDL TO E JCT TH 14 18.965
2016 6 MN 56 US 14 West Concord 55 60 2006 W JCT TH 14 TO SL 40 S SIDE WEST CONCORD 7.008
2016 6 MN 56 West Concord Kenyon 55 60 2006;2507 BEG SL 55 N SIDE W CONCORD TO SL 40 S SIDE KENYON 8.566
2016 6 MN 56 Kenyon Randolph 55 60 2508 N JCT TH 60/KENYON TO GOODHUE/DAKOTA CL/END D6 17.154
2016 7 MN 60 US 14 Madison Lake 55 60 0709 E JCT TH 14 TO SL 45 S SIDE MADISON LAKE 3.233
2016 7 MN 60 Madison Lake Elysian 55 60 0709;4006 BEG SL 55 N SIDE MADISON LK TO SL 55 N SIDE MAD L 6.077
2016 7 MN 60 Elysian Waterville 55 60 4006 BEG SL 55 N SIDE ELYSIAN TO SL 50 S OF WATERVILLE 5.117
2016 7 MN 68 Morgan MN 4 55 60 6410;0807 BEG SL 55 .04 MI E CSAH 3/MORGAN TO TH 4 11.816
2016 7 MN 68 MN 15 US 169 55 55 0608;0710 TH 15 TO TH 169 21.189
29

Study Year
District
Hwy Route
Approximate Starting Point of
55-mph Zone Study
Approximate End Point of 55-mph
Zone Study
Current Speed Limit
New Authorized Speed Limit
Control Section
Geographical Description of 55-mph Zone
Length (miles)
2016 4 MN 78 Interstate 94 Ashby 55 60 2614 I 94 S RAMPS TO SL 45 S SIDE ASHBY 3.73
2016 4 MN 78 Ashby Battle Lake 55 60 2612;2108;5619 BEG SL 55 N SIDE ASHBY TO TH 210 BEG SL 40/BAT LK 16.736
2016 4 MN 78 Battle Lake Otter Tail County 128 55 60 5620 BEG SL 55 N SIDE BATTLE LK TO SL
50 .2 MI CR 128 6.678
2016 4 MN 78 MN 108 Perham 55 60 5621 SL 55 .8 MI N S JCT TH 108 TO SL 45 S SIDE PERHAM 9.819
2016 7 MN 83 MN 30 Pemberton 55 60 8107;0711 TH 30 TO .4 MI S CSAH 53 9.314
2016 7 MN 83 Pemberton Mankato 55 60 0711 BEG SL 55 .1 MI N CSAH 53 TO TH 22 14.03
2016 7 MN 86 Iowa Border Lakefield 55 60 3207;3208 IOWA SL TO .2 MI S 5TH AV/LAKEFIELD 11.68
2016 7 MN 86 Lakefield MN 60 55 60 3208 BEG SL 55 .3 MI N MENAGE AV TO TH 60 10.002
2016 2 MN 87 US 71 Hubbard County 6 55 55 2909 N JCT TH 71 TO SL 30 .1 MI W CSAH 6 3.959
2016 2 MN 87 Hubbard County 6 Hubbard County 13 55 55 2909 BEG SL 55 .3 MI E CSAH 6 TO SL 40 .5 MI E CSAH 13 6.234
2016 2 MN 87 Hubbard 279th Ave MN 64 55 55 2909 BEG SL 55 3.3 MI W TH 64 TO TH 64 3.249
2016 7 MN 91 Iowa Border Ellsworth 55 55 5307 IOWA SL TO .1 MI S 7TH AV/ELLSWORTH 0.915
2016 7 MN 91 Ellsworth Adrian 55 55 5307 BEG SL 55 .1 MI N NORTH AV TO .2 MI S LOCUST ST/ADR 10.676
2016 7 MN 91 Adrian Nobles County 72 55 55 5308 BEG SL 55 .1 MI N RAMP I 90 TO NOBLES CL 14.213
2016 2 MN 92 MN 32 Brooks 55 60 6304 TH 32 TO SL 50 .1 MI E CSAH 12 6.059
30

Study Year
District
Hwy Route
Approximate Starting Point of
55-mph Zone Study
Approximate End Point of 55-mph
Zone Study
Current Speed Limit
New Authorized Speed Limit
Control Section
Geographical Description of 55-mph Zone
Length (miles)
2016 2 MN 92 Brooks Trail 55 60 6304;6305;6013 BEG SL 55 .3 MI E CSAH 12 TO SL 50 W SIDE TRAIL 23.807
2016 2 MN 92 Trail Gonvick 55 60 6013;1507 BEG SL 55 E SIDE TRAIL TO SL 45 W SIDE GONVICK 8.987
2016 2 MN 92 Gonvick Clearbrook 55 60 1507 BEG SL 55 E SIDE GONVICK TO SL 30 .1 MI N CLEARBRK 4.455
2016 2 MN 92 Clearbrook Bagley 55 60 1507 BEG SL 55 .1 MI S CLEARBRK TO SL 40 .5 MI N BAGELY 11.025
2016 2 MN 92 Bagley MN 200 55 55 1506 BEG SL 55 S SIDE BAGELY TO TH 200 14.533
2016 7 MN 93 Le Sueur US 169 55 55 7213 BEG SL 55 .2 MI W TH 112/LE SUEUR TO S JCT TH 169 0.617
2016 7 MN 93 US 169 Henderson 55 55 7212 N JCT TH 169 TO .2 MI S ELM ST/HENDERSON 3.448
2016 3 MN 95 Saint Cloud Princeton 55 60 0505;4809 TH 23 E OF ST CLOUD TO SL 50 W SIDE JCT 169 21.95
2016 3 MN 95 Princeton Cambridge 55 60 4810;3005;3006 BEG SL 55 E OF PRINCETON TO SL 30 W SIDE CAMBRIDGE 16.582
2016 3 MN 95 Cambridge North Branch 55 60 3007 BEG SL 55 E SIDE CAMBRIDGE TO ISANTI CO LN/END D3 9.432
2016 7 MN 99 Nicollet Saint Peter 55 55 5206 BEG SL 55 .5 MI E TH 11/NICOLLET TO S JCT TH 169 11.297
2016 7 MN 99 Saint Peter Cleveland 55 55 4008 BEG SL 55 .3 MI E MN RVR BR TO .2 MI W BROADWAY ST 5.255
2016 7 MN 99 Cleveland Le Center 55 55 4008;4009 BEG SL 55 .1 MI E 10TH ST TO .5 MI W LEX AV/LE CNTR 5.914
2016 7 MN 99 Le Center MN 21 55 55 4009;4010;6609 BEG SL 55 .1 MI E CORDOVA AV/LE CENTER TO TH 21 14.007
2016 2 MN 102 Fertile Crookston 55 60 6014 TH 32 TO TH 9 19.297
31
Study Year
District
Hwy Route
Approximate Starting Point of
55-mph Zone Study
Approximate End Point of 55-mph
Zone Study
Current Speed Limit
New Authorized Speed Limit
Control Section
Geographical Description of 55-mph Zone
Length (miles)
2016 4 MN 104 Sunburg Glenwood 55 60 3416;6109;6110 W JCT TH 9 TO SL 40 S SIDE GLENWOOD 25.57
2016 3 MN 107 MN 65 Braham 55 55 3010 TH 65 TO BEG SL 50 S SIDE BRAHAM 0.9
2016 3 MN 107 Braham Brook Park 55 60 3010;3311;5812 BEG SL 55 N SIDE BRAHAM TO TH 23 15.322
2016 4 MN 108 Interstate 94 Pelican Rapids 55 60 8413;5625 I 94 W RAMPS TO SL 45 W SIDE PELICAN RPDS 11.414
2016 4 MN 108 Star Lake Dent 55 55 5623 BEG SL 55 STAR LAKE TO SL 30 W SIDE DENT 5.765
2016 4 MN 108 Dent MN 78 55 55 5623 BEG SL 55 E SIDE DENT TO N JCT 78 6.642
2016 4 MN 108 MN 78 Ottertail 55 55 5624 S JCT TH 78 TO SL 35 W SIDE OTTERTAIL 0.848
2016 4 MN 108 Ottertail Leaf Lake 55 55 5624 BEG SL 55 E SIDE OTTERTAIL TO SL 45 LEAF LAKE 4.959
2016 4 MN 108 Leaf Lake Henning 55 55 5624 BEG SL 55 LEAF LAKE TO SL 45 N SIDE HENNING 5.917
2016 7 MN 109 Winnebago Easton 55 60 2212 BEG SL 55 .03 MI E 4TH ST SE TO .1 MI W 2ND ST/ESTN 12.788
2016 7 MN 109 Easton Wells 55 60 2212 BEG SL 55 .2 MI E 2ND ST TO .4 MI W MALF MOON RD 8.307
2016 7 MN 109 Wells Alden 55 55 2206;2407 BEG SL 55 .1 MI E 3RD ST SE TO .2 MI W MASON AV 8.344
2016 7 MN 112 Le Sueur Le Sueur County 112 55 55 4011 BEG SL 55 .8 MI S TURRIL ST TO .1 MI
W CR 112/ST HE 9.679
2016 7 MN 112 Le Sueur County 112 Le Center 55 55 4011 BEG SL 55 .3 MI E CR 112/ST HENRY
TO TH 99 1.588
2016 2 MN 113 MN 32 Norman County Line 55 55 2911 TH 32 TO NORMAN/MAHNOMEN CL/END D2 9.036
32

Study Year
District
Hwy Route
Approximate Starting Point of
55-mph Zone Study
Approximate End Point of 55-mph
Zone Study
Current Speed Limit
New Authorized Speed Limit
Control Section
Geographical Description of 55-mph Zone
Length (miles)
2016 4 MN 113 Norman County Line Waubun 55 60 4407 MAHNOMEN CO LN/BEG D4 TO SL 30 W SIDE WAUBUN 5.602
2016 4 MN 113 Waubun Mahnomen County 144 55 55 4405 TH 59 BEG SL 55 TO SL 50 .4 MI W CR
144 9.913
2016 4 MN 113 Savannah Township US 71 55 55 0307;2911 BEG SL 55 10 MI W TH 71 TO TH 71 5.079
2016 4 MN 114 Starbuck Lowry 55 60 6111 BEG SL 55 N SIDE STARBUCK TO SL 30 S SIDE LOWRY 5.385
2016 4 MN 114 Lowry Interstate 94 55 60 6112;2110;2111 W JCT TH 55 TO I 94 N RAMPS 12.697
2016 3 MN 115 Randall Camp Ripley 55 55 4908 TH 10 TO BEG SL 45 W OF CAMP RIPLEY 6.931
2016 4 MN 117 South Dakota Border MN 27 55 55 7807 SO DAK/MINN SL TO TH 27 1.797
2016 4 MN 119 Appleton US 12 55 60 7612 N JCT TH 7 & TH 59 TO TH 12 5.298
2016 1 MN 123 Sandstone Asko 55 60 5802 .1 MI N BR 5718 TO N JCT TH 23 6.397
2016 1 MN 194 US 2 US 53 55 60 6932 TH 2 TO W JCT TH 53 (RP 7.649) 7.637
2016 2 MN 200 North Dakota Border Halstad 55 60 5412;5411 ND/MINN SL TO SL 30 W SIDE HALSTAD 0.603
2016 2 MN 200 US 75 Ada 55 60 5407 S JCT TH 75 TO SL 40 W SIDE ADA 13.13
2016 2 MN 200 Ada Norman County Line 55 60 5401;5402;5403 BEG SL 55 .4 MI E ADA TO NORMAN/MAHNOMEN CL/BEG D4 21.92
2016 4 MN 200 Norman County Line Mahnomen 55 60 5403;4401 W MAHNOMEN CO LN/BEG D4 TO TH 59 BEG SL 40/MAHNMN 4.759
2016 4 MN 200 Mahnomen Roy Lake 55 55 4402 TH 59 BEG SL 55 TO SL 40 W SIDE ROY LAKE 18.62
33

Study Year
District
Hwy Route
Approximate Starting Point of 55-
mph Zone Study
Approximate End Point of 55-mph
Zone Study
Current Speed Limit
New Authorized Speed Limit
Control Section
Geographical Description of 55-mph Zone
Length (miles)
2016 2 MN 200 Roy Lake US 71 55 55 1504;1505 BEG SL 55 .5 MI E MAHN/CLWTR CL TO W JCT TH 71 24.632
2016 1 MN 200 Hill City MN 65 55 60 0106 .1 MI E CEDAR ST/HILL CITY TO .1 MI W MISS RVR BR 15.651
2016 1 MN 200 MN 65 US 2 55 60 0107 N JCT TH 65 TO TH 2 9.385
2016 2 MN 219 MN 1 Goodridge 55 60 5707 TH 1 TO SL 45 S SIDE GOODRIDGE 1.362
2016 2 MN 219 Goodridge MN 89 55 60 5707;4510 BEG SL 55 N SIDE GOODRIDGE TO TH 89 13.647
2016 2 MN 220 Climax US 2 55 60 6016 BEG SL 55 W SIDE CLIMAX TO E JCT TH 2 23.293
2016 2 MN 220 East Grand Forks Alvarado 55 60 6017;4511 BEG SL 55 1.1 MI N E GRD FRKS TO SL 30 S SD ALVRDO 16.286
2016 2 MN 220 Oslo MN 11 55 60 4512;3513 W JCT TH 1 TO TH 11 26.128
2016 2 MN 222 MN 92 Oklee 55 55 6306 TH 92 TO SL 30 .2 MI S 3RD AV/OKLEE 1.175
2016 2 MN 223 MN 92 Leonard 55 55 1508 TH 92 TO SL 30 .1 MI W 3RD AV/LEONARD 7.393
2016 4 MN 225 Becker County 26 MN 34 55 55 0309 BEG SL 55 E SIDE PONSFORD TO TH 34 8.439
2016 7 MN 253 Bricelyn Interstate 90 55 55 2210 BEG SL 55 .1 MI N 5TH ST/BRICELYN TO I 90 5.956
2016 7 MN 254 Frost Interstate 90 55 55 2211 BEG SL 55 .1 MI N 4TH ST/FROST TO I 90 4.532
2016 7 MN 257 Hanska MN 15 55 60 0808 BEG SL 55 .1 MI E BROADWAY ST TO TH 15 3.896
2016 7 MN 263 Ceylon Welcome 55 55 4609 BEG SL 55 .1 MI E GROVE ST/CEYLON TO CSAH 26/WELCOM 9.281
34

Study Year
District
Hwy Route
Approximate Starting Point of 55-
mph Zone Study
Approximate End Point of 55-mph
Zone Study
Current Speed Limit
New Authorized Speed Limit
Control Section
Geographical Description of 55-mph Zone
Length (miles)
2016 7 MN 263 Welcome Interstate 90 55 55 4609 BEG SL 55 .06 MI N CSAH 25 TO I 90 0.482
2016 7 MN 264 Round Lake Interstate 90 55 55 5310 BEG SL 55 .1 MI E ROHRER AV/ROUND LK TO I 90 7.04
2016 7 MN 270 Hills US 75 55 55 6706 BEG SL 55 .3 MI E CSAH 6HILLS TO TH 75 6.721
2016 2 MN 317 North Dakota Border MN 220 55 60 4513 ND/MN SL TO TH 220 1.444
2016 4 MN 329 US 59 University of Minnesota 55 55 7507 TH 59 TO END TH 329 U OF M EXPER
STA 1.112
Note: All speed limits within each control section are not listed in this chart. Other speed limits that may also be present include, but are not limited to, school speed zones and speed limits through urban areas.
35

Appendix F: 2015 Study Results
Study Year
District
Hwy Route
Approximate Starting Point of 55-
mph Zone Study
Approximate End Point of 55-mph
Zone Study
Current Speed Limit
New Authorized Speed Limit
Control Section
Geographical Description of 55-mph Zone
Length (miles)
2015 4 US 10 Begin 2-lane, west of Wadena Wadena 55 60 5605;8001 END 4LN 2.5 MI W WADENA TO SL 40 W
SIDE WADENA 2.9
2015 3 US 10 Wadena End 2-lane, east of Wadena 55 60 8001 BEG SL 55 .9 MI E TH 71 TO BEG DIV .5
MI E CR 108 1.787
2015 M US 10 US 61 Wisconsin 55 55 8205 BEG SL 55 .6 MI E TH 61 TO BEG SL 45 .4 MI W WI SL 2.095
2015 4 US 12 Ortonville Benson 55 60 0603;7603; 7604
BEG SL 55 .3 MI E TH 75 TO BEG SL 45 W SIDE BENSON 40.304
2015 4 US 12 Benson De Graff 55 60 7605 BEG SL 55 .2 MI E CSAH 25 TO SL 30 W SIDE DEGRAFF 6.128
2015 4 US 12 De Graff Murdock 55 60 7605 BEG SL 55 E SIDE DEGRAFF TO SL 30 W SIDE MURDOCK 3.915
2015 4 US 12 Murdock Kerkhoven 55 60 7605 BEG SL 55 E SIDE MURDOCK TO SL 30 W SIDE KERKHOVEN 3.655
2015 4 US 12 Kerkhoven Swift/Kandiyohi County Line 55 60 7605 BEG SL 55 E SIDE KERKHOVEN TO S
SWIFT CL/END D4 3.516
2015 8 US 12 Swift/Kandiyohi County Line Pennock 55 60 3403 BEG D8/W KANDIYOHI CL TO SL 45 NW
SIDE PENNOCK 3.445
2015 8 US 12 Pennock Willmar 55 60 3403 BEG SL 55 E SIDE PENNOCK TO SL 45 NW SIDE WILLMAR 5.173
2015 8 US 12 Willmar (US 71) Kandiyohi (CSAH 8) 55 60 3404 END 4LN SECT E WILMAR TO SL 45 .2 MI E W JCT CSAH 8 0.148
2015 8 US 12 Kandiyohi (CSAH 8) Atwater 55 60 3404 BEG SL 55 .1 MI E E JCT CSAH 8 TO SL 30 W SIDE ATWT 6.847
2015 8 US 12 Atwater Grove City (MN 4) 55 60 3404;4704 BEG SL 55 E SIDE ATWTR TO SL 30 .1 MI E W JCT TH 4 4.4
2015 8 US 12 Grove City (MN 4) Litchfield 55 60 4704 BEG SL 55 .1 MI W E JCT TH 4 TO SL 45 N SIDE LITCH 7.457
2015 8 US 12 Litchfield End 2-lane, east of Litchfield 55 60 4705 BEG SL 55 .1 MI E CSAH 34 TO BEG 4 LN
PASS SECTION 0.534
36

Study Year
District
Hwy Route
Approximate Starting Point of 55-
mph Zone Study
Approximate End Point of 55-mph
Zone Study
Current Speed Limit
New Authorized Speed Limit
Control Section
Geographical Description of 55-mph Zone
Length (miles)
2015 8 US 12 Begin 2-lane, west of Darwin Darwin (CSAH 14) 55 60 4705 END 4 LN PASS/E SD LITCH TO BEG SL
45 NW SD DARWN 2.544
2015 8 US 12 Darwin (CSAH 14) Dassel (MN 15) 55 60 4705 BEG SL 55 .1 MI E CSAH 14 TO SL 40 .1 MI W TH 15 4.179
2015 8 US 12 Dassel Meeker/Wright County Line 55 55 4705 BEG SL 55 E SIDE DASSEL TO MEEKER
CL/END D8 2.026
2015 3 US 12 Meeker/Wright County Line Cokato 55 55 8601 BEG D3 MEEKER-WRIGHT CN TO BEG
SL 35/W COKATO 2.687
2015 3 US 12 Cokato End 2-lane, east of Cokato 55 55 8601 BEG SL 55 .5 MI E COKATO TO 4 LN
PASS/E COKATO 1.03
2015 3 US 12 Begin 2-lane, west of Howard Lake Howard Lake 55 55 8601 END 4 LN PASS/E COKATO TO SL 30 W
SIDE HOWARD LAKE 2.143
2015 3 US 12 Howard Lake Waverly (CSAH 8) 55 55 8601 BG SL 55 .2 MI E CSAH 7 TO BEG SL 45 .3 MI W CSAH 8 3.788
2015 3 US 12 Waverly Montrose 55 55 8601 BEG SL 55 1.4 MI W CR 110 TO SL 45 .5 MI E CR 110 1.876
2015 3 US 12 Montrose MN 25 (East Junction) 55 55 8601 BEG SL 55 .2 MI E TH 25 TO BEG 4LN
PASS/E JCT TH 25 1.964
2015 3 US 12 Delano 55 55 8602 END 4 LN PASS/CSAH 14 TO BEG SL 50 .8 MI W CSAH 30 1.933
2015 3 US 12 Delano Maple Plain 55 55 2713 BEG SL 55 .2 MI W CL TO BEG SL 50 E LIM INDEPENDENC 4.8
2015 M US 12 Maple Plain Long Lake (Old Crystal Bay Rd) 55 55 2713 BEG SL 55 TO BEG SL 50 .3 W OF OLD
CRYSTAL BAY RD 2.362
2015 M US 12 I-494 I-394 55 55 2714 BEG SL 55 .2 MI W I 494 TO I 494 (156+01.014) 0.039
2015 2 US 71 MN 197 Begin 65-mph Zone 55 55 0410 BEG SL 55 N SIDE TO SL 65 .2 MI N BEMIDJI 0.664
2015 3 US 169 Onamia Garrison (MN 18) 55 55 1804 BEG SL 55 .6 MI S CSAH 35 TO SL 35 .3 MI S TH 18 8.296
37

Study Year
District
Hwy Route
Approximate Starting Point of 55-
mph Zone Study
Approximate End Point of 55-mph
Zone Study
Current Speed Limit
New Authorized Speed Limit
Control Section
Geographical Description of 55-mph Zone
Length (miles)
2015 3 US 169 Garrison (MN 18) Aitkin 55 55 1804;0115 BEG SL 55 .4 MI N TH 18 TO SL 45 S SIDE AITKIN 16.937
2015 M US 212 Norwood Young America
Begin 2-lane, east of Norwood Young
America55 60 1013 BEG SL 55 TO BEG 2 LN TACOMA AVE 0.405
2015 M US 212Begin 2-lane, east of Norwood Young
America
End 2-lane, east of Norwood Young
America55 60 1013 BEG 2 LN TO BEG 4LN 2.086
2015 M US 212End 2-lane, east of Norwood Young
America*** 55 60 1013 BEG 4LN TO BEG 2LN 1.677
2015 M US 212 *** End 2-lane, west of Cologne 55 55 1013 BEG 2LN TO BEG SL 50 IN DELANO 2.03
2015 M US 212 Begin 2-lane, east of Cologne
End 2-lane, west of Chaska 50 60 1013 BEG SL 50 IN DELANO 5.262
2015 M MN 3 Northfield Farmington 55 60 1920 BEG SL 55 .4 MI N CSAH 47 TO SL 45 S FARMINGTON 9.514
2015 M MN 3 Farmington Rosemount 55 60 1921 BEG SL 55 N FARMINGTON TO SL 45 S ROSEMOUNT 4.253
2015 M MN 3 Rosemount (Dodd Blvd) Eagan (Diffley Rd) 55 55 1921 BEG SL 55 .2 MI N DODD BLVD TO SL
45 S DIFFLEY RD 3.821
2015 4 MN 7 Beardsley (MN 28) CSAH 3 55 60 0609 TH 28 TO SL 50 .5 MI N CSAH 3 11.655
2015 M MN 7 Mayer (MN 25) St Bonifacius 55 60 1003;2704 END D8/BG MET SL 55 TH 25 TO BEG SL 45 W OF ST BONI 5.386
2015 M MN 7 St Bonifacius Chanhassen (Church Rd) 55 55 2704;1004;
2706BEG SL 55 ST BONI TO BEG SL 50,3LN
W OF CHURCH ST 6.121
2015 2 MN 11 North Dakota Donaldson 55 60 3511;3501 NORTH DAKOTA TO W SIDE DONALDSON 11.413
2015 2 MN 11 Donaldson Karlstad 55 60 3502 BEG SL 55 E SIDE DONALDSON TO SL 30 W SIDE KARLSTD 16.857
2015 2 MN 11 Karlstad Greenbush 55 60 3503;6801 BEG SL 55 E SIDE DONALDSON TO SL 30 W SIDE GRN BSH 17.698
38

Study Year District Hwy
RouteApproximate
Starting Point of 55-mph Zone Study
Approximate End Point of 55-mph
Zone Study
Current Speed Limit
New Authorized Speed Limit
Control Section
Geographical Description of 55-mph Zone
Length (miles)
2015 2 MN 11 Greenbush Badger 55 60 6802 BEG SL 55 E SIDE GREEN BUSH TO SL 50 S SIDE BADGER 9.437
2015 2 MN 11 Badger Roseau 55 60 6802 BEG SL 55 .3 MI E BADGER TO SL 45 .1 MI W ROSEAU 11.27
2015 2 MN 11 Roseau Warroad (MN 313) 55 60 6803 BEG SL 55 .1 MI E ROSEAU TO SL 40 .1 MI W TH 313 19.857
2015 2 MN 11 Warroad Williams (CSAH 2) 55 60 6804;3901 BEG SL 55 S SIDE ROSEAU TO SL 40 W SIDE WILLIAMS 18.724
2015 2 MN 11 Williams (CSAH 2) Baudette 55 60 3901 BEG 55 E SIDE WILLIAMS TO SL 40 .1 MI W BAUDETTE 15.639
2015 2 MN 11 Baudette CSAH 18 55 60 3901;3902 BEG SL 55 E SIDE BAUDETTE TO SL 45 .1 MI W CSAH 18 7.054
2015 2 MN 11 CSAH 18 CSAH 118 55 60 3902;3604 BEG SL 55 .2 MI E CSAH 18 TO SL 45 W CSAH 118 18.19
2015 2 MN 11 CSAH 118 CSAH 32 55 60 3604 BEG SL 55 .2 MI E CSAH 118 TO SL 30 1.2 MI E CR 82 20.289
2015 2 MN 11 CSAH 32 US 71 55 60 3604 BEG SL 55 1.7 MI E CR 82 TO W JCT TH 71/END D2 10.163
2015 1 MN 11 US 71 International Falls (CSAH 332) 55 60 3605 TH 71/PELHAND TO .1 MI W CR 91 6.631
2015 6 MN 13 I-90 New Richland 55 60 2401 BEG 2 LN .3 MI N I 90 TO SL 50 E NEW RICHLAND 14.795
2015 M MN 13 MN 19 CSAH 2 55 60 7001 BEG METRO JCT TH 19 TO BEG 2 LN .3 M S 263RD ST 1.465
2015 M MN 13 CSAH 2 Prior Lake (Five Hawks Ave) 55 55 7001 BEG 2 LN 263RD TO BEG SL 45,RSD
MED S PRIOR LAKE 11.989
2015 M MN 13 Savage (CSAH 42) Old MN 101 (US 169 ramps) 55 55 7001 BEG SL 55 CSAH 42 TO RAMP FROM
169 (OLD TH 101) 2.264
2015 M MN 13 Old MN 101 (US 169 ramps)
Savage (Yosemite Ave) 55 55 7001 RAMP FROM 169 TO BEG SL 45,RSD
MED YOSEMITE AVE 1.221
39

Study Year District Hwy
RouteApproximate
Starting Point of 55-mph Zone Study
Approximate End Point of 55-mph
Zone Study
Current Speed Limit
New Authorized Speed Limit
Control Section
Geographical Description of 55-mph Zone
Length (miles)
2015 M MN 13 Savage (Lynn Ave) Burnsville (Nicollet Ave) 55 55 7001;1901 BEG SL 55 LYNN AVE TO SL 50/R MED
N NICOLLET AV 2.886
2015 M MN 13 CSAH 30 (Diffley Rd) Silver Bell Rd 55 55 1901 BEG SL 55/DEPR MED TO SL 50 N SILVER BELL RD EAGAN 1.513
2015 M MN 13 CSAH 26 (Lone Oak Rd) Begin 4-lane (I-494) 55 55 1901 BEG SL 55 S LONE OAK RD TO 4 LN
DIV .2 MI S I-494 0.693
2015 M MN 13 Begin 4-lane (I-494) CSAH 31 (Pilot Knob Rd) 55 55 1901 BEG 4 LN DIV .2 MI S I-494 TO SL 40 N
PILOT KNOB RD 1.197
2015 3 MN 18 Brainerd (MN 25) Garrison (US 169) 55 55 1803 BEG SL 55 E SIDE BRAINERD TO SL 35 W SIDE GARRISON 17.246
2015 3 MN 18 US 169 MN 47 55 55 0102 BEG SL 55 E SIDE GARRISON TO N JCT TH 47 12.632
2015 1 MN 18 MN 47 Giese (CSAH 23) 55 60 4805;0103; 0114 TH 47 TO .1 MI W CSAH 23/GIESE 18.273
2015 1 MN 18 Giese (CSAH 23) Finlayson 55 60 0114;5808 .1 MI E CSAH 23/GIESE TO .1 MI E CSAH 35/FINLAYSON 10.16
2015 1 MN 18 Finlayson MN 23 55 60 5808 .1 MI E FRONT ST/FINLAYSON TO TH 23 3.83
2015 8 MN 22 Glencoe Biscay (CSAH 4) 55 60 4307 BEG SL 55 W SIDE GLENCOE TO SL 30 S SIDE BISCAY 6.643
2015 8 MN 22 Biscay (CSAH 4) Hutchinson 55 60 4307 BEG SL 55 NW OF BISCAY TO E JCT TH 7/E OF HUTCH 5.984
2015 8 MN 22 Cedar Mills (MN 7) Litchfield 55 60 4709 BEG SL 55 N TH 7 JCT TO SL 45 S SIDE LITCHFIELD 11.636
2015 8 MN 22 Litchfield (US 12) Eden Valley 55 60 4710 N JCT TH 12/LITCH TO SL 30 S SIDE EDEN VALLEY 11.458
2015 2 MN 32 Clay/Norman County Line Twin Valley 55 60 5404 CLAY/NORMAN CL/BEG D2 TO SL 30 S
SIDE TWIN VALLEY 7.183
2015 2 MN 32 Twin Valley (CSAH 27)
MN 200 (South Junction) 55 60 5404 BEG SL 55 .4 MI N TWIN VALLEY TO S
JCT TH 200 2.199
40

Study Year District Hwy
RouteApproximate
Starting Point of 55-mph Zone Study
Approximate End Point of 55-mph
Zone Study
Current Speed Limit
New Authorized Speed Limit
Control Section
Geographical Description of 55-mph Zone
Length (miles)
2015 2 MN 32 MN 200 (North Junction) Fertile 55 60 5405;6006 N JCT TH 200 TO SL 30 .4 MI S FERTILE 13.757
2015 2 MN 32 Fertile (MN 102) Red Lake Falls 55 60 6007;6301 BEG SL 55 .1 MI N TH 102 TO SL 30 S SIDE RED LK FL 22.435
2015 2 MN 32 Red Lake Falls St Hilaire 55 60 6301;5703 BEG SL 55 .3 MI RD LK FLS TO SL 30 S SIDE ST HLARE 8.866
2015 2 MN 32 St Hilaire Thief River Falls 55 60 5703 BEG SL 55 N HILAIRE TO SL 45 S THIEF RIVER FALLS 6.001
2015 2 MN 32 Thief River Falls Holt 55 60 5704;4503 BEG SL 55 N SIDE THF RVR FLS TO SL 50 S SIDE HOLT 10.86
2015 2 MN 32 Holt Middle River 55 60 4503;4504 BEG SL 55 N SIDE HOLT TO SL 45 S SIDE MIDDLE RIVER 9.459
2015 2 MN 32 Middle River Strathcona 55 60 4504;6805 BEG SL 55 .1 MI N MIDL RVR TO SL 40 S SD STRATHCNA 7.5
2015 2 MN 32 Strathcona Greenbush 55 60 6805 BEG SL 55 N SIDE STRTHCNA TO SL 40 S SIDE GRN BSH 9.665
2015 M MN 41 US 169 Chaska 55 55 7010 JCT TH 169 TO BEG SL 30 S CHASKA CL 1.49
2015 M MN 41 MN 5 MN 7 55 55 1008 BEG SL 55 TO TH 7,END TH 41 (9.362) 2.172
2015 M MN 47 Ramsey (156th Ln) Anoka/Isanti County Line 55 55 0206 BEG SL 55 156TH LN TO ISANTI CL BEG
D3 (36.585) 10
2015 3 MN 47 Anoka/Isanti County Line Bradford (CR 40) 55 60 3001 BEG SL 55 156TH LN TO ISANTI CL BEG
D3 (36.585) 10
2015 3 MN 47 Bradford (CR 40) Dalbo (CSAH 3) 55 60 3001;3002 BEG SL 55 N SIDE BRADFORD TO SL 30 S SIDE DALBO 10.207
2015 3 MN 47 Dalbo (CSAH 13) Ogilvie (TH 23) 55 60 3002;3303 BEG SL 55 N SIDE DALBO TO E JCT TH 23/OGILVIE 12.286
2015 3 MN 47 Ogilvie (TH 23) Isle (MN 27) 55 60 3304;4815 W JCT TH 23 TO SL 40 S SIDE ISLE 21.83
41

Study Year District Hwy
RouteApproximate
Starting Point of 55-mph Zone Study
Approximate End Point of 55-mph
Zone Study
Current Speed Limit
New Authorized Speed Limit
Control Section
Geographical Description of 55-mph Zone
Length (miles)
2015 3 MN 47 Isle Glen (CSAH 12) 55 55 4807;0108 BEG SL 55 N SIDE ISLE TO SL 50 .3 MI S CSAH 12 19.645
2015 3 MN 47 Glen (CSAH 12) Aitkin 55 55 0108 BEG SL 55 .2 MI N CSAH 12 TO SL 45 S SIDE AITKIN 14.157
2015 M MN 50 Farmington (MN 3) Hampton 55 55 1904 BEG SL 55 E CL FARMINGTON TO SL 30 N CL HAMPTON 6.925
2015 M MN 50 Hampton New Trier 55 55 1923 BEG SL 55 E CL HAMPTON TO SL 30 W CL NEW TRIER 2.658
2015 M MN 50 New Trier US 61 55 55 1923 BEG SL 55 E CL NEW TRIER TO TH 61 3.698
2015 3 MN 55 Buffalo Rockford 55 55 8607 BEG SL 55 E SIDE BUFFALO TO SL 45 W SIDE ROCKFORD 7.637
2015 M MN 55 Rockford Medina (Arrowhead Dr) 55 55 2722;2723 BEG SL 55 2LN CSAH 92 TO BEG 4LN
R-MED ARROWHEAD DR 7.456
2015 M MN 55 Begin 2-lane, east of US 52 Hastings 55 55 1910 BEG 2 LN .4 MI E TH 52 TO 4 LN .3 MI W
HASTINGS 6.68
2015 M MN 56 Goodhue/Dakota County Line Hampton (MN 50) 55 60 1911 END D6/BEG D9 GOODHUE/DAKOTA
CL TO TH 50 (98.789) 6.114
2015 6 MN 60 Waterville Faribault 55 60 4007;6606 BEG SL 55 .2 MI E WATERVL TO SL 45 W SIDE FARIBAULT 13.673
2015 6 MN 60 Faribault Kenyon 55 60 6607 BEG SL 55 E SIDE FARIBLT TO SL 45 W SIDE KENYON 0.02
2015 6 MN 60 Faribault Kenyon 55 60 6607;2511 BEG SL 55 E SIDE FARIBLT TO SL 30 W SIDE KENYON 12.388
2015 6 MN 60 Kenyon (MN 56) Zumbrota (US 52) 55 60 2511 BEG SL 55 E SIDE KENYON TO N JCT TH 52 15.32
2015 6 MN 60 US 52 Mazeppa 55 60 2512 S JCT TH 52 TO SL 30 GOODHUE/WABASHA CL 5.068
2015 6 MN 60 Mazeppa Zumbro Falls 55 60 7902 BEG SL 55 E SIDE MAZEPPA TO SL 30 W SIDE ZUMBRO FLS 0.186
42

Study Year District Hwy
RouteApproximate
Starting Point of 55-mph Zone Study
Approximate End Point of 55-mph
Zone Study
Current Speed Limit
New Authorized Speed Limit
Control Section
Geographical Description of 55-mph Zone
Length (miles)
2015 6 MN 60 Wabasha (bridge) Wisconsin 55 55 7911 BEG SL 55 S END BR TO MINN/WISC SL 0.233
2015 8 MN 68 South Dakota Canby (US 75) 55 55 8708 SO DAK/MINN STATE LN TO SL 40 NW OF CANBY 8.146
2015 8 MN 68 Canby (US 75) Porter 55 55 8709 BEG SL 55 SE SIDE CANBY TO SL 35 W SIDE PORTER 6.234
2015 8 MN 68 Porter Taunton (CSAH 1) 55 55 8709;4106;4210
BEG SL 55 S SIDE PORTER TO SL 35 W SIDE TAUNTON 5.235
2015 8 MN 68 Taunton (CSAH 1) Minneota 55 60 4210 BEG SL 55 S SIDE TAUNTON TO SL 30 NW SIDE MINNEOTA 4.02
2015 8 MN 68 Minneota Ghent 55 60 4210 BEG SL 55 SE SIDE MINN TO SL 35 W OF GHENT 4.762
2015 8 MN 68 Ghent Marshall (US 59) 55 60 4210 BEG SL 55 SE SIDE GHENT TO SL 40 NW SIDE MARSHALL 5.427
2015 8 MN 68 MN 19 Milroy 55 60 6407 E JCT TH 19/MARSHALL TO SL 30 N SIDE MILROY 2.453
2015 8 MN 68 Milroy Wabasso 55 60 6407 BEG SL 55 S SIDE MILROY TO SL 40 W SIDE WABASSO 15.469
2015 8 MN 68 Wabasso US 71 55 60 6407 BEG SL 55 .1 M E OF WABASSO TO S JCT TH 71 6.114
2015 8 MN 68 US 71 Morgan (MN 67) 55 55 6408 N JCT TH 71 TO SL 30 W SIDE MORGAN 9.659
2015 4 MN 79 Elbow Lake Erdahl (CSAH 10) 55 60 2613 BEG SL 55 E SIDE ELBOW LK TO SL 40 W SIDE ERDAHL 6.711
2015 4 MN 79 Erdahl (CR 54) I-94 55 60 2613;2109 BEG SL 55 E SIDE ERDAHL TO I 94 E RAMPS 4.347
2015 4 MN 87 Frazee Becker/Wadena County Line 55 60 0306 BEG SL 55 TO BECKER CO LN/END D4 26.346
2015 3 MN 87 Becker/Wadena County Line Menagha 55 60 8006 BECKER-WADENA CO LNBEG D3 TO
SL 45 W SIDE MENAGHA 2.339
43

Study Year District Hwy
RouteApproximate
Starting Point of 55-mph Zone Study
Approximate End Point of 55-mph
Zone Study
Current Speed Limit
New Authorized Speed Limit
Control Section
Geographical Description of 55-mph Zone
Length (miles)
2015 3 MN 87 Hubbard/Cass County Line Backus 55 55 1113 HUBB/CASS CO LN TO SL 30 W SIDE
BACKUS 11.222
2015 3 MN 87 Backus (MN 371) MN 84 55 55 1114 N JCT TH 371 TO TH 84 7.795
2015 M MN 97 I-35 US 61 55 55 8201 I 35 TO S JCT TH 61 (RP2.382) 2.36
2015 M MN 97 Forest Lake (8th St) Scandia (CSAH 3) 55 55 8212 BEG SL 55 GOODVIEW AV TO SL 50 W OAKHILL RD/SCANDIA 8.091
2015 M MN 97 Scandia (CSAH 3) MN 95 55 55 8212 BEG SL 55 .3 MI E OLINDA TR/SCANDIA TO TH 95 1.277
2015 4 MN 106 Deer Creek (MN 29) US 10 55 60 5622 BEG SL 55 N SIDE DEER CREEK TO TH 10 6.924
2015 4 MN 210 North Dakota US 75 55 55 8412 NO DAK/MINN SL TO N JCT TH 75 0.219
2015 4 MN 210 Breckenridge (US 75) Fergus Falls 55 60 8401;5601 S JCT TH 75 TO SL 45 4 LN DIV W SIDE FERGUS FALLS 22.068
2015 4 MN 210 I-94 Battle Lake (MN 78) 55 60 5602 E JCT I 94 TO .1 MI E TH 78/BATTLE LAKE 19.127
2015 4 MN 210 Battle Lake (MN 78) Vining 55 60 5603 .1 MI E TH 78/BATTLE LAKE TO SL 50 W SIDE VINING 8.637
2015 4 MN 210 Vining MN 29 55 60 5603;5604 BEG SL 55 E SIDE VINING TO .1 MI E TH 29 11.8
2015 4 MN 210 MN 29 Hewitt (US 71) 55 60 7701 .1 MI E TH 29 TO TH 71/HEWITT 10.831
2015 3 MN 210 Hewitt Staples 55 60 7701 BEG SL 55 E SIDE HEWITT TO SL 30 W SIDE STAPLES 14.969
2015 3 MN 210 Motley End 2-lane, Baxter 55 60 4909;1115;1805
BEG SL 55 E JCT TH 10 TO 4LN EXPWY W SIDE BAXTER 17.254
2015 3 MN 210 End 2-lane, Baxter MN 371 55 55 1805 BEG 4LN EXPWY W SIDE BAXTER TO SL 45 BAXTER 2.347
44

Study Year District Hwy
RouteApproximate
Starting Point of 55-mph Zone Study
Approximate End Point of 55-mph
Zone Study
Current Speed Limit
New Authorized Speed Limit
Control Section
Geographical Description of 55-mph Zone
Length (miles)
2015 3 MN 210 Begin 2-lane, east of Brainerd Ironton 55 60 1806 BEG SL 55 E OF BRAINERD TO SL 30 W
SIDE IRONTON 11.089
2015 3 MN 210 Crosby Deerwood 55 55 1807 BEG SL 55 E OF CROSBY TO SL 45 W OF DEERWOOD 2.898
2015 3 MN 210 Deerwood Aitkin 55 60 1807;0118 BEG SL 55 E SIDE DEERWOOD TO SL 45 W SIDE AITKIN 9.058
2015 3 MN 210 Aitkin McGregor (MN 65) 55 60 0119;0120 BG SL 55 E SIDE AITKIN TO SL 40 .2 MI W JCT TH 65 20.805
2015 1 MN 210 McGregor (MN 65) Tamarack (CSAH 6) 55 60 0121 .3 MI W E JCT TH 65/MCGRGR TO .2 MI W CSAH 6/TAMRCK 8.42
2015 1 MN 210 Tamarack (CSAH 6) Wright (CSAH 20) 55 60 0121;0914 .3 MI E CSAH 6/TAMARACK TO .1 MI W CSAH 20/WRIGHT 5.895
2015 1 MN 210 Wright (CSAH 23) Cromwell (MN 73) 55 60 0914 .04 MI E CSAH 23/WRIGHT TO .2 MI W TH 73/CROMWELL 5.349
2015 1 MN 210 Cromwell (MN 73) End 2-lane, west of I-35 55 60 0915 .3 MI E TH 73/CROMWELL TO .1 MI E T
343/COLOGNE RD 19.001
2015 8 MN 274 Woodlake MN 23 55 60 8714 BEG SL 55 N SIDE WOOD LAKE TO TH 23 8.345
2015 8 MN 277 MN 7 Gluek (CR 36) 55 60 1213 TH 7 TO SL 45 S SIDE GLUEK 2.31
2015 8 MN 277 Gluek (CR 36) MN 40 55 60 1213 BEG SL 55 N SIDE GLUEK TO TH 40 8.344
Note: All speed limits within each control section are not listed in this chart. Other speed limits that may also be present include, but are not limited to, school speed zones and speed limits through urban areas.
45

Appendix G: 2014 Study Results
Study Year
District
Hwy Route
Approximate Starting Point of 55-
mph Zone Study
Approximate End Point of 55-mph
Zone Study
Current Speed Limit
New Authorized Speed Limit
Control Section
Geographical Description of 55-mph Zone
Length (miles)
2014 8 US 212 Montevideo (MN 29) Granite Falls 55 55 1212;8712 BG SL 55 .3 MI E JCT TH 29 TO SL 45 W SIDE GR FLS 12.339
2014 8 US 212 Chippewa/Renville County Line Sacred Heart 55 60 6510 BEG SL 55 CHIP/RENVILLE CL TO SL 30
W OF SACRED HRT 5.119
2014 8 US 212 Sacred Heart Renville 55 60 6510 BEG SL 55 E OF SACRED HRT TO SL 45 W SIDE RENVILLE 5.772
2014 8 US 212 Renville Danube 55 60 6510 BEG SL 55 E SIDE RENVILLE TO SL 30 W SIDE DANUBE 4.573
2014 8 US 212 Danube Olivia (US 71) 55 60 6510 BG SL 55 E SIDE DANUBE TO SL 50 .2 MI E W JCT TH 71 3.264
2014 8 US 212 Olivia Bird Island 55 60 6511 BEG SL 55 E SIDE OLIVIA TO SL 30 W SIDE BIRD ISLAND 3.592
2014 8 US 212 Bird Island Hector (MN 4) 55 60 6511 BEG SL 55 E SIDE BD ISLE TO SL 45 W SIDE HECTOR 7.999
2014 8 US 212 Hector (MN 4) Buffalo Lake 55 60 6512 BEG SL 55 E SIDE HECTOR TO SL 50 W SIDE BUFFALO LK 3.596
2014 8 US 212 Buffalo Lake Stewart 55 60 6512;4309 BEG SL 55 E SIDE BUFF LK TO SL 50 W SIDE STEWART 6.155
2014 8 US 212 Stewart MN 22 55 60 4309;4310 BEG SL 55 E OF STEWART TO SL 65 W JCT TH 22 13.643
2014 8 MN 23 Begin 2-lane, east of New London
End 2-lane, west of Paynesville 55 60 3408 BEG SL 55 END DIV ROAD TO SL 65
PAYNESVILLE BYPASS 10.636
2014 3 MN 23 Paynesville Richmond 55 60 7305 BEG SL 55 E SIDE PAYNSVLLE TO SL 50 W SIDE RICHMOND 8.771
2014 3 MN 23 Foley Foreston 55 60 0504;4801 BEG SL 55 E SIDE FOLEY TO SL 50 W SIDE FORESTON 10.055
46

Study Year
District
Hwy Route
Approximate Starting Point of 55-
mph Zone Study
Approximate End Point of 55-mph
Zone Study
Current Speed Limit
New Authorized Speed Limit
Control Section
Geographical Description of 55-mph Zone
Length (miles)
2014 3 MN 23 Foreston Milaca 55 60 4801 BG SL 55 E SIDE FORESTON TO BEG SL 45 W SIDE MILACA 2.355
2014 3 MN 23 Milaca Ogilvie 55 60 4802;3301 BG SL 55 E SIDE MILACA TO SL 40 W JCT TH 47 OGILVIE 10.586
2014 3 MN 23 Ogilvie Mora (MN 65) 55 60 3301 BEG SL 55 E SIDE OGILVIE TO S JCT TH 65 SW OF MORA 5.900
2014 3 MN 23 Mora Quamba 55 60 3302;5801 BEG SL 55 W SIDE MORA TO BEG SL 50 W SIDE QUAMBA 5.207
2014 3 MN 23 Quamba Quamba 55 60 3302;5801 BEG SL 50 W SIDE TO BEG SL 55 E SIDE QUAMBA 0.270
2014 3 MN 23 Quamba MN 107 55 60 3302;5801 BEG SL 55 E SIDE QUAMBA TO TH 107/END D3 4.274
2014 1 MN 23 MN 107 Brook Park 55 60 5801 TH 105 TO .2 MI W CSAH 13/BROOK PARK 0.811
2014 1 MN 23 Brook Park Brook Park 55 60 5801 .2 MI W CSAH 13 TO .1 MI E CSAH 63/BROOK PARK 0.630
2014 1 MN 23 Brook Park I-35 55 60 5801 .1 MI E CSAH 63/BRK PK TO S JCT I-35 5.687
2014 4 MN 32 MN 34 Rollag (T383) 55 60 1402 TH 34 TO SL 30 S SIDE ROLLAG 5.430
2014 4 MN 32 Rollag (T383) Hitterdal 55 60 1402;1403 BEG SL 55 N SIDE ROLLAG TO SL 30 S SIDE HITTERDAL 16.325
2014 4 MN 32 Hitterdal Ulen 55 60 1403 BEG SL 55 N SIDE HITTERDAL TO SL 30 S SIDE ULEN 6.585
2014 4 MN 32 Ulen Clay/Norman County Line 55 60 1403 BEG SL 55 N SIDE ULEN TO CLAY CO
LN/END D4 4.661
2014 4 MN 54 MN 27 Elbow Lake (MN 55) 55 60 2607 TH 27 TO TH 55/ELBOW LAKE 10.851
2014 4 MN 55 North Dakota Nashua 55 60 8404;8405 SNO DAK/MINN SL TO SL 45 W SIDE NASHUA 12.405
47

Study Year
District
Hwy Route
Approximate Starting Point of 55-
mph Zone Study
Approximate End Point of 55-mph
Zone Study
Current Speed Limit
New Authorized Speed Limit
Control Section
Geographical Description of 55-mph Zone
Length (miles)
2014 4 MN 55 Nashua Wendell 55 60 8405;2608 BEG SL 55 E SIDE NASHUA TO SL 30 S SIDE WENDELL 9.819
2014 4 MN 55 Wendell US 59 (North Junction) 55 60 2608 BEG SL 55 N SIDE WENDELL TO N JCT
TH 59 4.672
2014 4 MN 55 Barret (US 59) Hoffman 55 60 2609 BEG SL 55 S SIDE BARRETT TO SL 40 N SIDE HOFFMAN 6.696
2014 4 MN 55 Hoffman Kensington 55 60 2609;2107 BEG SL 55 S SIDE HOFFMAN TO SL 30 N SIDE KENSINGT 5.686
2014 4 MN 55 Kensington Farwell 55 60 2107;6107 BEG SL 55 S SIDE KENSNGTN TO SL 45 N SIDE FARWELL 3.862
2014 4 MN 55 Farwell Lowry (MN 114) 55 60 6107 BEG SL 55 S SIDE FARWELL TO SL 30 W SIDE LOWRY 5.449
2014 4 MN 55 Lowry (MN 114) Glenwood (CSAH 50) 55 60 6107;6108 BEG SL 55 E SIDE LOWRY TO SL 50 .9 MI E TH 29 7.507
2014 4 MN 55 Glenwood Pope/Stearns County Line 55 60 6108 BEG SL 55 .4 MI S TH 28 TO POPE CO
LN/END D4 15.042
2014 3 MN 55 Pope/Stearns County Line Brooten 55 60 7312 STEARNS CO LN/BEG D3 TO SL 30 W
SIDE BROOTEN 0.171
2014 3 MN 55 Brooten Belgrade (US 71) 55 60 7312 BG SL 55 E SIDE BROOTN TO SL 30 W SIDE BELGRADE 6.070
2014 3 MN 55 Belgrade (US 71) Paynesville 55 60 7313;3410; 7314
BEG SL 55 .2 MI E EJCT TH 71 TO SL 35 W OF PAYNSVL 13.551
2014 3 MN 55 Paynesville Eden Valley 55 60 7314;4712 BEG SL 55 E OF PAYNSVL TO SL 30 W SIDE EDEN VALLEY 8.956
2014 3 MN 55 Eden Valley Watkins 55 60 4713 BEG SL 55 E SIDE EDEN VALLY TO SL 50 W SIDE WATKINS 6.199
2014 3 MN 55 Watkins Kimball 55 60 4713;7315 BEG SL 55 E SIDE WATKINS TO SL 40 W SIDE KIMBALL 5.184
2014 3 MN 55 Kimball South Haven 55 55 7316;8606 BEG SL 55 E KIMBALL TO SL 30 W SOUTH HAVEN 3.697
48

Study Year
District
Hwy Route
Approximate Starting Point of 55-
mph Zone Study
Approximate End Point of 55-mph
Zone Study
Current Speed Limit
New Authorized Speed Limit
Control Section Geographical Description of 55-mph Zone Length
(miles)
2014 3 MN 55 South Haven Annandale 55 55 8606 BEG SL 55 E SOUTH HAVEN TO SL 30 W SIDE ANNANDALE 4.470
2014 3 MN 55 Annandale Maple Lake 55 55 8606 BEG SL 55 E SIDE ANNANDL TO SL 45 W SIDE MAPLE LAKE 4.596
2014 3 MN 55 Maple Lake Buffalo 55 55 8606 BEG SL 55 E SIDE MAPLE LAKE TO SL 45 W SIDE BUFFALO 6.230
2014 3 MN 84 Pine River (MN 371) Longville 55 55 1110;1111 BEG SL 55 N OF PINE RVR TO SL 30 S SIDE LONGVILLE 22.967
2014 3 MN 84 Longville MN 200 55 55 1111 BEG SL 55 N SIDE LONGVILLE TO TH 200 4.158
2014 3 MN 237 New Munich (CSAH 30) I-94 55 60 7322 BG SL 55 E OF NEW MUNICH TO SL 40 .2
MI S I 94 1.427
2014 3 MN 237 40 mph Section, south of I-94 I-94 55 60 7322 BG SL 40 .2 MI S I 94 TO I 94 N RAMPS 0.319
Note: All speed limits within each control section are not listed in this chart. Other speed limits that may also be present include, but are not limited to, school speed zones and speed limits through urban areas.
49

Appendix H: Map of Speed Limit Study Progress
50