Embed Size (px)
Citation preview

2013 H I G H E R S C H O O L C E R T I F I C AT E
E X A M I N AT I O N
Earth and Environmental Science
General Instructions
• Reading time – 5 minutes
• Working time – 3 hours
• Write using black or blue pen Black pen is preferred
• Draw diagrams using pencil
• Boardapproved calculators may be used
• A Geological Time Scale is provided at the back of this paper
• Write your Centre Number and Student Number at the top of pages 13, 15, 17, 19, 21 and 25
Total marks – 100
Section I Pages 2–25
75 marks
This section has two parts, Part A and Part B
Part A – 20 marks
• Attempt Questions 1–20
• Allow about 35 minutes for this part
Part B – 55 marks
• Attempt Questions 21–30
• Allow about 1 hour and 40 minutes for this part
Section II Pages 27–36
25 marks
• Attempt ONE question from Questions 31–34
• Allow about 45 minutes for this section
2220
– 2 –
Section I 75 marks
Part A – 20 marks Attempt Questions 1–20 Allow about 35 minutes for this part
Use the multiplechoice answer sheet for Questions 1–20.
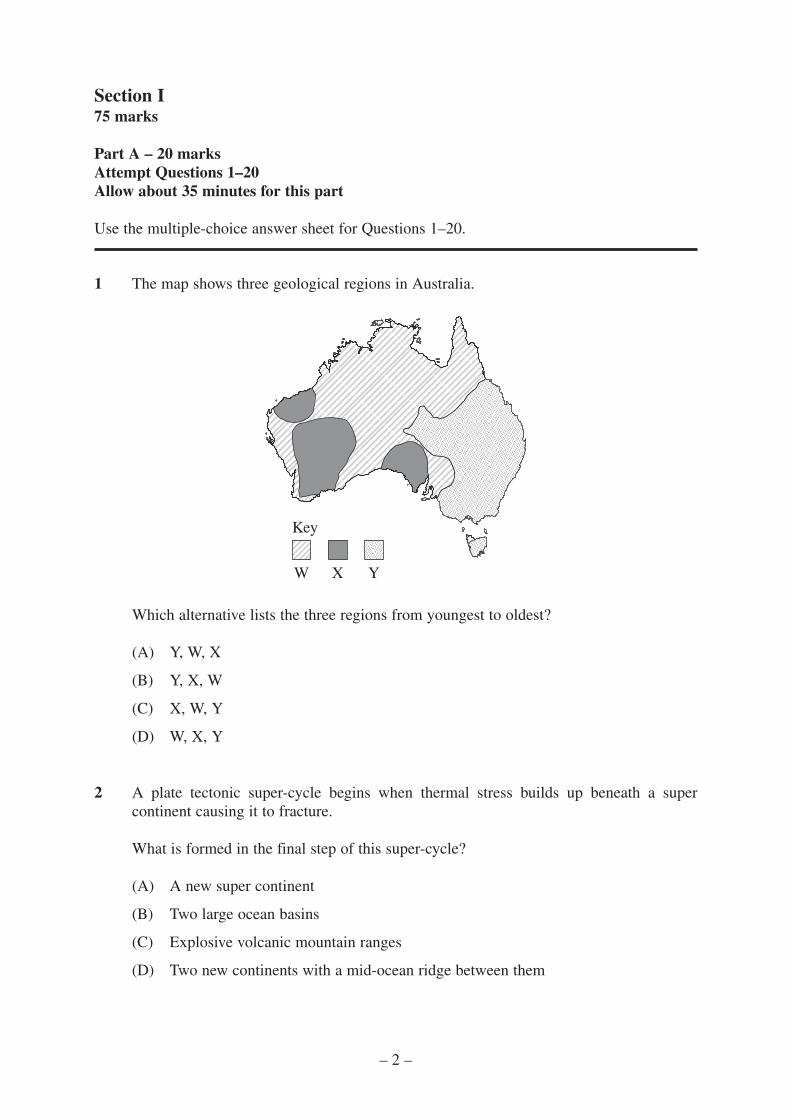
1 The map shows three geological regions in Australia.
Key
W X Y
Which alternative lists the three regions from youngest to oldest?
(A) Y, W, X
(B) Y, X, W
(C) X, W, Y
(D) W, X, Y
2 A plate tectonic supercycle begins when thermal stress builds up beneath a super continent causing it to fracture.
What is formed in the final step of this supercycle?
(A) A new super continent
(B) Two large ocean basins
(C) Explosive volcanic mountain ranges
(D) Two new continents with a midocean ridge between them

– 3 –
Refer to the map below to answer Questions 3–4.
ZZ
MM
OO
NN
LL
XX
YY
WW
3 The map shows the locations of four earthquakes L, M, N and O that occurred late in 2012.
Which earthquake was NOT on a plate boundary?
(A) L
(B) M
(C) N
(D) O
4 The map also shows the location of four volcanic regions W, X, Y and Z.
At which location would andesitic lava be found?
(A) W
(B) X
(C) Y
(D) Z

5 Which row of the table contains features characteristic of a collision between two continents?
(A)
(B)
(C)
(D)
Volcanic activity Depth of earthquake focus Type of fault
Explosive Shallow to deep Thrust
Explosive Shallow Normal
None Shallow Thrust
None Deep to shallow Normal
– 4 –
6 A sequence of rocks contains gently folded fossiliferous limestone alternating with layers of volcanic ash.
What was the tectonic setting at the time these rocks were deposited?
(A) Two oceanic plates colliding
(B) Two oceanic plates diverging
(C) Two continental plates colliding
(D) Two continental plates diverging
7 The image shows the 150 millionyearold fossil, Archaeopteryx.
Archaeopteryx is evidence that
(A) birds evolved into reptiles.
(B) the first vertebrates had feathers.
(C) only animals with hard body parts form fossils.
(D) present day organisms have developed from past life forms.
8 Which combination of structures, in addition to support tissue, was essential for terrestrial plants to evolve from simple aquatic plants?
(A) Roots, leaves and spores
(B) Stomates, spores and leaves
(C) Transport tissue, seeds and flowers
(D) Transport tissue, stomates and seeds
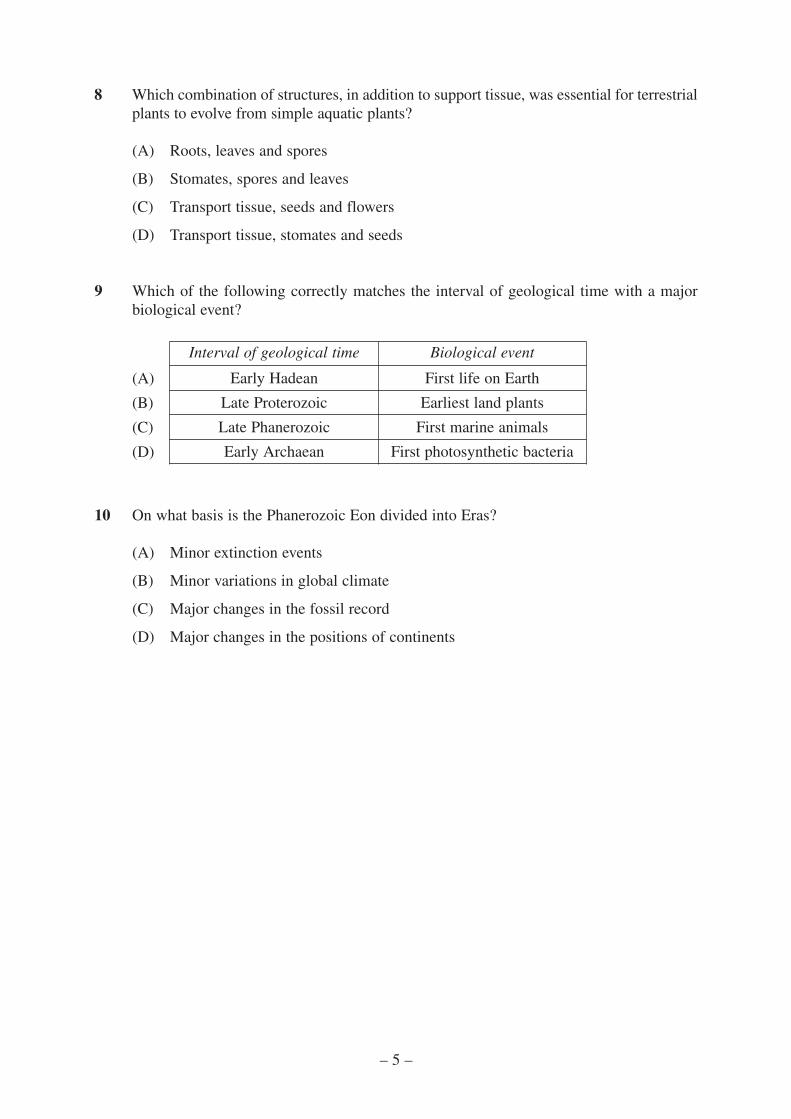
9 Which of the following correctly matches the interval of geological time with a major biological event?
(A)
(B)
(C)
(D)
Interval of geological time Biological event
Early Hadean First life on Earth
Late Proterozoic Earliest land plants
Late Phanerozoic First marine animals
Early Archaean First photosynthetic bacteria
– 5 –
10 On what basis is the Phanerozoic Eon divided into Eras?
(A) Minor extinction events
(B) Minor variations in global climate
(C) Major changes in the fossil record
(D) Major changes in the positions of continents

11 The flow chart shows a sequence of events that occurred during Earth’s history.
Early anoxic atmosphere
Anaerobic prokaryotes
W
X
Y
Z
The ozone layer formed
Which alternative correctly matches the events in the table with the letters W, X, Y and Zin the flow chart?
(A)
(B)
(C)
(D)
Banded IronFormationsdeposited
Cyanobacteriaevolved
Atmospheric oxygenconcentrationincreased
Oceanic oxygenconcentrationincreased
W Z Y X
X Y Z W
Y W Z X
Z W Y X
– 6 –

12 The diagram shows the times during which four species of organisms lived.
Fossil 1 2 3 4
Cambrian
Ordovician
Silurian
Devonian
Carboniferous
Permian
Triassic
Jurassic
Cretaceous
TIME INTERVALS
NOT TO SCALE
Which combination of fossils would indicate that a rock was deposited ONLY in theDevonian Period?
(A) 1, 2
(B) 1, 4
(C) 2, 3
(D) 3, 4
13 Which of the following statements is correct?
(A) Fossil stromatolites are found throughout Australia.
(B) Banded Iron Formations are evidence of the first plant life on land.
(C) Metazoan fossils dating back to the Proterozoic Eon have been found in SouthAustralia.
(D) The oldest rocks on Earth containing fossilised prokaryotic cells have been foundin 3.8 billion-year-old cratons in Australia.
– 7 –
14 What is the main effect of the impact of a raindrop on loose soil in a ploughed paddock?
(A) Compaction of soil
(B) Decrease in permeability
(C) Increase in soil particle size
(D) Displacement of surface particles
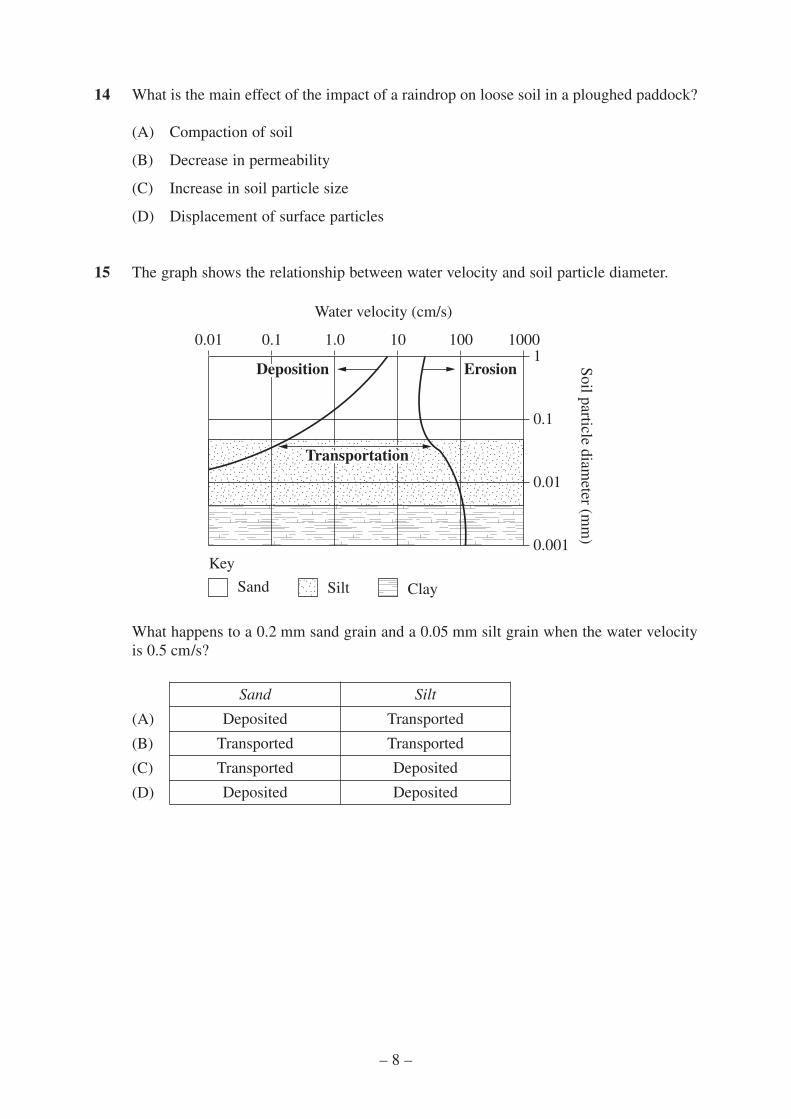
15 The graph shows the relationship between water velocity and soil particle diameter.
0.01 0.1 1.0 10 100 1000
Soil particle diameter (m
m)
1
0.1
0.01
0.001Key
Sand Silt Clay
TransportationTransportation
Water velocity (cm/s)
DepositionDeposition ErosionErosion
What happens to a 0.2 mm sand grain and a 0.05 mm silt grain when the water velocityis 0.5 cm/s?
(A)
(B)
(C)
(D)
Sand Silt
Deposited Transported
Transported Transported
Transported Deposited
Deposited Deposited
– 8 –

16 In which of the following do the chemicals react with each other to form a greenhousegas?
(A) Hydrocarbons and oxygen
(B) Sulfur trioxide and water
(C) Nitrous oxides and water
(D) Iron and water
17 Which sequence of reactions reduces the amount of ozone in the stratosphere?
(A)
Chlorine monoxide reacts withoxygen atoms to producechlorine atoms and oxygen gas
Ultraviolet radiation produceschlorine atoms fromchlorofluorocarbons
Chlorine atoms react withozone to produce chlorinemonoxide and oxygen gas
Chlorine monoxide reacts withoxygen atoms to producechlorine atoms and oxygen gas
Chlorine atoms react withozone to produce chlorinemonoxide and oxygen gas
Ultraviolet radiation produceschlorine atoms fromchlorofluorocarbons
(B)
Ultraviolet radiation produceschlorine atoms fromchlorofluorocarbons
Chlorine monoxide reacts withoxygen atoms to producechlorine atoms and oxygen gas
Chlorine atoms react withozone to produce chlorinemonoxide and oxygen gas
(D)
Chlorine atoms react withozone to produce chlorinemonoxide and oxygen gas
Chlorine monoxide reacts withoxygen atoms to producechlorine atoms and oxygen gas
Ultraviolet radiation produceschlorine atoms fromchlorofluorocarbons
(C)
– 9 –

18 Which of the following lists consists ONLY of gases found in the exhaust emissions ofvehicles?
(A) Sulfur dioxide, carbon monoxide, methane
(B) Nitrogen dioxide, carbon monoxide, water
(C) Sulfur dioxide, nitrogen dioxide, oxygen
(D) Methane, oxygen, water
19 A model for some of the energy entering and leaving Earth’s atmosphere in 2013 isshown. All components of the balanced energy budget are NOT shown.
Bac
k ra
diat
ion
from
atm
osph
ere
Sunlight
350units
70units
330units
Absorption by atmosphere
AtmosphereAtmosphereAtmosphere
NOT TO SCALE
Reflection from surface
30 units
Earth’s crustEarth’s crust
Which set of energy values would result in a reduction in global warming by 2050?
Sun’s radiation(units)
Surfacereflection(units)
Atmosphericabsorption(units)
Back radiation(units)
>350 >30 <70 >330
350 30 <70 <330
<350 30 >70 <330
350 <30 >70 >330
(A)
(B)
(C)
(D)
– 10 –

20 The diagram shows the present day continents that made up Gondwana before it brokeup, and the distribution of fossils found on those continents.
Africa
GlossopterisLystrosaurusCynognathusMesosaurus
GlossopterisCynognathusMesosaurus
GlossopterisLystrosaurus
GlossopterisLystrosaurus
Glossopteris
India
AntarcticaAustraliaSouth America
– 11 –
Which of the following statements is supported by the information in the diagram?
(A) Glossopteris evolved after the break up of Gondwana but before the separation ofSouth America from Africa.
(B) Mesosaurus evolved after the separation of South America from Africa but beforethe separation of Africa from Antarctica.
(C) Lystrosaurus evolved before the separation of South America from Africa andbefore the separation of India from Australia.
(D) Cynognathus evolved before the separation of South America from Africa but afterthe separation of Africa and South America from the other continents.
BLANK PAGE
© Board of Studies NSW 2013
– 12 –

2013 HIGHER SCHOOL CERTIFICATE EXAMINATION
Earth and Environmental Science
Section I (continued)Centre Number
Student NumberPart B – 55 marksAttempt Questions 21–30Allow about 1 hour and 40 minutes for this part
Answer the questions in the spaces provided. These spaces provide guidance for the expectedlength of response.
Question 21 (7 marks)
(a) A new volcanic island has formed in the South Atlantic Ocean, midway betweenSouth America and Africa.
Name an igneous rock you would find on this island and describe the characterof the volcanic eruption in which this rock was formed.
...............................................................................................................................
...............................................................................................................................
...............................................................................................................................
...............................................................................................................................
...............................................................................................................................
...............................................................................................................................
3
(b) In 1815, the Indonesian volcano Mt Tambora erupted. In 1816, Western Europeand North America experienced unusually cold weather.
Explain how the Mt Tambora eruption could have cooled Western Europe andNorth America in 1816.
...............................................................................................................................
...............................................................................................................................
...............................................................................................................................
...............................................................................................................................
...............................................................................................................................
...............................................................................................................................
...............................................................................................................................
...............................................................................................................................
4
– 13 –2221

BLANK PAGE
– 14 –
© Board of Studies NSW 2013
2013 HIGHER SCHOOL CERTIFICATE EXAMINATION
Earth and Environmental Science
Section I – Part B (continued)Centre Number
Student Number
Question 22 (4 marks)
Describe how heat flow and gravity influence crustal movement at plate boundaries.
.........................................................................................................................................
.........................................................................................................................................
.........................................................................................................................................
.........................................................................................................................................
.........................................................................................................................................
.........................................................................................................................................
.........................................................................................................................................
.........................................................................................................................................
4
– 15 –2222

Question 23 (5 marks)
The map shows the tectonic environment of New Zealand.
Australian Plate
Pacific Plate
Alpine FaultAlpine Fault
0 200 km
North Island
KeyFaultPlate boundary
South Island
(a) Name a geological hazard in the North Island of New Zealand and describe itsorigin.
...............................................................................................................................
...............................................................................................................................
...............................................................................................................................
...............................................................................................................................
2
(b) How might the effect of the geological hazard in part (a) be minimised when itoccurs in the future?
...............................................................................................................................
...............................................................................................................................
...............................................................................................................................
...............................................................................................................................
...............................................................................................................................
...............................................................................................................................
3
– 16 –
© Board of Studies NSW 2013

2013 HIGHER SCHOOL CERTIFICATE EXAMINATION
Earth and Environmental Science
Section I – Part B (continued)Centre Number
Student Number
Question 24 (4 marks)
The graphs represent two different models of how life evolved on Earth.
Graph A
Evo
lutio
n
Time
Graph B
Evo
lutio
n
Time
Explain how each model illustrates the process of evolution.
.........................................................................................................................................
.........................................................................................................................................
.........................................................................................................................................
.........................................................................................................................................
.........................................................................................................................................
.........................................................................................................................................
.........................................................................................................................................
.........................................................................................................................................
4
– 17 –2223

Question 25 (6 marks)
Name ONE mass extinction event and ONE smaller extinction event and complete thetable making comparisons between the two events.
6
Mass extinction event Smaller extinction event
Name: Name:
Comparison 1
Comparison 2
Comparison 3
– 18 –
© Board of Studies NSW 2013

2013 HIGHER SCHOOL CERTIFICATE EXAMINATION
Earth and Environmental Science
Section I – Part B (continued)Centre Number
Student Number
Question 26 (6 marks)
Please turn over
– 19 –2224
Question 26 (6 marks)
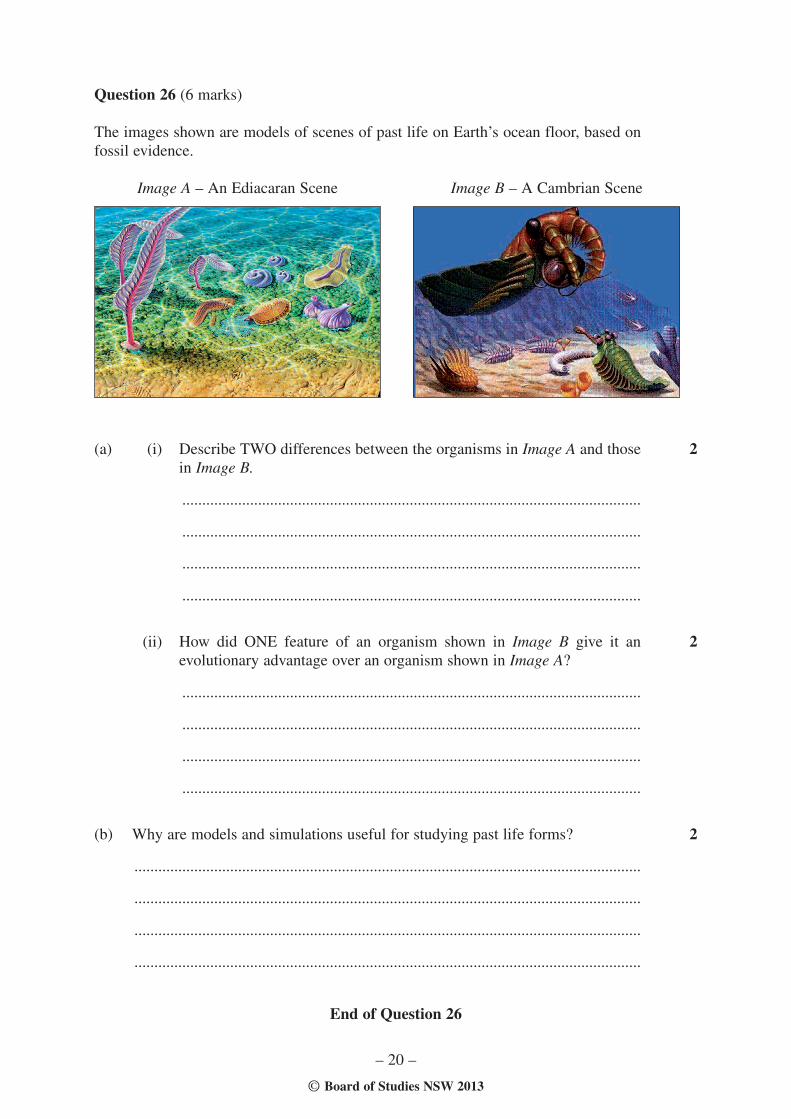
The images shown are models of scenes of past life on Earth’s ocean floor, based onfossil evidence.
Image A – An Ediacaran Scene Image B – A Cambrian Scene
(a) (i) Describe TWO differences between the organisms in Image A and thosein Image B.
...................................................................................................................
...................................................................................................................
...................................................................................................................
...................................................................................................................
(ii) How did ONE feature of an organism shown in Image B give it anevolutionary advantage over an organism shown in Image A?
...................................................................................................................
...................................................................................................................
...................................................................................................................
...................................................................................................................
(b) Why are models and simulations useful for studying past life forms?
...............................................................................................................................
...............................................................................................................................
...............................................................................................................................
...............................................................................................................................
End of Question 26
2
2
2
– 20 –
© Board of Studies NSW 2013

2013 HIGHER SCHOOL CERTIFICATE EXAMINATION
Earth and Environmental Science
Section I – Part B (continued)Centre Number
Student Number
Question 27 (4 marks)
Assess the effectiveness of one pest control management strategy that does not requirethe use of pesticides.
.........................................................................................................................................
.........................................................................................................................................
.........................................................................................................................................
.........................................................................................................................................
.........................................................................................................................................
.........................................................................................................................................
.........................................................................................................................................
.........................................................................................................................................
.........................................................................................................................................
.........................................................................................................................................
4
– 21 –2225

Question 28 (5 marks)
When chemical X is added to contaminated mine waste, toxic metals are bound to thewaste particles and vegetation growth is promoted.
The results of a trial of chemical X are shown below in the diagram.
Mine wastewith seeds
Mine wastewith seeds and chemical X
Site 1 Site 2 Site 3
(a) Outline ONE reason why the results of this trial may NOT be valid.
...............................................................................................................................
...............................................................................................................................
1
(b) How could the use of chemical X reduce the problems associated withabandoned mine sites?
...............................................................................................................................
...............................................................................................................................
...............................................................................................................................
...............................................................................................................................
...............................................................................................................................
...............................................................................................................................
...............................................................................................................................
4
– 22 –
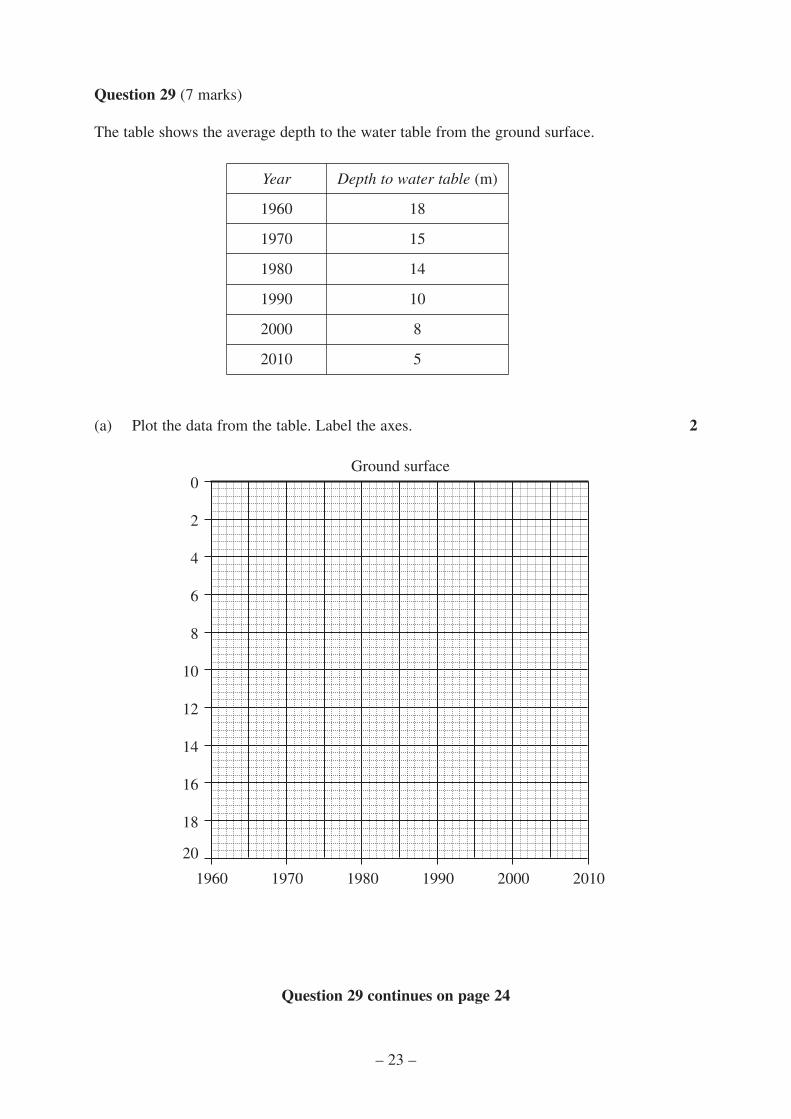
Question 29 (7 marks)
The table shows the average depth to the water table from the ground surface.
Year Depth to water table (m)
1960 18
1970 15
1980 14
1990 10
2000 8
2010 5
– 23 –
(a) Plot the data from the table. Label the axes. 2
20
1960
Ground surface
1970 1980 1990 2000 2010
18
16
14
12
10
8
6
4
2
0
Question 29 continues on page 24
Question 29 (continued)
(b) Account for the changes in the depth to the water table over time.
...............................................................................................................................
...............................................................................................................................
...............................................................................................................................
...............................................................................................................................
2
(c) Explain how a specific strategy could be used to reverse the changes in the depthto the water table.
...............................................................................................................................
...............................................................................................................................
...............................................................................................................................
...............................................................................................................................
...............................................................................................................................
...............................................................................................................................
3
End of Question 29
– 24 –
© Board of Studies NSW 2013

2013 HIGHER SCHOOL CERTIFICATE EXAMINATION
Earth and Environmental Science
Section I – Part B (continued)Centre Number
Student Number
Question 30 (7 marks)
Assess whether Australia’s resources and environments would be more sustainable ifthe concepts of earth and environmental science were more widely understood andapplied.
.........................................................................................................................................
.........................................................................................................................................
.........................................................................................................................................
.........................................................................................................................................
.........................................................................................................................................
.........................................................................................................................................
.........................................................................................................................................
.........................................................................................................................................
.........................................................................................................................................
.........................................................................................................................................
.........................................................................................................................................
.........................................................................................................................................
.........................................................................................................................................
.........................................................................................................................................
.........................................................................................................................................
.........................................................................................................................................
.........................................................................................................................................
.........................................................................................................................................
.........................................................................................................................................
........................................................................................................................................
7
– 25 –2226

BLANK PAGE
– 26 –
© Board of Studies NSW 2013

2013 HIGHER SCHOOL CERTIFICATE EXAMINATION
Earth and Environmental Science
Section II
25 marksAttempt ONE question from Questions 31–34Allow about 45 minutes for this section
Answer parts (a)–(c) of the question in Section II Answer Booklet 1.Answer parts (d)–(e) of the question in Section II Answer Booklet 2.Extra writing booklets are available.
Pages
Question 31 Introduced Species and the Australian Environment ........... 28–29
Question 32 Organic Geology – a Non-renewable Resource .................. 30–31
Question 33 Mining and the Australian Environment ..............................32–33
Question 34 Oceanography ...................................................................... 34–36
– 27 –2227

Question 31 — Introduced Species and the Australian Environment (25 marks)
Answer parts (a)–(c) in Section II Answer Booklet 1.
(a) (i) Define the term non-indigenous. 1
(ii) Give reasons why species have been introduced to Australia fromoverseas.
2
(b) Discuss a strategy being used to rehabilitate an ecosystem damaged by anintroduced species. In your answer, identify both the ecosystem and the species.
4
(c) The maps show the distributions of rabbits and prickly acacia in Australia.
Rabbits Prickly Acacia
KeyRare or absentScatteredAbundant
(i) Describe the distributions shown in the maps. 2
(ii) Explain the distribution of rabbits and prickly acacia in Australia. 4
Question 31 continues on page 29
– 28 –

Question 31 (continued)
Answer parts (d)–(e) in Section II Answer Booklet 2.
(d) Write a hypothesis and describe a method that could be used to conduct a validand reliable investigation of the effect of an introduced species on one abioticcomponent of an environment.
6
(e) Explain how major advances in scientific understanding and technology havebeen used to prevent the introduction of new species as well as to restrict thespread of those already introduced. Include examples in your answer.
6
End of Question 31
– 29 –

Question 32 — Organic Geology – a Non-renewable Resource (25 marks)
Answer parts (a)–(c) in Section II Answer Booklet 1.
(a) (i) Why are oil and natural gas regarded as non-renewable resources? 1
(ii) Outline differences in the environments in which oil and natural gas areformed.
2
(b) Compare the properties of structural petroleum traps and stratigraphicpetroleum traps.
4
(c) The graphs show the production and consumption of coal and oil in Australiafrom 1991–2010.
0
100
200
300
400
500
1991 20101995 1999 2003 2007
Production
Consumption
Year
Mill
ion
tonn
es o
f co
al
Coal
1991 1995 1999 2003 2007 2010Year
Tho
usan
d ba
rrel
s pe
r da
y of
oil
Production
Consumption
0
200
400
600
800
1000
1200Oil
(i) Describe the trends in each graph. 2
(ii) Explain the trends in each graph. 4
– 30 –
Question 32 continues on page 31

Question 32 (continued)
Answer parts (d)–(e) in Section II Answer Booklet 2.
(d) Write a hypothesis and describe a method that could be used to conduct a validand reliable investigation of the energy efficiency of a non-fossil fuel resource.
6
(e) Explain how major advances in scientific understanding and technology havebeen used to improve the effectiveness of fossil fuel exploration programs.Include examples in your answer.
6
End of Question 32
– 31 –

Question 33 — Mining and the Australian Environment (25 marks)
Answer parts (a)–(c) in Section II Answer Booklet 1.
(a) (i) What is an ore? 1
(ii) Outline reasons why a mining company has to produce anEnvironmental Impact Statement before mining commences.
2
(b) Give the main geological features of an Australian metal-producing locality inan island arc terrane.
4
(c) The graphs show the recovery rates when a sulfide ore containing 3% galena,10% sphalerite and 2 g/tonne gold is treated with two different flotationchemicals.
0
20
40
60
80
100
0.001 0.01 0.1 1
Grain size (mm)
Flotation Chemical 1
Goldx Galena
Sphalerite
Key
% m
iner
al r
ecov
ered
0
20
40
60
80
100
0.001 0.01 0.1 1Grain size (mm)
Flotation Chemical 2
(i) Describe the trends for galena and sphalerite in both graphs. 2
(ii) Describe a method that could be used to concentrate each of the threeore minerals in the sulfide ore.
4
Question 33 continues on page 33
– 32 –
Question 33 (continued)
Answer parts (d)–(e) in Section II Answer Booklet 2.
(d) Write a hypothesis and describe a method that could be used to conduct a validand reliable investigation to test for ore minerals in a rock using a geophysicalmethod.
6
(e) Explain how major advances in scientific understanding and technology havebeen used to improve the effectiveness of mineral exploration programs. Includeexamples in your answer.
6
End of Question 33
– 33 –

Question 34 — Oceanography (25 marks)
Answer parts (a)–(c) in Section II Answer Booklet 1.
(a) (i) Define the term ocean salinity. 1
(ii) Outline the origin of salinity in Earth’s oceans. 2
(b) Describe the evidence to support the theories that the ocean basins are youngerthan the continents and that the sea floor area has changed over time.
4
Question 34 continues on page 35
– 34 –

Question 34 (continued)
(c) The diagram shows five main layers or zones in an ocean and the graphs showthe changes in light intensity, salinity, temperature and oxygen concentrationwith increasing depth in that ocean.
10 000 m
11 000 m
9000 m
8000 m
7000 m
6000 m
5000 m
4000 m
3000 m3000 m
2000 m
200 m1000 m
Epipelagic ZoneMesopelagic Zone
Bathypelagic Zone
Continental Rise
Ocean Basin
Trench
Hadalpelagic Zone
NOT TO SCALE
Continental Slope
Abyssopelagic Zone
Continental Shelf
Figure 1
Figure 2
Salinity(ppt)
Temperature(°C)
Oxygen concentration(units x102)
Increasing lightintensity
35353434 1010 2020 1010 2020
10 000 m
8000 m
6000 m
4000 m
2000 m
0 m33 30300 30300
(i) Describe the trend in each of the graphs in Figure 2. 2
(ii) Explain how depth determines the nature of communities that live inTWO of the zones in Figure 1. In your answer, refer to specific types oforganisms found in each community.
4
– 35 –
Question 34 continues on page 36
Question 34 (continued)
Answer parts (d)–(e) in Section II Answer Booklet 2.
(d) Write a hypothesis and describe a method that could be used to conduct a validand reliable investigation to test the effect of the surface area to volume ratio ofsolids on their cooling rate in water.
6
(e) Explain how major advances in scientific understanding and technology havebeen used to increase our knowledge of the oceans. Include examples in youranswer.
6
End of paper
– 36 –

BLANK PAGE
– 37 –

– 38 –
Geological Time Scale
0
2
5
10
20
30
40
50
60
70
100
200
300
400
500
600
1000
2000
3000
4000 Hadean
Archaean
EON ERA
Oligocene
Eocene
Pliocene
Pleistocene
EPOCH
Quaternary
PERIOD
Tertiary
Cretaceous
Permian
Jurassic
Triassic
DevonianSilurian
Ordovician
Cambrian
Ediacaran
Carboniferous
Miocene
Palaeocene
Prot
eroz
oic
Phan
eroz
oic
Cen
ozoi
cPa
laeo
zoic
Mes
ozoi
c
Ma
BP
Holocene
© Board of Studies NSW 2013


![SIMAK UI - FOKUS BELAJAR – [Transformation Start from Here] · 2017-11-26 · GENERALINSTRUCTIONS 1.Before you begin work on the test, check the number of questions and the page](https://img.dokumen.tips/doc/110x75/5cf68a0388c993e14d8b7e11/simak-ui-fokus-belajar-transformation-start-from-here-2017-11-26.jpg)