Embed Size (px)
Citation preview

Full-Year Results 2013
18 February 2014
FULL-YEAR
RESULTS
18 February 2014

Full-Year Results 2013
18 February 2014
2013 KEY FIGURES (CONTINUING OPERATIONS)
2013 Change vs. 2012
Consolidated net sales €48,645m +15.9%
EBITDA €3,337m +17%
EBITDA margin 6.9% +6bp
Trading profit €2,363m +18.1%
Trading margin 4.9% +9bp
Net underlying profit, group share €618m +9.7%
Underlying diluted EPS €5.32 +7.6%
Cash flow* €1,956m +19.4%
Net financial debt €5,416m -€36m
Net financial debt/EBITDA 1.62x vs. 1.91x
2
* Excluding Mercialys

Full-Year Results 2013
18 February 2014
IN 2013 FINALISATION OF THE CONTROL OF MAJOR STRUCTURING ASSETS, FRENCH RECOVERY AND EXCELLENT RESULTS INTERNATIONALLY
After taking legal control, the Group took managerial control of two major structuring assets:
GPA in Brazil and Monoprix in France
French recovery
Géant hypermarkets and Casino supermarkets resumed positive traffic and volumes
Expansion of the discount store network with the takeover of some Franprix - Leader Price
master franchises and the acquisitions of Norma and Le Mutant stores
Very fast development in e-commerce, supported by the success of Cdiscount’s marketplace
Excellent results internationally
Good growth of activity and earnings in the three businesses operated
in Brazil - food, electronics and e-commerce - with sustained expansion
and market share gains
Sustained high margins in other subsidiaries
Market share gains thanks to dynamic expansion
Underlying net profit, Group share grew significantly to €618m (+9.7%)
3

Full-Year Results 2013
18 February 2014
HIGHLIGHTS
Results
2014 Perspectives & Conclusion
Appendices
Jean-Charles NAOURI Chairman and Chief Executive Officer
Full-Year Results 2013
18 February 2014
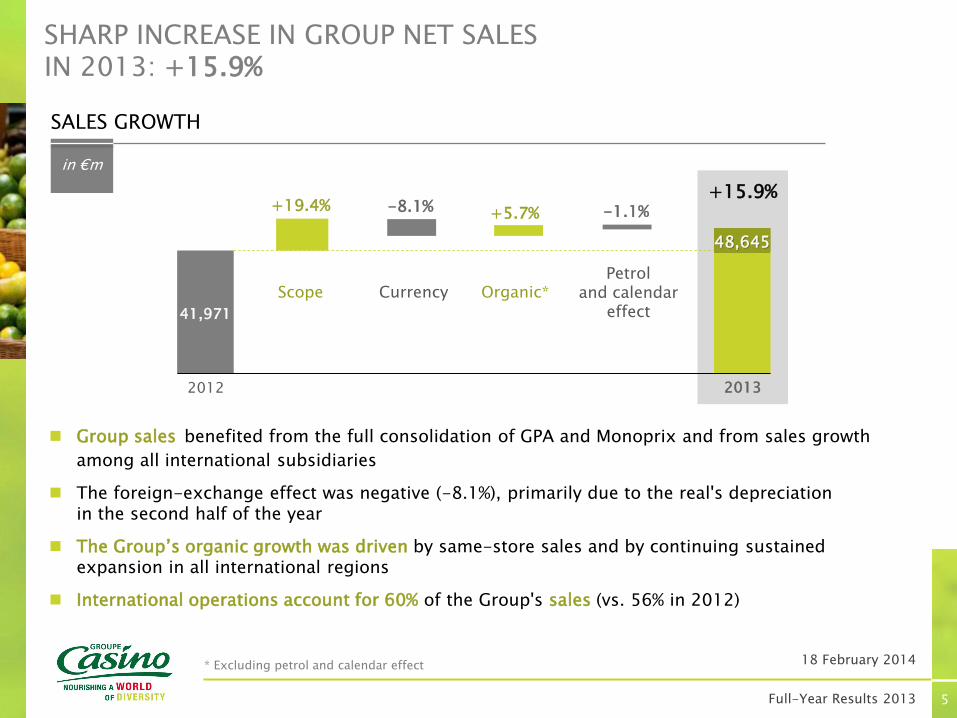
SHARP INCREASE IN GROUP NET SALES IN 2013: +15.9%
Group sales benefited from the full consolidation of GPA and Monoprix and from sales growth
among all international subsidiaries
The foreign-exchange effect was negative (-8.1%), primarily due to the real's depreciation in the second half of the year
The Group’s organic growth was driven by same-store sales and by continuing sustained expansion in all international regions
International operations account for 60% of the Group's sales (vs. 56% in 2012)
* Excluding petrol and calendar effect
5
SALES GROWTH
in €m
41,971
+5.7% +19.4% -8.1%
2012 2013
Organic* Scope Currency Petrol
and calendar effect
-1.1% +15.9%
48,645

Full-Year Results 2013
18 February 2014
GROWTH IN FRENCH ACTIVITY
In a backdrop of cost reductions initiated in Q4 2012, Géant hypermarkets and Casino Supermarkets sales improved sharply starting in the second half of the year, with both traffic and volumes rising from Q4
Monoprix performed well, growing compared to 2012, benefiting from continued expansion and resilient same-store sales
E-commerce grew again over the year (+16.1% in business volume at Cdiscount including the marketplace). Géant hypermarkets' and Cdiscount's cumulative non-food business volumes grew
6
-3.3%
2013
-3.6% -1.4% -3.4% -2.9%
Q1 Q2 Q3 Q4
ORGANIC SALES GROWTH* MONTHLY GROWTH IN SAME-STORE SALES* IN H2 2013
* Excluding petrol and calendar effect
2013
Q3: -3.3% Q4: -1.5%

Full-Year Results 2013
18 February 2014
INTERNATIONALLY, CONTINUED STRONG GROWTH IN 2013
A robust and sustained organic growth rate across all of the Group's international markets
Robust growth in reported sales: +23.9% after factoring in the effect of changes in scope (+27.2%, particularly in Brazil with the full consolidation of GPA in July 2012)
Latin America
Asia
2013 2012
*Excluding petrol and calendar effect
7
ORGANIC* SALES GROWTH IN INTERNATIONAL MARKETS
as a %
International operations
9.0% 9.4% 10.6%
11.9% 13.1%
7.5%

Full-Year Results 2013
18 February 2014
GÉANT RESUMED POSITIVE TRAFFIC AND STRONG GROWTH IN FOOD VOLUMES
For the entire year, reported business volume fell
due to significant price cuts: the new price positioning
is now very competitive
Strong sequential improvement in same-store food sales
(+0.8%* in 2013 vs. -7%* in Q4 2012) thanks to rising
traffic and volumes (+1.9% and +8.1% in Q4 2013
respectively)
Improvement in non-food performance
*Excluding calendar effect
4 weeks to 16 February 2014:
• Sales: +2.2%
• Client traffic: +4.1%
• Volumes: +7.8%
8
IN 2014
Objective of positive same-store sales growth

Full-Year Results 2013
18 February 2014
Client traffic and volumes turned positive during H2 2013 following price cuts
Continuation of action plans aimed at increasing the banner's appeal: quality of fresh products, variety in food offer and service in stores
IN 2014
Objective of positive same-store sales growth
RETURN TO GROWTH
9

Full-Year Results 2013
18 February 2014
Continued rapid expansion of new points of sale in high-traffic areas (train stations, airports, motorways, etc.)
New loyalty programme now rolled out to all integrated stores
Commercial revival in various integrated and franchises networks
IN 2014
Network of stores developed in a differentiated way according to the catchment areas around the Casino Shop and franchise banners (Vival and Spar)
ONGOING NETWORK DEVELOPMENT
Number of stores at end-2013:
7,314
(vs. 6,517 at end-2012)
including 77% as franchises
10
Full-Year Results 2013
18 February 2014
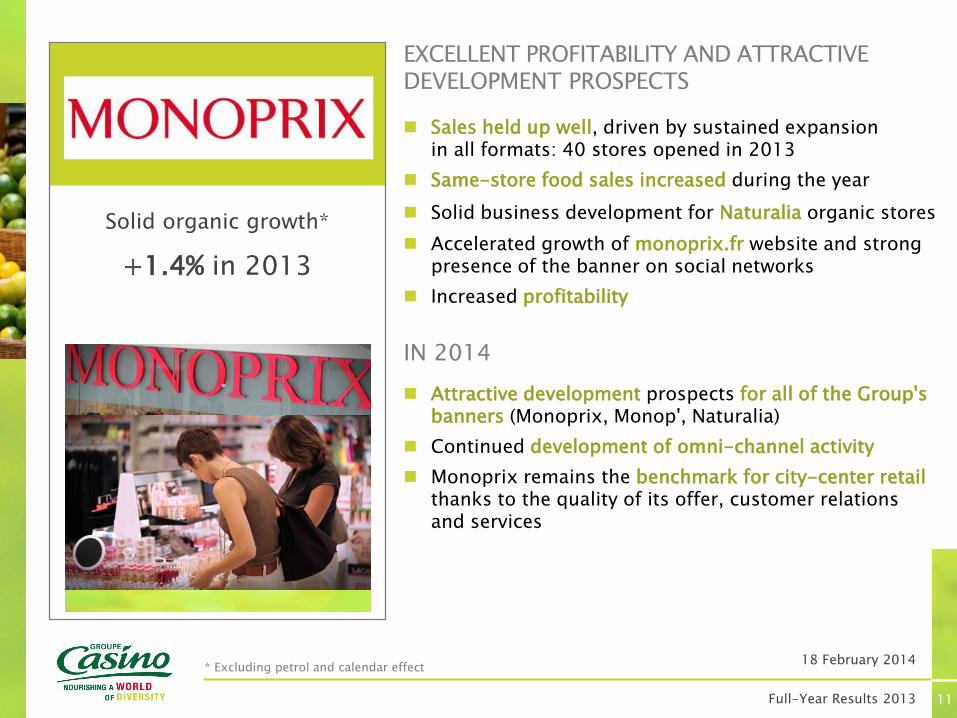
EXCELLENT PROFITABILITY AND ATTRACTIVE DEVELOPMENT PROSPECTS
Sales held up well, driven by sustained expansion in all formats: 40 stores opened in 2013
Same-store food sales increased during the year
Solid business development for Naturalia organic stores
Accelerated growth of monoprix.fr website and strong presence of the banner on social networks
Increased profitability
IN 2014
Attractive development prospects for all of the Group's banners (Monoprix, Monop', Naturalia)
Continued development of omni-channel activity
Monoprix remains the benchmark for city-center retail thanks to the quality of its offer, customer relations and services
Solid organic growth*
+1.4% in 2013
* Excluding petrol and calendar effect
11

Full-Year Results 2013
18 February 2014
Franprix
Loyalty card rolled out throughout the network Sales to loyalty cardholders account for more than 30% of the banner's total revenue
Continued expansion on various formats and store transformation to new concept
Leader Price
Significant price repositioning at the end of the year: the banner is now the least expensive on the market* both for private label and national brand products
Continued expansion notably with the consolidation of Norma stores in 2013 and Le Mutant in 2014
Growth in trading margin in organic terms
IN 2014
Continued expansion for both Leader Price and Franprix
CONFIRMATION OF THE FPLP MODEL'S ROBUSTNESS
12
Total sales:
+1.8% in 2013
* Independent panel

Full-Year Results 2013
18 February 2014
CONTINUATION OF STRONG GROWTH MOMENTUM
Robust growth of business volume (+16.1%) in 2013
Marketplace (which accounts for 16% of business volume at the end of 2013), with 5.5 million offers and more than 2,800 vendors, continued to develop rapidly
Sustained growth of the site's own revenue of +9.7%
Cdiscount relies on a retail network of more than 15,000 physical pick-up points in France
Launch of three new pure player sites early 2014 under the Cdiscount brand in Thailand, Vietnam and Colombia
IN 2014
With its highly differentiated concept, Cdiscount will continue to develop its traffic and sales and will increase the growth of its marketplace
13
* Number of items sold, including the marketplace
Volumes*
(4 weeks to 16 February 2014):
+21%

Full-Year Results 2013
18 February 2014
BRAZIL: EXCELLENT PERFORMANCE IN 2013
With GPA, Casino is the leading retailer in Brazil:
Nearly 2,000 multi-format points of sale (food and non-food: hypermarkets, supermarkets, convenience, cash & carry…)
GPA Food: growth of sales in all formats and more rapid expansion to win over new markets
Viavarejo: remarkable growth in profitability in an environment of strong business growth and successful IPO
Robust growth in new businesses:
Nova.com: very strong growth in online sales
Real estate developments
14

Full-Year Results 2013
18 February 2014
GPA FOOD: ACCELERATION IN ORGANIC GROWTH
Rapid GPA Food net same-store sales growth (+10.4%* in 2013), much faster than inflation
Excellent performance of Assaí cash & carry and Minimercado convenience formats, with faster expansion pace on both formats: 59 Minimercado Extra and 14 Assai opened during the year
Opening of 45,000 m2 in additional shopping centre space during the year
* Excluding petrol and calendar effect – as a reminder, GPA reports its sales including taxes and excluding calendar effect
Faster expansion pace in food, particularly for cash & carry and convenience
Strengthening of commercial real estate
IN 2014, CONTINUING EXPANSION OF BUOYANT FORMATS AND REAL ESTATE
2013 sales:
€11bn
Organic growth*:
+16.3%
GPA Food
15

Full-Year Results 2013
18 February 2014
NON–FOOD: STRONG GROWTH IN SALES AND IMPROVEMENT IN PROFITABILITY
Very sustained same-store sales growth (+10.1% in 2013)
Excellent performance from the Black Friday
Continued expansion with the opening of 34 stores
Significant improvement in operating profitability (EBITDA margin at 7.9% in 2013 vs. 6.4% in 2012) related to both same-store growth and costs reductions
Successful IPO of 28,75% of capital (including 9% sold by GPA)
Favourable environment related to the continuation of the programme supporting consumption and Brazil hosting football's World Cup (June-July 2014)
Continuation of plans to improve operating profitability
FAVOURABLE PROSPECTS IN 2014
Non-food GPA
*Excluding petrol and calendar effect
2013 sales:
€7.6bn
Organic growth*:
+12.4%
16

Full-Year Results 2013
18 February 2014
E-COMMERCE: EXCELLENT PERFORMANCE OF NOVA.COM ACTIVITIES
Very strong growth of e-commerce (+29.9%*) supported by:
Evolution of the pricing strategy and product categories
Improved services – particularly the rollout of free delivery
Development of the marketplace
In 2014, Nova.com is maintaining its strategy of robust growth
GPA e-commerce
* Excluding calendar effect
17
2013 sales:
€1.5bn
Organic growth*:
+29.9%

Full-Year Results 2013
18 February 2014
GPA HAS POSTED STEADY, REGULAR GROWTH IN ITS BUSINESS AND EARNINGS SINCE IT WAS ACQUIRED IN 1999
18
Data published by GPA since 1999 (in BRL millions)
SALES (in BRL millions)
EBITDA (in BRL millions)
0
1 000
2 000
3 000
4 000
5 000
6 000
0
10 000
20 000
30 000
40 000
50 000
60 000
1999 2000 2001 2002 2003 2004 2005 2006 2007 2008 2009 2010 2011 2012 2013
CA
EBITDA
Sales
EBITDA
60,000
50,000
40,000
30,000
20,000
10,000
0
6,000
5,000
4,000
3,000
2,000
1,000
0

Full-Year Results 2013
18 February 2014
2013 sales:
€4.2bn
Organic growth*:
+3.5%
GOOD PERFORMANCE BY ÉXITO THANKS TO ITS MULTI-BANNER STRATEGY
Organic growth sales of +3.5%*
Robust performance of sales initiatives in a slowing macroeconomic environment
Expansion focused on convenience and discount formats, which continued to gain market share: 276 affiliates ("Aliados") opened in 2013
Excellent performance in Uruguay
Ebitda margin slightly up (8.5%)
IN 2014, GROWTH OF RETAIL AND COMPLEMENTARY ACTIVITIES
Continued rapid growth of discount formats
Expansion of Surtimax format
Acquisition of 19 stores and contract to operate with an option to purchase 31 other stores, of the Super Inter banner, hence strengthening the Group's exposure to two key Colombian regions
Continued shopping centres development in partnership with local players
Acceleration in e-commerce through the launch of Cdiscount.com.co in addition to existing sites
* Excluding petrol and calendar effect
19

Full-Year Results 2013
18 February 2014
EXITO HAS EXPERIENCED REGULAR GROWTH IN ITS ACTIVITY AND EARNINGS SINCE IT WAS ACQUIRED IN 1999
20
Data published by Exito since 1999 (in COP millions)
0
200 000
400 000
600 000
800 000
1 000 000
1 200 000
0
2 000 000
4 000 000
6 000 000
8 000 000
10 000 000
12 000 000
1999 2000 2001 2002 2003 2004 2005 2006 2007 2008 2009 2010 2011 2012 2013
CA
EBITDA
Sales
EBITDA
SALES (IN COP millions)
EBITDA (IN COP millions)
12,000,000
10,000,000
8,000,000
6,000,000
4,000,000
2,000,000
0
1,200,000
1,000,000
800,000
600,000
400,000
200,000
0
Full-Year Results 2013
18 February 2014 * Excluding petrol and calendar effect, this figure includes the performance of shopping centres
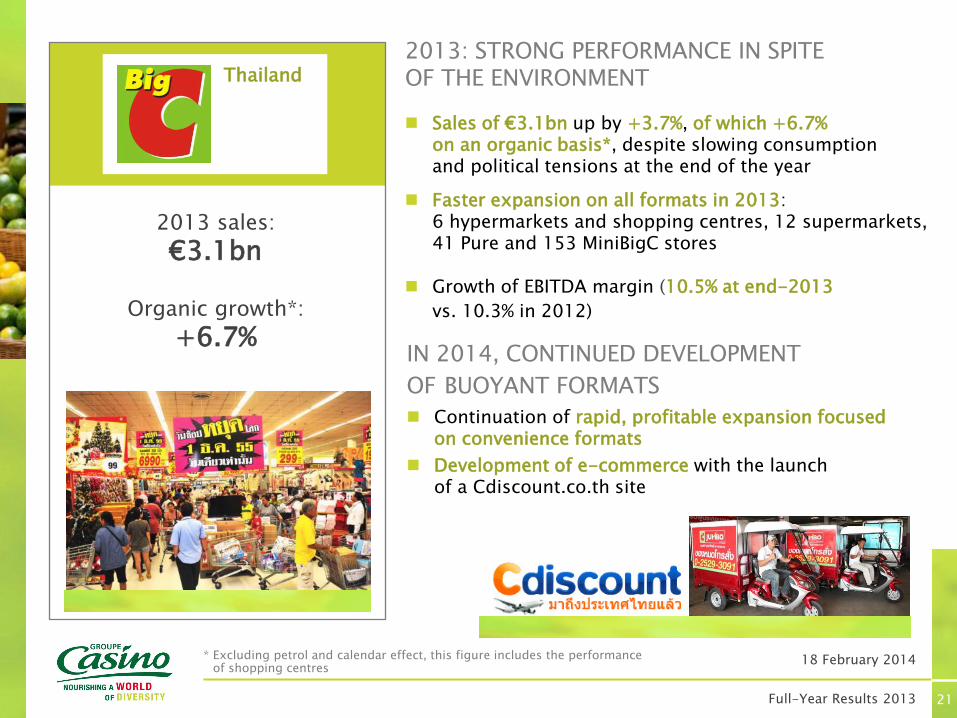
2013: STRONG PERFORMANCE IN SPITE OF THE ENVIRONMENT
21
Sales of €3.1bn up by +3.7%, of which +6.7% on an organic basis*, despite slowing consumption and political tensions at the end of the year
Faster expansion on all formats in 2013: 6 hypermarkets and shopping centres, 12 supermarkets, 41 Pure and 153 MiniBigC stores
Growth of EBITDA margin (10.5% at end-2013 vs. 10.3% in 2012)
IN 2014, CONTINUED DEVELOPMENT OF BUOYANT FORMATS
Continuation of rapid, profitable expansion focused on convenience formats
Development of e-commerce with the launch of a Cdiscount.co.th site
2013 sales:
€3.1bn
Organic growth*:
+6.7%
Thailand

Full-Year Results 2013
18 February 2014
22
Data published by Big C since 1999, en MTHB
BIG C HAS POSTED CONSTANT, REGULAR GROWTH IN ITS BUSINESS AND EARNINGS SINCE IT WAS ACQUIRED IN 1999
Thailand
0
2 000
4 000
6 000
8 000
10 000
12 000
14 000
0
20 000
40 000
60 000
80 000
100 000
120 000
140 000
1999 2000 2001 2002 2003 2004 2005 2006 2007 2008 2009 2010 2011 2012 2013
CA
EBITDA
SALES (in THB millions)
EBITDA (in THB millions)
Sales
EBITDA
140,000
120,000
100,000
80,000
60,000
40,000
20,000
0
14,000
12,000
10,000
8,000
6,000
4,000
2,000
0

Full-Year Results 2013
18 February 2014
STRONG ORGANIC SALES GROWTH
* Excluding calendar effect
23
Very strong sales growth on an organic basis over the year in an improving macroeconomic environment
Expansion continued with the opening of four hypermarkets and adjacent shopping centres over the year: the banner, with leading position on the hypermarket format, operates 25 hypermarkets and 10 convenience stores at end-2013
E-commerce development with the launch of the Cdiscount.vn website
2013 sales:
€468m
Organic growth*:
+13.5%
Vietnam

Full-Year Results 2013
18 February 2014
Highlights
RESULTS
2014 Perspectives & Conclusion
Appendices
Antoine GISCARD D’ESTAING Chief Financial Officer
Full-Year Results 2013
18 February 2014
PRELIMINARY NOTES
The 2013 consolidated financial statements approved by the Board of Directors
on 17 February 2014 have been audited by the Statutory Auditors
PRINCIPLE CHANGES IN SCOPE
After the IPO, GPA's stake in Viavarejo fell from 52.4% to 43.3% at the end of December 2013. As it did not result in a change of control, this transaction had no effect on consolidated sales figures. The change in GPA's stake in Nova.com (from 43.9% to 52.3%) also had no effect on consolidated sales.
On 21 June 2013, the date of the Shareholders’ Meeting during which the loss of control was noted, Mercialys was deconsolidated. As of this date, earnings will be accounted for under the equity method.
Monoprix Group was fully consolidated in Casino Group's accounts starting on 5 April 2013,
the date on which 50% of Monoprix shares are assumed to have been acquired.
As in 2012, changes to Casino’s stakes in other companies generated significant non-recurring net income of €551m in 2013, reported in other operating income and expenses in the income statement (vs. €672m for the previous year).
Since 1 February 2013, Casino has fully consolidated (via Franprix-Leader Price) various franchises. Its scope also changed with the full consolidation of NORMA stores starting on 31 July 2013.
25 25

Full-Year Results 2013
18 February 2014
SHARP INCREASE IN OPERATING PROFIT, IN LINE WITH GROWTH IN CONSOLIDATED SALES
26
Continuing operations (in € million) 2012 2013 Change
Net sales 41,971 48,645 +15.9%
Gross margin 10,844 12,445 +14.8%
As a % of sales 25.8% 25.6% -25bp
EBITDA* 2,853 3,337 +17%
EBITDA margin 6.8% 6.9% +6bp
Depreciation and amortisation 851 974 +14.4%
Trading profit 2,002 2,363 +18.1%
Trading margin 4.8% 4.9% +9bp

Full-Year Results 2013
18 February 2014
ORGANIC EBITDA AND TRADING PROFIT GROWTH ABOVE SALES GROWTH
CHANGE IN EBITDA
27
2,853
+8.3% +17.9%
-9.2%
+17%
2012 2013
Organic Scope Currency
CHANGE IN TRADING PROFIT
2,002
+10.7% +17.6%
-10.3%
+18.1%
2012 2013
Organic Scope Currency
Sustained organic EBITDA and trading profit growth (+8.3% and +10.7%, respectively),
above organic sales growth (+5.7%*)
Given those robust performances and taking into account scope changes, very significant
growth in reported EBITDA and trading profit
3,337 2,363
* Excluding petrol and calendar effect
in €m in €m

Full-Year Results 2013
18 February 2014
GROUP TRADING PROFIT AND TRADING MARGIN GROWTH
Very strong growth in trading profit from international subsidiaries, driven by the control of GPA and strong performance growth, particularly for Viavarejo
Trading profit stable in France excluding Mercialys
Excluding negative foreign exchange impact, total trading profit growth was +28.3% in 2013
TRADING PROFIT
in €m
TRADING MARGIN
in %
28
2,363
2012 2013
2,002
544
1,745
France (excluding Mercialys)
International +32.6%
-48.9%
1,316
539
Mercialys
+0.9%
146 75
4,9%
2012 2013
4.8% 4.9%

Full-Year Results 2013
18 February 2014
STABLE TRADING PROFIT FROM DISTRIBUTION ACTIVITIES IN FRANCE
Trading profit (in € million) 2012 Margin 2013 Margin
Organic change
Casino banners (excluding Mercialys) 254 2.1% 145 1.3% -76bp
Franprix-Leader Price 163 3.8% 152 3.5% +13bp
Monoprix 122 6.1% 247 6.9% +52bp
France (excluding Mercialys) 539 2.9% 544 2.8% -45bp
Mercialys (equity method in H2 2013) 146 n/a 75 n/a n/a
Total 685 n/a 618 n/a n/a
Casino banners: Price cuts carried out in 2013 notably at Géant resulted in successful price repositioning
These had a very positive effect on volumes: the Group has gained market share in volumes since the 4th quarter, both in hypermarkets and supermarkets
Cost reduction plans significantly limited the impact of price reductions
A strong FPLP model: Organic margin growth (+13bp)
Improved results by master franchises previously accounted for under the equity method and included in consolidated trading profit in 2013
Growth in the contribution of Monoprix to French results due to its full consolidation and the improvement of its margin in organic terms
29
Full-Year Results 2013
18 February 2014
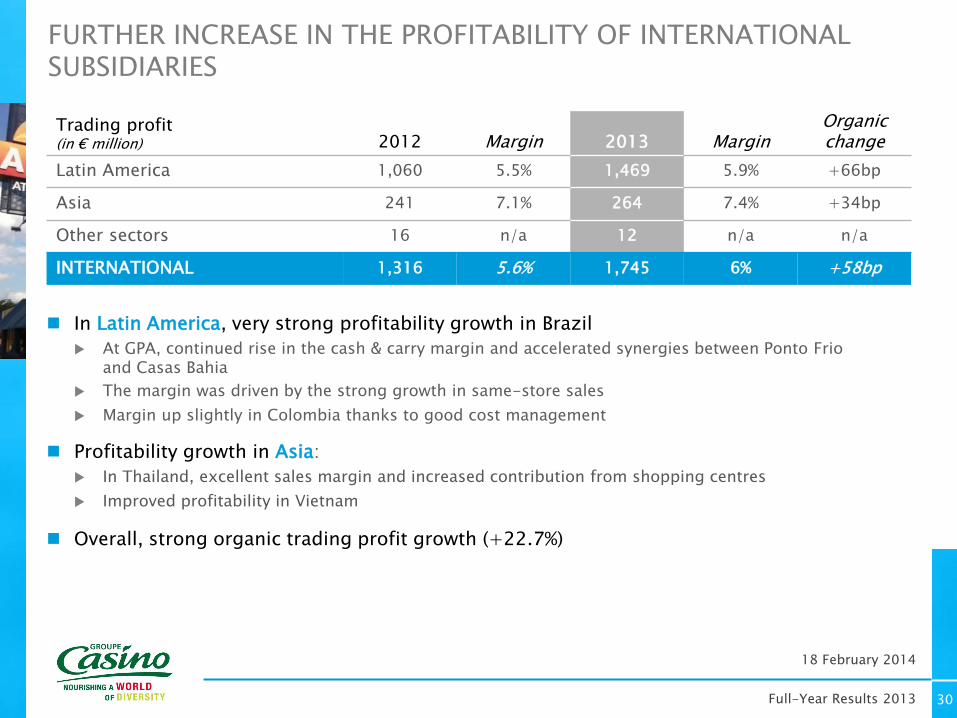
FURTHER INCREASE IN THE PROFITABILITY OF INTERNATIONAL SUBSIDIARIES
Trading profit (in € million) 2012 Margin 2013 Margin
Organic change
Latin America 1,060 5.5% 1,469 5.9% +66bp
Asia 241 7.1% 264 7.4% +34bp
Other sectors 16 n/a 12 n/a n/a
INTERNATIONAL 1,316 5.6% 1,745 6% +58bp
In Latin America, very strong profitability growth in Brazil
At GPA, continued rise in the cash & carry margin and accelerated synergies between Ponto Frio and Casas Bahia
The margin was driven by the strong growth in same-store sales
Margin up slightly in Colombia thanks to good cost management
Profitability growth in Asia:
In Thailand, excellent sales margin and increased contribution from shopping centres
Improved profitability in Vietnam
Overall, strong organic trading profit growth (+22.7%)
30

Full-Year Results 2013
18 February 2014
Continuing operations (in € million) 2012 2013 Change
Trading profit 2,002 2,363 +18.1%
Other operating income and expenses 377 261
Finance costs, net (519) (635)
Other financial income and expenses 20 (84)
Profit before tax 1,880 1,905
Income tax expense (323) (401)
Share of profits of associates (21) 21
Net income from continuing operations 1,535 1,524
Minority interests 470 672
o/w Group share 1,065 853
Underlying net profit (*) 979 1,254
Minority interests 415 636
o/w Group share 564 618 +9.7%
DETAILED INCOME STATEMENT
* Underlying profit corresponds to net profit from continuing operations adjusted for the impact of other operating income and expenses (as defined in the “Significant Accounting Policies” section of the notes to the annual consolidated financial statements), non-recurring financial items and non-recurring tax income/expenses.
31

Full-Year Results 2013
18 February 2014
OTHER OPERATING INCOME AND EXPENSES
(in € million) 2012 2013
Capital gain on asset disposals 110 58
Other operating income and expenses 267 203
Net income related to scope operations 672 551
Net impairment of assets (123) (79)
Provisions and charges for restructuring (200) (148)
Legal and risk provisions and charges (68) (86)
o/w GPA (18) (44)
Other (14) (35)
TOTAL 377 261
Less significant impact in 2013 from capital gains on asset disposals and income related to scope operations (revaluation of the share held in Mercialys and 100% consolidation of Monoprix)
Provisions for restructuring down in France and Brazil
Legal and risk provisions (especially at GPA)
32

Full-Year Results 2013
18 February 2014
GOOD MANAGEMENT OF FINANCE COSTS EXCLUDING THE IMPACT OF SCOPE EFFECTS
(in € million) 2012 2013
France (231) (258)
Brazil (282) (376)
Thailand (30) (24)
Other international 25 23
TOTAL (519) (635)
In France, finance costs were impacted by the acquisition of a 50% stake in Monoprix
At GPA, finance costs in local currency were stable despite unfavourable interest rate evolution
Lower finance costs in Thailand due to the combined effects of continued partial debt repayments over the year and the drop in interest rates
33

Full-Year Results 2013
18 February 2014
(in € million) 2012 underlying 2013 underlying
TRADING PROFIT 2,002 2,363
Other operating income and expense, net 0 0
OPERATING PROFIT 2,002 2,363
Finance costs, net (519) (635)
Other financial income and expense, net (4) 4
Income tax expense (478) (499)
Share of profit of associates (21) 21
PROFIT FROM CONTINUING OPERATIONS* 979 1,254
Attributable to minority interests 415 636
o/w Group share 564 618
NET UNDERLYING PROFIT UP +9.7%
* Underlying profit corresponds to net profit from continuing operations adjusted for the impact of other operating income and expenses (as defined in the “Significant Accounting Policies” section of the notes to the annual consolidated financial statements), non-recurring financial items and non-recurring tax income/expenses.
34

Full-Year Results 2013
18 February 2014
NET UNDERLYING EPS UP +7.6%
Continuing operations 2012 2013 Change
Diluted average number of shares 112,173,213 112,918,625 +0.7%
Diluted EPS* 9.41 7.40 -21.4%
Underlying diluted EPS* 4.94 5.32 +7.6%
* Adjusted for dividends paid to holders of TSSDI: €9 million in 2012 and €18 million in 2013
35
Dividend proposed at the Annual General Meeting of 6 May 2014: €3.12 per share

Full-Year Results 2013
18 February 2014
WCR: SIGNIFICANT IMPROVEMENT IN CASH FLOW GENERATION
Positive change in WCR in France thanks to good management of inventories
Internationally, strong performance in Brazil
36
CHANGE IN WCR (excluding Mercialys)
in €m
445
119
2012
2013
Group

Full-Year Results 2013
18 February 2014
2012 2013
CAPEX PRIMARILY ALLOCATED TO INTERNATIONAL ACTIVITIES
* Investments in property, plant & equipment and intangible assets ** Excluding Mercialys
37
Internationally: €1,083m France**: €540m
2012 2013
3.0% 2.8% 3.4%
3.7%
OPERATING INVESTMENTS (GROSS CAPEX* AS % OF SALES)
as % of sales

Full-Year Results 2013
18 February 2014
The financial year was marked by the acquisition of a 50% stake in Monoprix and continued investment in the Group's development
The Group's net debt remained under control thanks to: Close to €900 million in free cash flow generation Operations strengthening the capital base (hybrid issue of 18 October 2013 and Monoprix mandatory
convertible bonds on 20 December 2013) Cancellation of the put option granted to Mr. Diniz in Brazil The successful stock market listing of Viavarejo
STABILITY OF THE GROUP'S CONSOLIDATED DEBT
NFD 31/12/2013
NFD 31/12/2012
38
Dividends paid
(551)
(5,451)
Issuances to strengthen
the capital base
1,158
Cash flow
(5,416) 1,956
(1,535)
CAPEX (net)
Chg. WCR
(128)
Other items
GPA Put Option
Cancellation
399
Monoprix Operation
(1,434)
445
259
Other changes in scope
(536)
Stock Market Listing
of Via Varejo
FCF: +866M€
Excluding Mercialys flows
in €m

Full-Year Results 2013
18 February 2014
STRONG IMPROVEMENT IN THE CONSOLIDATED DEBT RATIO
39
NET FINANCIAL DEBT/EBITDA
in %
1.91
1.62
1,1
1,2
1,3
1,4
1,5
1,6
1,7
1,8
1,9
2,0
0
1000
2000
3000
4000
5000
6000
2012 2013
DFN EBITDA NFD / EBITDA

Full-Year Results 2013
18 February 2014
In April 2013, Casino issued two bonds for a total amount of €600 million (1.990% for a bond maturing in 2019
and 2.788% for a bond maturing in 2023)
On 4 July 2013, Casino announced the signing of a 5-year confirmed line of credit for US$1 billion,
strengthening the Group's liquidity position and extending the average maturity of Casino's confirmed lines from 1.8 years to 3 years
In October 2013, the Group announced the success of a hybrid perpetual bond for €750 million (4.87%)
In December 2013, Monoprix issued €500 million in mandatory convertible bonds with a maturity of 3 years
and a 6-month Euribor + 5.1% coupon. This operation strengthened its capital base.
The Group's average bond debt maturity was 4.8 years, compared to 4.5 years at end-2012 (and 4.4 years at end-2011)
Casino Group is rated BBB-Outlook stable by S&P and Fitch Ratings
* French scope: Casino Guichard Perrachon, Monoprix, FPLP and others; ** Casino Guichard Perrachon bond maturities as of 31 December 2013 excluding subordinated debt
2014 2015 2016 2017 2018 2019 2020 2021 2022 2023
750
578 508
888 850
600 600
Cash and cash equivalents
Undrawn confirmed lines
of credit
1,146
2,930 1,000 1,000
in €m
BOND MATURITIES** WELL SPREAD OUT OVER TIME
40
€4.1 billion IN LIQUIDITY* AT 31/12/2013
in €m
IN 2013, CASINO MAINTAINED A HIGH LEVEL OF LIQUIDITY BY EXTENDING THE MATURITY OF ITS DEBT CONTROLLING THE COST OF DEBT

Full-Year Results 2013
18 February 2014
Highlights
Results
2014 PERSPECTIVES & CONCLUSION
Appendices
Jean-Charles NAOURI Chairman and Chief Executive Officer

Full-Year Results 2013
18 February 2014
AT THE END OF 2013, THE GROUP'S PROFILE WAS PROFOUNDLY TRANSFORMED
42
* Proforma 2014: 100% consolidation of Monoprix; Mercialys accounted for under the equity method on 1 January 2013
** Cdiscount and Nova.com sites
2009: €26.8bn 2013*: €49.1bn
Over the past five years, the Group has nearly doubled in size
It has reinforced its portfolio of banners by taking control of Monoprix and GPA
It now has an excellent geographical mix. It has primarily developed in sectors and formats which address current consumption trends:
Discount Premium Convenience E-commerce
CONSOLIDATED NET SALES, 2009 / 2013 In € bn
56% 33%
63%
4%
38% 6% E-commerce**
International
France Retail

Full-Year Results 2013
18 February 2014
Strengthening of the premium formats’ positioning
Expansion in convenience
Development in non-food e-commerce
THE GROUP'S STRATEGIC PRIORITIES
Over time, Casino group has grown around a constant vision and has developed activities favoured by the main consumption trends
In 2014, the Group will continue and accelerate this strategy on all of its markets:
43
Roll out of discount banners 1
2
3
4

Full-Year Results 2013
18 February 2014
CONTINUE THE ROLL-OUT OF DISCOUNT BANNERS
In France
Continued development of Leader Price with, as of today, the best pricing on market*
Repositioning of Géant hypermarkets as a popular banner, with a very competitive offer and price index* and a new ambition for same-store growth
Internationally
Expansion:
In Brazil, in cash & carry (Assai)
In Colombia, through Surtimax stores and the recently acquired Super Inter stores
Attractive prospects for hypermarkets, seen as a discount format in the developing economies
44
* Independent panel
1

Full-Year Results 2013
18 February 2014
STRENGTHEN OUR POSITIONING ON PREMIUM FORMATS
The Group benefits from a unique positioning in premium formats via the Monoprix banners (including Monop’ and Naturalia), Carulla (Colombia) and Pão de Açúcar (Brazil) banners
In France, a sustained pace of expansion at Monoprix via its various formats
Internationally, accelerated development of high-quality supermarkets Carulla and Pão de Açúcar, which address changing consumption patterns
45
2

Full-Year Results 2013
18 February 2014
CONTINUE EXPANDING THE CONVENIENCE FORMAT
In France
Accelerated expansion on differentiated formats (store size and assortment adapted to the catchment areas)
Priority development given to franchise
Internationally, development of convenience formats
Minimercado in Brazil
Exito Express in Colombia
Mini Big C in Thailand
46
3

Full-Year Results 2013
18 February 2014
STRONG GROWTH OF E-COMMERCE
In 2013, Casino achieved sales of €2.9 billion in non-food e-commerce, in Brazil and France
In 2014, the Group will continue its strong development:
In France
Strong volume growth for Cdiscount
Strengthened website commercial appeal (pricing, product range)
Development of the marketplace, which should contribute significantly to Cdiscount's sales in 2014
Internationally
In Brazil, continued very high growth of Nova.com
Rapid development of Cdiscount pure players sites in Colombia,
Thailand and Vietnam
47
4

Full-Year Results 2013
18 February 2014
2014 PERSPECTIVES
In 2014, the Group sets the following objectives:
Return to positive organic sales growth in France
Continued strong organic sales growth internationally
Further trading profit growth in organic terms
Continued improvement of the financial structure
48 48

Full-Year Results 2013
18 February 2014
Highlights
Results
2014 Perspectives & Conclusion
APPENDICES

Full-Year Results 2013
18 February 2014
SIMPLIFIED CONSOLIDATED BALANCE SHEET
50
(in € millions) 31/12/2012** 31/12/2013
Goodwill 10,909 10,791
Intangibles and property, plant and equipment 13,046 14,128
Investments in associates 260 768
Non-current assets* 2,001 1,593
Other non-current assets 865 425
Inventories 4,727 4,693
Trade and other receivables*** 3,498 3,242
Cash and cash equivalents* 6,303 5,433
Assets held for sale 1,461 96
TOTAL ASSETS 43,071 41,168
Equity 15,201 15,426
Long-term provisions 975 963
Non-current financial liabilities* 9,394 8,516
Other non-current liabilities 2,264 2,012
Short-term provisions 275 214
Trade payables 6,655 7,016
Other current liabilities 4,425 4,397
Current financial liabilities* 2,786 2,623
Liabilities held for sale 1,095 0
TOTAL LIABILITIES 43,071 41,168
* Components of financial net debt ** Accounts restated for the adjustment of GPA PPA ** Including €40M of non-current financial assets included in the net financial debt in 2012

Full-Year Results 2013
18 February 2014
CASH FLOW STATEMENT
51
* Neutralisation of finance costs and of income tax expense, replaced by income tax paid ** Excluding Mercialys, included in 2012
(in € millions) 2012 2013**
Net financial debt at beginning of period (5,379) (5,451)
Cash flow 1,639 1,956
Change in working capital requirement 194 445
Other* 523 665
Net cash flow from operating activities, after tax 2,357 3,066
Capital expenditure (1,406) (1,622)
Acquisitions (130) (32)
Proceeds from disposals 287 96
Change in scope and other transactions with minority interests
(197) (1,806)
Net increase in loans and advances (44) 39
Equity instruments 0 1,158
Capital increase and reduction 0 14
(Purchases) sales of treasury shares, net (6) (3)
Dividends paid (815) (534)
Dividends paid to holders of TSSDI (20) (17)
Interest paid, net (541) (616)
Change in non-cash debt (442) 435
Translation adjustment 76 (142)
Net financial debt at 31/12 (6,260) (5,416)
Of which net financial debt of discontinued operations (Mercialys)
809 0
Net financial debt at 31/12 (5,451) (5,416)

Full-Year Results 2013
18 February 2014
CONSOLIDATED NET PROFIT
52
(in € millions) 2012 2013
Net profit from continuing operations 1,535 1,524
Group share 1,065 853
Attributable to minority interests 470 672
Net profit from discontinued operations (2) (2)
Group share (2) (2)
Attributable to minority interests 0 0
Consolidated net profit 1,533 1,523
Group share 1,062 851
Attributable to minority interests 470 672

Full-Year Results 2013
18 February 2014
DEFINITION OF UNDERLYING PROFIT
Underlying profit corresponds to net profit from continuing operations adjusted for the impact of other operating income and expense (as defined in the “Significant Accounting Policies” section of the notes to the annual consolidated financial statements), non-recurring financial items and non-recurring income tax expense/benefits.
Non-recurring financial items include fair value adjustments to certain financial instruments at fair value whose market value may be highly volatile. For example, fair value adjustments to financial instruments that do not qualify for hedge accounting and embedded derivatives indexed to the Casino share price are excluded from underlying profit.
Non-recurring income tax expense/benefits correspond to tax effects related directly to the above adjustments and to direct non-recurring tax effects. In other words, the tax on underlying profit before tax is calculated at the standard average tax rate paid by the Group
Underlying profit is a measure of the Group’s recurring profitability
53

Full-Year Results 2013
18 February 2014
RECONCILIATION OF REPORTED PROFIT TO UNDERLYING PROFIT
54
(in € millions) 2012 Adjustments 2012
underlying 2013 Adjustments 2013
underlying
Trading profit 2,002 2,002 2,363 2,363
Other operating income and expense, net
377 (377) 0 261 (261) 0
Operating profit 2,379 (377) 2,002 2,625 (261) 2,363
Finance costs, net (519) 0 (519) (635) 0 (635)
Other financial income and expense, net(1) 20 (24) (4) (84) 88 4
Income tax expense(2) (323) (155) (478) (401) (97) (499)
Share of profit of associates
(21) 0 (21) 21 0 21
Profit from continuing operations 1,535 (556) 979 1,524 (270) 1,254
Attributable to minority interests(3) 470 (55) 415 672 (36) 636
Group share 1,065 (501) 564 853 (234) 618
(1) Other financial income and expense, net is stated before discounting deferred tax liabilities in Brazil (-€22m in 2012 and -€25m in 2013), exchange losses on receivables on the state of Venezuela in USD (-€2m in 2012 only) and fair value adjustments from Total Return Swaps related to shares in GPA, Big C and forwards and calls (+€48m in 2012 and -€63m in 2013)
(2) Income tax expense is stated before the tax effect of the above adjustments and non-recurring income tax expense/benefits
(3) Minority interests are stated before the above adjustments.

Full-Year Results 2013
18 February 2014
AT THE END OF 2013, THE CONTRIBUTION FROM LISTED COMPANIES TO THE ENTERPRISE VALUE WAS €8.5 BILLION
Listed companies
Share price
at 31/12/2013 Market cap (100%, €m) %-owned
Casino’s share(€m)
GPA (Brazil) BRL 104.9 8,517 38.1%* 3,234
Grupo Exito (Colombia & Uruguay)
COP 30,000 5,053 54.8% 2,771
Big C (Thailand) THB 184 3,360 58.6% 1,961
TOTAL 7,967
Mercialys €15.25 1,404 40.3% 565
TOTAL 8,531
* This percentage does not take into account the Group’s total exposure at 31 December 2013, notably through TRS, totalling 46.6%
55

Full-Year Results 2013
18 February 2014
GPA SHAREHOLDER STRUCTURE AND MINORITY INTERESTS IN BRAZIL
56
43.3%**
Minority interests
56.7%**
52.3%* 44.1%*
Economic interest (as %)
GPA Food Viavarejo Nova.com
Casino Group 38% 16.5% 27.2%
Minority interests 62% 83.5% 72.8%
at 31 December 2013
Minority interests
61.9%
Minority interests
3.6%*
* Since 17 October 2013 ** Since 18 December 2013
38.1%

Full-Year Results 2013
18 February 2014
CHANGE IN UNDERLYING MINORITY INTERESTS
(in € millions) 2012 2013
FPLP (12) (6)
GPA 206 439
Big C Thailand 60 72
Exito 95 90
Other 8 12
Mercialys* 58 29
TOTAL 415 636
* Deconsolidated on 21 June 2013
57
Full-Year Results 2013
18 February 2014
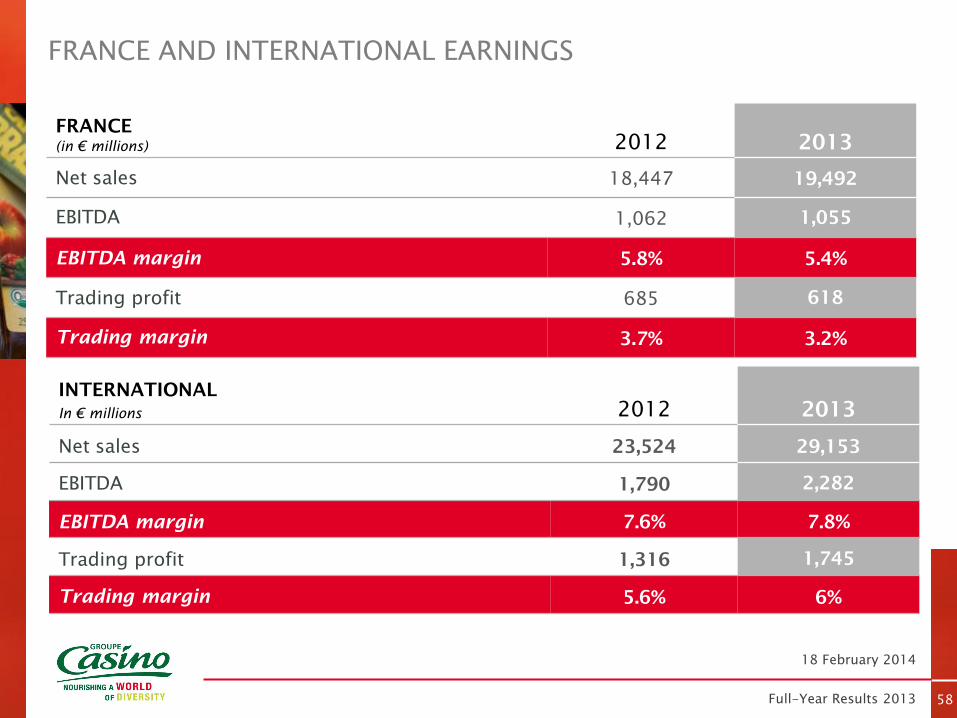
FRANCE AND INTERNATIONAL EARNINGS
58
FRANCE (in € millions) 2012 2013
Net sales 18,447 19,492
EBITDA 1,062 1,055
EBITDA margin 5.8% 5.4%
Trading profit 685 618
Trading margin 3.7% 3.2%
INTERNATIONAL
In € millions 2012 2013
Net sales 23,524 29,153
EBITDA 1,790 2,282
EBITDA margin 7.6% 7.8%
Trading profit 1,316 1,745
Trading margin 5.6% 6%

Full-Year Results 2013
18 February 2014
BREAKDOWN OF SALES BY ENTITY
59
(in € millions) 2012 2013 Var.
Change (organic,
excl. petrol)
Franprix-Leader Price 4,279 4,356 +1.8% -5.1%
Monoprix 2,010 3,561 +77.2% +1.1%
Casino France 12,158 11,575 -4.8% -3.9%
Géant Casino 5,246 4,890 -6.8% -7.2%
Casino
supermarkets 3,687 3,463 -6.1% -5.1%
Convenience 1,480 1,440 -2.7% -2.7%
Other 1,746 1,782 +2.1%
FRANCE 18,447 19,492 +5.7% -3.6%
Latin America 19,251 24,731 +28.5% +12.4%
Asia 3,407 3,561 +4.5% +7.1%
Other 866 862 -0.5% -0.1%
INTERNATIONAL 23,524 29,153 +23.9% +11.2%
GROUP 41,971 48,645 +15.9% +5%

Full-Year Results 2013
18 February 2014
SAME-STORE SALES
60
FRANCE 2013 vs. 2012
Including petrol Excluding petrol
Géant Casino -6.4% -6.8%
Casino Supermarkets -7.2% -6.2%
Franprix -2.9% -2.9%
Leader Price -4.4% -4.4%
Monoprix -0.7% -0.8%
INTERNATIONAL 2013 vs. 2012
Including petrol Excluding petrol
Latin America +8.6% +8.6%
Asia -0.3% -0.3%

Full-Year Results 2013
18 February 2014
OTHER FINANCIAL INCOME AND EXPENSE
61
(in € millions) 2012 2013
Change in derivatives excluding hedging instruments 39 (62)
Foreign exchange gains and losses off-NFD (2) (8)
Discounting adjustments (9) (16)
Other (9) 3
TOTAL 20 (84)

Full-Year Results 2013
18 February 2014
AVERAGE EXCHANGE RATES
62
(in € millions) 2012 2013 Var. %
Argentina (ARS / EUR) 0.171 0.137 -19.7%
Uruguay (UYP / EUR) 0.038 0.037 -4.1%
Thailand (THB / EUR) 0.025 0.024 -2.2%
Vietnam (VND / EUR) (x 1,000) 0.037 0.036 -4.1%
Colombia (COP / EUR) (x 1,000) 0.433 0.403 -6.9%
Brazil (BRL / EUR) 0.399 0.348 -12.6%

Full-Year Results 2013
18 February 2014
CALENDAR EFFECT IN FRANCE BY FORMAT
63
Q4 2013 2013
Géant Casino -0.8% -0.9%
Casino supermarkets -0.6% -0.7%
Convenience -0.6% -0.4%
Cdiscount 0% 0%
Monoprix 0% -0.3%
FPLP -1% -0.8%
FRANCE -0.7% -0.7%

Full-Year Results 2013
18 February 2014
ESTIMATED 2014 CALENDAR EFFECT
64
2014
Q1 Q2 Q3 Q4 2014
France -0.5% 0.4% -0.6% -0.3% -0.3%
International -1.2% 1.7% -0.2% -0.5% -0.1%

Full-Year Results 2013
18 February 2014
SHARE OF PROFIT OF ASSOCIATES
65
2012 2013
France (30) 4
International 8 17
TOTAL (21) 21

Full-Year Results 2013
18 February 2014
PUTS INCLUDED IN NET FINANCIAL DEBT
66
(in € millions) % capital Value
at 31/12/2012 Value
at 31/12/2013 Exercise period
GPA 399 0
Franprix - Leader Price
Majority-owned franchise stores
97 48 Various dates
Monshowroom 0 10 Various dates
Uruguay 15 15 At any time
2021
Other 1 1 At any time
2014
TOTAL 512 75

Full-Year Results 2013
18 February 2014
OFF-BALANCE SHEET PUTS
67
(in € millions) % capital Value
at 31/12/2012 Value
at 31/12/2013 Exercise period
Franprix - Leader Price
Minority-owned franchise stores
157 71 Various dates
Uruguay (Disco)
90 87 At any time
2021
Other 15 0
TOTAL 262 158

Full-Year Results 2013
18 February 2014
CHANGES IN EQUITY
68
(515)
31/12/2012 31/12/2013
Profit for the period
Distribution
Capital increase & stock options plans
15,201 15,426
14
Translation adjustment
(18)
TSSDI dividends
Other*
Change in scope of consolidation
and minority interests
(359)
1,029
* Including evolution in treasury shares, evolution with no change in control, and others
2013 TSSDI issue
1,523 745
(2,195)
in €m

Full-Year Results 2013
18 February 2014
NUMBER OF STORES
69
FRANCE 31/12/2012 31/12/2013
Géant Casino 125 126
Casino Supermarkets 445 444
Franprix 891 885
Monoprix 542 584
Leader Price 604 619
Superettes 6,517 7,315
Other 487 544
TOTAL FRANCE 9,611 10,517
INTERNATIONAL
Argentina 24 22
Uruguay 52 54
Brazil 1,881 1,999*
Colombia 427 739
Thailand 348 559
Vietnam 33 35
Indian Ocean 123 131
TOTAL INTERNATIONAL 2,888 3,539
* Excluding sales of stores under the agreement with CADE regarding the merger of Ponto Frio and Casas Bahia.

DISCLAIMER
This presentation contains forward-looking information and statements about Casino. Forward-looking statements are statements that are not historical facts. These statements include financial projections and estimates and their underlying assumptions, statements regarding plans, objectives and expectations with respect to future operations, products and services, and statements regarding future performance. Forward-looking statements are generally identified by the words “expects,” “anticipates,” “believes,” “intends,” “estimates” and similar expressions. Although the management of Casino believes that the expectations reflected in such forward-looking statements are reasonable, investors and holders of Casino securities are cautioned that forward-looking information and statements are subject to various risks and uncertainties, many of which are difficult to predict and generally beyond the control of Casino, that could cause actual results and developments to differ materially from those expressed in, or implied or projected by, the forward-looking information and statements. These risks and uncertainties include those discussed or identified in Casino’s public filings with the Autorité des marchés financiers (“AMF”), including those listed under “Risk Factors and Insurance” in the Registration Document filed by Casino on 28 March 2013. Except as required by applicable law, Casino undertakes no obligation to update any forward-looking information or statements.
This material was prepared solely for informational purposes and is not to be construed as a solicitation or an offer to buy or sell any securities or related financial instruments. Likewise it does not give and should not be treated as giving investment advice. It has no regard to the specific investment objectives, financial situation or particular needs of any recipient. No representation or warranty, either express or implied, is provided in relation to the accuracy, completeness or reliability of the information contained herein. It should not be regarded by recipients as a substitute for the exercise of their own judgement. All opinions expressed in this material are subject to change without notice.
This presentation and its contents are proprietary information and may not be reproduced or otherwise disseminated in whole or in part without the prior written consent of Casino Group.


![[XLS] · Web view921 2013 922 2013 923 2013 924 2013 925 2013 926 2013 927 2013 928 2013 929 2013 930 2013 931 2013 932 2013 933 2013 934 2013 935 2013 936 2013 937 2013 938 2013 939](https://img.dokumen.tips/doc/110x75/5aa139c27f8b9a436d8b52de/xls-view921-2013-922-2013-923-2013-924-2013-925-2013-926-2013-927-2013-928-2013.jpg)


![[XLS] · Web view1 2013 2 2013 3 2013 4 2013 5 2013 6 2013 7 2013 8 2013 9 2013 10 2013 11 2013 12 2013 13 2013 14 2013 15 2013 16 2013 17 2013 18 2013 19 2013 20 2013 21 2013 22](https://img.dokumen.tips/doc/110x75/5b8a3d977f8b9a82418bc06d/xls-web-view1-2013-2-2013-3-2013-4-2013-5-2013-6-2013-7-2013-8-2013-9-2013.jpg)