Embed Size (px)
Citation preview
2013 California Statewide Critical Peak Pricing
Evaluation
Josh L. BodeCandice A. Churchwell
DRMEC Spring 2014 Load Impacts Evaluation Workshop
San Francisco, CaliforniaMay 2014
2
Introduction and comparison of rates
PG&E Results
SCE Results
SDG&E Results
Appendix: Evaluation methodology
Presentation overview
3
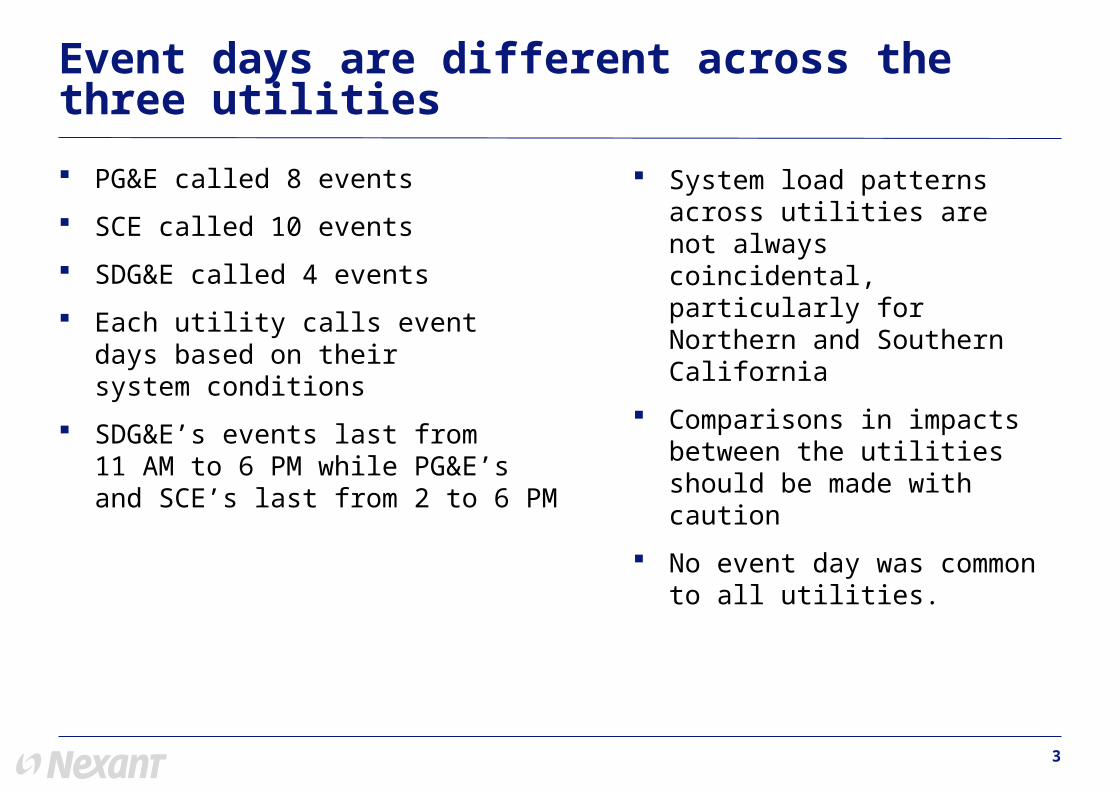
PG&E called 8 events
SCE called 10 events
SDG&E called 4 events
Each utility calls event days based on their system conditions
SDG&E’s events last from 11 AM to 6 PM while PG&E’sand SCE’s last from 2 to 6 PM
Event days are different across the three utilities
System load patterns across utilities are not always coincidental, particularly for Northern and Southern California
Comparisons in impacts between the utilities should be made with caution
No event day was common to all utilities.
4
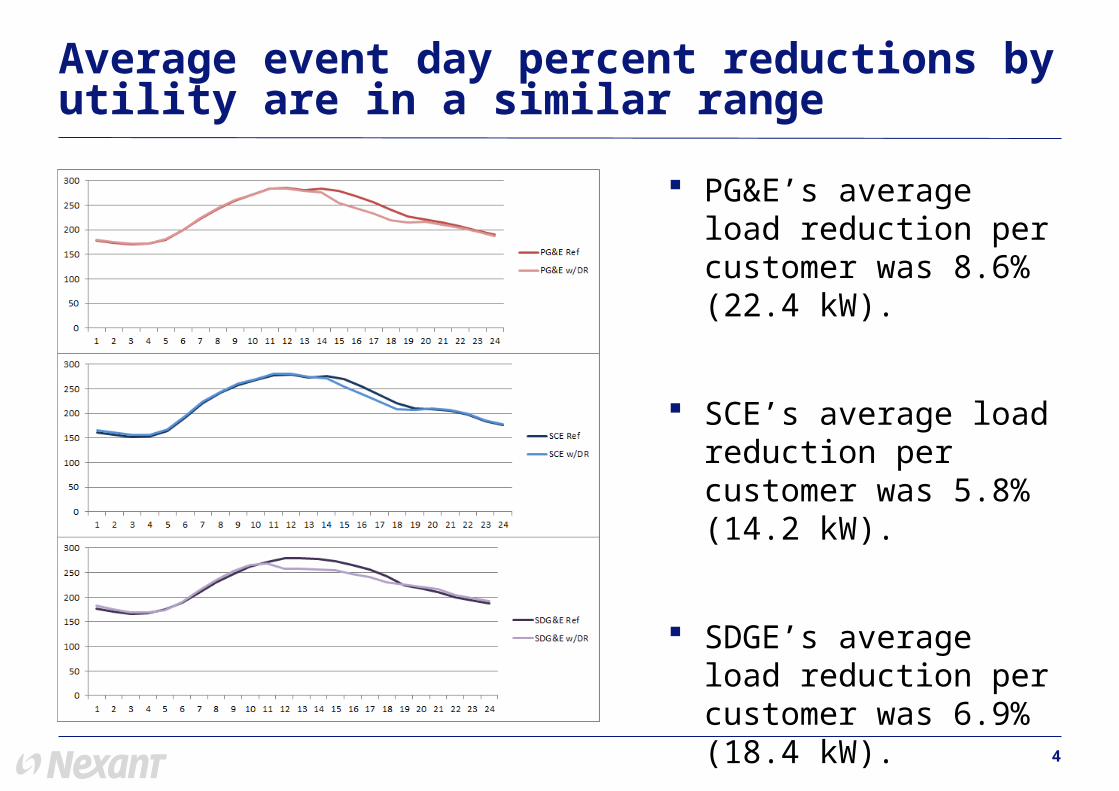
PG&E’s average load reduction per customer was 8.6% (22.4 kW).
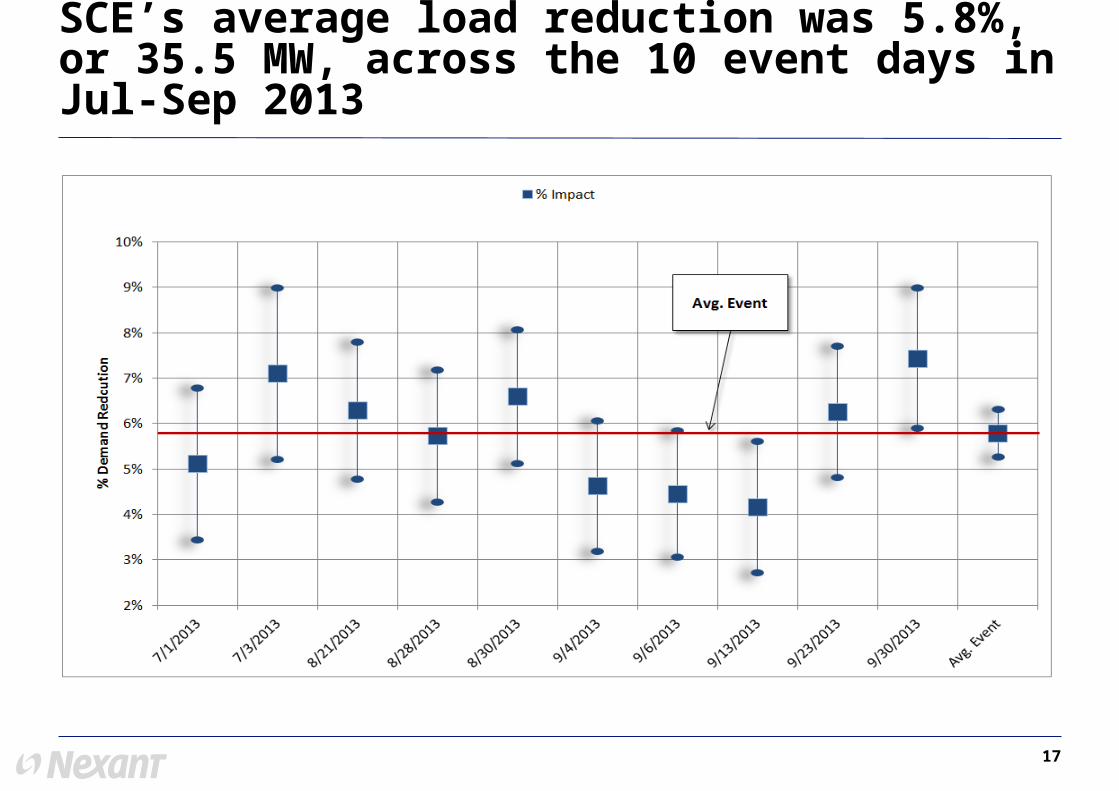
SCE’s average load reduction per customer was 5.8% (14.2 kW).
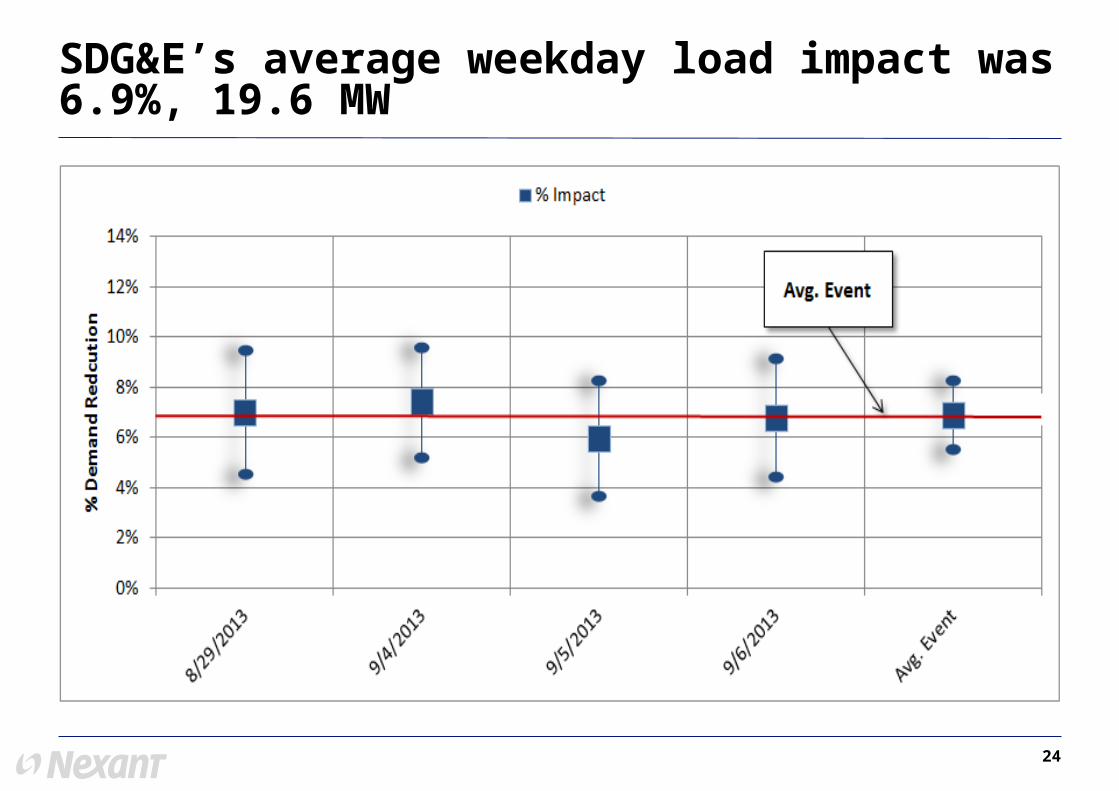
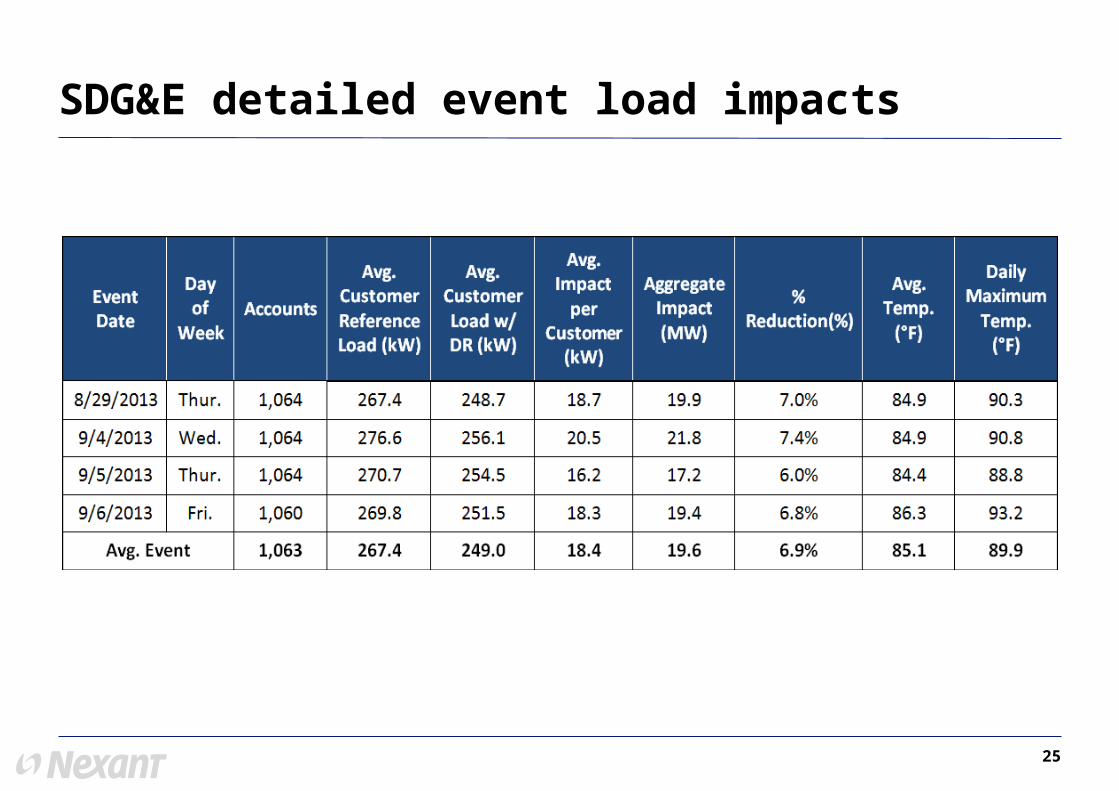
SDGE’s average load reduction per customer was 6.9% (18.4 kW).
Average event day percent reductions by utility are in a similar range
5
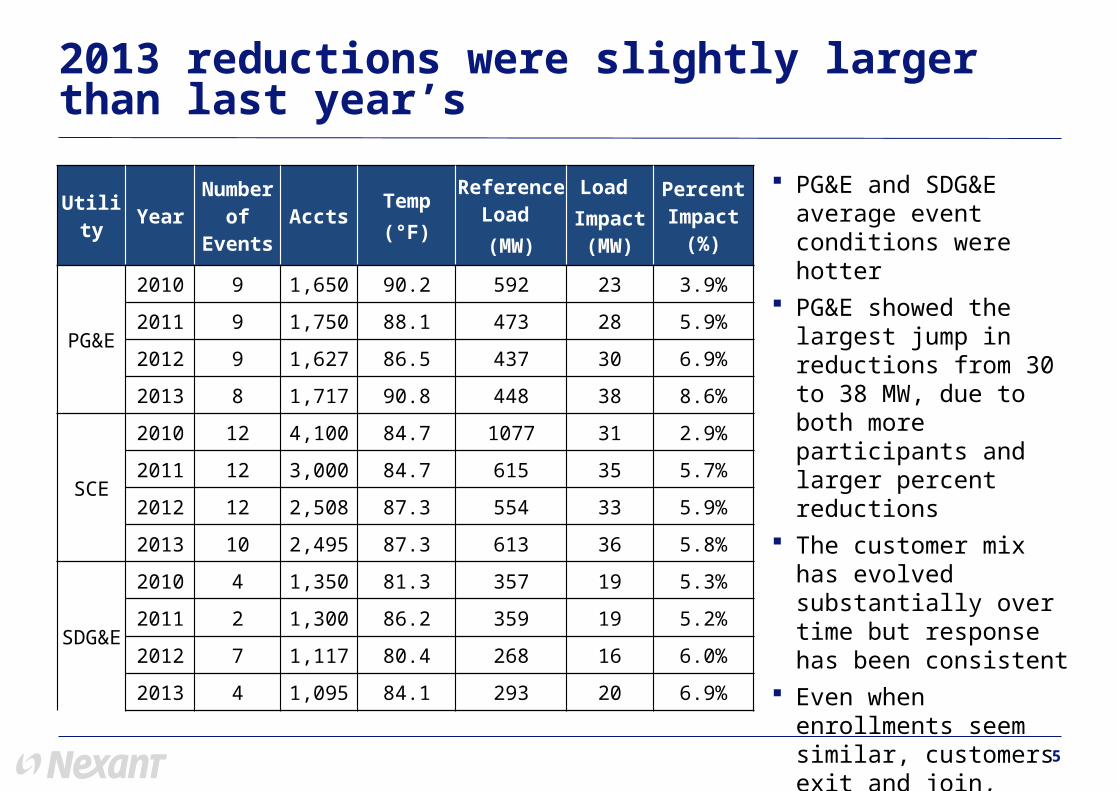
2013 reductions were slightly larger than last year’s
Utility Year Number of Events Accts Temp
(°F)
Reference Load (MW)
Load Impact (MW)
Percent Impact (%)
PG&E
2010 9 1,650 90.2 592 23 3.9%
2011 9 1,750 88.1 473 28 5.9%
2012 9 1,627 86.5 437 30 6.9%
2013 8 1,717 90.8 448 38 8.6%
SCE
2010 12 4,100 84.7 1077 31 2.9%
2011 12 3,000 84.7 615 35 5.7%
2012 12 2,508 87.3 554 33 5.9%
2013 10 2,495 87.3 613 36 5.8%
SDG&E
2010 4 1,350 81.3 357 19 5.3%
2011 2 1,300 86.2 359 19 5.2%
2012 7 1,117 80.4 268 16 6.0%
2013 4 1,095 84.1 293 20 6.9%
PG&E and SDG&E average event conditions were hotter
PG&E showed the largest jump in reductions from 30 to 38 MW, due to both more participants and larger percent reductions
The customer mix has evolved substantially over time but response has been consistent
Even when enrollments seem similar, customers exit and join, leading to changes

6
PG&E Specific Results
7
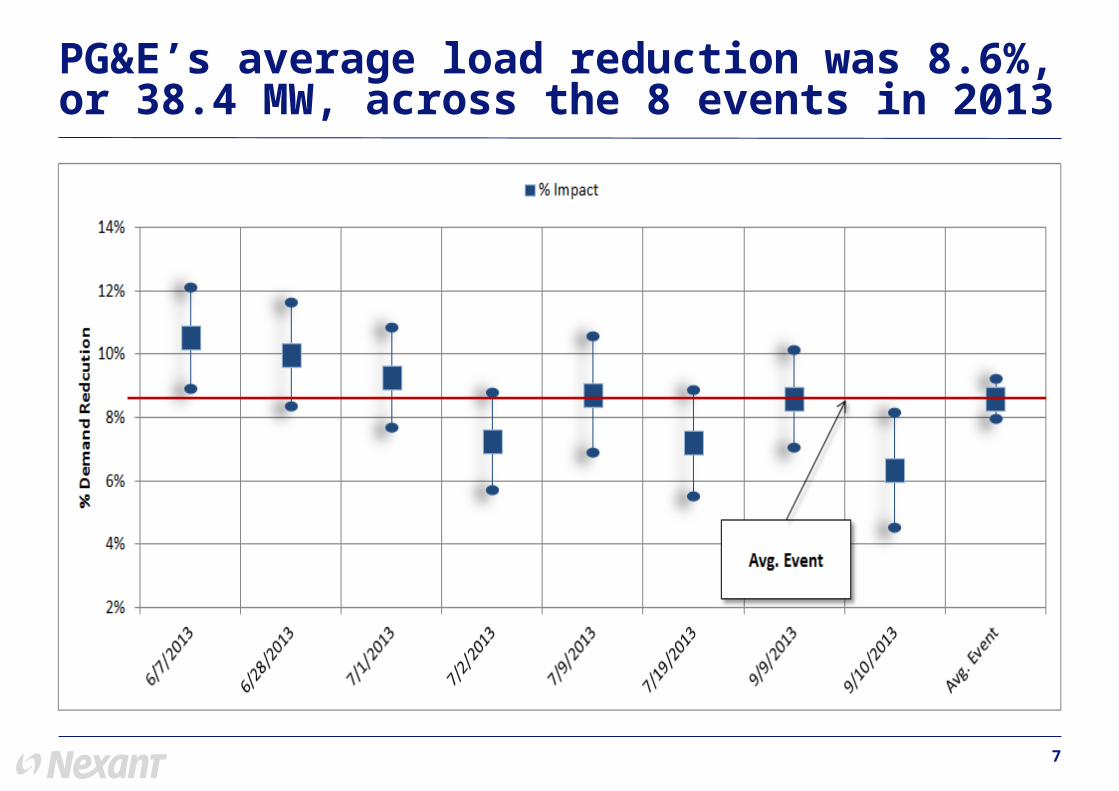
PG&E’s average load reduction was 8.6%, or 38.4 MW, across the 8 events in 2013
8
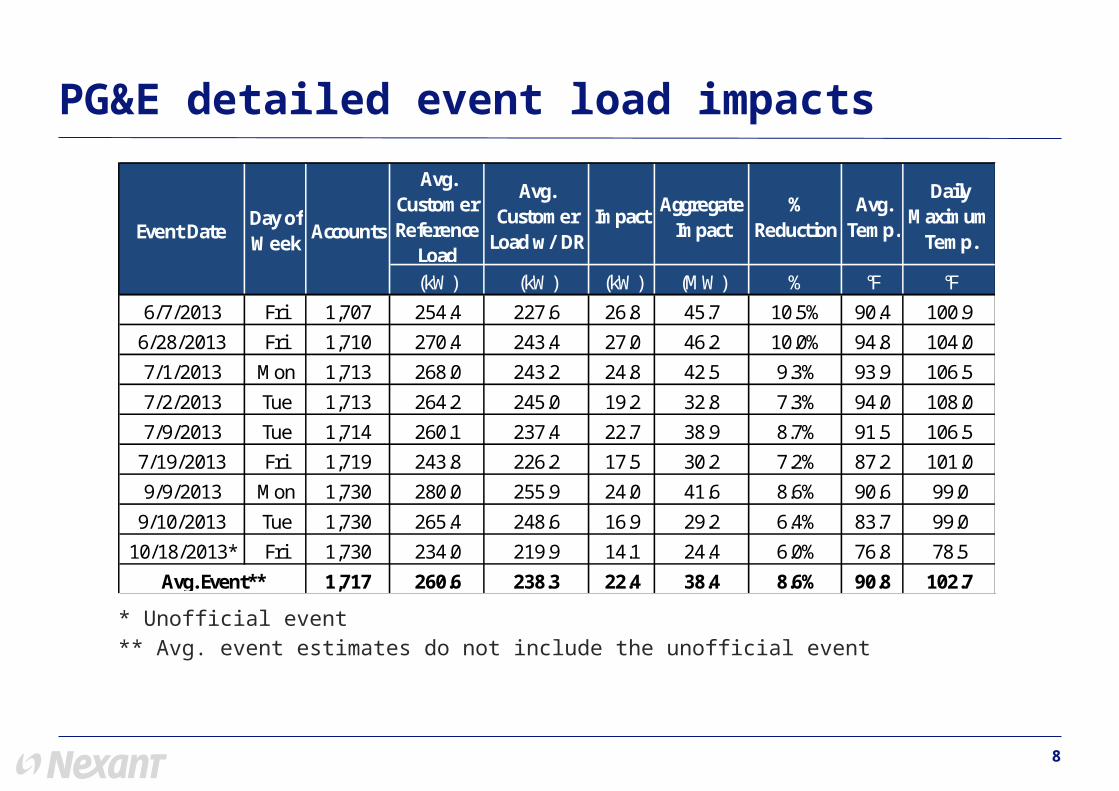
PG&E detailed event load impacts
Avg. Customer Reference
Load
Avg. Customer
Load w/ DRImpact
Aggregate Impact
% Reduction
Avg. Temp.
Daily Maximum
Temp.
(kW) (kW) (kW) (MW) % °F °F
6/7/2013 Fri 1,707 254.4 227.6 26.8 45.7 10.5% 90.4 100.9
6/28/2013 Fri 1,710 270.4 243.4 27.0 46.2 10.0% 94.8 104.0
7/1/2013 Mon 1,713 268.0 243.2 24.8 42.5 9.3% 93.9 106.5
7/2/2013 Tue 1,713 264.2 245.0 19.2 32.8 7.3% 94.0 108.0
7/9/2013 Tue 1,714 260.1 237.4 22.7 38.9 8.7% 91.5 106.5
7/19/2013 Fri 1,719 243.8 226.2 17.5 30.2 7.2% 87.2 101.0
9/9/2013 Mon 1,730 280.0 255.9 24.0 41.6 8.6% 90.6 99.0
9/10/2013 Tue 1,730 265.4 248.6 16.9 29.2 6.4% 83.7 99.0
10/18/2013* Fri 1,730 234.0 219.9 14.1 24.4 6.0% 76.8 78.5
1,717 260.6 238.3 22.4 38.4 8.6% 90.8 102.7
Event DateDay of Week
Accounts
Avg. Event**
* Unofficial event** Avg. event estimates do not include the unofficial event
9
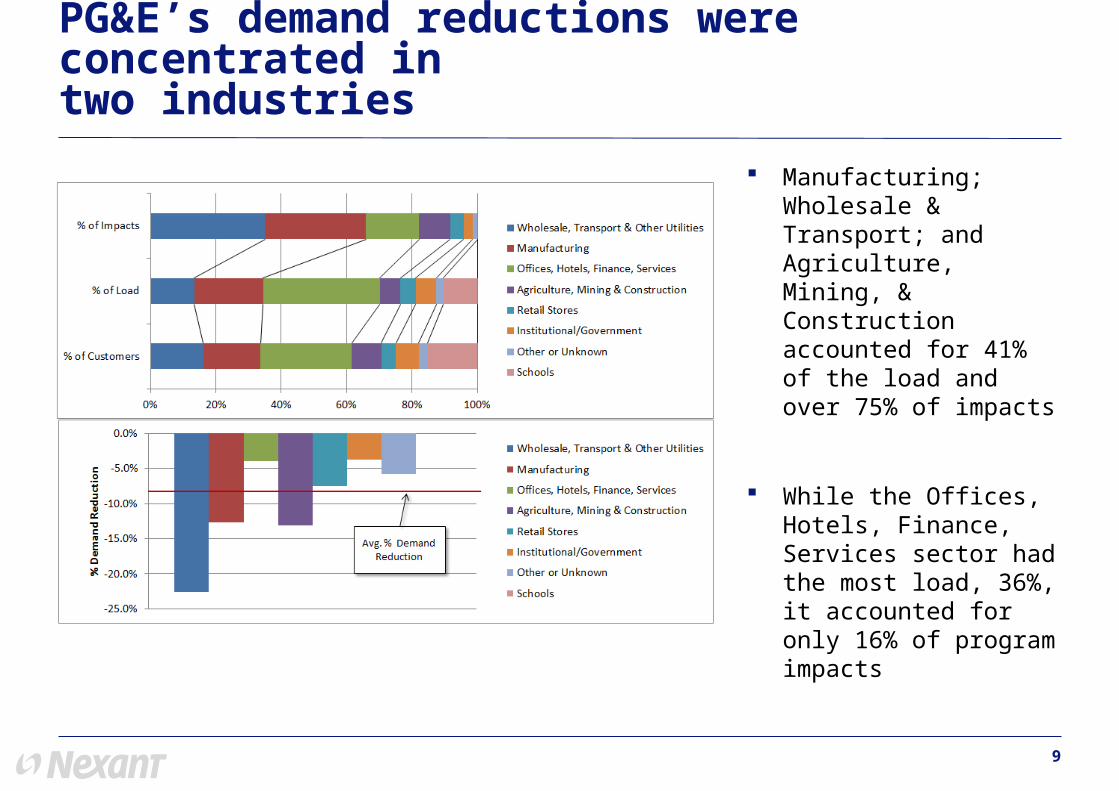
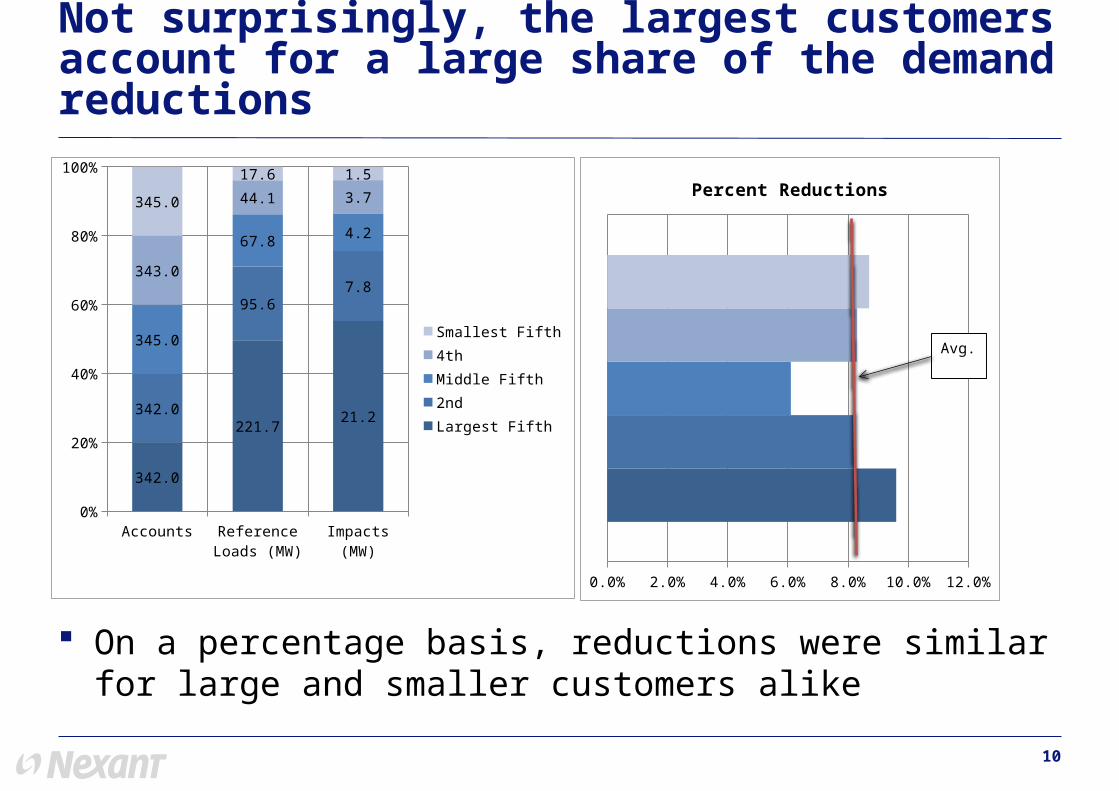
Manufacturing; Wholesale & Transport; and Agriculture, Mining, & Construction accounted for 41% of the load and over 75% of impacts
While the Offices, Hotels, Finance, Services sector had the most load, 36%, it accounted for only 16% of program impacts
PG&E’s demand reductions were concentrated in two industries
10
On a percentage basis, reductions were similar for large and smaller customers alike
Not surprisingly, the largest customers account for a large share of the demand reductions
Accounts Reference Loads (MW)
Impacts (MW)0%
20%
40%
60%
80%
100%
342.0
221.721.2342.0
95.67.8
345.0
67.84.2
343.0
44.1 3.7345.0
17.6 1.5
Smallest Fifth4thMiddle Fifth2nd Largest Fifth
0.0% 2.0% 4.0% 6.0% 8.0% 10.0% 12.0%
Percent Reductions
Avg.
11
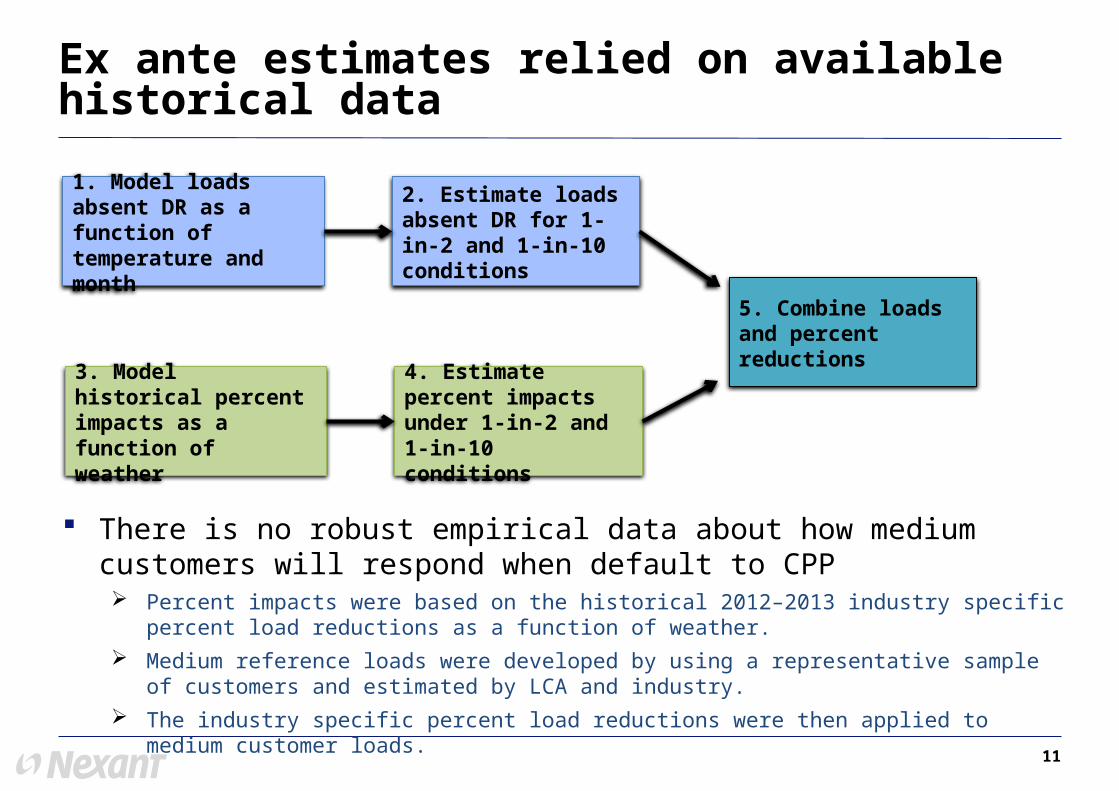
Ex ante estimates relied on available historical data
1. Model loads absent DR as a function of temperature and month
2. Estimate loads absent DR for 1-in-2 and 1-in-10 conditions
5. Combine loads and percent reductions
3. Model historical percent impacts as a function of weather
4. Estimate percent impacts under 1-in-2 and 1-in-10 conditions
There is no robust empirical data about how medium customers will respond when default to CPP Percent impacts were based on the historical 2012–2013 industry specific percent load reductions
as a function of weather.
Medium reference loads were developed by using a representative sample of customers and estimated by LCA and industry.
The industry specific percent load reductions were then applied to medium customer loads.
12
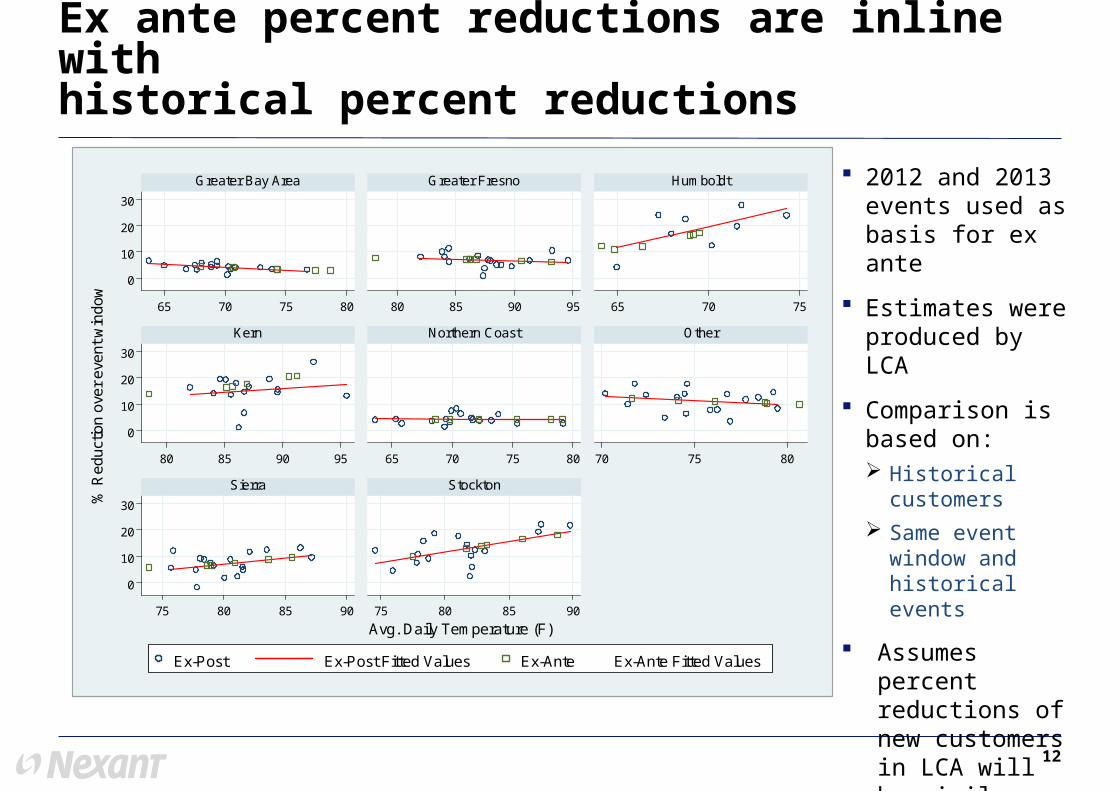
Ex ante percent reductions are inline with historical percent reductions
0
10
20
30
0
10
20
30
0
10
20
30
65 70 75 80 80 85 90 95 65 70 75
80 85 90 95 65 70 75 80 70 75 80
75 80 85 90 75 80 85 90
Greater Bay Area Greater Fresno Humboldt
Kern Northern Coast Other
Sierra Stockton
Ex-Post Ex-Post Fitted Values Ex-Ante Ex-Ante Fitted Values
% R
educ
tion
over
eve
nt w
indo
w
Avg. Daily Temperature (F)
2012 and 2013 events used as basis for ex ante
Estimates were produced by LCA
Comparison is based on: Historical
customers
Same event window and historical events
Assumes percent reductions of new customers in LCA will be similar
13
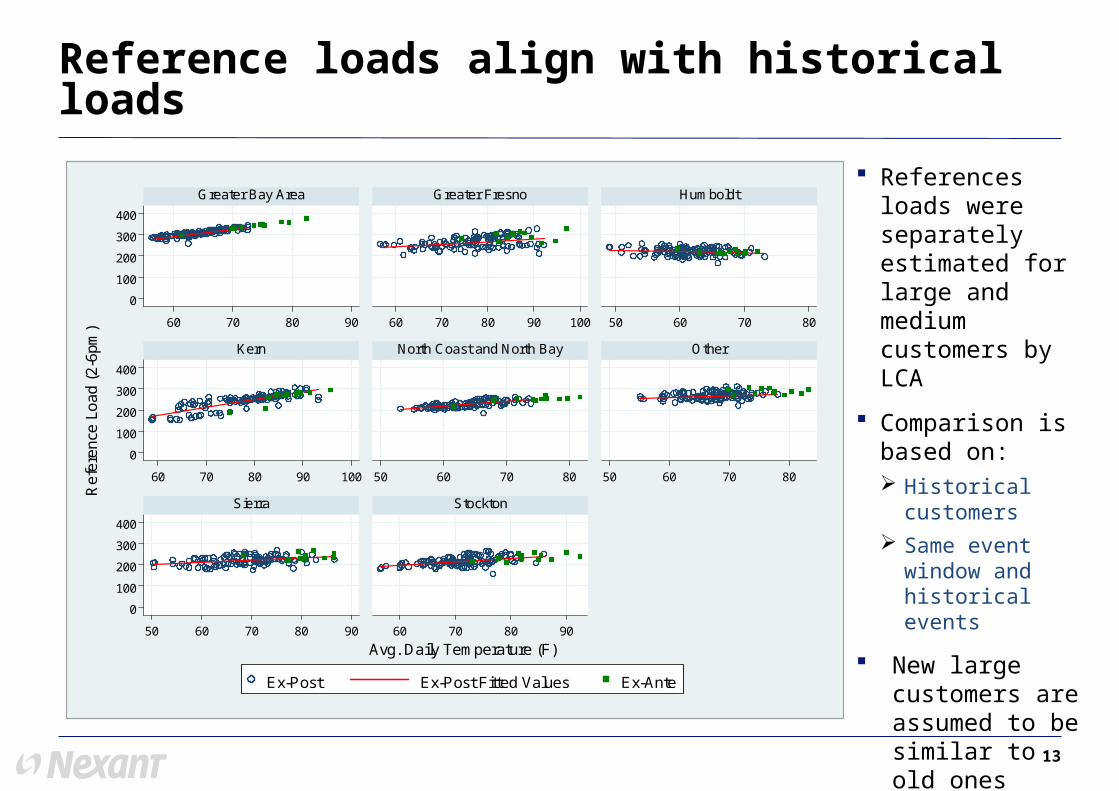
Reference loads align with historical loads
0
100
200
300
400
0
100
200
300
400
0
100
200
300
400
60 70 80 90 60 70 80 90 100 50 60 70 80
60 70 80 90 100 50 60 70 80 50 60 70 80
50 60 70 80 90 60 70 80 90
Greater Bay Area Greater Fresno Humboldt
Kern North Coast and North Bay Other
Sierra Stockton
Ex-Post Ex-Post Fitted Values Ex-Ante
Re
fere
nce
Lo
ad (
2-6
pm
)
Avg. Daily Temperature (F)
References loads were separately estimated for large and medium customers by LCA
Comparison is based on: Historical
customers
Same event window and historical events
New large customers are assumed to be similar to old ones
14
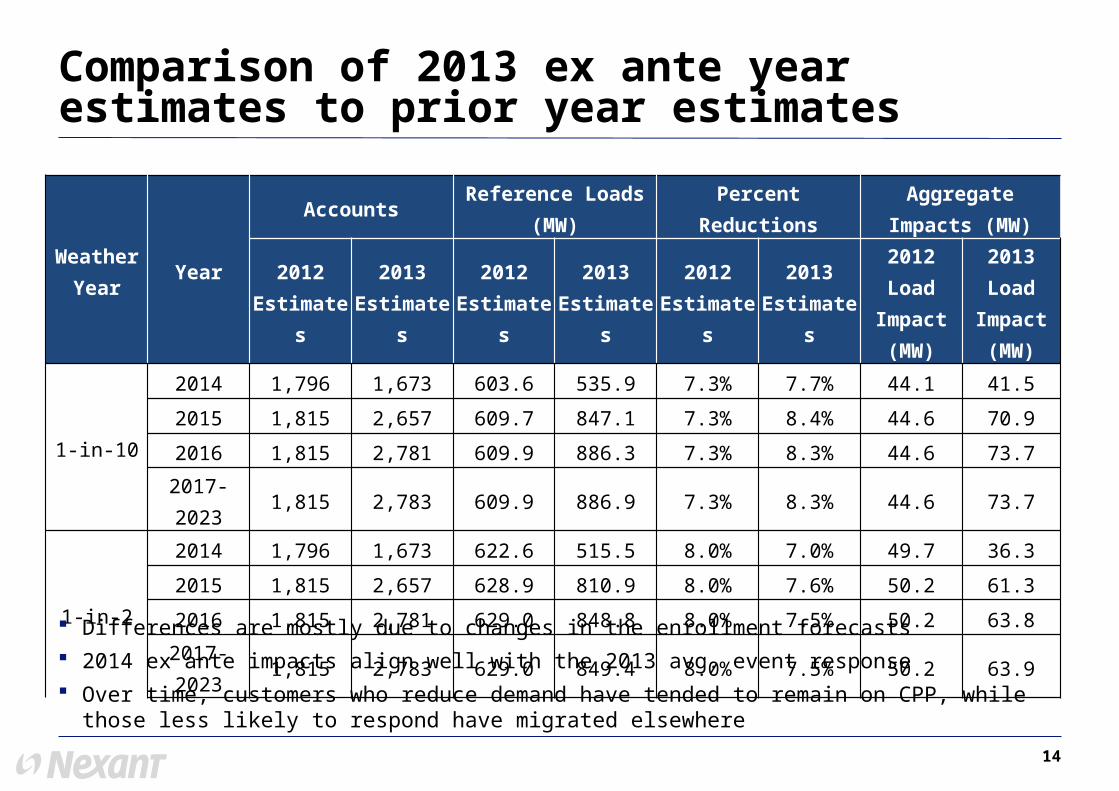
Weather Year Year
Accounts Reference Loads (MW) Percent Reductions Aggregate Impacts (MW)
2012 Estimates
2013 Estimates
2012 Estimates
2013 Estimates
2012 Estimates
2013 Estimates
2012 Load Impact (MW)
2013 Load Impact (MW)
1-in-10
2014 1,796 1,673 603.6 535.9 7.3% 7.7% 44.1 41.5
2015 1,815 2,657 609.7 847.1 7.3% 8.4% 44.6 70.9
2016 1,815 2,781 609.9 886.3 7.3% 8.3% 44.6 73.7
2017-2023 1,815 2,783 609.9 886.9 7.3% 8.3% 44.6 73.7
1-in-2
2014 1,796 1,673 622.6 515.5 8.0% 7.0% 49.7 36.3
2015 1,815 2,657 628.9 810.9 8.0% 7.6% 50.2 61.3
2016 1,815 2,781 629.0 848.8 8.0% 7.5% 50.2 63.8
2017-2023 1,815 2,783 629.0 849.4 8.0% 7.5% 50.2 63.9
Comparison of 2013 ex ante year estimates to prior year estimates
Differences are mostly due to changes in the enrollment forecasts
2014 ex ante impacts align well with the 2013 avg. event response
Over time, customers who reduce demand have tended to remain on CPP, while those less likely to respond have migrated elsewhere
15
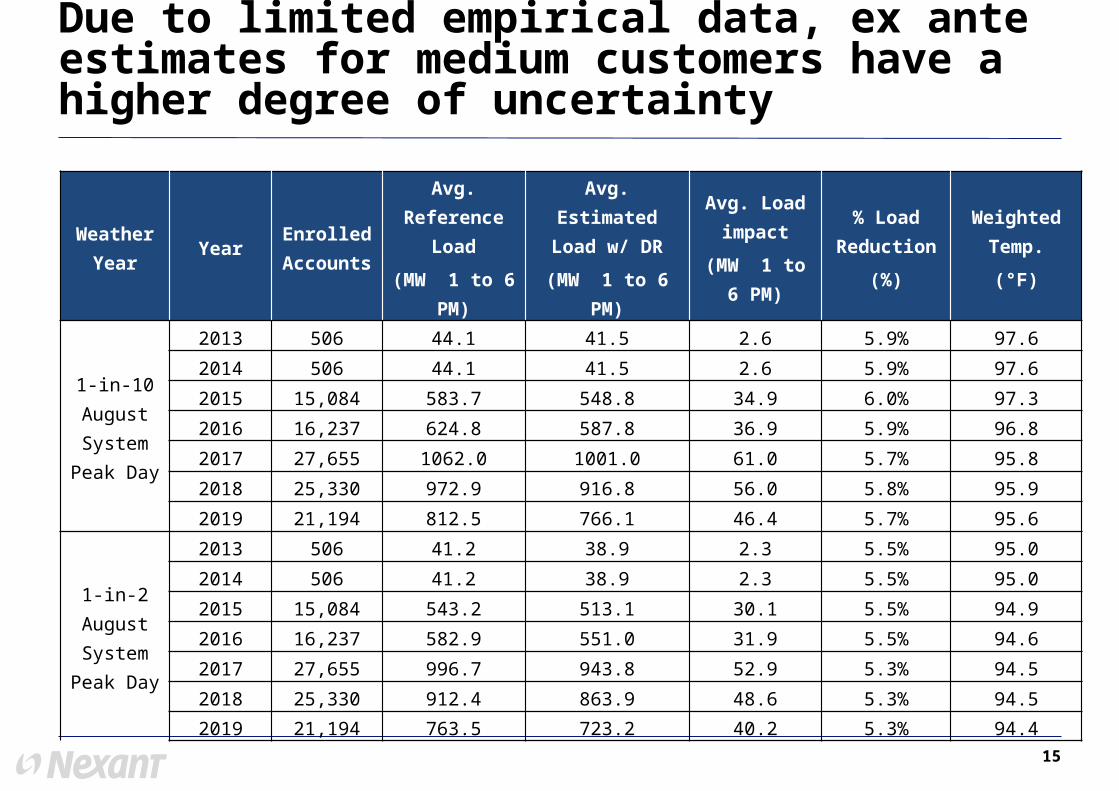
Weather Year Year Enrolled
Accounts
Avg. Reference Load
(MW 1 to 6 PM)
Avg. Estimated Load w/ DR
(MW 1 to 6 PM)
Avg. Load impact
(MW 1 to 6 PM)
% Load Reduction
(%)
Weighted Temp.
(°F)
1-in-10 August
System Peak Day
2013 506 44.1 41.5 2.6 5.9% 97.6
2014 506 44.1 41.5 2.6 5.9% 97.6
2015 15,084 583.7 548.8 34.9 6.0% 97.3
2016 16,237 624.8 587.8 36.9 5.9% 96.8
2017 27,655 1062.0 1001.0 61.0 5.7% 95.8
2018 25,330 972.9 916.8 56.0 5.8% 95.9
2019 21,194 812.5 766.1 46.4 5.7% 95.6
1-in-2 August
System Peak Day
2013 506 41.2 38.9 2.3 5.5% 95.0
2014 506 41.2 38.9 2.3 5.5% 95.0
2015 15,084 543.2 513.1 30.1 5.5% 94.9
2016 16,237 582.9 551.0 31.9 5.5% 94.6
2017 27,655 996.7 943.8 52.9 5.3% 94.5
2018 25,330 912.4 863.9 48.6 5.3% 94.52019 21,194 763.5 723.2 40.2 5.3% 94.4
Due to limited empirical data, ex ante estimates for medium customers have a higher degree of uncertainty
16
SCE Specific Results
17
SCE’s average load reduction was 5.8%, or 35.5 MW, across the 10 event days in Jul-Sep 2013
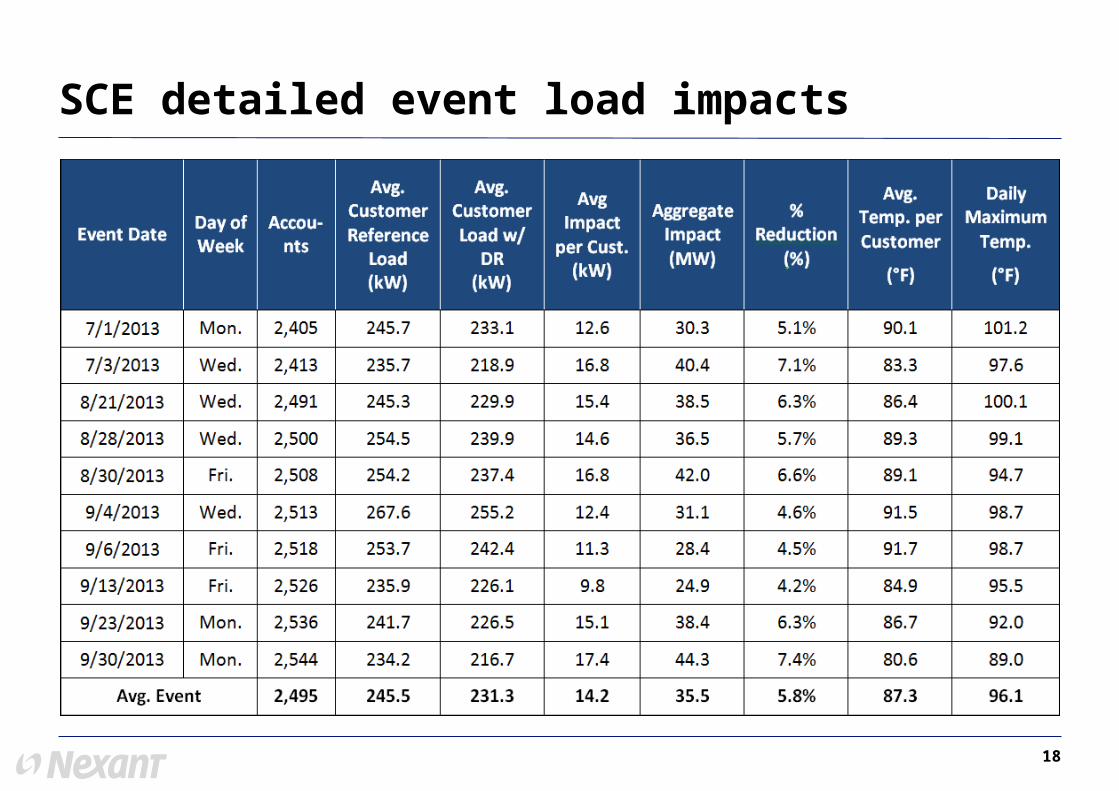
18
SCE detailed event load impacts
19
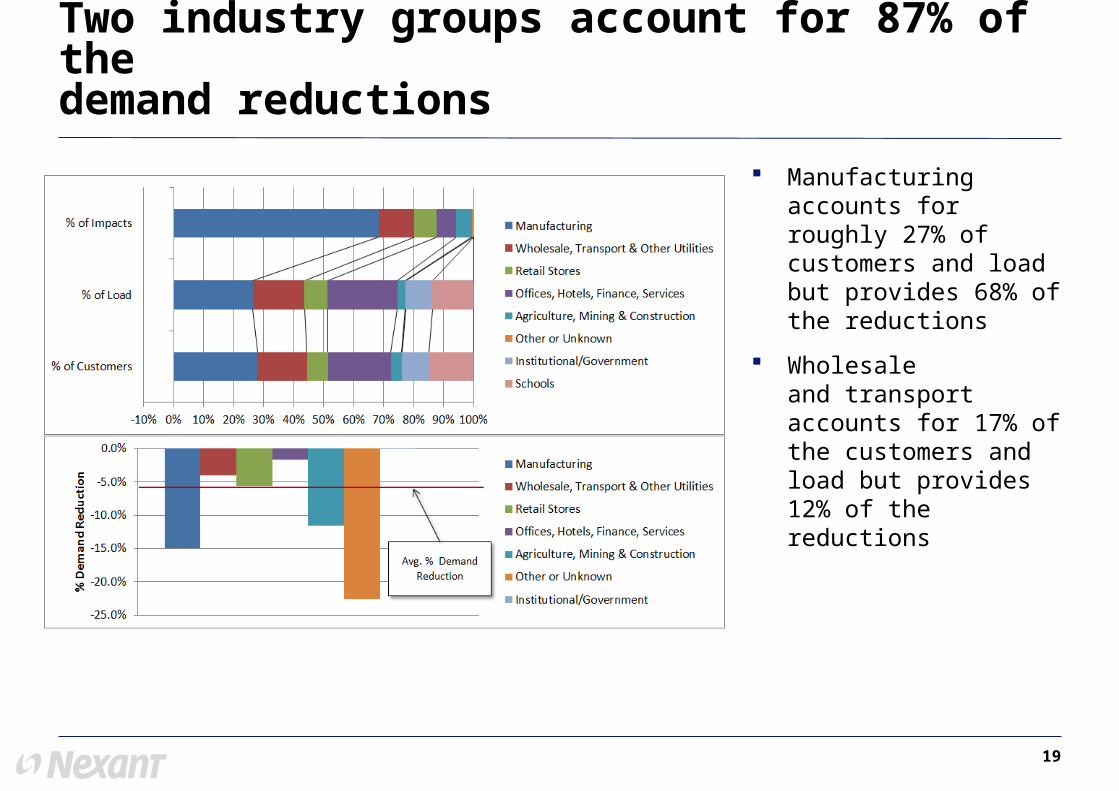
Manufacturing accounts for roughly 27% of customers and load but provides 68% of the reductions
Wholesale and transport accounts for 17% of the customers and load but provides 12% of the reductions
Two industry groups account for 87% of the demand reductions
20
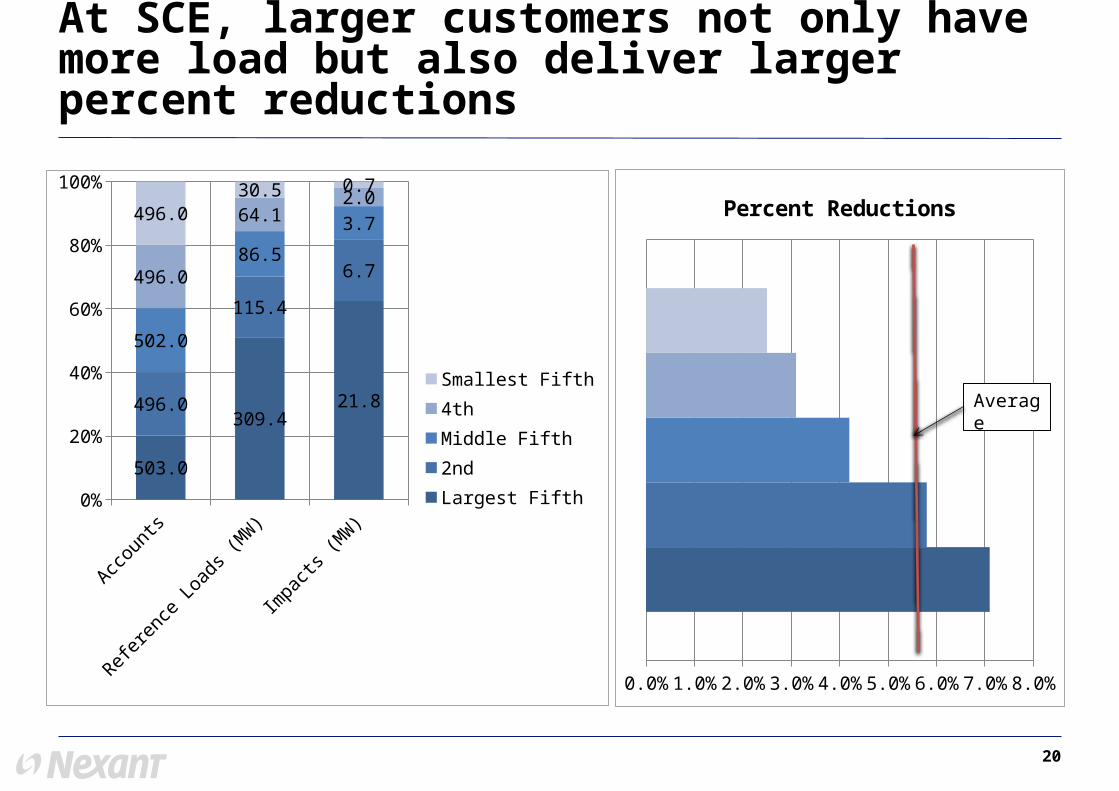
At SCE, larger customers not only have more load but also deliver larger percent reductions
Accounts Reference Loads (MW)
Impacts (MW)0%
20%
40%
60%
80%
100%
503.0
309.421.8496.0
115.4
6.7
502.0
86.5
3.7
496.0
64.12.0
496.0
30.5 0.7
Smallest Fifth4thMiddle Fifth2nd Largest Fifth
0.0% 1.0% 2.0% 3.0% 4.0% 5.0% 6.0% 7.0% 8.0%
Percent Reductions
Average
21
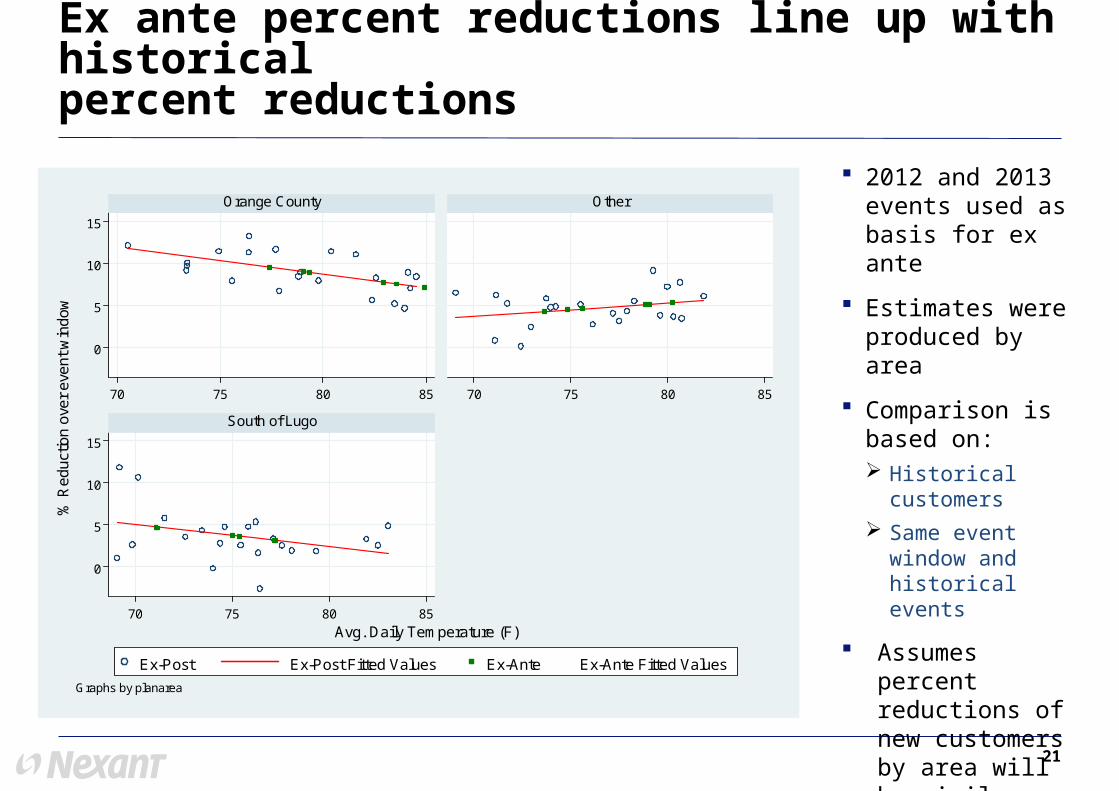
Ex ante percent reductions line up with historical percent reductions
2012 and 2013 events used as basis for ex ante
Estimates were produced by area
Comparison is based on: Historical
customers
Same event window and historical events
Assumes percent reductions of new customers by area will be similar
0
5
10
15
0
5
10
15
70 75 80 85 70 75 80 85
70 75 80 85
Orange County Other
South of Lugo
Ex-Post Ex-Post Fitted Values Ex-Ante Ex-Ante Fitted Values
% R
educ
tion
over
eve
nt w
indo
w
Avg. Daily Temperature (F)
Graphs by planarea
22
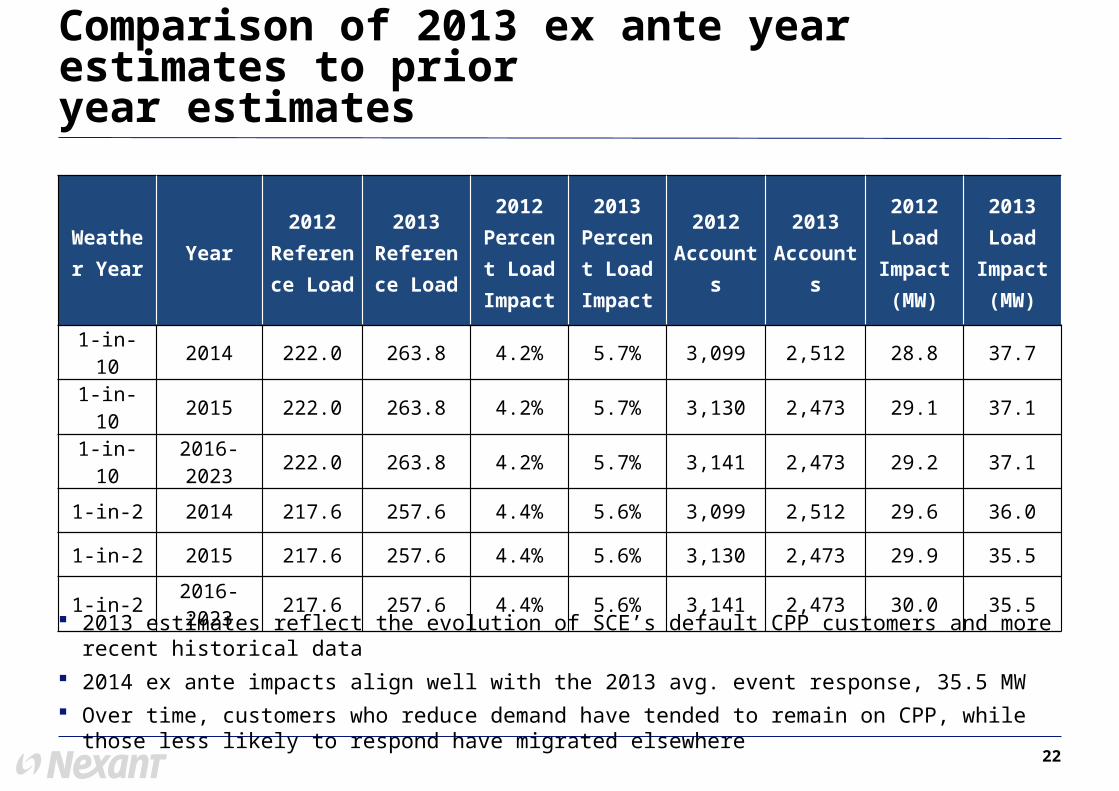
Comparison of 2013 ex ante year estimates to prior year estimates
2013 estimates reflect the evolution of SCE’s default CPP customers and more recent historical data
2014 ex ante impacts align well with the 2013 avg. event response, 35.5 MW
Over time, customers who reduce demand have tended to remain on CPP, while those less likely to respond have migrated elsewhere
Weather Year Year
2012 Reference
Load
2013 Reference
Load
2012 Percent
Load Impact
2013 Percent
Load Impact
2012 Accounts
2013 Accounts
2012 Load
Impact (MW)
2013 Load
Impact (MW)
1-in-10 2014 222.0 263.8 4.2% 5.7% 3,099 2,512 28.8 37.7
1-in-10 2015 222.0 263.8 4.2% 5.7% 3,130 2,473 29.1 37.1
1-in-10 2016-2023 222.0 263.8 4.2% 5.7% 3,141 2,473 29.2 37.1
1-in-2 2014 217.6 257.6 4.4% 5.6% 3,099 2,512 29.6 36.0
1-in-2 2015 217.6 257.6 4.4% 5.6% 3,130 2,473 29.9 35.5
1-in-2 2016-2023 217.6 257.6 4.4% 5.6% 3,141 2,473 30.0 35.5

23
SDG&E Specific Results
24
SDG&E’s average weekday load impact was 6.9%, 19.6 MW
25
SDG&E detailed event load impacts
26
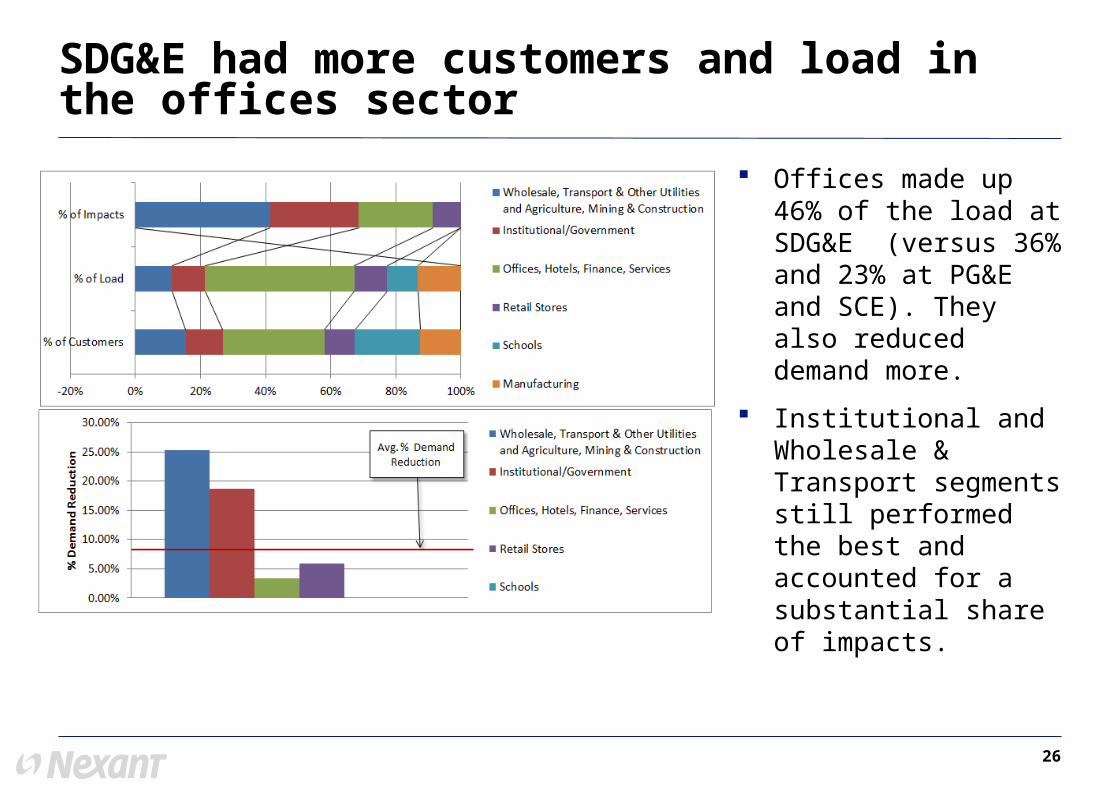
Offices made up 46% of the load at SDG&E (versus 36% and 23% at PG&E and SCE). They also reduced demand more.
Institutional and Wholesale & Transport segments still performed the best and accounted for a substantial share of impacts.
SDG&E had more customers and load in the offices sector
27
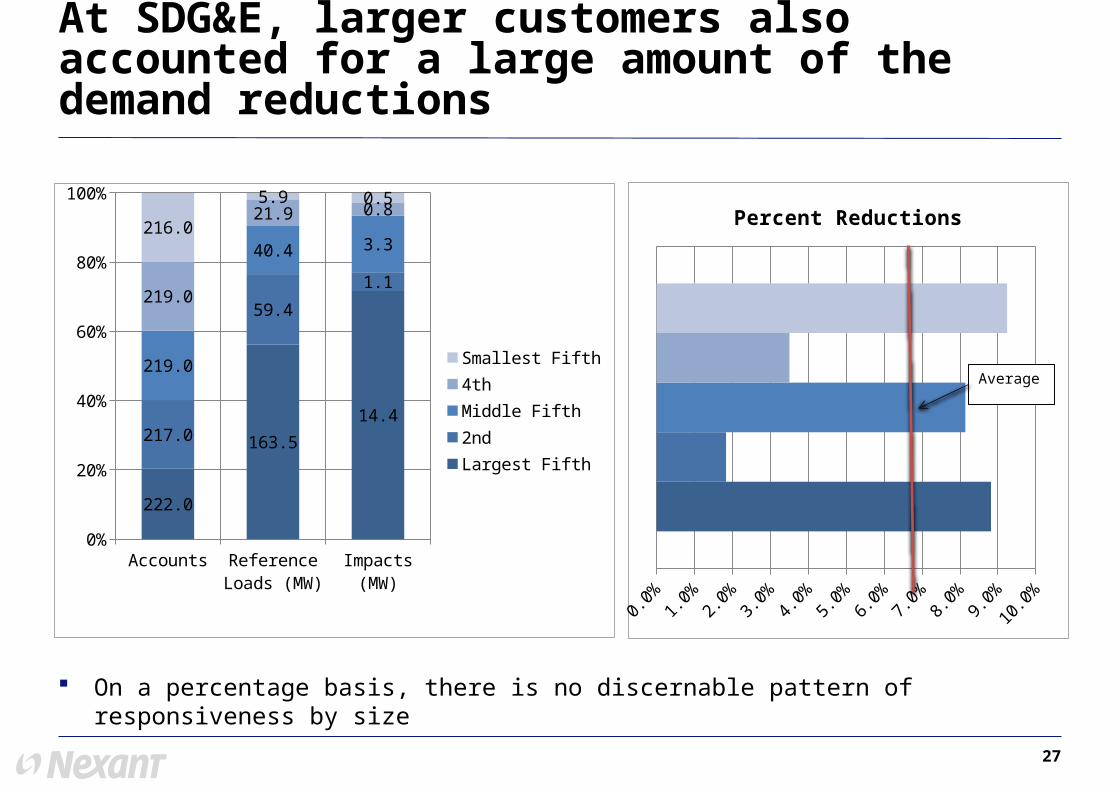
At SDG&E, larger customers also accounted for a large amount of the demand reductions
Accounts Reference Loads (MW)
Impacts (MW)0%
20%
40%
60%
80%
100%
222.0
163.5
14.4217.0
59.4
1.1
219.0
40.4 3.3
219.0
21.9 0.8216.0
5.9 0.5
Smallest Fifth4thMiddle Fifth2nd Largest Fifth
0.0% 1.0% 2.0% 3.0% 4.0% 5.0% 6.0% 7.0% 8.0% 9.0%10.0%
Percent Reductions
Average
On a percentage basis, there is no discernable pattern of responsiveness by size
28
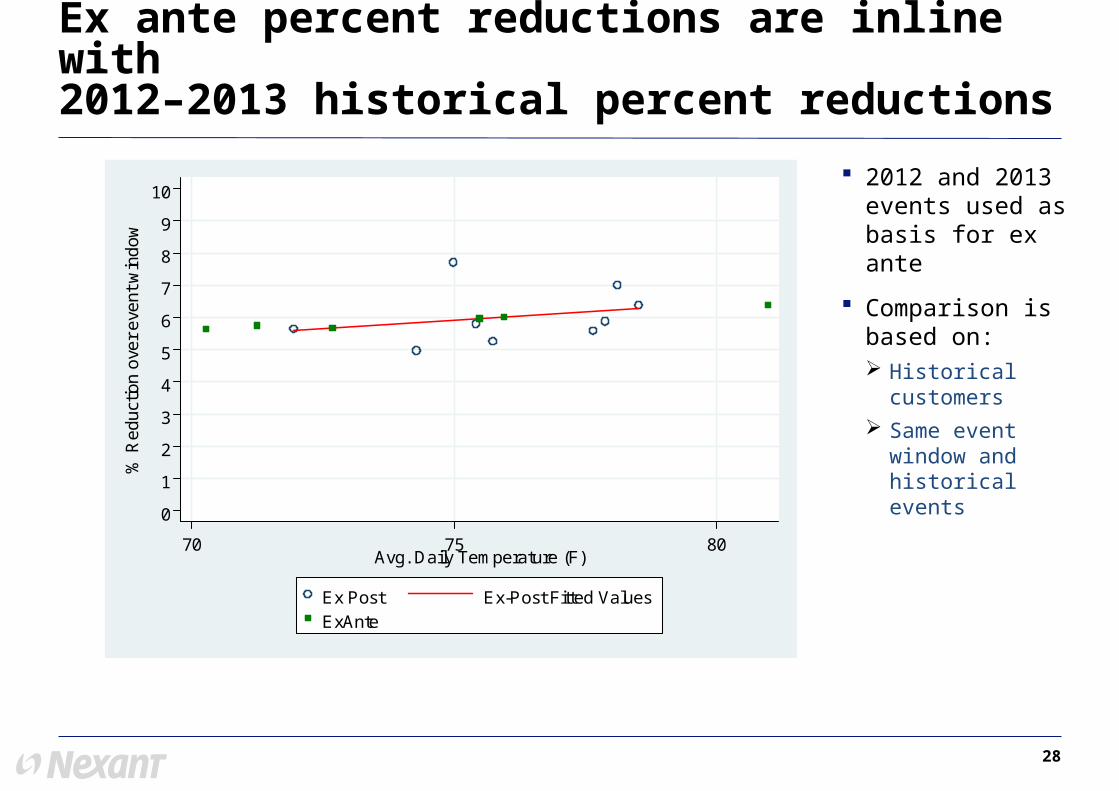
Ex ante percent reductions are inline with 2012–2013 historical percent reductions
2012 and 2013 events used as basis for ex ante
Comparison is based on: Historical
customers
Same event window and historical events
0
1
2
3
4
5
6
7
8
9
10
% R
ed
uct
ion
ove
r e
ven
t w
ind
ow
70 75 80Avg. Daily Temperature (F)
Ex Post Ex-Post Fitted ValuesExAnte
29
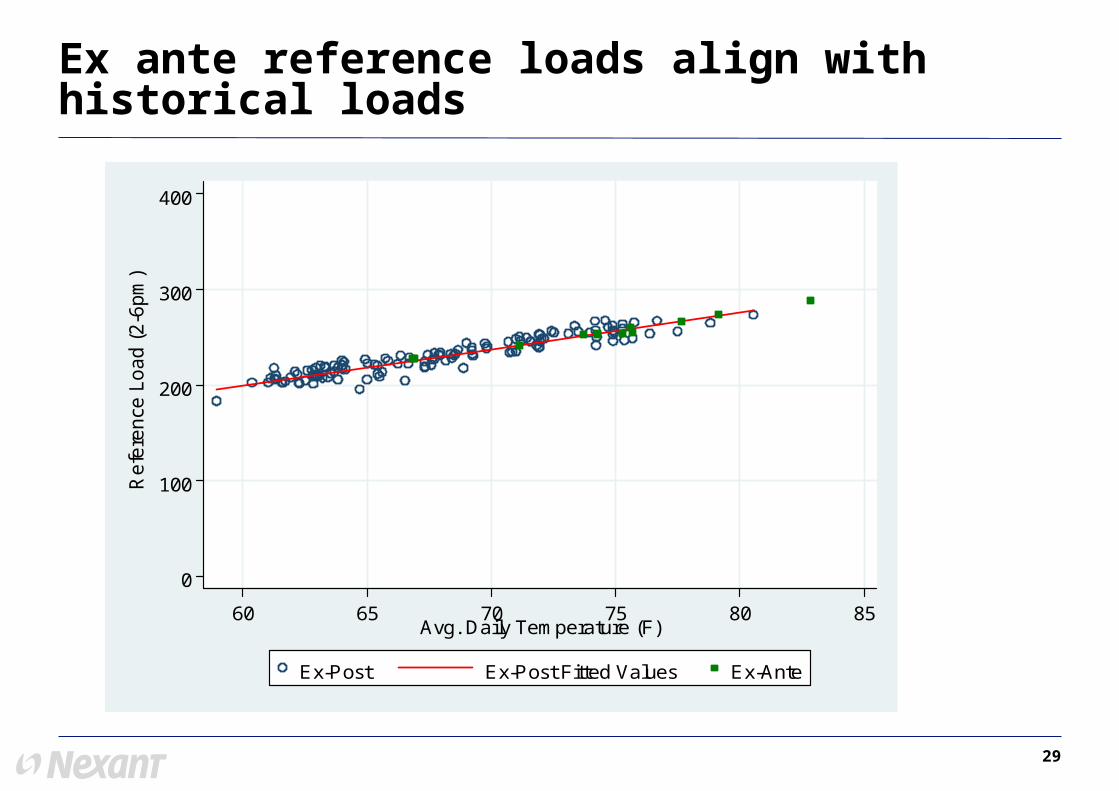
Ex ante reference loads align with historical loads
0
100
200
300
400
Re
fere
nce
Lo
ad
(2
-6p
m)
60 65 70 75 80 85Avg. Daily Temperature (F)
Ex-Post Ex-Post Fitted Values Ex-Ante
30
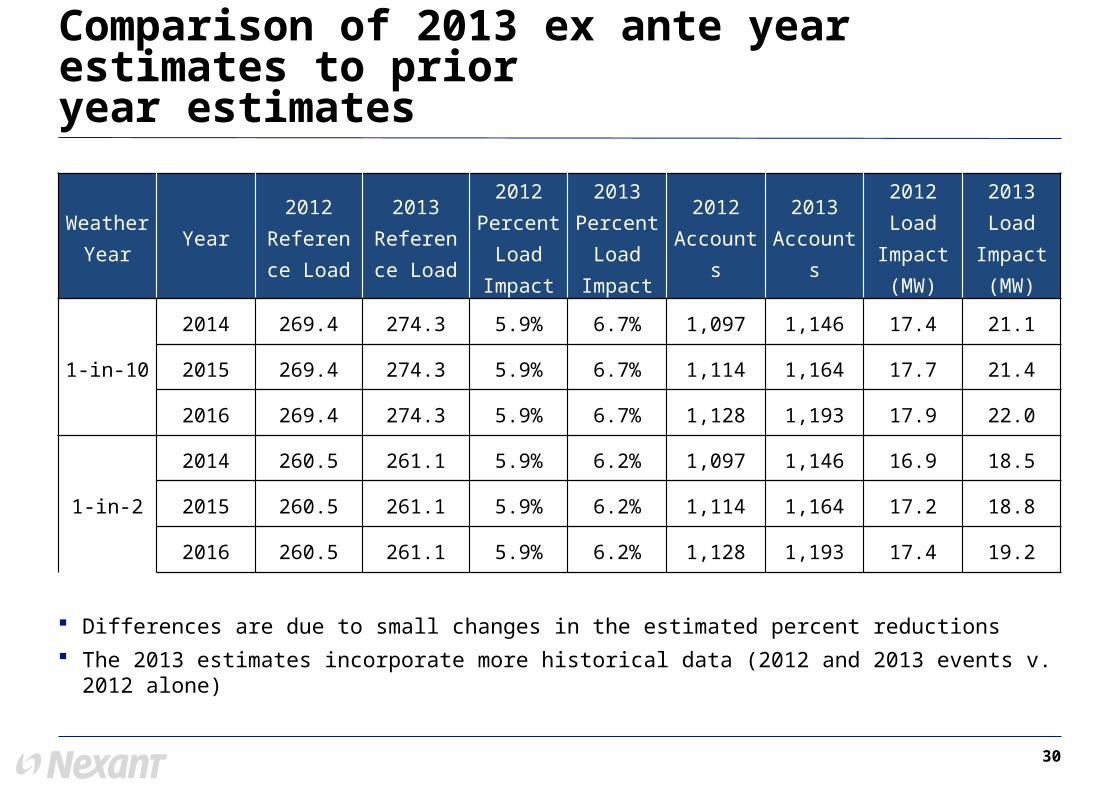
Comparison of 2013 ex ante year estimates to prior year estimates
Differences are due to small changes in the estimated percent reductions
The 2013 estimates incorporate more historical data (2012 and 2013 events v. 2012 alone)
Weather Year Year
2012 Reference
Load
2013 Reference
Load
2012 Percent
Load Impact
2013 Percent
Load Impact
2012 Accounts
2013 Accounts
2012 Load Impact (MW)
2013 Load Impact (MW)
1-in-10
2014 269.4 274.3 5.9% 6.7% 1,097 1,146 17.4 21.1
2015 269.4 274.3 5.9% 6.7% 1,114 1,164 17.7 21.4
2016 269.4 274.3 5.9% 6.7% 1,128 1,193 17.9 22.0
1-in-2
2014 260.5 261.1 5.9% 6.2% 1,097 1,146 16.9 18.5
2015 260.5 261.1 5.9% 6.2% 1,114 1,164 17.2 18.8
2016 260.5 261.1 5.9% 6.2% 1,128 1,193 17.4 19.2
31
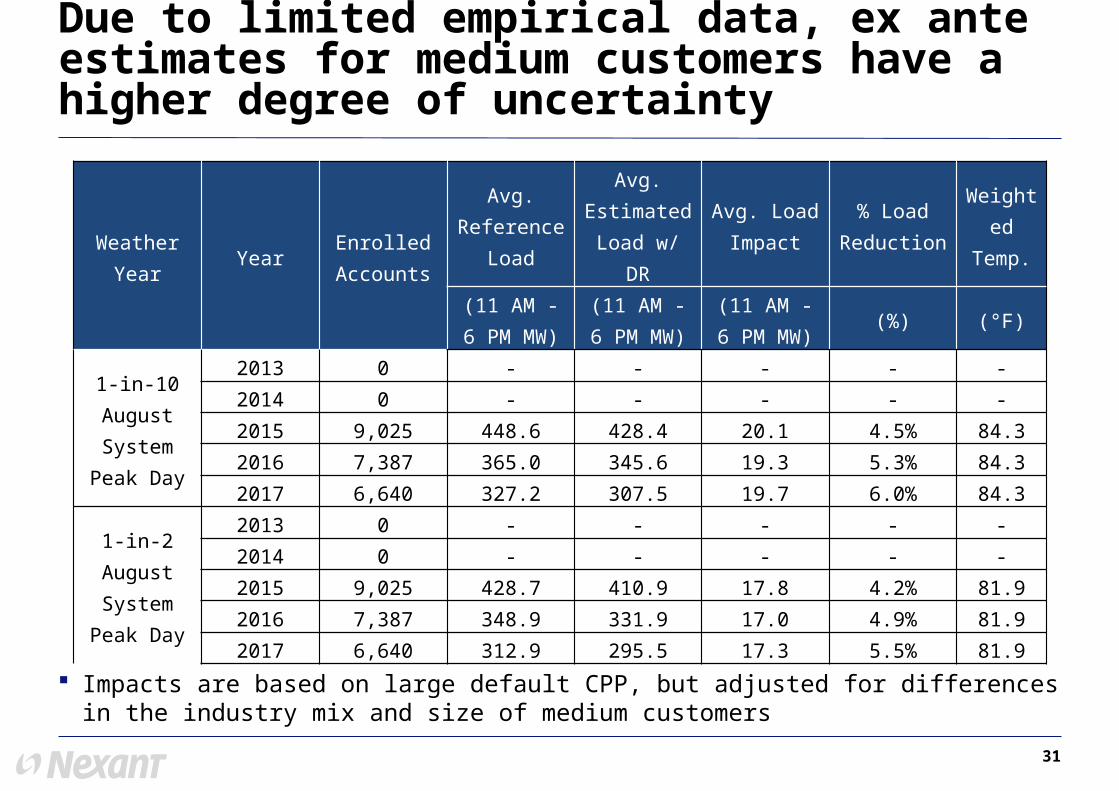
Due to limited empirical data, ex ante estimates for medium customers have a higher degree of uncertainty
Weather Year Year Enrolled Accounts
Avg. Reference
Load
Avg. Estimated
Load w/ DR
Avg. Load Impact
% Load Reduction
Weighted Temp.
(11 AM - 6 PM MW)
(11 AM - 6 PM MW)
(11 AM - 6 PM MW) (%) (°F)
1-in-10 August
System Peak Day
2013 0 - - - - -2014 0 - - - - -2015 9,025 448.6 428.4 20.1 4.5% 84.32016 7,387 365.0 345.6 19.3 5.3% 84.32017 6,640 327.2 307.5 19.7 6.0% 84.3
1-in-2 August System Peak
Day
2013 0 - - - - -2014 0 - - - - -2015 9,025 428.7 410.9 17.8 4.2% 81.92016 7,387 348.9 331.9 17.0 4.9% 81.92017 6,640 312.9 295.5 17.3 5.5% 81.9
Impacts are based on large default CPP, but adjusted for differences in the industry mix and size of medium customers

For comments or questions, contact:
Josh L. Bode, M.P.P.
Candice A. Churchwell, M.S.
Nexant, Inc.101 Montgomery St., 15th Floor
San Francisco, CA 94104415-777-0707

33
Appendix Evaluation Methodology
and Validation
34
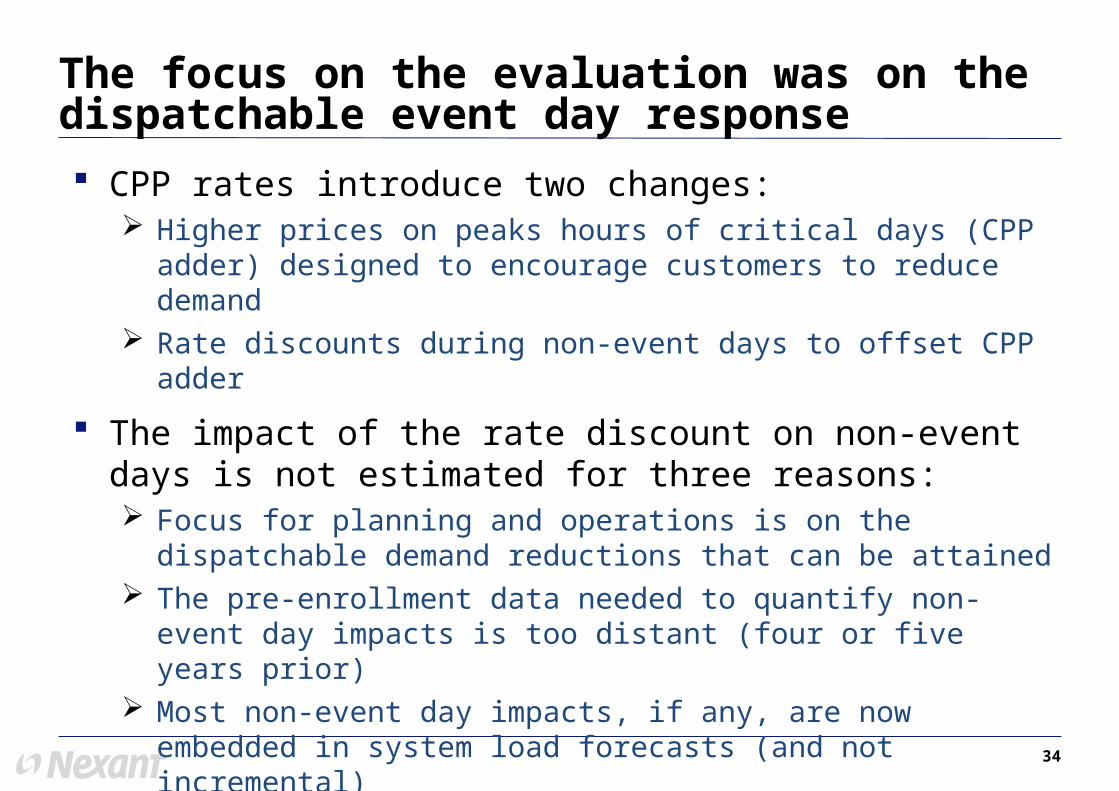
CPP rates introduce two changes: Higher prices on peaks hours of critical days (CPP adder) designed to
encourage customers to reduce demand Rate discounts during non-event days to offset CPP adder
The impact of the rate discount on non-event days is not estimated for three reasons: Focus for planning and operations is on the dispatchable demand
reductions that can be attained The pre-enrollment data needed to quantify non-event day impacts is
too distant (four or five years prior) Most non-event day impacts, if any, are now embedded in system
load forecasts (and not incremental) Analyses in 2010 and 2011 did not find statistically significant impacts
due to the rate discount
The focus on the evaluation was on the dispatchable event day response
35
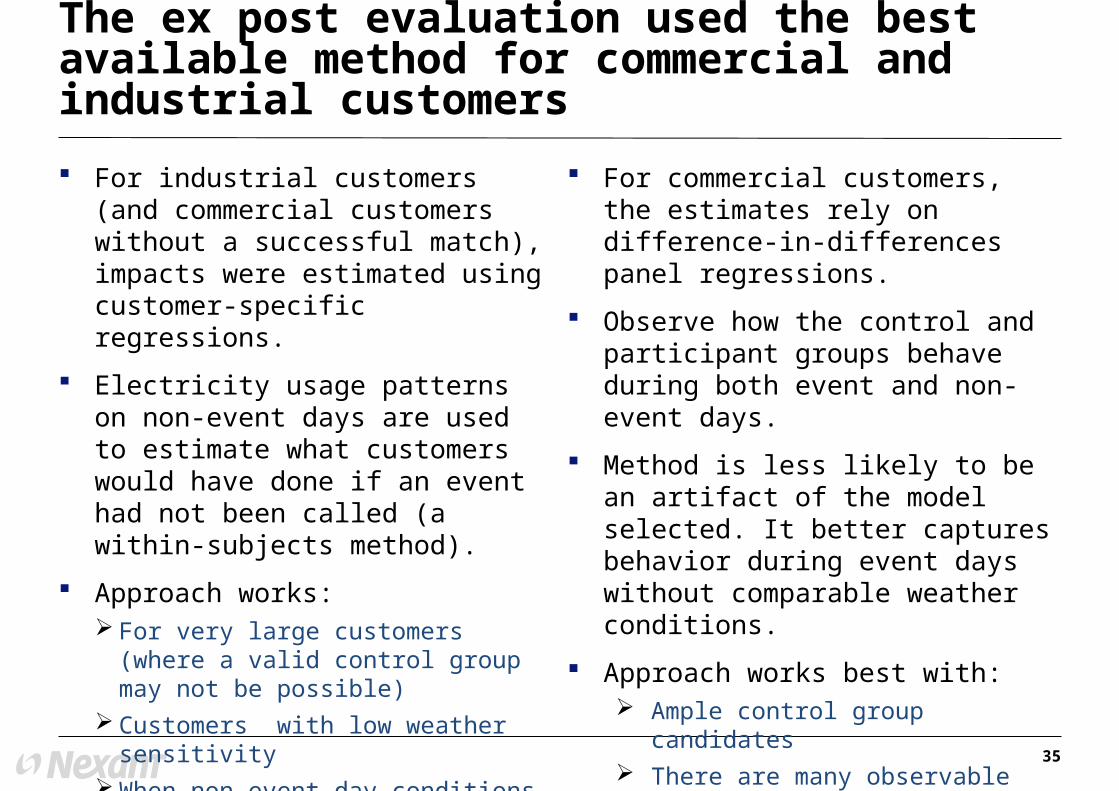
For industrial customers (and commercial customers without a successful match), impacts were estimated using customer-specific regressions.
Electricity usage patterns on non-event days are used to estimate what customers would have done if an event had not been called (a within-subjects method).
Approach works: For very large customers (where a valid
control group may not be possible) Customers with low weather sensitivity When non-event day conditions are
similar to event days (often not the case)
For commercial customers, the estimates rely on difference-in-differences panel regressions.
Observe how the control and participant groups behave during both event and non-event days.
Method is less likely to be an artifact of the model selected. It better captures behavior during event days without comparable weather conditions.
Approach works best with: Ample control group candidates There are many observable variables Non-event or pre-enrollment data A small number of customer does not
dominate the load and/or reductions
These use an external control group and non-event day data.
This approach was used for weather-sensitive commercial customers: institutional/governmental industries, offices, hotels, finance, services, and retail stores.
This approach was used for less weather-sensitive industrial customers, and for those commercial customers that could not be matched with a suitable control customer.
The ex post evaluation used the best available method for commercial and industrial customers
36
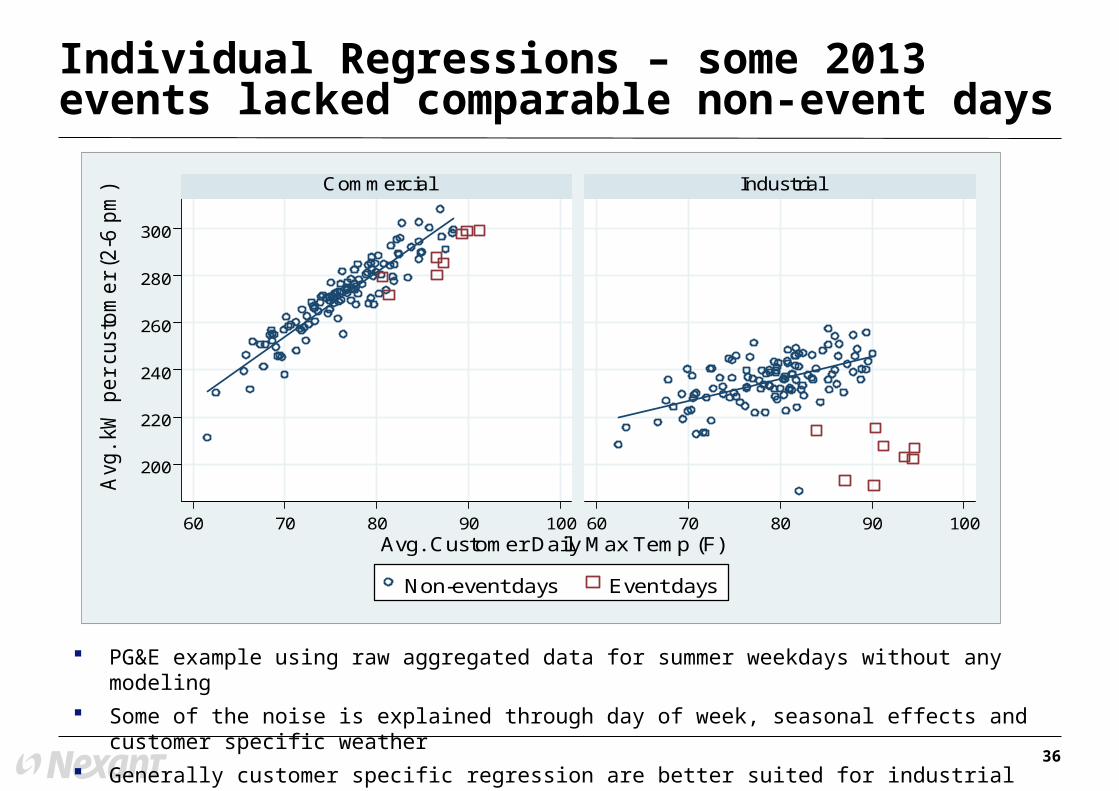
PG&E example using raw aggregated data for summer weekdays without any modeling
Some of the noise is explained through day of week, seasonal effects and customer specific weather
Generally customer specific regression are better suited for industrial customers
Individual Regressions – some 2013 events lacked comparable non-event days
200
220
240
260
280
300
60 70 80 90 100 60 70 80 90 100
Commercial Industrial
Non-event days Event days
Avg
. kW
pe
r cu
sto
me
r (2
-6 p
m)
Avg. Customer Daily Max Temp (F)
37
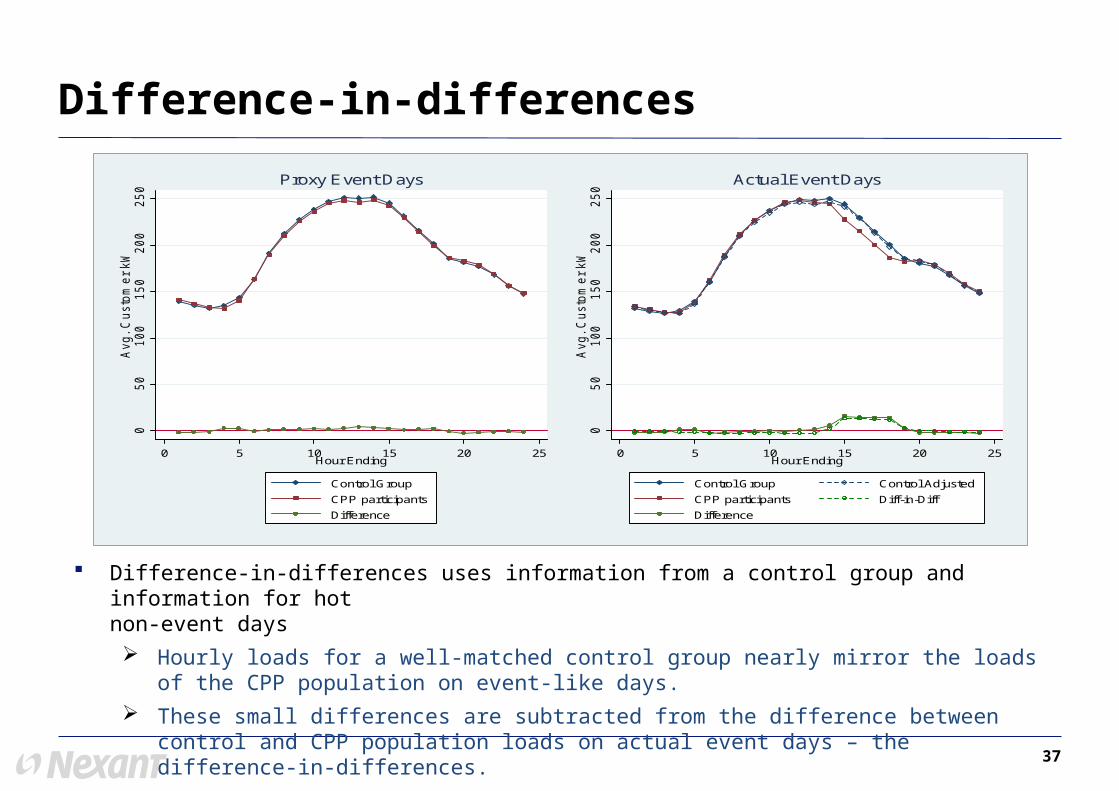
Difference-in-differences
Difference-in-differences uses information from a control group and information for hot non-event days
Hourly loads for a well-matched control group nearly mirror the loads of the CPP population on event-like days.
These small differences are subtracted from the difference between control and CPP population loads on actual event days – the difference-in-differences.
05
01
00
150
200
250
Avg
. C
usto
me
r kW
0 5 10 15 20 25Hour Ending
Control Group
CPP participants
Difference
Proxy Event Days
05
01
00
150
200
250
Avg
. C
usto
me
r kW
0 5 10 15 20 25Hour Ending
Control Group
CPP participants
Difference
Control Adjusted
Diff-in-Diff
Actual Event Days
38
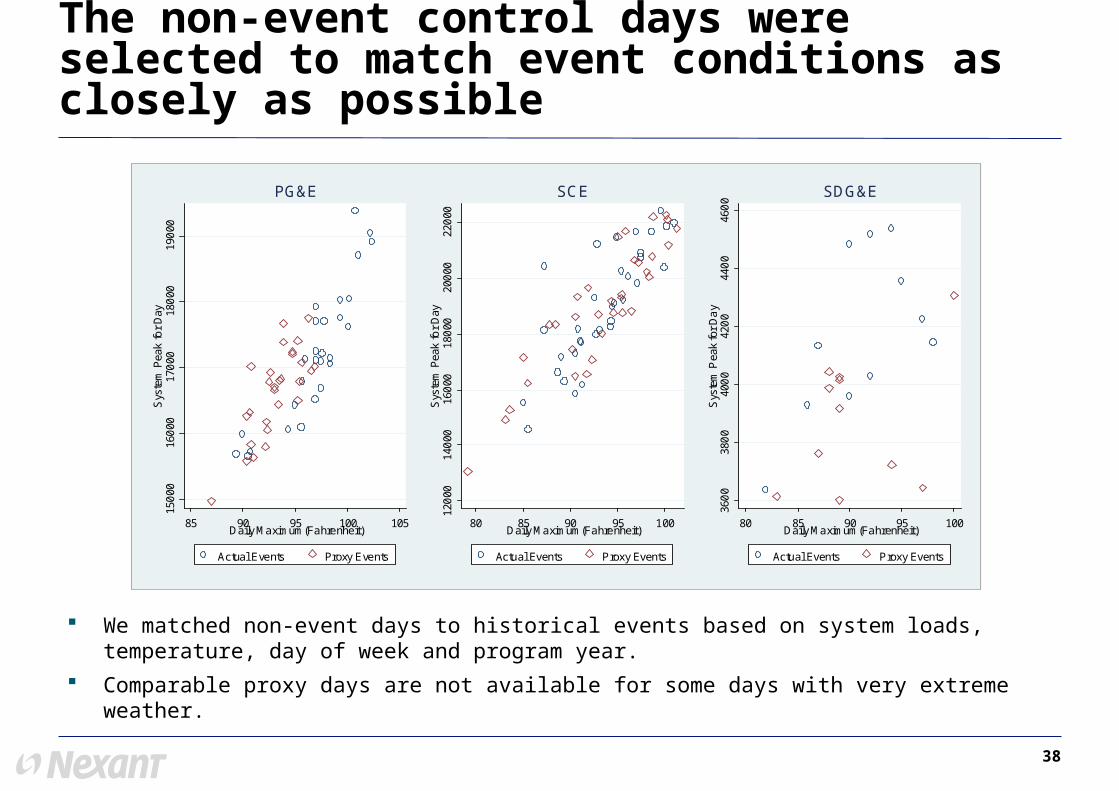
The non-event control days were selected to match event conditions as closely as possible
We matched non-event days to historical events based on system loads, temperature, day of week and program year.
Comparable proxy days are not available for some days with very extreme weather.
150
0016
000
170
0018
000
190
00S
yste
m P
eak
for
Day
85 90 95 100 105Daily Maximum(Fahrenheit)
Actual Events Proxy Events
PG&E
120
0014
000
160
0018
000
200
0022
000
Sys
tem
Pea
k fo
r D
ay
80 85 90 95 100Daily Maximum(Fahrenheit)
Actual Events Proxy Events
SCE
360
038
00
400
042
00
440
046
00
Sys
tem
Pea
k fo
r D
ay
80 85 90 95 100Daily Maximum(Fahrenheit)
Actual Events Proxy Events
SDG&E
39
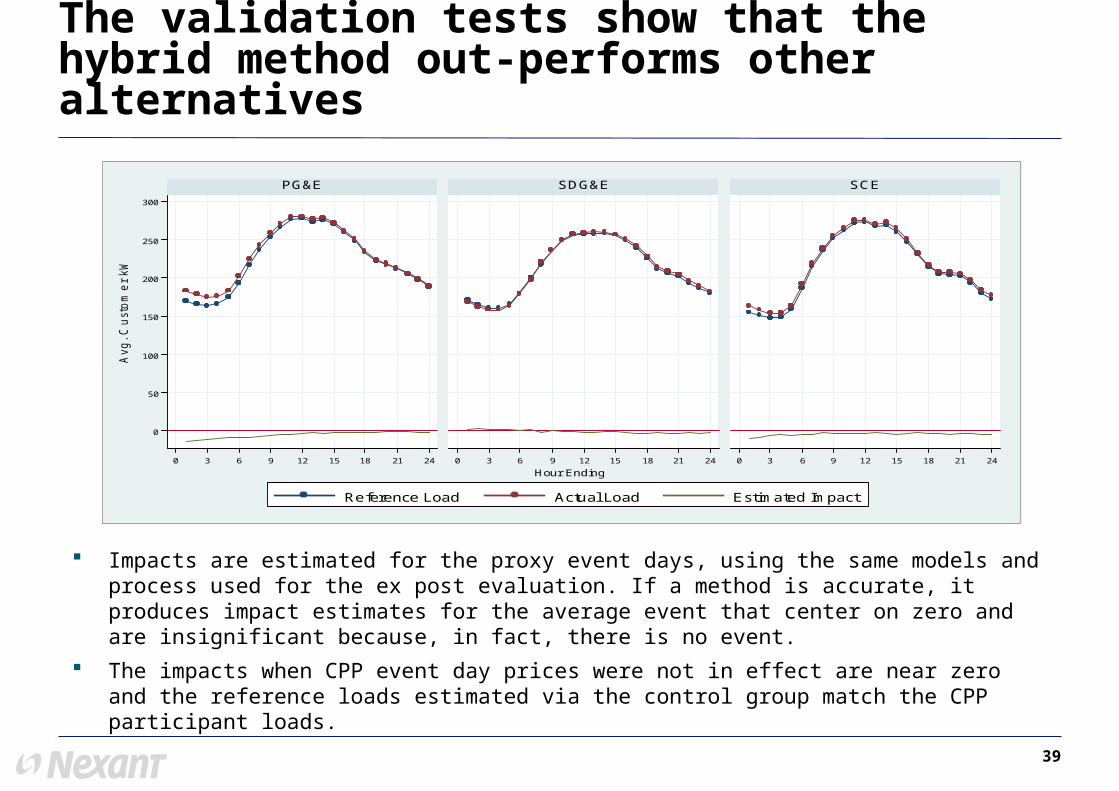
The validation tests show that the hybrid method out-performs other alternatives
Impacts are estimated for the proxy event days, using the same models and process used for the ex post evaluation. If a method is accurate, it produces impact estimates for the average event that center on zero and are insignificant because, in fact, there is no event.
The impacts when CPP event day prices were not in effect are near zero and the reference loads estimated via the control group match the CPP participant loads.
0
50
100
150
200
250
300
0 3 6 9 12 15 18 21 24 0 3 6 9 12 15 18 21 24 0 3 6 9 12 15 18 21 24
PG&E SDG&E SCE
Reference Load Actual Load Estimated Impact
Avg
. C
usto
me
r kW
Hour Ending