Embed Size (px)
Citation preview

KEWAUNEE®
…encouraging new discovery
2013ANNUAL REPORT

Corporate Profile Kewaunee Scientific Corporation is a recognized global leader in the design, manufacture, and installation of laboratory, healthcare, and technical furniture products. Laboratory furniture products include both steel and wood cabinetry, fume hoods, adaptable modular systems, moveable workstations, biological safety cabinets, and epoxy resin counters and sinks. Healthcare furniture products include laminate casework, storage systems, and related products for healthcare applications. Technical furniture products include column systems, slotted-post systems, pedestal systems, and stand-alone benches. The Company's corporate headquarters are located in Statesville, North Carolina. Three manufacturing facilities are located in Statesville, NC serving the domestic and international markets. One manufacturing facility is located in Bangalore, India serving the local and Asian markets. The Company has subsidiaries in Singapore and India. Kewaunee Scientific Corporation’s website is located at http://www.kewaunee.com.

Dear Stockholder: July 18, 2013
Fiscal year 2013 was an excellent year, as we exceeded our sales and earnings goals and made excellent progress in many important areas. These included increasing sales and earnings, increasing market share, improving product mix, strengthening relationships with existing customers and key leading laboratory planners, strengthening the Kewaunee brand, and building relationships with new and prospective customers.
Sales for the year were a record $117,121,000, up 14% from sales of $102,847,000 in the prior year. Net earnings for the year were $3,044,000, or $1.17 per diluted share, up from net earnings of $1,031,000, or $0.40 per diluted share, in the prior year.
The order backlog was $80 million at April 30, 2013, as compared to $86 million at April 30, 2012. The decline reflects the manufacturing and shipping of a previously received large international order, which was partially offset by an increase during the year in domestic orders in the backlog.
We were particularly pleased with the improved performance of our domestic operations, which finished the year with very strong sales and profits in the fourth quarter. Sales for the year increased 11% to $93,519,000, and net earnings more than doubled from the prior year.
This was our first full fiscal year with our strengthened and expanded domestic dealer network in place, and we are pleased with the results of our entire sales network. In addition to contributing to the higher sales, we achieved our goals of increasing market share and improving our product mix. Regarding our domestic markets, activity for private sector laboratory construction projects held up well during the year, as increased activity for mid-sized projects more than offset fewer large projects. Publicly funded wood educational projects continued to be well below pre-recession levels, with fewer large project opportunities available during the year. Pricing remained very competitive in all of our market segments.
We were also pleased with the performance of our international operations, as sales increased 25% to $23,602,000, and net earnings increased 30% from the prior year. This follows very strong sales and earnings in the fourth quarter of the prior year when several very profitable large international projects were manufactured and shipped.
We continue to see good opportunities in the international markets, particularly in the growth markets of India, Singapore, China, and the Middle East. As an indication of our continuing commitment to capitalize on these opportunities, on June 24, 2013, we acquired the 49% minority stake in Kewaunee Labway Asia Pte. Ltd. Through its sales organizations in Singapore and India, Kewaunee Labway Asia has served as Kewaunee’s international headquarters for sales and installation of laboratory furniture products and fume hoods since the company was formed in 1998 as a joint venture with the minority partner. This purchase provides Kewaunee a sound foundation for further growth in the international markets. The purchase is expected to be accretive to earnings beginning in fiscal year 2014.
The significant cost savings initiatives implemented in Statesville in fiscal year 2012, as well as other continuing initiatives, are making Kewaunee a leaner, more cost-effective company. Operating expenses for the year declined to 14.5% of sales, down from 16% of sales in the prior year. If we had not incurred an increase in pension expense for the year related to our frozen pension plans, operating expenses would have declined to 14.1% of sales. These initiatives are also reducing our product costs and making us more competitive in the marketplace.

The Company’s balance sheet and financial condition remain strong. Cash on hand at the end of the year was $6.5 million and working capital was $25.1 million. Short term borrowings under the Company’s revolving credit facility were $6.7 million and term debt outstanding was $3.5 million. The debt-to-equity ratio at year end was .33-to-1.
In early May 2013, we changed our corporate banking relationship and moved to a larger credit facility that provides us increased limits and flexibility to better handle our projected future cash needs. The new facility provides for a 3-year revolving credit facility that allows outstanding advances of up to $20 million, as compared to the previous limit of $15 million, and new 7-year term debt of $5 million, which replaced our existing $3.5 million outstanding term debt.
We continue to increase our interaction and communications with customers and dealers to better understand their needs. Representatives from these groups are regularly on site in Statesville for meetings, presentations, and training for our products. We are continually searching for new ways to better serve them as evidenced by the recent reorganization of our customer service and project management departments. We also work closely with key leading laboratory planners for domestic and international projects to better understand their needs and desired products. We were successful in becoming their preferred solution for laboratory furniture, fume hoods, worktops, and all related products.
Board ChangesSince last year’s shareholders’ meeting, we have had one outside member resign and one new outside member join our Board. In January 2013, Patrick L. McCrory resigned from the Kewaunee Board when he was sworn in as Governor of North Carolina. Since joining our Board in May 2009, he served the Company well, as he shared unique insights and perspective obtained through his career in the private sector and as a seven-term mayor of Charlotte. We all wish Governor McCrory the very best in his new role.
We are delighted to have Donald F. Shaw join our Board on June 1, 2013. Don’s wealth of knowledge in the construction industry and his leadership experience as chief executive officer of ISEC, Inc., a highly successful high-end commercial interior subcontractor, make him an extremely valuable addition to our Board.
Management ChangesAs previously announced, I retired on June 30, 2013, after nearly 20 years of service with the Company, including the last 13 years as Chief Executive Officer. I will remain as a non-executive Chairman of the Board. It has been a privilege to lead this great company over this period and see it transition into the position of being the global leader in the design, manufacture, and installation of laboratory furniture products and fume hoods.
Following a succession planning process lasting more than two years, the Board appointed David to take on the additional role of Chief Executive Officer and become a member of our Board of Directors, both effective July 1, 2013. David was appointed President and Chief Operating Officer in March 2012. Your Board feels he is an excellent choice to succeed me based on his demonstrated leadership abilities, his deep knowledge of the laboratory furniture industry, and his 19 years of experience in various leadership roles with the Company.

OutlookWe are excited about the outlook for Kewaunee’s growth and profitability over the coming years, as we continue to see many opportunities for increased sales and earnings.
On the domestic front, our strengthened and expanded dealer network continues to position us well for increased sales opportunities and orders. Enhanced relationships with customers and key lab planners have made us the preferred supplier for laboratory furniture, fume hoods, worktops, and related products. Our new products, including bio-safety cabinets, safety storage cabinets, and laminate furniture products, are providing added exposure for Kewaunee in our markets. Our lower operating costs continue to make us more competitive in the marketplace.
On the international front, our strengthened and broadened dealer network has positioned us to take advantage of the growing number of project opportunities in Asia and the Middle East. We have successfully completed several large projects in the Middle East, and we believe Kewaunee is now the preferred supplier of laboratory furniture and fume hoods in this part of the world. Our recent buyout of the minority holder in our international sales subsidiary in Singapore provides us opportunities to further expand our efforts and earnings in the international marketplace.
Over the past year, we reached our goal set last year of being the global leader in the design, manufacture, and installation of laboratory, healthcare, and technical furniture products, and we will continue to diligently work to earn and retain this recognition. We could not have achieved this recognition without the support of our dealers, direct sales representatives, and our national stocking distributor, as well as the hard work and dedication of all of our Associates. To all of you, we thank you for your many contributions. We also would like to thank our stockholders for your continuing support and our Board of Directors for their wise counsel.
As we move forward, our priorities remain to provide our stockholders with a good return on their investment, customers with the best quality service and products, and our Associates with rewarding jobs and opportunities for advancement.
Sincerely,
William A. Shumaker David M. Rausch Chairman of the Board President,
Chief Executive Officer
See page 5 of this Annual Report for a discussion of factors that could significantly impact results or achievements expressed or implied by forward-looking statements made in this letter.

[THIS PAGE INTENTIONALLY LEFT BLANK.]

UNITED STATESSECURITIES AND EXCHANGE COMMISSION
WASHINGTON, D.C. 20549
FORM 10-KÈ ANNUAL REPORT PURSUANT TO SECTION 13 OR 15(d) OF THE SECURITIES EXCHANGE ACT OF
1934For the fiscal year ended April 30, 2013 or
‘ TRANSITION REPORT PURSUANT TO SECTION 13 OR 15(d) OF THE SECURITIES EXCHANGEACT OF 1934For the transition period from to
Commission file number 0-5286
KEWAUNEE SCIENTIFIC CORPORATION(Exact name of registrant as specified in its charter)
Delaware 38-0715562(State or other jurisdiction of
incorporation or organization)(IRS Employer
Identification No.)
2700 West Front StreetStatesville, North Carolina 28677-2927
(Address of principal executive offices) (Zip Code)
Registrant’s telephone number, including area code: (704) 873-7202Securities registered pursuant to Section 12(b) of the Act:
Title of Each Class Name of Exchange on which registered
Common Stock $2.50 par value NASDAQ Global Market
Securities registered pursuant to Section 12(g) of the Act: None
Indicate by check mark if the registrant is a well-known seasoned issuer, as defined in Rule 405 of the Securities Act. Yes ‘ No È
Indicate by check mark if the registrant is not required to file reports pursuant to Section 13 or Section 15(d) of the Act. Yes ‘ No È
Indicate by check mark whether the registrant (1) has filed all reports required to be filed by Section 13 or 15(d) of the Securities Exchange Act of1934 during the preceding 12 months (or for such shorter period that the registrant was required to file such reports), and (2) has been subject to suchfiling requirements for the past 90 days. Yes È No ‘
Indicate by check mark whether the registrant has submitted electronically and posted on its corporate Web site, if any, every Interactive Data Filerequired to be submitted and posted pursuant to Rule 405 of Regulation S-T (§ 232.405 of this chapter) during the preceding 12 months (or for suchshorter period that the registrant was required to submit and post such files). Yes È No ‘
Indicate by check mark if disclosure of delinquent filers pursuant to Item 405 of Regulation S-K (§ 229.405) is not contained herein, and will not becontained, to the best of registrant’s knowledge, in definitive proxy or information statements incorporated by reference in Part III of this Form 10-Kor any amendment to this Form 10-K. È
Indicate by check mark whether the registrant is a large accelerated filer, an accelerated filer, a non-accelerated filer, or a smaller reporting company.See the definitions of “large accelerated filer,” “accelerated filer” and “smaller reporting company” in Rule 12b-2 of the Exchange Act: (Check one):
Large accelerated filer ‘ Accelerated filer ‘ Non-accelerated filer ‘ Smaller reporting company È
(Do not check if a smaller reporting company)
Indicate by check mark whether the registrant is a shell company (as defined by Rule 12b-2 of the Act). Yes ‘ No È
The aggregate market value of shares of voting stock held by non-affiliates of the registrant was approximately $23,760,686 based on the lastreported sale price of the registrant’s Common Stock on October 31, 2012, the last business day of the registrant’s most recently completed secondfiscal quarter. Only shares beneficially owned by directors of the registrant (excluding shares subject to options) and each person owning more than10% of the outstanding Common Stock of the registrant were excluded in that such persons may be deemed to be affiliates. This determination ofaffiliate status is not necessarily a conclusive determination for other purposes.
As of July 15, 2013, the registrant had outstanding 2,598,784 shares of Common Stock.
DOCUMENTS INCORPORATED BY REFERENCE: Those portions of the Company’s proxy statement for use in connection with KewauneeScientific Corporation’s annual meeting of stockholders to be held on August 28, 2013, indicated in this report are incorporated by reference intoPart III hereof.

Table of Contents Page or Reference
PART I
Item 1. Business 3
Item 1A. Risk Factors 5
Item 2. Properties 6
Item 3. Legal Proceedings 6
Item 4. Mine Safety Disclosures 6
PART II
Item 5. Market for Registrant’s Common Equity, Related Stockholder Matters and Issuer Purchasesof Equity Securities 7
Item 6. Selected Financial Data 8
Item 7. Management’s Discussion and Analysis of Financial Condition and Results of Operations 9
Item 7A. Quantitative and Qualitative Disclosures About Market Risk 13
Item 8. Financial Statements and Supplementary Data 13
Item 9. Changes in and Disagreements with Accountants on Accounting and Financial Disclosure 35
Item 9A. Controls and Procedures 35
Item 9B. Other Information 35
PART III
Item 10. Directors, Executive Officers and Corporate Governance 36
Item 11. Executive Compensation 37
Item 12. Security Ownership of Certain Beneficial Owners and Management and RelatedStockholder Matters 37
Item 13. Certain Relationships and Related Transactions, and Director Independence 37
Item 14. Principal Accountant Fees and Services 37
PART IV
Item 15. Exhibits and Financial Statement Schedules 38
SIGNATURES 39
EXHIBIT INDEX40
2

PART I
Item 1. Business
GENERAL
Kewaunee Scientific Corporation was founded in 1906, incorporated in Michigan in 1941, became publicly-held in1968, and was reincorporated in Delaware in 1970. Our principal business is the design, manufacture, and installation oflaboratory, healthcare, and technical furniture products. Laboratory furniture products include both steel and wood cabinetry, fumehoods, adaptable modular systems, moveable workstations, biological safety cabinets, and epoxy resin counters and sinks.Healthcare furniture products include laminate casework, storage systems, and related products for healthcare applications.Technical furniture products include column systems, slotted-post systems, pedestal systems, and stand-alone benches.
Our products are sold primarily through purchase orders and contracts submitted by customers through our dealers andcommissioned agents and a national distributor, as well as through competitive bids submitted by us and our subsidiaries in Indiaand Singapore. Products are sold principally to pharmaceutical, biotechnology, industrial, chemical and commercial researchlaboratories, educational institutions, healthcare institutions, governmental entities, manufacturing facilities and users ofnetworking furniture. We consider the markets in which we compete to be highly competitive, with a significant amount of thebusiness involving competitive public bidding.
It is common in the laboratory and healthcare furniture industries for customer orders to require delivery at extendedfuture dates, as products are frequently to be installed in buildings yet to be constructed. Changes or delays in building constructionmay cause delays in delivery of the orders and our recognition of the sale. Since prices are normally quoted on a firm basis in theindustry, we bear the burden of possible increases in labor and material costs between quotation of an order and delivery of theproduct. The impact of such possible increases is considered when determining the sales price.
Our need for working capital and our credit practices are comparable to those of other companies manufacturing,selling and installing similar products in similar markets. Since our products are used in building construction projects, in manycases payments for our products are received over longer periods of time than payments for many other types of manufacturedproducts, thus requiring increased working capital. In addition, payment terms associated with certain projects provide for aretention amount until completion of the project, thus also increasing required working capital. On average, payments for ourproducts are received during the quarter following shipment, with the exception of the retention amounts which are collected at thecompletion of the project.
The principal raw materials and products manufactured by others and used by us in our products are cold-rolled carbonand stainless steel, hardwood lumber and plywood, paint, chemicals, resins, hardware, plumbing and electrical fittings. Suchmaterials and products are purchased from multiple suppliers and are typically readily available.
We hold various patents and patent rights, but do not consider that our success or growth is dependent upon our patentsor patent rights. Our business is not dependent upon licenses, franchises, concessions, trademarks, royalty agreements, or laborcontracts.
Our business is not generally cyclical, although sales are sometimes lower during our third quarter because of slowerconstruction activity in certain areas of the country during the winter months. Our business is not dependent on any one or a fewcustomers; however, sales to our national distributor, VWR International, LLC, represented approximately 11%, 12% and 14% ofnet sales in each of fiscal years 2013, 2012 and 2011, respectively.
Our order backlog at April 30, 2013 was $80.2 million, as compared to $86.2 million at April 30, 2012 and $65.7million at April 30, 2011. All but $12.6 million of the backlog at April 30, 2013 was scheduled for shipment during fiscal year2014; however, it may reasonably be expected that delays in shipments will occur because of customer rescheduling or delay incompletion of projects which involve the installation of our products. Based on scheduled shipment dates and past experience, weestimate that more than 80 percent of our order backlog at April 30, 2013 will be shipped during fiscal year 2014.
SEGMENT INFORMATION
See Note 9 of the Notes to Consolidated Financial Statements included in Item 8 of this Annual Report on Form 10-Kfor information concerning our Domestic and International business segments.
3

COMPETITION
We consider the industries in which we compete to be highly competitive and believe that the principal competitivefactors are price, product performance, and customer service. A significant portion of our business is based upon competitivepublic bidding.
RESEARCH AND DEVELOPMENT
The amount spent and expensed by us during the fiscal year ended April 30, 2013 on research and developmentactivities related to new or redesigned products was $872,000. The amounts spent for similar purposes in the fiscal years endedApril 30, 2012 and 2011 were $941,000 and $1,181,000, respectively.
ENVIRONMENTAL COMPLIANCE
In the last three fiscal years, compliance with federal, state, or local provisions enacted or adopted regulating thedischarge of materials into the environment has had no material effect on us. There is no material capital expenditure anticipatedfor such purposes, and accordingly, such regulation is not expected to have a material effect on our earnings or competitiveposition.
EMPLOYEES
At April 30, 2013, we had 456 domestic and 131 international full-time employees.
OTHER INFORMATION
Our Internet address is www.kewaunee.com. We make available, free of charge through this web site, our annualreport to stockholders. Our Form 10-K and 10-Q financial reports may be obtained by stockholders by writing the Secretary of theCompany, Kewaunee Scientific Corporation, P.O. Box 1842, Statesville, NC 28687-1842. The public may also obtain informationon our reports, proxy, and information statements at the SEC Internet site www.sec.gov. The reference to our website does notconstitute incorporation by reference of any information contained at that site.
SAFE HARBOR STATEMENT UNDER THE PRIVATE SECURITIES LITIGATION REFORM ACT OF 1995
Certain statements included and referenced in this report, including Management’s Discussion and Analysis ofFinancial Condition and Results of Operations, constitute “forward-looking” statements within the meaning of the PrivateSecurities Litigation Reform Act of 1995 (the “Reform Act”). Such forward-looking statements involve known and unknown risks,uncertainties, and other factors that could significantly impact results or achievements expressed or implied by such forward-looking statements. These factors include, but are not limited to, economic, competitive, governmental and technological factorsaffecting our operations, markets, products, services and prices, as well as prices for certain raw materials and energy. Thecautionary statements made by us pursuant to the Reform Act herein and elsewhere should not be construed as exhaustive. Wecannot always predict what factors would cause actual results to differ materially from those indicated by the forward-lookingstatements. In addition, readers are urged to consider statements that include the terms “believes,” “belief,” “expects,” “plans,”“objectives,” “anticipates,” “intends” or the like to be uncertain and forward-looking.
EXECUTIVE OFFICERS OF THE REGISTRANT
Included in Part III, Item 10(b) of this Annual Report on Form 10-K.
4

Item 1A. Risk Factors
You should carefully consider the following risks before you decide to buy shares of our common stock. If any of thefollowing risks actually occur, our business, results of operations, or financial condition would likely suffer. In such case, thetrading price of our common stock would decline, and you may lose all or part of the money you paid to buy our stock.
This and other public reports may contain forward-looking statements based on current expectations, assumptions,estimates and projections about us and our industry. These forward-looking statements involve risks and uncertainties. Our actualresults could differ materially from those forward-looking statements as a result of many factors, as more fully described belowand elsewhere in our public reports. We do not undertake to update publicly any forward-looking statements for any reasons, evenif new information becomes available or other events occur in the future.
Disruptions in the financial markets have created uncertainty and deteriorating economic conditions may adversely affectour customers and our business.
The financial markets in the United States, Europe and Asia continue to be volatile. The tightening of credit infinancial markets, continuation or worsening of the current economic conditions, a prolonged global, national or regional economicrecession or other similar events could have a material adverse effect on the demand for our products and on our sales, pricing andprofitability. We are unable to predict the likely duration of these adverse economic conditions and the impact these events mayhave on our operations and the laboratory furniture industry in general.
If we fail to compete effectively, our revenue and profit margins could decline.
We face a variety of competition in all of the markets in which we participate. Competitive pricing, including pricecompetition or the introduction of new products, could have material adverse effects on our revenues and profit margins.
Our ability to compete effectively depends to a significant extent on the specification or approval of our products byarchitects, engineers, and customers. If a significant segment of those communities were to decide that the design, materials,manufacturing, testing, or quality control of our products is inferior to that of any of our competitors, our sales and profits would bematerially and adversely affected.
If we lose a large customer, our sales and profits would decline.
We have substantial sales to one large customer. That distributor accounted for approximately 11% of our net sales infiscal year 2013. Loss of all or a part of our sales to a large customer would have a material effect on our revenues and profits.
An increase in the price of raw materials and energy could negatively affect our sales and profits.
It is common in the laboratory and healthcare furniture industries for customers to require delivery at extended futuredates, as products are frequently to be installed in buildings yet to be constructed. Since prices are normally quoted on a firm basisin the industry, we bear the burden of possible increases in labor, material and energy costs between the quotation of an order andthe delivery of the products. Our principal raw materials are steel, including stainless steel, wood and epoxy resin. Numerousfactors beyond our control, such as general economic conditions, competition, worldwide demand, labor costs, energy costs, andimport duties and other trade restrictions, influence prices for our raw materials. We have not always been able, and in the futurewe might not be able, to increase our product prices in amounts that correspond to increases in costs of raw materials, withoutmaterially and adversely affecting our sales and profits. Where we are not able to increase our prices, increases in our raw materialcosts will adversely affect our profitability.
Our future growth may depend on our ability to penetrate new international markets.
International laws and regulations, construction customs, standards, techniques and methods differ from those in theUnited States. Significant challenges of conducting business in foreign countries include, among other factors, local acceptance ofour products, political instability, currency controls, changes in import and export regulations, changes in tariff and freight ratesand fluctuations in foreign exchange rates.
Events outside our control may affect our operating results.
We have little control over the timing of shipping customer orders, as customers’ required delivery dates are subject tochange by the customer. Construction delays and customer changes to product designs are among the factors that may delay the
5
start of manufacturing and shipments of orders. Shipments that we anticipate in one quarter may occur in another quarter, affectingboth quarters’ results. Weather conditions, such as unseasonably warm, cold, or wet weather, can also affect and sometimes delayprojects. Political and economic events can also affect our revenues. When sales do not meet our expectations, our operating resultswill be reduced for the relevant quarters.
Our principal markets are in the laboratory building construction industry. This industry is subject to significantvolatility due to various factors, none of which is within our control. Declines in construction activity or demand for our productscould materially and adversely affect our business and financial condition.
We depend on key management and technical personnel, the loss of whom could harm our business.
We depend on certain key management and technical personnel. The loss of one or more key employees maymaterially and adversely affect us. Our success also depends on our ability to attract and retain additional highly qualifiedtechnical, marketing, and management personnel necessary for the maintenance and expansion of our activities. We might not beable to attract or retain such personnel.
Our stock price is likely to be volatile and could drop.
The trading price of our Common Stock could be subject to wide fluctuations in response to quarter-to-quartervariation in operating results, announcement of technological innovations or new products by us or our competitors, generalconditions in the construction and construction materials industries, relatively low trading volume in our common stock and otherevents or factors. In addition, in recent years, the stock market has experienced extreme price fluctuations. This volatility has had asubstantial effect on the market prices of securities issued by many companies for reasons unrelated to the operating performanceof those companies. Securities market fluctuations may adversely affect the market price of our common stock.
We are subject to a number of significant risks that might cause our actual results to vary materially from our forecasts,targets, or projections, including:
• Failing to anticipate the need for, appropriately invest in and effectively manage the human, information technology andlogistical resources necessary to support our business, including managing the costs associated with such resources;
• Failing to generate sufficient future positive operating cash flows and, if necessary, secure adequate external financing to fundour growth; and
• Interruptions in service by common carriers that ship goods within our distribution channels.
Item 2. Properties
We own and operate three adjacent manufacturing facilities in Statesville, North Carolina. These facilities also houseour corporate offices, as well as sales and marketing, administration, engineering and drafting personnel. These facilities togethercomprise approximately 413,000 square feet and are located on approximately 20 acres of land. In addition, at April 30, 2013, weleased our primary distribution facility and other warehouse facilities totaling 220,000 square feet in Statesville, North Carolina. InBangalore, India we also lease and operate a manufacturing facility comprising 55,000 square feet, a warehouse facility comprising11,000 square feet and a facility comprising 7,000 square feet that houses sales and administrative offices. The Company’s realproperty and equipment located in Statesville, North Carolina are pledged as collateral for the Company’s term loan that isscheduled to mature on August 1, 2017. We believe our facilities are suitable for their respective uses and are adequate for ourcurrent needs.
Item 3. Legal Proceedings
From time to time, we are involved in disputes and litigation relating to claims arising out of our operations in theordinary course of business. Further, we are periodically subject to government audits and inspections. We believe that any suchmatters presently pending will not, individually or in the aggregate, have a material adverse effect on our results of operations orfinancial condition.
Item 4. Mine Safety Disclosures
Not Applicable.
6

PART II
Item 5. Market for Registrant’s Common Equity, Related Stockholder Matters and Issuer Purchases of Equity Securities
Our common stock is traded on the NASDAQ Global Market, under the symbol KEQU. The following table sets forththe quarterly high and low prices reported on the NASDAQ Global Market for our stock over the last two fiscal years.
FirstQuarter
SecondQuarter
ThirdQuarter
FourthQuarter
2013High $13.45 $13.40 $12.96 $13.18Low $ 7.90 $11.03 $11.00 $12.27Close $11.85 $11.25 $12.37 $13.05
2012High $11.10 $10.20 $ 9.87 $ 9.67Low $ 9.56 $ 8.01 $ 7.90 $ 8.00Close $ 9.90 $ 9.62 $ 9.35 $ 8.59
As of July 15, 2013, we estimate there were approximately 1,000 stockholders of our common shares, of which 180were stockholders of record. We paid cash dividends per share of $0.40 for fiscal years 2013, 2012 and 2011, respectively. Weexpect to pay dividends in the future in line with our actual and anticipated future operating results.
SECURITIES AUTHORIZED FOR ISSUANCE UNDER EQUITY COMPENSATION PLANS
See Item 12 in this Form 10-K for a discussion of securities authorized for issuance under our equity compensationplans.
7

Item 6. Selected Financial Data
The following tables set forth selected historical consolidated financial and other data for the periods indicated. Theconsolidated financial data should be read in conjunction with Item 8, Financial Statements and Supplementary Data, and withItem 7, Management’s Discussion and Analysis of Financial Condition and Results of Operations.
Years Ended April 30
$ and shares in thousands, except per share amounts 2013 2012 2011 2010 2009
OPERATING STATEMENT DATA:Net sales $117,121 $102,847 $100,003 $99,093 $103,978Costs of products sold 94,863 83,691 80,719 77,690 82,605
Gross profit 22,258 19,156 19,284 21,403 21,373Operating expenses 16,981 16,443 16,127 15,576 14,289
Operating earnings 5,277 2,713 3,157 5,827 7,084Other income (expense) 306 271 4 1 (28)Interest expense (362) (445) (199) (157) (280)
Earnings before income taxes 5,221 2,539 2,962 5,671 6,776Income tax expense 1,540 739 864 1,921 2,264
Net earnings 3,681 1,800 2,098 3,750 4,512Less: net earnings attributable to noncontrolling interest 637 769 248 178 265
Net earnings attributable to Kewaunee Scientific Corporation $ 3,044 $ 1,031 $ 1,850 $ 3,572 $ 4,247
Weighted average shares outstanding:Basic 2,587 2,579 2,575 2,564 2,555Diluted 2,600 2,580 2,585 2,575 2,561
PER SHARE DATA:Net earnings attributable to Kewaunee Scientific Corporation
Basic $ 1.18 $ 0.40 $ 0.72 $ 1.39 $ 1.66Diluted 1.17 0.40 0.72 1.39 1.66
Cash dividends 0.40 0.40 0.40 0.38 0.32Year-end book value 12.22 11.44 12.21 11.83 10.54
As of April 30
$ in thousands 2013 2012 2011 2010 2009
BALANCE SHEET DATA:Current assets $ 47,230 $ 42,823 $ 42,379 $38,582 $ 37,545Current liabilities 22,115 19,465 20,264 18,497 18,663Net working capital 25,115 23,358 22,115 20,085 18,882Net property, plant and equipment 15,098 15,346 16,575 13,815 11,369Total assets 68,742 63,361 63,058 56,621 52,529Total borrowings/long-term debt 10,464 10,519 10,574 5,073 6,141Kewaunee Scientific Corporation Stockholders’ equity 31,676 29,511 31,491 30,433 26,953
OTHER DATA:Capital expenditures $ 2,405 $ 1,435 $ 5,247 $ 4,239 $ 1,500Year-end stockholders of record 180 198 206 208 212Year-end employees (domestic) 456 440 475 462 466
8

Item 7. Management’s Discussion and Analysis of Financial Condition and Results of Operations
SPECIAL NOTE REGARDING FORWARD-LOOKING STATEMENTS
Certain statements in this document constitute “forward-looking” statements within the meaning of the Private Securities LitigationReform Act of 1995 (the “Reform Act”). Such forward-looking statements involve known and unknown risks, uncertainties andother factors that could significantly impact results or achievements expressed or implied by such forward-looking statements.These factors include, but are not limited to, economic, competitive, governmental and technological factors affecting ouroperations, markets, products, services and prices. The cautionary statements made pursuant to the Reform Act herein andelsewhere by us should not be construed as exhaustive. We cannot always predict what factors would cause actual results to differmaterially from those indicated by the forward-looking statements. In addition, readers are urged to consider statements thatinclude the terms “believes,” “belief,” “expects,” “plans,” “objectives,” “anticipates,” “intends,” or the like to be uncertain andforward-looking. Over time, our actual results, performance, or achievements will likely differ from the anticipated results,performance or achievements that are expressed or implied by our forward-looking statements, and such difference might besignificant and harmful to our stockholders’ interest. Many important factors that could cause such a difference are described underthe caption “Risk Factors,” in Item 1A of this Annual Report, which you should review carefully.
MANAGEMENT’S DISCUSSION AND ANALYSIS
INTRODUCTION
Kewaunee Scientific Corporation is a recognized leader in the design, manufacture and installation of laboratory, healthcare andtechnical furniture. The Company’s corporate headquarters are located in Statesville, North Carolina. The Company’smanufacturing facilities are located in Statesville and Bangalore, India. The Company has subsidiaries in Singapore and Bangalorethat serve the Asian and Middle East markets. Kewaunee Scientific’s website is located at www.kewaunee.com.
Our products are primarily sold through purchase orders and contracts submitted by customers through our dealers andcommissioned agents, a national distributor, and through competitive bids submitted by us and our subsidiaries. Products are soldprincipally to pharmaceutical, biotechnology, industrial, chemical and commercial research laboratories, educational institutions,healthcare institutions, governmental entities, manufacturing facilities and users of networking furniture. We consider the marketsin which we compete to be highly competitive, with a significant amount of the business involving competitive public bidding.
It is common in the laboratory and healthcare furniture industries for customer orders to require delivery at extended future dates,as products are frequently to be installed in buildings yet to be constructed. Changes or delays in building construction may causedelays in delivery of the orders and our recognition of the sale. Since prices are normally quoted on a firm basis in the industry, webear the burden of possible increases in labor and material costs between quotation of an order and delivery of the product. Theimpact of such possible increases is considered when determining the sales price. The principal raw materials and productsmanufactured by others used in our products are cold-rolled carbon and stainless steel, hardwood lumbers and plywood, paint,chemicals, resins, hardware, plumbing and electrical fittings. Such materials and products are purchased from multiple suppliersand are typically readily available.
CRITICAL ACCOUNTING POLICIES
In the ordinary course of business, we have made a number of estimates and assumptions relating to the reporting of results ofoperations and financial position in the preparation of our consolidated financial statements in conformity with generally acceptedaccounting principles in the United States of America. Actual results could differ significantly from those estimates. We believethat the following discussion addresses our most critical accounting policies, which are those that are most important to theportrayal of our financial condition and results of operations, and require management’s most difficult, subjective and complexjudgments, often as a result of the need to make estimates about the effect of matters that are inherently uncertain.
Revenue Recognition
A portion of our product sales result from fixed-price construction contracts. In these instances, we are usually in the role of asubcontractor, but in some cases may enter into a contract directly with the end-user of the products. Our contract arrangements
9

normally do not contain a general right of return relative to the delivered items. Product sales resulting from fixed-priceconstruction contracts are generated from multiple-element arrangements that require separate units of accounting and estimatesregarding the fair value of individual elements. The Company has determined that its multiple-element arrangements that qualify asseparate units of accounting are (1) product sales and (2) installation services. There is objective and reliable evidence of fair valuefor both the product sales and installation services, and allocation of arrangement consideration for each of these units is based ontheir relative fair values. Each of these elements represents individual units of accounting, as the delivered item has value to acustomer on a stand-alone basis. The Company’s products are regularly sold on a stand-alone basis to customers which providesvendor-specific objective evidence of fair value. The fair value of installation services is separately calculated using expected costsof installation services. Many times the value of installation services is calculated using price quotations from subcontractors to theCompany, who perform installation services on a stand-alone basis. Assuming all other criteria for revenue recognition have beenmet, we recognize revenue for product sales at the date of shipment. Product sales resulting from purchase orders involve apurchase order received by us from our dealers or our stocking distributor. This category includes product sales for standardproducts, as well as products which require some customization. These sales are recognized under the terms of the purchase orderwhich generally are freight on board (“FOB”) shipping point and do not include rights of return. Accordingly, these sales arerecognized at the time of shipment.
Allowance for Doubtful Accounts
Evaluation of the allowance for doubtful accounts involves management judgments and estimates. We evaluate the collectability ofour trade accounts receivable based on a number of factors. In circumstances where management is aware of a customer’s inabilityto meet its financial obligations to us, or a project dispute makes it unlikely that all of the receivable owed by a customer will becollected, a specific reserve for bad debts is estimated and recorded to reduce the recognized receivable to the estimated amount webelieve will ultimately be collected. In addition to specific customer identification of potential bad debts, a general reserve for baddebts is estimated and recorded based on our recent past loss history and an overall assessment of past due trade accountsreceivable amounts outstanding.
Inventories
The majority of inventories are valued at the lower of cost or market under the last-in, first-out (“LIFO”) method. The LIFOmethod allocates the most recent costs to cost of products sold, and, therefore, recognizes into operating results fluctuations in rawmaterials and other inventory costs more quickly than other methods. Inventories at our international subsidiaries are measured onthe first-in, first-out (“FIFO”) method.
Pension Benefits
We sponsor pension plans covering all employees who met eligibility requirements as of April 30, 2005. In February 2005, ourpension plans were amended as of April 30, 2005. No further benefits have been, or will be, earned under the plans subsequent tothe amendment date, and no additional participants have been, or will be, added to the plans. Several statistical and other factors,which attempt to anticipate future events, are used in calculating the expense and liability related to the pension plans. Thesefactors include assumptions about the discount rate used to calculate and determine benefit obligations and expected return on planassets within certain guidelines. The actuarial assumptions used by us may differ materially from actual results due to changingmarket and economic conditions, higher or lower withdrawal rates, or longer or shorter life spans of participants. These differencesmay significantly affect the amount of pension income or expense recorded by us in future periods.
RESULTS OF OPERATIONS
Sales for fiscal year 2013 were $117.1 million, an increase of 13.9% from fiscal year 2012 sales of $102.8 million. DomesticOperations sales for fiscal year 2013 were $93.5 million, an increase of 11.4% from fiscal year 2012 sales of $84.0 million.International Operations sales for fiscal year 2013 were $23.6 million, an increase of 25% from fiscal year 2012 sales of $18.9million. The increase in Domestic Operations sales was due to increased activity for mid-sized projects and several large directprojects. The increase in International Operations sales was due to the shipment of several large international orders. Sales forfiscal year 2012 were $102.8 million, an increase of 3% from fiscal year 2011 sales of $100.0 million. Domestic Operations salesfor fiscal year 2012 were $84.0 million, comparable to fiscal year 2011 sales of $84.1 million. International Operations sales forfiscal year 2012 were $18.9 million, an increase of 19% from fiscal year 2011 sales of $15.9 million. The increase in InternationalOperations sales reflected increased sales opportunities as the international marketplace continued to recover.
10

Our order backlog was $80.2 million at April 30, 2013, as compared to $86.2 million at April 30, 2012 and $65.7 million atApril 30, 2011.
Gross profit represented 19.0%, 18.6% and 19.3% of sales in fiscal years 2013, 2012 and 2011, respectively. The increase in grossprofit margin for fiscal year 2013 was primarily due to cost savings initiatives and a more favorable product mix. The decrease ingross profit margin for fiscal year 2012 was primarily due to increased competitive pricing in the marketplace and higher costs forsteel and epoxy resin raw materials.
Operating expenses were $17.0 million, $16.4 million and $16.1 million in fiscal years 2013, 2012 and 2011, respectively, and14.5%, 16.0% and 16.1% of sales, respectively. The increase in fiscal year 2013 as compared to fiscal year 2012 resulted primarilyfrom higher pension expense of $442,000 and $519,000 in expense related to compensation earned under performance incentiveplans. These increases were partially offset by decreases in bad debt expenses of $180,000 and sales and marketing expenses of$317,000. The increase in operating expenses in fiscal year 2012 as compared to fiscal year 2011 resulted primarily from anincrease in operating expenses of $378,000 attributable to the growth in International Operations and an increase in depreciationexpense of $147,000. These increases were partially offset by a decrease of $148,000 in pension expense and a decrease of$100,000 in sales and marketing expenses.
Other income was $306,000, $271,000 and $4,000 in fiscal years 2013, 2012 and 2011, respectively. The increase in other incomein fiscal year 2013 was primarily due to an increase in interest income earned on cash on hand of the international subsidiaries. Theincrease in other income in fiscal year 2012 was primarily due to a property insurance settlement in the amount of $156,000 and anincrease in interest income.
Interest expense was $362,000, $445,000 and $199,000 in fiscal years 2013, 2012 and 2011, respectively. The decrease in interestexpense for fiscal year 2013 was primarily due to lower levels of bank borrowings and the increase in fiscal year 2012 was due tohigher levels of borrowings.
Income tax expense was $1,540,000, $739,000 and $864,000 in fiscal years 2013, 2012 and 2011, respectively, or 29.5%, 29.1%and 29.2% of pretax earnings, respectively. The effective tax rate for each of these years is lower than the statutory rate due to thefavorable impact of tax rates for the Company’s international subsidiaries and the impact of state and federal tax credits.
Net earnings attributable to the noncontrolling interest related to our two subsidiaries that are not 100% owned by the Companywere $637,000, $769,000 and $248,000, for fiscal years 2013, 2012 and 2011, respectively. The changes from year-to-year in thenet earnings attributable to the noncontrolling interest were directly attributable to changes in the levels of net income of thesubsidiaries.
Net earnings in fiscal year 2013 were $3,044,000, or $1.17 per diluted share. Net earnings in fiscal year 2012 were $1,031,000, or$0.40 per diluted share, and net earnings in fiscal year 2011 were $1,850,000, or $0.72 per diluted share.
LIQUIDITY AND CAPITAL RESOURCES
Our principal sources of liquidity have historically been funds generated from operating activities, supplemented as needed byborrowings under our revolving credit facility. Additionally, certain machinery and equipment are financed by non-cancelableoperating leases. We believe that these sources of funds will be sufficient to support ongoing business requirements, includingcapital expenditures, through fiscal year 2014.
At April 30, 2013, we had advances of $6.7 million and standby letters of credit aggregating $2.1 million outstanding under ourunsecured $15 million revolving credit facility. The credit facility matures on July 31, 2014. See Note 3 and Note 10 of the Notesto Consolidated Financial Statements included in Item 8 of this Annual Report for additional information concerning our creditfacility. We did not have any off balance sheet arrangements at April 30, 2013.
11
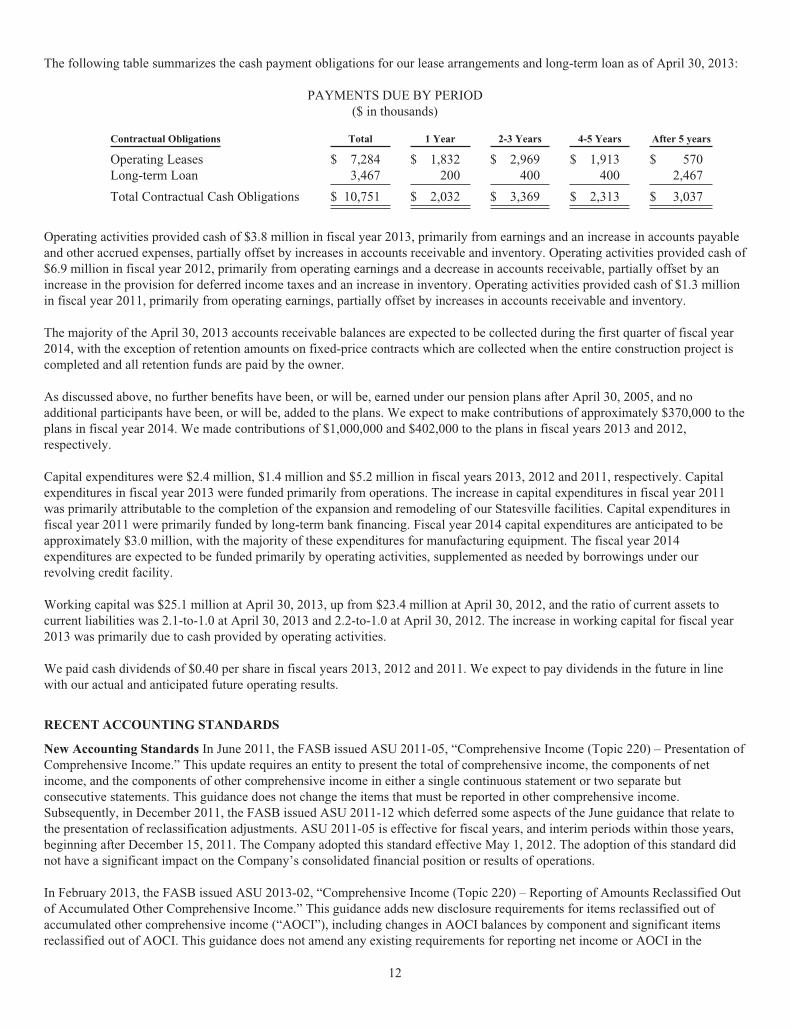
The following table summarizes the cash payment obligations for our lease arrangements and long-term loan as of April 30, 2013:
PAYMENTS DUE BY PERIOD($ in thousands)
Contractual Obligations Total 1 Year 2-3 Years 4-5 Years After 5 years
Operating Leases $ 7,284 $ 1,832 $ 2,969 $ 1,913 $ 570Long-term Loan 3,467 200 400 400 2,467
Total Contractual Cash Obligations $ 10,751 $ 2,032 $ 3,369 $ 2,313 $ 3,037
Operating activities provided cash of $3.8 million in fiscal year 2013, primarily from earnings and an increase in accounts payableand other accrued expenses, partially offset by increases in accounts receivable and inventory. Operating activities provided cash of$6.9 million in fiscal year 2012, primarily from operating earnings and a decrease in accounts receivable, partially offset by anincrease in the provision for deferred income taxes and an increase in inventory. Operating activities provided cash of $1.3 millionin fiscal year 2011, primarily from operating earnings, partially offset by increases in accounts receivable and inventory.
The majority of the April 30, 2013 accounts receivable balances are expected to be collected during the first quarter of fiscal year2014, with the exception of retention amounts on fixed-price contracts which are collected when the entire construction project iscompleted and all retention funds are paid by the owner.
As discussed above, no further benefits have been, or will be, earned under our pension plans after April 30, 2005, and noadditional participants have been, or will be, added to the plans. We expect to make contributions of approximately $370,000 to theplans in fiscal year 2014. We made contributions of $1,000,000 and $402,000 to the plans in fiscal years 2013 and 2012,respectively.
Capital expenditures were $2.4 million, $1.4 million and $5.2 million in fiscal years 2013, 2012 and 2011, respectively. Capitalexpenditures in fiscal year 2013 were funded primarily from operations. The increase in capital expenditures in fiscal year 2011was primarily attributable to the completion of the expansion and remodeling of our Statesville facilities. Capital expenditures infiscal year 2011 were primarily funded by long-term bank financing. Fiscal year 2014 capital expenditures are anticipated to beapproximately $3.0 million, with the majority of these expenditures for manufacturing equipment. The fiscal year 2014expenditures are expected to be funded primarily by operating activities, supplemented as needed by borrowings under ourrevolving credit facility.
Working capital was $25.1 million at April 30, 2013, up from $23.4 million at April 30, 2012, and the ratio of current assets tocurrent liabilities was 2.1-to-1.0 at April 30, 2013 and 2.2-to-1.0 at April 30, 2012. The increase in working capital for fiscal year2013 was primarily due to cash provided by operating activities.
We paid cash dividends of $0.40 per share in fiscal years 2013, 2012 and 2011. We expect to pay dividends in the future in linewith our actual and anticipated future operating results.
RECENT ACCOUNTING STANDARDS
New Accounting Standards In June 2011, the FASB issued ASU 2011-05, “Comprehensive Income (Topic 220) – Presentation ofComprehensive Income.” This update requires an entity to present the total of comprehensive income, the components of netincome, and the components of other comprehensive income in either a single continuous statement or two separate butconsecutive statements. This guidance does not change the items that must be reported in other comprehensive income.Subsequently, in December 2011, the FASB issued ASU 2011-12 which deferred some aspects of the June guidance that relate tothe presentation of reclassification adjustments. ASU 2011-05 is effective for fiscal years, and interim periods within those years,beginning after December 15, 2011. The Company adopted this standard effective May 1, 2012. The adoption of this standard didnot have a significant impact on the Company’s consolidated financial position or results of operations.
In February 2013, the FASB issued ASU 2013-02, “Comprehensive Income (Topic 220) – Reporting of Amounts Reclassified Outof Accumulated Other Comprehensive Income.” This guidance adds new disclosure requirements for items reclassified out ofaccumulated other comprehensive income (“AOCI”), including changes in AOCI balances by component and significant itemsreclassified out of AOCI. This guidance does not amend any existing requirements for reporting net income or AOCI in the
12

financial statements. The Company will adopt this standard in fiscal year 2014. The Company does not expect the adoption of thisstandard to have a significant impact on the Company’s consolidated financial position or results of operations.
In March 2013, the FASB issued ASU 2013-05 “Foreign Currency Matters (Topic 830) – Parent’s Accounting for the CumulativeTranslation Adjustment upon Derecognition of Certain Subsidiaries or Groups of Assets within a Foreign Entity or of anInvestment in a Foreign Entity.” This guidance issued amendments to address the accounting for the cumulative translationadjustment when a parent entity sells or transfers either a subsidiary or group of assets within a foreign entity. The Company willadopt this standard in fiscal year 2015. The Company does not expect the adoption of this standard to have a significant impact onthe Company’s consolidated financial position or results of operations.
OUTLOOK
Our ability to predict future demand for our products continues to be limited given our role as subcontractor or supplier to dealersfor subcontractors. Demand for our products is also dependent upon the number of laboratory construction projects planned and/orcurrent progress in projects already under construction. Our earnings are also impacted by increased costs of raw materials,including stainless steel, wood, and epoxy resin, and whether we are able to increase product prices to customers in amounts thatcorrespond to such increases without materially and adversely affecting sales. Additionally, since prices are normally quoted on afirm basis in the industry, we bear the burden of possible increases in labor and material costs between the quotation of an orderand delivery of a product. We are also unable to predict the timing and strength of the global economic recovery and its short-termand long-term impact on our operations and the markets in which we compete.
Item 7A. Quantitative and Qualitative Disclosures About Market Risk
We are exposed to market risk in the area of interest rates. This exposure is associated with advances outstanding under ourbank line of credit and certain lease obligations for production machinery, all of which are priced on a floating rate basis. Advancesoutstanding under the bank line of credit were $6.7 million at April 30, 2013. In June 2010, we entered into an interest rate swapagreement whereby the interest rate payable on the outstanding principal balance of our $4 million term loan was effectivelyconverted to a fixed rate of 4.875%. In July 2009, we entered into an interest rate swap agreement whereby the interest rate payableon $2 million of outstanding advances under the revolving credit facility effectively converted to a fixed interest rate of 3.9% forthe period beginning August 3, 2009 and ending August 1, 2012. We entered into these interest rate swaps to mitigate futureinterest rate risk associated with borrowings under the credit facility. We believe that our exposure to market risk is not material.
Item 8. Financial Statements and Supplementary Data
Page
Consolidated Financial Statements
Report of Management on Internal Control over Financial Reporting 14
Report of Independent Registered Public Accounting Firm Cherry Bekaert LLP 15
Consolidated Statements of Operations – Years ended April 30, 2013, 2012 and 2011 16
Consolidated Statements of Comprehensive Income (Loss) – Years ended April 30, 2013, 2012 and 2011 17
Consolidated Statements of Stockholders’ Equity – Years ended April 30, 2013, 2012 and 2011 18
Consolidated Balance Sheets – April 30, 2013 and 2012 19
Consolidated Statements of Cash Flows – Years ended April 30, 2013, 2012 and 2011 20
Notes to Consolidated Financial Statements 21
Consent of Independent Registered Public Accounting Firm 35
13

REPORT OF MANAGEMENT ON INTERNAL CONTROL OVER FINANCIAL REPORTING
TO THE STOCKHOLDERS AND BOARD OF DIRECTORSOF KEWAUNEE SCIENTIFIC CORPORATION
Management is responsible for establishing and maintaining adequate internal control over financial reporting for the Company.Internal control over financial reporting is a process designed to provide reasonable assurance regarding the reliability of financialreporting and the preparation of consolidated financial statements for external purposes in accordance with accounting principlesgenerally accepted in the United States.
The Company’s internal control over financial reporting includes those policies and procedures that (i) pertain to the maintenanceof records that, in reasonable detail, accurately and fairly reflect the transactions and dispositions of the assets of the Company;(ii) provide reasonable assurance that transactions are recorded as necessary to permit preparation of consolidated financialstatements in accordance with accounting principles generally accepted in the United States, and that receipts and expenditures ofthe Company are being made only in accordance with authorizations of Management and Directors of the Company; and(iii) provide reasonable assurance regarding prevention or timely detection of unauthorized acquisition, use or disposition of theCompany’s assets that could have a material effect on the consolidated financial statements.
Because of its inherent limitations, internal control over financial reporting may not prevent or detect misstatements. In addition,projections of any evaluation of effectiveness to future periods are subject to the risk that controls may become inadequate becauseof changes in conditions, or that the degree of compliance with the policies or procedures may deteriorate.
Management conducted an evaluation of the effectiveness of internal control over financial reporting based on the framework inInternal Control – Integrated Framework issued by the Committee of Sponsoring Organizations of the Treadway Commission.Based on this evaluation, Management concluded the Company maintained effective internal control over financial reporting as ofApril 30, 2013.
/s/ David M. Rausch
President and Chief Executive Officer
/s/ D. Michael Parker
Senior Vice President, FinanceChief Financial Officer
July 18, 2013
14

REPORT OF INDEPENDENT REGISTERED PUBLIC ACCOUNTING FIRM
TO THE SHAREHOLDERS AND BOARD OF DIRECTORSOF KEWAUNEE SCIENTIFIC CORPORATIONSTATESVILLE, NORTH CAROLINA
We have audited the accompanying consolidated balance sheets of Kewaunee Scientific Corporation and subsidiaries (the“Company”) as of April 30, 2013 and 2012, and the related consolidated statements of operations, comprehensive income (loss),stockholders’ equity and cash flows for each of the three years in the period ended April 30, 2013. These consolidated financialstatements are the responsibility of the Company’s management. Our responsibility is to express an opinion on these consolidatedfinancial statements based on our audits.
We conducted our audits in accordance with the standards of the Public Company Accounting Oversight Board (United States).Those standards require that we plan and perform the audit to obtain reasonable assurance about whether the financial statementsare free of material misstatement. An audit includes examining, on a test basis, evidence supporting the amounts and disclosures inthe financial statements, assessing the accounting principles used and significant estimates made by management, and evaluatingthe overall financial statement presentation. We believe that our audits provide a reasonable basis for our opinion.
In our opinion, the consolidated financial statements referred to above present fairly, in all material respects, the consolidatedfinancial position of the Company as of April 30, 2013 and 2012, and the consolidated results of their operations and their cashflows for each of the three years in the period ended April 30, 2013, in conformity with accounting principles generally accepted inthe United States of America.
We were not engaged to examine management’s assertion about the effectiveness of the Company’s internal control over financialreporting as of April 30, 2013 included in the accompanying “Report of Management on Internal Control over FinancialReporting,” and, accordingly, we do not express an opinion thereon.
/s/ CHERRY BEKAERT LLPCharlotte, North Carolina
July 18, 2013
15
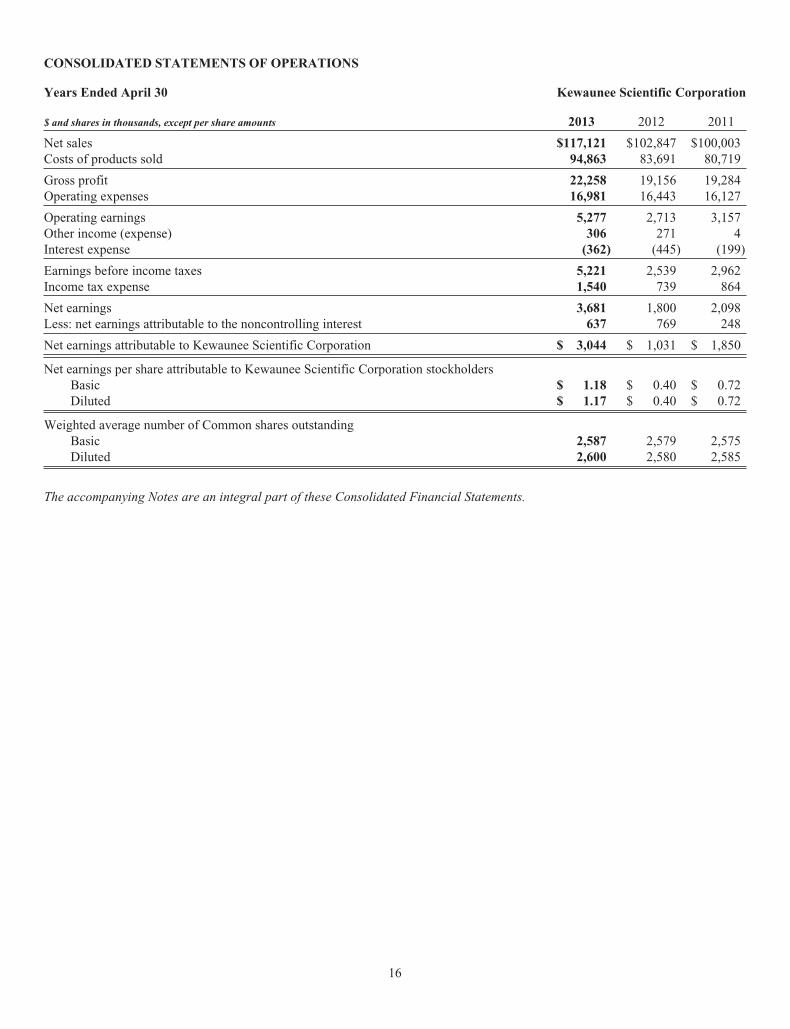
CONSOLIDATED STATEMENTS OF OPERATIONS
Years Ended April 30 Kewaunee Scientific Corporation
$ and shares in thousands, except per share amounts 2013 2012 2011
Net sales $117,121 $102,847 $100,003Costs of products sold 94,863 83,691 80,719
Gross profit 22,258 19,156 19,284Operating expenses 16,981 16,443 16,127
Operating earnings 5,277 2,713 3,157Other income (expense) 306 271 4Interest expense (362) (445) (199)
Earnings before income taxes 5,221 2,539 2,962Income tax expense 1,540 739 864
Net earnings 3,681 1,800 2,098Less: net earnings attributable to the noncontrolling interest 637 769 248
Net earnings attributable to Kewaunee Scientific Corporation $ 3,044 $ 1,031 $ 1,850
Net earnings per share attributable to Kewaunee Scientific Corporation stockholdersBasic $ 1.18 $ 0.40 $ 0.72Diluted $ 1.17 $ 0.40 $ 0.72
Weighted average number of Common shares outstandingBasic 2,587 2,579 2,575Diluted 2,600 2,580 2,585
The accompanying Notes are an integral part of these Consolidated Financial Statements.
16

CONSOLIDATED STATEMENTS OF COMPREHENSIVE INCOME (LOSS)
Years Ended April 30 Kewaunee Scientific Corporation
$ in thousands 2013 2012 2011
Net earnings $3,681 $ 1,800 $2,098Other comprehensive income (loss), net of tax
Foreign currency translation adjustments 84 (466) 21Change in unrecognized actuarial loss on pension obligations (256) (1,682) 54Change in fair value of cash flow hedge 21 (98) (107)
Comprehensive income (loss), net of tax 3,530 (446) 2,066Less comprehensive income (loss) attributable to the noncontrolling interest (637) (769) (248)
Total comprehensive income (loss) attributable to Kewaunee Scientific Corporation $2,893 $(1,215) $1,818
The accompanying Notes are an integral part of these Consolidated Financial Statements.
17

CONSOLIDATED STATEMENTS OF STOCKHOLDERS’ EQUITY
Kewaunee Scientific Corporation
$ in thousands,except per share amounts
CommonStock
AdditionalPaid-inCapital
TreasuryStock
RetainedEarnings
AccumulatedOther
ComprehensiveIncome (Loss)
TotalStockholders’
Equity
Balance at April 30, 2010 $6,550 $ 855 $(472) $28,398 $(4,898) $30,433
Net earnings — — — 1,850 — 1,850Other comprehensive income (loss) — — — — (32) (32)Cash dividends declared, $.40 per share — — — (1,030) — (1,030)Stock options exercised, 13,850 shares — 11 140 — — 151Stock options granted, 136,400 shares — 225 — — — 225Purchase of treasury stock, 8,323 shares — — (106) — — (106)
Balance at April 30, 2011 6,550 1,091 (438) 29,218 (4,930) 31,491
Net earnings — — — 1,031 — 1,031Other comprehensive income (loss) — — — — (2,246) (2,246)Cash dividends declared, $.40 per share — — — (1,031) — (1,031)Stock options exercised, 14,500 shares — (11) 152 — — 141Stock options granted, 55,000 shares — 261 — — — 261Purchase of treasury stock, 13,306 shares — — (136) — — (136)
Balance at April 30, 2012 6,550 1,341 (422) 29,218 (7,176) 29,511
Net earnings — — — 3,044 — 3,044Other comprehensive income (loss) — — — — (151) (151)Cash dividends declared, $0.40 per share — — — (1,071) — (1,071)Stock options exercised, 26,750 shares — (1) 286 — — 285Stock options granted, 40,000 shares — 227 — — — 227Purchase of treasury stock, 13,752 shares — — (169) — — (169)
Balance at April 30, 2013 $6,550 $1,567 $(305) $31,191 $(7,327) $31,676
The accompanying Notes are an integral part of these Consolidated Financial Statements.
18

CONSOLIDATED BALANCE SHEETS
Years Ended April 30 Kewaunee Scientific Corporation
$ and shares in thousands, except per share amounts 2013 2012
ASSETSCurrent AssetsCash and cash equivalents $ 5,811 $ 6,188Restricted cash 691 704Receivables, less allowance: $194 (2013); $311 (2012) 25,884 22,469Inventories 13,203 11,760Deferred income taxes 654 713Prepaid expenses and other current assets 987 989
Total Current Assets 47,230 42,823Property, Plant and Equipment, Net 15,098 15,346
Other AssetsDeferred income taxes 2,241 1,656Other 4,173 3,536
Total Other Assets 6,414 5,192
Total Assets $68,742 $63,361
LIABILITIES AND STOCKHOLDERS’ EQUITYCurrent LiabilitiesShort-term borrowings and interest rate swap $ 6,997 $ 6,816Current obligations under capital leases — 36Current portion of long-term debt 200 200Accounts payable 10,406 8,848Employee compensation and amounts withheld 2,076 1,304Deferred revenue 488 587Other accrued expenses 1,948 1,674
Total Current Liabilities 22,115 19,465Long-term debt 3,267 3,467Accrued pension and deferred compensation costs 9,667 8,771
Total Liabilities 35,049 31,703
Commitments and Contingencies (Note 7)Stockholders’ EquityCommon stock, $2.50 par value, Authorized - 5,000 shares; Issued - 2,620 shares; Outstanding -
2,592 shares (2013); 2,579 shares (2012) 6,550 6,550Additional paid-in-capital 1,567 1,341Retained earnings 31,191 29,218Accumulated other comprehensive loss (7,327) (7,176)Common stock in treasury, at cost: 27 shares (2013); 40 shares (2012) (305) (422)
Total Kewaunee Scientific Corporation Stockholders’ Equity 31,676 29,511Noncontrolling Interest 2,017 2,147
Total Equity 33,693 31,658
Total Liabilities and Stockholders’ Equity $68,742 $63,361
The accompanying Notes are an integral part of these Consolidated Financial Statements.
19
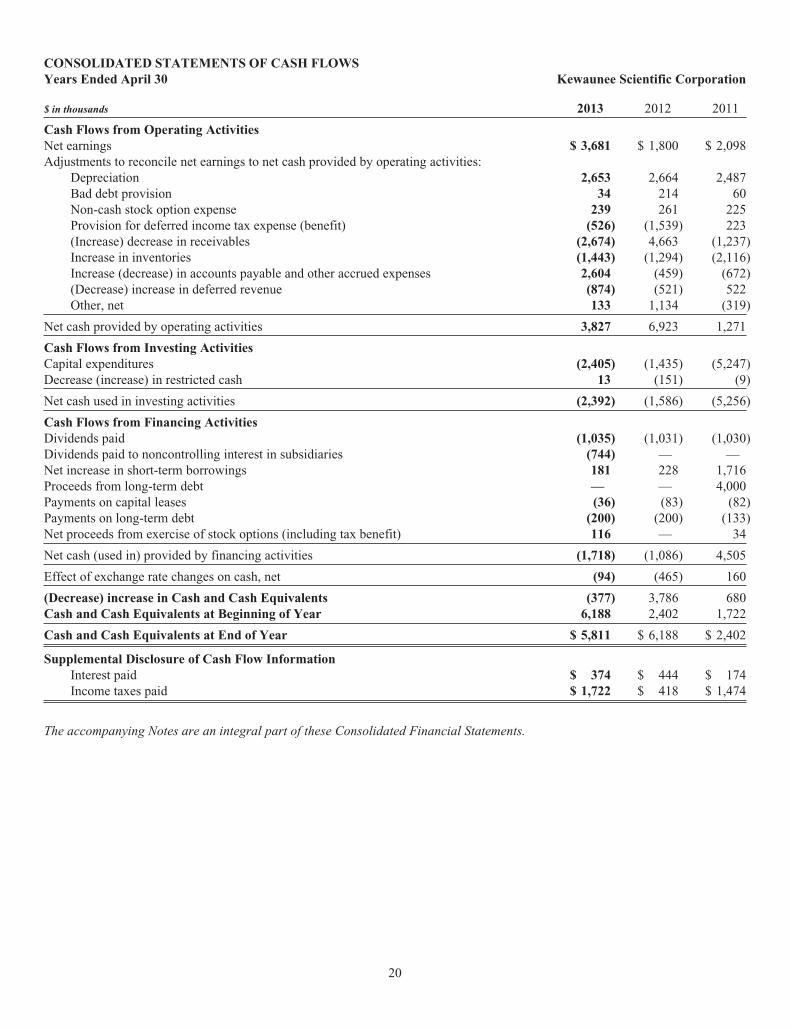
CONSOLIDATED STATEMENTS OF CASH FLOWSYears Ended April 30 Kewaunee Scientific Corporation
$ in thousands 2013 2012 2011
Cash Flows from Operating ActivitiesNet earnings $ 3,681 $ 1,800 $ 2,098Adjustments to reconcile net earnings to net cash provided by operating activities:
Depreciation 2,653 2,664 2,487Bad debt provision 34 214 60Non-cash stock option expense 239 261 225Provision for deferred income tax expense (benefit) (526) (1,539) 223(Increase) decrease in receivables (2,674) 4,663 (1,237)Increase in inventories (1,443) (1,294) (2,116)Increase (decrease) in accounts payable and other accrued expenses 2,604 (459) (672)(Decrease) increase in deferred revenue (874) (521) 522Other, net 133 1,134 (319)
Net cash provided by operating activities 3,827 6,923 1,271
Cash Flows from Investing ActivitiesCapital expenditures (2,405) (1,435) (5,247)Decrease (increase) in restricted cash 13 (151) (9)
Net cash used in investing activities (2,392) (1,586) (5,256)
Cash Flows from Financing ActivitiesDividends paid (1,035) (1,031) (1,030)Dividends paid to noncontrolling interest in subsidiaries (744) — —Net increase in short-term borrowings 181 228 1,716Proceeds from long-term debt — — 4,000Payments on capital leases (36) (83) (82)Payments on long-term debt (200) (200) (133)Net proceeds from exercise of stock options (including tax benefit) 116 — 34
Net cash (used in) provided by financing activities (1,718) (1,086) 4,505
Effect of exchange rate changes on cash, net (94) (465) 160
(Decrease) increase in Cash and Cash Equivalents (377) 3,786 680Cash and Cash Equivalents at Beginning of Year 6,188 2,402 1,722
Cash and Cash Equivalents at End of Year $ 5,811 $ 6,188 $ 2,402
Supplemental Disclosure of Cash Flow InformationInterest paid $ 374 $ 444 $ 174Income taxes paid $ 1,722 $ 418 $ 1,474
The accompanying Notes are an integral part of these Consolidated Financial Statements.
20

NOTES TO CONSOLIDATED FINANCIAL STATEMENTS
Note 1—Summary of Significant Accounting Policies
Kewaunee Scientific Corporation (the “Company”) designs, manufactures, and installs laboratory, healthcare, and technicalfurniture products. Laboratory furniture products include both steel and wood cabinetry, fume hoods, adaptable modular systems,moveable workstations, biological safety cabinets, and epoxy resin counters and sinks. Healthcare furniture products includelaminate casework, storage systems, and related products for healthcare applications. Technical furniture products include columnsystems, slotted-post systems, pedestal systems, and stand-alone benches. The Company’s sales are made through purchase ordersand contracts submitted by customers, dealers and agents, a national stocking distributor, competitive bids submitted by theCompany and its subsidiaries located in Singapore and Bangalore, India. The majority of the Company’s products are sold tocustomers located in North America, primarily within the United States. The Company’s laboratory products are used in chemistry,physics, biology and other general science laboratories in the pharmaceutical, biotechnology, industrial, chemical, commercial,educational, government and health care markets. Technical products are used in facilities manufacturing computers and lightelectronics and by users of computer and networking furniture. Laminate casework is used in educational, healthcare and industrialapplications.
Principles of Consolidation The Company’s consolidated financial statements include the accounts of Kewaunee ScientificCorporation and its four international subsidiaries. A brief description of each subsidiary, along with the amount of the Company’scontrolling financial interests, is as follows: (1) Kewaunee Labway Asia Pte. Ltd., a dealer for the Company’s products inSingapore, is 51% owned by the Company; (2) Kewaunee Labway India Pvt. Ltd., a dealer for the Company’s products inBangalore, India, is 90% owned by Kewaunee Labway Asia, Pte. Ltd.; (3) Kewaunee Scientific Corporation India Pvt. Ltd. inBangalore, India, a manufacturing and assembly operation, is 100% owned by the Company, and (4) Kewaunee ScientificCorporation Singapore Pte. Ltd., a holding company in Singapore, is 100% owned by the Company. All intercompany balances,transactions, and profits have been eliminated. Included in the consolidated financial statements are net assets of $11,189,000 and$9,648,000 at April 30, 2013 and 2012, respectively, of the Company’s subsidiaries. Net sales by the Company’s subsidiaries in theamount of $23,602,000, $18,876,000 and $15,882,000 were included in the consolidated statements of operations for fiscal years2013, 2012 and 2011, respectively. On June 24, 2013, the Company entered into an agreement to purchase the minorityshareholders’ interest in Kewaunee Labway Asia Pte. Ltd. See Note 10 – Subsequent Event for additional information.
Cash and Cash Equivalents Cash and cash equivalents consist of cash on hand and highly liquid investments with originalmaturities of three months or less. During the years ended April 30, 2013 and 2012, the Company had cash deposits in excess ofFDIC insured limits. The Company has not experienced any losses from such deposits.
Restricted Cash Restricted cash includes bank deposits of a subsidiary used for performance guarantees against customer orders.
Allowance for Doubtful Accounts The Company evaluates the collectability of its trade accounts receivable based on a number offactors. In circumstances where management is aware of a customer’s inability to meet its financial obligations to the Company, ora project dispute makes it unlikely that all of the receivable owed by a customer will be collected, a specific reserve for bad debts isestimated and recorded to reduce the recognized receivable to the estimated amount the Company believes will ultimately becollected. In addition to specific customer identification of potential bad debts, a general reserve for bad debts is estimated andrecorded based on the customer’s recent past loss history and an overall assessment of past due trade accounts receivable amountsoutstanding. Accounts are written off when it is clearly established that the receivable is a bad debt. Recoveries of receivablespreviously written off are recorded when received. The activity in the allowance for doubtful accounts for each of the three yearsended April 30 was:
$ in thousands 2013 2012 2011
Balance at beginning of year $ 311 $ 250 $259Bad debt provision 34 214 60Doubtful accounts written off (net) (151) (153) (69)
Balance at end of year $ 194 $ 311 $250
Inventories The majority of inventories are valued at the lower of cost or market under the last-in, first-out (“LIFO”) method. TheLIFO method allocates the most recent costs to cost of products sold; and, therefore, recognizes into operating results fluctuationsin costs of raw materials more quickly than other methods. Inventories at our international subsidiaries are measured on the first-in,first-out (“FIFO”) method.
21

Property, Plant and Equipment Property, plant and equipment are stated at cost less accumulated depreciation. Depreciation isdetermined for financial reporting purposes principally on the straight-line method over the estimated useful lives of the individualassets or, for leaseholds, over the terms of the related leases, if shorter. Property, plant and equipment consisted of the following atApril 30:
$ in thousands 2013 2012 Useful Life
Land $ 41 $ 41 N/ABuilding and improvements 14,921 14,626 10-40 yearsMachinery and equipment 30,147 28,889 5-10 years
Total 45,109 43,556Less accumulated depreciation (30,011) (28,210)
Net property, plant and equipment $ 15,098 $ 15,346
At April 30, 2012, equipment financed under capital leases with a cost of $307,000 was included in machinery and equipment.Management reviews the carrying value of property, plant and equipment for impairment whenever changes in circumstances orevents indicate that such carrying value may not be recoverable. If projected undiscounted cash flows are not sufficient to recoverthe carrying value of the potentially impaired asset, the carrying value is reduced to estimated fair value. There were noimpairments in fiscal years 2013, 2012 and 2011.
Other Assets Other assets at April 30, 2013 and 2012 included $4,077,000 and $3,454,000, respectively, of assets held in a trustaccount for non-qualified benefit plans and $96,000 and $83,000, respectively, of cash surrender values of life insurance policies.Life insurance policies are recorded at the amount that could be realized under the insurance contract as of the date of theCompany’s consolidated balance sheet with the change in cash surrender or contract value being recorded as income or expenseduring each period.
Use of Estimates The presentation of consolidated financial statements in conformity with generally accepted accountingprinciples in the United States of America requires management to make estimates and assumptions that affect the amountsreported in the consolidated financial statements and accompanying notes. Actual results could differ from these estimates.Significant estimates impacting the accompanying consolidated financial statements include the allowance for uncollectibleaccounts receivable, inventory valuation, and pension liabilities.
Fair Value of Financial Instruments A financial instrument is defined as cash equivalents, evidence of an ownership interest inan entity, or a contract that creates a contractual obligation or right to deliver or receive cash or another financial instrument fromanother party. The Company’s financial instruments consist primarily of cash and equivalents, mutual funds, cash surrender valueof life insurance policies and short-term borrowings. The carrying value of these assets and liabilities approximate their fair value.
Fair value is defined as the exchange price that would be received for an asset or paid to transfer a liability (an exit price) in theprincipal or most advantageous market for the asset or liability in an orderly transaction between market participants on themeasurement date. The standard also expands disclosures about instruments measured at fair value and establishes a fair valuehierarchy which requires an entity to maximize the use of observable inputs and minimize the use of unobservable inputs whenmeasuring fair value. The standard describes a fair value hierarchy based on three levels of inputs, of which the first two areconsidered observable and the last unobservable, that may be used to measure fair value as follows:
Level 1 Quoted prices in active markets for identical assets or liabilities as of the reporting date.Level 2 Inputs other than Level 1 that are observable, either directly or indirectly, such as quoted prices for
similar assets or liabilities; quoted prices in markets that are not active; or other inputs that areobservable or can be corroborated by observable market data for substantially the full term of the assetsor liabilities as of the reporting date.
Level 3 Unobservable inputs that are supported by little or no market activity and that are significant to the fairvalue of the assets or liabilities.
22

The following tables summarize the Company’s fair value hierarchy for its financial assets and liabilities measured at fair value ona recurring and nonrecurring basis as of April 30, 2013 and 2012 (in thousands):
2013
Financial Assets Level 1 Level 2 Level 3 Total
Trading securities held in deferred compensation plan (1) $ 4,077 $ — $ — $ 4,077Cash surrender value of life insurance policies (1) — 96 — 96
Total $ 4,077 $ 96 $ — $ 4,173
Financial LiabilitiesDeferred compensation plans (2) $ — $ 4,399 $ — $ 4,399Interest rate swap derivative — 344 — 344
Total $ — $ 4,743 $ — $ 4,743
2012
Financial Assets Level 1 Level 2 Level 3 Total
Trading securities held in deferred compensation plan (1) $ 3,454 $ — $ — $ 3,454Cash surrender value of life insurance policies (1) — 83 — 83
Total $ 3,454 $ 83 $ — $ 3,537
Financial LiabilitiesDeferred compensation plans (2) $ — $ 3,717 $ — $ 3,717Interest rate swap derivative — 378 — 378
Total $ — $ 4,095 $ — $ 4,095
(1) The Company maintains an executive compensation plan which includes investment assets in a rabbi trust.These assets consist of marketable securities, which are valued using quoted market prices multiplied by thenumber of shares owned, and the cash surrender value of life insurance policies.
(2) The deferred compensation plan liability is equal to the individual participants’ account balances under theplan.
Revenue Recognition Product sales and installation revenue are recognized when all of the following criteria have been met:(1) products have been shipped, or customers have purchased and accepted title to the goods, but because of construction delays,have requested that the Company temporarily store the finished goods on the customer’s behalf; service revenue for installation ofproducts sold is recognized as the installation services are performed, (2) persuasive evidence of an arrangement exists, (3) theprice to the customer is fixed, and (4) collectability is reasonably assured.
Deferred revenue consists of customer deposits and advance billings of the Company’s products where sales have not yet beenrecognized. Accounts receivable includes retainage in the amounts of $2,659,000 and $2,015,000 at April 30, 2013 and 2012,respectively. Shipping and handling costs are included in cost of sales. Because of the nature and quality of the Company’sproducts, any warranty issues are determined in a relatively short period after the sale and are infrequent in nature, and as such,warranty costs are immaterial to the Company’s consolidated financial position and results of operations and are expensed asincurred.
Product sales resulting from fixed-price construction contracts involve a signed contract for a fixed price to provide the Company’slaboratory furniture and fume hoods for a construction project. In these instances, the Company is usually in the role of asubcontractor, but in some cases may enter into a contract directly with the end-user of the products. Contract arrangementsnormally do not contain a general right of return relative to the delivered items. Product sales resulting from fixed-priceconstruction contracts are generated from multiple-element arrangements that require separate units of accounting and estimatesregarding the fair value of individual elements. The Company has determined that its multiple-element arrangements that qualify asseparate units of accounting are (1) product sales and (2) installation services. There is objective and reliable evidence of fair valuefor both the product sales and installation services and allocation of arrangement consideration for each of these units is based on
23

their relative fair values. Each of these elements represent individual units of accounting, as the delivered item has value to acustomer on a stand-alone basis. The Company’s products are regularly sold on a stand-alone basis to customers which providesvendor-specific objective evidence of fair value. The fair value of installation services is separately calculated using expected costsof installation services. Many times the value of installation services is calculated using price quotations from subcontractors to theCompany who perform installation services on a stand-alone basis.
Product sales resulting from purchase orders involve a purchase order received by the Company from its dealers or its stockingdistributor. This category includes product sales for standard products, as well as products which require some customization. Anycustomization requirements are approved by the customer prior to manufacture of the customized product. Sales from purchaseorders are recognized under the terms of the purchase order which generally are freight on board (“FOB”) shipping point and donot include rights of return. Accordingly, these sales are recognized at the time of shipment.
Credit Concentration Credit risk is generally not concentrated with any one customer or industry, although the Company doesenter into large contracts with individual customers from time to time. The Company performs credit evaluations of its customers.Revenues from the Company’s national stocking distributor, VWR International, LLC, represented approximately 11%, 12% and14% of the Company’s total sales in fiscal years 2013, 2012 and 2011, respectively.
Income Taxes In accordance with ASC 740, “Income Taxes,” the Company uses the liability method in measuring the provisionfor income taxes and recognizing deferred tax assets and liabilities on the balance sheet. ASC 740 clarifies the financial statementrecognition threshold and measurement attribute of a tax position taken or expected to be taken in a tax return. Under ASC 740, theCompany applies a more-likely-than-not recognition threshold for all tax uncertainties. ASC 740 only allows the recognition ofthose tax benefits that have a greater than 50% likelihood of being sustained upon examination by the taxing authorities. TheCompany does not have any significant uncertain tax positions at April 30, 2013 and 2012.
Research and Development Costs Research and development costs are charged to expense in the periods incurred. Expendituresfor research and development costs were $872,000, $941,000 and $1,181,000 for the fiscal years ended April 30, 2013, 2012 and2011, respectively.
Advertising Costs Advertising costs are expensed as incurred, and include trade shows, training materials, sales samples, andother related expenses. Advertising costs for the years ended April 30, 2013, 2012 and 2011 were $395,000, $344,000 and$398,000, respectively.
Derivative Financial Instruments The Company records derivatives on the balance sheet at fair value and establishes criteria fordesignation and effectiveness of hedging relationships. The nature of the Company’s business activities involves the managementof various financial and market risks, including those related to changes in interest rates. The Company does not enter intoderivative instruments for speculative purposes. In June 2010, the Company entered into an interest rate swap agreement wherebythe interest rate payable by the Company on the outstanding balance of the term loan was effectively converted to a fixed rate of4.875% beginning August 2, 2010. In July 2009, the Company entered into an interest rate swap agreement whereby the interestrate payable by the Company on $2 million of outstanding advances under the revolving credit facility was effectively converted toa fixed interest rate of 3.9% for the period beginning August 3, 2009 and ending August 1, 2012. The Company entered into theseinterest rate swap arrangements to mitigate future interest rate risk associated with its loan balances and has designated these ascash flow hedges. (See Note 3.)
Foreign Currency Translation The financial statements of subsidiaries located outside the United States are measured using thelocal currency as the functional currency. Assets and liabilities of the Company’s foreign subsidiaries are translated into UnitedStates dollars at fiscal year-end exchange rates. Sales, expenses, and cash flows are translated at weighted average exchange ratesfor each period. Net translation gains or losses are included in other comprehensive income, a separate component of stockholders’equity. The Company does not provide for U.S. income taxes on foreign currency translation adjustments, since it does not providefor taxes on undistributed earnings of foreign subsidiaries. Gains and losses from foreign currency transactions of thesesubsidiaries are included in net earnings.
Earnings Per Share Basic earnings per share is based on the weighted average number of common shares outstanding during theyear. Diluted earnings per share reflects the assumed exercise and conversion of outstanding options under the Company’s stockoption plans, except when options have an antidilutive effect. Accordingly, options to purchase 72,850, 253,050 and 118,900shares at April 30, 2013, 2012 and 2011, respectively, were not included in earnings per share. These options were not included inthe computation of diluted earnings per share because the option exercise prices were greater than the average market price of thecommon shares at that date, and accordingly, such options would have an antidilutive effect.
24

The following is a reconciliation of basic to diluted weighted average common shares outstanding:
Shares in thousands 2013 2012 2011
Weighted average common shares outstandingBasic 2,587 2,579 2,575Dilutive effect of stock options 13 1 10
Weighted average common shares outstanding—diluted 2,600 2,580 2,585
Accounting for Stock Options Compensation costs related to all stock awards granted by the Company are charged againstincome during their vesting period, under ASC 718, “Compensation – Stock Compensation,” for stock options. The Companygranted stock options for 40,000, 55,000 and 136,400 shares during fiscal years 2013, 2012 and 2011, respectively. (See Note 5.)
Reclassifications Certain 2012 amounts have been reclassified to conform with the 2013 presentation in the consolidated balancesheets and consolidated statements of cash flows. Such reclassifications had no impact on net earnings.
New Accounting Standards In June 2011, the FASB issued ASU 2011-05, “Comprehensive Income (Topic 220) – Presentation ofComprehensive Income.” This update requires an entity to present the total of comprehensive income, the components of netincome, and the components of other comprehensive income in either a single continuous statement or two separate butconsecutive statements. This guidance does not change the items that must be reported in other comprehensive income.Subsequently, in December 2011, the FASB issued ASU 2011-12 which deferred some aspects of the June guidance that relate tothe presentation of reclassification adjustments. ASU 2011-05 is effective for fiscal years, and interim periods within those years,beginning after December 15, 2011. The Company adopted this standard effective May 1, 2012. The adoption of this standard didnot have a significant impact on the Company’s consolidated financial position or results of operations.
In February 2013, the FASB issued ASU 2013-02, “Comprehensive Income (Topic 220) – Reporting of Amounts Reclassified Outof Accumulated Other Comprehensive Income.” This guidance adds new disclosure requirements for items reclassified out ofaccumulated other comprehensive income (“AOCI”), including changes in AOCI balances by component and significant itemsreclassified out of AOCI. This guidance does not amend any existing requirements for reporting net income or AOCI in thefinancial statements. The Company will adopt this standard in fiscal year 2014. The Company does not expect the adoption of thisstandard to have a significant impact on the Company’s consolidated financial position or results of operations.
In March 2013, the FASB issued ASU 2013-05 “Foreign Currency Matters (Topic 830) – Parent’s Accounting for the CumulativeTranslation Adjustment upon Derecognition of Certain Subsidiaries or Groups of Assets within a Foreign Entity or of anInvestment in a Foreign Entity.” This guidance issued amendments to address the accounting for the cumulative translationadjustment when a parent entity sells or transfers either a subsidiary or group of assets within a foreign entity. The Company willadopt this standard in fiscal year 2015. The Company does not expect the adoption of this standard to have a significant impact onthe Company’s consolidated financial position or results of operations.
Note 2—Inventories
Inventories consisted of the following at April 30:
$ in thousands 2013 2012
Finished goods $ 4,052 $ 3,570Work-in-process 1,678 1,831Materials and components 7,473 6,359
Total inventories $ 13,203 $ 11,760
At April 30, 2013 and 2012, the Company’s international subsidiaries’ inventories were $2,077,000 and $1,253,000, respectively,measured using the first-in, first-out (“FIFO”) method. If all of the Company’s inventories had been determined using the FIFOmethod at April 30, 2013 and 2012, reported inventories would have been $1.3 million and $1.6 million greater, respectively.During fiscal year 2013, the LIFO index was less than 100% due to lower prices paid for certain raw materials. This reductionresulted in a liquidation of LIFO inventory quantities carried at higher costs prevailing in prior years as compared with the cost ofpurchases in fiscal year 2013, the effect of which decreased the cost of sales by $273,000. During fiscal year 2012, the LIFO index
25

was higher than 100% due to higher prices for certain raw materials. This increase resulted in the addition of LIFO inventoryquantities carried at lower costs prevailing in prior years as compared to the cost of purchases in fiscal year 2012, the effect ofwhich increased the cost of sales by $146,000.
Note 3—Long-term Debt and Other Credit Arrangements
At April 30, 2013 the Company had an unsecured revolving credit facility in the amount of $15 million with an expiration date ofJuly 31, 2014. Monthly interest payments under the facility are payable calculated at the 30-day LIBOR Market Interest Rate plus avariable rate ranging from 1.575% to 2.175%. The borrowing rate at April 30, 2013 was 1.773%, including a variable rateadjustment of 1.575%. The credit facility includes financial covenants with respect to certain ratios, including (a) debt-to-networth, (b) fixed charge coverage, and (c) asset coverage. At April 30, 2013 and 2012, the Company was in compliance with all ofthe financial covenants.
At April 30, 2013, there were advances of $6.7 million outstanding under the revolving credit facility. Additionally, at April 30,2013, the Company’s Asia subsidiaries had standby letters of credit and bank guarantees in the aggregate amount of $2.1 millionoutstanding under the credit facility to guarantee performance on certain customer projects. All of the letters of credit and bankguarantees outstanding at April 30, 2013 have expiration dates during fiscal year 2014.
On August 2, 2010, the Company entered into a $4 million seven-year term loan secured by the Company’s real property andequipment located in Statesville, North Carolina. Amounts outstanding under the term loan were as follows as of April 30:
$ in thousands 2013 2012
Term loan payable $ 3,467 $ 3,667Less: current portion (200) (200)
Long-term debt $ 3,267 $ 3,467
The term loan requires monthly principal payments of $17,000, plus interest calculated at the 30-day LIBOR Market Index Rateplus 1.575%, with payment of the outstanding principal balance and any unpaid interest at the term loan maturity date. In June2010, the Company entered into an interest rate swap agreement with a notional amount that is adjusted to match the outstandingprincipal on the related debt. Accordingly, the interest rate payable by the Company on the term loan was effectively converted to afixed rate of 4.875% beginning August 2, 2010. Scheduled annual principal payments for the term loan are $200,000 for fiscalyears 2014 through 2017 and $2,667,000 for fiscal year 2018.
On May 6, 2013, the Company entered into a new credit and security agreement that replaced and repaid the above credit facilityand term loan. See Note 10 – Subsequent Event for additional information.
Note 4—Income Taxes
Income tax expense consisted of the following:
$ in thousands 2013 2012 2011
Current tax expense (benefit):Federal $ 941 $ 247 $ 300State and local 184 63 124Foreign 791 838 185
Total current tax expense 1,916 1,148 609
Deferred tax expense (benefit):Federal (346) (338) 170State and local (24) (12) 83Foreign (6) (59) 2
Total deferred tax expense (benefit) (376) (409) 255
Net income tax expense $ 1,540 $ 739 $ 864
26

The reasons for the differences between the above net income tax expense and the amounts computed by applying the statutoryfederal income tax rates to earnings before income taxes are as follows:
$ in thousands 2013 2012 2011
Income tax expense at statutory rate $ 1,775 $ 863 $ 1,007State and local taxes, net of federal income tax benefit (expense) 128 3 96Tax credits (state, net of federal benefit) (118) (76) (122)Effects of differing US and foreign tax rates (106) (61) (155)(Decrease) increase in valuation allowance (14) 73 —Other items, net (125) (63) 38
Net income tax expense $ 1,540 $ 739 $ 864
Significant items comprising deferred tax assets and liabilities as of April 30 were as follows:
$ in thousands 2013 2012
Deferred tax assets:Accrued employee benefit expenses $ 568 $ 480Allowance for doubtful accounts 52 95Deferred compensation 1,688 1,446Tax credits 336 375Unrecognized actuarial loss, defined benefit plans 4,309 4,146Other 86 93
Total deferred tax assets 7,039 6,635
Deferred tax liabilities:Book basis in excess of tax basis of property, plant and equipment (1,953) (2,166)Prepaid pension (2,260) (2,180)Other 128 153
Total deferred tax liabilities (4,085) (4,193)
Less: valuation allowance (59) (73)
Net deferred tax assets (liabilities) $ 2,895 $ 2,369
Deferred tax assets classified in the balance sheet:Current $ 654 $ 713Long-term 2,241 1,656
Net deferred tax assets (liabilities) $ 2,895 $ 2,369
At April 30, 2013, the Company had federal tax credit carryforwards in the amount of $50,000 expiring beginning in 2020 andstate tax credit carryforwards in the amount of $286,000, net of federal benefit, expiring beginning in 2014. After a review of theexpiration schedule of the tax credits and future taxable income required to utilize such credits before their expiration, a valuationallowance of $59,000 and $73,000 was recorded at April 30, 2013 and 2012, respectively.
Note 5—Stock Options and Share-Based Compensation
The stockholders approved the 2010 Stock Option Plan for Directors (“2010 Plan”) in fiscal year 2011 which allows the Companyto grant options on an aggregate of 100,000 shares of the Company’s common stock. Under this plan, each eligible director will begranted options to purchase 10,000 shares at the fair market value at the date of grant for a term of five years. These options will beexercisable in four equal installments, one-fourth becoming exercisable on the next August 1 following the date of grant, and one-fourth becoming exercisable on August 1 of each of the next three years. At April 30, 2013, there were 45,000 shares available forfuture grants under the 2010 Plan.
The stockholders approved the 2008 Key Employee Stock Option Plan (“2008 Plan”) in fiscal year 2009 which allows theCompany to grant options on an aggregate of 300,000 shares of the Company’s common stock. This plan replaced the Company’sprevious stock option plans, but certain unexercised options previously granted under the old plans remain outstanding. Under both
27

plans, options were granted at not less than the fair market value at the date of grant and options are exercisable in suchinstallments, for such terms (up to 10 years), and at such times, as the Board of Directors may determine at the time of the grant. AtApril 30, 2013, there were 80,300 shares available for future grants under the 2008 Plan.
The Company recorded stock-based compensation expense in accordance with ASC 718. In order to determine the fair value ofstock options on the date of grant, the Company applied the Black-Scholes option pricing model. Inherent in the model areassumptions related to expected stock-price volatility, option life, risk-free interest rate, and dividend yield. For stock optionsgranted during the fiscal years 2013, 2012 and 2011, the Company believes that its historical share option experience does notprovide a reasonable basis upon which to estimate expected term. The stock options granted have the “plain-vanilla” characteristicsas defined in SEC Staff Accounting Bulletin No. 107 (SAB 107). The Company utilized the Safe Harbor option “SimplifiedMethod” to determine the expected term of these options in accordance with the guidance of SAB 107 for options granted. TheCompany intends to continue to utilize the “Simplified Method” for future grants in accordance with the guidance of SAB 110until such time that the Company believes that its historical share option experience will provide a reasonable basis to estimateexpected term. The fair value of the options granted as shown below was estimated using the Black-Scholes model with thefollowing assumptions:
2013 2012 2011
2008 Plan 2008 Plan 2010 Plan 2008 Plan 2010 Plan
Options granted 40,000 45,000 10,000 56,400 80,000Weighted average expected stock price volatility 51.18% 48.51% 29.92% 47.53% 57.63%Expected option life 6.25 years 6.25 years 2.42 years 6.25 years 3.75 yearsAverage risk-free interest rate 1.35% 2.74% 0.90% 1.80% 0.95%Average dividend yield 4.34% 3.48% 3.38% 2.95% 2.95%Estimated fair value of each option $3.86 $3.06 $1.53 $3.79 $3.83
The stock-based compensation expense is recorded over the vesting period (4 years) for the options granted, net of tax. TheCompany recorded $239,000, $261,000 and $225,000 of compensation expense and $93,000, $100,000 and $86,000 deferredincome tax benefit in fiscal years 2013, 2012 and 2011, respectively. The remaining compensation expense of $373,000 and$145,000 deferred income tax benefit will be recorded over the remaining vesting periods.
The Company utilized treasury stock to satisfy stock options exercised during fiscal years 2013, 2012 and 2011. Stock optionactivity and weighted average exercise price is summarized as follows:
2013 2012 2011
Numberof Shares
WeightedAverageExercise
PriceNumberof Shares
WeightedAverageExercise
PriceNumberof Shares
WeightedAverageExercise
Price
Outstanding at beginning of year 298,050 $11.60 279,800 $11.94 158,925 $12.86Granted 40,000 11.78 55,000 8.90 136,400 10.64Canceled (15,750) 10.57 (22,250) 10.64 (1,675) 11.83Exercised (26,750) 9.86 (14,500) 9.39 (13,850) 9.71
Outstanding at end of year 295,550 $11.84 298,050 $11.60 279,800 $11.94
Exercisable at end of year 157,250 $12.91 126,425 $13.00 81,588 $12.86
The number of options outstanding, exercisable, and their weighted average exercise prices were within the following price rangesat April 30, 2013:
Exercise Price Range
$8.59-$12.66 $14.69-$14.90
Options outstanding 222,700 72,850Weighted average exercise price $10.87 $14.79Weighted average remaining contractual life 6.58 years 4.84 yearsAggregate intrinsic value $485,000 —
Options exercisable 84,400 72,850Weighted average exercise price $11.28 $14.79Aggregate intrinsic value $150,000 —
28

Note 6—Accumulated Other Comprehensive Income (Loss)
The Company’s other comprehensive income (loss) consists of unrealized gains and losses on the translation of the assets,liabilities, and equity of its foreign subsidiaries, changes in the fair value of its cash flow hedges, and additional minimum pensionliability adjustments, net of income taxes. The before tax income (loss), related income tax effect, and accumulated balances are asfollows:
$ in thousandsCash Flow
Hedge
ForeignCurrency
TranslationAdjustment
MinimumPensionLiability
Adjustment
TotalAccumulated
OtherComprehensiveIncome (Loss)
Balance at April 30, 2010 (31) 17 (4,884) (4,898)Foreign currency translation adjustment — 21 — 21Change in fair value of cash flow hedges (172) — — (172)Change in unrecognized actuarial loss on pension obligations — — 88 88Income tax effect 65 — (34) 31
Balance at April 30, 2011 (138) 38 (4,830) (4,930)Foreign currency translation adjustment — (466) — (466)Change in fair value of cash flow hedges (157) — — (157)Change in unrecognized actuarial loss on pension obligations — — (2,753) (2,753)Income tax effect 59 — 1,071 1,130
Balance at April 30, 2012 (236) (428) (6,512) (7,176)Foreign currency translation adjustment — 84 — 84Change in fair value of cash flow hedges 34 — — 34Change in unrecognized actuarial loss on pension obligations — — (419) (419)Income tax effect (13) — 163 150
Balance at April 30, 2013 $ (215) $ (344) $(6,768) $(7,327)
Note 7—Commitments and Contingencies
The Company leases both its primary distribution facility and warehouse facility under non-cancelable operating leases. TheCompany also leases some of its machinery and equipment under non-cancelable operating leases. Most of these leases provide theCompany with renewal and purchase options, and most leases of machinery and equipment have certain early cancellation rights.Rent expense for these operating leases was $2,288,000, $2,425,000 and $2,323,000 in fiscal years 2013, 2012 and 2011,respectively. Future minimum payments under the above non-cancelable lease arrangements for the years ending April 30 are asfollows:
$ in thousands Operating
2014 $1,8322015 1,6712016 1,2982017 1,0882018 825Thereafter 570
Total minimum lease payments $7,284
The Company is involved in certain claims and legal proceedings in the normal course of business which management believeswill not have a material adverse effect on the Company’s consolidated financial condition or results of operations.
29

Note 8—Retirement Benefits
Defined Benefit Plans
The Company has non-contributory defined benefit pension plans covering a significant number of salaried and hourly employees.These plans were amended as of April 30, 2005; no further benefits have been, or will be, earned under the plans subsequent to theamendment date, and no additional participants will be added to the plans. The defined benefit plan for salaried employeesprovides pension benefits that are based on each employee’s years of service and average annual compensation during the last 10consecutive calendar years of employment as of April 30, 2005. The benefit plan for hourly employees provides benefits at statedamounts based on years of service as of April 30, 2005. The Company uses an April 30 measurement date for its defined benefitplans. The change in projected benefit obligations and the change in fair value of plan assets for the non-contributory definedbenefit pension plans for each of the years ended April 30 are summarized as follows:
$ in thousands 2013 2012
Accumulated Benefit Obligation, April 30 $20,683 $19,061
Change in Projected Benefit ObligationsProjected benefit obligations, beginning of year $19,061 $17,328Interest cost 906 942Actuarial loss 1,610 1,611Actual benefits paid (894) (820)
Projected benefit obligations, end of year 20,683 19,061
Change in Plan AssetsFair value of plan assets, beginning of year 14,007 14,979Actual return (loss) on plan assets 1,302 (554)Employer contributions 1,000 402Actual benefits paid (894) (820)
Fair value of plan assets, end of year 15,415 14,007
Funded status – under $ (5,268) $ (5,054)
Amounts Recognized in the Consolidated Balance Sheets consist of:Noncurrent assets $ — $ —Noncurrent liabilities (5,268) (5,054)
Net amount recognized $ (5,268) $ (5,054)
Amounts recognized in accumulated other comprehensive income (loss) consist of:Net actual loss $11,078 $10,658Deferred tax benefit (4,310) (4,146)
After-tax actuarial loss $ 6,768 $ 6,512
Weighted-Average Assumptions Used to Determine Benefit Obligations at April 30Discount rate 4.25% 4.75%Rate of compensation increase N/A N/A
Weighted-Average Assumptions Used to Determine Net Periodic Benefit Cost for Years EndedApril 30Discount rate 4.75% 5.60%Expected long-term return on plan assets 8.50% 8.75%Rate of compensation increase N/A N/A
30

The components of the net periodic pension cost for each of the fiscal years ended April 30 are as follows:
$ in thousands 2013 2012 2011
Interest cost $ 906 $ 942 $ 959Expected return on plan assets (1,213) (1,306) (1,155)Recognition of net loss 1,102 717 687
Net periodic pension cost $ 795 $ 353 $ 491
The estimated net actuarial loss for the defined benefit pension plans that will be amortized from accumulated other comprehensiveincome into net periodic benefit cost during the fiscal year 2014 is $1,138,000.
The Company’s funding policy is to contribute to the plans when pension laws and economics either require or encourage funding.Contributions of $1,000,000 and $402,000 were made to the plan in fiscal years 2013 and 2012, respectively. The Companyanticipates that contributions in the amount of $370,000 will be made to the plans in fiscal year 2014.
The following benefit payments are expected to be paid from the benefit plans in the fiscal years ending April 30:
$ in thousands Amount
2014 $ 1,0502015 1,1222016 1,1992017 1,2202018 1,2662019-2023 6,684
The Company employs a building block approach in determining the long-term rate of return for plan assets. Historical markets arestudied and long-term historical relationships between equities and fixed-income securities are preserved consistent with the widelyaccepted capital market principle that assets with higher volatility generate a greater return over the long-term. Current marketfactors such as inflation and interest rates are evaluated before long-term capital market assumptions are determined. The expectedlong-term portfolio return is established via a building block approach with proper consideration of diversification and rebalancing.Peer data and historical returns are also reviewed to check for reasonableness and appropriateness.
The Company uses a Yield Curve technique methodology to determine its GAAP discount rate. Under this approach, future benefitpayment cash flows are projected from the pension plan on a projected benefit obligation basis. The payment stream is discountedto a present value using an interest rate applicable to the timing of each respective cash flow. The graph of these time-dependentinterest rates is known as a yield curve. The interest rates comprising the Yield Curve are determined through a statistical analysisperformed by the IRS and issued each month in the form of a pension discount curve. For this purpose, the universe of possiblebonds consists of a set of bonds which are designated as corporate, have high quality ratings (AAA, AA, or A) from nationallyrecognized statistical rating organizations, and have at least $250 million in par amount outstanding on at least one day during thereporting period. A 1% increase/decrease in the discount rate for fiscal years 2013 and 2012 would decrease/increase pensionexpense by approximately $166,000 and $152,000, respectively.
The Company uses a total return investment approach, whereby a mix of equities and fixed-income investments are used to attemptto maximize the long-term return on plan assets for a prudent level of risk. Risk tolerance is established through carefulconsideration of plan liabilities, plan funded status, and corporate financial condition. The investment portfolio contains adiversified blend of equity and fixed-income investments. Furthermore, equity investments are diversified across U.S. and non-U.S. stocks, as well as growth, value, and small and large capitalizations. The target allocations based on the Company’sinvestment policy were 70% in equity securities and 30% in fixed-income securities at both April 30, 2013 and April 30, 2012. A1% increase/decrease in the expected return on assets for fiscal years 2013 and 2012 would decrease/increase pension expense byapproximately $143,000 and $149,000, respectively.
31

Plan assets by asset categories as of April 30, 2013 and 2012 were as follows:
$ in thousands 2013 2012Asset Category Amount % Amount %
Equity Securities $ 7,754 50 $ 9,417 67Fixed Income Securities 4,475 29 4,547 33Cash and Cash Equivalents 3,186 21 43 —
Totals $15,415 100 $14,007 100
The following tables present the fair value of the assets in our defined benefit pension plans at April 30, 2013 and 2012:
2013
Asset Category Level 1 Level 2 Level 3
Large Cap $ 5,875 $ — $ —Small/Mid Cap 1,535 — —Emerging Markets 216 — —Real Estate/Commodities 128 — —Fixed Income 4,475 — —Cash and Cash Equivalents 3,186 — —
Totals $15,415 $ — $ —
2012
Asset Category Level 1 Level 2 Level 3
Large Cap $ 5,225 $ — $ —Small/Mid Cap 1,329 — —International 1,202 — —Emerging Markets 1,134 — —Real Estate/Commodities 527 — —Fixed Income 4,547 — —Cash and Cash Equivalents 43 — —
Totals $14,007 $ — $ —
Level 1 retirement plan assets include United States currency held by a designated trustee and equity funds of common andpreferred securities issued by domestic and foreign corporations. These equity funds are traded actively on exchanges and pricequotes for these shares are readily available.
Defined Contribution Plan
The Company has a defined contribution plan covering substantially all salaried and hourly employees. The plan provides benefitsto all employees who have attained age 21, completed three months of service, and who elect to participate. The plan provides thatthe Company make matching contributions equal to 100% of the employee’s qualifying contribution up to 3% of the employee’scompensation, and make matching contributions equal to 50% of the employee’s contributions between 3% and 5% of theemployee’s compensation, resulting in a maximum employer contribution equal to 4% of the employee’s compensation.Additionally, the plan provides that the Company may elect to make a non-matching contribution for participants employed by theCompany on December 31 of each year up to 1% of the participant’s qualifying compensation for that calendar year. TheCompany’s contributions to the plan in fiscal years 2013, 2012 and 2011 were $659,000, $664,000 and $847,000, respectively.
32

Note 9—Segment Information
The Company’s operations are classified into two business segments: Domestic Operations and International Operations. TheDomestic Operations segment principally designs, manufactures, and installs scientific and technical furniture, including steel andwood laboratory cabinetry, fume hoods, laminate casework, flexible systems, worksurfaces, workstations, workbenches, andcomputer enclosures. The International Operations segment, which consists of four foreign subsidiaries as identified in Note 1,provides both the Company’s products and services, including facility design, detailed engineering, construction, and projectmanagement from the planning stage through testing and commissioning of laboratories.
Intersegment transactions are recorded at normal profit margins. All intercompany balances and transactions have been eliminated.Certain corporate expenses shown below have not been allocated to the business segments.
The following table shows revenues, earnings, and other financial information by business segment for each of the three yearsended April 30:
$ in thousandsDomestic
OperationsInternationalOperations Corporate Total
Fiscal Year 2013Revenues from external customers $93,519 $23,602 $ — $117,121Intersegment revenues 6,722 2,443 (9,165) —Depreciation 2,523 130 — 2,653Operating earnings (loss) before income taxes 6,908 2,622 (4,309) 5,221Income tax expense (benefit) 2,025 786 (1,271) 1,540Net earnings attributable to noncontrolling interest — 637 — 637Net earnings (loss) attributable to Kewaunee Scientific Corporation 4,883 1,199 (3,038) 3,044Segment assets 52,252 16,490 — 68,742Expenditures for segment assets 2,314 91 — 2,405Revenues (excluding intersegment) to customers in foreign countries 942 23,602 — 24,544
Fiscal Year 2012Revenues from external customers $83,971 $18,876 $ — $102,847Intersegment revenues 5,290 3,051 (8,341) —Depreciation 2,513 151 — 2,664Operating earnings (loss) before income taxes 3,400 2,472 (3,333) 2,539Income tax expense (benefit) 1,349 779 (1,389) 739Net earnings attributable to noncontrolling interest — 769 — 769Net earnings (loss) attributable to Kewaunee Scientific Corporation 2,051 924 (1,944) 1,031Segment assets 49,373 13,988 — 63,361Expenditures for segment assets 1,395 40 — 1,435Revenues (excluding intersegment) to customers in foreign countries 1,717 18,876 — 20,593
Fiscal Year 2011Revenues from external customers $84,121 $15,882 $ — $100,003Intersegment revenues 3,825 1,297 (5,122) —Depreciation 2,312 175 — 2,487Operating earnings (loss) before income taxes 5,150 1,008 (3,196) 2,962Income tax expense (benefit) 1,650 188 (974) 864Net earnings attributable to noncontrolling interest — 248 — 248Net earnings (loss) attributable to Kewaunee Scientific Corporation 3,500 572 (2,222) 1,850Segment assets 52,812 10,246 — 63,058Expenditures for segment assets 5,070 177 — 5,247Revenues (excluding intersegment) to customers in foreign countries 2,663 15,882 — 18,545
33

Note 10—Subsequent Event
On May 6, 2013, the Company entered into a new credit and security agreement (the “Loan Agreement”) with a new lenderconsisting of (1) a $20 million revolving credit facility which matures on May 1, 2016 (“Line of Credit”), (2) a term loan in theamount of $3,450,000 which matures on May 1, 2020 (“Term Loan A”) and (3) a term loan in the amount of $1,550,000 whichmatures on May 1, 2020 (“Term Loan B” and together with Term Loan A, the “Term Loans”). The Line of Credit provided fundsto refinance all existing indebtedness to the Company’s current lender and for working capital and other general corporatepurposes. In addition, it provides for the issuance of up to $4.7 million of letters of credit for our account. Indebtedness under theLine of Credit bears interest at a variable rate per annum equal to Daily One Month LIBOR plus 1.5% per annum. Payments aredue under Term Loan A in consecutive equal monthly principal payments in the amount of $17,000 until August 1, 2017, and thenin consecutive equal monthly principal payments in the amount of $79,000 each, commencing on September 1, 2017 andcontinuing on the first business day of each month thereafter until May 1, 2020, and at that time, all principal, accrued unpaidinterest and other charges outstanding under Term Loan A shall be due and payable in full. The interest rate on Term Loan A, afterconsideration of interest rate swap agreements, is a fixed rate per annum equal to 4.875%, and effective August 1, 2017, such rateconverts to a fixed rate per annum of 4.37%. Payments are due under the Term Loan B in consecutive equal monthly principalpayments in the amount of $18,000 until May 1, 2020, and at that time, all principal, accrued unpaid interest and other chargesoutstanding under Term Loan B shall be due and payable in full. The interest rate on Term Loan B, after consideration of interestrate swap agreement, is a variable rate per annum equal to One Month LIBOR plus 1.575% per annum, and effective November 3,2014, such rate converts to a fixed rate per annum of 3.07%.
On June 24, 2013, the Company entered into an Agreement (the “Agreement”) through one of its subsidiaries, to purchase the 49%minority ownership of its subsidiary, Kewaunee Labway Asia Pte. Ltd. (the “Subsidiary”) for a total purchase price of $3,550,000.The purchase price includes $1,800,000 representing the minority ownership share of the accumulated undistributed earnings of theSubsidiary reported as noncontrolling interest in the Company’s total equity shown in the Company’s consolidated balance sheet atApril 30, 2013. The terms under the Agreement include payments of $1,775,000 at the date of the agreement, $887,500 on June 24,2014 and $887,500 on June 24, 2015. The Subsidiary and its subsidiary in India, Kewanee Labway India Pvt. Ltd., serve as theCompany’s principal sales and distribution organization for sales to international customers.
Note 11—Consolidated Quarterly Data (Unaudited)
Selected quarterly financial data for fiscal years 2013 and 2012 were as follows:
$ in thousands, except per share amountsFirst
QuarterSecondQuarter
ThirdQuarter
FourthQuarter
Fiscal Year 2013Net sales $26,683 $31,185 $27,450 $31,803Gross profit 5,243 5,227 5,009 6,779Net earnings 688 807 782 1,404Less: net earnings attributable to the noncontrolling interest 54 158 238 187Net earnings attributable to Kewaunee Scientific Corporation 634 649 544 1,217
Net earnings per share attributable to Kewaunee Scientific CorporationBasic 0.25 0.25 0.21 0.47Diluted 0.25 0.25 0.21 0.46
Cash dividends per share 0.10 0.10 0.10 0.10
Fiscal Year 2012Net sales $26,321 $25,962 $21,574 $28,990Gross profit 4,188 3,845 3,771 7,352Net earnings (loss) 108 (156) 34 1,814Less: net earnings (loss) attributable to the noncontrolling interest 86 (31) 156 558Net earnings (loss) attributable to Kewaunee Scientific Corporation 22 (125) (122) 1,256
Net earnings (loss) per share attributable to Kewaunee Scientific CorporationBasic 0.01 (0.05) (0.05) 0.49Diluted 0.01 (0.05) (0.05) 0.49
Cash dividends per share 0.10 0.10 0.10 0.10
34

CONSENT OF INDEPENDENT REGISTERED PUBLIC ACCOUNTING FIRM
We hereby consent to the incorporation by reference in the Registration Statements on Form S-8, (No. 333-98963, No. 333-160276and No. 333-176447) of Kewaunee Scientific Corporation of our report dated July 18, 2013 relating to the consolidated financialstatements which report appears in this Form 10-K.
/s/ CHERRY BEKAERT LLPCharlotte, North Carolina
July 18, 2013
Item 9. Changes in and Disagreements with Accountants on Accounting and Financial Disclosure
None
Item 9A. Controls and Procedures
Conclusion Regarding the Effectiveness of Disclosure Controls and Procedures
We maintain disclosure controls and procedures that are intended to ensure that the information required to bedisclosed in our filings under the Securities Exchange Act of 1934 (the “Exchange Act”) is properly and timely recorded,processed, summarized, and reported. Our management, including the Chief Executive Officer and Chief Financial Officer, haveconducted an evaluation of the effectiveness of disclosure controls and procedures as of April 30, 2013 pursuant to Exchange ActRule 13a-14. Based on that evaluation, the Chief Executive Officer and Chief Financial Officer concluded that the disclosurecontrols and procedures are effective to provide reasonable assurance that we are able to collect, process, record, and disclose,within the required time periods, the information we are required to disclose in the reports filed with the Securities and ExchangeCommission. In designing disclosure controls and procedures, we recognize that any controls and procedures, no matter how welldesigned and operated, can provide only reasonable assurance of achieving desired control objectives, and that managementnecessarily is required to apply its judgment in evaluating the cost-benefit relationship of possible controls and procedures.Nevertheless, we believe that our disclosure controls and procedures are effective.
Management’s Report on Internal Control Over Financial Reporting
Management is responsible for establishing and maintaining adequate internal control over financial reporting for theCompany. Internal control over financial reporting is a process designed to provide reasonable assurance regarding the reliabilityof financial reporting and the preparation of financial statements for external purposes in accordance with accounting principlesgenerally accepted in the United States. Management conducted an evaluation of the effectiveness of internal control over financialreporting based on the framework in Internal Control – Integrated Framework issued by the Committee of SponsoringOrganizations of the Treadway Commission. Based on this evaluation, Management concluded the Company maintained effectiveinternal control over financial reporting as of April 30, 2013.
Because of its inherent limitations, internal control over financial reporting may not prevent or detect misstatements. Inaddition, projections of any evaluation of effectiveness to future periods are subject to the risk that controls may becomeinadequate because of changes in conditions, or that the degree of compliance with the policies or procedures may deteriorate.
This annual report does not include an attestation report of our registered public accounting firm regarding internalcontrol over financial reporting. Management’s report was not subject to attestation by our registered public accounting firmpursuant to rules of the Securities and Exchange Commission that permit us to provide only management’s report in this AnnualReport.
Changes in Internal Control Over Financial Reporting
There have been no significant changes in our internal controls over financial reporting that occurred during our fourth fiscalquarter that have materially affected, or are reasonably likely to materially affect, our internal controls over financial reporting.
Item 9B. Other Information
None.
35

PART III
Item 10. Directors, Executive Officers and Corporate Governance
(a) The information appearing in the sections entitled “Election of Directors” and “Meetings and Committees of theBoard” included in our Proxy Statement for use in connection with our annual meeting of stockholders to be held onAugust 28, 2013 (the “Proxy Statement”) is incorporated herein by reference. The Proxy Statement will be filed withthe SEC within 120 days of our most recently completed fiscal year.
(b) The names and ages of our executive officers as of July 8, 2013 and their business experience during the past fiveyears are set forth below:
Executive Officers
Name Age Position
David M. Rausch 54 President and Chief Executive Officer
D. Michael Parker 61 Senior Vice President, Finance,Chief Financial Officer,Treasurer and Secretary
K. Bain Black 67 Vice President, Sales and Marketing,Healthcare and Technical Products
Dana L. Dahlgren 57 Vice President, Sales and Marketing,Laboratory Products
Elizabeth D. Phillips 36 Vice President, Human Resources
Kurt P. Rindoks 55 Vice President, Engineering and Product Development
Keith D. Smith 44 Vice President, Manufacturing
Sudhir K. (Steve) Vadehra 66 Vice President, International Operations
David M. Rausch has served as President and Chief Executive Officer since July 1, 2013. He joined the Company inMarch 1994 as Manager of Estimating and was promoted to Southeast Regional Sales Manager in December 1996, then to Directorof Sales for Network Storage Systems products in May 2000. In August 2001, he was promoted to Project Sales Manager, and inthis position, he also had direct management responsibility for the Estimating Department. Mr. Rausch was elected Vice Presidentof Construction Services in June 2007. In June 2011, he was elected Senior Vice President of Construction Services and GeneralManager of the Laminate Furniture Division, and in March 2012, he was elected President and Chief Operating Officer.
D. Michael Parker joined the Company in November 1990 as Director of Financial Reporting and Accounting and waspromoted to Corporate Controller in November 1991. Mr. Parker has served as Chief Financial Officer, Treasurer and Secretarysince August 1995. He was elected Vice President of Finance in August 1995 and Senior Vice President of Finance in August2000.
K. Bain Black joined the Company in August 2004 as the General Sales Manager for the Technical Products Group. Hewas elected Vice President and General Manager of the Technical Products Group, effective July 1, 2005 and Vice President, Salesand Marketing of Healthcare and Technical Products, effective June 27, 2012. Prior to joining the Company, Mr. Black wasDirector of Marketing for Newton Instrument Company, a manufacturer of products for the telecom industry, from 2001 to 2003.Prior thereto, he was a partner and President of TechMetals, LLC beginning in 1997.
Dana L. Dahlgren joined the Company in November 1989 as a Regional Sales Manager and was promoted to Directorof Sales and Marketing of the Laboratory Products Group in September 1998. Mr. Dahlgren was elected Vice President of Salesand Marketing of the Laboratory Products Group in June 2004.
Elizabeth D. Phillips joined the Company in August 2006 as Human Resources and Training Manager. She waspromoted to Director of Human Resources in June 2007 and was elected Vice President of Human Resources in June 2009. Prior tojoining the Company, she was Director of Human Resources for Vanguard Furniture Co., Inc., a manufacturer of householdfurniture, from April 2004 until August 2006.
Kurt P. Rindoks joined the Company in January 1985 as an engineer. He was promoted to Director of ProductDevelopment in August 1991 and assumed the additional responsibilities of Director of Engineering in July 1995. He has served asVice President of Engineering and Product Development since September 1996. Additionally, from May 1998 through October2001, he served as General Manager of the Company’s Resin Materials Division.
36

Keith D. Smith joined the Company in 1993 as a department supervisor in the Metal Plant and served as Resin PlantManager from 1995 until April 2001 when he was promoted to Wood Plant Manager. He served as Wood Plant Manager until heassumed the position of Director of Manufacturing in November 2003, a position he held until he was promoted to Vice Presidentof Manufacturing, effective July 1, 2005.
Sudhir K. (Steve) Vadehra joined the Company in October 1999. He was elected Vice President of InternationalOperations in June 2004. He also has served as the Managing Director of Kewaunee Labway Asia Pte. Ltd., the Company’s jointventure subsidiary in Singapore, since the subsidiary’s formation in June 1998.
Section 16(a) Beneficial Ownership Reporting Compliance
The information appearing in the section entitled “Securities Ownership of Certain Beneficial Owners – Section 16(a)Beneficial Ownership Reporting Compliance” in the Proxy Statement is incorporated herein by reference.
Code of Ethics
A copy of our code of ethics that applies to our Chief Executive Officer and Chief Financial Officer, entitled “EthicsObligations for Chief Executive Officer and Employees with Financial Reporting Responsibilities,” is available free of chargethrough our website at www.kewaunee.com.
Audit Committee
The information appearing in the section entitled “Election of Directors – Meetings and Committees of the Board” inour Proxy Statement is incorporated herein by reference.
Item 11. Executive Compensation
The information appearing in the sections entitled “Compensation Discussion and Analysis,” “Compensation Tables,”“Agreements with Certain Executives,” and “Election of Directors – Compensation Committee Interlocks and InsiderParticipation” in the Proxy Statement is incorporated herein by reference.
Item 12. Security Ownership of Certain Beneficial Owners and Management and Related Stockholder Matters
The information appearing in the sections entitled “Security Ownership of Directors and Executive Officers” and“Security Ownership of Certain Beneficial Owners” in the Proxy Statement is incorporated herein by reference.
The following table sets forth certain information as of April 30, 2013 with respect to compensation plans under whichour equity securities are authorized for issuance:
Plan Category
Number ofsecurities to be
issued uponexercise of
outstandingoptions, warrants
and rights(a)
Weighted averageexercise price of
outstanding options,warrants and rights
(b)
Number of securitiesremaining available forfuture issuance underequity compensation
plans (excludingsecurities reflected in
column (a))(c)
Equity Compensation Plans approved by Security Holders:
2000 Key Employee Stock Option Plan 40,100 $14.88 —
2008 Key Employee Stock Option Plan 205,450 $11.55 80,300
2010 Stock Option Plan for Directors 50,000 $10.58 45,000
Equity Compensation Plans not approved by Security Holders: — — —
Refer to Note 5 of the Company’s consolidated financial statements for additional information.
Item 13. Certain Relationships and Related Transactions, and Director Independence
The information appearing in the sections entitled “Election of Directors” and “Agreements with Certain Executives”in the Proxy Statement is incorporated herein by reference.
Item 14. Principal Accountant Fees and Services
The information appearing in the section entitled “Independent Registered Public Accounting Firm – Audit Fees andNon-Audit Fees” in the Proxy Statement is incorporated herein by reference.
37

PART IV
Item 15. Exhibits and Financial Statement Schedules
The following documents are filed or incorporated by reference as part of this Annual Report:
Page
(a)(1) Consolidated Financial Statements
Report of Independent Registered Public Accounting Firm Cherry Bekaert LLP 15
Consolidated Statements of Operations – Years ended April 30, 2013, 2012 and 2011 16
Consolidated Statements of Comprehensive Income (Loss) – Years ended April 30, 2013, 2012 and 2011 17
Consolidated Statements of Stockholders’ Equity – Years ended April 30, 2013, 2012 and 2011 18
Consolidated Balance Sheets – April 30, 2013 and 2012 19
Consolidated Statements of Cash Flows – Years ended April 30, 2013, 2012 and 2011 20
Notes to Consolidated Financial Statements 21
Consent of Independent Registered Public Accounting Firm 35
(a)(2) Consolidated Financial Statement Schedules
Financial statement schedules have been omitted because the information required has been separately disclosedin the consolidated financial statements or related notes.
(a)(3) Exhibits
Exhibits required by Item 601 of Regulation S-K are listed in the Exhibit Index, which is attached hereto at pages40 through 41 and which is incorporated herein by reference.
38

SIGNATURES
Pursuant to the requirements of Section 13 or 15(d) of the Securities Exchange Act of 1934, the Registrant has dulycaused this report to be signed on its behalf by the undersigned, thereunto duly authorized.
KEWAUNEE SCIENTIFIC CORPORATION
By: /s/ David M. Rausch
David M. RauschPresident and Chief Executive Officer
Date: July 18, 2013
Pursuant to the requirements of the Securities Exchange Act of 1934, the following persons on behalf of the Registrantand in the capacities and on the dates indicated have signed this report below.
(i) Principal Executive Officer ))
/s/ David M. Rausch )David M. Rausch )President and Chief Executive Officer )
)(ii) Principal Financial and Accounting Officer )
)/s/ D. Michael Parker )D. Michael Parker )Senior Vice President, Finance )Chief Financial Officer, )Treasurer and Secretary )
)(iii) A majority of the Board of Directors: ) July 18, 2013
))
/s/ John C. Campbell, Jr. /s/ David S. Rhind )John C. Campbell, Jr. David S. Rhind )
))
/s/ Ross W. McCanless /s/ John D. Russell )Ross W. McCanless John D. Russell )
))
/s/ Margaret B. Pyle /s/ Donald F. Shaw )Margaret B. Pyle Donald F. Shaw )
))
/s/ David M. Rausch /s/ William A. Shumaker )David M. Rausch William A. Shumaker )
))
39

[THIS PAGE INTENTIONALLY LEFT BLANK]

BOARD OF DIRECTORS John C. Campbell, Jr. Retired Private Consultant Ross W. McCanless Chief Legal Officer HVM, L.L.C. Margaret B. Pyle Attorney Vice , Chief Legal Counsel The Pyle Group
David M. Rausch President, Chief Executive Officer Kewaunee Scientific Corporation David S. Rhind Deputy General Counsel Hudson Global, Inc. John D. Russell
Former Chief Executive Officer Maysteel, LLC
Donald F. Shaw Retired CEO ISEC, Inc. William A. Shumaker Chairman of the Board Kewaunee Scientific Corporation
_________________________________________________________________________________________________________ EXECUTIVE OFFICERS David M. Rausch President, Chief Executive Officer
D. Michael Parker Senior Vice President, Finance, Chief Financial Officer, Treasurer, Secretary
K. Bain Black Vice President, Sales & Marketing Healthcare & Technical Products
Dana L. Dahlgren Vice President, Sales & Marketing Laboratory Products
Elizabeth D. Phillips Vice President, Human Resources
Kurt P. Rindoks Vice President, Engineering & Product Development
Keith D. Smith Vice President, Manufacturing
Sudhir K. Vadehra Vice President, International Operations
_________________________________________________________________________________________________________
CORPORATE HEADQUARTERS 2700 West Front Street Statesville, NC 28677-2927 P.O. Box 1842, Statesville, NC 28687-1842 Telephone: 704-873-7202 Facsimile: 704-873-1275
INTERNATIONAL HEADQUARTERS Kewaunee Labway Asia Pte. Ltd. 194 Pandan Loop, #6-22 Pantech Industrial Complex Singapore 128 383 Telephone: 65-6773-0288 Facsimile: 65-6773-2322
STOCKHOLDER INFORMATION Financial Information The Company’s Form 10-K financial report, filed annually with the Securities and Exchange Commission, may be obtained by stockholders without charge on the Internet at http://www.kewaunee.com or by writing the Secretary of the Company, Kewaunee Scientific Corporation, P.O. Box 1842, Statesville, NC 28687-1842. The Company’s common stock is listed on the NASDAQ Global Market. Trading symbol: KEQU Recent financial information and Company news is available on the Internet at http://www.kewaunee.com. Notice of Annual Meeting The Annual Meeting of Stockholders of Kewaunee Scientific Corporation will be held at The Conference Center at UBS Tower, One North Wacker Drive, 2nd Floor, Chicago, IL on August 28, 2013, at 10:00 a.m. Central Daylight Time.
Transfer Agent and Registrar All stockholder inquiries, including transfer-related matters, should be directed to: Computershare, P.O. Box 43006, Providence, RI 02940-3006 [correspondence] or 250 Royall Street, Canton, MA 02021 [courier service] Telephone: 800-522-6645. Shareholder website at: www.computershare.com/investor Internet at: http://www.us.computershare.com/investor/Contact
Independent Registered Public Accounting Firm Cherry Bekaert LLP Charlotte, NC
PRODUCT INFORMATION Kewaunee Scientific Corporation products are available through a network of sales representatives, a national stocking distributor, and international subsidiaries. For more information on the Company’s laboratory products: Telephone: 877-539-2863 On the Internet at http://www.kewaunee.com E-mail: [email protected] For more information on the Company’s healthcare and technical products: Telephone: 800-824-6626 On the Internet at http://www.kewaunee.com E-mail: [email protected]. For more information on the Company’s laminate furniture products: Telephone: 877-572-6610 On the Internet at http://www.kewaunee.com E-mail: [email protected]
EMPLOYMENT OPPORTUNITIES Individuals interested in employment with Kewaunee Scientific Corporation should contact the Vice President of Human Resources, Kewaunee Scientific Corporation, P.O. Box 1842, Statesville, NC 28687-1842. Employment opportunities are also listed on the Internet at http://www.kewaunee.com. Kewaunee Scientific Corporation is an equal opportunity employer.
Managing Director, ForteONE Chairman

P.O. Box 1842 Statesville, NC 28687-1842 Phone: (704) 873-7202 Fax: (704) 873-1275Web Site: www.kewaunee.com


![NUCLEAR REGULATORY COMMISSION [Docket … › public-inspection.federal...NUCLEAR REGULATORY COMMISSION [Docket Nos. 50-305; NRC-2017-0121] Dominion Energy Kewaunee, Inc. Kewaunee](https://img.dokumen.tips/doc/110x75/5f0d232f7e708231d438dcc6/nuclear-regulatory-commission-docket-a-public-inspectionfederal-nuclear-regulatory.jpg)