Embed Size (px)
DESCRIPTION
A review of important data from ACICS-accredited schools.
Citation preview

43%43%
91
69
16
STATISTICS
OPERATINGKEY
2013
Accrediting Council for Independent Colleges and Schools
Data Collected fro
m the 2013 Campus Accountabilit
y Reports


Introduction ...........................................................................................................1
Enrollment Data ....................................................................................................4
Top Programs .........................................................................................................6
Retention and Placement Data .......................................................................8
Average Program Contact Hours by Degree Level and Program ..... 15
Average Tuition and Fees by Degree Level and Program ................... 22
Annual Financial Report Data ........................................................................ 29
Income Statement Data ................................................................................... 30
Balance Sheet Data ........................................................................................... 39
Analysis of Balance Sheet Data ..................................................................... 67
Table of Contents


INTRODUCTION
The review and analysis of quality at more than 900 colleges and schools accredited by
ACICS includes a strong emphasis on accountability, and a particular focus on student
achievement refl ected in academic persistence (retention); placement in an employ-
ment opportunity (an indication of successful completion of the program) and for pro-
fessions and occupations requiring licensure, the rate at which graduates pass licensure
examinations. The institutions are required to collect data on these performance and
accountability metrics continuously; submit them in the annual ACICS Campus Ac-
countability Report (CAR); defend the data’s veracity and accuracy when challenged;
and to imbed strategies and initiatives to continuously improve these metrics within
their organization’s strategic plan, operating culture, hierarchy of values and system of
accountability. In summary, the data disclosed in the annual Key Operating Statistics
refl ect an important dimension of the quality assurance review applied to ACICS cam-
puses on a regular and formal basis.
Reaching or exceeding the Council’s expectations for these key student achievement
metrics is necessary, but not suffi cient, to retain good standing with ACICS standards of
quality and integrity. In addition to the quantitative, verifi ed data reviewed each year,
every campus is subject to an in-person discovery every three to six years that yields
an intensive review through direct observation, interviews and fi le reviews. The peer-
based teams who conduct site visits complement the reported quantitative data with
physical on-site review and professional insight.
It is the combination of all of these activities – annual performance data, site visits and
the subsequent dialogue between the institutions and the Council – that validate and
affi rm the commitment to quality and integrity. The 2013 Summary of Key Operating
Statistic is off ered for review in that context.


ACICS-ACCREDITED SCHOOLSACICS-ACCREDITED SCHOOLS

4
Non-degree 174
Occupational Associate’s Degree 126
Academic Associate’s Degree 234
Bachelor’s Degree 302
Master’s Degree 76
Doctoral Degree 4
TOTAL 916
NUMBER OF
ACICS-ACCREDITED SCHOOLS
Florida 97
California 77
Ohio 55
Pennsylvania 53
Texas 44
STATES WITH MOST
ACICS-ACCREDITED SCHOOL
CREDENTIAL LEVEL
Indicates the highest level of programs an institu-tion off ers under its grant of accreditation.
INSTITUTION
A main campus and any additional locations of that main campus. As an institutional accreditor, ACICS accredits institutions as a whole and does not sepa-rately accredit individual campuses or programs.
ENROLLMENT AT THE BEGINNING OF THE RE-
PORTING PERIOD
The number of students enrolled on July 1. Enroll-ment represents the unduplicated* student head-count.
DEFINITIONS USED BY INSTITUTIONS WHEN
PROVIDING ENROLLMENT INFORMATION
NEW STARTS
The number of students enrolled for the fi rst time or who graduated from a program and enrolled for the fi rst time in a diff erent program between July 1 and June 30 of the subsequent year.
RE-ENTRIES
The number of returning students who enrolled in the institution between July 1 and June 30, who had previously withdrawn from the institution.
ENROLLMENT DATAENROLLMENT DATA
Puerto Rico 34
Indiana 34
New York 32
Virginia 33
Kentucky 25
* Subtraction of duplicates caused by students enrolled in more than one program during the CAR reporting period.

5Enrollment Data
STUDENT ENROLLMENT BY CREDENTIAL LEVEL
0
50,000
100,000
150,000
200,000
250,000
300,000
DoctoralDegree
Master'sDegree
Bachelor'sDegree
AcademicAssociate's
Degree
OccupationalAssociate's
Degree
Non-Degree
125,102
79,958
149,833
264,062
150,231
1,690
Credential Level
Num
ber o
f Stu
dent
s
TOTAL NUMBER OF STUDENTS ENROLLED AT ACICS-ACCREDITED SCHOOLS
0
200,000
400,000
600,000
800,000
1,000,000
20132012201120102009
700,775
881,262 899,141846,082
770,876
Reporting Year
Num
ber o
f Stu
dent
s

6
MEDIAN ENROLLMENTAVERAGE ENROLLMENT
0
200
400
600
800
1,000
1,200
20132012201120102009
956899
842
1,077 1,046
0
100
200
300
400
500
600
700
800
20132012201120102009
705
791 774
673
588
0 300 600 900 1200 1500Information Technology
Medical Office Assistant
Medical Administrative Assistant
Massage Therapy
Computer and Electronics Engineering Technology
Legal Assistant/Paralegal
Accounting
Criminal Justice/Law Enforcement
Medical/Clinical Assistant
Business Administration &
Management1,213
735
684
510
498
361
339
334
330
329
TOP PROGRAMS BY
NUMBER OFFERED
0 20,000 40,000 60,000 80,000 100,000Securities Services Administration/Management
System, Networking, & LAN/WAN Management/Manager
Computer & Electronics Engineering Technology
Nursing
Medical Administrative Assistant
Cooking & Related Culinary Arts
Business and Related Support Services, Other
Criminal Justice/Law Enforcement
Business Administration & Management
Medical/95,721
46,622
34,624
25,767
25,562
25,307
22,769
22,717
21,032
19,051
Clinical Assistant
TOP PROGRAMS
BY ENROLLMENT
Reporting YearReporting Year

7
All
Institutions
N = 916
Non-degree
N = 174
Occupational
Associate’s
N = 126
Academic
Associate’s
N = 234
Bachelor’s
N = 302
Master’s
N = 76
Enrollment at Beginning of Period 388,171* 54,324 39,647 74,439 145,562 73,261
New Starts 352,105 68,103 37,302 69,395 106,978 69,588
Reentries 30,600* 2,675 3,009 5,999 11,522 7,382
Total Enrollment During
Reporting Year
770,876 125,102 79,958 149,833 264,062 150,231
Number of Enrollees Without a
High School Diploma or
Equivalent While Enrolled
16,247 9,484 2,987 2,020 530 1,226
Number of Enrollees Who Obtained a GED
Certifi cate While Enrolled
774 88 379 147 86 74
Number of Enrollees in One or More Courses
through Distance Learning
189,674 1,833 9,401 10,421 55,669 112,076
Completed a Full Program 3,740 1,557 285 965 429 488
Graduated from a Program 180,524 42,196 21,312 45,219 52,833 18,455
Withdrew due to Military Service 770 25 67 132 407 139
Withdrew 679 90 75 197 257 60
Still Enrolled at the End of the Period 260 37 30 58 94 41
Students Who Withdrew to Accept Employ-
ment in Their Field of Training
219 67 16 11 33 92
N = Number of ACICS-Accredited Institutions
Note: Institutions are classifi ed according to the highest credential awarded, but they also may off er lower credentials. For example, a bachelor’s degree institution also may off er non-degree
or associate’s degree programs. The enrollment descriptions above are for institutions as a whole and may include students in lower level programs.
*Total includes doctoral level institutions.
Enrollment Data

8
Institutions report retention outcomes based on the total enrollment and withdrawals during the reporting period. The following defi nitions apply in determining the appropriate retention classifi cation. The Council’s benchmark stan-dard for retention in the 2013 reporting year was 70% and the compliance standard was 60%. It refl ects the Council’s emphasis on the value of retaining students from one term to the next as a fundamental element of student success; i.e., retention leads to completion , completion leads to graduation and graduation leads to employment and partici-pation in economic opportunity.
RETENTION DATA
Withdrawal
A student who is no longer enrolled at the institution and…
1. has failed to attend the full length of the program;
2. has not maintained satisfactory academic progress;
3. has failed courses or substitute courses permitted by the institution;
4. has not attained speeds or competencies required;
5. is not eligible for a credential; or
6. failed to meet the institution’s attendance and/or graduation requirements.
…is considered to be withdrawn from enrollment.
Retention Rates
Retention rates are calculated for each institution according to standard formulas adopted by the Council. For pur-poses of calculating retention, students who withdraw due to military service or to enroll in another institution under the same owner are not included in the retention rate calculation.
Retention Percentage Rate = ((A-B)-C) / (A-B)
A = Beginning Enrollment and Reentries and New Starts
B = Withdrew to enroll in institution with common ownership
C = Withdrawals
RETENTION & PLACEMENT DATARETENTION & PLACEMENT DATA

9
2013 Retention Rates by Credential Level
Credential Level
Re
ten
tio
n R
ate
(%
)
65
70
75
80
85
Master'sDegree
Bachelor'sDegree
Academic Associate's
Degree
OccupationalAssociate's
Degree
Non-Degree
78
70
7574 73
Note: Approximately two-thirds of institutions have retention rates within one standard deviation (+ or -) of the average
Reporting Year
Re
ten
tio
n R
ate
(%
)
Average Retention Rates by Reporting Year
0
10
20
30
40
50
60
70
80
20132012201120102009
75
8
72
10
73
9
73
11
73
9
Standard Deviation
Retention Rate
Retention & Placement Data

10
Institutions report placement outcomes for graduates and completers as of the submission date of the CAR. The following defi nitions apply in determining the appropriate placement classifi cation.
PLACEMENT DATA
Completer
A student who is no longer enrolled at the institution and who either has completed the time allowed or has attempted the maximum allowable number of credits for the program of study, but who did not accomplish one of the following graduation require-ments: (1) achieved a grade point aver-age of at least 2.0; (2) attained required competencies or speed skills; or (3) satisfi ed non-academic requirements.
Graduate
A student who has (1) achieved a grade point average of 2.0 or greater at graduation; (2) successfully passed all courses in the program or substitute courses permitted by the institution;
(3) attained required competencies or speed levels in all courses; (4) met all clinical, internship, and externship requirements; (5) satisfi ed all non-aca-demic requirements such as payment of tuition and fees, return of books, etc.; (6) satisfi ed all other academic re-quirements for graduation; (7) received the appropriate credential; and (8) ceased enrollment in the program.
In-Field or Related Field
A graduate is employed in a position that requires direct use of the skills taught in the program or a graduate is employed in a position that requires indirect use of the skills taught in the program.
Out-of-Field
A graduate is employed in a position that does not require use of the skills taught in the program.
Not Available
A graduate is documented as unavail-able for placement because of preg-nancy or other health-related situa-tions; continuing education; active military service; ineligibility for place-ment in the United States due to visa status; or completion of a stand-alone English as a Second Language (ESL)program for which placement typically is not off ered.
Standards
Benchmark = 70%Compliance = 60%
Placement rates are calculated for each institution according to standard formulas adopted by the Council.
Placement Percentage Rate = (IFRF) / (G – U)
IFRF = Placed in Field or Placed in Related Field G = Graduates and Completers
U = Unavailable for Placement
All Institutions Non-Degree
Occupational
Associate’s Degree
Academic
Associate’s Degree Bachelor’s Degree Master’s Degree
Total Number of Completers and
Graduates Eligible for Placement
184,264 43,753 21,597 46,184 53,262 18,943
Placed in Field of or in a Related
Field of Study
110,893 25,230 14,117 29,217 32,283 9,933
Placed Out of Field of Study
(Employed Not Placed)
445 48 65 134 129 69
Not Available Due to Pregnancy or
Other Health Situation
2,520 583 411 68 94 981
Not Available Due to Continuing
Education
824 464 144 59 0 144
Not Available Due to Active
Military Service
46,045* 13,006 4,635 11,659 12,483 4,262
International Student Possessing
an I-20 Visa
154 25 18 49 35 26
ESL Completers or Graduates 2,948 575 495 530 852 491
Not Employed (Not Working) 386 9 17 337 23 0
Note: Data does not include institutions that did not have students eligible for placement.
** Data does not include institutions that reported zeros for both retention and placement where applicable.
*Total includes doctoral students

11
2013 Average Placement Rates by Credential Level
Credential Level
Pla
ce
me
nt
Ra
te (
%)
0
20
40
60
80
100
Master'sDegree
Bachelor'sDegree
AcademicAssociate's
Degree
OccupationalAssociate's
Degree
Non-Degree
6976 72 72
77
Note: Data excludes institutions that did not have students eligible for placement.
2013 Average Placement Rates by Reporting Year
Reporting Year
Pla
ce
me
nt
Ra
te (
%)
0
20
40
60
80
100
Standard Deviation
Placement Rate
20132012201120102009
74
10
71
11
70
13
66
21
72
12
Note: Approximately two-thirds of insti-tutions have retention rates with one standard deviation (+ or -) of the average
Retention & Placement Data
12
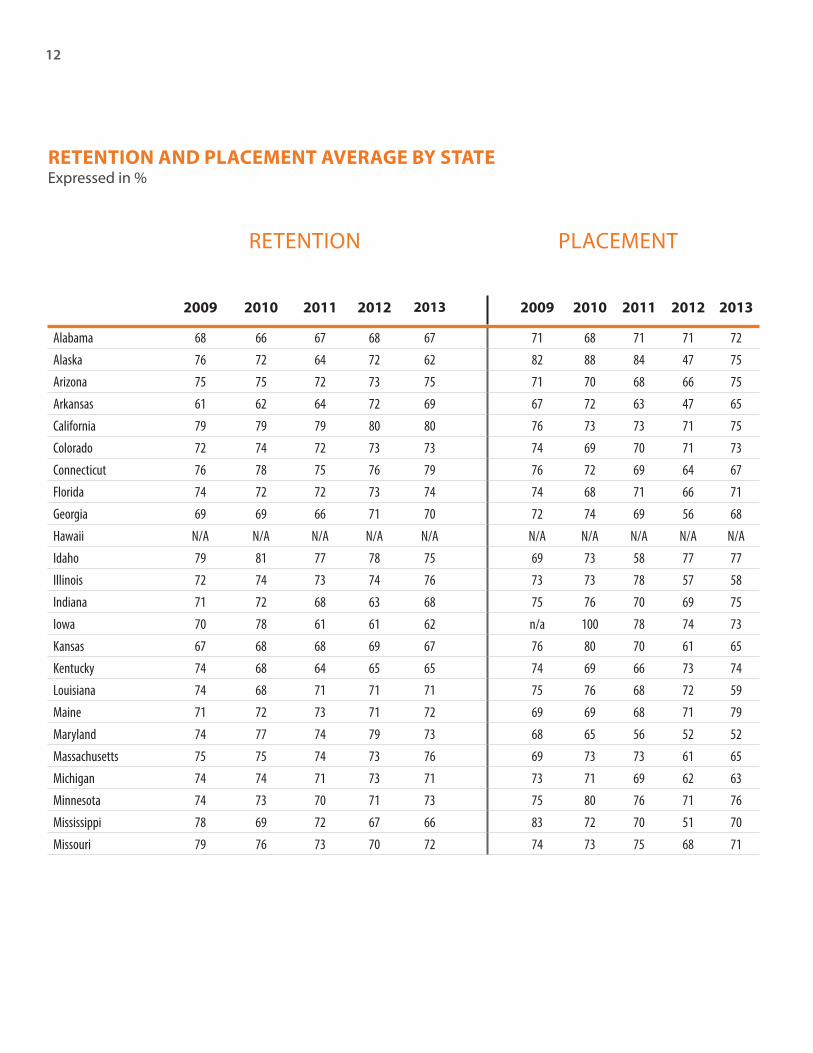
2009 2010 2011 2012 2013 2009 2010 2011 2012 2013
Alabama 68 66 67 68 67 71 68 71 71 72
Alaska 76 72 64 72 62 82 88 84 47 75
Arizona 75 75 72 73 75 71 70 68 66 75
Arkansas 61 62 64 72 69 67 72 63 47 65
California 79 79 79 80 80 76 73 73 71 75
Colorado 72 74 72 73 73 74 69 70 71 73
Connecticut 76 78 75 76 79 76 72 69 64 67
Florida 74 72 72 73 74 74 68 71 66 71
Georgia 69 69 66 71 70 72 74 69 56 68
Hawaii N/A N/A N/A N/A N/A N/A N/A N/A N/A N/A
Idaho 79 81 77 78 75 69 73 58 77 77
Illinois 72 74 73 74 76 73 73 78 57 58
Indiana 71 72 68 63 68 75 76 70 69 75
Iowa 70 78 61 61 62 n/a 100 78 74 73
Kansas 67 68 68 69 67 76 80 70 61 65
Kentucky 74 68 64 65 65 74 69 66 73 74
Louisiana 74 68 71 71 71 75 76 68 72 59
Maine 71 72 73 71 72 69 69 68 71 79
Maryland 74 77 74 79 73 68 65 56 52 52
Massachusetts 75 75 74 73 76 69 73 73 61 65
Michigan 74 74 71 73 71 73 71 69 62 63
Minnesota 74 73 70 71 73 75 80 76 71 76
Mississippi 78 69 72 67 66 83 72 70 51 70
Missouri 79 76 73 70 72 74 73 75 68 71
RETENTION AND PLACEMENT AVERAGE BY STATEExpressed in %
RETENTION PLACEMENT

13
2009 2010 2011 2012 2013 2009 2010 2011 2012 2013
Nebraska 71 72 70 77 64 67 75 72 35 84
Nevada 80 79 75 77 77 74 70 63 69 70
New Hampshire 95 88 88 84 85 66 70 41 65 67
New Jersey 78 76 76 78 76 77 73 73 69 70
New Mexico 81 82 77 72 75 78 70 69 75 68
New York 74 76 74 72 77 74 72 69 65 68
North Carolina 71 69 69 67 70 73 74 70 58 71
North Dakota N/A N/A N/A N/A N/A N/A N/A N/A N/A N/A
Ohio 74 69 65 68 68 74 73 70 69 74
Oklahoma 68 70 70 73 69 80 68 74 73 76
Oregon 78 78 79 77 80 69 66 68 61 66
Pennsylvania 76 75 74 74 75 76 75 75 69 70
Puerto Rico 75 71 68 69 71 73 72 69 66 67
Rhode Island 76 76 77 75 81 70 65 70 68 58
South Carolina 75 79 71 72 73 80 76 76 66 68
South Dakota n/a 62 60 68 75 n/a 73 81 82 85
Tennessee 70 69 67 68 67 74 68 69 67 69
Texas 75 76 72 72 73 71 67 66 61 70
Utah 74 72 69 71 72 81 79 75 70 68
Virginia 73 75 73 75 75 75 71 62 67 71
Washington 78 81 77 72 75 70 68 67 61 66
West Virginia 70 71 73 68 70 73 73 76 76 80
Wisconsin 72 76 68 66 70 71 70 57 59 71
Wyoming 70 69 68 66 70 90 85 90 72 85
International 85 78 84 81 82 82 82 80 61 60
RETENTION PLACEMENT
Retention & Placement Data

14

ACICS monitors average program lengths and tuition and fees of similar programs of study of its accredited institutions as required by the U.S. Department of Education. Further, the Accreditation Criteria specifi es that the Council will collect and provide data relative to program length and tuition and fees for all ACICS-accredited institutions.
The charts on the following pages identify the average program length and tuition and fees charged by credential for selected programs. The data were derived from the statistical information reported on the 2013 Campus Accountability Reports (CAR) by all ACICS-accredited institutions. The program codes given correspond with those used to report program data on the CAR. To maintain confi dentiality, ACICS does not publish information for programs that are off ered by fewer than ten institutions.
PROGRAM CONTACT HOURS/TUITION & FEES

16
CERTIFICATE/DIPLOMA
AVERAGE PROGRAM CONTACT HOURS
Program Program Code
Number of Programs
Day Evening
Average
Contact Hours
Standard
Deviation
Accounting 52.0301 122 122 703 274
Administrative Assistant 52.0401 103 102 719 274
Aesthetician/Esthetician and Skin Care Specialist 12.0409 3 3 1,160 139
Animation/Interactive Technology/Video Graphics 10.0304 54 54 780 283
Automotive Mechanics Technology 47.0604 11 10 1,065 478
Baking and Pastry Arts 12.0501 18 18 1,181 184
Banking and Financial Support Services 52.0803 45 45 1,023 262
Barbering/Barber 12.0402 13 13 1,111 335
Bartending 12.0502 19 19 1,236 163
Business Accounting Technology 52.0302 14 14 903 136
Business Administration and Management 52.0201 39 39 665 116
Business Offi ce Technology 52.0407 122 122 573 201
Cardiovascular Technology 51.0901 34 33 720 200
Child Care and Support Services Management 19.0708 13 13 1,545 491
Clinical/Medical Laboratory Assistant 51.0802 12 12 1,050 283
Computer and Information Systems Security 11.1003 4 4 1,103 102
Computer Installation and Repair Technology 47.0104 13 13 1,018 39
Computer Software and Media Applications 11.0899 17 17 727 271
Computer Support Specialist 11.1006 32 32 849 328
Computer Systems Networking/ Telecommunications 11.0901 48 48 965 311
Computer Systems Technology 15.1202 24 24 752 349
Cooking and Related Culinary Arts 12.0500 46 43 993 248
Cosmetology 12.0401 153 152 1,230 358
Court Reporting 22.0303 15 15 2,297 1,256
Criminalistics and Criminal Science 43.0111 43 43 835 287
Data Entry/Microcomputer Applications 11.0601 12 12 892 138
Data Processing Technology 11.0301 27 27 1,052 960
Dental Assistant 51.0601 124 124 904 175
Diagnostic Medical Sonography 51.0910 19 19 1,841 335

17Average Program Contact Hours by Degree Level & Program
Program Program Code
Number of Programs
Day Evening
Average
Contact Hours
Standard
Deviation
Electrical/Electronics Maintenance and Repair Tech 47.0199 37 37 1,073 291
Emergency Medical Technology 51.0904 20 20 1,131 499
English as a Second Language 13.1401 36 36 790 341
Graphic Design 50.0409 10 10 660 0
Health and Physical Education/Fitness 31.0599 11 11 1,042 252
Heating, A/C and Refrigeration Technology 15.0501 18 18 810 140
Home Health Aide/Home Attendant 51.2602 57 57 1,029 162
Information Technology 11.0103 18 18 698 7
Legal Administrative Assistant 22.0301 35 35 770 269
Legal Assistant/Paralegal 22.0302 43 43 854 242
Licensed Practical/Vocational Nurse 51.1613 51 49 767 320
Massage Therapy 51.3501 47 46 1,345 219
Medical Administrative Assistant 51.0716 199 196 943 354
Medical Insurance Coding Specialist/Coder 51.0713 164 165 899 513
Medical Insurance Specialist/Medical Biller 51.0714 168 167 741 195
Medical Offi ce Assistant 51.0710 145 145 789 228
Medical Staff Services Technology/Technician 51.0717 179 177 784 269
Medical Transcription 51.0708 10 10 891 302
Medical/Clinical Assistant 51.0801 375 371 883 183
Nail Technician/Specialist and Manicurist 12.0410 25 25 766 231
Nursing 51.1601 33 32 1,310 188
Nursing/Patient Care Assistant 51.1614 13 13 489 132
Pharmacy Assistant 51.0805 165 164 773 132
Photography 50.0605 11 11 956 248
Radiologic Technology 51.0911 10 10 1,227 436
Respiratory Therapy Assistant 51.0812 13 13 1,445 125
Surgical Technology 51.0909 36 36 1,242 253
System Administration 11.1001 20 20 888 184
Tourism and Travel Services Management 52.0903 10 10 1,111 305
Vocational Rehabilitation Counseling 51.2310 19 19 1,169 86
Web Page and Digital/Multimedia Design 11.0801 28 25 710 223
CERTIFICATE/DIPLOMA (Continued)

18
OCCUPATIONAL ASSOCIATE’S DEGREE
Program Program Code
Number of Programs
Day Evening
Average
Contact Hours
Standard
Deviation
Accounting 52.0301 60 60 1,367 262
Administrative Assistant 52.0401 44 44 1,540 265
Business Administration and Management 52.0201 103 103 1,361 296
Cardiovascular Technology 51.0901 11 11 1,853 248
Computer Systems Networking/ Telecommunications 11.0901 24 23 1,400 179
Computer Systems Technology 15.1202 11 11 1,286 184
Construction Trades 46.0000 10 10 1,108 379
Cooking and Related Culinary Arts 12.0500 11 11 1,560 296
Cosmetology 12.0401 17 17 1,633 597
Court Reporting 22.0303 22 22 2,871 1,150
Criminal Justice/Law Enforcement 43.0103 33 33 1,278 252
Dental Assistant 51.0601 11 11 1,428 302
Health Information Technology 51.0707 25 25 1,429 249
Human Resources Management 52.1001 17 17 1,180 141
Information Technology 11.0103 10 9 1,255 281
Legal Administrative Assistant 22.0301 18 18 1,450 315
Legal Assistant/Paralegal 22.0302 37 37 1,281 274
Marketing/Marketing Management 52.1401 14 14 1,321 144
Massage Therapy 51.3501 40 39 1,317 191
Medical Administrative Assistant 51.0716 49 48 1,419 282
Medical Insurance Coding Specialist/Coder 51.0713 15 15 1,299 136
Medical Insurance Specialist/Medical Biller 51.0714 18 18 1,202 137
Medical Offi ce Assistant 51.0710 24 24 1,419 351
Medical Staff Services Technology/Technician 51.0717 15 15 1,346 245
Medical/Clinical Assistant 51.0801 76 74 1,424 305
Pharmacy Assistant 51.0805 10 10 1,291 194
Security/Loss Prevention Services 43.0109 11 10 1,251 257
Surgical Technology 51.0909 21 21 1,496 151
Veterinary/Animal Health Technology 51.0808 9 9 1,530 277

19
ACADEMIC ASSOCIATE’S DEGREE
Program Program Code
Number of Programs
Day Evening
Average
Contact Hours
Standard
Deviation
Accounting 52.0301 146 146 1,140 307
Administrative Assistant 52.0401 57 57 1,204 163
Animation/Interactive Technology/Video Graphics 10.0304 9 9 1,495 671
Baking and Pastry Arts 12.0501 19 19 1,368 164
Business Accounting Technology 52.0302 33 33 1,088 252
Business Administration and Management 52.0201 296 296 1,100 393
Business and Related Support Services, Other 52.9999 30 30 960 169
Business Offi ce Technology 52.0407 29 29 1,125 160
Business/Commerce, General 52.0101 69 69 1,014 234
Cardiovascular Technology 51.0901 22 22 1,650 496
Clinical Laboratory Technology 51.1005 11 11 1,429 276
Computer and Electronics Engineering Technology 15.0303 240 240 1,120 208
Computer and Information Systems Security 11.1003 29 29 1,301 286
Computer Drafting and Design 15.1302 141 141 1,149 215
Computer Programming 11.0201 50 50 1,230 378
Computer Science 11.0701 10 10 1,024 56
Computer Software and Media Applications 11.0899 15 15 1,233 155
Computer Systems Networking/ Telecommunications 11.0901 185 185 1,146 252
Computer Systems Technology 15.1202 11 11 1,017 338
Computer/Info Technology Serv Adm and Mgmt 11.1099 14 14 1,047 312
Cooking and Related Culinary Arts 12.0500 27 27 1,521 452
Criminal Justice/Law Enforcement 43.0103 282 282 1,063 290
Criminalistics and Criminal Science 43.0111 92 92 1,011 102
Dental Assistant 51.0601 21 21 1,378 247
Design and Visual Communications 50.0401 89 89 1,138 206
Diagnostic Medical Sonography 51.0910 15 15 1,927 258
Drafting and Design Technology 15.1301 139 139 1,102 140
Early Childhood Education 13.1210 20 20 1,202 103
Electrical/Electronics Maintenance and Repair Tech 47.0199 11 11 1,146 139
Electronics and Communications Engineering 14.1001 19 19 1,274 233
Engineering Technology 15.0000 11 11 1,342 225
Fashion/Apparel Design 50.0407 12 12 1,237 155
Graphic Design 50.0409 110 110 1,162 154
Health and Physical Education/Fitness 31.0599 21 21 1,217 132
Health Care Administration/Management 51.0701 53 53 2,077 1,504
Health Information Technology 51.0707 65 65 1,149 173
Health Services/Allied Health/ Health Sciences 51.0000 20 20 1,125 357
Hotel/Motel Administration/Management 52.0904 15 15 1,151 382
Average Program Contact Hours by Degree Level & Program
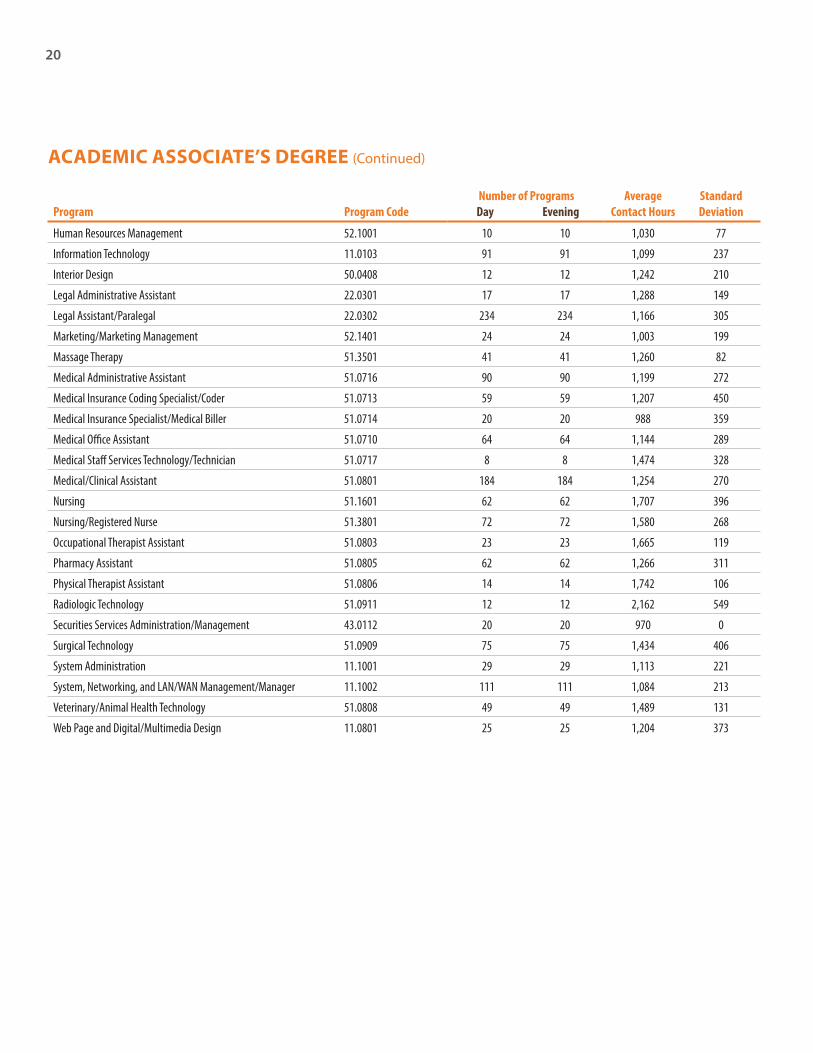
20
Program Program Code
Number of Programs
Day Evening
Average
Contact Hours
Standard
Deviation
Human Resources Management 52.1001 10 10 1,030 77
Information Technology 11.0103 91 91 1,099 237
Interior Design 50.0408 12 12 1,242 210
Legal Administrative Assistant 22.0301 17 17 1,288 149
Legal Assistant/Paralegal 22.0302 234 234 1,166 305
Marketing/Marketing Management 52.1401 24 24 1,003 199
Massage Therapy 51.3501 41 41 1,260 82
Medical Administrative Assistant 51.0716 90 90 1,199 272
Medical Insurance Coding Specialist/Coder 51.0713 59 59 1,207 450
Medical Insurance Specialist/Medical Biller 51.0714 20 20 988 359
Medical Offi ce Assistant 51.0710 64 64 1,144 289
Medical Staff Services Technology/Technician 51.0717 8 8 1,474 328
Medical/Clinical Assistant 51.0801 184 184 1,254 270
Nursing 51.1601 62 62 1,707 396
Nursing/Registered Nurse 51.3801 72 72 1,580 268
Occupational Therapist Assistant 51.0803 23 23 1,665 119
Pharmacy Assistant 51.0805 62 62 1,266 311
Physical Therapist Assistant 51.0806 14 14 1,742 106
Radiologic Technology 51.0911 12 12 2,162 549
Securities Services Administration/Management 43.0112 20 20 970 0
Surgical Technology 51.0909 75 75 1,434 406
System Administration 11.1001 29 29 1,113 221
System, Networking, and LAN/WAN Management/Manager 11.1002 111 111 1,084 213
Veterinary/Animal Health Technology 51.0808 49 49 1,489 131
Web Page and Digital/Multimedia Design 11.0801 25 25 1,204 373
ACADEMIC ASSOCIATE’S DEGREE (Continued)

21
BACHELOR’S DEGREE
Program Program Code
Number of Programs
Day Evening
Average
Contact Hours
Standard
Deviation
Accounting 52.0301 68 68 2,164 717
Advertising 09.0903 14 14 2,265 163
Animation/Interactive Technology/Video Graphics 10.0304 91 91 2,176 420
Business Administration and Management 52.0201 319 319 1,994 507
Computer and Electronics Engineering Technology 15.0303 80 80 2,103 291
Computer and Information Systems Security 11.1003 187 187 2,125 309
Computer Graphics 11.0803 9 9 2,289 465
Computer Programming 11.0201 15 15 2,205 308
Computer Science 11.0701 10 10 2,384 1,037
Computer Software and Media Applications 11.0899 11 11 2,161 146
Construction Management 52.2001 60 60 2,072 297
Criminal Justice/Law Enforcement 43.0103 217 217 1,923 275
Design and Visual Communications 50.0401 15 15 2,361 952
Electrical & Electronic EngTechnologies/Technician 15.0399 51 51 2,122 309
Electronics and Communications Engineering 14.1001 15 15 2,139 107
Fashion Merchandising 52.1902 18 18 2,185 227
Fashion/Apparel Design 50.0407 18 18 2,337 191
General Studies 24.0102 9 9 1,713 306
Graphic Design 50.0409 51 51 2,316 285
Health Care Administration/Management 51.0701 124 124 1,948 289
Human Resources Management 52.1001 10 10 1,800 615
Information Technology 11.0103 96 96 2,127 345
Interior Design 50.0408 38 38 2,303 272
Legal Assistant/Paralegal 22.0302 48 48 2,085 347
Marketing/Marketing Management 52.1401 15 15 1,936 128
Nursing 51.1601 18 18 2,234 740
Nursing/Registered Nurse 51.3801 10 10 1,707 799
Photography 50.0605 13 13 2,136 459
Project Management 52.0211 101 101 1,994 118
Securities Services Administration/Management 43.0112 11 11 1,920 0
System Administration 11.1001 14 14 2,074 267
Web Page and Digital/Multimedia Design 11.0801 27 27 2,269 267
MASTER’S DEGREE
Program Program Code
Number of Programs
Day Evening
Average
Contact Hours
Standard
Deviation
Business Administration and Management 52.0201 74 73 594 172
Average Program Contact Hours by Degree Level & Program

22
AVERAGE TUITION & FEES BY DEGREE LEVEL & PROGRAM
CERTIFICATE/DIPLOMA
Program Program Code
Number of Programs
Day Evening
Average
Tuition & Fees
Day Evening
Standard Deviation
Day Evening
Accounting 52.0301 122 122 14,894 15,077 4,770 4,898
Administrative Assistant 52.0401 103 103 14,296 14,650 4,822 4,882
Advertising 09.0903 21 21 62,764 61,510 21,570 21,400
Aesthetician/Esthetician and Skin Care Specialist 12.0409 27 27 10,345 10,085 1,502 2,367
Animation/Interactive Technology/Video Graphics 10.0304 11 11 34,318 34,218 17,585 17,585
Automotive Mechanics Technology 47.0604 18 18 13,039 13,039 7,535 7,535
Baking and Pastry Arts 12.0501 46 46 16,362 16,018 5,862 5,731
Banking and Financial Support Services 52.0803 13 13 9,780 9,044 157 2,417
Barbering/Barber 12.0402 20 20 13,032 13,032 5,439 5,439
Bartending 12.0502 14 14 7,151 7,151 1,653 1,653
Business Accounting Technology 52.0302 39 39 13,706 13,577 4,525 5,623
Business Administration and Management 52.0201 122 122 15,638 16,045 5,445 5,515
Business Offi ce Technology 52.0407 122 122 15,379 15,792 5,309 5,365
Business/Commerce, General 52.0101 71 71 46,343 46,912 8,829 7,493
Cardiovascular Technology 51.0901 13 13 26,860 26,913 10,320 10,299
Child Care and Support Services Management 19.0708 15 15 8,989 8,776 3,919 3,239
Cinematography and Film/Video Producation 50.0602 17 17 52,383 53,470 28,856 28,378
Clinical Laboratory Technology 51.1005 21 21 31,117 32,617 7,595 9,466
Clinical/Medical Laboratory Assistant 51.0802 14 14 14,167 13,986 949 1,138
Computer and Information Systems Security 11.1003 17 17 18,331 18,331 5,613 5,613
Computer Installation and Repair Technology 47.0104 32 32 12,686 12,896 5,111 5,200
Computer Software and Media Applications 11.0899 8 8 14,609 14,609 10,066 10,066
Computer Support Specialist 11.1006 7 7 12,282 14,957 5,685 4,144
Computer Systems Networking/ Telecommunications 11.0901 48 48 16,438 16,351 5,376 5,545
Computer Systems Technology 15.1202 24 24 13,053 13,357 4,554 4,364
Cooking and Related Culinary Arts 12.0500 46 46 18,697 18,422 5,878 5,940
Cosmetology 12.0401 153 153 13,565 13,759 5,864 5,980
Court Reporting 22.0303 17 17 29,391 41,088 12,147 19,637
Criminal Justice/Law Enforcement 43.0103 45 45 16,321 16,012 4,711 3,878
Culinary Arts/Chef Training 12.0503 11 11 18,216 18,216 6,463 6,463
Data Entry/Microcomputer Applications 11.0601 27 27 13,323 14,044 11,091 12,797
Data Processing Technology 11.0301 9 9 21,397 28,750 13,461 24,525
Dental Assistant 51.0601 124 124 16,190 16,486 2,996 3,245
Diagnostic Medical Sonography 51.0910 19 19 32,179 31,480 6,139 6,643

23
Program Program Code
Number of Programs
Day Evening
Average
Tuition & Fees
Day Evening
Standard Deviation
Day Evening
Electrical/Electronics Maintenance and Repair Tech 47.0199 37 37 12,783 12,649 3,707 3,637
Emergency Medical Technology 51.0904 20 20 10,725 10,725 6,354 6,354
English as a Second Language 13.1401 36 36 5,074 4,905 3,663 3,666
Executive Assistant/Executive Secretary 52.0402 10 10 9,995 9,995 0 0
Graphic Design 50.0409 11 11 22,901 25,907 5,947 9,860
Health and Physical Education/Fitness 31.0599 17 17 15,793 16,026 3,766 3,964
Heating, A/C and Refrigeration Technology 15.0501 57 57 14,269 14,037 4,348 4,535
Home Health Aide/Home Attendant 51.2602 18 18 7,046 7,052 147 161
Information Technology 11.0103 35 35 14,239 14,525 6,650 6,537
Legal Administrative Assistant 22.0301 44 44 17,553 19,391 6,427 7,023
Legal Assistant/Paralegal 22.0302 43 43 15,828 15,935 3,508 3,555
Licensed Practical/Vocational Nurse 51.1613 47 47 19,166 19,959 7,652 8,127
Massage Therapy 51.3501 202 202 15,193 15,060 4,501 4,417
Medical Administrative Assistant 51.0716 165 165 16,792 16,505 9,513 4,730
Medical Insurance Coding Specialist/Coder 51.0713 168 168 16,948 17,245 4,407 4,163
Medical Insurance Specialist/Medical Biller 51.0714 146 146 15,413 15,594 3,747 3,845
Medical Offi ce Assistant 51.0710 181 181 16,224 16,505 5,228 5,146
Medical Staff Services Technology/Technician 51.0717 10 10 14,151 14,151 4,141 4,141
Medical Transcription 51.0708 5 5 15,726 15,726 6,967 6,967
Medical/Clinical Assistant 51.0801 377 377 17,760 18,362 4,379 8,120
Nail Technician/Specialist and Manicurist 12.0410 25 25 6,685 6,825 2,391 2,336
Nur Asst/Aid and Patient Care Asst/Aid 51.3902 13 13 13,265 13,265 994 994
Nursing 51.1601 33 33 21,689 20,997 7,566 7,959
Nursing/Patient Care Assistant 51.1614 39 39 11,990 12,236 8,226 8,355
Pharmacy Assistant 51.0805 165 165 16,587 16,806 3,773 3,773
Phlebotomy 51.1009 34 34 12,086 12,124 4,073 4,066
Physical Therapist Assistant 51.0806 11 11 12,116 11,087 1,576 1,532
Radiologic Technology 51.0911 10 10 23,700 23,915 5,608 5,904
Respiratory Therapy Assistant 51.0812 13 13 9,912 9,912 838 838
Surgical Technology 51.0909 35 35 18,409 18,158 7,697 8,050
System Administration 11.1001 20 20 16,739 16,469 1,074 1,140
Tourism and Travel Services Management 52.0903 11 11 10,163 17,916 2,071 23,428
Vocational Rehabilitation Counseling 51.2310 19 19 13,878 13,859 238 368
Web Page and Digital/Multimedia Design 11.0801 28 28 22,211 22,797 5,653 5,137
Average Program Tuition & Fees by Degree Level & Program

24
OCCUPATIONAL ASSOCIATE’S DEGREE
Program Program Code
Number of Programs
Day Evening
Average
Tuition & Fees
Day Evening
Standard Deviation
Day Evening
Accounting 52.0301 62 62 26,232 27,049 4,269 5,919
Administrative Assistant 52.0401 46 46 25,530 25,448 6,863 7,231
Business Administration and Management 52.0201 104 104 26,876 27,483 6,123 6,149
Cardiovascular Technology 51.0901 11 11 27,185 32,473 9,769 6,518
Computer Systems Networking/ Telecommunications 11.0901 24 24 29,227 30,215 6,833 6,615
Computer Systems Technology 15.1202 12 12 24,424 24,362 4,970 5,555
Construction Trades 46.0000 10 10 26,895 27,658 3,723 4,260
Cooking and Related Culinary Arts 12.0500 11 11 36,434 38,701 4,885 3,805
Cosmetology 12.0401 17 17 24,750 25,813 6,731 6,909
Court Reporting 22.0303 24 24 40,363 44,398 12,623 17,618
Criminal Justice/Law Enforcement 43.0103 33 33 30,056 29,816 5,311 5,210
Dental Assistant 51.0601 11 11 26,126 26,711 6,524 6,928
Health Information Technology 51.0707 25 25 25,083 24,922 4,534 4,035
Human Resources Management 52.1001 17 17 29,885 29,885 5,782 5,728
Information Technology 11.0103 10 10 24,560 22,745 6,317 9,561
Legal Administrative Assistant 22.0301 18 18 23,213 23,147 3,510 3,847
Legal Assistant/Paralegal 22.0302 36 36 27,250 27,657 6,717 6,425
Marketing/Marketing Management 52.1401 14 14 29,713 29,713 6,956 6,956
Massage Therapy 51.3501 41 41 27,412 27,586 5,952 5,921
Medical Administrative Assistant 51.0716 50 50 25,230 25,006 4,824 6,250
Medical Insurance Coding Specialist/Coder 51.0713 16 16 24,944 26,032 4,815 4,800
Medical Insurance Specialist/Medical Biller 51.0714 18 18 29,506 29,506 8,098 8,098
Medical Offi ce Assistant 51.0710 24 24 22,234 21,758 4,729 5,958
Medical Staff Services Technology/Technician 51.0717 15 15 27,198 27,152 3,796 3,935
Medical/Clinical Assistant 51.0801 76 76 29,098 29,202 6,294 6,120
Pharmacy Assistant 51.0805 10 10 28,070 28,070 8,301 8,301
Respiratory Therapy Assistant 51.0812 10 10 30,609 32,389 3,700 5,976
Security/Loss Prevention Services 43.0109 11 11 25,212 25,212 3,376 3,376
Surgical Technology 51.0909 21 21 25,904 25,513 5,223 3,356
Veterinary/Animal Health Technology 51.0808 9 9 32,500 31,959 6,330 4,972
Web Page and Digital/Multimedia Design 11.0801 10 10 29,653 29,653 11,656 11,656

25
ACADEMIC ASSOCIATE’S DEGREE
Program Program Code Number of Programs
Day
Evening
Average Tuition &
Fees
DAY EVENING
Standard Deviation
DAY EVENING
Accounting 52.0301 146 146 32,689 32,982 8,574 8,270
Administrative Assistant 52.0401 144 144 31,307 31,708 7,388 7,159
Animation/Interactive Technology/Video Graphics 10.0304 9 9 44,050 44,050 7,517 7,517
Baking and Pastry Arts 12.0501 19 19 37,835 37,522 4,458 4,367
Business Accounting Technology 52.0302 33 33 38,037 39,834 6,495 5,437
Business Administration and Management 52.0201 296 296 33,659 32,592 19,137 8,140
Business and Related Support Services, Other 52.9999 30 30 41,204 40,915 2,348 2,797
Business Offi ce Technology 52.0407 29 29 29,467 29,199 6,060 6,123
Business/Commerce, General 52.0101 69 69 46,912 46,912 7,493 7,493
Cardiovascular Technology 51.0901 22 22 35,701 35,247 4,659 5,296
Clinical Laboratory Technology 51.1005 11 11 34,341 34,341 3,539 3,539
Computer and Electronics Engineering Technology 15.0303 240 240 46,458 46,459 2,766 2,766
Computer and Information Systems Security 11.1003 29 29 37,506 37,506 14,655 14,655
Computer Drafting and Design 15.1302 141 141 46,315 46,315 3,839 3,839
Computer Programming 11.0201 50 50 41,958 43,485 11,975 11,685
Computer Science 11.0701 10 10 37,549 37,549 6,447 6,447
Computer Software and Media Applications 11.0899 15 15 36,267 36,267 10,629 10,629
Computer Systems Networking/ Telecommunications 11.0901 185 185 43,285 43,707 7,376 7,025
Computer Systems Technology 15.1202 11 11 29,117 30,781 6,367 3,346
Computer/Info Technology Serv Adm and Mgmt 11.1099 14 14 44,897 44,897 3,562 3,562
Construction Management 52.2001 11 11 35,957 35,957 2,240 2,240
Cooking and Related Culinary Arts 12.0500 27 27 35,313 34,922 8,970 9,119
Criminal Justice/Law Enforcement 43.0103 282 282 38,500 39,584 8,730 17,334
Criminalistics and Criminal Science 43.0111 92 92 45,590 45,386 1,159 2,264
Dental Assistant 51.0601 21 21 28,128 27,414 8,849 7,967
Design and Visual Communications 50.0401 89 89 46,910 46,910 2,588 2,588
Diagnostic Medical Sonography 51.0910 15 15 34,988 36,966 8,334 10,462
Drafting and Design Technology 15.1301 139 139 44,958 44,958 3,234 3,234
Early Childhood Education 13.1210 20 20 24,178 24,828 11,676 11,655
Electrical/Electronics Maintenance and Repair Tech 47.0199 11 11 30,714 30,714 3,187 3,187
Electronics and Communications Engineering 14.1001 19 19 35,675 35,675 12,657 12,657
Engineering Technology 15.0000 11 11 22,803 22,803 14,665 14,665
Fashion/Apparel Design 50.0407 12 12 40,090 37,443 9,837 8,458
Genral Studies 24.0102 10 10 24,985 26,074 9,612 13,778
Graphic Design 50.0409 110 110 41,024 41,732 7,418 7,013
Average Program Tuition & Fees by Degree Level & Program

26
ACADEMIC ASSOCIATE’S DEGREE (Continued)
Program Program Code Number of Programs
Day
Evening
Average Tuition &
Fees
DAY EVENING
Standard Deviation
DAY EVENING
Health and Physical Education/Fitness 31.0599 21 21 33,471 34,121 7,593 7,207
Health Care Administration/Management 51.0701 53 53 30,090 29,390 5,782 6,900
Health Information Technology 51.0707 65 65 34,124 34,124 7,460 7,460
Health Services/Allied Health/ Health Sciences 51.0000 20 20 24,737 25,666 15,209 15,084
Hotel/Motel Administration/Management 52.0904 15 15 31,266 34,037 3,865 3,048
Human Resources Management 52.1001 10 10 35,000 35,000 3,000 3,000
Information Technology 11.0103 91 91 33,456 33,843 8,769 8,671
Interior Design 50.0408 12 12 39,969 37,965 8,545 9,320
Legal Administrative Assistant 22.0301 17 17 27,631 29,571 6,051 8,681
Legal Assistant/Paralegal 22.0302 234 234 39,462 39,746 8,766 8,620
Marketing/Marketing Management 52.1401 24 24 37,080 37,080 3,596 3,596
Massage Therapy 51.3501 41 41 33,689 34,007 5,196 4,853
Medical Administrative Assistant 51.0716 90 90 31,995 33,129 7,975 6,686
Medical Insurance Coding Specialist/Coder 51.0713 59 59 34,499 34,611 4,482 4,247
Medical Insurance Specialist/Medical Biller 51.0714 20 20 31,632 32,039 4,279 4,034
Medical Offi ce Assistant 51.0710 64 64 32,139 33,697 7,735 6,199
Medical Staff Services Technology/Technician 51.0717 8 8 32,738 32,738 6,170 6,170
Medical/Clinical Assistant 51.0801 184 184 31,475 31,749 5,293 5,308
Nursing 51.1601 184 184 34,401 34,793 8,914 8,800
Nursing/Registered Nurse 51.3801 72 72 49,253 50,836 8,891 5,491
Occupational Therapist Assistant 51.0803 23 23 34,940 36,011 5,391 4,010
Pharmacy Assistant 51.0805 62 62 30,191 30,568 7,886 7,905
Physical Therapist Assistant 51.0806 14 14 30,389 27,996 12,584 16,191
Radiologic Technology 51.0911 12 12 37,461 39,386 11,291 12,110
Securities Services Administration/Management 43.0112 20 20 40,527 40,128 3,403 3,863
Surgical Technology 51.0909 75 75 33,723 33,776 3,351 3,396
System Administration 11.1001 29 29 36,000 36,000 7,483 7,483
System, Networking, and LAN/WAN Management/Manager 11.1002 111 111 45,882 45,882 154 154
Veterinary/Animal Health Technology 51.0808 49 49 36,781 37,816 7,474 7,250
Web Page and Digital/Multimedia Design 11.0801 25 25 37,911 37,911 5,652 5,652

27
BACHELOR’S DEGREE
Program Program Code Number of Programs
DAY EVENING
Average Tuition &
Fees
DAY EVENING
Standard Deviation
DAY EVENING
Accounting 52.0301 68 68 67,043 67,208 14,848 14,899
Advertising 09.0903 14 14 76,878 76,070 10,270 10,286
Animation/Interactive Technology/Video Graphics 10.0304 91 91 80,867 80,764 12,282 12,493
Business Administration and Management 52.0201 319 319 71,958 71,726 38,583 38,863
Computer and Electronics Engineering Technology 15.0303 80 80 88,266 88,266 4,640 4,640
Computer and Information Systems Security 11.1003 187 187 86,653 86,428 9,345 9,809
Computer Graphics 11.0803 9 9 55,364 51,463 31,384 31,130
Computer Programming 11.0201 15 15 74,283 74,686 21,113 22,603
Computer Science 11.0701 10 10 52,810 50,895 22,773 24,931
Computer Software and Media Applications 11.0899 11 11 63,996 63,996 17,848 17,848
Construction Management 52.2001 60 60 86,823 86,683 5,676 5,624
Criminal Justice/Law Enforcement 43.0103 217 217 74,983 74,983 14,415 14,414
Design and Visual Communications 50.0401 15 15 75,772 75,772 5,346 5,347
Electrical & Electronic EngTechnologies/Technician 15.0399 51 51 88,808 88,808 352 352
Electronics and Communications Engineering 14.1001 15 15 88,740 85,816 0 11,325
Fashion Merchandising 52.1902 18 18 74,054 73,271 10,253 10,051
Fashion/Apparel Design 50.0407 18 18 77,851 72,514 14,348 9,983
General Studies 24.0102 9 9 44,493 31,500 7,978 9,950
Graphic Design 50.0409 51 51 72,030 72,636 18,407 16,086
Health Care Administration/Management 51.0701 124 124 64,526 64,378 9,300 9,598
Information Technology 11.0103 96 96 67,147 67,767 16,466 15,353
Interior Design 50.0408 38 38 74,102 73,368 11,807 11,741
Legal Assistant/Paralegal 22.0302 48 48 65,853 66,153 11,460 11,398
Marketing/Marketing Management 52.1401 15 15 64,168 64,168 14,271 14,271
Nursing 51.1601 18 18 38,778 38,778 29,242 29,242
Nursing/Registered Nurse 51.3801 10 10 43,690 36,120 23,664 0
Photography 50.0605 13 13 78,672 77,202 13,396 14,137
Project Management 52.0211 101 101 88,167 87,368 3,470 8,655
Securities Services Administration/Management 43.0112 192 192 73,361 73,361 5,036 5,036
System Administration 11.1001 14 14 75,998 75,998 22,240 22,240
Web Page and Digital/Multimedia Design 11.0801 27 27 72,166 70,734 16,592 16,190
Program Program CodeProgram Code Number of ProgramsNumber of Programs
DAY EVENING
Average Tuition & FeesAverage Tuition & Fees
DAY EVENING
Standard DeviationStandard Deviation
DAY EVENING
Business Administration and Management 52.0201 74 74 22,496 23,325 6,103 9,177
MASTER’S DEGREE
Average Program Tuition & Fees by Degree Level & Program


ANNUAL FINANCIAL REPORT (AFR) DATA
The aggregated summary data provided by ACICS-accredited institutions through the Annual Financial Report (AFR) constitutes information reviewed by the Council to evaluate the fi nancial viability and sustainability of member institutions. The review of annual audited fi nancial data enables the Council to better protect students from displace-ment due to fi nancial stress experienced by the institution they attend. The AFR is submitted each year 180 days after the conclusion of the institution’s fi scal year. It is accompanied by an institution’s most recently completed audited fi nancial statements. This summary includes AFR data collected for the fi scal year-end dates from July 31, 2012 through June 30, 2013.
The ratios are derived from total campus revenues and expenses aggregated to illustrate operating fi gures and aver-ages (mean) of all member institutions which includes both for-profi t and not-for-profi t institutions. They do not purport to be industry-wide statistics. The chart of accounts used is prescribed by ACICS, and the reported results are verifi ed by audited fi nancial statements. All results are reported using the accrual method of accounting.
Multiple institutions can be owned or controlled by one corporation. This results in fewer balance sheets available to summarize than income statements.

30
N = number of income statements in this revenue range
All Credential Levels
N = 81
Non-Degree
N = 23
Occupational Associate's Degree
N = 9
AVG OR AVG OR AVG OR
Gross Tuition 627,155 113.88% 647,213 114.45% 725,886 127.30%
Gross Contract Revenue 1,187 0.22% 63 0.01% 19 0.00%
(Less Tuition Refunds) (55,329) -10.05% (54,174) -9.58% (109,320) -19.17%
(Less Textbook Expense) (22,289) -4.05% (27,604) -4.88% (46,367) -8.13%
TOTAL EDUCATIONAL REVENUES $550,724 100.00% $565,498 100.00% $570,218 100.00%
Instructional Salaries 175,978 31.95% 247,064 43.69% 143,868 25.23%
Instructional Expenses 38,721 7.03% 41,684 7.37% 20,850 3.66%
Student Recruitment 207,512 37.68% 72,978 12.91% 83,671 14.67%
Depreciation of Equipment 38,534 7.00% 29,451 5.21% 11,240 1.97%
Occupancy Expense 188,028 34.14% 152,564 26.98% 96,449 16.91%
Administrative Salaries 139,977 25.42% 142,028 25.12% 126,668 22.21%
Offi cer Salaries 32,187 5.84% 42,420 7.50% 31,117 5.46%
Administrative Expense 144,364 26.21% 110,845 19.60% 101,412 17.78%
Student Personnel Services 22,668 4.12% 12,799 2.26% 11,606 2.04%
TOTAL EDUCATIONAL EXPENSES $987,969 179.39% $851,833 150.63% $626,881 109.94%
EDUCATIONAL INCOME (437,245) -79.39% (286,335) -50.63% (56,663) -9.94%
Net Dormitory Income 267 0.05% 0 0.00% 0 0.00%
Net Bookstore Operations 6,108 1.11% 9,265 1.64% 8,129 1.43%
Net Interest Income Expense 2,008 0.36% (4,414) -0.78% (393) -0.07%
Other Income Expense 9,302 1.69% 3,523 0.62% (193) -0.03%
Net Extraordinary & Unusual Income & Expense 991 0.18% 1,888 0.33% 0 0.00%
TOTAL OTHER INCOME AND EXPENSE $18,676 3.39% $10,262 1.81% $7,543 1.32%
NET INCOME BEFORE INCOME TAXES ($418,569) -76.00% ($276,073) -48.82% ($49,120) -8.61%
(Federal State Income Taxes) ($13,880) -2.52% (23,842) -4.22% (7,609) -1.33%
NET INCOME AFTER TAXES ($432,449) -78.52% ($299,915) -53.04% ($56,729) -9.95%
INCOME STATEMENTTotal Educational Revenue < $1,000,000 Mean Average (AVG) Operating Ratio (OR) = % of Total Educational Revenues

31
Academic Associate's Degree
N = 21
Bachelor's Degree
N = 15
Master's Degree
N = 13
AVG OR AVG OR AVG OR
Gross Tuition 679,799 116.58% 524,841 109.57% 556,332 102.73%
Gross Contract Revenue 0 0.00% 4,347 0.91% 2,257 0.42%
(Less Tuition Refunds) (77,380) -13.27% (29,454) -6.15% (14,230) -2.63%
(Less Textbook Expense) (19,319) -3.31% (20,714) -4.32% (2,828) -0.52%
TOTAL EDUCATIONAL REVENUES $583,100 100.00% $479,020 100.00% $541,531 100.00%
Instructional Salaries 154,185 26.44% 122,739 25.62% 169,076 31.22%
Instructional Expenses 36,423 6.25% 34,517 7.21% 54,414 10.05%
Student Recruitment 169,117 29.00% 642,948 134.22% 90,868 16.78%
Depreciation of Equipment 49,159 8.43% 60,017 12.53% 31,548 5.83%
Occupancy Expense 168,011 28.81% 309,305 64.57% 206,576 38.15%
Administrative Salaries 119,512 20.50% 169,330 35.35% 144,754 26.73%
Offi cer Salaries 39,074 6.70% 3,935 0.82% 36,295 6.70%
Administrative Expense 145,978 25.03% 171,358 35.77% 199,648 36.87%
Student Personnel Services 37,993 6.52% 7,712 1.61% 40,286 7.44%
TOTAL EDUCATIONAL EXPENSES $919,452 157.68% $1,521,861 317.70% $973,465 179.76%
EDUCATIONAL INCOME (336,352) -57.68% (1,042,841) -217.70% (431,934) -79.76%
Net Dormitory Income 0 0.00% 0 0.00% 1,666 0.31%
Net Bookstore Operations 2,381 0.41% 6,060 1.27% 5,198 0.96%
Net Interest Income Expense 1,036 0.18% (3,127) -0.65% 22,526 4.16%
Other Income Expense 29,423 5.05% (15,167) -3.17% 21,829 4.03%
Net Extraordinary & Unusual Income & Expense 0 0.00% 0 0.00% 2,833 0.52%
TOTAL OTHER INCOME AND EXPENSE $32,840 5.63% ($12,234) -2.55% $54,052 9.98%
NET INCOME BEFORE INCOME TAXES ($303,512) -52.05% ($1,055,075) -220.26% ($377,882) -69.78%
(Federal State Income Taxes) (22,414) -3.84% (108) -0.02% (2,702) -0.50%
NET INCOME AFTER TAXES ($325,926) -55.90% ($1,055,183) -220.28% ($380,584) -70.28%

32
INCOME STATEMENTTotal Educational Revenue $1,000,000 - $ 9,999,999Mean Average (AVG) Operating Ratio (OR) = % of Total Educational Revenues
All Credential Levels
N = 636
Non-Degree
N = 116
Occupational Associate's Degree
N = 104
AVG OR AVG OR AVG OR
Gross Tuition 5,535,806 108.55% 4,233,403 105.62% 4,640,292 107.10%
Gross Contract Revenue 4,711 0.09% 5,559 0.14% 3,013 0.07%
(Less Tuition Refunds) (317,056) -6.22% (103,455) -2.58% (210,745) -4.86%
(Less Textbook Expense) (123,665) -2.42% (127,224) -3.17% (99,725) -2.30%
TOTAL EDUCATIONAL REVENUES $5,099,796 100.00% $4,008,283 100.00% $4,332,835 100.00%
Instructional Salaries 1,086,846 21.31% 877,549 21.89% 990,844 22.87%
Instructional Expenses 252,729 4.96% 242,974 6.06% 265,346 6.12%
Student Recruitment 1,009,772 19.80% 504,084 12.58% 825,912 19.06%
Depreciation of Equipment 174,750 3.43% 126,876 3.17% 123,431 2.85%
Occupancy Expense 697,181 13.67% 596,777 14.89% 662,641 15.29%
Administrative Salaries 573,474 11.25% 580,530 14.48% 497,402 11.48%
Offi cer Salaries 66,109 1.30% 75,726 1.89% 68,485 1.58%
Administrative Expense 864,370 16.95% 851,012 21.23% 667,408 15.40%
Student Personnel Services 160,845 3.15% 133,947 3.34% 123,915 2.86%
TOTAL EDUCATIONAL EXPENSES $4,886,076 95.81% $3,989,475 99.53% $4,225,384 97.52%
EDUCATIONAL INCOME $213,720 4.19% $18,808 0.47% $107,451 2.48%
Net Dormitory Income 3,260 0.06% 0 0.00% 1,388 0.03%
Net Bookstore Operations 50,852 1.00% 24,680 0.62% 61,167 1.41%
Net Interest Income Expense 3,726 0.07% (16,144) -0.40% 10,749 0.25%
Other Income Expense (113,494) -2.23% (218,623) -5.45% (243,896) -5.63%
Net Extraordinary & Unusual Income & Expense (12,962) -0.25% (66,990) -1.67% (5,358) -0.12%
TOTAL OTHER INCOME AND EXPENSE ($68,618) -1.35% ($277,077) -6.91% ($175,950) -4.06%
NET INCOME BEFORE INCOME TAXES $145,102 2.85% ($258,269) -6.44% ($68,500) -1.58%
(Federal State Income Taxes) (85,293) -1.67% (92,250) -2.30% (124,797) -2.88%
NET INCOME AFTER TAXES $59,809 1.17% ($350,519) -8.74% ($193,297) -4.46%
N = number of income statements in this revenue range
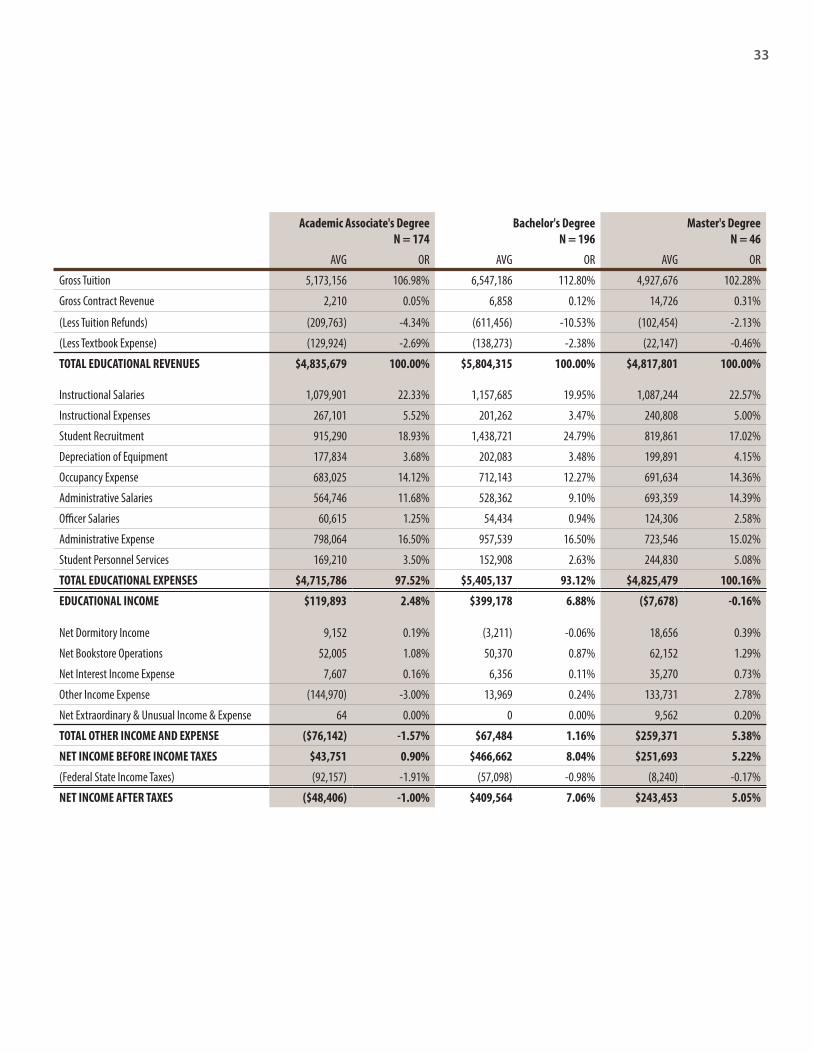
33
Academic Associate's Degree
N = 174
Bachelor's Degree
N = 196
Master's Degree
N = 46
AVG OR AVG OR AVG OR
Gross Tuition 5,173,156 106.98% 6,547,186 112.80% 4,927,676 102.28%
Gross Contract Revenue 2,210 0.05% 6,858 0.12% 14,726 0.31%
(Less Tuition Refunds) (209,763) -4.34% (611,456) -10.53% (102,454) -2.13%
(Less Textbook Expense) (129,924) -2.69% (138,273) -2.38% (22,147) -0.46%
TOTAL EDUCATIONAL REVENUES $4,835,679 100.00% $5,804,315 100.00% $4,817,801 100.00%
Instructional Salaries 1,079,901 22.33% 1,157,685 19.95% 1,087,244 22.57%
Instructional Expenses 267,101 5.52% 201,262 3.47% 240,808 5.00%
Student Recruitment 915,290 18.93% 1,438,721 24.79% 819,861 17.02%
Depreciation of Equipment 177,834 3.68% 202,083 3.48% 199,891 4.15%
Occupancy Expense 683,025 14.12% 712,143 12.27% 691,634 14.36%
Administrative Salaries 564,746 11.68% 528,362 9.10% 693,359 14.39%
Offi cer Salaries 60,615 1.25% 54,434 0.94% 124,306 2.58%
Administrative Expense 798,064 16.50% 957,539 16.50% 723,546 15.02%
Student Personnel Services 169,210 3.50% 152,908 2.63% 244,830 5.08%
TOTAL EDUCATIONAL EXPENSES $4,715,786 97.52% $5,405,137 93.12% $4,825,479 100.16%
EDUCATIONAL INCOME $119,893 2.48% $399,178 6.88% ($7,678) -0.16%
Net Dormitory Income 9,152 0.19% (3,211) -0.06% 18,656 0.39%
Net Bookstore Operations 52,005 1.08% 50,370 0.87% 62,152 1.29%
Net Interest Income Expense 7,607 0.16% 6,356 0.11% 35,270 0.73%
Other Income Expense (144,970) -3.00% 13,969 0.24% 133,731 2.78%
Net Extraordinary & Unusual Income & Expense 64 0.00% 0 0.00% 9,562 0.20%
TOTAL OTHER INCOME AND EXPENSE ($76,142) -1.57% $67,484 1.16% $259,371 5.38%
NET INCOME BEFORE INCOME TAXES $43,751 0.90% $466,662 8.04% $251,693 5.22%
(Federal State Income Taxes) (92,157) -1.91% (57,098) -0.98% (8,240) -0.17%
NET INCOME AFTER TAXES ($48,406) -1.00% $409,564 7.06% $243,453 5.05%

34
INCOME STATEMENTTotal Educational Revenue $10,000,000 - $19,999,999Mean Average (AVG) Operating Ratio (OR) = % of Total Educational Revenues
All Credential Levels
N = 151
Non-Degree
N = 13
Occupational Associate's Degree
N = 10
AVG OR AVG OR AVG OR
Gross Tuition 14,422,971 111.33% 12,957,269 105.73% 13,557,220 103.36%
Gross Contract Revenue 23,427 0.18% 42 0.00% 0 0.00%
(Less Tuition Refunds) (1,239,986) -9.57% (473,403) -3.86% (211,698) -1.61%
(Less Textbook Expense) (250,828) -1.94% (229,208) -1.87% (228,390) -1.74%
TOTAL EDUCATIONAL REVENUES $12,955,584 100.00% $12,254,700 100.00% $13,117,132 100.00%
Instructional Salaries 2,324,059 17.94% 2,369,482 19.34% 2,646,307 20.17%
Instructional Expenses 578,108 4.46% 984,630 8.03% 761,303 5.80%
Student Recruitment 2,381,784 18.38% 1,309,992 10.69% 1,818,072 13.86%
Depreciation of Equipment 324,581 2.51% 438,872 3.58% 254,199 1.94%
Occupancy Expense 1,317,492 10.17% 1,467,494 11.97% 1,477,742 11.27%
Administrative Salaries 1,013,100 7.82% 805,501 6.57% 1,641,486 12.51%
Offi cer Salaries 90,688 0.70% 196,260 1.60% 163,404 1.25%
Administrative Expense 1,973,098 15.23% 2,352,554 19.20% 1,762,414 13.44%
Student Personnel Services 250,607 1.93% 402,079 3.28% 197,390 1.50%
TOTAL EDUCATIONAL EXPENSES $10,253,517 79.14% $10,326,864 84.27% $10,722,317 81.74%
EDUCATIONAL INCOME $2,702,067 20.86% $1,927,836 15.73% $2,394,815 18.26%
Net Dormitory Income 4,107 0.03% 0 0.00% 0 0.00%
Net Bookstore Operations 85,360 0.66% (2,020) -0.02% 108,280 0.83%
Net Interest Income Expense (32,220) -0.25% (514,678) -4.20% 24,969 0.19%
Other Income Expense (283,436) -2.19% (44,318) -0.36% (278,341) -2.12%
Net Extraordinary & Unusual Income & Expense (50,596) -0.39% 0 0.00% 0 0.00%
TOTAL OTHER INCOME AND EXPENSE ($276,785) -2.14% ($561,016) -4.58% ($145,092) -1.11%
NET INCOME BEFORE INCOME TAXES $2,425,282 18.72% $1,366,820 11.15% $2,249,723 17.15%
(Federal State Income Taxes) (275,359) -2.13% (178,843) -1.46% (220,642) -1.68%
NET INCOME AFTER TAXES $2,149,923 16.59% $1,187,977 9.69% $2,029,081 15.47%
N = number of income statements in this revenue range

35
Academic Associate's Degree
N = 23
Bachelor's Degree
N = 92
Master's Degree
N = 13
AVG OR AVG OR AVG OR
Gross Tuition 14,697,665 106.94% 14,485,238 114.83% 15,627,983 107.39%
Gross Contract Revenue 471 0.00% 38,328 0.30% 0 0.00%
(Less Tuition Refunds) (741,752) -5.40% (1,650,807) -13.09% (771,703) -5.30%
(Less Textbook Expense) (212,768) -1.55% (258,394) -2.05% (303,495) -2.09%
TOTAL EDUCATIONAL REVENUES $13,743,616 100.00% $12,614,365 100.00% $14,552,785 100.00%
Instructional Salaries 2,595,041 18.88% 2,051,390 16.26% 3,480,985 23.92%
Instructional Expenses 780,996 5.68% 447,909 3.55% 593,118 4.08%
Student Recruitment 2,554,290 18.59% 2,578,408 20.44% 2,190,507 15.05%
Depreciation of Equipment 327,948 2.39% 277,475 2.20% 591,842 4.07%
Occupancy Expense 1,732,003 12.60% 1,113,429 8.83% 1,755,002 12.06%
Administrative Salaries 1,003,250 7.30% 917,549 7.27% 1,430,956 9.83%
Offi cer Salaries 94,523 0.69% 61,927 0.49% 125,934 0.87%
Administrative Expense 2,470,193 17.97% 1,756,108 13.92% 2,411,858 16.57%
Student Personnel Services 384,337 2.80% 181,619 1.44% 391,696 2.69%
TOTAL EDUCATIONAL EXPENSES $11,942,581 86.90% $9,385,814 74.41% $12,971,898 89.14%
EDUCATIONAL INCOME $1,801,035 13.10% $3,228,551 25.59% $1,580,887 10.86%
Net Dormitory Income (8) 0.00% 6,743 0.05% 0 0.00%
Net Bookstore Operations 92,395 0.67% 85,589 0.68% 141,041 0.97%
Net Interest Income Expense 31,296 0.23% 6,340 0.05% 20,987 0.14%
Other Income Expense (369,823) -2.69% (290,835) -2.31% (321,277) -2.21%
Net Extraordinary & Unusual Income & Expense 0 0.00% (80,217) -0.64% (20,000) -0.14%
TOTAL OTHER INCOME AND EXPENSE ($246,140) -1.79% ($272,380) -2.16% ($179,249) -1.23%
NET INCOME BEFORE INCOME TAXES $1,554,895 11.31% $2,956,171 23.43% $1,401,638 9.63%
(Federal State Income Taxes) (291,800) -2.12% (298,677) -2.37% (219,855) -1.51%
NET INCOME AFTER TAXES $1,263,095 9.19% $2,657,494 21.07% $1,181,783 8.12%

36
INCOME STATEMENTTotal Educational Revenue $20,000,000 - $49,999,999Mean Average (AVG) Operating Ratio (OR) = % of Total Educational Revenues
All Credential Levels
N = 22
Non-Degree
N = 2
Occupational Associate's Degree
N = 2
AVG OR AVG OR AVG OR
Gross Tuition 29,750,889 106.45% 23,683,552 100.96% 35,081,068 109.44%
Gross Contract Revenue 305 0.00% 0 0.00% 0 0.00%
(Less Tuition Refunds) (1,681,494) -6.02% (151,966) -0.65% (3,025,920) -9.44%
(Less Textbook Expense) (122,433) -0.44% (74,267) -0.32% 0 0.00%
TOTAL EDUCATIONAL REVENUES $27,947,267 100.00% $23,457,319 100.00% $32,055,148 100.00%
Instructional Salaries 4,583,945 16.40% 4,336,756 18.49% 6,533,841 20.38%
Instructional Expenses 649,216 2.32% 703,648 3.00% 1,389,002 4.33%
Student Recruitment 6,132,514 21.94% 4,389,068 18.71% 9,197,400 28.69%
Depreciation of Equipment 613,019 2.19% 863,136 3.68% 402,654 1.26%
Occupancy Expense 2,830,724 10.13% 4,898,976 20.88% 7,461,324 23.28%
Administrative Salaries 1,642,322 5.88% 1,804,730 7.69% 1,667,068 5.20%
Offi cer Salaries 122,749 0.44% 129,742 0.55% 278,623 0.87%
Administrative Expense 3,694,354 13.22% 3,815,605 16.27% 7,333,503 22.88%
Student Personnel Services 649,778 2.33% 1,136,379 4.84% 683,957 2.13%
TOTAL EDUCATIONAL EXPENSES $20,918,621 74.85% $22,078,040 94.12% $34,947,372 109.02%
EDUCATIONAL INCOME $7,028,646 25.15% $1,379,279 5.88% ($2,892,224) -9.02%
Net Dormitory Income 26,972 0.10% 143,813 0.61% (196,927) -0.61%
Net Bookstore Operations 216,050 0.77% 133,119 0.57% 273,892 0.85%
Net Interest Income Expense 13,291 0.05% (76,732) -0.33% 221,692 0.69%
Other Income Expense (133,215) -0.48% 64,882 0.28% (677,077) -2.11%
Net Extraordinary & Unusual Income & Expense (337) 0.00% 0 0.00% 0 0.00%
TOTAL OTHER INCOME AND EXPENSE $122,761 0.44% $265,082 1.13% ($378,420) -1.18%
NET INCOME BEFORE INCOME TAXES $7,151,407 25.59% $1,644,361 7.01% ($3,270,644) -10.20%
(Federal State Income Taxes) (1,047,135) -3.75% (585,485) -2.50% (1,324,972) -4.13%
NET INCOME AFTER TAXES $6,104,272 21.84% $1,058,876 4.51% ($4,595,616) -14.34%
N = number of income statements in this revenue range

37
Academic Associate's Degree
N = 2
Bachelor's Degree
N = 12
Master's Degree
N = 4
AVG OR AVG OR AVG OR
Gross Tuition 34,668,803 101.23% 28,672,793 110.01% 30,894,803 100.85%
Gross Contract Revenue 2,990 0.01% 0 0.00% 183 0.00%
(Less Tuition Refunds) 0 0.00% (2,466,576) -9.46% (259,548) -0.85%
(Less Textbook Expense) (424,688) -1.24% (141,301) -0.54% 0 0.00%
TOTAL EDUCATIONAL REVENUES $34,247,105 100.00% $26,064,916 100.00% $30,635,438 100.00%
Instructional Salaries 3,983,624 11.63% 4,002,298 15.36% 5,777,693 18.86%
Instructional Expenses 512,153 1.50% 546,579 2.10% 628,553 2.05%
Student Recruitment 1,659,715 4.85% 6,542,907 25.10% 6,477,013 21.14%
Depreciation of Equipment 514,150 1.50% 459,888 1.76% 1,101,972 3.60%
Occupancy Expense 1,328,232 3.88% 2,392,611 9.18% 1,546,882 5.05%
Administrative Salaries 1,609,094 4.70% 1,311,890 5.03% 2,556,659 8.35%
Offi cer Salaries 0 0.00% 136,059 0.52% 62,770 0.20%
Administrative Expense 858,050 2.51% 3,200,601 12.28% 4,713,567 15.39%
Student Personnel Services 126,426 0.37% 490,822 1.88% 1,127,929 3.68%
TOTAL EDUCATIONAL EXPENSES $10,591,444 30.93% $19,083,655 73.22% $23,993,038 78.32%
EDUCATIONAL INCOME $23,655,661 69.07% $6,981,261 26.78% $6,642,400 21.68%
Net Dormitory Income 0 0.00% 58,302 0.22% 0 0.00%
Net Bookstore Operations 108,840 0.32% 246,921 0.95% 189,589 0.62%
Net Interest Income Expense 11,647 0.03% (5,964) -0.02% 12,687 0.04%
Other Income Expense 15,286 0.04% (269,043) -1.03% 372,900 1.22%
Net Extraordinary & Unusual Income & Expense 0 0.00% (618) 0.00% 0 0.00%
TOTAL OTHER INCOME AND EXPENSE $135,773 0.40% $29,598 0.11% $575,176 1.88%
NET INCOME BEFORE INCOME TAXES $23,791,434 69.47% $7,010,859 26.90% $7,217,576 23.56%
(Federal State Income Taxes) 0 0.00% (1,385,118) -5.31% (648,662) -2.12%
NET INCOME AFTER TAXES $23,791,434 69.47% $5,625,741 21.58% $6,568,914 21.44%
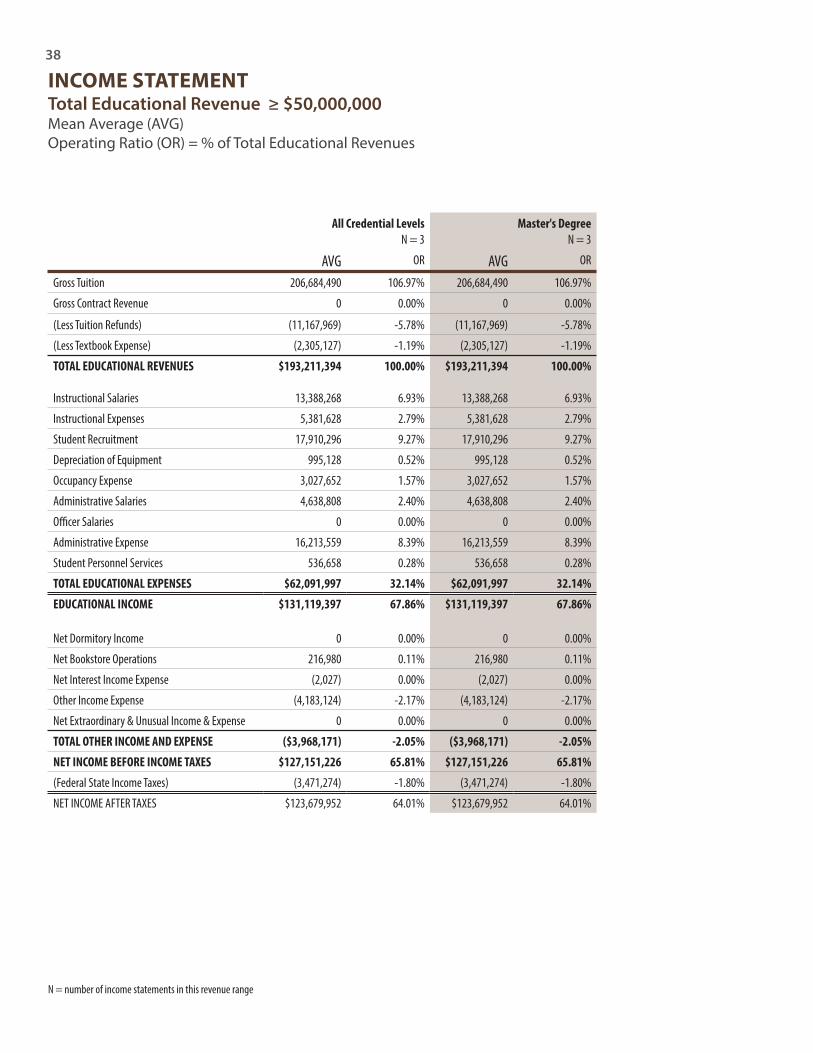
38
INCOME STATEMENTTotal Educational Revenue ≥ $50,000,000Mean Average (AVG) Operating Ratio (OR) = % of Total Educational Revenues
All Credential Levels
N = 3
Master's Degree
N = 3
AVG OR AVG OR
Gross Tuition 206,684,490 106.97% 206,684,490 106.97%
Gross Contract Revenue 0 0.00% 0 0.00%
(Less Tuition Refunds) (11,167,969) -5.78% (11,167,969) -5.78%
(Less Textbook Expense) (2,305,127) -1.19% (2,305,127) -1.19%
TOTAL EDUCATIONAL REVENUES $193,211,394 100.00% $193,211,394 100.00%
Instructional Salaries 13,388,268 6.93% 13,388,268 6.93%
Instructional Expenses 5,381,628 2.79% 5,381,628 2.79%
Student Recruitment 17,910,296 9.27% 17,910,296 9.27%
Depreciation of Equipment 995,128 0.52% 995,128 0.52%
Occupancy Expense 3,027,652 1.57% 3,027,652 1.57%
Administrative Salaries 4,638,808 2.40% 4,638,808 2.40%
Offi cer Salaries 0 0.00% 0 0.00%
Administrative Expense 16,213,559 8.39% 16,213,559 8.39%
Student Personnel Services 536,658 0.28% 536,658 0.28%
TOTAL EDUCATIONAL EXPENSES $62,091,997 32.14% $62,091,997 32.14%
EDUCATIONAL INCOME $131,119,397 67.86% $131,119,397 67.86%
Net Dormitory Income 0 0.00% 0 0.00%
Net Bookstore Operations 216,980 0.11% 216,980 0.11%
Net Interest Income Expense (2,027) 0.00% (2,027) 0.00%
Other Income Expense (4,183,124) -2.17% (4,183,124) -2.17%
Net Extraordinary & Unusual Income & Expense 0 0.00% 0 0.00%
TOTAL OTHER INCOME AND EXPENSE ($3,968,171) -2.05% ($3,968,171) -2.05%
NET INCOME BEFORE INCOME TAXES $127,151,226 65.81% $127,151,226 65.81%
(Federal State Income Taxes) (3,471,274) -1.80% (3,471,274) -1.80%
NET INCOME AFTER TAXES $123,679,952 64.01% $123,679,952 64.01%
N = number of income statements in this revenue range

BALANCE SHEET - ASSETS
ANNUAL FINANCIAL REPORT (AFR) DATA

40
BALANCE SHEET - ASSETSTotal Assets < $1,000,000Mean Average (in $)
All Credential Levels
N = 46
Non-Degree
N =17
Occupational Associate's Degree
N = 13
Cash on Hand - Unrestricted 95,888 19.02% 109,111 23.39% 100,012 17.48%
Cash - Restricted 29,065 5.77% 4,363 0.94% 0 0.00%
A/R Students - Net 149,898 29.74% 157,491 33.77% 132,522 23.16%
A/R - Related Parties 4,762 0.94% 10,855 2.33% 0 0.00%
A/R Other 5,048 1.00% 10,725 2.30% 1,292 0.23%
Allowance for Doubtful Accounts (3,091) -0.61% (7,559) -1.62% (1,052) -0.18%
N/R Related Parties 14,791 2.93% 30,277 6.49% 12,745 2.23%
N/R Other 936 0.19% 2,432 0.52% 0 0.00%
Inventory Books and Supplies 10,171 2.02% 5,228 1.12% 22,827 3.99%
Temporary Investments 5,647 1.12% 15,281 3.28% 0 0.00%
Current Prepaid Expense 12,957 2.57% 8,142 1.75% 24,412 4.27%
Other Current Assets 21,351 4.24% 2,323 0.50% 71,390 12.48%
TOTAL CURRENT ASSETS $347,423 68.92% $348,669 74.76% $364,148 63.63%
Buildings 18,747 3.72% 50,727 10.88% 0 0.00%
(Accumulated Depreciation) (15,580) -3.09% (42,158) -9.04% 0 0.00%
Furniture and Equipment 290,785 57.69% 236,829 50.78% 529,785 92.58%
(Accumulated Depreciation) (234,474) -46.52% (201,390) -43.18% (436,495) -76.28%
Leasehold Improvements 115,446 22.90% 26,612 5.71% 119,774 20.93%
(Amortization) (74,387) -14.76% (13,102) -2.81% (67,807) -11.85%
Library 3,866 0.77% 0 0.00% 0 0.00%
(Accumulated Depreciation) (2,639) -0.52% 0 0.00% 0 0.00%
Land 1,560 0.31% 4,222 0.91% 0 0.00%
Other Fixed Assets 55,273 10.97% 13,247 2.84% 43,120 7.54%
(Accumulated Depreciation) (43,663) -8.66% (9,623) -2.06% (27,800) -4.86%
TOTAL FIXED ASSETS $114,934 22.80% $65,364 14.01% $160,577 28.06%
Deposits 7,362 1.46% 8,433 1.81% 6,840 1.20%
Other Prepaid Expenses 841 0.17% 2,276 0.49% 0 0.00%
Goodwill 141 0.03% 0 0.00% 500 0.09%
Revolving Book Account 0 0.00% 0 0.00% 0 0.00%
SFA Matching Funds 0 0.00% 0 0.00% 0 0.00%
Other Assets 33,363 6.62% 41,656 8.93% 40,188 7.02%
TOTAL OTHER ASSETS $41,707 8.27% $52,365 11.23% $47,528 8.31%
TOTAL ASSETS $504,064 100.00% $466,398 100.00% $572,253 100.00%
N = number of balance sheets in this range of total assets

41
Academic Associate's Degree
N = 7
Bachelor's Degree
N = 1
Master's Degree
N = 8
Cash on Hand - Unrestricted 20,725 4.02% 195,940 20.46% 114,351 28.14%
Cash - Restricted 94,266 18.28% 0 0.00% 75,368 18.55%
A/R Students - Net 206,147 39.97% 495,123 51.71% 69,628 17.13%
A/R - Related Parties 0 0.00% 0 0.00% 4,313 1.06%
A/R Other (20) 0.00% 0 0.00% 4,154 1.02%
Allowance for Doubtful Accounts 0 0.00% 0 0.00% 0 0.00%
N/R Related Parties 0 0.00% 0 0.00% 0 0.00%
N/R Other 186 0.04% 404 0.04% 0 0.00%
Inventory Books and Supplies 9,605 1.86% 8,356 0.87% 830 0.20%
Temporary Investments 0 0.00% 0 0.00% 0 0.00%
Current Prepaid Expense 6,413 1.24% 0 0.00% 11,923 2.93%
Other Current Assets 1,099 0.21% 6,880 0.72% 0 0.00%
TOTAL CURRENT ASSETS $338,421 65.61% $706,703 73.80% $280,567 69.05%
Buildings 0 0.00% 0 0.00% 0 0.00%
(Accumulated Depreciation) 0 0.00% 0 0.00% 0 0.00%
Furniture and Equipment 202,355 39.23% 252,154 26.33% 99,270 24.43%
(Accumulated Depreciation) (139,167) -26.98% (245,870) -25.68% (58,460) -14.39%
Leasehold Improvements 198,952 38.57% 1,015,906 106.09% 111,560 27.45%
(Amortization) (123,521) -23.95% (811,439) -84.74% (80,187) -19.73%
Library 2,356 0.46% 0 0.00% 20,171 4.96%
(Accumulated Depreciation) (2,035) -0.39% 0 0.00% (13,393) -3.30%
Land 0 0.00% 0 0.00% 0 0.00%
Other Fixed Assets 114,585 22.21% 804,764 84.04% 18,739 4.61%
(Accumulated Depreciation) (89,591) -17.37% (764,627) -79.85% (11,471) -2.82%
TOTAL FIXED ASSETS $163,934 31.78% $250,888 26.20% $86,229 21.22%
0.00%
Deposits 7,088 1.37% 0 0.00% 7,096 1.75%
Other Prepaid Expenses 0 0.00% 0 0.00% 0 0.00%
Goodwill 0 0.00% 0 0.00% 0 0.00%
Revolving Book Account 0 0.00% 0 0.00% 0 0.00%
SFA Matching Funds 0 0.00% 0 0.00% 0 0.00%
Other Assets 6,362 1.23% 0 0.00% 32,459 7.99%
TOTAL OTHER ASSETS $13,450 2.61% $0 0.00% $39,555 9.73%
TOTAL ASSETS $515,805 100.00% $957,591 100.00% $406,351 100.00%

42
All Credential Levels
N = 213
Non-Degree
N =52
Occupational Associate's Degree
N = 32
Cash on Hand - Unrestricted 763,361 18.27% 358,459 8.91% 1,175,207 35.09%
Cash - Restricted 205,361 4.91% 1,422 0.04% 28,316 0.85%
A/R Students - Net 556,765 13.32% 506,328 12.59% 761,537 22.74%
A/R - Related Parties 62,416 1.49% 94,727 2.35% 73,526 2.20%
A/R Other 15,983 0.38% 17,171 0.43% 13,348 0.40%
Allowance for Doubtful Accounts (31,178) -0.75% (49,810) -1.24% (21,788) -0.65%
N/R Related Parties 33,085 0.79% 99,325 2.47% 3,500 0.10%
N/R Other 6,399 0.15% 1,868 0.05% 874 0.03%
Inventory Books and Supplies 43,806 1.05% 20,593 0.51% 52,897 1.58%
Temporary Investments 51,837 1.24% 133,854 3.33% 43,328 1.29%
Current Prepaid Expense 58,148 1.39% 52,305 1.30% 60,412 1.80%
Other Current Assets 130,487 3.12% 84,118 2.09% 32,465 0.97%
TOTAL CURRENT ASSETS $1,896,470 45.38% $1,320,360 32.82% $2,223,622 66.39%
Buildings 158,330 3.79% 73,840 1.84% 261,286 7.80%
(Accumulated Depreciation) (65,886) -1.58% (13,618) -0.34% (113,053) -3.38%
Furniture and Equipment 1,261,059 30.18% 758,612 18.86% 1,149,208 34.31%
(Accumulated Depreciation) (879,788) -21.05% (492,545) -12.24% (805,340) -24.04%
Leasehold Improvements 1,546,428 37.01% 959,816 23.86% 672,335 20.07%
(Amortization) (774,353) -18.53% (580,175) -14.42% (321,900) -9.61%
Library 42,850 1.03% 2,777 0.07% 46,163 1.38%
(Accumulated Depreciation) (28,911) -0.69% (2,071) -0.05% (37,693) -1.13%
Land 35,198 0.84% 32,710 0.81% 12,555 0.37%
Other Fixed Assets 157,084 3.76% 216,337 5.38% 96,482 2.88%
(Accumulated Depreciation) (150,600) -3.60% (228,604) -5.68% (155,352) -4.64%
TOTAL FIXED ASSETS $1,301,411 31.14% $727,079 18.07% $804,691 24.02%
Deposits 19,325 0.46% 15,700 0.39% 36,479 1.09%
Other Prepaid Expenses 3,152 0.08% 3,124 0.08% 0 0.00%
Goodwill 100,891 2.41% 70,677 1.76% 144,253 4.31%
Revolving Book Account 0 0.00% 0 0.00% 0 0.00%
SFA Matching Funds 4,587 0.11% 0 0.00% 11,680 0.35%
Other Assets 853,134 20.41% 1,886,047 46.88% 128,676 3.84%
TOTAL OTHER ASSETS $981,089 23.48% $1,975,548 49.11% $321,088 9.59%
TOTAL ASSETS $4,178,970 100.00% $4,022,987 100.00% $3,349,401 100.00%
BALANCE SHEET - ASSETSTotal Assets $1,000,000 - $9,999,999Mean Average (in $)
N = number of balance sheets in this range of total assets

43
Academic Associate's Degree
N = 64
Bachelor's Degree
N = 48
Master's Degree
N = 17
Cash on Hand - Unrestricted 687,275 17.88% 909,250 15.74% 1,101,165 37.06%
Cash - Restricted 133,839 3.48% 706,825 12.24% 15,790 0.53%
A/R Students - Net 425,928 11.08% 716,983 12.42% 365,770 12.31%
A/R - Related Parties 32,355 0.84% 57,713 1.00% 69,120 2.33%
A/R Other 22,261 0.58% 10,831 0.19% 8,218 0.28%
Allowance for Doubtful Accounts (33,767) -0.88% (5,053) -0.09% (55,880) -1.88%
N/R Related Parties 2,428 0.06% 19,175 0.33% 40,843 1.37%
N/R Other 11,386 0.30% 2,275 0.04% 23,535 0.79%
Inventory Books and Supplies 40,630 1.06% 79,902 1.38% 7,741 0.26%
Temporary Investments 10,410 0.27% 11,164 0.19% 87,787 2.95%
Current Prepaid Expense 70,419 1.83% 47,894 0.83% 54,517 1.83%
Other Current Assets 212,246 5.52% 167,325 2.90% 45,021 1.52%
TOTAL CURRENT ASSETS $1,615,410 42.02% $2,724,284 47.17% $1,763,627 59.36%
Buildings 94,148 2.45% 220,653 3.82% 288,633 9.71%
(Accumulated Depreciation) (33,884) -0.88% (105,752) -1.83% (144,896) -4.88%
Furniture and Equipment 1,149,068 29.89% 2,224,585 38.52% 709,571 23.88%
(Accumulated Depreciation) (806,445) -20.98% (1,595,923) -27.63% (458,524) -15.43%
Leasehold Improvements 1,948,159 50.68% 2,615,414 45.29% 455,402 15.33%
(Amortization) (936,244) -24.35% (1,297,120) -22.46% (134,456) -4.53%
Library 38,440 1.00% 91,656 1.59% 37,985 1.28%
(Accumulated Depreciation) (29,422) -0.77% (52,873) -0.92% (24,902) -0.84%
Land 13,079 0.34% 18,188 0.31% 216,726 7.29%
Other Fixed Assets 162,203 4.22% 123,681 2.14% 164,954 5.55%
(Accumulated Depreciation) (134,470) -3.50% (93,462) -1.62% (125,112) -4.21%
TOTAL FIXED ASSETS $1,464,632 38.10% $2,149,047 37.21% $985,381 33.16%
0.00%
Deposits 10,806 0.28% 11,995 0.21% 50,885 1.71%
Other Prepaid Expenses 0 0.00% 4,794 0.08% 16,396 0.55%
Goodwill 126,046 3.28% 94,550 1.64% 34,888 1.17%
Revolving Book Account 0 0.00% 0 0.00% 0 0.00%
SFA Matching Funds 4,606 0.12% 6,427 0.11% 0 0.00%
Other Assets 622,689 16.20% 784,024 13.58% 120,057 4.04%
TOTAL OTHER ASSETS $764,147 19.88% $901,790 15.62% $222,226 7.48%
TOTAL ASSETS $3,844,189 100.00% $5,775,121 100.00% $2,971,234 100.00%

44
All Credential Levels
N = 60
Non-Degree
N =6
Occupational Associate's Degree
N = 7
Cash on Hand - Unrestricted 1,032,609 7.10% 536,005 3.48% 1,056,220 7.24%
Cash - Restricted 431,302 2.97% 0 0.00% 140,743 0.96%
A/R Students - Net 1,708,642 11.75% 4,219,480 27.36% 1,131,304 7.75%
A/R - Related Parties 66,270 0.46% 0 0.00% 0 0.00%
A/R Other 132,627 0.91% 10,537 0.07% 59,171 0.41%
Allowance for Doubtful Accounts (54,117) -0.37% (85,309) -0.55% (22,304) -0.15%
N/R Related Parties 144,588 0.99% 177,000 1.15% 0 0.00%
N/R Other 6,300 0.04% 0 0.00% 12,638 0.09%
Inventory Books and Supplies 65,619 0.45% 53,222 0.35% 63,673 0.44%
Temporary Investments 59,809 0.41% 0 0.00% 0 0.00%
Current Prepaid Expense 89,329 0.61% 109,064 0.71% 115,589 0.79%
Other Current Assets 233,620 1.61% 27,696 0.18% 215,577 1.48%
TOTAL CURRENT ASSETS $3,916,598 26.93% $5,047,695 32.73% $2,772,611 19.00%
Buildings 839,464 5.77% 0 0.00% 0 0.00%
(Accumulated Depreciation) (219,420) -1.51% 0 0.00% 0 0.00%
Furniture and Equipment 1,935,733 13.31% 1,183,027 7.67% 1,642,524 11.26%
(Accumulated Depreciation) (1,312,764) -9.02% (341,125) -2.21% (1,274,298) -8.73%
Leasehold Improvements 2,589,637 17.80% 1,533,372 9.94% 2,245,058 15.39%
(Amortization) (1,472,487) -10.12% (1,136,546) -7.37% (1,790,791) -12.27%
Library 90,643 0.62% 7,117 0.05% 32,971 0.23%
(Accumulated Depreciation) (62,658) -0.43% (2,000) -0.01% (22,147) -0.15%
Land 341,820 2.35% 0 0.00% 0 0.00%
Other Fixed Assets 279,094 1.92% 163,044 1.06% 95,695 0.66%
(Accumulated Depreciation) (167,067) -1.15% (203,296) -1.32% (73,250) -0.50%
TOTAL FIXED ASSETS $2,841,995 19.54% $1,203,593 7.80% $855,762 5.86%
Deposits 32,049 0.22% 53,181 0.34% 17,832 0.12%
Other Prepaid Expenses 1,823 0.01% 0 0.00% 15,340 0.11%
Goodwill 583,604 4.01% 91,726 0.59% 548,317 3.76%
Revolving Book Account 0 0.00% 0 0.00% 0 0.00%
SFA Matching Funds 1,568 0.01% 0 0.00% 0 0.00%
Other Assets 7,168,515 49.28% 9,026,747 58.53% 10,382,304 71.15%
TOTAL OTHER ASSETS $7,787,559 53.54% $9,171,654 59.47% $10,963,793 75.13%
TOTAL ASSETS $14,546,152 100.00% $15,422,942 100.00% $14,592,166 100.00%
BALANCE SHEET - ASSETSTotal Assets $10,000,000 - $19,999,999Average (in $)
N = number of balance sheets in this range of total assets

45
Academic Associate's Degree
N = 22
Bachelor's Degree
N = 17
Master's Degree
N = 8
Cash on Hand - Unrestricted 775,513 5.29% 1,523,627 10.67% 1,048,001 7.42%
Cash - Restricted 0 0.00% 1,464,289 10.26% 0 0.00%
A/R Students - Net 380,919 2.60% 1,246,977 8.73% 4,962,959 35.15%
A/R - Related Parties 174,281 1.19% 7,059 0.05% 2,754 0.02%
A/R Other 3,371 0.02% 407,063 2.85% 60,744 0.43%
Allowance for Doubtful Accounts (64,564) -0.44% (20,327) -0.14% (101,639) -0.72%
N/R Related Parties 0 0.00% 447,839 3.14% 0 0.00%
N/R Other 13,162 0.09% 0 0.00% 0 0.00%
Inventory Books and Supplies 48,628 0.33% 82,645 0.58% 87,162 0.62%
Temporary Investments 0 0.00% 92,474 0.65% 252,060 1.79%
Current Prepaid Expense 94,157 0.64% 51,516 0.36% 118,628 0.84%
Other Current Assets 156,221 1.07% 233,773 1.64% 616,373 4.37%
TOTAL CURRENT ASSETS $1,581,688 10.79% $5,536,935 38.78% $7,047,042 49.91%
Buildings 134,426 0.92% 1,145,945 8.03% 3,491,175 24.73%
(Accumulated Depreciation) (28,288) -0.19% (153,626) -1.08% (1,241,407) -8.79%
Furniture and Equipment 1,377,928 9.40% 2,884,181 20.20% 2,275,333 16.12%
(Accumulated Depreciation) (1,058,956) -7.23% (2,010,288) -14.08% (1,290,880) -9.14%
Leasehold Improvements 2,677,030 18.27% 3,461,146 24.24% 1,591,055 11.27%
(Amortization) (1,463,574) -9.99% (1,983,800) -13.90% (383,898) -2.72%
Library 8,161 0.06% 159,113 1.11% 285,080 2.02%
(Accumulated Depreciation) (9,943) -0.07% (119,227) -0.84% (168,357) -1.19%
Land 14,013 0.10% 509,643 3.57% 1,442,121 10.21%
Other Fixed Assets 99,464 0.68% 356,370 2.50% 856,376 6.07%
(Accumulated Depreciation) (78,056) -0.53% (49,972) -0.35% (715,589) -5.07%
TOTAL FIXED ASSETS $1,672,205 11.41% $4,199,485 29.42% $6,141,009 43.50%
0.00%
Deposits 10,228 0.07% 48,655 0.34% 53,360 0.38%
Other Prepaid Expenses 0 0.00% 116 0.00% 0 0.00%
Goodwill 355,813 2.43% 951,538 6.67% 827,956 5.86%
Revolving Book Account 0 0.00% 0 0.00% 0 0.00%
SFA Matching Funds 4,275 0.03% 0 0.00% 0 0.00%
Other Assets 11,032,076 75.27% 3,539,618 24.79% 49,411 0.35%
TOTAL OTHER ASSETS $11,402,392 77.80% $4,539,927 31.80% $930,727 6.59%
TOTAL ASSETS $14,656,285 100.00% $14,276,347 100.00% $14,118,778 100.00%

46
BALANCE SHEET - ASSETSTotal Assets $20,000,000 - $49,999,999Average (in $)
All Credential Levels
N = 46
Non-Degree
N =5
Occupational Associate's Degree
N = 7
Cash on Hand - Unrestricted 2,018,076 6.51% 1,162,067 4.17% 1,228,232 4.02%
Cash - Restricted 409,049 1.32% 0 0.00% 0 0.00%
A/R Students - Net 2,533,205 8.17% 4,544,903 16.33% 472,837 1.55%
A/R - Related Parties 668,074 2.16% 50,700 0.18% 3,243,188 10.62%
A/R Other 158,511 0.51% 298,895 1.07% 450,580 1.48%
Allowance for Doubtful Accounts (207,433) -0.67% 0 0.00% (31,142) -0.10%
N/R Related Parties 3,338 0.01% 0 0.00% 0 0.00%
N/R Other 67,561 0.22% 414,896 1.49% 6,595 0.02%
Inventory Books and Supplies 121,723 0.39% 86,523 0.31% 76,317 0.25%
Temporary Investments 550,925 1.78% 0 0.00% 427,596 1.40%
Current Prepaid Expense 240,711 0.78% 85,924 0.31% 106,962 0.35%
Other Current Assets 241,655 0.78% 362,931 1.30% 158,072 0.52%
TOTAL CURRENT ASSETS $6,805,395 21.96% $7,006,839 25.17% $6,139,237 20.10%
Buildings 1,958,182 6.32% 985,597 3.54% 538,021 1.76%
(Accumulated Depreciation) (265,126) -0.86% (4,203) -0.02% (114,463) -0.37%
Furniture and Equipment 3,555,411 11.47% 3,620,027 13.00% 1,583,124 5.18%
(Accumulated Depreciation) (2,524,400) -8.15% (2,492,931) -8.95% (1,263,771) -4.14%
Leasehold Improvements 3,997,915 12.90% 6,267,956 22.51% 4,683,299 15.33%
(Amortization) (1,936,713) -6.25% (3,381,189) -12.15% (1,934,722) -6.33%
Library 83,908 0.27% 82,804 0.30% 39,186 0.13%
(Accumulated Depreciation) (50,378) -0.16% (58,161) -0.21% (25,933) -0.08%
Land 588,358 1.90% 254,534 0.91% 90,957 0.30%
Other Fixed Assets 606,943 1.96% 489,214 1.76% 120,487 0.39%
(Accumulated Depreciation) (252,302) -0.81% (39,289) -0.14% (90,699) -0.30%
TOTAL FIXED ASSETS $5,761,798 18.59% $5,724,359 20.56% $3,625,486 11.87%
Deposits 70,116 0.23% 29,632 0.11% 9,332 0.03%
Other Prepaid Expenses 4,539 0.01% 1,350 0.00% 0 0.00%
Goodwill 1,264,796 4.08% 6,024,114 21.64% 0 0.00%
Revolving Book Account 22,604 0.07% 0 0.00% 0 0.00%
SFA Matching Funds 4,188 0.01% 0 0.00% 0 0.00%
Other Assets 17,059,698 55.04% 9,053,547 32.52% 20,770,651 68.00%
TOTAL OTHER ASSETS $18,425,941 59.45% $15,108,643 54.27% $20,779,983 68.03%
TOTAL ASSETS $30,993,134 100.00% $27,839,841 100.00% $30,544,706 100.00%
N = number of balance sheets in this range of total assets

47
Academic Associate's Degree
N = 14
Bachelor's Degree
N = 11
Master's Degree
N = 9
Cash on Hand - Unrestricted 689,090 2.29% 3,171,883 9.89% 3,765,062 11.32%
Cash - Restricted 880,850 2.93% 464,514 1.45% 152,745 0.46%
A/R Students - Net 862,765 2.87% 4,378,614 13.65% 3,361,067 10.11%
A/R - Related Parties 0 0.00% 382,051 1.19% 397,004 1.19%
A/R Other 129,111 0.43% 63,002 0.20% 15,822 0.05%
Allowance for Doubtful Accounts (182,426) -0.61% (423,342) -1.32% (234,799) -0.71%
N/R Related Parties 0 0.00% 13,957 0.04% 0 0.00%
N/R Other 12,235 0.04% 72,465 0.23% 2,083 0.01%
Inventory Books and Supplies 37,616 0.13% 308,941 0.96% 78,605 0.24%
Temporary Investments 0 0.00% 1,357,379 4.23% 824,243 2.48%
Current Prepaid Expense 123,422 0.41% 436,025 1.36% 374,464 1.13%
Other Current Assets 92,454 0.31% 552,497 1.72% 91,458 0.27%
TOTAL CURRENT ASSETS $2,645,117 8.81% $10,777,986 33.59% $8,827,754 26.54%
Buildings 4,709 0.02% 4,074,775 12.70% 4,054,866 12.19%
(Accumulated Depreciation) (937) 0.00% (499,225) -1.56% (652,103) -1.96%
Furniture and Equipment 1,907,576 6.35% 5,696,766 17.75% 4,999,600 15.03%
(Accumulated Depreciation) (1,465,390) -4.88% (3,988,048) -12.43% (3,380,816) -10.16%
Leasehold Improvements 2,292,701 7.64% 3,678,443 11.46% 5,246,727 15.77%
(Amortization) (1,567,962) -5.22% (1,836,752) -5.72% (1,831,563) -5.51%
Library 36,793 0.12% 74,299 0.23% 204,339 0.61%
(Accumulated Depreciation) (27,463) -0.09% (66,620) -0.21% (80,864) -0.24%
Land 0 0.00% 1,150,485 3.59% 1,388,864 4.18%
Other Fixed Assets 351,203 1.17% 1,637,447 5.10% 189,013 0.57%
(Accumulated Depreciation) (122,970) -0.41% (699,536) -2.18% (150,897) -0.45%
TOTAL FIXED ASSETS $1,408,260 4.69% $9,222,034 28.74% $9,987,166 30.03%
Deposits 13,258 0.04% 87,060 0.27% 207,621 0.62%
Other Prepaid Expenses 0 0.00% 18,366 0.06% 0 0.00%
Goodwill 933,009 3.11% 731,956 2.28% 771,820 2.32%
Revolving Book Account 0 0.00% 0 0.00% 115,532 0.35%
SFA Matching Funds 0 0.00% 2,980 0.01% 17,763 0.05%
Other Assets 25,026,806 83.35% 11,246,450 35.05% 13,333,081 40.09%
TOTAL OTHER ASSETS $25,973,073 86.50% $12,086,812 37.67% $14,445,817 43.43%
TOTAL ASSETS $30,026,450 100.00% $32,086,832 100.00% $33,260,737 100.00%

48
BALANCE SHEET - ASSETSTotal Assets $50,000,000 - $99,999,999Mean Average (in $)
All Credential Levels
N = 10
Occupational Associate's Degree
N = 1
Academic Associate's Degree
N = 2
Cash on Hand - Unrestricted 1,776,785 2.61% 14,721 0.03% 21,918 0.03%
Cash - Restricted 28,899 0.04% 0 0.00% 0 0.00%
A/R Students - Net 7,695,658 11.31% 85,124 0.16% 561,121 0.75%
A/R - Related Parties 424,035 0.62% 0 0.00% 0 0.00%
A/R Other 104,419 0.15% 2,085 0.00% 5,324 0.01%
Allowance for Doubtful Accounts (1,592,589) -2.34% 0 0.00% (57,779) -0.08%
N/R Related Parties 191,640 0.28% 0 0.00% 0 0.00%
N/R Other 301,244 0.44% 2,599 0.00% 0 0.00%
Inventory Books and Supplies 138,737 0.20% 169,876 0.33% 50,895 0.07%
Temporary Investments 0 0.00% 0 0.00% 0 0.00%
Current Prepaid Expense 253,116 0.37% 226,786 0.43% 104,864 0.14%
Other Current Assets 2,207,206 3.25% 20,072,775 38.46% 8,919 0.01%
TOTAL CURRENT ASSETS $11,529,150 16.95% $20,573,966 39.42% $695,262 0.93%
Buildings 6,580,921 9.68% 0 0.00% 0 0.00%
(Accumulated Depreciation) (1,053,171) -1.55% 0 0.00% 0 0.00%
Furniture and Equipment 4,972,978 7.31% 3,973,199 7.61% 2,376,898 3.20%
(Accumulated Depreciation) (3,896,512) -5.73% (3,134,669) -6.01% (1,992,908) -2.68%
Leasehold Improvements 3,462,159 5.09% 7,417,230 14.21% 6,685,192 8.99%
(Amortization) (2,229,667) -3.28% (4,291,019) -8.22% (4,340,187) -5.84%
Library 13,486 0.02% 19,932 0.04% 26,795 0.04%
(Accumulated Depreciation) (11,749) -0.02% (14,092) -0.03% (23,925) -0.03%
Land 1,585,839 2.33% 0 0.00% 0 0.00%
Other Fixed Assets 123,316 0.18% 11,564 0.02% 160,822 0.22%
(Accumulated Depreciation) (105,206) -0.15% 0 0.00% (123,286) -0.17%
TOTAL FIXED ASSETS $9,442,394 13.88% $3,982,145 7.63% $2,769,401 3.72%
Deposits 23,700 0.03% 210,686 0.40% 0 0.00%
Other Prepaid Expenses 0 0.00% 0 0.00% 0 0.00%
Goodwill 3,108,183 4.57% 27,290,450 52.29% 0 0.00%
Revolving Book Account 0 0.00% 0 0.00% 0 0.00%
SFA Matching Funds 0 0.00% 0 0.00% 0 0.00%
Other Assets 43,914,652 64.56% 135,635 0.26% 70,914,109 95.34%
TOTAL OTHER ASSETS $47,046,535 69.17% $27,636,771 52.95% $70,914,109 95.34%
TOTAL ASSETS $68,018,079 100.00% $52,192,882 100.00% $74,378,772 100.00%
N = number of balance sheets in this range of total assets

49
Bachelor's Degree
N = 2
Master's Degree
N = 5
Cash on Hand - Unrestricted 2,381,882 3.44% 2,589,107 3.80%
Cash - Restricted 0 0.00% 57,797 0.08%
A/R Students - Net 36,008,051 51.96% 746,622 1.10%
A/R - Related Parties 0 0.00% 848,070 1.24%
A/R Other 450,530 0.65% 26,080 0.04%
Allowance for Doubtful Accounts (7,586,829) -10.95% (127,335) -0.19%
N/R Related Parties 0 0.00% 383,281 0.56%
N/R Other 1,504,920 2.17% 0 0.00%
Inventory Books and Supplies 318,832 0.46% 95,609 0.14%
Temporary Investments 0 0.00% 0 0.00%
Current Prepaid Expense 67,476 0.10% 391,940 0.58%
Other Current Assets 854,329 1.23% 54,558 0.08%
TOTAL CURRENT ASSETS $33,999,191 49.06% $5,065,729 7.44%
Buildings 3,398,533 4.90% 11,802,429 17.32%
(Accumulated Depreciation) (208,581) -0.30% (2,022,910) -2.97%
Furniture and Equipment 7,476,818 10.79% 5,209,831 7.65%
(Accumulated Depreciation) (5,812,396) -8.39% (4,043,969) -5.94%
Leasehold Improvements 2,876,502 4.15% 1,616,194 2.37%
(Amortization) (1,346,429) -1.94% (1,326,483) -1.95%
Library 0 0.00% 12,268 0.02%
(Accumulated Depreciation) 0 0.00% (11,109) -0.02%
Land 0 0.00% 3,171,678 4.66%
Other Fixed Assets 74,013 0.11% 150,386 0.22%
(Accumulated Depreciation) (67,878) -0.10% (133,947) -0.20%
TOTAL FIXED ASSETS $6,390,582 9.22% $14,424,368 21.17%
0.00%
Deposits 0 0.00% 5,263 0.01%
Other Prepaid Expenses 0 0.00% 0 0.00%
Goodwill 1,895,691 2.74% 0 0.00%
Revolving Book Account 0 0.00% 0 0.00%
SFA Matching Funds 0 0.00% 0 0.00%
Other Assets 27,020,292 38.99% 48,628,411 71.38%
TOTAL OTHER ASSETS $28,915,983 41.72% $48,633,674 71.39%
TOTAL ASSETS $69,305,756 100.00% $68,123,771 100.00%

50
BALANCE SHEET - ASSETSTotal Assets $100,000,000 - $699,999,999Mean Average (in $)
All Credential Levels
N = 11
Non-Degree
N =1
Occupational Associate's Degree
N = 2
Cash on Hand - Unrestricted 34,066,990 14.99% 61,708,000 17.79% 14,227,220 7.57%
Cash - Restricted 368,113 0.16% 0 0.00% 527,349 0.28%
A/R Students - Net 20,008,989 8.81% 17,370,000 5.01% 5,868,717 3.12%
A/R - Related Parties 7,217,705 3.18% 0 0.00% 0 0.00%
A/R Other 1,195,571 0.53% 0 0.00% 279,164 0.15%
Allowance for Doubtful Accounts (712,011) -0.31% 0 0.00% (2,084,130) -1.11%
N/R Related Parties 0 0.00% 0 0.00% 0 0.00%
N/R Other 631,117 0.28% 0 0.00% (170,651) -0.09%
Inventory Books and Supplies 1,072,746 0.47% 2,677,000 0.77% 763,265 0.41%
Temporary Investments 21,031 0.01% 0 0.00% 0 0.00%
Current Prepaid Expense 4,689,957 2.06% 14,814,000 4.27% 1,691,152 0.90%
Other Current Assets 7,156,970 3.15% 2,944,000 0.85% 4,244,056 2.26%
TOTAL CURRENT ASSETS $75,717,178 33.32% $99,513,000 28.70% $25,346,142 13.48%
Buildings 20,841,140 9.17% 105,354,000 30.38% 0 0.00%
(Accumulated Depreciation) (5,278,159) -2.32% (30,140,000) -8.69% 0 0.00%
Furniture and Equipment 47,670,975 20.98% 79,172,000 22.83% 23,745,817 12.63%
(Accumulated Depreciation) (30,343,370) -13.35% (52,891,000) -15.25% (16,044,300) -8.54%
Leasehold Improvements 26,322,494 11.58% 87,810,000 25.32% 26,991,436 14.36%
(Amortization) (12,947,976) -5.70% (53,981,000) -15.57% (11,190,094) -5.95%
Library 60,954 0.03% 0 0.00% 104,446 0.06%
(Accumulated Depreciation) (16,307) -0.01% 0 0.00% (24,672) -0.01%
Land 5,423,091 2.39% 18,362,000 5.30% 0 0.00%
Other Fixed Assets 3,806,684 1.68% 1,293,000 0.37% 20,709 0.01%
(Accumulated Depreciation) (4,116,503) -1.81% (883,000) -0.25% (10,411) -0.01%
TOTAL FIXED ASSETS $51,423,023 22.63% $154,096,000 44.44% $23,592,931 12.55%
Deposits 233,094 0.10% 0 0.00% 589,476 0.31%
Other Prepaid Expenses 918,969 0.40% 0 0.00% 5,523 0.00%
Goodwill 47,694,573 20.99% 65,527,000 18.90% 61,961,137 32.96%
Revolving Book Account 0 0.00% 0 0.00% 0 0.00%
SFA Matching Funds 0 0.00% 0 0.00% 0 0.00%
Other Assets 51,246,782 22.55% 27,638,000 7.97% 76,474,373 40.68%
TOTAL OTHER ASSETS $100,093,418 44.05% $93,165,000 26.87% $139,030,509 73.96%
TOTAL ASSETS $227,233,619 100.00% $346,774,000 100.00% $187,969,582 100.00%
N = number of balance sheets in this range of total assets
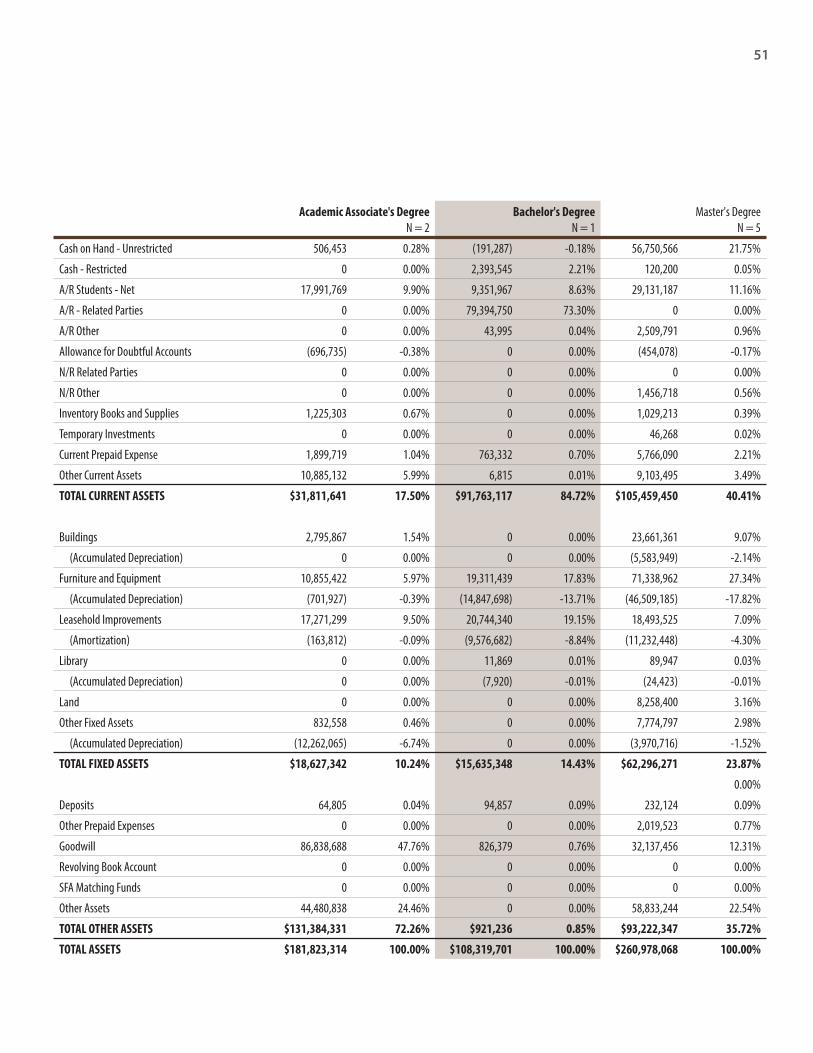
51
Academic Associate's Degree
N = 2
Bachelor's Degree
N = 1
Master's Degree
N = 5
Cash on Hand - Unrestricted 506,453 0.28% (191,287) -0.18% 56,750,566 21.75%
Cash - Restricted 0 0.00% 2,393,545 2.21% 120,200 0.05%
A/R Students - Net 17,991,769 9.90% 9,351,967 8.63% 29,131,187 11.16%
A/R - Related Parties 0 0.00% 79,394,750 73.30% 0 0.00%
A/R Other 0 0.00% 43,995 0.04% 2,509,791 0.96%
Allowance for Doubtful Accounts (696,735) -0.38% 0 0.00% (454,078) -0.17%
N/R Related Parties 0 0.00% 0 0.00% 0 0.00%
N/R Other 0 0.00% 0 0.00% 1,456,718 0.56%
Inventory Books and Supplies 1,225,303 0.67% 0 0.00% 1,029,213 0.39%
Temporary Investments 0 0.00% 0 0.00% 46,268 0.02%
Current Prepaid Expense 1,899,719 1.04% 763,332 0.70% 5,766,090 2.21%
Other Current Assets 10,885,132 5.99% 6,815 0.01% 9,103,495 3.49%
TOTAL CURRENT ASSETS $31,811,641 17.50% $91,763,117 84.72% $105,459,450 40.41%
Buildings 2,795,867 1.54% 0 0.00% 23,661,361 9.07%
(Accumulated Depreciation) 0 0.00% 0 0.00% (5,583,949) -2.14%
Furniture and Equipment 10,855,422 5.97% 19,311,439 17.83% 71,338,962 27.34%
(Accumulated Depreciation) (701,927) -0.39% (14,847,698) -13.71% (46,509,185) -17.82%
Leasehold Improvements 17,271,299 9.50% 20,744,340 19.15% 18,493,525 7.09%
(Amortization) (163,812) -0.09% (9,576,682) -8.84% (11,232,448) -4.30%
Library 0 0.00% 11,869 0.01% 89,947 0.03%
(Accumulated Depreciation) 0 0.00% (7,920) -0.01% (24,423) -0.01%
Land 0 0.00% 0 0.00% 8,258,400 3.16%
Other Fixed Assets 832,558 0.46% 0 0.00% 7,774,797 2.98%
(Accumulated Depreciation) (12,262,065) -6.74% 0 0.00% (3,970,716) -1.52%
TOTAL FIXED ASSETS $18,627,342 10.24% $15,635,348 14.43% $62,296,271 23.87%
0.00%
Deposits 64,805 0.04% 94,857 0.09% 232,124 0.09%
Other Prepaid Expenses 0 0.00% 0 0.00% 2,019,523 0.77%
Goodwill 86,838,688 47.76% 826,379 0.76% 32,137,456 12.31%
Revolving Book Account 0 0.00% 0 0.00% 0 0.00%
SFA Matching Funds 0 0.00% 0 0.00% 0 0.00%
Other Assets 44,480,838 24.46% 0 0.00% 58,833,244 22.54%
TOTAL OTHER ASSETS $131,384,331 72.26% $921,236 0.85% $93,222,347 35.72%
TOTAL ASSETS $181,823,314 100.00% $108,319,701 100.00% $260,978,068 100.00%

52
BALANCE SHEET - ASSETSTotal Assets > $700,000,000Mean Average (in $)
All Credential Levels
N = 2
Bachelor's Degree
N = 1
Master's Degree
N = 1
Cash on Hand - Unrestricted 432,952,980 13.47% 857,447,000 16.16% 8,458,960 0.76%
Cash - Restricted 0 0.00% 0 0.00% 0 0.00%
A/R Students - Net 16,358,905 0.51% 0 0.00% 32,717,809 2.92%
A/R - Related Parties 0 0.00% 0 0.00% 0 0.00%
A/R Other 230,314,500 7.17% 460,629,000 8.68% 0 0.00%
Allowance for Doubtful Accounts (6,029,865) -0.19% 0 0.00% (12,059,730) -1.08%
N/R Related Parties 0 0.00% 0 0.00% 0 0.00%
N/R Other 0 0.00% 0 0.00% 0 0.00%
Inventory Books and Supplies 26,419,000 0.82% 52,838,000 1.00% 0 0.00%
Temporary Investments 198,091,000 6.17% 396,182,000 7.47% 0 0.00%
Current Prepaid Expense 21,633,573 0.67% 43,146,000 0.81% 121,146 0.01%
Other Current Assets 299,635 0.01% 0 0.00% 599,270 0.05%
TOTAL CURRENT ASSETS $920,039,728 28.63% $1,810,242,000 34.11% $29,837,455 2.67%
Buildings 519,440,000 16.17% 1,038,880,000 19.58% 0 0.00%
(Accumulated Depreciation) 0 0.00% 0 0.00% 0 0.00%
Furniture and Equipment 941,005,932 29.29% 1,880,306,000 35.43% 1,705,863 0.15%
(Accumulated Depreciation) (862,690,228) -26.85% (1,723,910,000) -32.48% (1,470,456) -0.13%
Leasehold Improvements 23,026,743 0.72% 45,413,000 0.86% 640,486 0.06%
(Amortization) (308,101) -0.01% 0 0.00% (616,202) -0.06%
Library 0 0.00% 0 0.00% 0 0.00%
(Accumulated Depreciation) 0 0.00% 0 0.00% 0 0.00%
Land 61,678,000 1.92% 123,356,000 2.32% 0 0.00%
Other Fixed Assets 90,949,943 2.83% 181,620,000 3.42% 279,886 0.03%
(Accumulated Depreciation) (127,007) 0.00% 0 0.00% (254,013) -0.02%
TOTAL FIXED ASSETS $772,975,282 24.06% $1,545,665,000 29.13% $285,564 0.03%
0.00%
Deposits 45,750 0.00% 0 0.00% 91,500 0.01%
Other Prepaid Expenses 0 0.00% 0 0.00% 0 0.00%
Goodwill 0 0.00% 0 0.00% 0 0.00%
Revolving Book Account 0 0.00% 0 0.00% 0 0.00%
SFA Matching Funds 0 0.00% 0 0.00% 0 0.00%
Other Assets 1,520,036,968 47.31% 1,950,994,000 36.76% 1,089,079,933 97.30%
TOTAL OTHER ASSETS $1,520,082,718 47.31% $1,950,994,000 36.76% $1,089,171,433 97.31%
TOTAL ASSETS $3,213,097,728 100.00% $5,306,901,000 100.00% $1,119,294,452 100.00%
N = number of balance sheets in this range of total assets

BALANCE SHEET - LIABILITIES AND EQUITY
ANNUAL FINANCIAL REPORT (AFR) DATA

54
All Credential Levels
N = 46
Non-Degree
N =17
Occupational Associate's Degree
N = 13
Accounts Payable Trade 53,906 10.69% 89,625 19.22% 42,007 7.34%
Notes Payable Equipment 3,254 0.65% 0 0.00% 11,513 2.01%
Notes Payable Other 21,929 4.35% 1,012 0.22% 26,349 4.60%
Tuition Refunds Payable 22,129 4.39% 54,506 11.69% 1,558 0.27%
Current Portion of Long Term Debt 6,111 1.21% 7,329 1.57% 8,242 1.44%
Payroll Taxes Payable 4,427 0.88% 4,592 0.98% 2,939 0.51%
Accrued Salaries and Wages 15,280 3.03% 9,059 1.94% 36,616 6.40%
Unearned Tuition 117,403 23.29% 98,489 21.12% 111,353 19.46%
Unearned Dormitory Fees 2,251 0.45% 0 0.00% 0 0.00%
Other Current Liabilities 55,907 11.09% 13,128 2.81% 65,276 11.41%
TOTAL CURRENT LIABILITIES $302,597 60.03% $277,740 59.55% $305,853 53.45%
Notes or Bonds Payable 30,055 5.96% 18,114 3.88% 74,189 12.96%
Mortgage Payable 3,332 0.66% 9,017 1.93% 0 0.00%
Other Long-Term Liabilities 64,946 12.88% 22,308 4.78% 4,966 0.87%
TOTAL LONG-TERM LIABILITIES $98,333 19.51% $49,439 10.60% $79,155 13.83%
TOTAL LIABILITIES $400,930 79.54% $327,179 70.15% $385,008 67.28%
Preff ered Stock (45,030) -8.93% (121,845) -26.12% 0 0.00%
Common Stock 22,084 4.38% 15,462 3.32% 57,846 10.11%
Other Equity 29,495 5.85% 54,831 11.76% (64,491) -11.27%
Retained Earnings 0.00%
Beginning Balance 114,823 22.78% 185,807 39.84% 275,628 48.17%
Earnings and Loss for Year (1,019) -0.20% 13,991 3.00% 72,146 12.61%
(Dividends) (23,291) -4.62% (13,235) -2.84% (46,689) -8.16%
Other R/E Changes 6,072 1.20% 4,208 0.90% (107,195) -18.73%
Ending Balance 96,585 19.16% 190,771 40.90% 193,890 33.88%
TOTAL STOCKHOLDERS EQUITY $103,134 20.46% $139,219 29.85% $187,245 32.72%
TOTAL LIABILITIES AND EQUITY $504,064 100.00% $466,398 100.00% $572,253 100.00%
BALANCE SHEET - LIABILITIES AND EQUITYTotal Liabilities & Equity > $1,000,000Average (in $)
N = number of balance sheets in this range of total liabilities and equity

55
Academic Associate's Degree
N = 7
Bachelor's Degree
N = 1
Master's Degree
N = 8
Accounts Payable Trade 33,311 6.46% 21,552 2.25% 19,407 4.78%
Notes Payable Equipment 0 0.00% 0 0.00% 0 0.00%
Notes Payable Other 92,714 17.97% 0 0.00% 0 0.00%
Tuition Refunds Payable 10,153 1.97% 0 0.00% 0 0.00%
Current Portion of Long Term Debt 3,144 0.61% 0 0.00% 3,421 0.84%
Payroll Taxes Payable 5,831 1.13% 0 0.00% 5,817 1.43%
Accrued Salaries and Wages 7,229 1.40% 0 0.00% 2,783 0.68%
Unearned Tuition 153,911 29.84% 577,198 60.28% 78,009 19.20%
Unearned Dormitory Fees 3,920 0.76% 76,125 7.95% 0 0.00%
Other Current Liabilities 33,976 6.59% 0 0.00% 157,767 38.83%
TOTAL CURRENT LIABILITIES $344,189 66.73% $674,875 70.48% $267,204 65.76%
Notes or Bonds Payable 1,714 0.33% 0 0.00% 12,269 3.02%
Mortgage Payable 0 0.00% 0 0.00% 0 0.00%
Other Long-Term Liabilities 363,277 70.43% 0 0.00% 100 0.02%
TOTAL LONG-TERM LIABILITIES $364,991 70.76% $0 0.00% $12,369 3.04%
TOTAL LIABILITIES $709,180 137.49% $674,875 70.48% $279,573 68.80%
Preff ered Stock 0 0.00% 0 0.00% 0 0.00%
Common Stock 0 0.00% 0 0.00% 125 0.03%
Other Equity 0 0.00% 0 0.00% 157,880 38.85%
Retained Earnings 0.00%
Beginning Balance 62,399 12.10% 376,700 39.34% (284,187) -69.94%
Earnings and Loss for Year 69,345 13.44% 2,313,951 241.64% (502,744) -123.72%
(Dividends) (34,208) -6.63% 0 0.00% 0 0.00%
Other R/E Changes (290,911) -56.40% (2,407,935) -251.46% 755,704 185.97%
Ending Balance (193,375) -37.49% 282,716 29.52% (31,227) -7.68%
TOTAL STOCKHOLDERS EQUITY ($193,375) -37.49% $282,716 29.52% $126,778 31.20%
TOTAL LIABILITIES AND EQUITY $515,805 100.00% $957,591 100.00% $406,351 100.00%

56
All Credential Levels
N = 213
Non-Degree
N =52
Occupational Associate's Degree
N = 32
Accounts Payable Trade 130,752 3.13% 122,645 3.05% 156,290 4.67%
Notes Payable Equipment 4,341 0.10% 3,599 0.09% 2,025 0.06%
Notes Payable Other 23,081 0.55% 27,368 0.68% 12,540 0.37%
Tuition Refunds Payable 8,147 0.19% 3,347 0.08% 14,258 0.43%
Current Portion of Long Term Debt 20,795 0.50% 14,065 0.35% 66,028 1.97%
Payroll Taxes Payable 9,305 0.22% 13,550 0.34% 2,531 0.08%
Accrued Salaries and Wages 47,932 1.15% 64,752 1.61% 47,485 1.42%
Unearned Tuition 537,876 12.87% 623,625 15.50% 781,059 23.32%
Unearned Dormitory Fees 1,428 0.03% 0 0.00% 179 0.01%
Other Current Liabilities 145,126 3.47% 69,670 1.73% 206,039 6.15%
TOTAL CURRENT LIABILITIES $928,783 22.23% $942,621 23.43% $1,288,434 38.47%
Notes or Bonds Payable 62,446 1.49% 38,892 0.97% 69,611 2.08%
Mortgage Payable 36,854 0.88% 3,840 0.10% 61,017 1.82%
Other Long-Term Liabilities 761,863 18.23% 557,116 13.85% 118,931 3.55%
TOTAL LONG-TERM LIABILITIES $861,163 20.61% $599,848 14.91% $249,559 7.45%
TOTAL LIABILITIES $1,789,946 42.83% $1,542,469 38.34% $1,537,993 45.92%
Preff ered Stock 3,568 0.09% 0 0.00% (1,580) -0.05%
Common Stock (30,652) -0.73% 8,859 0.22% 16,200 0.48%
Other Equity 927,661 22.20% 1,417,800 35.24% 519,484 15.51%
Retained Earnings
Beginning Balance 1,755,917 42.02% 1,254,068 31.17% 1,638,272 48.91%
Earnings and Loss for Year (12,662) -0.30% (196,543) -4.89% 219,957 6.57%
(Dividends) (113,125) -2.71% (8,627) -0.21% (310,926) -9.28%
Other R/E Changes (141,683) -3.39% 4,961 0.12% (269,999) -8.06%
Ending Balance
TOTAL STOCKHOLDERS EQUITY $2,389,024 57.17% $2,480,518 61.66% $1,811,408 54.08%
TOTAL LIABILITIES AND EQUITY $4,178,970 100.00% $4,022,987 100.00% $3,349,401 100.00%
BALANCE SHEET - LIABILITIES AND EQUITYTotal Liabilities & Equity $1,000,000 - $9,999,999Average (in $)
N = number of balance sheets in this range of total liabilities and equity

57
Academic Associate's Degree
N = 64
Bachelor's Degree
N = 48
Master's Degree
N = 17
Accounts Payable Trade 90,611 2.36% 159,796 2.77% 176,594 5.94%
Notes Payable Equipment 7,321 0.19% 4,254 0.07% 0 0.00%
Notes Payable Other 9,252 0.24% 41,667 0.72% 29,389 0.99%
Tuition Refunds Payable 7,239 0.19% 13,017 0.23% 994 0.03%
Current Portion of Long Term Debt 9,521 0.25% 5,419 0.09% 42,097 1.42%
Payroll Taxes Payable 10,075 0.26% 8,052 0.14% 9,715 0.33%
Accrued Salaries and Wages 30,978 0.81% 53,949 0.93% 44,159 1.49%
Unearned Tuition 457,918 11.91% 485,790 8.41% 265,919 8.95%
Unearned Dormitory Fees 4,461 0.12% 243 0.00% 79 0.00%
Other Current Liabilities 171,687 4.47% 184,935 3.20% 48,876 1.64%
TOTAL CURRENT LIABILITIES $799,063 20.79% $957,122 16.57% $617,822 20.79%
Notes or Bonds Payable 75,138 1.95% 18,506 0.32% 197,294 6.64%
Mortgage Payable 0 0.00% 39,182 0.68% 224,530 7.56%
Other Long-Term Liabilities 1,056,674 27.49% 1,259,487 21.81% 83,442 2.81%
TOTAL LONG-TERM LIABILITIES $1,131,812 29.44% $1,317,175 22.81% $505,266 17.01%
TOTAL LIABILITIES $1,930,875 50.23% $2,274,297 39.38% $1,123,088 37.80%
Preff ered Stock 8,418 0.22% 3,647 0.06% 5,696 0.19%
Common Stock (143,134) -3.72% 14,204 0.25% 57,105 1.92%
Other Equity 1,051,739 27.36% 424,823 7.36% 1,149,401 38.68%
Retained Earnings 0.00%
Beginning Balance 1,269,813 33.03% 3,354,836 58.09% 827,880 27.86%
Earnings and Loss for Year 77,318 2.01% (125,406) -2.17% 91,514 3.08%
(Dividends) (136,711) -3.56% (100,637) -1.74% (6,897) -0.23%
Other R/E Changes (214,129) -5.57% (70,643) -1.22% (276,553) -9.31%
Ending Balance
TOTAL STOCKHOLDERS EQUITY $1,913,314 49.77% $3,500,824 60.62% $1,848,146 62.20%
TOTAL LIABILITIES AND EQUITY $3,844,189 100.00% $5,775,121 100.00% $2,971,234 100.00%

58
BALANCE SHEET - LIABILITIES AND EQUITYTotal Liabilities & Equity $10,000,000 - $19,999,999Average (in $)
All Credential Levels
N = 60
Non-Degree
N =6
Occupational Associate's Degree
N = 7
Accounts Payable Trade 216,073 1.49% 443,240 2.87% 68,490 0.47%
Notes Payable Equipment 1,686 0.01% 0 0.00% 0 0.00%
Notes Payable Other 4,176 0.03% 0 0.00% 0 0.00%
Tuition Refunds Payable 5,890 0.04% 401 0.00% 981 0.01%
Current Portion of Long Term Debt 103,457 0.71% 0 0.00% 23,723 0.16%
Payroll Taxes Payable 7,328 0.05% 0 0.00% 3,881 0.03%
Accrued Salaries and Wages 66,553 0.46% 104,524 0.68% 151,614 1.04%
Unearned Tuition 914,545 6.29% 1,687,251 10.94% 472,617 3.24%
Unearned Dormitory Fees 473 0.00% 0 0.00% 0 0.00%
Other Current Liabilities 257,714 1.77% 186,830 1.21% 245,628 1.68%
TOTAL CURRENT LIABILITIES $1,577,895 10.85% $2,422,246 15.71% $966,934 6.63%
Notes or Bonds Payable 102,818 0.71% 0 0.00% 20,080 0.14%
Mortgage Payable 408,236 2.81% 0 0.00% 0 0.00%
Other Long-Term Liabilities 1,063,474 7.31% 984,884 6.39% 421,638 2.89%
TOTAL LONG-TERM LIABILITIES $1,574,528 10.82% $984,884 6.39% $441,718 3.03%
TOTAL LIABILITIES $3,152,423 21.67% $3,407,130 22.09% $1,408,652 9.65%
Preff ered Stock 17 0.00% 167 0.00% 0 0.00%
Common Stock 90,344 0.62% 2,042 0.01% 100 0.00%
Other Equity 780,904 5.37% 4,307,828 27.93% 6,145,339 42.11%
Retained Earnings
Beginning Balance 10,649,798 73.21% 7,889,345 51.15% 6,712,996 46.00%
Earnings and Loss for Year 340,022 2.34% (81,617) -0.53% 592,300 4.06%
(Dividends) (72,501) -0.50% (192,007) -1.24% (267,221) -1.83%
Other R/E Changes (394,855) -2.71% 90,054 0.58% 0 0.00%
Ending Balance 10,522,464 72.34% 7,705,775 49.96% 7,038,075 48.23%
TOTAL STOCKHOLDERS EQUITY $11,393,729 78.33% $12,015,812 77.91% $13,183,514 90.35%
TOTAL LIABILITIES AND EQUITY $14,546,152 100.00% $15,422,942 100.00% $14,592,166 100.00%
N = number of balance sheets in this range of total liabilities and equity
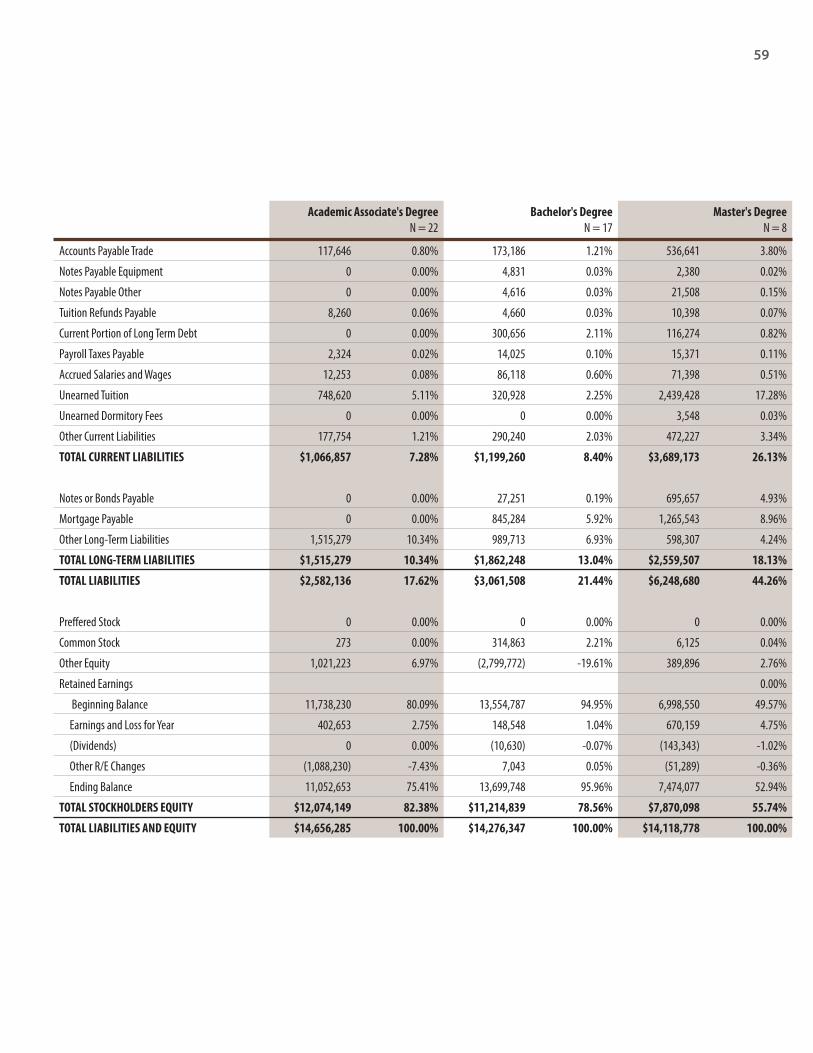
59
Academic Associate's Degree
N = 22
Bachelor's Degree
N = 17
Master's Degree
N = 8
Accounts Payable Trade 117,646 0.80% 173,186 1.21% 536,641 3.80%
Notes Payable Equipment 0 0.00% 4,831 0.03% 2,380 0.02%
Notes Payable Other 0 0.00% 4,616 0.03% 21,508 0.15%
Tuition Refunds Payable 8,260 0.06% 4,660 0.03% 10,398 0.07%
Current Portion of Long Term Debt 0 0.00% 300,656 2.11% 116,274 0.82%
Payroll Taxes Payable 2,324 0.02% 14,025 0.10% 15,371 0.11%
Accrued Salaries and Wages 12,253 0.08% 86,118 0.60% 71,398 0.51%
Unearned Tuition 748,620 5.11% 320,928 2.25% 2,439,428 17.28%
Unearned Dormitory Fees 0 0.00% 0 0.00% 3,548 0.03%
Other Current Liabilities 177,754 1.21% 290,240 2.03% 472,227 3.34%
TOTAL CURRENT LIABILITIES $1,066,857 7.28% $1,199,260 8.40% $3,689,173 26.13%
Notes or Bonds Payable 0 0.00% 27,251 0.19% 695,657 4.93%
Mortgage Payable 0 0.00% 845,284 5.92% 1,265,543 8.96%
Other Long-Term Liabilities 1,515,279 10.34% 989,713 6.93% 598,307 4.24%
TOTAL LONG-TERM LIABILITIES $1,515,279 10.34% $1,862,248 13.04% $2,559,507 18.13%
TOTAL LIABILITIES $2,582,136 17.62% $3,061,508 21.44% $6,248,680 44.26%
Preff ered Stock 0 0.00% 0 0.00% 0 0.00%
Common Stock 273 0.00% 314,863 2.21% 6,125 0.04%
Other Equity 1,021,223 6.97% (2,799,772) -19.61% 389,896 2.76%
Retained Earnings 0.00%
Beginning Balance 11,738,230 80.09% 13,554,787 94.95% 6,998,550 49.57%
Earnings and Loss for Year 402,653 2.75% 148,548 1.04% 670,159 4.75%
(Dividends) 0 0.00% (10,630) -0.07% (143,343) -1.02%
Other R/E Changes (1,088,230) -7.43% 7,043 0.05% (51,289) -0.36%
Ending Balance 11,052,653 75.41% 13,699,748 95.96% 7,474,077 52.94%
TOTAL STOCKHOLDERS EQUITY $12,074,149 82.38% $11,214,839 78.56% $7,870,098 55.74%
TOTAL LIABILITIES AND EQUITY $14,656,285 100.00% $14,276,347 100.00% $14,118,778 100.00%

60
BALANCE SHEET - LIABILITIES AND EQUITYTotal Liabilities & Equity $20,000,000 - $49,999,999Average (in $)
All Credential Levels
N = 46
Non-Degree
N =5
Occupational Associate's Degree
N = 7
Accounts Payable Trade 357,047 1.15% 590,550 2.12% 18,904 0.06%
Notes Payable Equipment 2,678 0.01% 0 0.00% 0 0.00%
Notes Payable Other 21,739 0.07% 200,000 0.72% 0 0.00%
Tuition Refunds Payable 63,378 0.20% 4,279 0.02% 14,079 0.05%
Current Portion of Long Term Debt 381,035 1.23% 35,331 0.13% 0 0.00%
Payroll Taxes Payable 18,919 0.06% 12,060 0.04% 1,236 0.00%
Accrued Salaries and Wages 198,644 0.64% 139,099 0.50% 42,295 0.14%
Unearned Tuition 1,220,114 3.94% 3,177,830 11.41% 563,945 1.85%
Unearned Dormitory Fees 0 0.00% 0 0.00% 0 0.00%
Other Current Liabilities 866,801 2.80% 2,618,788 9.41% 189,418 0.62%
TOTAL CURRENT LIABILITIES $3,130,355 10.10% $6,777,937 24.35% $829,877 2.72%
Notes or Bonds Payable 901,123 2.91% 340,157 1.22% 0 0.00%
Mortgage Payable 714,771 2.31% 1,033,845 3.71% 0 0.00%
Other Long-Term Liabilities 1,015,743 3.28% 1,881,097 6.76% 1,309,690 4.29%
TOTAL LONG-TERM LIABILITIES $2,631,637 8.49% $3,255,099 11.69% $1,309,690 4.29%
TOTAL LIABILITIES $5,761,992 18.59% $10,033,036 36.04% $2,139,567 7.00%
Preff ered Stock 74,087 0.24% 0 0.00% 0 0.00%
Common Stock 15,464 0.05% 120 0.00% 143 0.00%
Other Equity 12,387,190 39.97% 16,683,879 59.93% 30,805,514 100.85%
Retained Earnings
Beginning Balance 13,374,879 43.15% 4,696,318 16.87% (1,110,668) -3.64%
Earnings and Loss for Year (458,464) -1.48% (3,573,512) -12.84% (1,289,850) -4.22%
(Dividends) (82,727) -0.27% 0 0.00% 0 0.00%
Other R/E Changes (79,287) -0.26% 0 0.00% 0 0.00%
Ending Balance 12,754,401 41.15% 1,122,806 4.03% (2,400,518) -7.86%
TOTAL STOCKHOLDERS EQUITY $25,231,142 81.41% $17,806,805 63.96% $28,405,139 93.00%
TOTAL LIABILITIES AND EQUITY $30,993,134 100.00% $27,839,841 100.00% $30,544,706 100.00%
N = number of balance sheets in this range of total liabilities and equity

61
Academic Associate's Degree
N = 14
Bachelor's Degree
N = 11
Master's Degree
N = 9
Accounts Payable Trade 91,894 0.31% 829,694 2.59% 325,101 0.98%
Notes Payable Equipment 0 0.00% 0 0.00% 13,687 0.04%
Notes Payable Other 0 0.00% 0 0.00% 0 0.00%
Tuition Refunds Payable 2,952 0.01% 241,229 0.75% 11,178 0.03%
Current Portion of Long Term Debt 123,810 0.41% 644,237 2.01% 947,891 2.85%
Payroll Taxes Payable 1,624 0.01% 5,140 0.02% 80,225 0.24%
Accrued Salaries and Wages 35,529 0.12% 505,873 1.58% 231,563 0.70%
Unearned Tuition 976,230 3.25% 1,288,963 4.02% 938,076 2.82%
Unearned Dormitory Fees 0 0.00% 0 0.00% 0 0.00%
Other Current Liabilities 183,430 0.61% 1,252,697 3.90% 1,011,700 3.04%
TOTAL CURRENT LIABILITIES $1,415,469 4.71% $4,767,833 14.86% $3,559,421 10.70%
Notes or Bonds Payable 0 0.00% 3,245,696 10.12% 449,804 1.35%
Mortgage Payable 928,572 3.09% 1,023,848 3.19% 383,103 1.15%
Other Long-Term Liabilities 553,104 1.84% 1,238,813 3.86% 753,386 2.27%
TOTAL LONG-TERM LIABILITIES $1,481,676 4.93% $5,508,357 17.17% $1,586,293 4.77%
TOTAL LIABILITIES $2,897,145 9.65% $10,276,190 32.03% $5,145,714 15.47%
Preff ered Stock 243,429 0.81% 0 0.00% 0 0.00%
Common Stock 71 0.00% 58,946 0.18% 6,707 0.02%
Other Equity 6,063,018 20.19% 14,130,253 44.04% 3,381,968 10.17%
Retained Earnings 0.00%
Beginning Balance 21,025,099 70.02% 8,471,942 26.40% 23,554,975 70.82%
Earnings and Loss for Year (201,786) -0.67% (585,176) -1.82% 1,674,342 5.03%
(Dividends) 0 0.00% 0 0.00% (422,827) -1.27%
Other R/E Changes (526) 0.00% (265,323) -0.83% (80,142) -0.24%
Ending Balance 20,822,787 69.35% 7,621,443 23.75% 24,726,348 74.34%
TOTAL STOCKHOLDERS EQUITY $27,129,305 90.35% $21,810,642 67.97% $28,115,023 84.53%
TOTAL LIABILITIES AND EQUITY $30,026,450 100.00% $32,086,832 100.00% $33,260,737 100.00%

62
BALANCE SHEET - LIABILITIES AND EQUITYTotal Liabilities & Equity $50,000,000 - $99,999,999Average (in $)
All Credential Levels
N = 10
Occupational Associate's Degree
N = 1
Academic Associate's Degree
N = 2
Accounts Payable Trade 709,006 1.04% 142,034 0.27% 30,453 0.04%
Notes Payable Equipment 7,459 0.01% 0 0.00% 0 0.00%
Notes Payable Other 39,440 0.06% 0 0.00% 0 0.00%
Tuition Refunds Payable 46,618 0.07% 417,067 0.80% 13,913 0.02%
Current Portion of Long Term Debt 224,991 0.33% 0 0.00% 0 0.00%
Payroll Taxes Payable 0 0.00% 0 0.00% 0 0.00%
Accrued Salaries and Wages 182,843 0.27% 46,947 0.09% 28,602 0.04%
Unearned Tuition 5,415,350 7.96% 130,161 0.25% 347,564 0.47%
Unearned Dormitory Fees 0 0.00% 0 0.00% 0 0.00%
Other Current Liabilities 359,008 0.53% 344,216 0.66% 40,616 0.05%
TOTAL CURRENT LIABILITIES $6,984,715 10.27% $1,080,425 2.07% $461,148 0.62%
Notes or Bonds Payable 2,414,375 3.55% 0 0.00% 0 0.00%
Mortgage Payable 456,784 0.67% 0 0.00% 0 0.00%
Other Long-Term Liabilities 1,135,606 1.67% 5,874,593 11.26% 207,985 0.28%
TOTAL LONG-TERM LIABILITIES $4,006,765 5.89% $5,874,593 11.26% $207,985 0.28%
TOTAL LIABILITIES $10,991,480 16.16% $6,955,018 13.33% $669,133 0.90%
Preff ered Stock 0 0.00% 0 0.00% 0 0.00%
Common Stock 4,036 0.01% 10,000 0.02% 0 0.00%
Other Equity 11,963,434 17.59% 29,958,268 57.40% 21,957,115 29.52%
Retained Earnings
Beginning Balance 50,336,449 74.00% 15,459,114 29.62% 51,484,231 69.22%
Earnings and Loss for Year 2,871,543 4.22% (189,518) -0.36% 268,293 0.36%
(Dividends) (7,157,988) -10.52% 0 0.00% 0 0.00%
Other R/E Changes (990,875) -1.46% 0 0.00% 0 0.00%
Ending Balance 45,059,129 66.25% 15,269,596 29.26% 51,752,524 69.58%
TOTAL STOCKHOLDERS EQUITY $57,026,599 83.84% $45,237,864 86.67% $73,709,639 99.10%
TOTAL LIABILITIES AND EQUITY $68,018,079 100.00% $52,192,882 100.00% $74,378,772 100.00%
N = number of balance sheets in this range of total liabilities and equity

63
Bachelor's Degree
N = 2
Master's Degree
N = 5
Accounts Payable Trade 2,508,295 3.62% 374,107 0.55%
Notes Payable Equipment 37,295 0.05% 0 0.00%
Notes Payable Other 197,200 0.28% 0 0.00%
Tuition Refunds Payable 0 0.00% 4,258 0.01%
Current Portion of Long Term Debt 215,000 0.31% 363,982 0.53%
Payroll Taxes Payable 0 0.00% 0 0.00%
Accrued Salaries and Wages 734,557 1.06% 51,032 0.07%
Unearned Tuition 25,204,257 36.37% 583,939 0.86%
Unearned Dormitory Fees 0 0.00% 0 0.00%
Other Current Liabilities 143 0.00% 632,868 0.93%
TOTAL CURRENT LIABILITIES $28,896,747 41.69% $2,010,186 2.95%
Notes or Bonds Payable 0 0.00% 4,828,750 7.09%
Mortgage Payable 2,283,921 3.30% 0 0.00%
Other Long-Term Liabilities 1,582,564 2.28% 380,075 0.56%
TOTAL LONG-TERM LIABILITIES $3,866,485 5.58% $5,208,825 7.65%
TOTAL LIABILITIES $32,763,232 47.27% $7,219,011 10.60%
Preff ered Stock 0 0.00% 0 0.00%
Common Stock 0 0.00% 6,072 0.01%
Other Equity 3,445,000 4.97% 7,774,368 11.41%
Retained Earnings 0.00%
Beginning Balance 31,904,637 46.03% 64,225,528 94.28%
Earnings and Loss for Year 7,139,076 10.30% 2,818,042 4.14%
(Dividends) (5,946,189) -8.58% (11,937,500) -17.52%
Other R/E Changes 0 0.00% (1,981,750) -2.91%
Ending Balance 33,097,524 47.76% 53,124,320 77.98%
TOTAL STOCKHOLDERS EQUITY $36,542,524 52.73% $60,904,760 89.40%
TOTAL LIABILITIES AND EQUITY $69,305,756 100.00% $68,123,771 100.00%

64
BALANCE SHEET - LIABILITIES AND EQUITYTotal Liabilities & Equity $100,000,000 - $699,999,999Average (in $)
All Credential Levels
N = 11
Non-Degree
N =1
Occupational Associate's Degree
N = 2
Accounts Payable Trade 12,993,749 5.72% 13,500,000 3.89% 2,256,913 1.20%
Notes Payable Equipment 0 0.00% 0 0.00% 0 0.00%
Notes Payable Other 43,748 0.02% 0 0.00% 0 0.00%
Tuition Refunds Payable 1,190,389 0.52% 0 0.00% 6,547,141 3.48%
Current Portion of Long Term Debt 1,513,913 0.67% 412,000 0.12% 1,211,172 0.64%
Payroll Taxes Payable 41,480 0.02% 314,591 0.09% 0 0.00%
Accrued Salaries and Wages 3,494,052 1.54% 2,685,197 0.77% 3,709,894 1.97%
Unearned Tuition 23,889,812 10.51% 34,648,000 9.99% 3,183,603 1.69%
Unearned Dormitory Fees 0 0.00% 0 0.00% 0 0.00%
Other Current Liabilities 11,005,410 4.84% 7,014,212 2.02% 4,398,856 2.34%
TOTAL CURRENT LIABILITIES $54,172,553 23.84% $58,574,000 16.89% $21,307,579 11.34%
Notes or Bonds Payable 37,595,024 16.54% 73,115,000 21.08% 73,089,513 38.88%
Mortgage Payable 0 0.00% 0 0.00% 0 0.00%
Other Long-Term Liabilities 24,682,910 10.86% 16,608,000 4.79% 34,549,792 18.38%
TOTAL LONG-TERM LIABILITIES $62,277,934 27.41% $89,723,000 25.87% $107,639,305 57.26%
TOTAL LIABILITIES $116,450,487 51.25% $148,297,000 42.76% $128,946,884 68.60%
Preff ered Stock 773,916 0.34% 0 0.00% 4 0.00%
Common Stock 15,604,398 6.87% 141,377,000 40.77% 501 0.00%
Other Equity 14,134,226 6.22% (66,959,000) -19.31% 134,449,115 71.53%
Retained Earnings
Beginning Balance 98,703,009 43.44% 167,689,000 48.36% (62,901,997) -33.46%
Earnings and Loss for Year (4,798,933) -2.11% (37,186,000) -10.72% (11,007,761) -5.86%
(Dividends) (3,359,026) -1.48% (6,444,000) -1.86% (13,031,515) -6.93%
Other R/E Changes (10,274,458) -4.52% 0 0.00% 11,514,351 6.13%
Ending Balance 80,270,592 35.33% 124,059,000 35.78% (75,426,922) -40.13%
TOTAL STOCKHOLDERS EQUITY $110,783,132 48.75% $198,477,000 57.24% $59,022,698 31.40%
TOTAL LIABILITIES AND EQUITY $227,233,619 100.00% $346,774,000 100.00% $187,969,582 100.00%
N = number of balance sheets in this range of total liabilities and equity

65
Academic Associate's Degree
N = 2
Bachelor's Degree
N = 1
Master's Degree
N = 5
Accounts Payable Trade 3,459,393 1.90% 2,416,101 2.23% 23,116,505 8.87%
Notes Payable Equipment 0 0.00% 0 0.00% 0 0.00%
Notes Payable Other 0 0.00% 0 0.00% 96,245 0.04%
Tuition Refunds Payable 0 0.00% 0 0.00% 0 0.00%
Current Portion of Long Term Debt 1,846,780 1.02% 0 0.00% 2,025,028 0.78%
Payroll Taxes Payable 0 0.00% 0 0.00% 28,338 0.01%
Accrued Salaries and Wages 0 0.00% 612,463 0.57% 5,543,425 2.13%
Unearned Tuition 11,216,507 6.17% 9,138,317 8.44% 38,040,280 14.59%
Unearned Dormitory Fees 0 0.00% 0 0.00% 0 0.00%
Other Current Liabilities 6,199,175 3.41% 377,199 0.35% 18,494,408 7.09%
TOTAL CURRENT LIABILITIES $22,721,855 12.50% $12,544,080 11.58% $87,344,229 33.51%
Notes or Bonds Payable 14,841,495 8.16% 0 0.00% 32,913,651 12.63%
Mortgage Payable 0 0.00% 0 0.00% 0 0.00%
Other Long-Term Liabilities 16,406,466 9.02% 3,296,121 3.04% 29,939,075 11.49%
TOTAL LONG-TERM LIABILITIES $31,247,961 17.19% $3,296,121 3.04% $62,852,726 24.11%
TOTAL LIABILITIES $53,969,816 29.68% $15,840,201 14.62% $150,196,955 57.62%
Preff ered Stock 0 0.00% 0 0.00% 1,702,614 0.65%
Common Stock 255 0.00% 536,112 0.49% 5,946,751 2.28%
Other Equity 177,416,998 97.58% 448,538 0.41% (80,649,056) -30.94%
Retained Earnings 0.00%
Beginning Balance 23,715,576 13.04% 100,908,689 93.16% 179,101,650 68.71%
Earnings and Loss for Year (73,279,331) -40.30% (9,413,839) -8.69% 32,477,153 12.46%
(Dividends) 0 0.00% 0 0.00% (888,451) -0.34%
Other R/E Changes 0 0.00% 0 0.00% (27,209,548) -10.44%
Ending Balance (49,563,755) -27.26% 91,494,850 84.47% 183,480,804 70.39%
TOTAL STOCKHOLDERS EQUITY $127,853,498 70.32% $92,479,500 85.38% $110,481,113 42.38%
TOTAL LIABILITIES AND EQUITY $181,823,314 100.00% $108,319,701 100.00% $260,678,068 100.00%

66
BALANCE SHEET - LIABILITIES AND EQUITYTotal Liabilities & Equity > $700,000,000Average (in $)
All Credential Levels
N = 2
Bachelor's Degree
N = 1
Master's Degree
N = 1
Accounts Payable Trade 48,449,000 1.51% 96,898,000 1.83% 0 0.00%
Notes Payable Equipment 0 0.00% 0 0.00% 0 0.00%
Notes Payable Other 0 0.00% 0 0.00% 0 0.00%
Tuition Refunds Payable 0 0.00% 0 0.00% 0 0.00%
Current Portion of Long Term Debt 11,641,500 0.36% 23,283,000 0.44% 0 0.00%
Payroll Taxes Payable 0 0.00% 0 0.00% 0 0.00%
Accrued Salaries and Wages 88,777,886 2.76% 177,464,000 3.34% 91,771 0.01%
Unearned Tuition 4,229,480 0.13% 0 0.00% 8,458,960 0.76%
Unearned Dormitory Fees 0 0.00% 0 0.00% 0 0.00%
Other Current Liabilities 299,842,280 9.33% 599,697,000 11.30% (12,440) 0.00%
TOTAL CURRENT LIABILITIES $452,940,146 14.10% $897,342,000 16.91% $8,538,291 0.76%
Notes or Bonds Payable 480,112,000 14.94% 960,224,000 18.09% 0 0.00%
Mortgage Payable 0 0.00% 0 0.00% 0 0.00%
Other Long-Term Liabilities 366,612,446 11.41% 732,429,000 13.80% 795,891 0.07%
TOTAL LONG-TERM LIABILITIES $846,724,446 26.35% $1,692,653,000 31.90% $795,891 0.07%
TOTAL LIABILITIES $1,299,664,592 40.45% $2,589,995,000 48.80% $9,334,182 0.83%
Preff ered Stock 0 0.00% 0 0.00% 0 0.00%
Common Stock 0 0.00% 0 0.00% 0 0.00%
Other Equity 0 0.00% 0 0.00% 0 0.00%
Retained Earnings 0.00%
Beginning Balance 1,585,456,359 49.34% 2,405,770,000 45.33% 765,142,717 68.36%
Earnings and Loss for Year 388,093,777 12.08% 431,370,000 8.13% 344,817,553 30.81%
(Dividends) 0 0.00% 0 0.00% 0 0.00%
Other R/E Changes (60,117,000) -1.87% (120,234,000) -2.27% 0 0.00%
Ending Balance 1,913,433,136 59.55% 2,716,906,000 51.20% 1,109,960,270 99.17%
TOTAL STOCKHOLDERS EQUITY $1,913,433,136 59.55% $2,716,906,000 51.20% $1,109,960,270 99.17%
TOTAL LIABILITIES AND EQUITY $3,213,097,728 100.00% $5,306,901,000 100.00% $1,119,294,452 100.00%
N = number of balance sheets in this range of total liabilities and equity

ANNUAL FINANCIAL REPORT (AFR) DATA
ANALYSIS OF BALANCE SHEETS

68
Total Assets < $1,000,000 All Credential Levels
N = 46
Non-Degree
N = 17
Occupational Associate's Degree
N = 13
Current Ratio 1.15 1.26 1.19
current assets/current liabilities
Quick Ratio 1.07 1.21 1.04
current assets - (inventory + current prepaid expenses)/current liabilities
Debt-to-Equity Ratio 3.89 2.35 2.06
total liabilities/total stockholders equity
Total Assets $1,000,000 - $ 9,999,999 All Credential Levels
N = 213
Non-Degree
N = 52
Occupational Associate's Degree
N = 32
Current Ratio 2.04 1.40 1.73
current assets/current liabilities
Quick Ratio 1.93 1.32 1.64
current assets - (inventory + current prepaid expenses)/current liabilities
Debt-to-Equity Ratio 0.75 0.62 0.85
total liabilities/total stockholders equity
Total Assets $10,000,000 - $19,999,999 All Credential Levels
N = 60
Non-Degree
N = 6
Occupational Associate's Degree
N = 7
Current Ratio 2.48 2.08 2.87
current assets/current liabilities
Quick Ratio 2.38 2.02 2.68
current assets - (inventory + current prepaid expenses)/current liabilities
Debt-to-Equity Ratio 0.28 0.28 0.11
total liabilities/total stockholders equity
ANALYSIS OF BALANCE SHEET DATA
N = number of balance sheets in this range of total assets

69
Academic Associate's Degree
N = 7
Bachelor's Degree
N = 1
Master's Degree
N = 8
0.98 1.05 1.05
0.94 1.03 1.00
-3.67 2.39 2.21
Academic Associate's Degree
N = 64
Bachelor's Degree
N = 48
Master's Degree
N = 17
2.02 2.85 2.85
1.88 2.71 2.75
1.01 0.65 0.61
Academic Associate's Degree
N = 22
Bachelor's Degree
N = 17
Master's Degree
N = 8
1.48 4.62 1.91
1.35 4.51 1.85
0.21 0.27 0.79

Total Assets $20,000,000 - $49,999,999 All Credential Levels
N = 46
Non-Degree
N = 5
Occupational Associate's Degree
N = 7
Current Ratio 2.17 1.03 7.40
current assets/current liabilities
Quick Ratio 2.06 1.01 7.18
current assets - (inventory + current prepaid expenses)/current liabilities
Debt-to-Equity Ratio 0.23 0.56 0.08
total liabilities/total stockholders equity
Total Assets $50,000,000 - $99,999,999 All Credential Levels
N = 10
Non-Degree
N = 0
Occupational Associate's Degree
N = 1
Current Ratio 1.65 N/A 19.04
current assets/current liabilities
Quick Ratio 1.59 N/A 18.68
current assets - (inventory + current prepaid expenses)/current liabilities
Debt-to-Equity Ratio 0.19 N/A 0.15
total liabilities/total stockholders equity
Total Assets $100,000,000 - $699,999,999 All Credential Levels
N = 11
Non-Degree
N = 1
Occupational Associate's Degree
N = 2
Current Ratio 1.40 1.70 1.19
current assets/current liabilities
Quick Ratio 1.29 1.40 1.07
current assets - (inventory + current prepaid expenses)/current liabilities
Debt-to-Equity Ratio 1.05 0.75 2.18
total liabilities/total stockholders equity
ANALYSIS OF BALANCE SHEET DATA

71
Academic Associate's Degree
N = 14
Bachelor's Degree
N = 11
Master's Degree
N = 9
1.87 2.26 2.48
1.75 2.10 2.35
0.11 0.47 0.18
Academic Associate's Degree
N = 2
Bachelor's Degree
N = 2
Master's Degree
N = 5
1.51 1.18 2.52
1.17 1.16 2.28
0.01 0.90 0.12
Academic Associate's Degree
N = 2
Bachelor's Degree
N = 1
Master's Degree
N = 5
1.40 7.32 1.21
1.26 7.25 1.13
0.42 0.17 1.36

72
Total Assets > $700,000,000 All Credential Levels
N = 2
Non-Degree
N = 0
Occupational Associate's Degree
N = 0
Current Ratio 2.03 N/A N/A
current assets/current liabilities
Quick Ratio 1.93 N/A N/A
current assets - (inventory + current prepaid expenses)/current liabilities
Debt-to-Equity Ratio 0.68 N/A N/A
total liabilities/total stockholders equity
N = number of balance sheets in this range of total assets
ANALYSIS OF BALANCE SHEET DATA

73
Academic Associate's Degree
N = 0
Bachelor's Degree
N = 1
Master's Degree
N = 1
N/A 2.02 3.49
N/A 1.91 3.48
N/A 0.95 0.01


Accrediting Council for Independent Colleges and Schools
750 First Street, NE, Suite 980Washington, DC 20002-4223
202.336.6780 (phone)www.acics.org