Embed Size (px)
Citation preview
Contents
President’s Letter 2
Principles for Sustainability 3
ACI Consumer Education & Outreach 5
ACI Science and Research 9
ACI Sustainability Metrics Program 15
Metrics for 2012 20
Stories of Sustainability 29
About ACI
The American Cleaning Institute® (ACI) www.cleaninginstitute.org is the Home of the U.S. Cleaning
Products Industry® and represents the $30 billion U.S. cleaning products market. ACI members include
the formulators of soaps, detergents, and general cleaning products used in household, commercial,
industrial and institutional settings; companies that supply ingredients and finished packaging for
these products; and oleochemical producers. ACI and its members are dedicated to improving health
and the quality of life through sustainable cleaning products and practices.
If you have any questions about the 2013 ACI Sustainability Report, please contact Brian Sansoni, Vice
President, Sustainability Initiatives at 202.662.2517 or [email protected] or Melissa
Bernardo, Manager, Sustainability Programs, at 202.662.2518 or [email protected].
ACI is located at 1331 L Street NW, Suite 650, Washington, DC 20005
1
A Message from ACI President and CEO Ernie Rosenberg
“For Better Living.” That’s not just the American Cleaning Institute tagline. It’s a phrase that summarizes the positive impact cleaning and hygiene products make on our daily lives.
The sustainability mission for ACI is to benefit society and improve quality of life through hygiene and cleanliness – by driving sustainability improvements across our industry and throughout the supply chain. Our members’ products help maintain the health and well-being of billions of people across the planet.
The companies that formulate cleaning products and produce the ingredients that make them effective take their product stewardship responsibilities very seriously. That’s why you see so many of our members building sustainability platforms across their businesses and throughout their supply chains.
With leadership from our member companies, ACI sustainability initiatives are demonstrating transparency by reporting aggregated environmental metrics data, using sound science and outreach to show how cleaning products and ingredients enhance health and quality of life and communicating ways in which consumers can use these products safely and responsibly.
I hope you will find the ACI Sustainability Report and its online companion to be useful and informative. The online version also provides insights into how many ACI member companies are operating sustainably throughout the year.
Of course there are environmental, social and economic challenges that confront us each day and will continue to arise tomorrow. There are no easy answers, but I believe that our industry – in the U.S. and around the world – is tackling these challenges responsibly and creatively, while also supporting consumers as they meet challenges in their own lives. Through research, science, technology and innovation, the women and men of our industry are working to embed sustainability throughout their companies and in the products they manufacture. The ACI Sustainability Report provides an overview of these efforts.
We look forward to sharing this information and receiving your feedback in the months and years ahead.
2Return to Index
ACI Sustainability Definition:
The ability to improve the quality of life for this and future generations, by creating products that promote hygiene and cleanliness, are environmentally sound and are economically successful.
ACI Sustainability Mission:
To benefit society and improve the quality of life through hygiene and cleanliness by driving sustainability improvements across our industry and throughout the supply chain.
Preamble: Principles for Sustainability
The members of the American Cleaning Institute are committed to the continuous enhancement of human health and the quality of life through the responsible formulation, production, sale and use of cleaning products and ingredients.
The members of the American Cleaning Institute will strive to meet the following commitments to advance human health and environmental quality, social well-being, and economic growth. ACI will support its members in meeting these commitments.
American Cleaning Institute: Principles for Sustainability
3 Return to Index
Human Health/Environmental Sustainability
• To only market products that have been shown to be safe for humans and the environment, through careful consideration of the potential health and environmental effects, exposures and releases that will be associated with their production, transportation, use and disposal.
• To promote transparent communication of safety, handling and environmental information across the chain of commerce.
• To support basic research to resolve uncertainties around human and environmental safety when they arise.
• To obey the spirit and intent of all national laws and regulations.
• To promote sustainable innovations that will help reduce the overall environmental impacts of our industry.
Economic Sustainability
• To contribute to value creation, including economic prosperity and continuity for the industry’s shareholders, employees and communities.
• To add value for the consumer through continuous product innovations.
Social Sustainability
• To contribute to a better quality of life for our consumers, business partners, employees and the communities in which we operate.
• To develop products and ingredients that effectively deliver claimed benefits.
• To promote the safe use of our products with the public.
• To support society’s efforts to enhance public health and well-being through improved hygiene and sanitation.
• To maintain a high level of product stewardship throughout the chain of commerce.
• To operate our manufacturing facilities with due regard to the health and safety of our employees, the communities in which we operate and the wider environment.
4Return to Index

Throughout the year, ACI partners with public and private groups – including family and consumer science educators, health and safety professionals, medical experts, government agencies and charitable organizations, to name just a few – to educate individuals, families and communities about the positive contributions that cleaning products make to better and healthier living.
ACI Board Chair Catherine Ehrenberger (center), Amway, helps put together hygiene kits for a local charity in Orlando, FL in partnership with Clean the World at the 2013 ACI Convention.
Doing Our Part to Help Clean the World®
ACI is a proud partner of Clean the World (www.cleantheworld.org), which collects and recycles – in a safe and environmentally-friendly way – discarded soaps, shampoos, conditioners and other hygiene products from more than 1,982 hotels and 493,395 guestrooms. This non-profit organization distributes these products to those in need to help prevent disease and avoidable death in areas where essentials for cleanliness are otherwise not readily available.
Attendees at the 2013 ACI Annual Meeting & Industry Convention participated in a serve and learn opportunity with Clean the World to assemble 2,200 hygiene kits that were donated to the Families in Transition (FIT) program. FIT provides assistance to homeless children and their families in Seminole County, Florida.
ACI Consumer Education & Outreach Partnerships: Enhancing Good Health and Good Hygiene
5 Return to Index
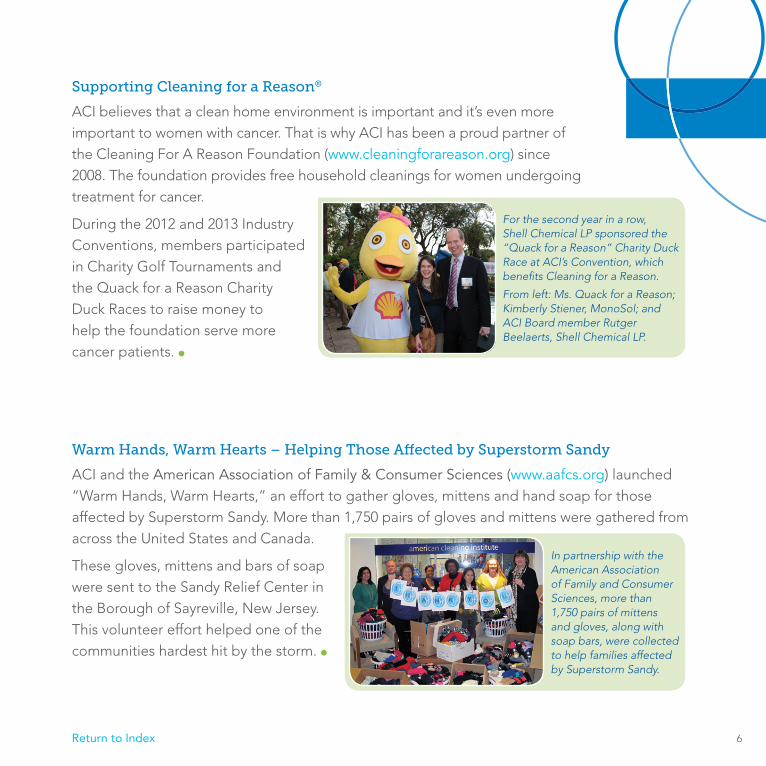
Supporting Cleaning for a Reason®
ACI believes that a clean home environment is important and it’s even more important to women with cancer. That is why ACI has been a proud partner of the Cleaning For A Reason Foundation (www.cleaningforareason.org) since 2008. The foundation provides free household cleanings for women undergoing treatment for cancer.
During the 2012 and 2013 Industry Conventions, members participated in Charity Golf Tournaments and the Quack for a Reason Charity Duck Races to raise money to help the foundation serve more cancer patients.
Warm Hands, Warm Hearts – Helping Those Affected by Superstorm Sandy
ACI and the American Association of Family & Consumer Sciences (www.aafcs.org) launched “Warm Hands, Warm Hearts,” an effort to gather gloves, mittens and hand soap for those affected by Superstorm Sandy. More than 1,750 pairs of gloves and mittens were gathered from across the United States and Canada.
These gloves, mittens and bars of soap were sent to the Sandy Relief Center in the Borough of Sayreville, New Jersey. This volunteer effort helped one of the communities hardest hit by the storm.
In partnership with the American Association of Family and Consumer Sciences, more than 1,750 pairs of mittens and gloves, along with soap bars, were collected to help families affected by Superstorm Sandy.
For the second year in a row, Shell Chemical LP sponsored the “Quack for a Reason” Charity Duck Race at ACI’s Convention, which benefits Cleaning for a Reason.
From left: Ms. Quack for a Reason; Kimberly Stiener, MonoSol; and ACI Board member Rutger Beelaerts, Shell Chemical LP.
6Return to Index
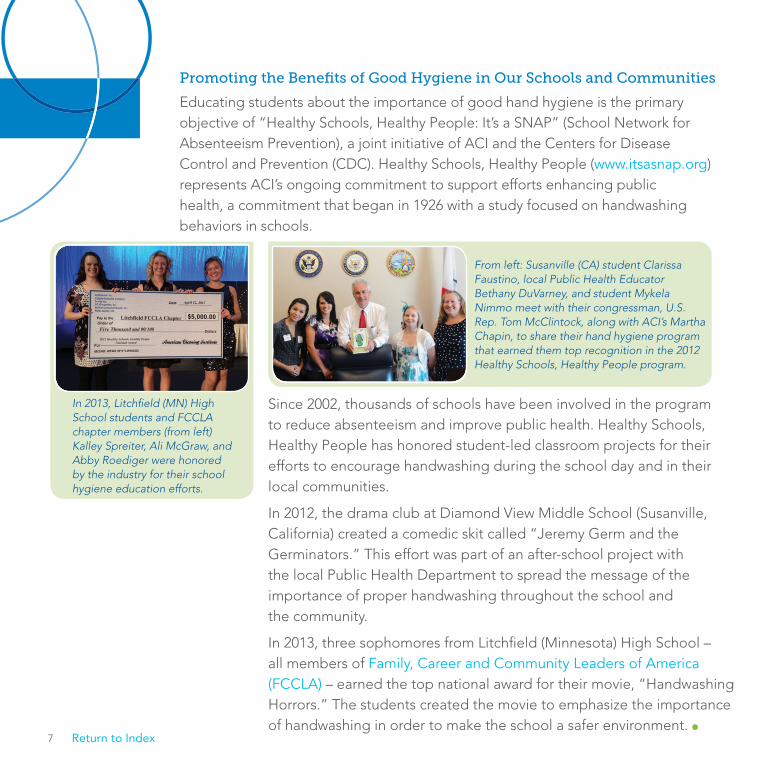
Since 2002, thousands of schools have been involved in the program to reduce absenteeism and improve public health. Healthy Schools, Healthy People has honored student-led classroom projects for their efforts to encourage handwashing during the school day and in their local communities.
In 2012, the drama club at Diamond View Middle School (Susanville, California) created a comedic skit called “Jeremy Germ and the Germinators.” This effort was part of an after-school project with the local Public Health Department to spread the message of the importance of proper handwashing throughout the school and the community.
In 2013, three sophomores from Litchfield (Minnesota) High School – all members of Family, Career and Community Leaders of America (FCCLA) – earned the top national award for their movie, “Handwashing Horrors.” The students created the movie to emphasize the importance of handwashing in order to make the school a safer environment.
Promoting the Benefits of Good Hygiene in Our Schools and Communities
Educating students about the importance of good hand hygiene is the primary objective of “Healthy Schools, Healthy People: It’s a SNAP” (School Network for Absenteeism Prevention), a joint initiative of ACI and the Centers for Disease Control and Prevention (CDC). Healthy Schools, Healthy People (www.itsasnap.org) represents ACI’s ongoing commitment to support efforts enhancing public health, a commitment that began in 1926 with a study focused on handwashing behaviors in schools.
From left: Susanville (CA) student Clarissa Faustino, local Public Health Educator Bethany DuVarney, and student Mykela Nimmo meet with their congressman, U.S. Rep. Tom McClintock, along with ACI’s Martha Chapin, to share their hand hygiene program that earned them top recognition in the 2012 Healthy Schools, Healthy People program.
In 2013, Litchfield (MN) High School students and FCCLA chapter members (from left) Kalley Spreiter, Ali McGraw, and Abby Roediger were honored by the industry for their school hygiene education efforts.
7 Return to Index
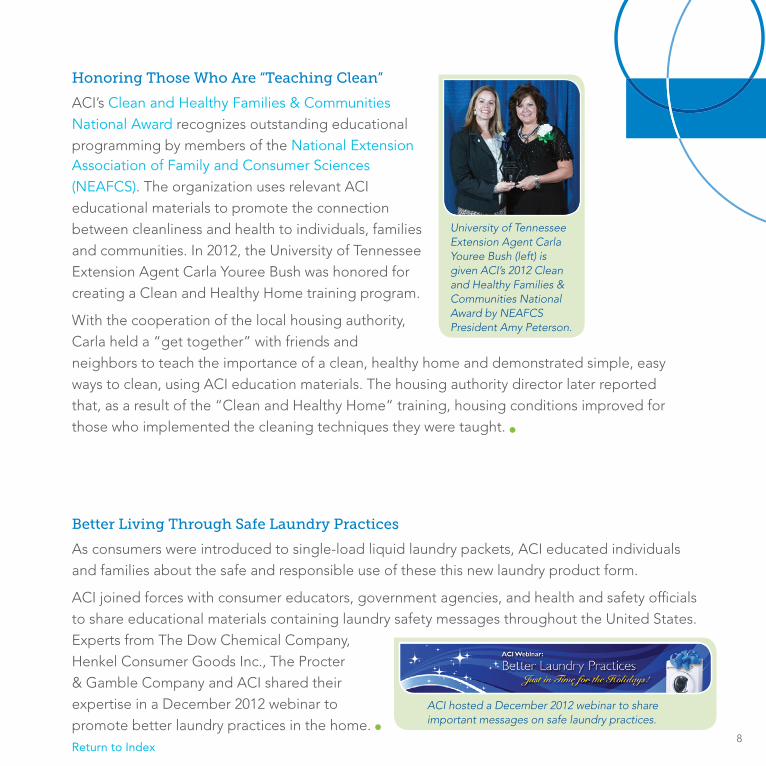
Honoring Those Who Are “Teaching Clean”
ACI’s Clean and Healthy Families & Communities National Award recognizes outstanding educational programming by members of the National Extension Association of Family and Consumer Sciences (NEAFCS). The organization uses relevant ACI educational materials to promote the connection between cleanliness and health to individuals, families and communities. In 2012, the University of Tennessee Extension Agent Carla Youree Bush was honored for creating a Clean and Healthy Home training program.
With the cooperation of the local housing authority, Carla held a “get together” with friends and neighbors to teach the importance of a clean, healthy home and demonstrated simple, easy ways to clean, using ACI education materials. The housing authority director later reported that, as a result of the “Clean and Healthy Home“ training, housing conditions improved for those who implemented the cleaning techniques they were taught.
University of Tennessee Extension Agent Carla Youree Bush (left) is given ACI’s 2012 Clean and Healthy Families & Communities National Award by NEAFCS President Amy Peterson.
Better Living Through Safe Laundry Practices
As consumers were introduced to single-load liquid laundry packets, ACI educated individuals and families about the safe and responsible use of these this new laundry product form.
ACI joined forces with consumer educators, government agencies, and health and safety officials to share educational materials containing laundry safety messages throughout the United States. Experts from The Dow Chemical Company, Henkel Consumer Goods Inc., The Procter & Gamble Company and ACI shared their expertise in a December 2012 webinar to promote better laundry practices in the home.
ACI hosted a December 2012 webinar to share important messages on safe laundry practices.
8Return to Index

9
ACI Science & Research: Pathways to Product Stewardship
Year in and year out, scientific and research programs contribute to the tools, data and insight ACI member companies use to assess the safety and effectiveness of cleaning products and their ingredients. The work that ACI does is particularly focused on answering the questions consumers and regulators are asking. ACI and our members share detailed technical information with a variety of audiences as part of our commitment to transparency and product stewardship.
Additional information about these scientific research programs can be found at ACIscience.org.
Sharing a Tool to Predict Chemical Concentrations in Waterways
ACI’s iSTREEM® is a web-based computer model which forecasts chemical concentrations in U.S. waterways resulting from the use of those chemicals in consumer products that are disposed down the drain. Available to manufacturers and the public for a number of years, ACI has provided one-on-one briefings to the U.S. Environmental Protection Agency (EPA) and the U.S. Food and Drug Administration (FDA) on the functionality and capabilities of iSTREEM. In addition, iSTREEM was recently featured among presentations made at EPA’s Office of Pesticide Program’s semi-annual Environmental Modeling Public Meeting.
iSTREEM can help predict chemical concentrations in U.S. waterways.
Return to Index
10
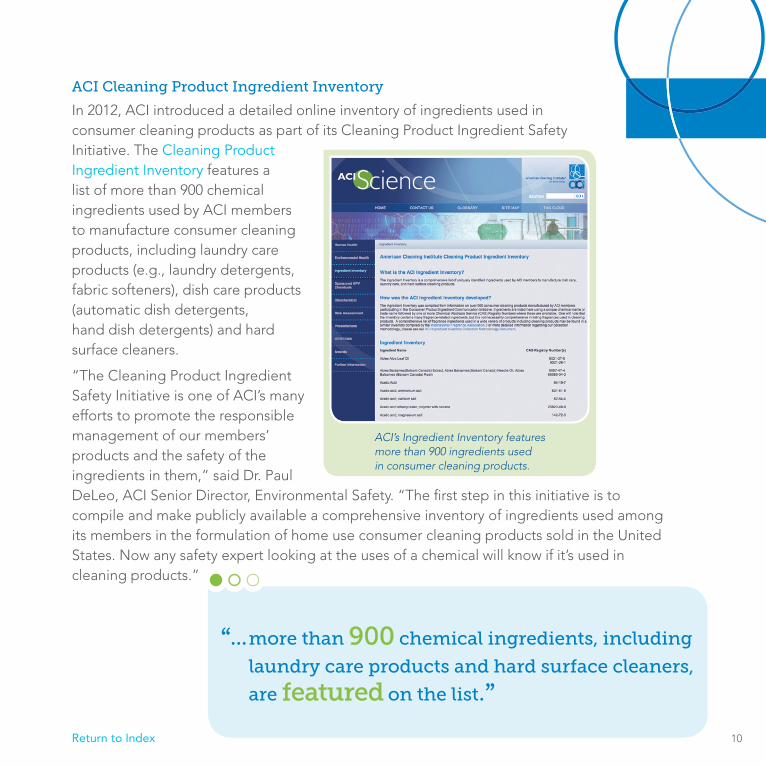
ACI Cleaning Product Ingredient Inventory
In 2012, ACI introduced a detailed online inventory of ingredients used in consumer cleaning products as part of its Cleaning Product Ingredient Safety Initiative. The Cleaning Product Ingredient Inventory features a list of more than 900 chemical ingredients used by ACI members to manufacture consumer cleaning products, including laundry care products (e.g., laundry detergents, fabric softeners), dish care products (automatic dish detergents, hand dish detergents) and hard surface cleaners.
“The Cleaning Product Ingredient Safety Initiative is one of ACI’s many efforts to promote the responsible management of our members’ products and the safety of the ingredients in them,” said Dr. Paul DeLeo, ACI Senior Director, Environmental Safety. “The first step in this initiative is to compile and make publicly available a comprehensive inventory of ingredients used among its members in the formulation of home use consumer cleaning products sold in the United States. Now any safety expert looking at the uses of a chemical will know if it’s used in cleaning products.”
ACI’s Ingredient Inventory features more than 900 ingredients used in consumer cleaning products.
“... more than 900 chemical ingredients, including
laundry care products and hard surface cleaners,
are featured on the list.”Return to Index

11
ACI-Chaired Science Forum Provides In-Depth Research Insights on Asthma
The Asthma Science Forum, sponsored by a coalition of industry trade associations and chaired by ACI, released a detailed report exploring the relationship between asthma and exposure to consumer products and their ingredients.
This unique report, based on research presented at the 2011 Asthma Science Forum held in Arlington, VA, concluded that the database of current studies is not sufficiently robust enough to demonstrate a causal relationship between product exposures and new-onset asthma. But some evidence does exist that suggests some exposures could trigger asthma-like symptoms in individuals with pre-existing asthma and/or bronchial hypersensitivity, providing a path forward to further work in this area.
Asthma Report: Manufacturers want to examine the best science available.
“ Manufacturers want to examine the best science available and identify where data
gaps exist to ensure that products are used
safely and beneficially...”
Return to Index

12
Landscape Plants Benefit from Watering with Household Graywater
Graywater – wastewater primarily from bathing and laundering – makes up nearly 50% of a typical household’s wastewater and could supply 100% of the residential irrigation demand in some areas of the country. As more households turn to graywater for their irrigation needs, it is important to understand what compounds are in graywater, what happens to them in the environment, and what potential impacts graywater may have on soil quality, groundwater quality, and plant and human health.
Research from ACI and the Water Environment Research Foundation found that many plants around the home do well under long-term graywater irrigation and may receive benefits beyond just having their thirst quenched. This information helps homeowners sustain their landscape plants.
ACI partnered with the Water Environment Research Foundation to explore safe use of household “graywater.”
“ Graywater...could supply 100% of
the residential irrigation demand
in some areas of the country.”
Return to Index
13
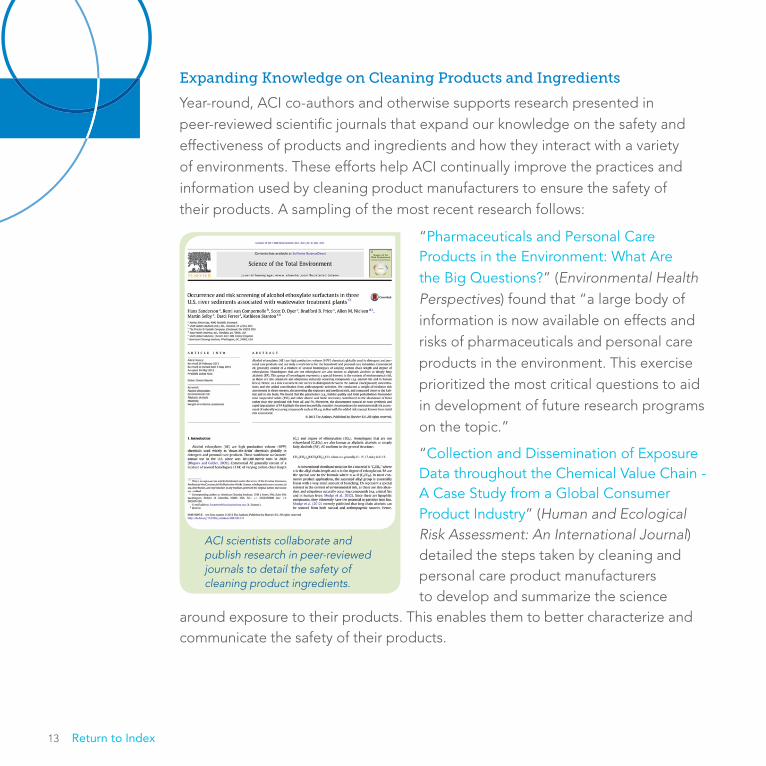
Expanding Knowledge on Cleaning Products and Ingredients
Year-round, ACI co-authors and otherwise supports research presented in peer-reviewed scientific journals that expand our knowledge on the safety and effectiveness of products and ingredients and how they interact with a variety of environments. These efforts help ACI continually improve the practices and information used by cleaning product manufacturers to ensure the safety of their products. A sampling of the most recent research follows:
“Pharmaceuticals and Personal Care Products in the Environment: What Are the Big Questions?” (Environmental Health Perspectives) found that “a large body of information is now available on effects and risks of pharmaceuticals and personal care products in the environment. This exercise prioritized the most critical questions to aid in development of future research programs on the topic.”
“Collection and Dissemination of Exposure Data throughout the Chemical Value Chain - A Case Study from a Global Consumer Product Industry” (Human and Ecological Risk Assessment: An International Journal) detailed the steps taken by cleaning and personal care product manufacturers to develop and summarize the science
around exposure to their products. This enables them to better characterize and communicate the safety of their products.
ACI scientists collaborate and publish research in peer-reviewed journals to detail the safety of cleaning product ingredients.
Return to Index
14
“The Toxicology and Immunology of Detergent Enzymes” (Journal of Immunotoxicology) presented a detailed review of enzyme toxicology and an assessment of the testing methods currently used to support the hazard characterization, risk assessment, and management of detergent enzymes.
Another paper published in the same journal – “Relevance of sensitization to occupational allergy and asthma in the detergent industry” – expanded the industry’s knowledge and understanding of how exposure to detergent enzymes can be related to allergic symptoms. It also reviewed the industry practices that have successfully minimized the
health risks to both occupational workers and consumers from exposure to detergent enzymes.
“An expert panel report of a proposed scientific model demonstrating the effectiveness of antibacterial handwash products” (American Journal of Infection Control) presented a realistic protocol for testing the efficacy of consumer antibacterial handwash products in terms of their ability to reduce infection.
“Occurrence and Risk Screening of Alcohol Ethoxylate Surfactants in Three U.S. River Sediments Associated with Wastewater Treatment Plants” (Science of the Total Environment) tied a bow on field work conducted in 2003. The research highlighted the low predicted risk of alcohol ethoxylates and fatty acids associated with detergent use through a weight-of-evidence risk assessment.
“ These efforts help ACI continually improve
the practices and information used...to ensure
the safety of products...”
Return to Index

15
Environmental Metrics
Supporting companies taking steps toward operating sustainably is a
key priority for the American Cleaning Institute (ACI) and tracking industry
performance is essential to this goal. ACI’s Sustainability Metrics Program
is an initiative to develop and publicly report data that provides business
value for our members and drives sustainability performance
improvements within the industry, including companies that make
and sell cleaning products and the companies that provide chemical
ingredients. The results are used to gain insights into the environmental
footprint of the cleaning products industry and allow companies to
internally benchmark against aggregated industry metrics.
The benefits for ACI members who participate in this program are
numerous, especially to those who are just starting their sustainability
journey. The program creates a framework for companies to initiate and
develop a sustainability program around four common environmental
metrics: Energy Use; Climate (Greenhouse Gas Emissions); Water Use;
and Solid Waste Generation. Participation also opens up pathways to
developing expertise within a company to capture data essential to
dealing with future regulatory and market-driven demands.
ACI Sustainability Metrics Program
Return to Index
16
ACI has a strong support system in place to guide members through
the reporting process. Annual training is provided for member company
staff responsible for collecting and submitting environmental metrics
data. ACI also conducts webinars to help companies stay at the forefront
of developments on sustainability measurement and benchmarking. In
2012, we offered member companies a new “Sustainability Metrics 101”
course which introduced participants to best practices for collecting
production facility metrics and provided real world examples from
company case studies.
Another important aspect of ACI’s Sustainability Metrics Program is the
reporting of aggregated industry metrics data, which can be used as an
internal benchmark against which companies can compare their own
environmental footprints. Not only does this drive the industry toward a
common set of sustainability goals, but it also provides a platform for a
company to continually improve their sustainability performance.
Return to Index

17
Program Specifics
ACI began aggregating data in 2009 with the assistance of Environmental
Resources Management (ERM) and reported publicly in our first
Sustainability Report in 2011. Members are invited to report annually on
sustainability metrics in accordance with a protocol closely aligned with
the performance indicators of the Global Reporting Initiative (GRI) and the
Greenhouse Gas Protocol. Data is aggregated and normalized per metric
ton of production in order to better understand how the cleaning products
industry is progressing.
Included in our reporting boundary are operations associated with
cleaning product-related activities in the United States
for which member companies exert operational
control. Member companies are responsible for
determining their operational control boundaries
in accordance with GRI’s boundary protocol. The
data presented in this report includes impacts
from manufacturing facilities, research and
development facilities, and office buildings
located within the United States.
The data reported in the following sections was
collected in 2012. Metrics data was received from
24 ACI member companies, representing 83% of
ACI’s membership dues base1. To ensure year-to-
year comparability, each company was responsible
for maintaining a consistent reporting boundary
across the three-year time frame: 2009-2011. Only
companies whose data spanned all three reporting years
(2009, 2010 and 2011) are included in the analysis presented in this report.
1 ACI membership dues are based on U.S. sales of cleaning products and related ingredients.
Definitions
Cleaning product
production includes
the production of
formulated products
(laundry and fabric care
products, topical
cleansers, surface
cleaners, dishwashing
and associated products),
packaging, ingredients,
and other chemicals
used in the production
of cleaning products.
Return to Index

18
Definitions
Operational control
was broadly defined
as those facilities and
impacts over which
the member company
exerts day-to-day
control or significant
influence, particularly
with respect to
environmental
sustainability metrics.
One of the main goals of sustainability measurement and reporting is to
encourage tracking of environmental performance within our member
companies. In order to increase participation and facilitate progress, ACI
encourages companies to participate even if they cannot provide data for
every metric or every reporting year. Though not included in the results
reported here, these companies have gained experience on metric reporting
that will support submission of data in future years of the metrics program.
The following are member companies that participated in 2012:
AkzoNobel Surface Chemistry
Amway
Arylessence, Inc.
BASF Corporation
Church & Dwight Company, Inc.
The Clorox Company
Colgate-Palmolive Company
Croda Inc.
The Dow Chemical Company
DuPont Industrial Biosciences
Ecolab Inc.
Evonik Goldschmidt Corporation
FMC Corporation
Givaudan Fragrances Corporation
Henkel Consumer Goods, Inc.
Huntsman Corporation
Novozymes
The Procter & Gamble Company
PQ Corporation
Sasol
SC Johnson
Seventh Generation
Shell Chemical LP
Stepan Company
Return to Index

19
Comparability
Due to the varying levels of reporting experience of each of our
participating member companies and differences between their units
of business, interpretations about the data should be made with care.
Caution should especially be taken when comparisons are made with
ACI’s prior Sustainability Report. Data in the prior report were
collected in 2010, which was during the early stages of ACI’s program,
and represented fewer member companies. For example, in the 2011
public report, results captured metrics associated with 11.3 million
metric tons per year of cleaning product production. Our current data
captures metrics related to 15 million metric tons per year, an increase
of 33 percent.
Return to Index

20
Following are the results of ACI’s 2012 Sustainability Metrics
Program which include four basic aspects of member operations
that are within their day-to-day control or influence:
Energy Use
Climate (Greenhouse Gas Emissions)
Water Use
Solid Waste Generation
Metrics for 2012
Return to Index
21
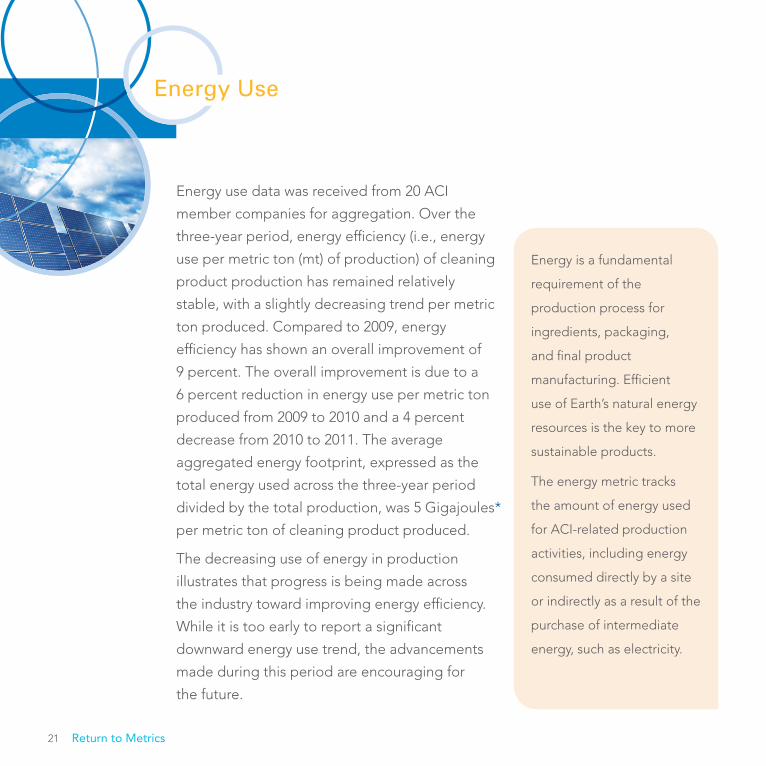
Energy Use
Energy is a fundamental
requirement of the
production process for
ingredients, packaging,
and final product
manufacturing. Efficient
use of Earth’s natural energy
resources is the key to more
sustainable products.
The energy metric tracks
the amount of energy used
for ACI-related production
activities, including energy
consumed directly by a site
or indirectly as a result of the
purchase of intermediate
energy, such as electricity.
Energy use data was received from 20 ACI
member companies for aggregation. Over the
three-year period, energy efficiency (i.e., energy
use per metric ton (mt) of production) of cleaning
product production has remained relatively
stable, with a slightly decreasing trend per metric
ton produced. Compared to 2009, energy
efficiency has shown an overall improvement of
9 percent. The overall improvement is due to a
6 percent reduction in energy use per metric ton
produced from 2009 to 2010 and a 4 percent
decrease from 2010 to 2011. The average
aggregated energy footprint, expressed as the
total energy used across the three-year period
divided by the total production, was 5 Gigajoules*
per metric ton of cleaning product produced.
The decreasing use of energy in production
illustrates that progress is being made across
the industry toward improving energy efficiency.
While it is too early to report a significant
downward energy use trend, the advancements
made during this period are encouraging for
the future.
Return to Metrics

22
-9%
Percentage change overall (2009-2011)
Gigajoules per metric ton of cleaning product (GJ/mt)
5.35.04.8
2009 2010 20111.0
Direct energy sources include:
• Coal • Propane
• Gasoline • Kerosene
• Natural Gas • Fuel oil
Energy consumed indirectly includes:
• Electricity
• Purchased steam
• Other “green” energy sources (e.g., solar, wind)
* The Gigajoule is a unit
of measure for energy
equal to approximately
278 kilowatt hours.
Average Aggregate Footprint
5.0 GJ/mt
Return to Metrics

23
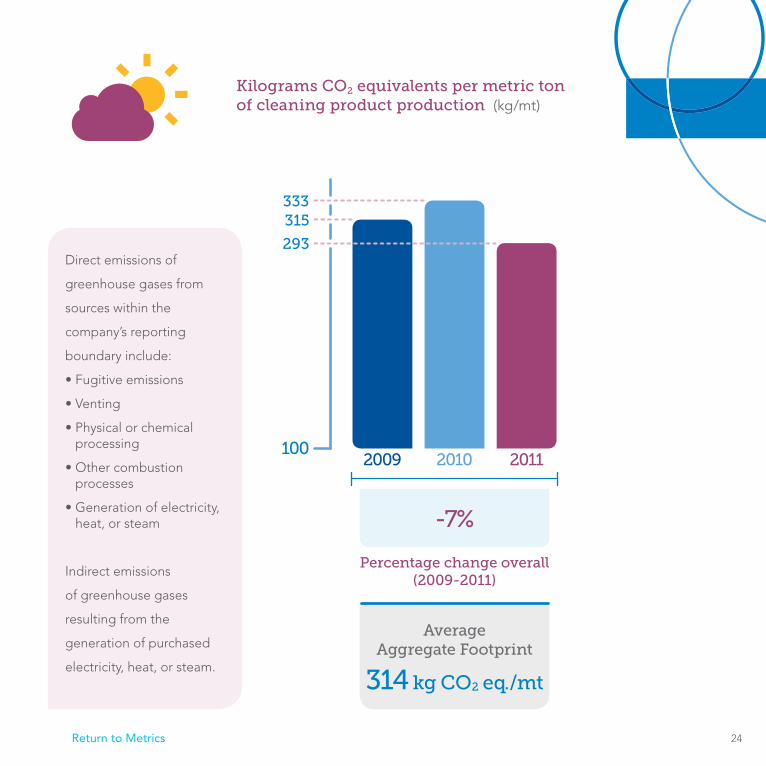
Climate (Greenhouse Gas Emissions)
Greenhouse Gas (GHG) Emissions data was
received or calculated from energy sources for
19 companies. Over the three-year period,
aggregate greenhouse gas emissions per metric
ton of production have shown slight variations
year-to-year. From 2009 to 2011, a 7 percent
decrease in GHG emissions occurred. In 2010,
an increase of 6 percent occurred compared to
2009, which was followed by a decrease of 12
percent from 2010 to 2011. The average
aggregated GHG footprint, expressed as the
total emissions across the three-year period
divided by the total production, was 314
kilograms CO2 equivalents per metric ton of
cleaning product production.
The direct cause of the increased GHG emissions
in 2010 is unclear. It is important to remember the
results are an aggregate of many companies,
each with their own changing energy profile. It is
possible facilities switching energy sources may
be a cause of the variations as each source has a
distinct emissions profile.
Tracking and reducing
emissions released into
the air during manufacturing
is a vital practice in
decreasing negative
climate change impacts
of ACI-related products.
Member companies report
GHG emissions from sources
under their operational
control and from indirect
emissions that are the
consequence of activities
of the reporting organization,
but are generated at sources
owned or controlled by
another organization.
Return to Metrics
24
333315
293
2009 2010 2011100
Direct emissions of
greenhouse gases from
sources within the
company’s reporting
boundary include:
• Fugitive emissions
• Venting
• Physical or chemical processing
• Other combustion processes
• Generation of electricity, heat, or steam
Indirect emissions
of greenhouse gases
resulting from the
generation of purchased
electricity, heat, or steam.
Kilograms CO2 equivalents per metric ton of cleaning product production (kg/mt)
-7%
Percentage change overall (2009-2011)
Average Aggregate Footprint
314 kg CO2 eq./mt
Return to Metrics

25
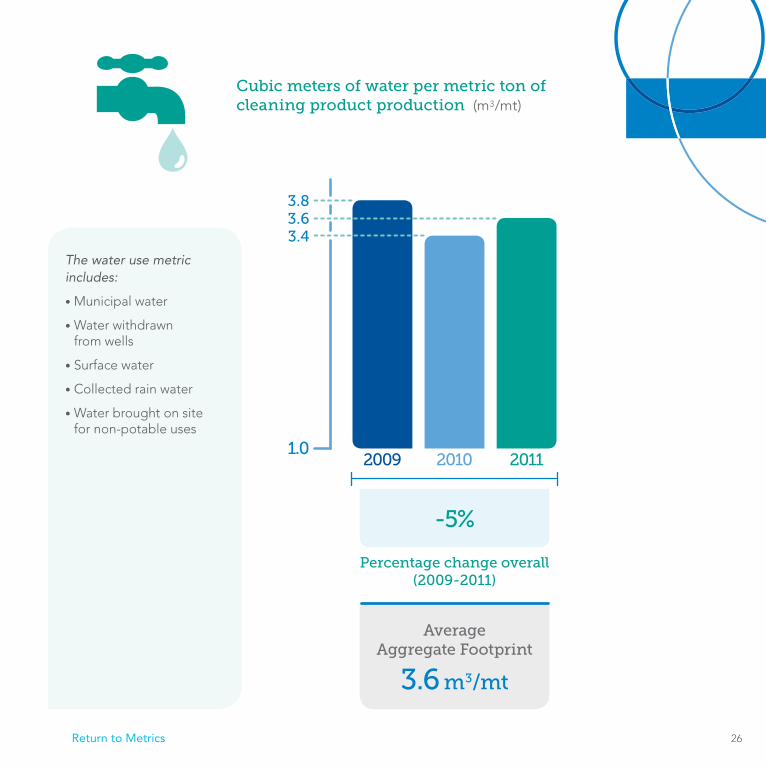
Water Use
The water use data collected was received
from 20 member companies. Over the
three-year period, water used to produce
cleaning products and their ingredients has
remained relatively stable, with only slight
fluctuations. In 2010, water use decreased
11 percent per metric ton of production
compared to 2009. Data in 2011 showed a 6
percent increase in water use compared to
2010. The average aggregated water use
footprint, expressed as the total water used
across the three-year period divided by the
total production, was 3.6 cubic meters of water
per metric ton of cleaning product production.
The results indicate that the amount of
water used in cleaning product production
is relatively stable within the industry. While
every company’s situation varies, large
reductions in water use across the industry
were not seen during this three-year period.
Barriers to improving water efficiency need
to be further explored.
Water scarcity is an issue
of worldwide concern. As a
necessary resource for the
full life-cycle of ACI-related
products, the water metric
tracks the water volume
used (i.e., withdrawn from
the environment) by each
company and the water
volume saved through
conservation measures
throughout the
production process.
Return to Metrics
26
3.83.63.4
2009 2010 20111.0
Average Aggregate Footprint
3.6 m3/mt
The water use metric includes:
• Municipal water
• Water withdrawn from wells
• Surface water
• Collected rain water
• Water brought on site for non-potable uses
Cubic meters of water per metric ton of cleaning product production (m3/mt)
-5%
Percentage change overall (2009-2011)
Return to Metrics

27
Solid Waste Generation
Data from 19 companies was included in the solid
waste metric. Over the three-year period, solid
waste generation per metric ton production has
seen an overall reduction of 17 percent. A
significant reduction of 24 percent was reported
for 2010 compared to 2009, which was followed
by a 10 percent increase in 2011. The average
aggregate solid waste footprint, expressed as
the total waste generated across the three-year
period divided by the total production, was 35
kilograms solid waste per metric ton of cleaning
product production.
While overall from 2009 to 2011 solid waste
generation decreased, the metric is unstable
from year-to-year. The fluctuating data indicates
that progress is being made around reducing
waste in the production phase. Many member
companies are in the process of pursuing zero
waste goals or other improvements. As the
efficiency of the product-to-waste relationship
continues to mature, overall reductions in the
average industry footprint are expected.
Moderating solid waste
generation is a critical and
continual challenge.
Successful waste-reduction
measures help improve
efficiency and alleviate
pressure on natural resources.
The solid waste metric tracks
the amount of solid waste
generated, reused, recycled,
and disposed of by each
company as a result of
cleaning product production.
Solid wastes generated within
the company’s operational
control are included, whether
regulated as nonhazardous
or hazardous.
Return to Metrics

28
-17%
Percentage change overall (2009-2011)
Kilograms solid waste per metric ton of production (kg/mt)
For example:
• Waste disposed or treated on-site
• Waste reused off-site
• Waste recycled off-site
• Waste landfilled off-site
• Waste otherwise disposed of off-site (e.g., incineration)
Post-consumer waste is not included.
41
3431
2009 2010 201110
Average Aggregate Footprint
35 kg/mt
Return to Metrics

29
ACI member companies are committed to increasing sustainability
and demonstrating corporate social responsibility. We invite you
to learn more about their individual efforts in our online showcase,
available here: www.cleaninginstitute.org/sustainability2013
The following ACI member companies have shared their stories:
Stories of Sustainability
Return to Index

30Return to Index
BRADFORD
&F ra g r a n c e F l a vo rCHEMIA
www.cleaninginstitute.org
While reasonable efforts have been made to include reliable data and information in this Report, ACI cannot assume responsibility for the validity of all facts, data and materials contained in this Report, the consequences of their use, or any translation of the contents of this Report. The information contained in this Report was created and/or compiled by ACI and is offered solely to aid the reader. To the fullest extent permissible under applicable law, ACI and its member companies do not make any guarantees, representations or warranties of any kind, express or implied, with respect to the accuracy and completeness of the information contained herein and assume no responsibility for the use of this information. ACI and its member companies do not assume any responsibility to amend, revise, or update information contained herein based on information which becomes available subsequent to publication. The content included in the Member Company Sustainability Snapshots section of the Report was provided by individual member companies and does not necessarily represent the views of ACI.
This Report and all of its content are protected by applicable U.S. and international copyright laws. No one may copy, download, publish, modify, transmit, reproduce, create new works from, distribute, sell, loan or in any way exploit any of the material contained in this Report in whole or in part without the express authorization of ACI.