Embed Size (px)
Citation preview

Dr.-Ing. Luigi Vanfretti “Docent” and Assistant Professor
KTH Royal Institute of Technology, Sweden E-mail: [email protected] , [email protected]
Web: http://www.vanfretti.com
Opal-RT Real-Time 2012 -5th International User Conference
Las Vegas, Nevada, USA – July 17-19, 2012
SmarTS Lab – A real-time hardware-in-the-loop lab. for developing WAMPAC applications

Outline
• whoami
• Smart Transmission Systems Research Group
• SmarTS Lab - Overall architecture and hardware implementation
- Comm. and Synchronization Architecture and Implementation
- Software implementation
- Model-to-Data Workflow for Hardware-in-Open-Loop and Hardware-in-the-Loop
• Configuration of PMUs and Phasor Data Concentrator
- PDC Configuration, Visualization and Historian Configuration
• A LabView Software Development Toolkit (SDK) for PMU Applications - Synchrophasor Bable Fish
- LabView SDK
• Research Project Example
• Lessons Learned and Future Research Activities

Intermitted generation – brings renewable energy capacity • New production of
electricity:
- Wind: variable - uncertain
- Solar: variable - uncertain
• Location:
- Most “new” wind is located at distant locations (Long-distance transmission required)
- Most “new” solar sources sited ”closer” to the customer – on all voltage levels (becoming bigger)
• And more to come!
- In Norway – great potential for micro hydro plants at remote locations.
Small Hydro
PV
Wind
While new energy capacity is coming in, new challenges are also emerging for security of supply: - Meeting the challenges from the push for
decommissioning of nuclear plants (Germany) - Meeting EU 202020 goals (CO2 goals make it
difficult to attain – dependency on fossil). - Handling public acceptance for the installation of
transmission capacity! (Norway/Sweden)

To deal with new generation sources requires a paradigm shift … also at the transmission level
• Future generation patterns bring faster power transfer interactions
- System wide visibility and awareness of the system’s condition at short time scales becomes necessary!
• Real-time monitoring across traditional operational boundaries:
- Obtain visibility of the system-wide dynamics
• Real-time control can help handling operation under stringent conditions

• System dynamics become increasingly important for system operation
• The US has a very limited penetration of wind, despite of this limitation problems are emerging
- How will Europe cope with these kind of “dynamic “ operation challenges?
• Flexibility becomes available with advancements in
-Wide-area monitoring, protection, and control systems
Need for Flexibility
• In December 2010, OG&E monitored oscillations on the transmission system in northwester Oklahoma.
• Occurring during periods of high wind.
• The oscillations had their origin in two adjacent wind farms.
• What would happen with massive wind deployment to cope with changes < 25 min?
~2 sec
PMU Data

Smart Grids – Also at the Transmission Level Monitoring, Operation, Control and Protection in Real-Time – through Smart Apps?
Picture of Coreso (coordination initiative of Elia (Belgium), RTE (France), National Grid (UK), Terna (Italy) and 50 Hz (Germany) ) Operators have the challenge of tracing dynamic events through large and complex interconnected networks.
A challenge also in Scandinavia: Picture of the Regional Control Center at Alta, Norway. Operators have the challenge of running a power system under severe weather conditions and guaranteeing supply to critical heavy industries

SmarTS Lab The Smart Transmission Systems Lab.

• Smart Grid require Smart Operation, Smart Control and Smart Protection:
- The ultimate goal should be to attain an automatic-feedback self-healing control system
• Measure – Communicate – Analyze (System Assessment and real limits) – Determine Preventive/Corrective Actions – Communicate – Control and protect
• To achieve this vision, new applications need to be developed in a controlled environment, allowing testing and considering the ICT chain
How to develop a controlled environment for developing Smart Transmission Apps?
Sync. Timing
Phasor Measurement Data
Controllable and Protective Device Measurement and Status Data
Data Alignmentand
Concentration
Comm
unica
tion N
etwor
ksData Storage and Mining
Monitoring
Transmission System Control Center
Advanced Displays Early Warning
System
Near Real-TimeSecurity
Assessment Automatic Determination ofControl Actions
Decision/Control Support System
Smart-Automatic Control Actions
Smarter OperatorDecision Support
Smarter Operator Control Actions
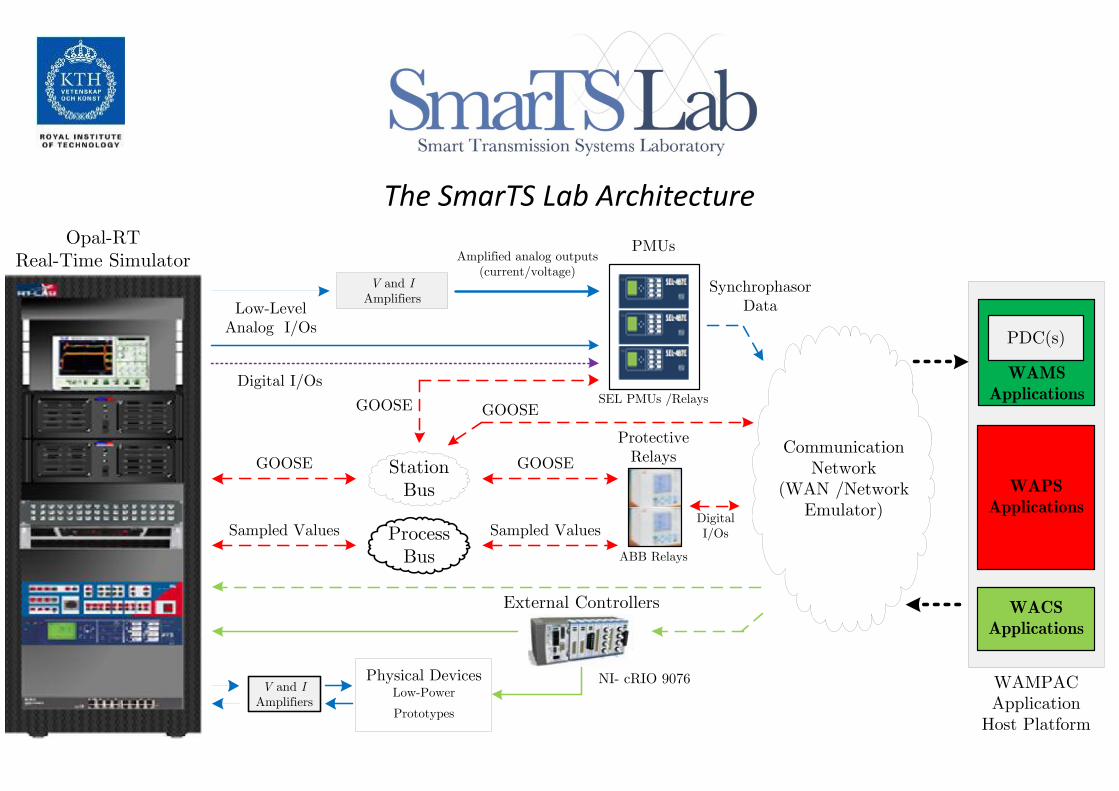
The SmarTS Lab Architecture Opal-RT
Real-Time Simulator
CommunicationNetwork
(WAN /Network Emulator)
Station Bus
Low-LevelAnalog I/Os
Physical DevicesLow-Power
Prototypes
V and IAmplifiers
Digital I/Os
Amplified analog outputs (current/voltage)
SEL PMUs /Relays
ABB Relays
NI- cRIO 9076
Synchrophasor Data
WAMSApplications
PDC(s)
WAPSApplications
PMUs
External Controllers
V and IAmplifiers
GOOSE
Sampled Values
GOOSE
Sampled Values
Protective Relays
WACSApplications
WAMPAC Application
Host Platform
GOOSE
Process Bus
GOOSE
Digital I/Os

Smar
TS L
ab
Har
dw
are
Imp
lem
enta
tio
n

SmarTS Lab Comm. and Synchronization Architecture and Implementation
GPS - Signal
IRIG-B
Process Bus (IEC 61850-9-2)
Station Bus (IEC 61850-8-1)
Synchrophasor Bus (IEEE C37.118)

Synchrowave Phasor Data Concentrator – Gathering PMU Measurements, Time Alignment and Archival
Input to the PDC from 3 different PMUs (IP Configuration, Port No, PMU ID, etc.)
Output Stream: - Sent to other PDC from SEL
Smar
TS L
ab
Soft
war
e Im
ple
men
tati
on

Synchrowave Central (Visualization of PMU Data) SEL AcSELerator Quickset (Relay Settings and HMI)
Display of real-time PMU data streams from SEL PDC
SEL AcSELerator Display for Voltage and Current Phasors
SmarTS Lab Software Implementation

MATLAB/SimulinkSimPowerSystems
Model
Model Splitting into Sub-systems forRT-Simulation
Real-Time Model Simulation
RT-Lab Software Interface Compiles and Loads the Model into
RT-Targets
EthernetPort
OP5949 Active Monitoring PanelOP 5600 I/O Extension ChasiseMEGAsim (12 Cores)
64 Analog Out
16 Analog In
Current Inputs Voltage Inputs
OPAL-RT
MATLAB/Simulink Design models for real-
time simulation
Simulator Analog and Digital I/Os
1
2
4
5
Ethernet Switch
The model is compiled and loaded into the simulator using Opal-RT
Lab Software
Real-Time Digital simulation is converted to Analog / Digital Signals
through I/O s
The Analog outputs of the Simulator are fed into the CT Inputs of the SEL-487E
RealTime simulations are accessed from the console generated by OPAL-RT Lab
software
OP 5251 (128 DIgital I/O))
Digital Outputs Digital Inputs
Receiving Data from SEL 487E
using SEL AcSELerator
Quickset
The current and voltage from the analog outputs of the simulator
amplified by using Megger SMRT-1 Amplifier and fed into the CT/VT
inputs of the relay
3
Off-line to RT Model Code Generation
Model-to-Data Workflow

Model-to-Data Proof of Concept Experiment (Hardware-in-Open-Loop)
Real-Time Simulator
Amplifier
PMU/Relay
Media Converter
SEL Synchrowave PDC Hardwired Ethernet
Generate 3-Phase RT Signals (Voltages and
Currents)
Output signals, low level through simulator I/Os
(+/- 16 V., +/- 20 mA)
Amplifying from low-level to standard
rating (1-60 Amp, 60-300 V)
PMU Transmits Computed
Phasors through Serial Port
RS232 to TCP/IP over Ethernet

Megger SMRT1 (Back Panel)
Ethernet Port Data Stream on IEEE C37.118
GPS Antenna Input
Three-Phase Voltage & Current Signals
Opal-RT OP5600 Computational Target
Analog Outputs from IO to
Megger SMRT1
SEL-421 Relay with PMU functionality
Monitoring Output Measurement
(3-Phase signals)
GPS Antenna
Megger SMRT1 (Front Panel)
GPS Signals Spliter

What is observed at the PMU at 50 fps reporting rate?
Generator mechanical power perturbation
Generator mechanical power perturbation
The whole process in real-time: Interaction with the model in real-time (Hardware-in-open-loop)
Synchronous Generartor
500MVA , 20kV
Step Up Transformer 20kV / 380 kV
Bus 2
Bus 3
Thevenin Equivalent
Bus 1Transmission Line
L 1-3
Transmission Line L 1-3 a
Transmission Line
L 3-5
M
`
Bus 4
Step Down Transformer
380 kV / 6.3 kV
Bus 5
Induction Motor4.9 MVA , 6.3 kV
OLTC Controlled Load
Damped oscillations captured by the PMU at 50 fps in the frequency computed by the PMU
One-Line Diagram

Modeling for Real-Time Hardware-in-the-Loop
Simulation
Video!

Configuration of PMUs and Phasor Data Concentrator for HIL Application Development

Configuring Relay and PMU Features

Configuring Synchrophasor Data Concentrator

Visualization and Historian Configuration
Frequency
Voltage Mag.
Current Mag.
Real-time or Historian Display

A Software Development Toolkit (SDK) for Developing Smart Transmission Grid Applications

The Missing Link: Needed Software Development
• Avoid the Software Road-Block:
- To date, there are no flexible software tools that would allow for fast prototyping of monitoring applications that use PMU data.
- What is needed is to develop a "Babel Fish" that brings real-time streams from PMU data to the hands of researchers and small developers to develop ad hoc applications.
- Having the Bable Fish available, we will develop some monitoring tools consuming real-time data.
• New monitoring applications
• Possibility of including the bable fish in embedded systems for real-time control and protection!
C. And Provide Real-Time Data from PMUs in LabView
A. Starting from “real-time” data streams in the IEEE C37.118 protocol and IEC 61850-90-5:
0001000101010001001001010101
B. I translate the protocol into usable data.

Building Smart Apps with the facilities at SmarTS-Lab
PMU Data Bus (IEEE C37.118)
Phasor Data Concentrator(s)
Real-Time Simulator
+ Amplifiers
+ PMUs
+ Comm.
Network
000101
Bable Fish
Labview PMU Application Software Development Toolkit
(SDK)
C. And Provide Real-Time Data from PMUs in LabView
A. Starting from “real-time” data streams in the IEEE C37.118 protocol and IEC 61850-90-5:
0001000101010001001001010101
B. I translate the protocol into usable data.

• Joint work with Statnett SF (Norway’s TSO)
• Connection mechanims for the IEEE C37.118 protocol and IEC 61850-9-5
• Make PMU-data available in a buffer
• Allow data access from the buffer with adjustable update rate
• Allow selection of channels
• Allow receiving data on a queue
PMU App. SDK A LabView-Based PMU Application SDK

SDK Platform
C37.118
PDC
DLL
Live Buffer
Access Buffer
PRL
SnapShooter
Data - Time Stamp - Voltage Phasors - Current Phasors - Frequency
Selector
Custom Application
Remote

PMU Recorder Light (PRL)
DLL
?
?
?
SnapShooter
PRL
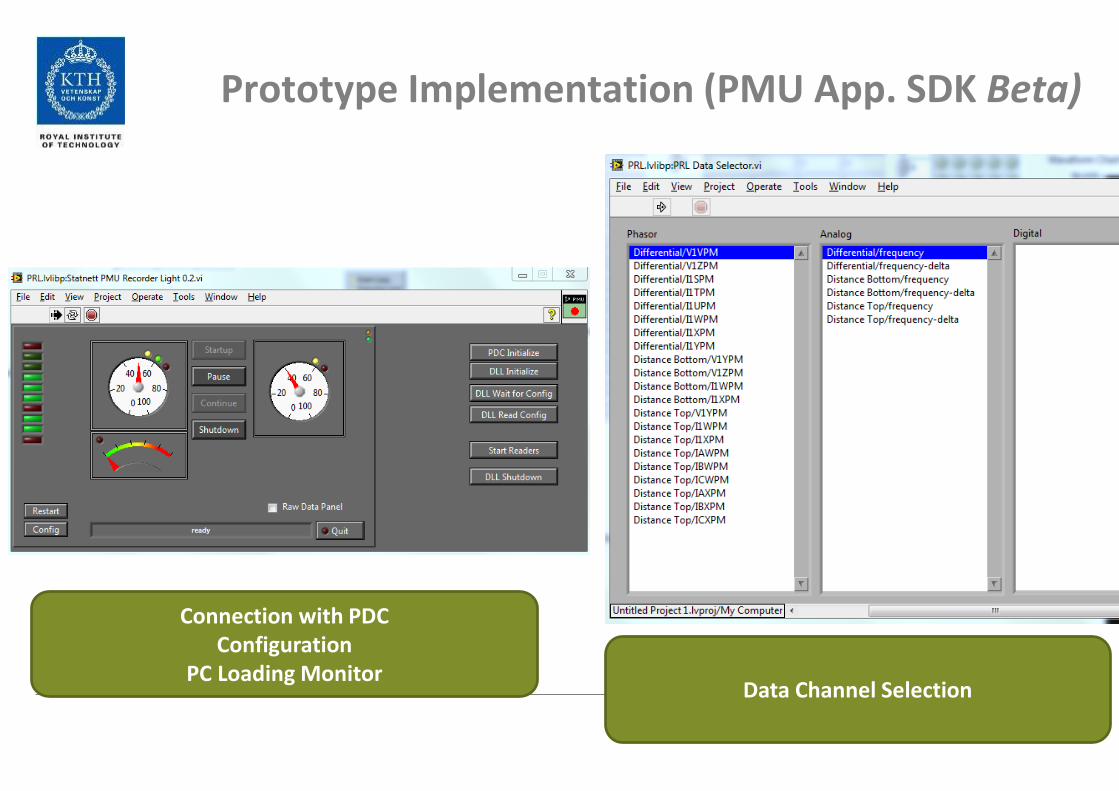
Prototype Implementation (PMU App. SDK Beta)
Connection with PDC Configuration
PC Loading Monitor Data Channel Selection

Real-Time Data Access
Straightforward Development of Monitoring Application

• When building such laboratory, many details need to be considered:
• Cost and Procurement.
• Choice of real-time simulator - It should fit your needs - Research needs ≠ industry needs.
• When operating such lab., a broad range of expertise is needed:
- Clear knowledge on Real-Time modeling and simulation, with associated modeling phylosophy
- From configuration of relays/PMU to PDC, and beyond (media converters, comm. network…)
• Big lessons:
- Separate your communication networks depending on the data type they will carry.
• In our experiments having large amounts of PMU data had large impacts in the performance of IEC-61850-8-1 and -9-2 (relay trip time was longer than using hardwires)
• Performance can be enhanced by separating IEC-61850-8-1, -9-2, and PMU data - having IEC-61850-8-1 operate even faster that hardwired tests.
• Question: how can this be dealt with when all of the data will be under IEC 61850 with PMU under -9-5?
- When using amplifiers, synchronization between each amplification source can be source of error for protection applications.
Lessons Learned A fun experience!


