Embed Size (px)
Citation preview
North Carolina Division of Tourism, Film and Sports Development
2012 North Carolina Regional Travel Summary
A publication of the North Carolina Division of Tourism, Film & Sports Development
May 2013
2012 North Carolina Regional Travel Summary
2012 North Carolina Regional Travel Summary The North Carolina Division of Tourism, Film and Sports Development has contracted with the research company TNS for six years to perform demographic profiles and volume analyses on the North Carolina travel and tourism industry. TNS is the world’s largest provider of custom research and analysis, serving all segments of the travel industry. The company has over 13,000 full-time employees worldwide and offices in more than 80 countries. The research program, titled “TravelsAmerica” conducts over 10,000 Internet-based interviews among past 12-month travelers who have traveled more than 50 miles from their homes (excluding commuters). From this sample, past-month data from 4,500 – 5,500 past month travelers is also collected for even greater insights. Information collected includes: purpose of trip, mode of travel, travel party characteristics, places visited, number of nights, accommodations, activities, spending, and demographics. Data collected are weighted to match US Census variables, market size, age of household head, household income, and household size. The purpose of this regional report is to provide each region with research data specific to their geographic area. The report is divided into three sections: Mountain, Piedmont, and Coast. Where applicable, regional statistics are compared to statewide statistics to provide regions with information relevant to how they compare to NC travel in general. In addition, comparisons to 2011 are also offered as available. In the final section of the report, a comparison between the three regions is offered. At the end of the report, an appendix offers definitions of key travel terms.
North Carolina Division of Tourism, Film and Sports Development
2012 North Carolina Regional Travel Summary
Table of Contents
Page
Coastal Region Summary 2
Coastal Overnight Visitors 3
Coastal Region Overnight Visitor/North Carolina Comparison 12
Piedmont Region Summary 22
Piedmont Overnight Visitors 23
Piedmont Region Overnight Visitor/North Carolina Comparison 32
Mountain Region Summary 39
Mountain Overnight Visitors 40
Mountain Region Overnight Visitor/North Carolina Comparison 49
Regional Comparison 59
Glossary of Terms 69
2012 North Carolina Regional Travel Summary – Coastal Region
2 | P a g e
2012 Domestic Coastal Region Total Travel
Summary
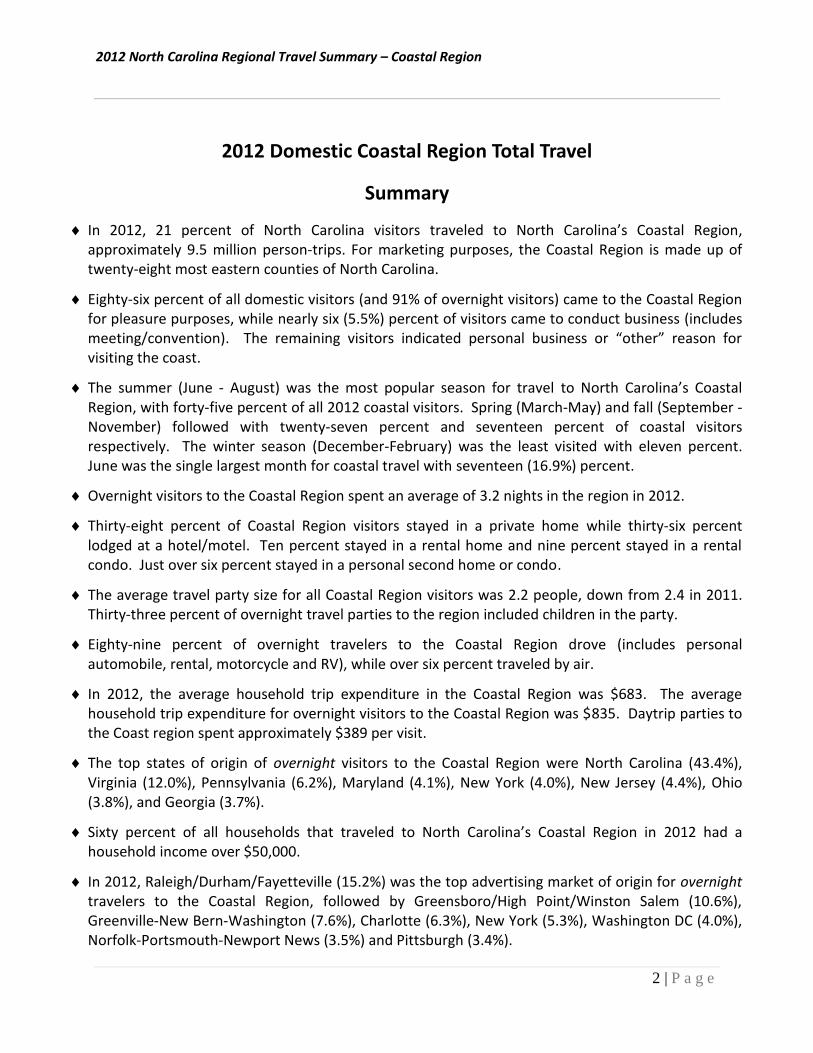
In 2012, 21 percent of North Carolina visitors traveled to North Carolina’s Coastal Region, approximately 9.5 million person-trips. For marketing purposes, the Coastal Region is made up of twenty-eight most eastern counties of North Carolina.
Eighty-six percent of all domestic visitors (and 91% of overnight visitors) came to the Coastal Region for pleasure purposes, while nearly six (5.5%) percent of visitors came to conduct business (includes meeting/convention). The remaining visitors indicated personal business or “other” reason for visiting the coast.
The summer (June - August) was the most popular season for travel to North Carolina’s Coastal Region, with forty-five percent of all 2012 coastal visitors. Spring (March-May) and fall (September - November) followed with twenty-seven percent and seventeen percent of coastal visitors respectively. The winter season (December-February) was the least visited with eleven percent. June was the single largest month for coastal travel with seventeen (16.9%) percent.
Overnight visitors to the Coastal Region spent an average of 3.2 nights in the region in 2012.
Thirty-eight percent of Coastal Region visitors stayed in a private home while thirty-six percent lodged at a hotel/motel. Ten percent stayed in a rental home and nine percent stayed in a rental condo. Just over six percent stayed in a personal second home or condo.
The average travel party size for all Coastal Region visitors was 2.2 people, down from 2.4 in 2011. Thirty-three percent of overnight travel parties to the region included children in the party.
Eighty-nine percent of overnight travelers to the Coastal Region drove (includes personal automobile, rental, motorcycle and RV), while over six percent traveled by air.
In 2012, the average household trip expenditure in the Coastal Region was $683. The average household trip expenditure for overnight visitors to the Coastal Region was $835. Daytrip parties to the Coast region spent approximately $389 per visit.
The top states of origin of overnight visitors to the Coastal Region were North Carolina (43.4%), Virginia (12.0%), Pennsylvania (6.2%), Maryland (4.1%), New York (4.0%), New Jersey (4.4%), Ohio (3.8%), and Georgia (3.7%).
Sixty percent of all households that traveled to North Carolina’s Coastal Region in 2012 had a household income over $50,000.
In 2012, Raleigh/Durham/Fayetteville (15.2%) was the top advertising market of origin for overnight travelers to the Coastal Region, followed by Greensboro/High Point/Winston Salem (10.6%), Greenville-New Bern-Washington (7.6%), Charlotte (6.3%), New York (5.3%), Washington DC (4.0%), Norfolk-Portsmouth-Newport News (3.5%) and Pittsburgh (3.4%).

2012 North Carolina Regional Travel Summary – Coastal Region
3 | P a g e
Coastal Region Overnight Visitor Profile
Main Purpose of Visit
In 2012, over nine out of ten (91.4%) of domestic overnight visitors came to the Coastal Region for leisure purposes, which included visiting friends and relatives, outdoor recreation and entertainment/sightseeing. Five percent of domestic overnight visitors came for general business, convention, seminar or other group meeting, while four percent traveled to the Coastal Region to conduct personal or “other” business.
The Coastal Region saw a much larger proportion of repeat visitors in 2012, up to 91% from 82% in 2011. First time overnight visitors were only nine percent of all overnight visitors.
0%
20%
40%
60%
80%
100%
Leisure Business Personal/Other
91%
5% 4%
93%
4% 3%
94%
5% 1%
89%
8% 4%
2012 Primary Purpose of Overnight Trip to North Carolina's Coastal Region
2012
2011
2010
2009
0%
20%
40%
60%
80%
First visit Have visited once ortwice in past 5 years
Have visited 3+ timesin past 5 years
9%
21%
70%
18% 20%
62%
18% 22%
61%
17% 21%
63%
2012 First Time vs. Repeat Visitors to North Carolina's Coastal Region
2012
2011
2010
2009
2012 North Carolina Regional Travel Summary – Coastal Region
4 | P a g e
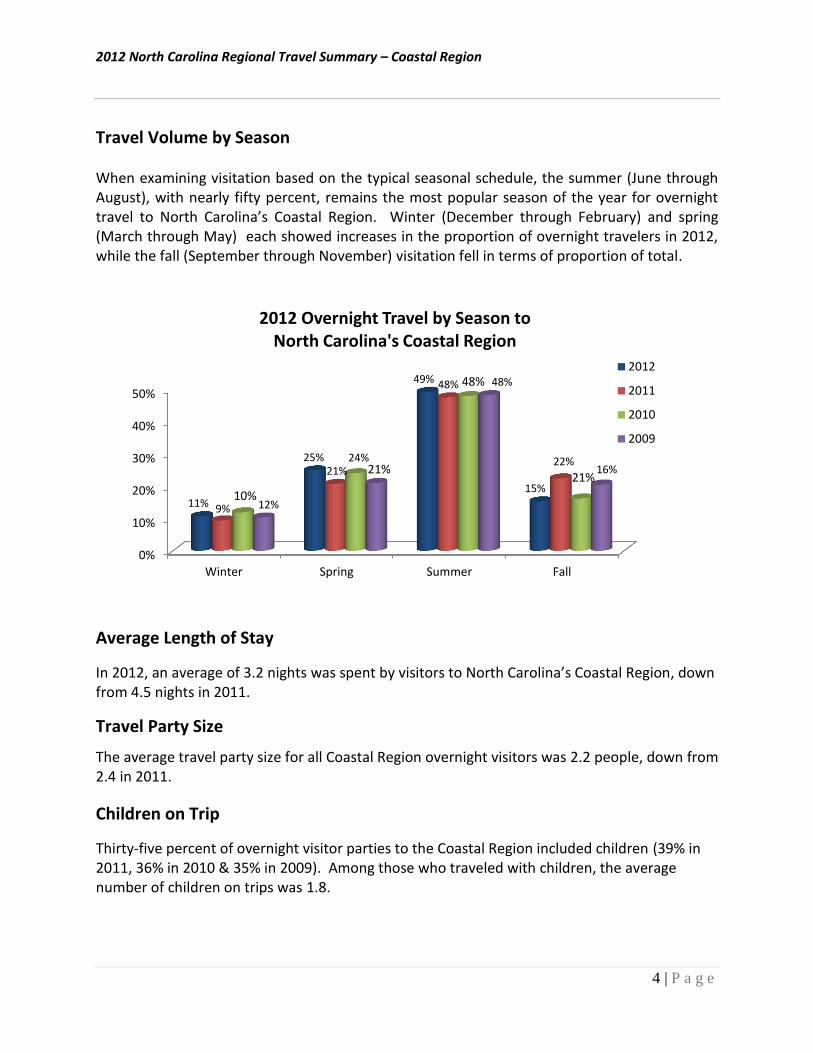
Travel Volume by Season When examining visitation based on the typical seasonal schedule, the summer (June through August), with nearly fifty percent, remains the most popular season of the year for overnight travel to North Carolina’s Coastal Region. Winter (December through February) and spring (March through May) each showed increases in the proportion of overnight travelers in 2012, while the fall (September through November) visitation fell in terms of proportion of total.
Average Length of Stay
In 2012, an average of 3.2 nights was spent by visitors to North Carolina’s Coastal Region, down from 4.5 nights in 2011.
Travel Party Size
The average travel party size for all Coastal Region overnight visitors was 2.2 people, down from 2.4 in 2011.
Children on Trip
Thirty-five percent of overnight visitor parties to the Coastal Region included children (39% in 2011, 36% in 2010 & 35% in 2009). Among those who traveled with children, the average number of children on trips was 1.8.
0%
10%
20%
30%
40%
50%
Winter Spring Summer Fall
11%
25%
49%
15%
9%
21%
48%
22%
12%
24%
48%
16%
10%
21%
48%
21%
2012 Overnight Travel by Season to North Carolina's Coastal Region
2012
2011
2010
2009
2012 North Carolina Regional Travel Summary – Coastal Region
5 | P a g e
Lodging Used in Coastal Region
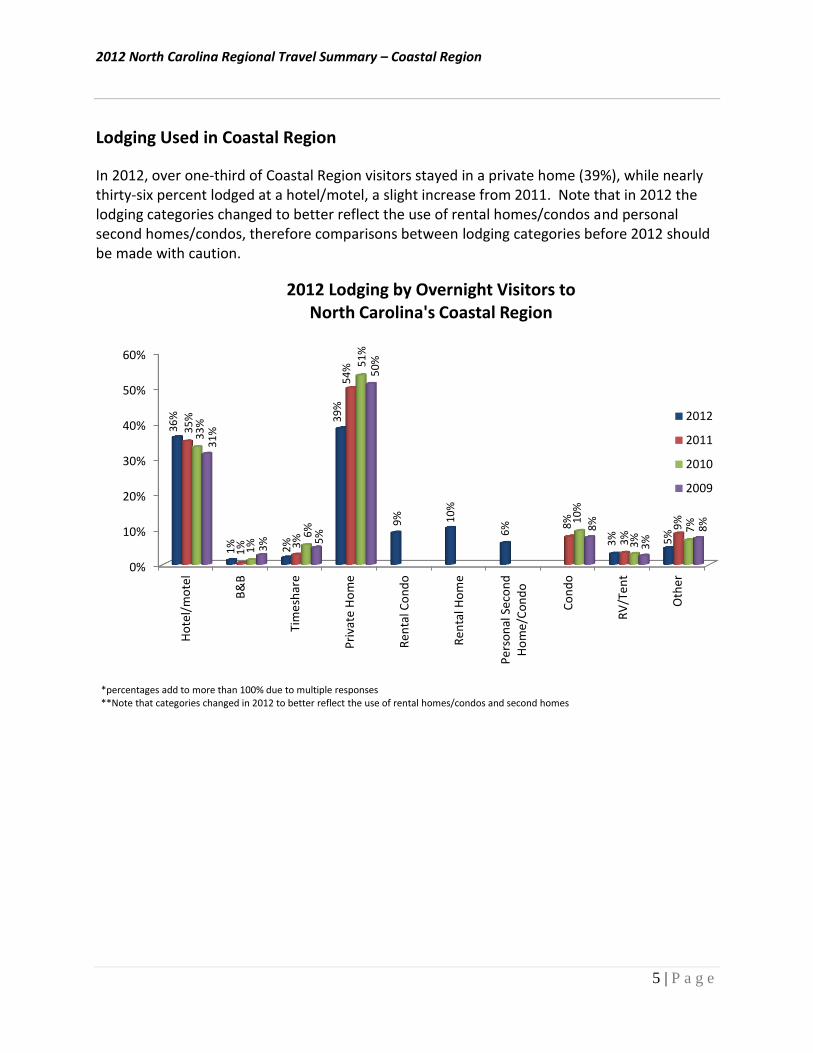
In 2012, over one-third of Coastal Region visitors stayed in a private home (39%), while nearly thirty-six percent lodged at a hotel/motel, a slight increase from 2011. Note that in 2012 the lodging categories changed to better reflect the use of rental homes/condos and personal second homes/condos, therefore comparisons between lodging categories before 2012 should be made with caution.
0%
10%
20%
30%
40%
50%
60%
Ho
tel/
mo
tel
B&
B
Tim
esh
are
Pri
vate
Ho
me
Re
nta
l Co
nd
o
Re
nta
l Ho
me
Pe
rso
nal
Se
con
dH
om
e/C
on
do
Co
nd
o
RV
/Te
nt
Oth
er
36
%
1%
2%
39
%
9%
10
%
6%
3%
5%
35
%
1%
3%
50
%
8%
3%
9%
33
%
1%
6%
54
%
10
%
3%
7%
31
%
3%
5%
51
%
8%
3%
8%
*percentages add to more than 100% due to multiple responses **Note that categories changed in 2012 to better reflect the use of rental homes/condos and second homes
2012 Lodging by Overnight Visitors to North Carolina's Coastal Region
2012
2011
2010
2009
2012 North Carolina Regional Travel Summary – Coastal Region
6 | P a g e
Mode of Transportation
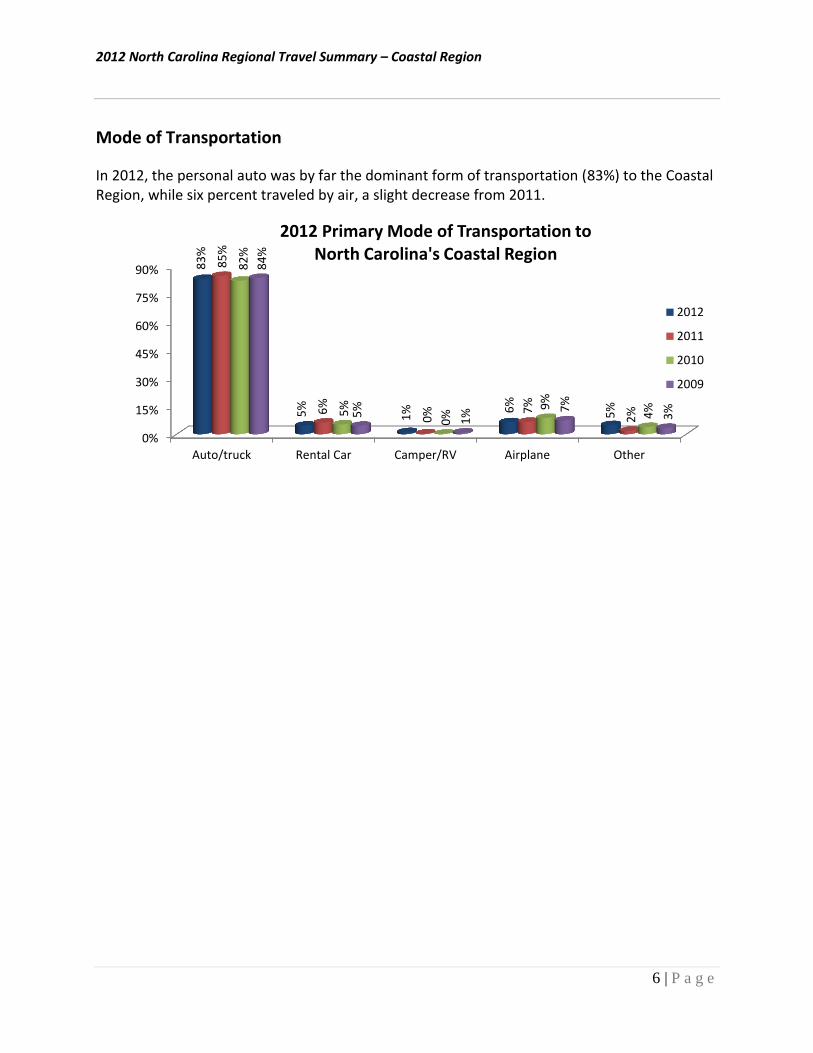
In 2012, the personal auto was by far the dominant form of transportation (83%) to the Coastal Region, while six percent traveled by air, a slight decrease from 2011.
0%
15%
30%
45%
60%
75%
90%
Auto/truck Rental Car Camper/RV Airplane Other
83
%
5%
1%
6%
5%
85
%
6%
0%
7%
2%
82
%
5%
0%
9%
4%
84
%
5%
1%
7%
3%
2012 Primary Mode of Transportation to North Carolina's Coastal Region
2012
2011
2010
2009
2012 North Carolina Regional Travel Summary – Coastal Region
7 | P a g e
Amount Spent in Coastal Region
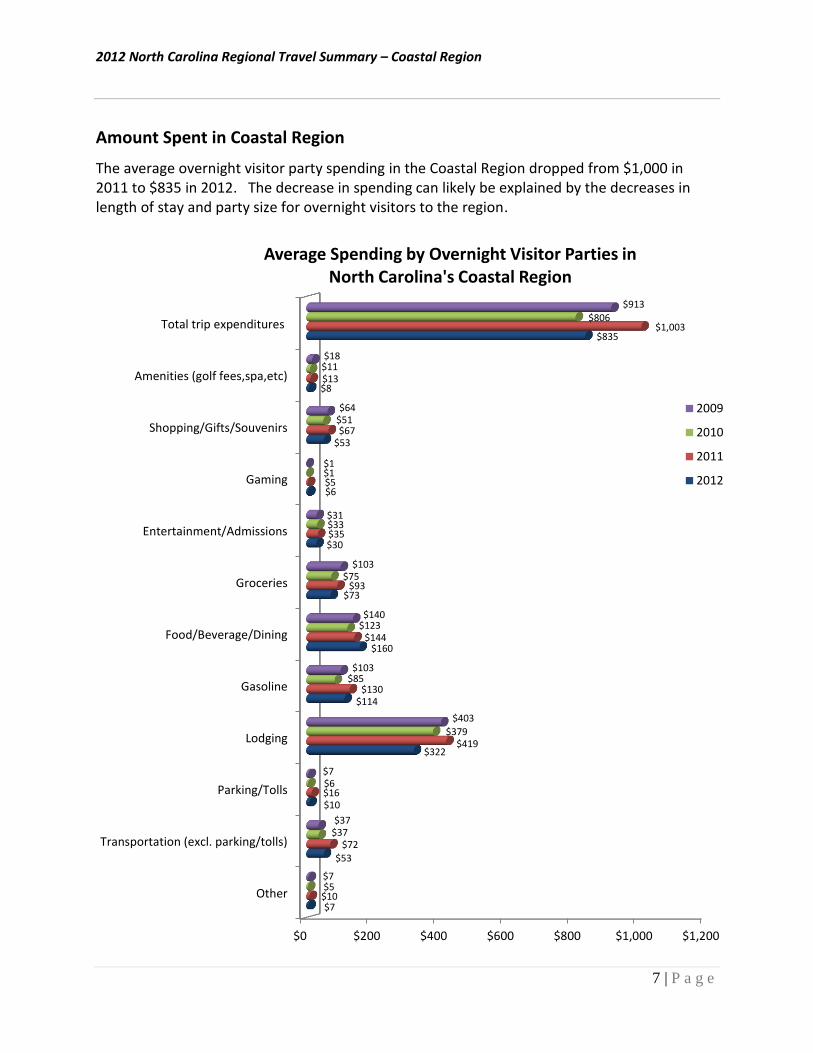
The average overnight visitor party spending in the Coastal Region dropped from $1,000 in 2011 to $835 in 2012. The decrease in spending can likely be explained by the decreases in length of stay and party size for overnight visitors to the region.
$0 $200 $400 $600 $800 $1,000 $1,200
Other
Transportation (excl. parking/tolls)
Parking/Tolls
Lodging
Gasoline
Food/Beverage/Dining
Groceries
Entertainment/Admissions
Gaming
Shopping/Gifts/Souvenirs
Amenities (golf fees,spa,etc)
Total trip expenditures
$7
$53
$10
$322
$114
$160
$73
$30
$6
$53
$8
$835
$10
$72
$16
$419
$130
$144
$93
$35
$5
$67
$13
$1,003
$5
$37
$6
$379
$85
$123
$75
$33
$1
$51
$11
$806
$7
$37
$7
$403
$103
$140
$103
$31
$1
$64
$18
$913
Average Spending by Overnight Visitor Parties in North Carolina's Coastal Region
2009
2010
2011
2012
2012 North Carolina Regional Travel Summary – Coastal Region
8 | P a g e
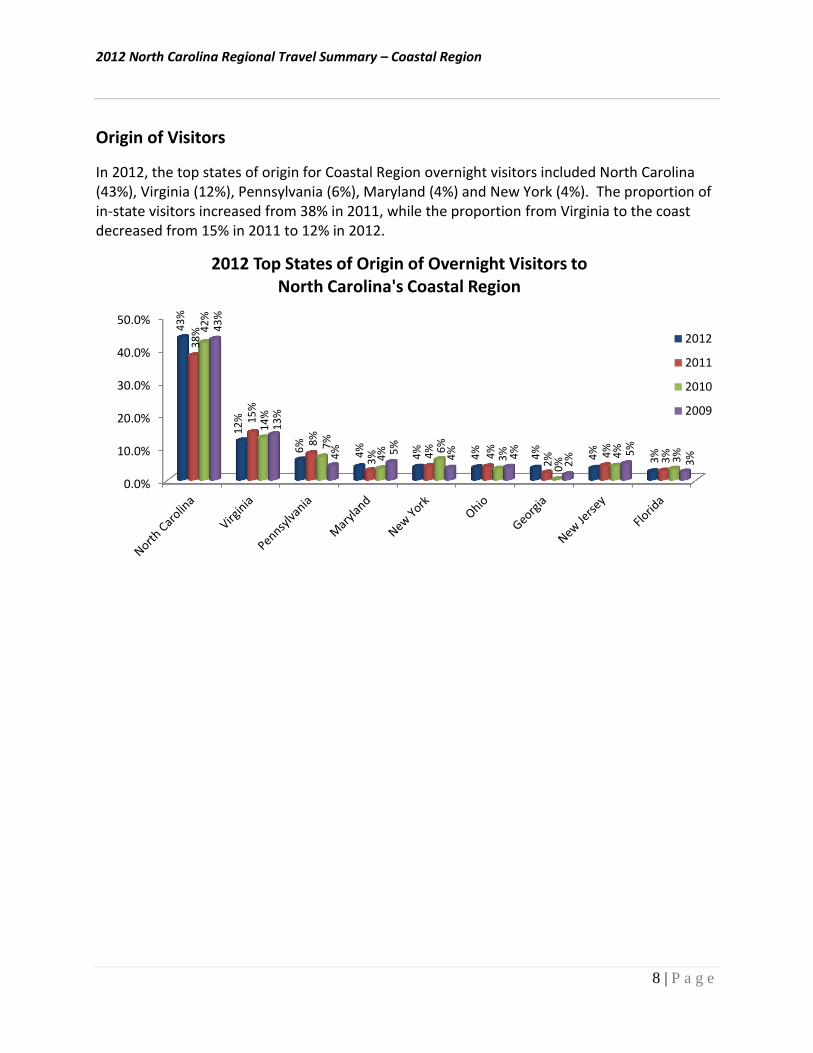
Origin of Visitors
In 2012, the top states of origin for Coastal Region overnight visitors included North Carolina (43%), Virginia (12%), Pennsylvania (6%), Maryland (4%) and New York (4%). The proportion of in-state visitors increased from 38% in 2011, while the proportion from Virginia to the coast decreased from 15% in 2011 to 12% in 2012.
0.0%
10.0%
20.0%
30.0%
40.0%
50.0%
43
%
12
%
6%
4%
4%
4%
4%
4%
3%
38
%
15
%
8%
3%
4%
4%
2%
4%
3%
42
%
13
%
7%
4%
6%
3%
0%
4%
3%
43
%
14
%
4%
5%
4%
4%
2%
5%
3%
2012 Top States of Origin of Overnight Visitors to North Carolina's Coastal Region
2012
2011
2010
2009
2012 North Carolina Regional Travel Summary – Coastal Region
9 | P a g e
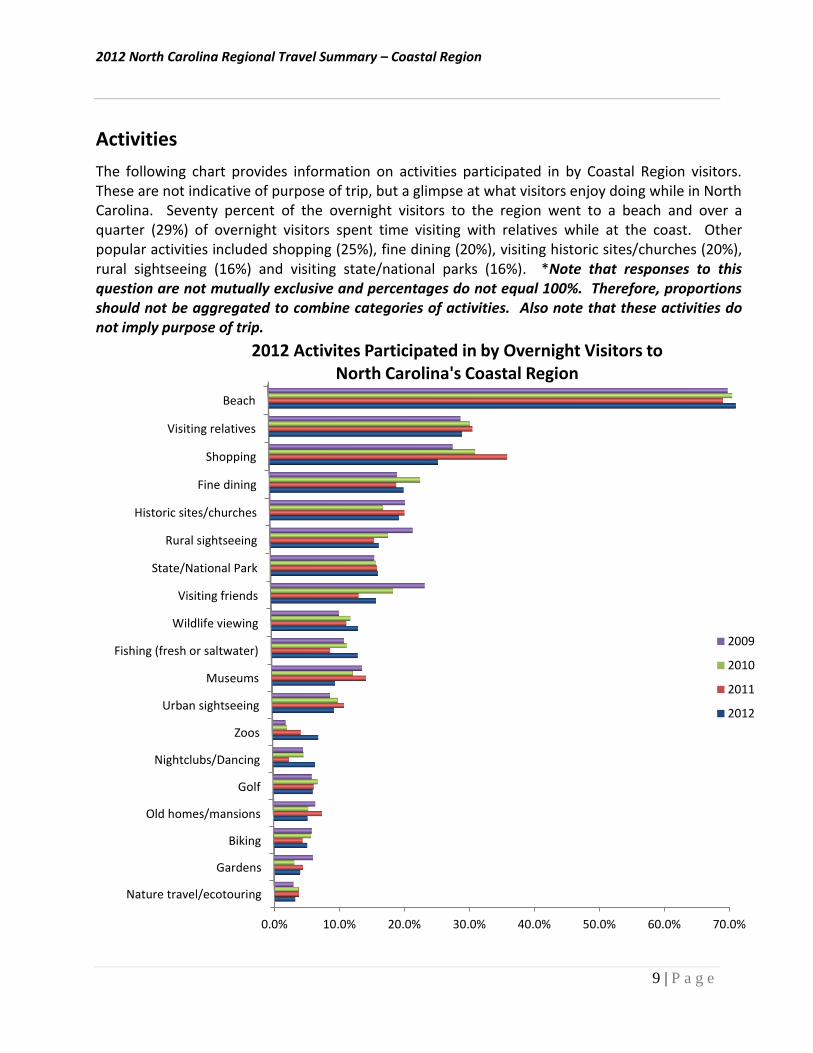
Activities
The following chart provides information on activities participated in by Coastal Region visitors. These are not indicative of purpose of trip, but a glimpse at what visitors enjoy doing while in North Carolina. Seventy percent of the overnight visitors to the region went to a beach and over a quarter (29%) of overnight visitors spent time visiting with relatives while at the coast. Other popular activities included shopping (25%), fine dining (20%), visiting historic sites/churches (20%), rural sightseeing (16%) and visiting state/national parks (16%). *Note that responses to this question are not mutually exclusive and percentages do not equal 100%. Therefore, proportions should not be aggregated to combine categories of activities. Also note that these activities do not imply purpose of trip.
0.0% 10.0% 20.0% 30.0% 40.0% 50.0% 60.0% 70.0%
Nature travel/ecotouring
Gardens
Biking
Old homes/mansions
Golf
Nightclubs/Dancing
Zoos
Urban sightseeing
Museums
Fishing (fresh or saltwater)
Wildlife viewing
Visiting friends
State/National Park
Rural sightseeing
Historic sites/churches
Fine dining
Shopping
Visiting relatives
Beach
2012 Activites Participated in by Overnight Visitors to North Carolina's Coastal Region
2009
2010
2011
2012
2012 North Carolina Regional Travel Summary – Coastal Region
10 | P a g e
Demographic Profile of North Carolina Coastal Region Overnight Visitors The North Carolina Coastal Region overnight visitor gender breakdown is fifty-six percent female and forty-four percent male. More than half (63%) of the visitors are married and just nineteen percent of the region’s visitors are divorced, widowed or separated. The largest proportion of North Carolina coastal region overnight visitors classifies themselves as white (93%), and four percent classify themselves as black/African American. Two-thirds (66%) of Coastal Region overnight visitor parties have a household head with a college degree or higher. The average Coastal region visitor is 45 years old, with almost one-half (48%) being 45 years old or older. Over forty percent (45%) of the visitor parties that traveled to North Carolina’s Coastal Region in 2012 had a household income $75,000 or over. Eleven percent had a household income of over $125,000.
2012 North Carolina Regional Travel Summary – Coastal Region
11 | P a g e
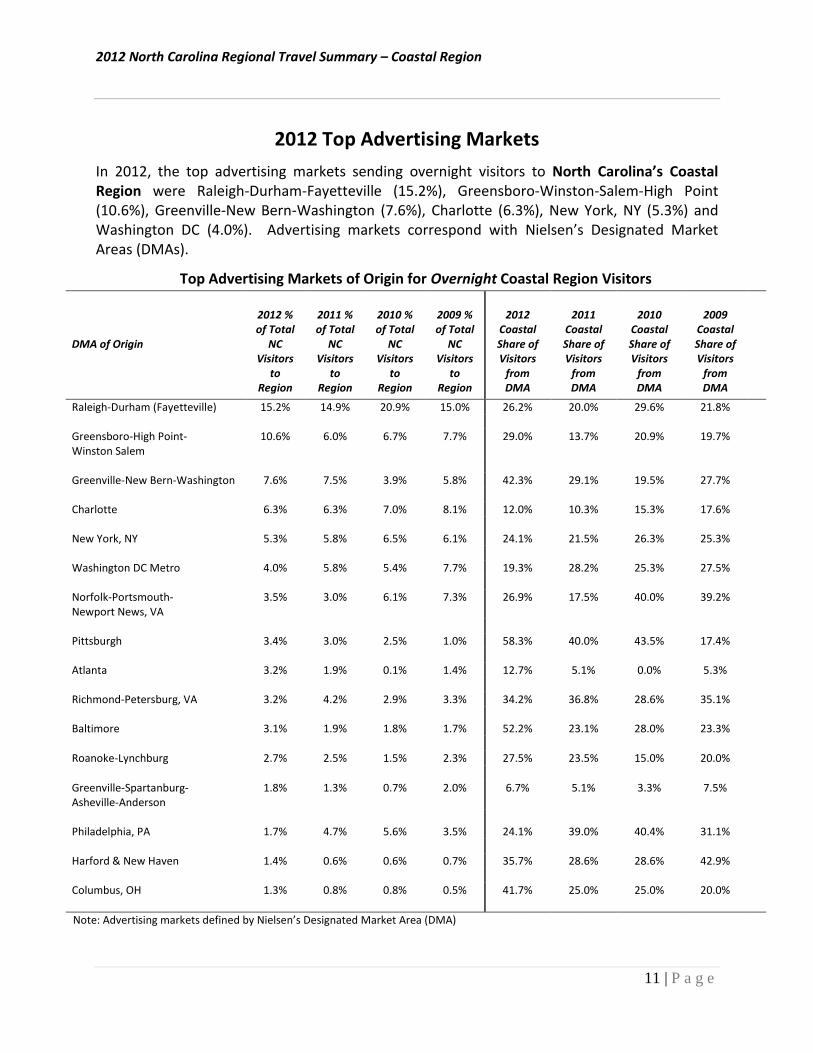
2012 Top Advertising Markets
In 2012, the top advertising markets sending overnight visitors to North Carolina’s Coastal Region were Raleigh-Durham-Fayetteville (15.2%), Greensboro-Winston-Salem-High Point (10.6%), Greenville-New Bern-Washington (7.6%), Charlotte (6.3%), New York, NY (5.3%) and Washington DC (4.0%). Advertising markets correspond with Nielsen’s Designated Market Areas (DMAs).
Top Advertising Markets of Origin for Overnight Coastal Region Visitors
DMA of Origin
2012 % of Total
NC Visitors
to Region
2011 % of Total
NC Visitors
to Region
2010 % of Total
NC Visitors
to Region
2009 % of Total
NC Visitors
to Region
2012 Coastal Share of Visitors
from DMA
2011 Coastal Share of Visitors
from DMA
2010 Coastal Share of Visitors
from DMA
2009 Coastal Share of Visitors
from DMA
Raleigh-Durham (Fayetteville) 15.2% 14.9% 20.9% 15.0% 26.2% 20.0% 29.6% 21.8% Greensboro-High Point- Winston Salem
10.6% 6.0% 6.7% 7.7% 29.0% 13.7% 20.9% 19.7%
Greenville-New Bern-Washington 7.6% 7.5% 3.9% 5.8% 42.3% 29.1% 19.5% 27.7% Charlotte 6.3% 6.3% 7.0% 8.1% 12.0% 10.3% 15.3% 17.6% New York, NY 5.3% 5.8% 6.5% 6.1% 24.1% 21.5% 26.3% 25.3% Washington DC Metro 4.0% 5.8% 5.4% 7.7% 19.3% 28.2% 25.3% 27.5% Norfolk-Portsmouth- Newport News, VA
3.5% 3.0% 6.1% 7.3% 26.9% 17.5% 40.0% 39.2%
Pittsburgh 3.4% 3.0% 2.5% 1.0% 58.3% 40.0% 43.5% 17.4% Atlanta 3.2% 1.9% 0.1% 1.4% 12.7% 5.1% 0.0% 5.3% Richmond-Petersburg, VA 3.2% 4.2% 2.9% 3.3% 34.2% 36.8% 28.6% 35.1% Baltimore 3.1% 1.9% 1.8% 1.7% 52.2% 23.1% 28.0% 23.3% Roanoke-Lynchburg 2.7% 2.5% 1.5% 2.3% 27.5% 23.5% 15.0% 20.0%
Greenville-Spartanburg- Asheville-Anderson
1.8% 1.3% 0.7% 2.0% 6.7% 5.1% 3.3% 7.5%
Philadelphia, PA 1.7% 4.7% 5.6% 3.5% 24.1% 39.0% 40.4% 31.1% Harford & New Haven 1.4% 0.6% 0.6% 0.7% 35.7% 28.6% 28.6% 42.9% Columbus, OH 1.3% 0.8% 0.8% 0.5% 41.7% 25.0% 25.0% 20.0%
Note: Advertising markets defined by Nielsen’s Designated Market Area (DMA)
2012 North Carolina Regional Travel Summary – Coastal Region vs. North Carolina
12 | P a g e
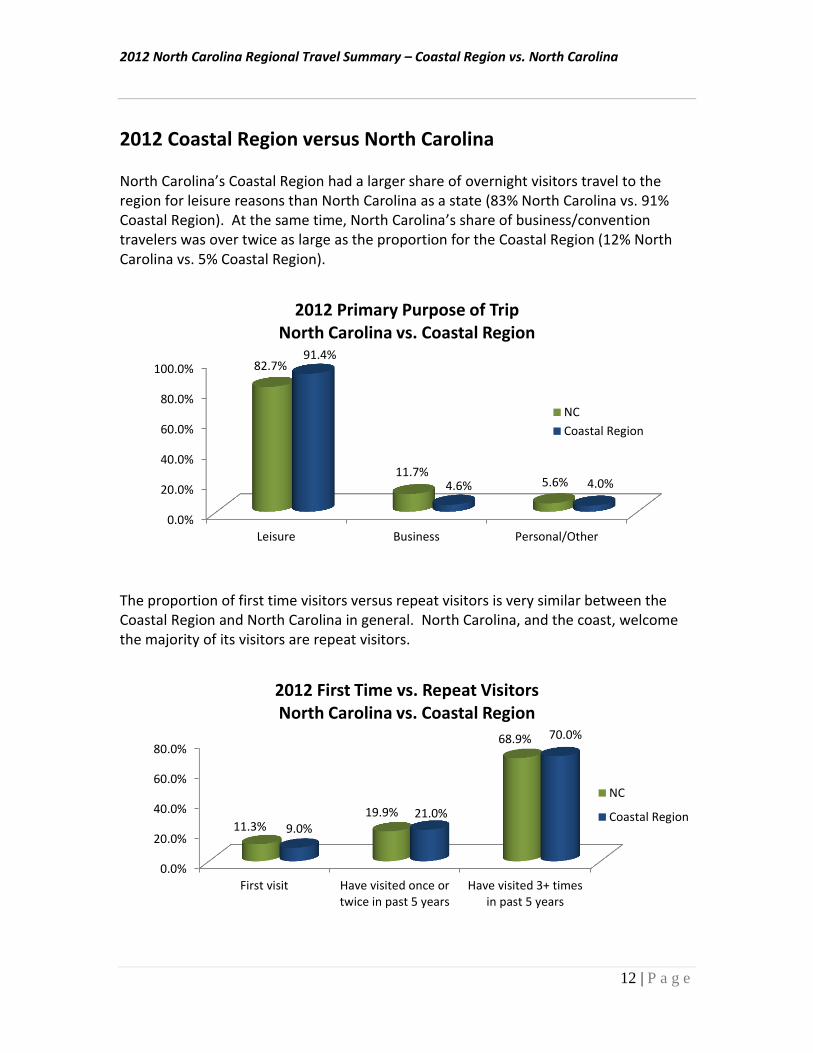
2012 Coastal Region versus North Carolina North Carolina’s Coastal Region had a larger share of overnight visitors travel to the region for leisure reasons than North Carolina as a state (83% North Carolina vs. 91% Coastal Region). At the same time, North Carolina’s share of business/convention travelers was over twice as large as the proportion for the Coastal Region (12% North Carolina vs. 5% Coastal Region).
The proportion of first time visitors versus repeat visitors is very similar between the Coastal Region and North Carolina in general. North Carolina, and the coast, welcome the majority of its visitors are repeat visitors.
0.0%
20.0%
40.0%
60.0%
80.0%
100.0%
Leisure Business Personal/Other
82.7%
11.7% 5.6%
91.4%
4.6% 4.0%
2012 Primary Purpose of Trip North Carolina vs. Coastal Region
NC
Coastal Region
0.0%
20.0%
40.0%
60.0%
80.0%
First visit Have visited once ortwice in past 5 years
Have visited 3+ timesin past 5 years
11.3% 19.9%
68.9%
9.0% 21.0%
70.0%
2012 First Time vs. Repeat Visitors North Carolina vs. Coastal Region
NC
Coastal Region
2012 North Carolina Regional Travel Summary – Coastal Region vs. North Carolina
13 | P a g e
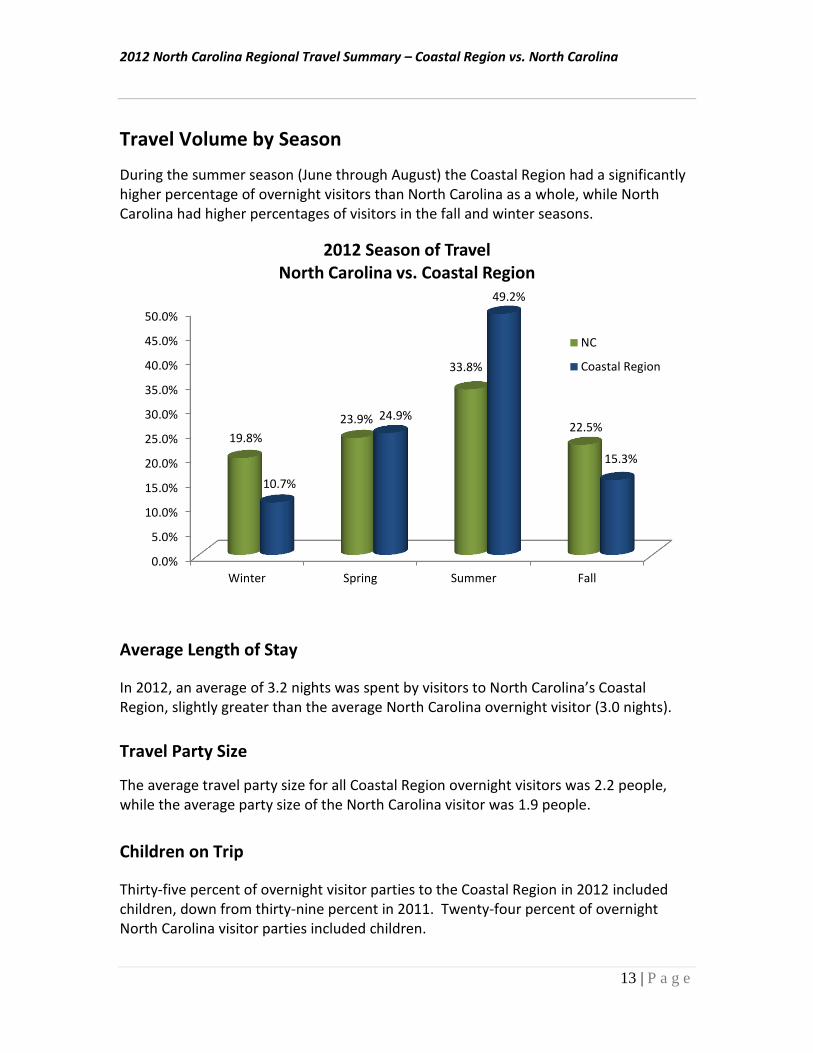
Travel Volume by Season
During the summer season (June through August) the Coastal Region had a significantly higher percentage of overnight visitors than North Carolina as a whole, while North Carolina had higher percentages of visitors in the fall and winter seasons.
Average Length of Stay
In 2012, an average of 3.2 nights was spent by visitors to North Carolina’s Coastal Region, slightly greater than the average North Carolina overnight visitor (3.0 nights).
Travel Party Size
The average travel party size for all Coastal Region overnight visitors was 2.2 people, while the average party size of the North Carolina visitor was 1.9 people.
Children on Trip
Thirty-five percent of overnight visitor parties to the Coastal Region in 2012 included children, down from thirty-nine percent in 2011. Twenty-four percent of overnight North Carolina visitor parties included children.
0.0%
5.0%
10.0%
15.0%
20.0%
25.0%
30.0%
35.0%
40.0%
45.0%
50.0%
Winter Spring Summer Fall
19.8%
23.9%
33.8%
22.5%
10.7%
24.9%
49.2%
15.3%
2012 Season of Travel North Carolina vs. Coastal Region
NC
Coastal Region
2012 North Carolina Regional Travel Summary – Coastal Region vs. North Carolina
14 | P a g e
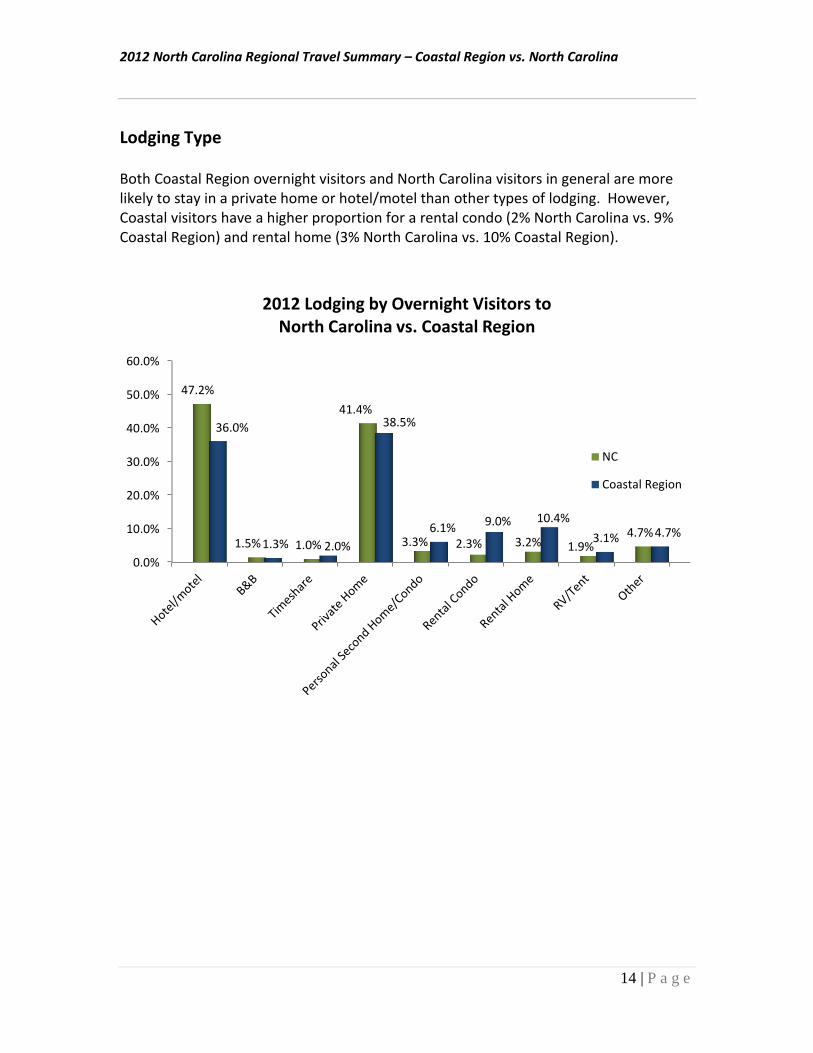
Lodging Type
Both Coastal Region overnight visitors and North Carolina visitors in general are more likely to stay in a private home or hotel/motel than other types of lodging. However, Coastal visitors have a higher proportion for a rental condo (2% North Carolina vs. 9% Coastal Region) and rental home (3% North Carolina vs. 10% Coastal Region).
0.0%
10.0%
20.0%
30.0%
40.0%
50.0%
60.0%
47.2%
1.5% 1.0%
41.4%
3.3% 2.3% 3.2% 1.9% 4.7%
36.0%
1.3% 2.0%
38.5%
6.1% 9.0% 10.4%
3.1% 4.7%
2012 Lodging by Overnight Visitors to North Carolina vs. Coastal Region
NC
Coastal Region
2012 North Carolina Regional Travel Summary – Coastal Region vs. North Carolina
15 | P a g e
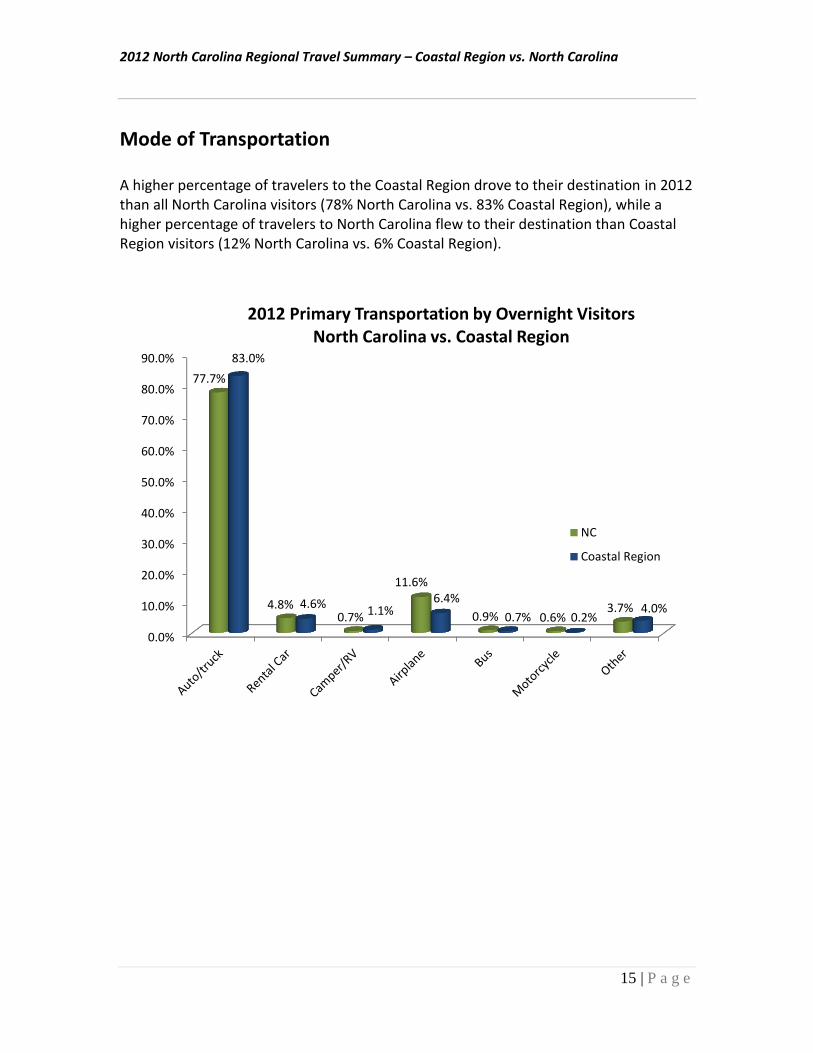
Mode of Transportation A higher percentage of travelers to the Coastal Region drove to their destination in 2012 than all North Carolina visitors (78% North Carolina vs. 83% Coastal Region), while a higher percentage of travelers to North Carolina flew to their destination than Coastal Region visitors (12% North Carolina vs. 6% Coastal Region).
0.0%
10.0%
20.0%
30.0%
40.0%
50.0%
60.0%
70.0%
80.0%
90.0%
77.7%
4.8% 0.7%
11.6%
0.9% 0.6% 3.7%
83.0%
4.6% 1.1%
6.4%
0.7% 0.2% 4.0%
2012 Primary Transportation by Overnight Visitors North Carolina vs. Coastal Region
NC
Coastal Region
2012 North Carolina Regional Travel Summary – Coastal Region vs. North Carolina
16 | P a g e
Amount Spent in Coastal Region
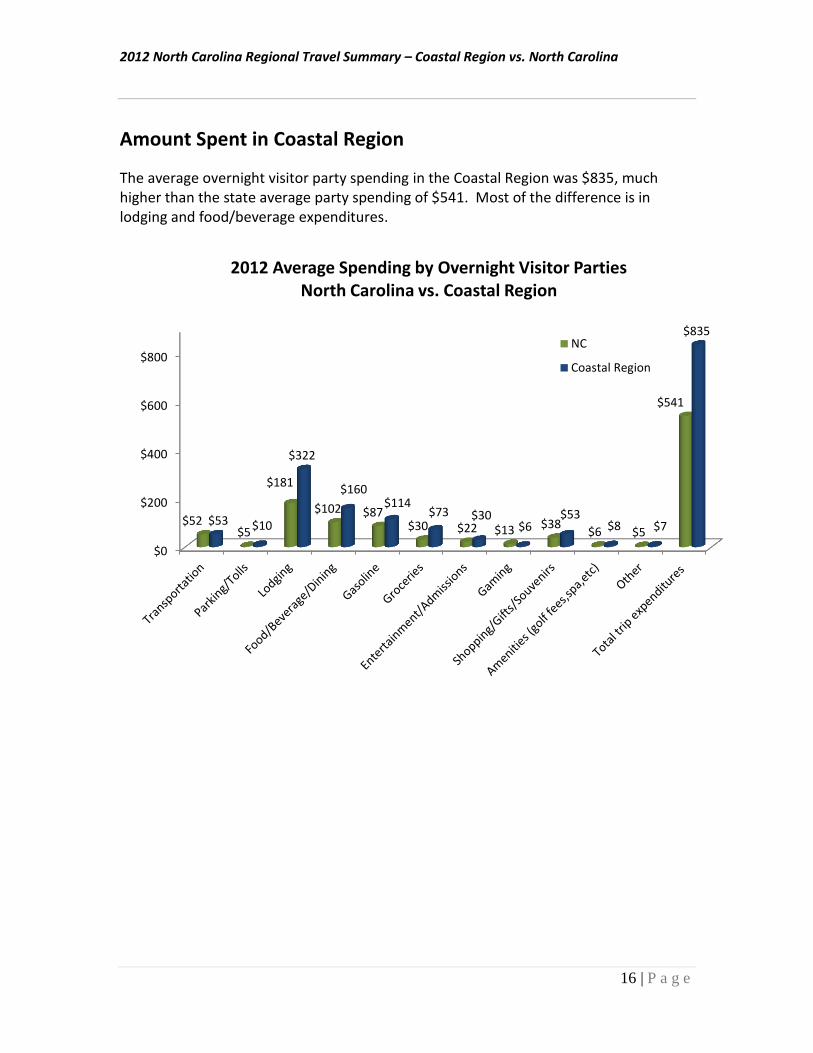
The average overnight visitor party spending in the Coastal Region was $835, much higher than the state average party spending of $541. Most of the difference is in lodging and food/beverage expenditures.
$0
$200
$400
$600
$800
$52 $5
$181
$102 $87 $30 $22 $13 $38
$6 $5
$541
$53 $10
$322
$160 $114
$73 $30 $6
$53 $8 $7
$835
2012 Average Spending by Overnight Visitor Parties North Carolina vs. Coastal Region
NC
Coastal Region
2012 North Carolina Regional Travel Summary – Coastal Region vs. North Carolina
17 | P a g e
Origin of Overnight Visitors
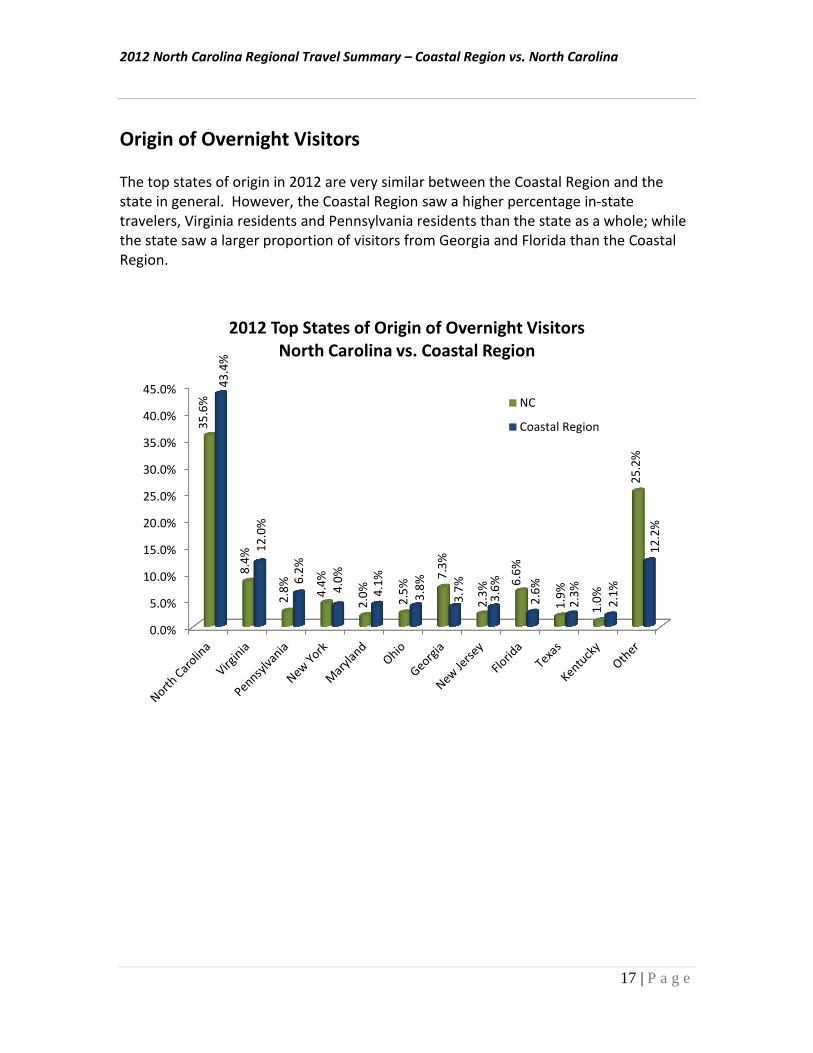
The top states of origin in 2012 are very similar between the Coastal Region and the state in general. However, the Coastal Region saw a higher percentage in-state travelers, Virginia residents and Pennsylvania residents than the state as a whole; while the state saw a larger proportion of visitors from Georgia and Florida than the Coastal Region.
0.0%
5.0%
10.0%
15.0%
20.0%
25.0%
30.0%
35.0%
40.0%
45.0%
35
.6%
8.4
%
2.8
%
4.4
%
2.0
%
2.5
% 7
.3%
2.3
% 6.6
%
1.9
%
1.0
%
25
.2%
43
.4%
12
.0%
6.2
%
4.0
%
4.1
%
3.8
%
3.7
%
3.6
%
2.6
%
2.3
%
2.1
%
12
.2%
2012 Top States of Origin of Overnight Visitors North Carolina vs. Coastal Region
NC
Coastal Region
2012 North Carolina Regional Travel Summary – Coastal Region vs. North Carolina
18 | P a g e
Trip Planning
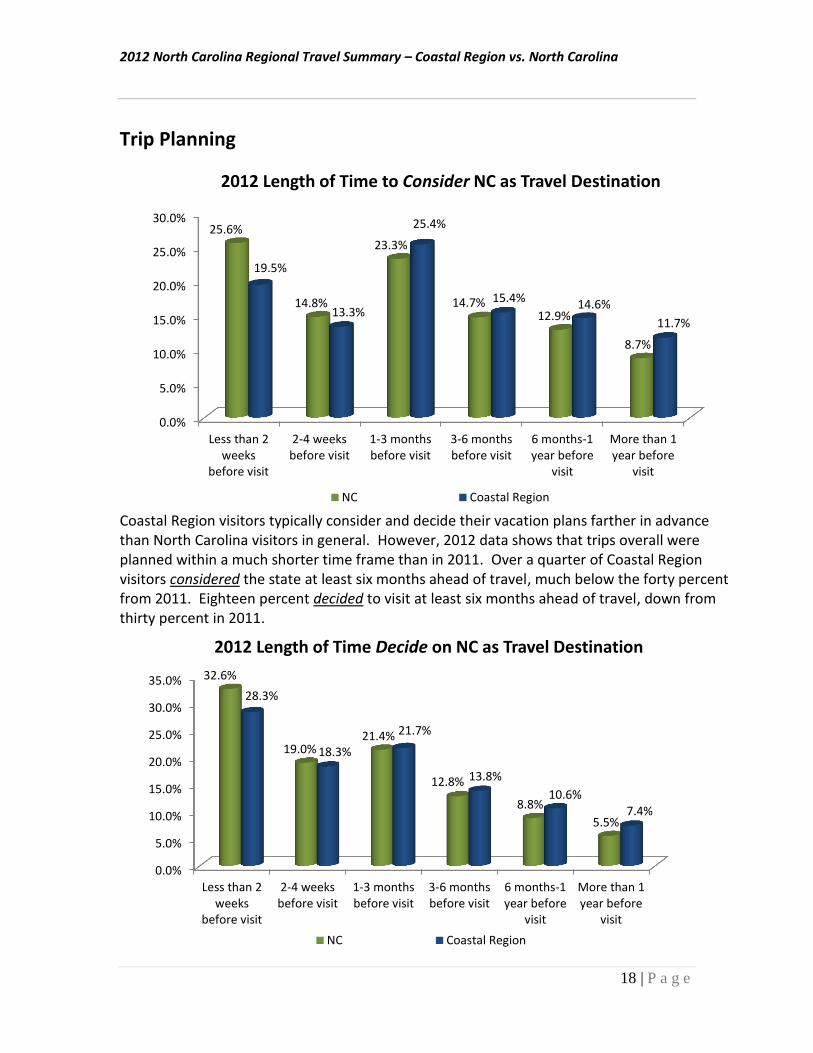
Coastal Region visitors typically consider and decide their vacation plans farther in advance than North Carolina visitors in general. However, 2012 data shows that trips overall were planned within a much shorter time frame than in 2011. Over a quarter of Coastal Region visitors considered the state at least six months ahead of travel, much below the forty percent from 2011. Eighteen percent decided to visit at least six months ahead of travel, down from thirty percent in 2011.
0.0%
5.0%
10.0%
15.0%
20.0%
25.0%
30.0%
Less than 2weeks
before visit
2-4 weeksbefore visit
1-3 monthsbefore visit
3-6 monthsbefore visit
6 months-1year before
visit
More than 1year before
visit
25.6%
14.8%
23.3%
14.7% 12.9%
8.7%
19.5%
13.3%
25.4%
15.4% 14.6%
11.7%
2012 Length of Time to Consider NC as Travel Destination
NC Coastal Region
0.0%
5.0%
10.0%
15.0%
20.0%
25.0%
30.0%
35.0%
Less than 2weeks
before visit
2-4 weeksbefore visit
1-3 monthsbefore visit
3-6 monthsbefore visit
6 months-1year before
visit
More than 1year before
visit
32.6%
19.0% 21.4%
12.8%
8.8%
5.5%
28.3%
18.3%
21.7%
13.8%
10.6% 7.4%
2012 Length of Time Decide on NC as Travel Destination
NC Coastal Region
2012 North Carolina Regional Travel Summary – Coastal Region vs. North Carolina
19 | P a g e
Activities
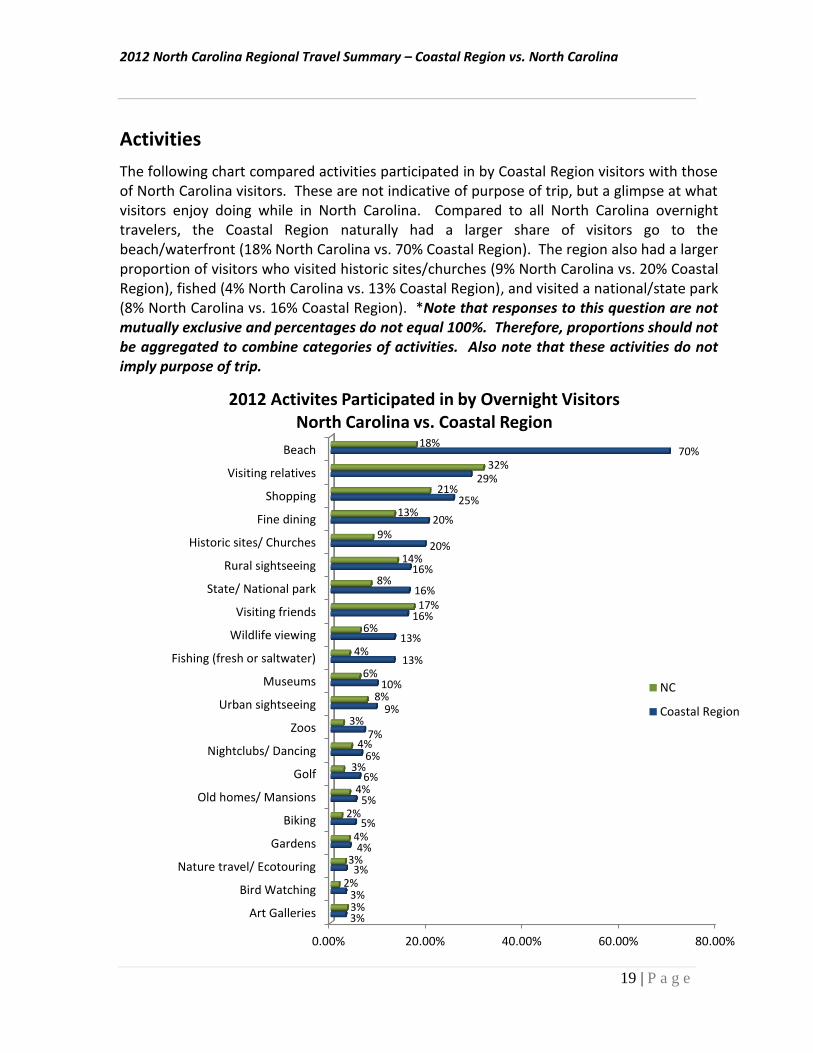
The following chart compared activities participated in by Coastal Region visitors with those of North Carolina visitors. These are not indicative of purpose of trip, but a glimpse at what visitors enjoy doing while in North Carolina. Compared to all North Carolina overnight travelers, the Coastal Region naturally had a larger share of visitors go to the beach/waterfront (18% North Carolina vs. 70% Coastal Region). The region also had a larger proportion of visitors who visited historic sites/churches (9% North Carolina vs. 20% Coastal Region), fished (4% North Carolina vs. 13% Coastal Region), and visited a national/state park (8% North Carolina vs. 16% Coastal Region). *Note that responses to this question are not mutually exclusive and percentages do not equal 100%. Therefore, proportions should not be aggregated to combine categories of activities. Also note that these activities do not imply purpose of trip.
0.00% 20.00% 40.00% 60.00% 80.00%
Art Galleries
Bird Watching
Nature travel/ Ecotouring
Gardens
Biking
Old homes/ Mansions
Golf
Nightclubs/ Dancing
Zoos
Urban sightseeing
Museums
Fishing (fresh or saltwater)
Wildlife viewing
Visiting friends
State/ National park
Rural sightseeing
Historic sites/ Churches
Fine dining
Shopping
Visiting relatives
Beach
3%
3%
3%
4%
5%
5%
6%
6%
7%
9%
10%
13%
13%
16%
16%
16%
20%
20%
25%
29%
70%
3%
2%
3%
4%
2%
4%
3%
4%
3%
8%
6%
4%
6%
17%
8%
14%
9%
13%
21%
32%
18%
2012 Activites Participated in by Overnight Visitors North Carolina vs. Coastal Region
NC
Coastal Region
2012 North Carolina Regional Travel Summary – Coastal Region vs. North Carolina
20 | P a g e
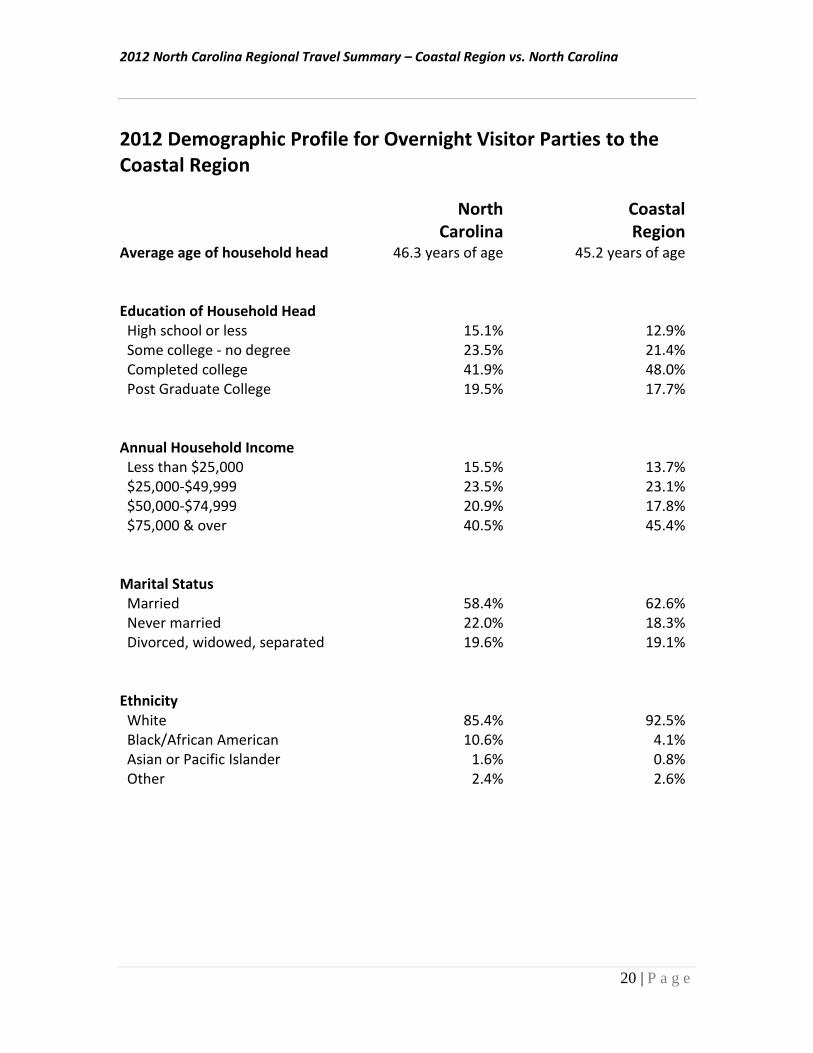
2012 Demographic Profile for Overnight Visitor Parties to the Coastal Region
North Carolina
Coastal Region
Average age of household head 46.3 years of age 45.2 years of age
Education of Household Head High school or less 15.1% 12.9% Some college - no degree 23.5% 21.4% Completed college 41.9% 48.0% Post Graduate College 19.5% 17.7%
Annual Household Income Less than $25,000 15.5% 13.7% $25,000-$49,999 23.5% 23.1% $50,000-$74,999 20.9% 17.8% $75,000 & over 40.5% 45.4%
Marital Status Married 58.4% 62.6% Never married 22.0% 18.3% Divorced, widowed, separated 19.6% 19.1% Ethnicity White 85.4% 92.5% Black/African American 10.6% 4.1% Asian or Pacific Islander 1.6% 0.8% Other 2.4% 2.6%
2012 North Carolina Regional Travel Summary – Coastal Region vs. North Carolina
21 | P a g e
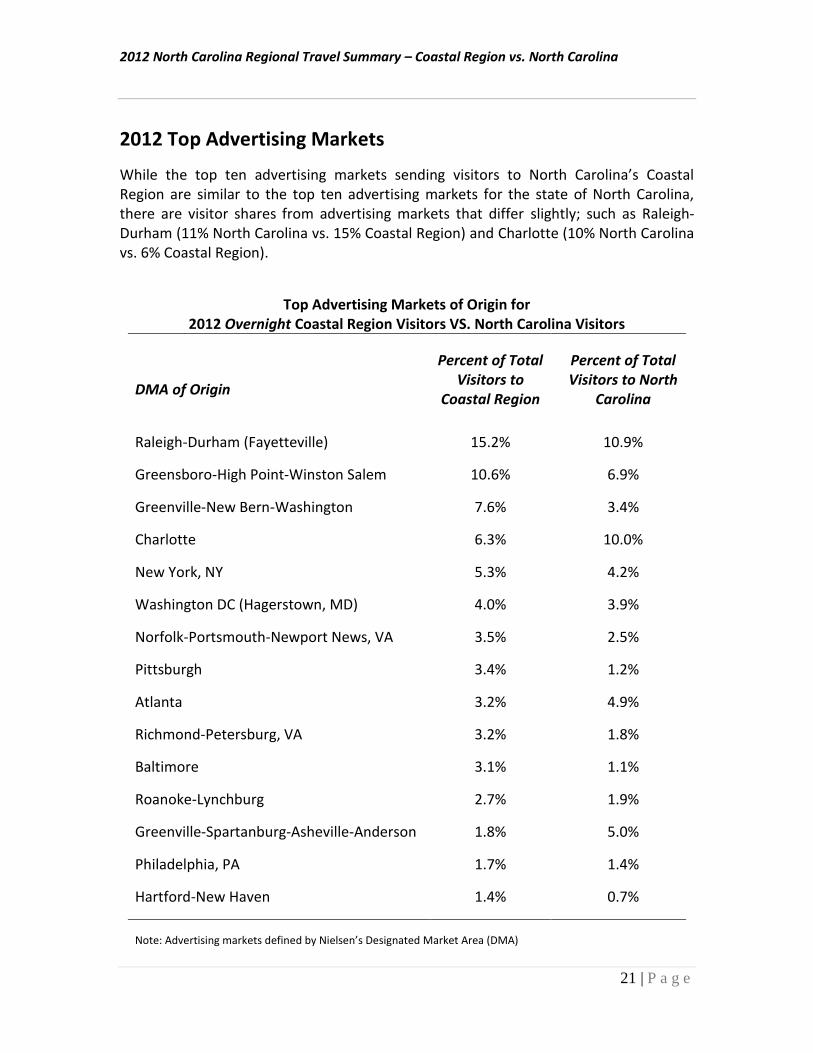
2012 Top Advertising Markets
While the top ten advertising markets sending visitors to North Carolina’s Coastal Region are similar to the top ten advertising markets for the state of North Carolina, there are visitor shares from advertising markets that differ slightly; such as Raleigh-Durham (11% North Carolina vs. 15% Coastal Region) and Charlotte (10% North Carolina vs. 6% Coastal Region).
Top Advertising Markets of Origin for
2012 Overnight Coastal Region Visitors VS. North Carolina Visitors
DMA of Origin
Percent of Total Visitors to
Coastal Region
Percent of Total Visitors to North
Carolina
Raleigh-Durham (Fayetteville) 15.2% 10.9%
Greensboro-High Point-Winston Salem 10.6% 6.9%
Greenville-New Bern-Washington 7.6% 3.4%
Charlotte 6.3% 10.0%
New York, NY 5.3% 4.2%
Washington DC (Hagerstown, MD) 4.0% 3.9%
Norfolk-Portsmouth-Newport News, VA 3.5% 2.5%
Pittsburgh 3.4% 1.2%
Atlanta 3.2% 4.9%
Richmond-Petersburg, VA 3.2% 1.8%
Baltimore 3.1% 1.1%
Roanoke-Lynchburg 2.7% 1.9%
Greenville-Spartanburg-Asheville-Anderson 1.8% 5.0%
Philadelphia, PA 1.7% 1.4%
Hartford-New Haven 1.4% 0.7%
Note: Advertising markets defined by Nielsen’s Designated Market Area (DMA)
2012 North Carolina Regional Travel Summary – Piedmont Region
- 22 - | P a g e
2012 Domestic Piedmont Region Travel
Summary
In 2012, fifty-eight percent of North Carolina visitors traveled to North Carolina’s Piedmont Region, approximately 26.1 million person-trips. For marketing purposes, the Piedmont Region is made up of the 49 most central counties of North Carolina.
Seventy-four percent of all domestic visitors came to the Piedmont Region for pleasure purposes, while sixteen percent of visitors came to conduct business (includes meeting/convention). The remainder visited for personal business or “other” reasons.
Travel to the Piedmont Region of North Carolina was fairly consistent throughout the seasons. However, the spring (March - May) had a slightly higher proportion of visitors, with twenty-nine percent of all 2012 piedmont visitors. Summer (June - August) followed with twenty-five percent of piedmont visitors, followed by fall (September - November) with twenty-four percent and winter (December - February) with twenty-two percent. March was the single largest month for piedmont travel with eleven percent.
Overnight visitors to the Piedmont Region spent an average of 3.1 nights in the region. This was down from 3.4 nights in 2011.
Forty-seven percent of Piedmont Region visitors stayed in a private home while fifty-three percent of visitors lodged in a hotel/motel.
The average travel party size for all Piedmont Region visitors was 1.9 people. Twenty-two percent of travel parties to the region included children in the party.
Seventy-seven percent of all overnight travelers to the Piedmont Region drove (includes personal automobile, rental, and motorcycle), while eighteen percent traveled by air.
In 2012, the average household trip expenditure in the Piedmont Region was $426. The average household trip expenditure for overnight visitors to the Piedmont Region was $531. Daytrip parties to the Piedmont region spent approximately $153 per visit in 2012.
The top states of origin of overnight visitors to the Piedmont Region in 2012 were North Carolina (30.1%), Virginia (9.8%), South Carolina (7.8%), Florida (6.4%), New York (6.2%) and Georgia (5.9%).
Fifty-seven percent of the households that traveled to North Carolina’s Piedmont Region in 2012 had a household income over $50,000.
In 2012, Raleigh/Durham/Fayetteville (9.3%), was the top advertising market of origin for overnight travelers to the Piedmont Region, followed by Charlotte (9.0%), Greensboro/High Point/Winston-Salem (5.1%), New York (4.9%), Greenville-Spartanburg-Asheville-Anderson (4.2%), Washington DC (4.0%) and Atlanta (3.5%).
2012 North Carolina Regional Travel Summary – Piedmont Region
- 23 - | P a g e
Piedmont Region Overnight Visitor Profile
Main Purpose of Visit
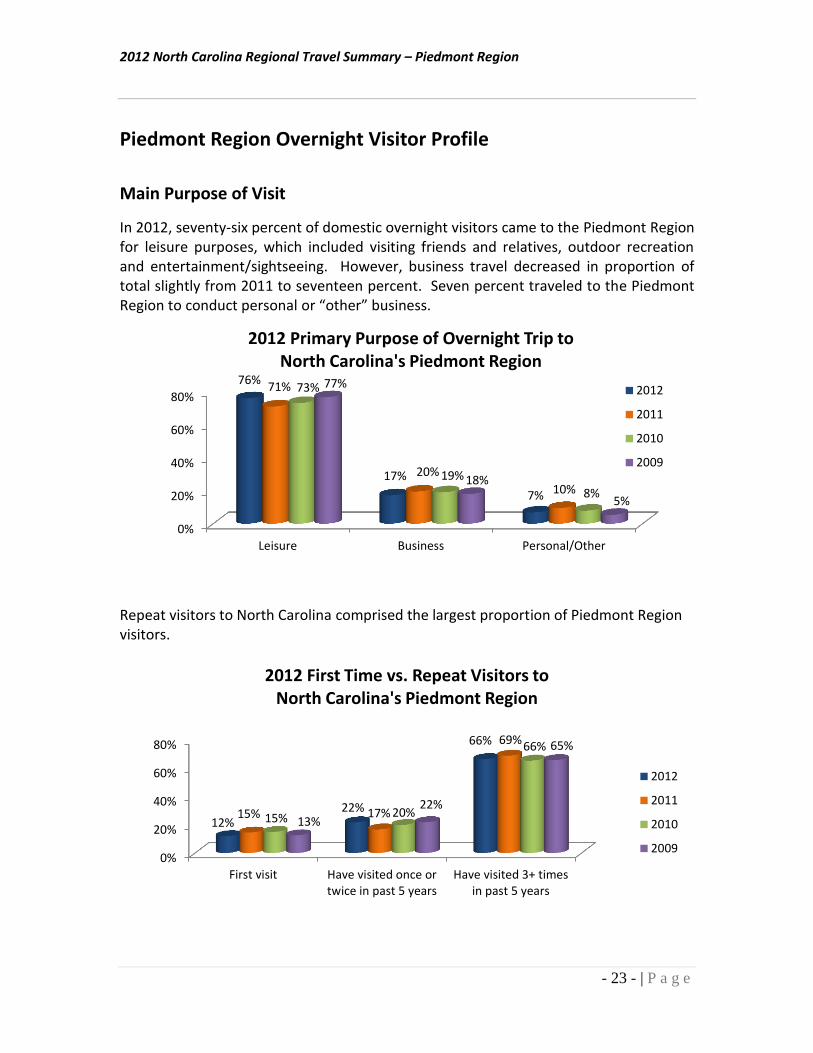
In 2012, seventy-six percent of domestic overnight visitors came to the Piedmont Region for leisure purposes, which included visiting friends and relatives, outdoor recreation and entertainment/sightseeing. However, business travel decreased in proportion of total slightly from 2011 to seventeen percent. Seven percent traveled to the Piedmont Region to conduct personal or “other” business.
Repeat visitors to North Carolina comprised the largest proportion of Piedmont Region visitors.
0%
20%
40%
60%
80%
Leisure Business Personal/Other
76%
17%
7%
71%
20%
10%
73%
19%
8%
77%
18%
5%
2012 Primary Purpose of Overnight Trip to North Carolina's Piedmont Region
2012
2011
2010
2009
0%
20%
40%
60%
80%
First visit Have visited once ortwice in past 5 years
Have visited 3+ timesin past 5 years
12% 22%
66%
15% 17%
69%
15% 20%
65%
13%
22%
66%
2012 First Time vs. Repeat Visitors to North Carolina's Piedmont Region
2012
2011
2010
2009
2012 North Carolina Regional Travel Summary – Piedmont Region
- 24 - | P a g e
Travel Volume by Season
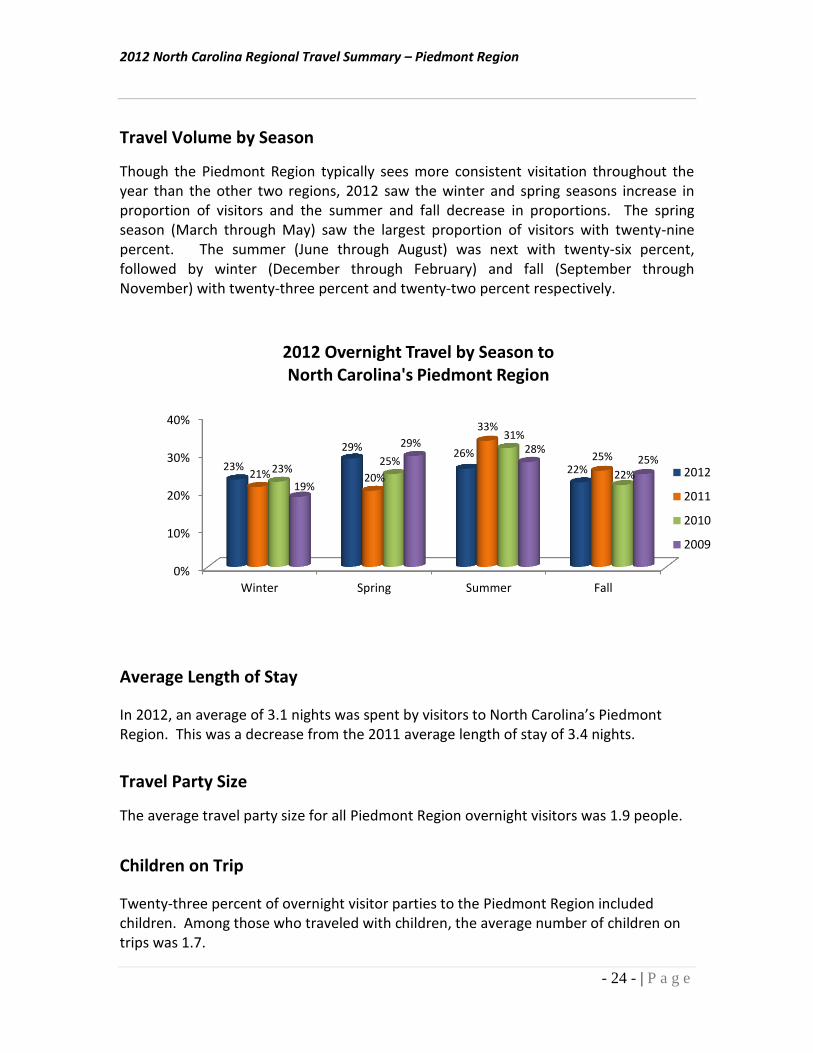
Though the Piedmont Region typically sees more consistent visitation throughout the year than the other two regions, 2012 saw the winter and spring seasons increase in proportion of visitors and the summer and fall decrease in proportions. The spring season (March through May) saw the largest proportion of visitors with twenty-nine percent. The summer (June through August) was next with twenty-six percent, followed by winter (December through February) and fall (September through November) with twenty-three percent and twenty-two percent respectively.
Average Length of Stay
In 2012, an average of 3.1 nights was spent by visitors to North Carolina’s Piedmont Region. This was a decrease from the 2011 average length of stay of 3.4 nights.
Travel Party Size
The average travel party size for all Piedmont Region overnight visitors was 1.9 people.
Children on Trip
Twenty-three percent of overnight visitor parties to the Piedmont Region included children. Among those who traveled with children, the average number of children on trips was 1.7.
0%
10%
20%
30%
40%
Winter Spring Summer Fall
23%
29% 26%
22% 21% 20%
33%
25% 23%
25%
31%
22% 19%
29% 28%
25%
2012 Overnight Travel by Season to North Carolina's Piedmont Region
2012
2011
2010
2009
2012 North Carolina Regional Travel Summary – Piedmont Region
- 25 - | P a g e
Lodging Used in Piedmont Region
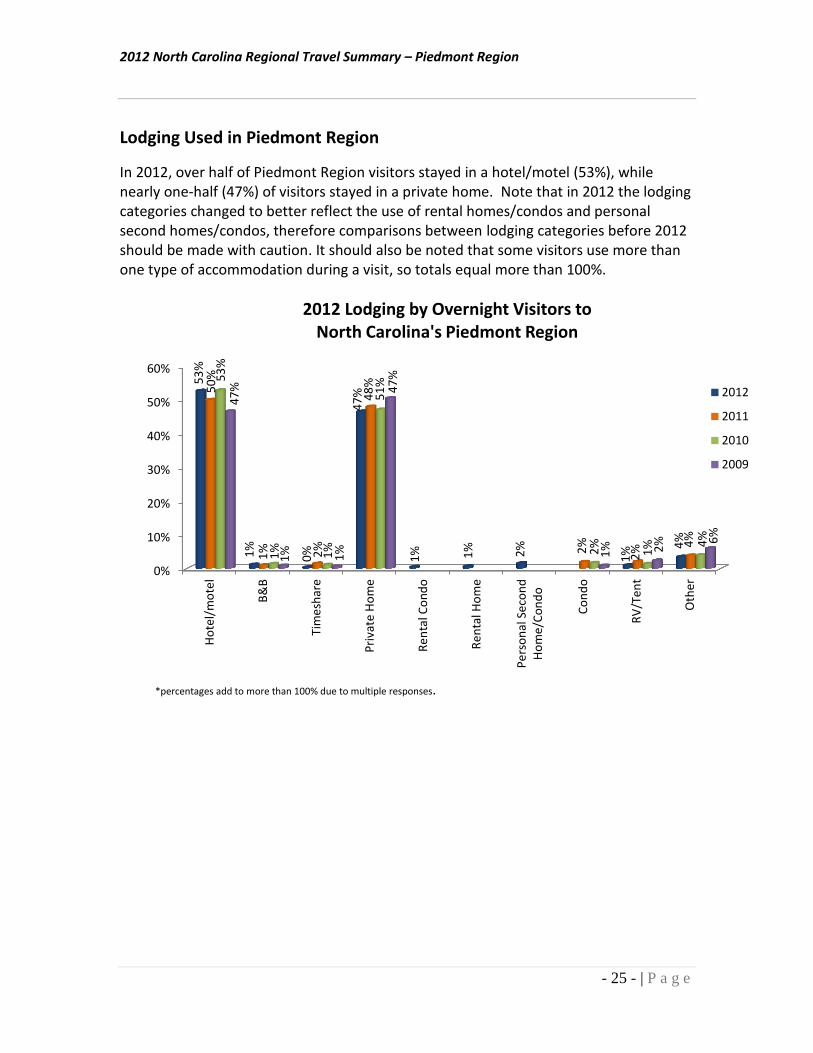
In 2012, over half of Piedmont Region visitors stayed in a hotel/motel (53%), while nearly one-half (47%) of visitors stayed in a private home. Note that in 2012 the lodging categories changed to better reflect the use of rental homes/condos and personal second homes/condos, therefore comparisons between lodging categories before 2012 should be made with caution. It should also be noted that some visitors use more than one type of accommodation during a visit, so totals equal more than 100%.
0%
10%
20%
30%
40%
50%
60%
Ho
tel/
mo
tel
B&
B
Tim
esh
are
Pri
vate
Ho
me
Re
nta
l Co
nd
o
Re
nta
l Ho
me
Pe
rso
nal
Se
con
dH
om
e/C
on
do
Co
nd
o
RV
/Te
nt
Oth
er
53
%
1%
0%
47
%
1%
1%
2%
1%
4%
50
%
1%
2%
48
%
2%
2%
4%
53
%
1%
1%
47
%
2%
1%
4%
47
%
1%
1%
51
%
1%
2%
6%
2012 Lodging by Overnight Visitors to North Carolina's Piedmont Region
2012
2011
2010
2009
*percentages add to more than 100% due to multiple responses.
2012 North Carolina Regional Travel Summary – Piedmont Region
- 26 - | P a g e
Mode of Transportation
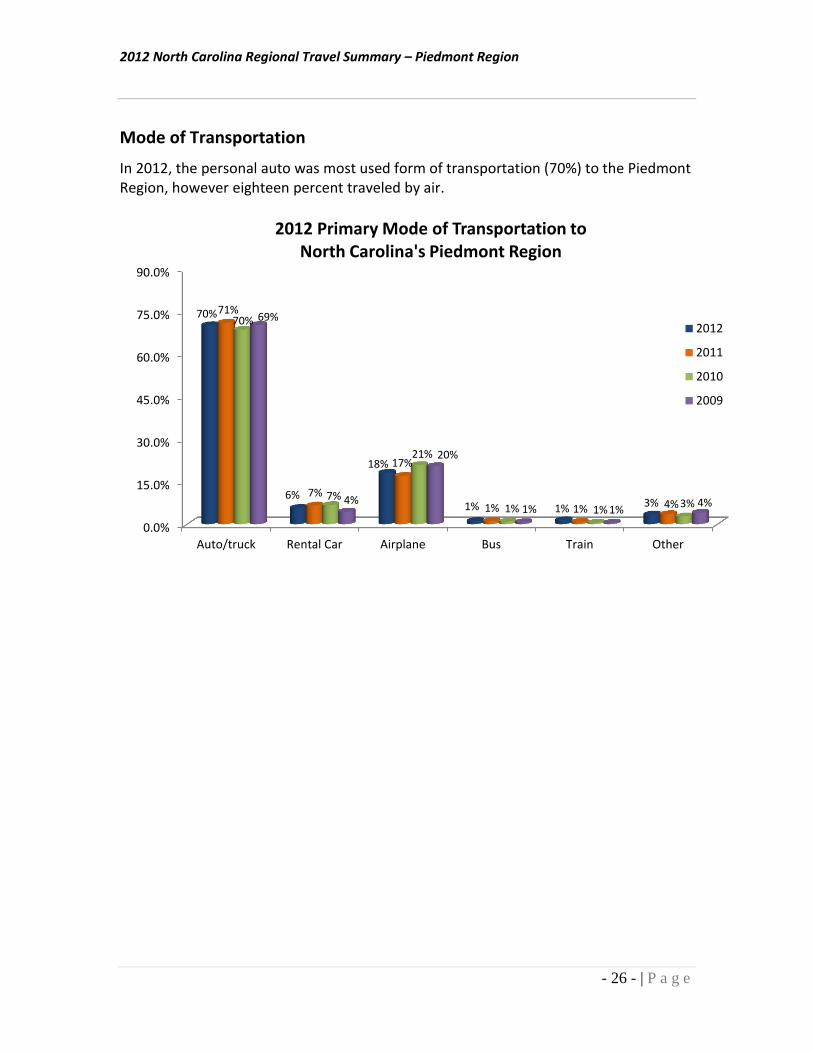
In 2012, the personal auto was most used form of transportation (70%) to the Piedmont Region, however eighteen percent traveled by air.
0.0%
15.0%
30.0%
45.0%
60.0%
75.0%
90.0%
Auto/truck Rental Car Airplane Bus Train Other
70%
6%
18%
1% 1% 3%
71%
7%
17%
1% 1% 4%
69%
7%
21%
1% 1% 3%
70%
4%
20%
1% 1% 4%
2012 Primary Mode of Transportation to North Carolina's Piedmont Region
2012
2011
2010
2009
2012 North Carolina Regional Travel Summary – Piedmont Region
- 27 - | P a g e
Amount Spent in Piedmont Region
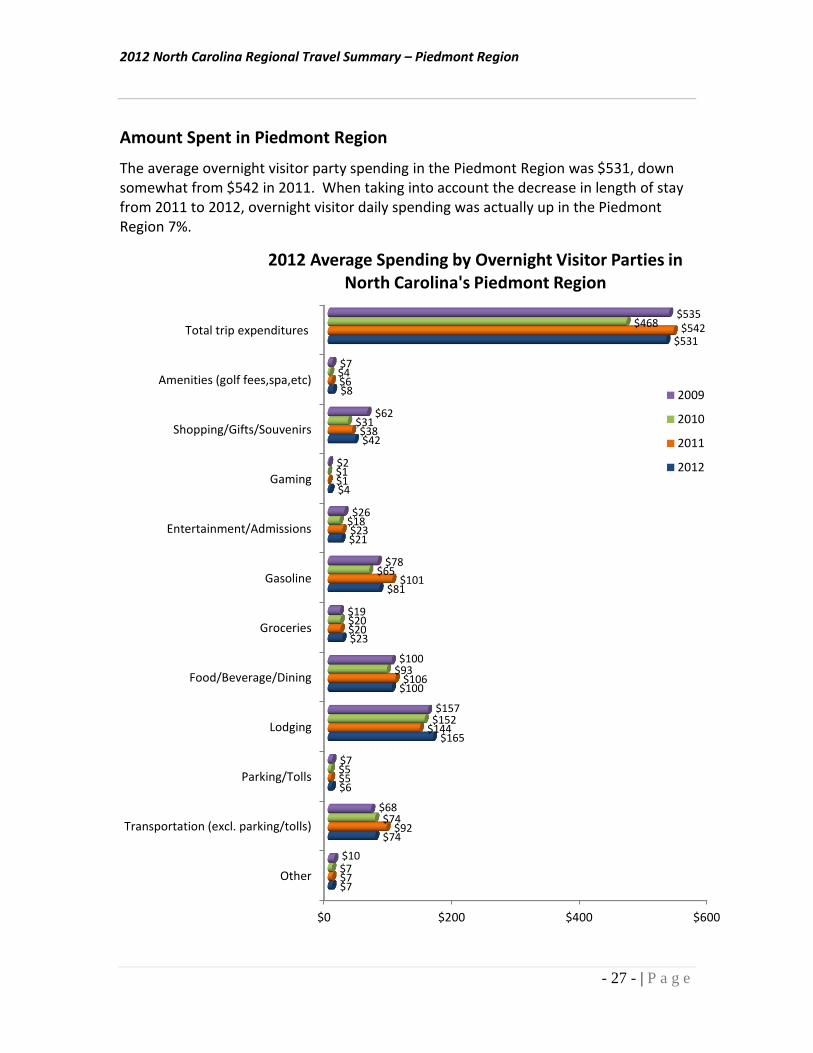
The average overnight visitor party spending in the Piedmont Region was $531, down somewhat from $542 in 2011. When taking into account the decrease in length of stay from 2011 to 2012, overnight visitor daily spending was actually up in the Piedmont Region 7%.
$0 $200 $400 $600
Other
Transportation (excl. parking/tolls)
Parking/Tolls
Lodging
Food/Beverage/Dining
Groceries
Gasoline
Entertainment/Admissions
Gaming
Shopping/Gifts/Souvenirs
Amenities (golf fees,spa,etc)
Total trip expenditures
$7
$74
$6
$165
$100
$23
$81
$21
$4
$42
$8
$531
$7
$92
$5
$144
$106
$20
$101
$23
$1
$38
$6
$542
$7
$74
$5
$152
$93
$20
$65
$18
$1
$31
$4
$468
$10
$68
$7
$157
$100
$19
$78
$26
$2
$62
$7
$535
2012 Average Spending by Overnight Visitor Parties in North Carolina's Piedmont Region
2009
2010
2011
2012
2012 North Carolina Regional Travel Summary – Piedmont Region
- 28 - | P a g e
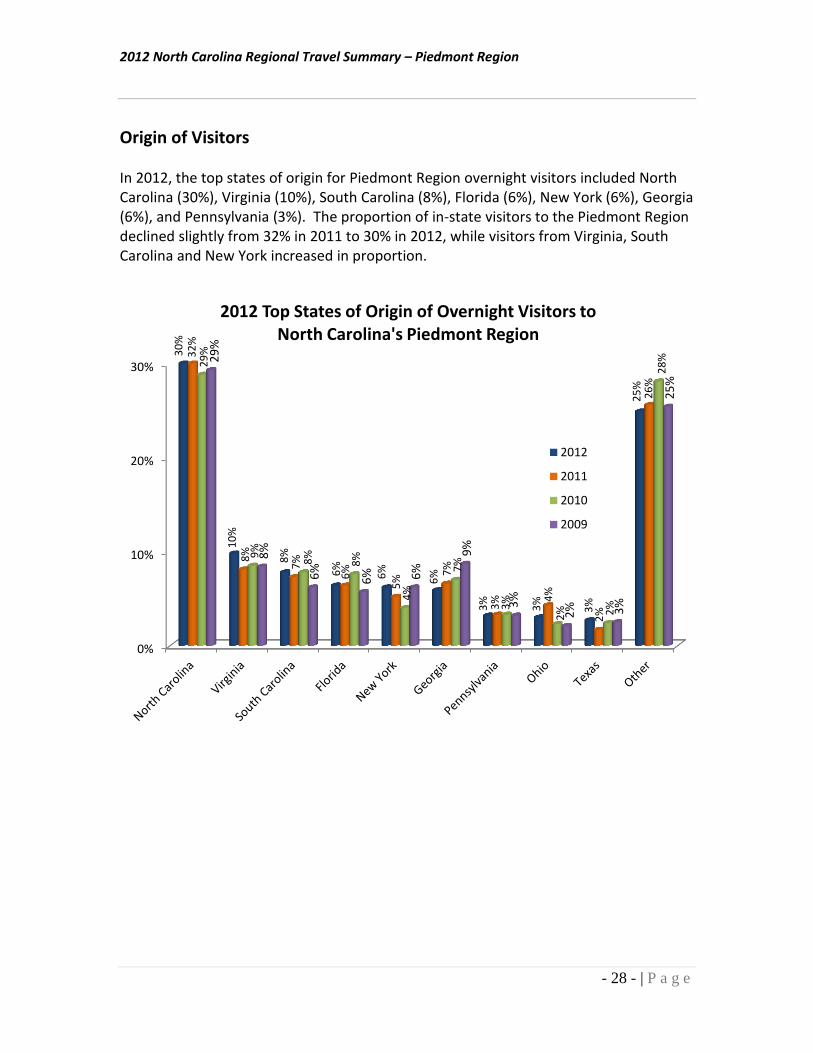
Origin of Visitors
In 2012, the top states of origin for Piedmont Region overnight visitors included North Carolina (30%), Virginia (10%), South Carolina (8%), Florida (6%), New York (6%), Georgia (6%), and Pennsylvania (3%). The proportion of in-state visitors to the Piedmont Region declined slightly from 32% in 2011 to 30% in 2012, while visitors from Virginia, South Carolina and New York increased in proportion.
0%
10%
20%
30%
30
%
10
%
8%
6%
6%
6%
3%
3%
3%
25
%
32
%
8%
7%
6%
5%
7%
3%
4%
2%
26
%
29
%
9%
8%
8%
4%
7%
3%
2%
2%
28
%
29
%
8%
6%
6%
6%
9%
3%
2%
3%
25
%
2012 Top States of Origin of Overnight Visitors to North Carolina's Piedmont Region
2012
2011
2010
2009
2012 North Carolina Regional Travel Summary – Piedmont Region
- 29 - | P a g e
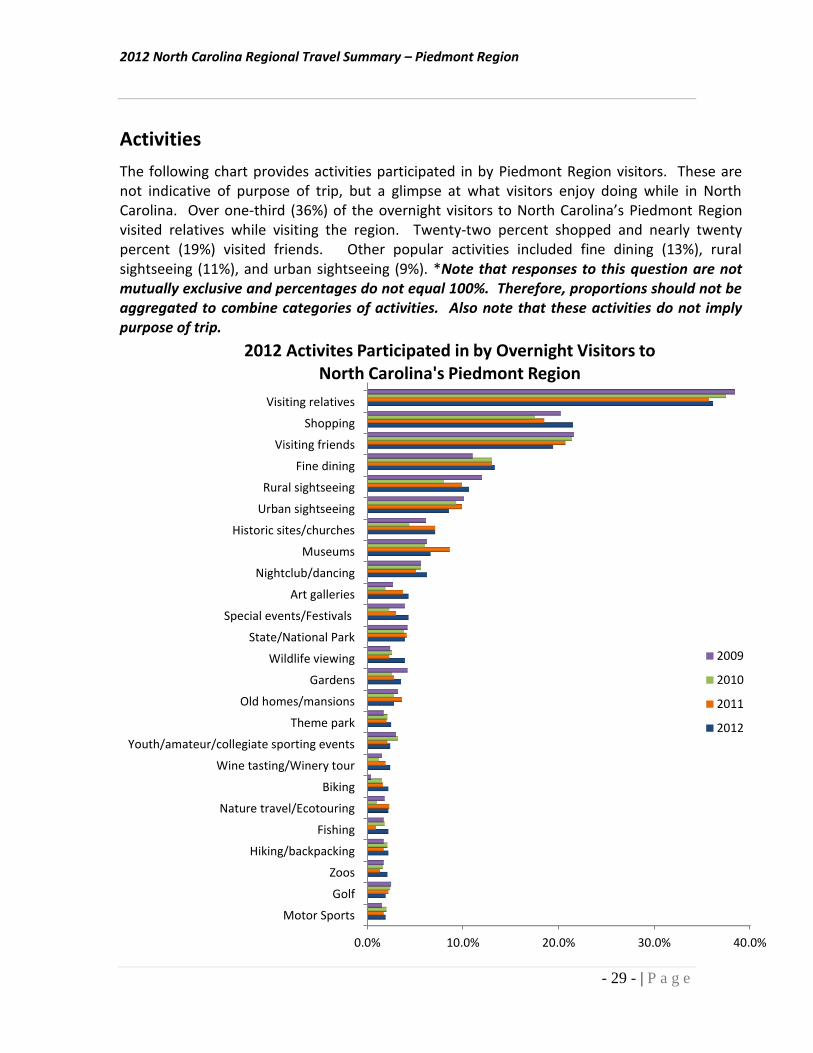
Activities
The following chart provides activities participated in by Piedmont Region visitors. These are not indicative of purpose of trip, but a glimpse at what visitors enjoy doing while in North Carolina. Over one-third (36%) of the overnight visitors to North Carolina’s Piedmont Region visited relatives while visiting the region. Twenty-two percent shopped and nearly twenty percent (19%) visited friends. Other popular activities included fine dining (13%), rural sightseeing (11%), and urban sightseeing (9%). *Note that responses to this question are not mutually exclusive and percentages do not equal 100%. Therefore, proportions should not be aggregated to combine categories of activities. Also note that these activities do not imply purpose of trip.
0.0% 10.0% 20.0% 30.0% 40.0%
Motor Sports
Golf
Zoos
Hiking/backpacking
Fishing
Nature travel/Ecotouring
Biking
Wine tasting/Winery tour
Youth/amateur/collegiate sporting events
Theme park
Old homes/mansions
Gardens
Wildlife viewing
State/National Park
Special events/Festivals
Art galleries
Nightclub/dancing
Museums
Historic sites/churches
Urban sightseeing
Rural sightseeing
Fine dining
Visiting friends
Shopping
Visiting relatives
2012 Activites Participated in by Overnight Visitors to North Carolina's Piedmont Region
2009
2010
2011
2012
2012 North Carolina Regional Travel Summary – Piedmont Region
- 30 - | P a g e
Demographic Profile of North Carolina Overnight Visitors to the Piedmont Region The North Carolina Piedmont Region overnight visitor gender breakdown is fifty-eight percent female and forty-two percent male. More than half (56.7%) of the visitors are married and just about seventeen percent of the region’s visitors are divorced, widowed or separated. The largest proportion of North Carolina Piedmont Region overnight visitors classify themselves as white (80.7%), and fifteen percent classify themselves as black/African American. Over one-half (61.6%) of Piedmont Region overnight visitor parties have a household head with a college degree or higher. The average Piedmont Region visitor is 44 years old, with almost one-half (45.4%) being 45 years old or older. Nearly one-half (40.6%) of the visitor parties that traveled to North Carolina’s Piedmont Region in 2012 had a household income $75,000 or over. Fifteen percent had a household income of over $125,000.
2012 North Carolina Regional Travel Summary – Piedmont Region
- 31 - | P a g e
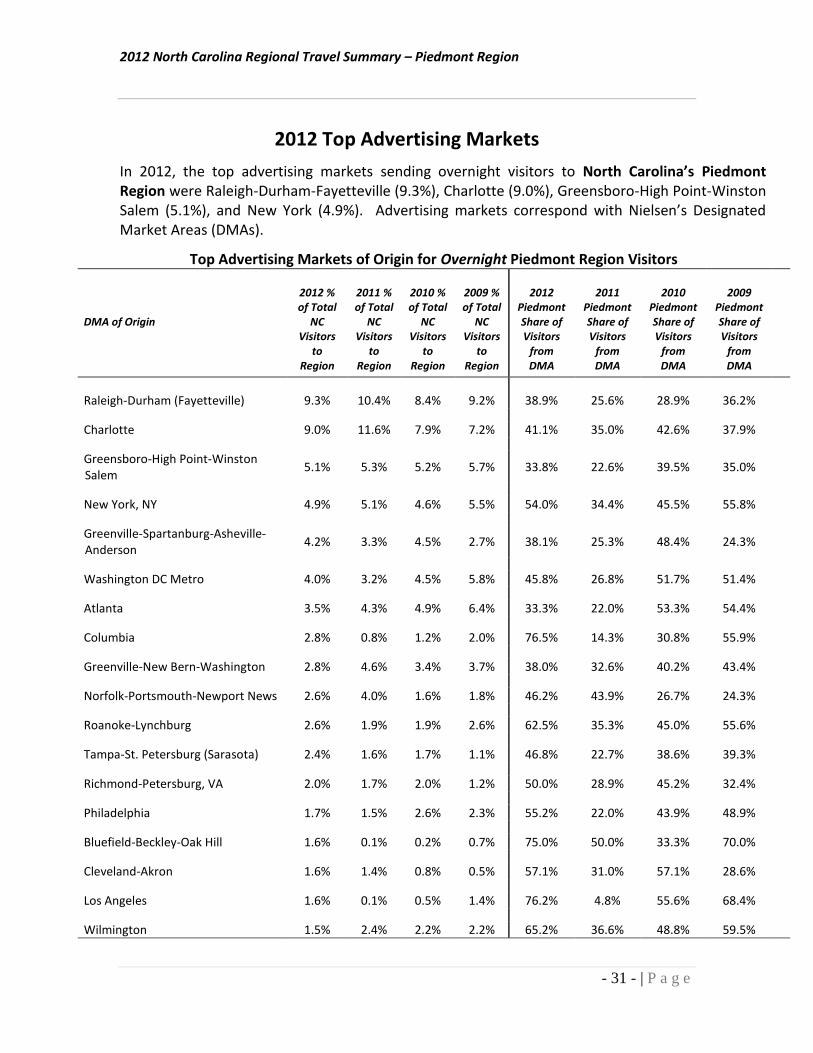
2012 Top Advertising Markets
In 2012, the top advertising markets sending overnight visitors to North Carolina’s Piedmont Region were Raleigh-Durham-Fayetteville (9.3%), Charlotte (9.0%), Greensboro-High Point-Winston Salem (5.1%), and New York (4.9%). Advertising markets correspond with Nielsen’s Designated Market Areas (DMAs).
Top Advertising Markets of Origin for Overnight Piedmont Region Visitors
DMA of Origin
2012 % of Total
NC Visitors
to Region
2011 % of Total
NC Visitors
to Region
2010 % of Total
NC Visitors
to Region
2009 % of Total
NC Visitors
to Region
2012 Piedmont Share of Visitors
from DMA
2011 Piedmont Share of Visitors
from DMA
2010 Piedmont Share of Visitors
from DMA
2009 Piedmont Share of Visitors
from DMA
Raleigh-Durham (Fayetteville) 9.3% 10.4% 8.4% 9.2% 38.9% 25.6% 28.9% 36.2%
Charlotte 9.0% 11.6% 7.9% 7.2% 41.1% 35.0% 42.6% 37.9%
Greensboro-High Point-Winston Salem
5.1% 5.3% 5.2% 5.7% 33.8% 22.6% 39.5% 35.0%
New York, NY 4.9% 5.1% 4.6% 5.5% 54.0% 34.4% 45.5% 55.8%
Greenville-Spartanburg-Asheville-Anderson
4.2% 3.3% 4.5% 2.7% 38.1% 25.3% 48.4% 24.3%
Washington DC Metro 4.0% 3.2% 4.5% 5.8% 45.8% 26.8% 51.7% 51.4%
Atlanta 3.5% 4.3% 4.9% 6.4% 33.3% 22.0% 53.3% 54.4%
Columbia 2.8% 0.8% 1.2% 2.0% 76.5% 14.3% 30.8% 55.9%
Greenville-New Bern-Washington 2.8% 4.6% 3.4% 3.7% 38.0% 32.6% 40.2% 43.4%
Norfolk-Portsmouth-Newport News 2.6% 4.0% 1.6% 1.8% 46.2% 43.9% 26.7% 24.3%
Roanoke-Lynchburg 2.6% 1.9% 1.9% 2.6% 62.5% 35.3% 45.0% 55.6%
Tampa-St. Petersburg (Sarasota) 2.4% 1.6% 1.7% 1.1% 46.8% 22.7% 38.6% 39.3%
Richmond-Petersburg, VA 2.0% 1.7% 2.0% 1.2% 50.0% 28.9% 45.2% 32.4%
Philadelphia 1.7% 1.5% 2.6% 2.3% 55.2% 22.0% 43.9% 48.9%
Bluefield-Beckley-Oak Hill 1.6% 0.1% 0.2% 0.7% 75.0% 50.0% 33.3% 70.0%
Cleveland-Akron 1.6% 1.4% 0.8% 0.5% 57.1% 31.0% 57.1% 28.6%
Los Angeles 1.6% 0.1% 0.5% 1.4% 76.2% 4.8% 55.6% 68.4%
Wilmington 1.5% 2.4% 2.2% 2.2% 65.2% 36.6% 48.8% 59.5%
2012 North Carolina Regional Travel Summary – Piedmont Region vs. North Carolina
- 32 - | P a g e
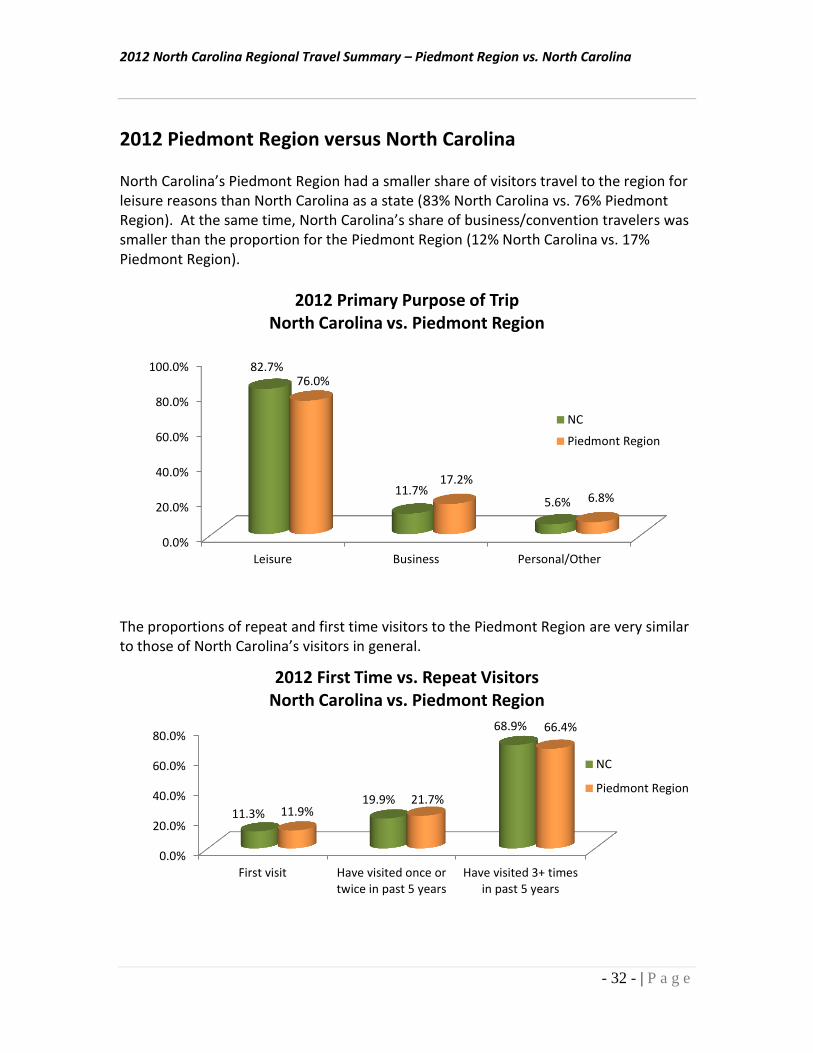
2012 Piedmont Region versus North Carolina North Carolina’s Piedmont Region had a smaller share of visitors travel to the region for leisure reasons than North Carolina as a state (83% North Carolina vs. 76% Piedmont Region). At the same time, North Carolina’s share of business/convention travelers was smaller than the proportion for the Piedmont Region (12% North Carolina vs. 17% Piedmont Region).
The proportions of repeat and first time visitors to the Piedmont Region are very similar to those of North Carolina’s visitors in general.
0.0%
20.0%
40.0%
60.0%
80.0%
100.0%
Leisure Business Personal/Other
82.7%
11.7% 5.6%
76.0%
17.2%
6.8%
2012 Primary Purpose of Trip North Carolina vs. Piedmont Region
NC
Piedmont Region
0.0%
20.0%
40.0%
60.0%
80.0%
First visit Have visited once ortwice in past 5 years
Have visited 3+ timesin past 5 years
11.3% 19.9%
68.9%
11.9% 21.7%
66.4%
2012 First Time vs. Repeat Visitors North Carolina vs. Piedmont Region
NC
Piedmont Region
2012 North Carolina Regional Travel Summary – Piedmont Region vs. North Carolina
- 33 - | P a g e
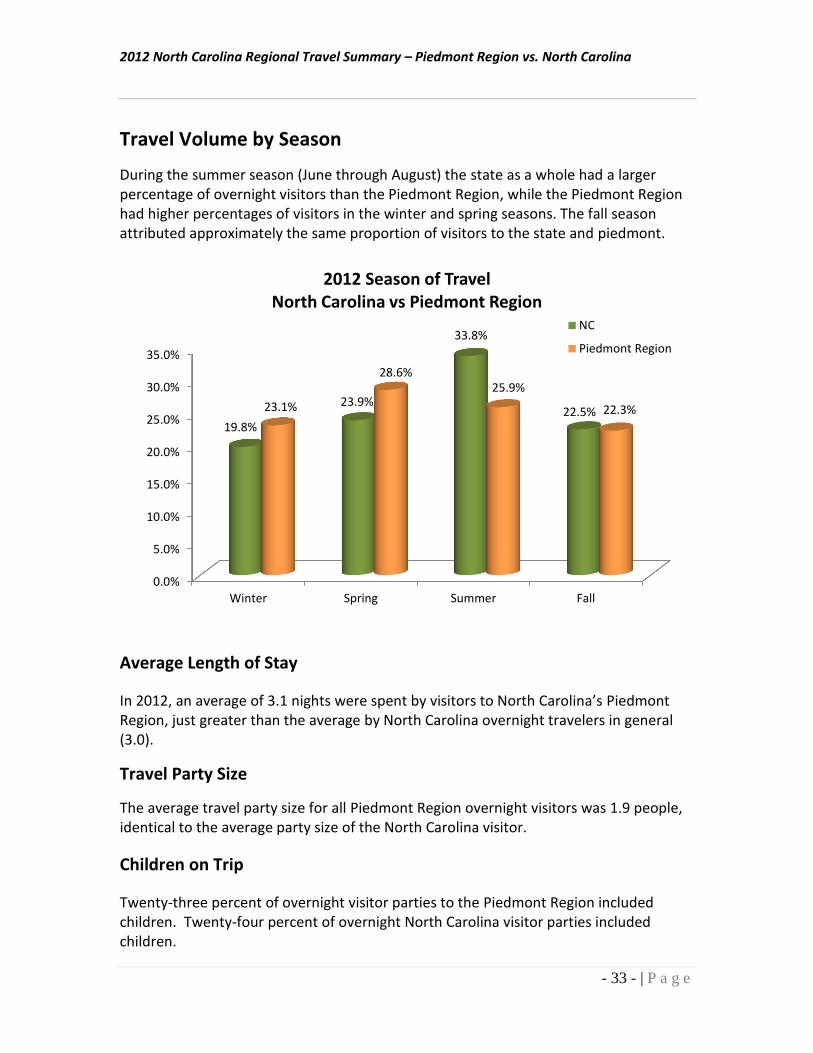
Travel Volume by Season
During the summer season (June through August) the state as a whole had a larger percentage of overnight visitors than the Piedmont Region, while the Piedmont Region had higher percentages of visitors in the winter and spring seasons. The fall season attributed approximately the same proportion of visitors to the state and piedmont.
Average Length of Stay
In 2012, an average of 3.1 nights were spent by visitors to North Carolina’s Piedmont Region, just greater than the average by North Carolina overnight travelers in general (3.0).
Travel Party Size
The average travel party size for all Piedmont Region overnight visitors was 1.9 people, identical to the average party size of the North Carolina visitor.
Children on Trip
Twenty-three percent of overnight visitor parties to the Piedmont Region included children. Twenty-four percent of overnight North Carolina visitor parties included children.
0.0%
5.0%
10.0%
15.0%
20.0%
25.0%
30.0%
35.0%
Winter Spring Summer Fall
19.8%
23.9%
33.8%
22.5% 23.1%
28.6% 25.9%
22.3%
2012 Season of Travel North Carolina vs Piedmont Region
NC
Piedmont Region
2012 North Carolina Regional Travel Summary – Piedmont Region vs. North Carolina
- 34 - | P a g e
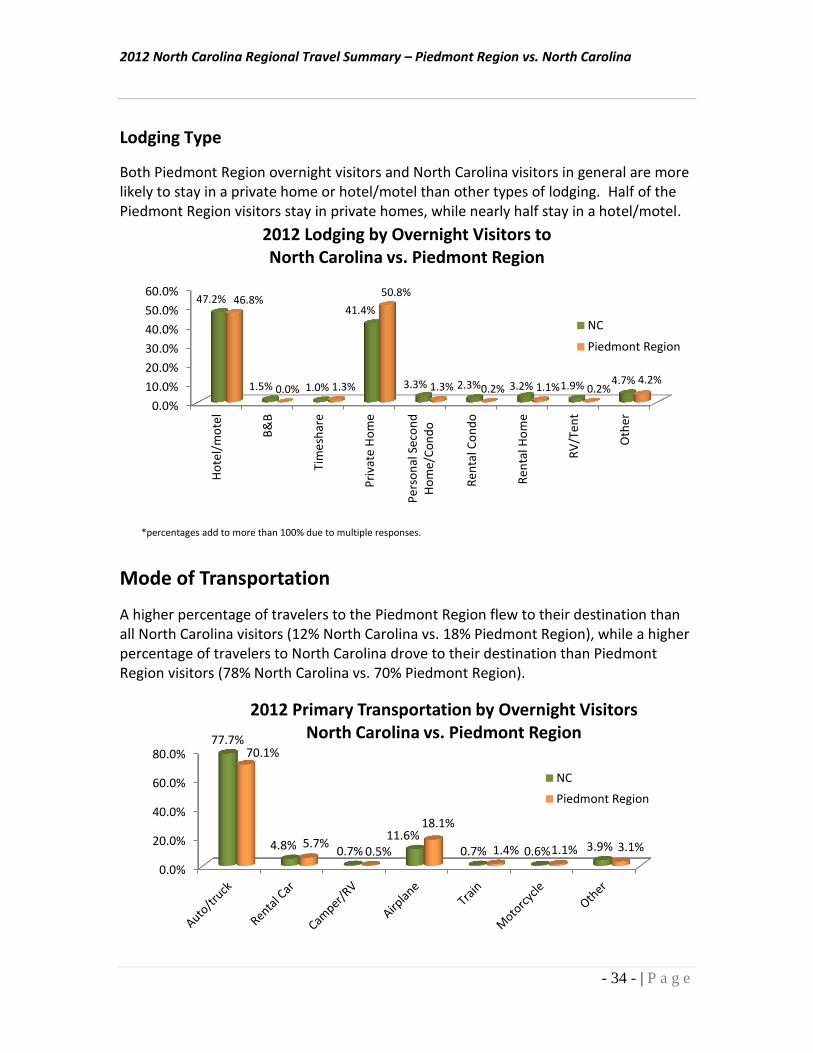
Lodging Type
Both Piedmont Region overnight visitors and North Carolina visitors in general are more likely to stay in a private home or hotel/motel than other types of lodging. Half of the Piedmont Region visitors stay in private homes, while nearly half stay in a hotel/motel.
Mode of Transportation
A higher percentage of travelers to the Piedmont Region flew to their destination than all North Carolina visitors (12% North Carolina vs. 18% Piedmont Region), while a higher percentage of travelers to North Carolina drove to their destination than Piedmont Region visitors (78% North Carolina vs. 70% Piedmont Region).
0.0%
10.0%
20.0%
30.0%
40.0%
50.0%
60.0%
Ho
tel/
mo
tel
B&
B
Tim
esh
are
Pri
vate
Ho
me
Pe
rso
nal
Se
con
dH
om
e/C
on
do
Re
nta
l Co
nd
o
Re
nta
l Ho
me
RV
/Te
nt
Oth
er
47.2%
1.5% 1.0%
41.4%
3.3% 2.3% 3.2% 1.9% 4.7%
46.8%
0.0% 1.3%
50.8%
1.3% 0.2% 1.1% 0.2% 4.2%
2012 Lodging by Overnight Visitors to North Carolina vs. Piedmont Region
NC
Piedmont Region
*percentages add to more than 100% due to multiple responses.
0.0%
20.0%
40.0%
60.0%
80.0%77.7%
4.8% 0.7% 11.6%
0.7% 0.6% 3.9%
70.1%
5.7% 0.5%
18.1%
1.4% 1.1% 3.1%
2012 Primary Transportation by Overnight Visitors North Carolina vs. Piedmont Region
NC
Piedmont Region
2012 North Carolina Regional Travel Summary – Piedmont Region vs. North Carolina
- 35 - | P a g e
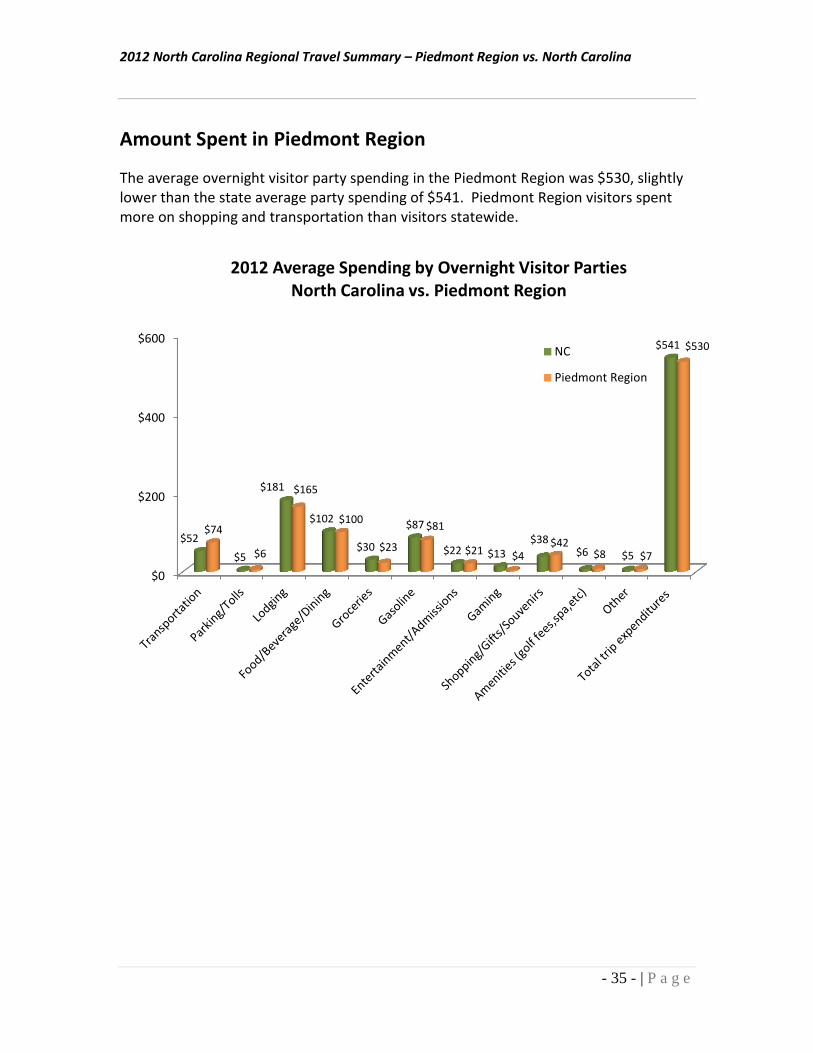
Amount Spent in Piedmont Region
The average overnight visitor party spending in the Piedmont Region was $530, slightly lower than the state average party spending of $541. Piedmont Region visitors spent more on shopping and transportation than visitors statewide.
$0
$200
$400
$600
$52
$5
$181
$102
$30
$87
$22 $13 $38
$6 $5
$541
$74
$6
$165
$100
$23
$81
$21 $4 $42
$8 $7
$530
2012 Average Spending by Overnight Visitor Parties North Carolina vs. Piedmont Region
NC
Piedmont Region
2012 North Carolina Regional Travel Summary – Piedmont Region vs. North Carolina
- 36 - | P a g e
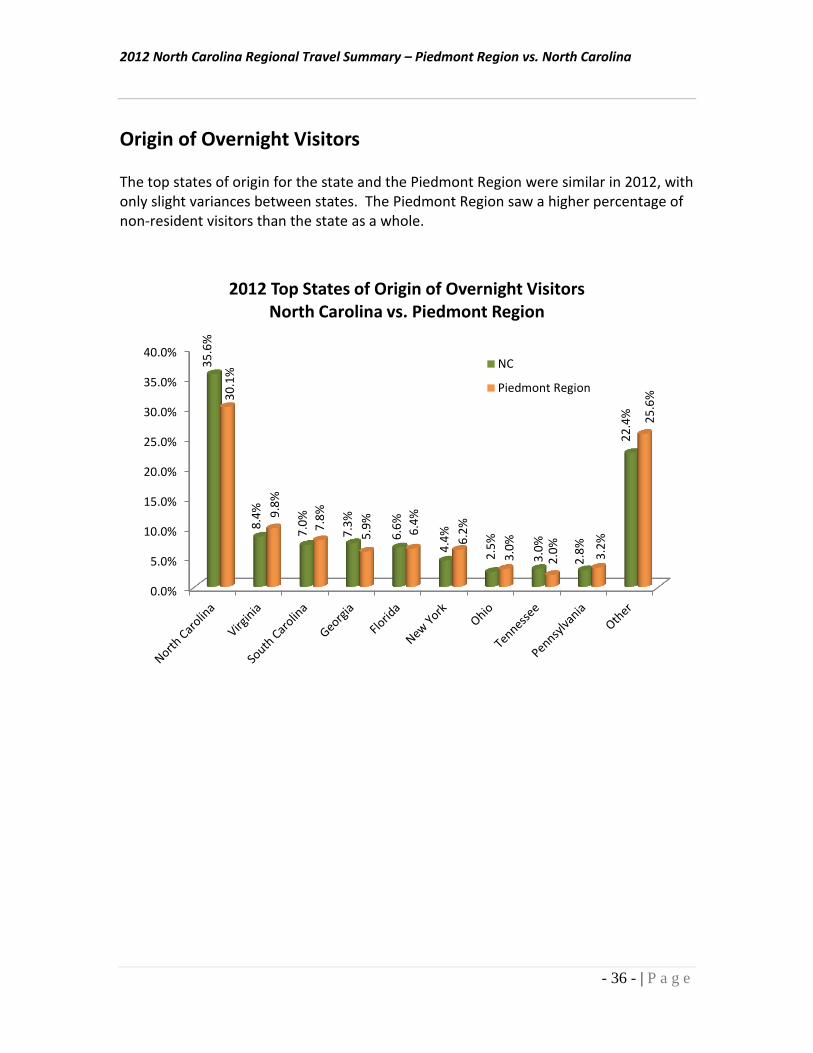
Origin of Overnight Visitors
The top states of origin for the state and the Piedmont Region were similar in 2012, with only slight variances between states. The Piedmont Region saw a higher percentage of non-resident visitors than the state as a whole.
0.0%
5.0%
10.0%
15.0%
20.0%
25.0%
30.0%
35.0%
40.0%
35
.6%
8.4
%
7.0
%
7.3
%
6.6
%
4.4
%
2.5
%
3.0
%
2.8
%
22
.4%
30
.1%
9.8
%
7.8
%
5.9
%
6.4
%
6.2
%
3.0
%
2.0
%
3.2
%
25
.6%
2012 Top States of Origin of Overnight Visitors North Carolina vs. Piedmont Region
NC
Piedmont Region
2012 North Carolina Regional Travel Summary – Piedmont Region vs. North Carolina
- 37 - | P a g e
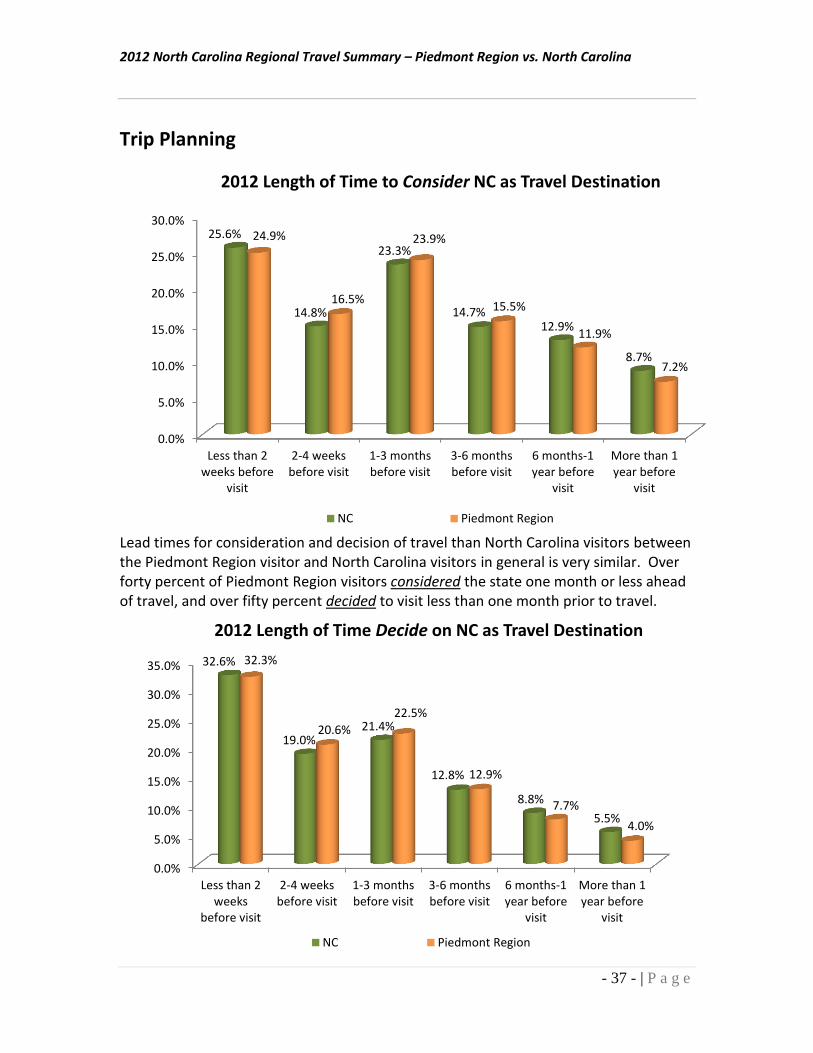
Trip Planning
Lead times for consideration and decision of travel than North Carolina visitors between the Piedmont Region visitor and North Carolina visitors in general is very similar. Over forty percent of Piedmont Region visitors considered the state one month or less ahead of travel, and over fifty percent decided to visit less than one month prior to travel.
0.0%
5.0%
10.0%
15.0%
20.0%
25.0%
30.0%
Less than 2weeks before
visit
2-4 weeksbefore visit
1-3 monthsbefore visit
3-6 monthsbefore visit
6 months-1year before
visit
More than 1year before
visit
25.6%
14.8%
23.3%
14.7% 12.9%
8.7%
24.9%
16.5%
23.9%
15.5%
11.9%
7.2%
2012 Length of Time to Consider NC as Travel Destination
NC Piedmont Region
0.0%
5.0%
10.0%
15.0%
20.0%
25.0%
30.0%
35.0%
Less than 2weeks
before visit
2-4 weeksbefore visit
1-3 monthsbefore visit
3-6 monthsbefore visit
6 months-1year before
visit
More than 1year before
visit
32.6%
19.0% 21.4%
12.8%
8.8%
5.5%
32.3%
20.6%
22.5%
12.9%
7.7%
4.0%
2012 Length of Time Decide on NC as Travel Destination
NC Piedmont Region
2012 North Carolina Regional Travel Summary – Piedmont Region vs. North Carolina
- 38 - | P a g e
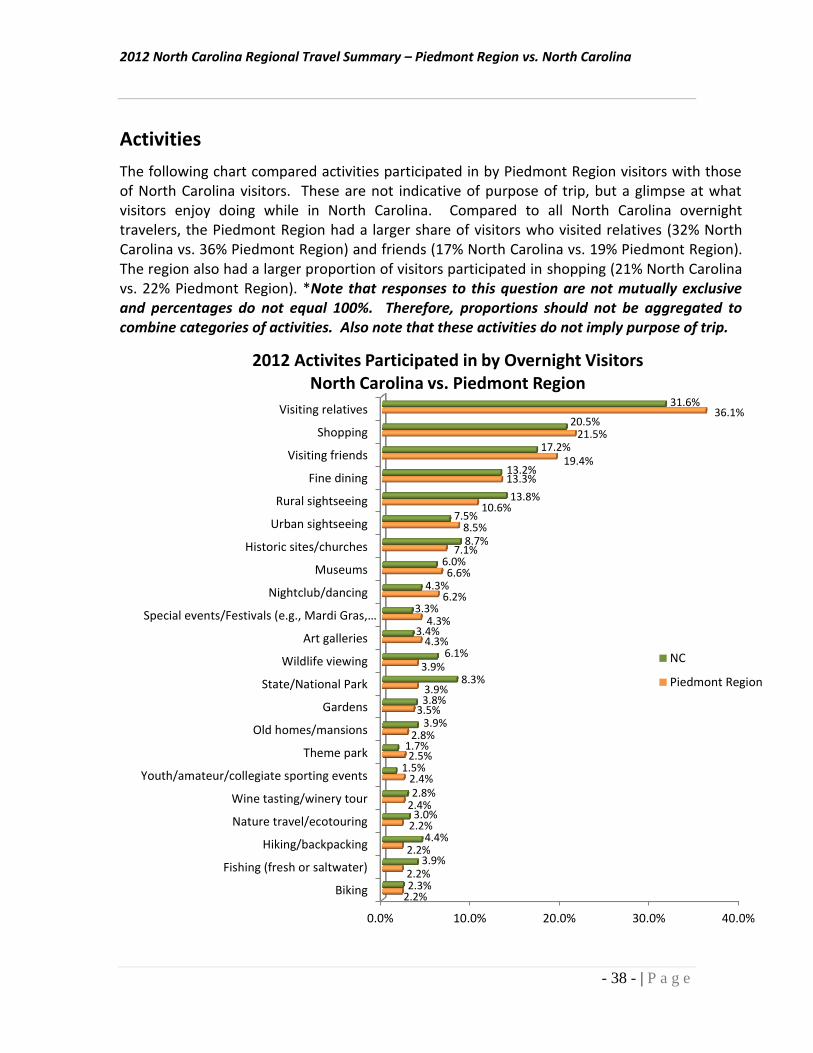
Activities
The following chart compared activities participated in by Piedmont Region visitors with those of North Carolina visitors. These are not indicative of purpose of trip, but a glimpse at what visitors enjoy doing while in North Carolina. Compared to all North Carolina overnight travelers, the Piedmont Region had a larger share of visitors who visited relatives (32% North Carolina vs. 36% Piedmont Region) and friends (17% North Carolina vs. 19% Piedmont Region). The region also had a larger proportion of visitors participated in shopping (21% North Carolina vs. 22% Piedmont Region). *Note that responses to this question are not mutually exclusive and percentages do not equal 100%. Therefore, proportions should not be aggregated to combine categories of activities. Also note that these activities do not imply purpose of trip.
0.0% 10.0% 20.0% 30.0% 40.0%
Biking
Fishing (fresh or saltwater)
Hiking/backpacking
Nature travel/ecotouring
Wine tasting/winery tour
Youth/amateur/collegiate sporting events
Theme park
Old homes/mansions
Gardens
State/National Park
Wildlife viewing
Art galleries
Special events/Festivals (e.g., Mardi Gras,…
Nightclub/dancing
Museums
Historic sites/churches
Urban sightseeing
Rural sightseeing
Fine dining
Visiting friends
Shopping
Visiting relatives
2.2%
2.2%
2.2%
2.2%
2.4%
2.4%
2.5%
2.8%
3.5%
3.9%
3.9%
4.3%
4.3%
6.2%
6.6%
7.1%
8.5%
10.6%
13.3%
19.4%
21.5%
36.1%
2.3%
3.9%
4.4%
3.0%
2.8%
1.5%
1.7%
3.9%
3.8%
8.3%
6.1%
3.4%
3.3%
4.3%
6.0%
8.7%
7.5%
13.8%
13.2%
17.2%
20.5%
31.6%
2012 Activites Participated in by Overnight Visitors North Carolina vs. Piedmont Region
NC
Piedmont Region
2012 North Carolina Regional Travel Summary – Piedmont Region vs. North Carolina
- 39 - | P a g e
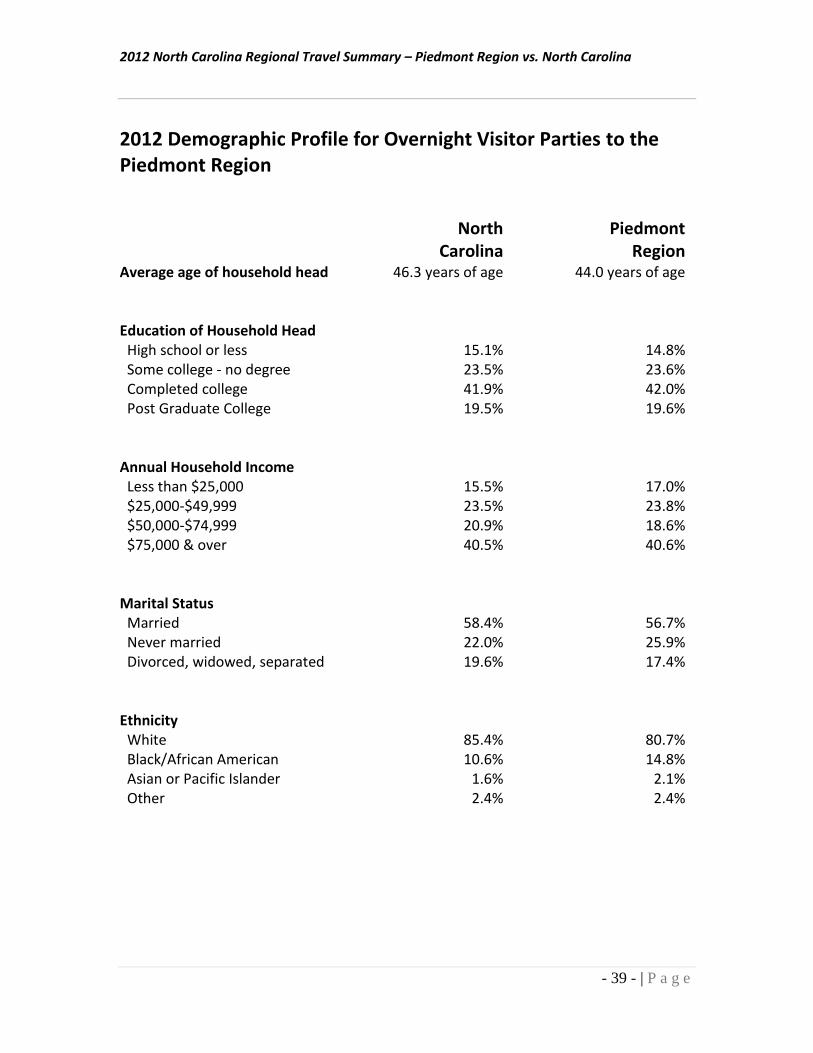
2012 Demographic Profile for Overnight Visitor Parties to the Piedmont Region
North Carolina
Piedmont Region
Average age of household head 46.3 years of age 44.0 years of age
Education of Household Head High school or less 15.1% 14.8% Some college - no degree 23.5% 23.6% Completed college 41.9% 42.0% Post Graduate College 19.5% 19.6%
Annual Household Income Less than $25,000 15.5% 17.0% $25,000-$49,999 23.5% 23.8% $50,000-$74,999 20.9% 18.6% $75,000 & over 40.5% 40.6%
Marital Status Married 58.4% 56.7% Never married 22.0% 25.9% Divorced, widowed, separated 19.6% 17.4% Ethnicity White 85.4% 80.7% Black/African American 10.6% 14.8% Asian or Pacific Islander 1.6% 2.1% Other 2.4% 2.4%
2012 North Carolina Regional Travel Summary – Piedmont Region vs. North Carolina
- 40 - | P a g e
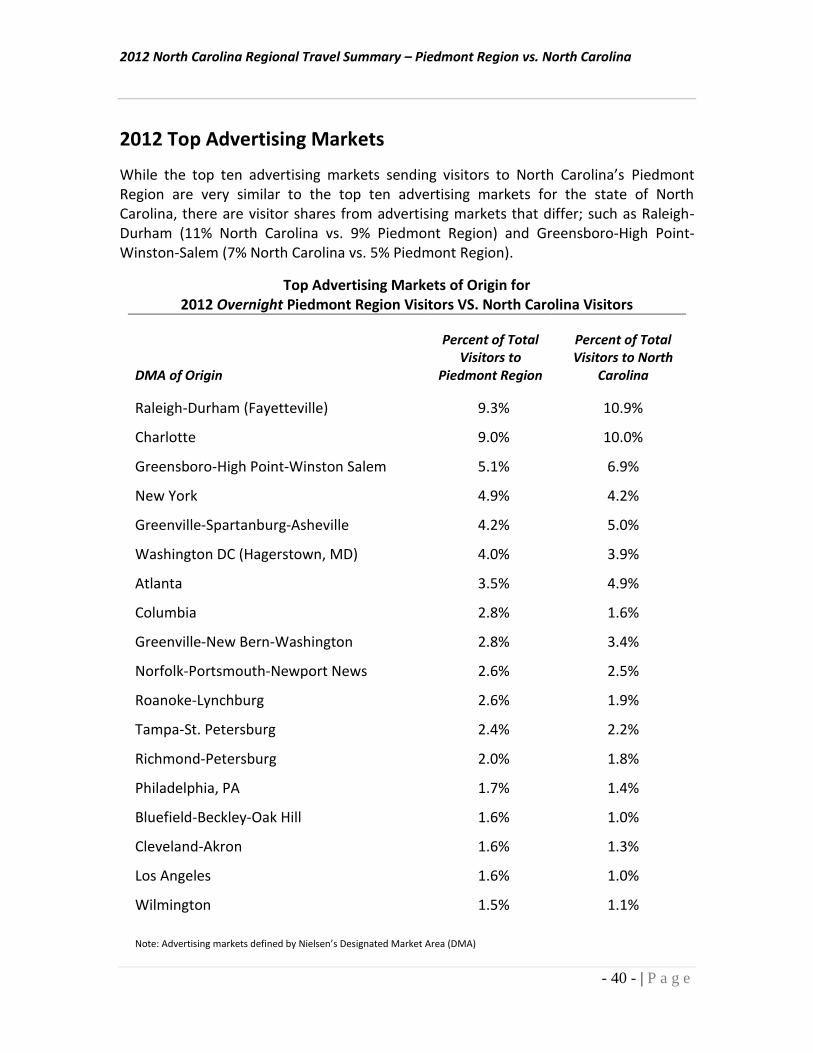
2012 Top Advertising Markets
While the top ten advertising markets sending visitors to North Carolina’s Piedmont Region are very similar to the top ten advertising markets for the state of North Carolina, there are visitor shares from advertising markets that differ; such as Raleigh-Durham (11% North Carolina vs. 9% Piedmont Region) and Greensboro-High Point-Winston-Salem (7% North Carolina vs. 5% Piedmont Region).
Top Advertising Markets of Origin for 2012 Overnight Piedmont Region Visitors VS. North Carolina Visitors
DMA of Origin
Percent of Total Visitors to
Piedmont Region
Percent of Total Visitors to North
Carolina
Raleigh-Durham (Fayetteville) 9.3% 10.9%
Charlotte 9.0% 10.0%
Greensboro-High Point-Winston Salem 5.1% 6.9%
New York 4.9% 4.2%
Greenville-Spartanburg-Asheville 4.2% 5.0%
Washington DC (Hagerstown, MD) 4.0% 3.9%
Atlanta 3.5% 4.9%
Columbia 2.8% 1.6%
Greenville-New Bern-Washington 2.8% 3.4%
Norfolk-Portsmouth-Newport News 2.6% 2.5%
Roanoke-Lynchburg 2.6% 1.9%
Tampa-St. Petersburg 2.4% 2.2%
Richmond-Petersburg 2.0% 1.8%
Philadelphia, PA 1.7% 1.4%
Bluefield-Beckley-Oak Hill 1.6% 1.0%
Cleveland-Akron 1.6% 1.3%
Los Angeles 1.6% 1.0%
Wilmington 1.5% 1.1%
Note: Advertising markets defined by Nielsen’s Designated Market Area (DMA)
2012 North Carolina Regional Travel Summary – Mountain Region
- 39 - | P a g e
2012 Domestic Mountain Region Travel
Summary
In 2012, twenty-two percent of North Carolina visitors traveled to North Carolina’s Mountain Region, approximately 9.8 million person-trips. For marketing purposed, the Mountain Region is made up of the 23 western-most counties of North Carolina.
Eighty-six percent of domestic visitors came to the Mountain Region for pleasure purposes, while eight percent of visitors came to conduct business (includes meeting/convention). The remaining six percent reported personal business or “other” purpose of visit.
Travel to the Mountain Region of North Carolina was heaviest in the summer and fall. The fall (September - November) had the highest proportion of visitors, with thirty percent of all 2012 Mountain Region visitors. The summer (June – August) followed with just less than thirty (29.5%) percent of visitors, followed by winter (December - February) with twenty-one percent and spring (March - May) with nineteen percent. September was the single largest month for mountain travel with twelve percent.
Overnight visitors to the Mountain Region spent an average of 2.8 nights in the region.
Sixty-three percent of Mountain Region visitors lodged in a hotel/motel while twenty-two percent stayed at a private home. Three percent stayed in an RV park/campground.
The average travel party size for all Mountain Region visitors was 2.0 people. Twenty-four percent of all travel parties to the region included children in the party.
Ninety-two percent of all travelers to the Mountain Region drove (includes personal automobile, rental vehicle, RV/camper), while four percent traveled by air.
In 2012, the average trip expenditure in the Mountain Region was $547. The average trip expenditure for overnight visitors to the Mountain Region was $664. Daytrip parties to the Mountain Region spent approximately $258 per visit.
The top states of origin of overnight visitors to the Mountain Region were North Carolina (32.5%), Georgia (12.0%), South Carolina (10.5%), Florida (8.7%), Tennessee (7.7%), and Virginia (2.8%).
Fifty-eight percent of the households that traveled to North Carolina’s Mountain Region in 2012 had a household income over $50,000.
In 2012, Charlotte (14.8%) was the top DMA of origin for overnight travelers to the Mountain Region, followed by Greenville/Spartanburg/Anderson, SC/Asheville (10.3%), Atlanta (9.1%), Greensboro/High Point/Winston-Salem (7.1%), Raleigh/Durham/Fayetteville (6.5%) and New York (4.1%).
2012 North Carolina Regional Travel Summary – Mountain Region
40 | P a g e
Mountain Region Overnight Visitor Profile
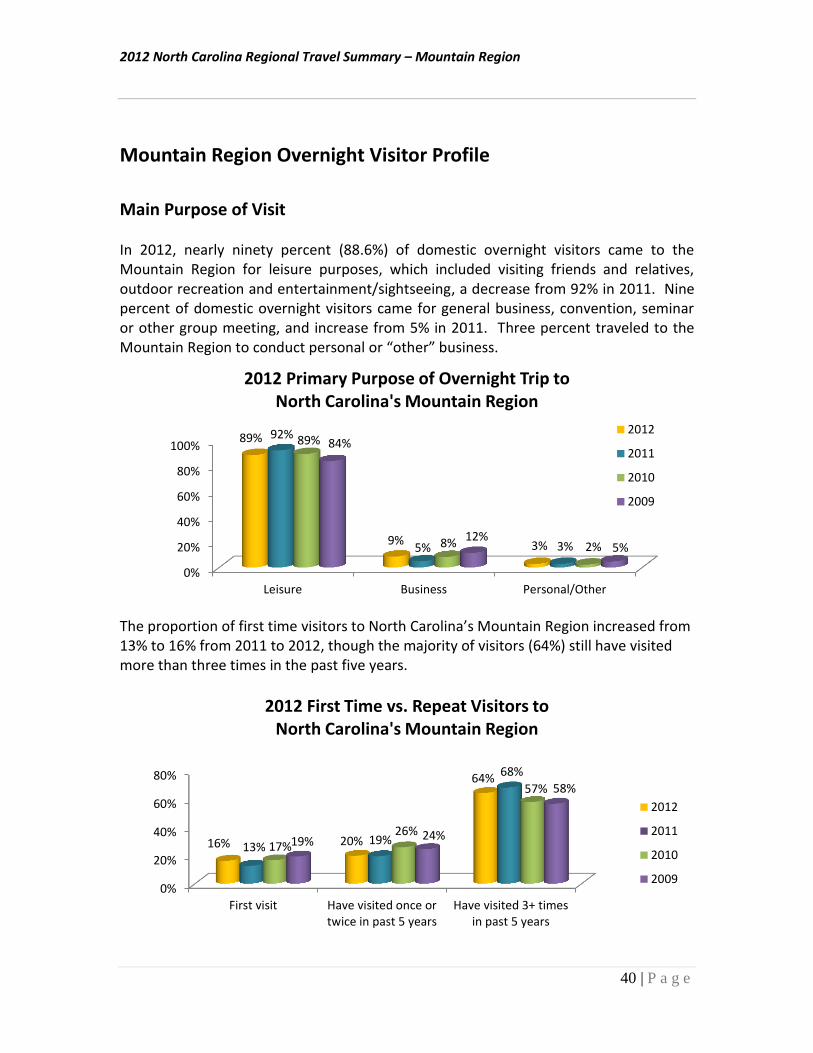
Main Purpose of Visit In 2012, nearly ninety percent (88.6%) of domestic overnight visitors came to the Mountain Region for leisure purposes, which included visiting friends and relatives, outdoor recreation and entertainment/sightseeing, a decrease from 92% in 2011. Nine percent of domestic overnight visitors came for general business, convention, seminar or other group meeting, and increase from 5% in 2011. Three percent traveled to the Mountain Region to conduct personal or “other” business.
The proportion of first time visitors to North Carolina’s Mountain Region increased from 13% to 16% from 2011 to 2012, though the majority of visitors (64%) still have visited more than three times in the past five years.
0%
20%
40%
60%
80%
100%
Leisure Business Personal/Other
89%
9% 3%
92%
5% 3%
89%
8% 2%
84%
12% 5%
2012 Primary Purpose of Overnight Trip to North Carolina's Mountain Region
2012
2011
2010
2009
0%
20%
40%
60%
80%
First visit Have visited once ortwice in past 5 years
Have visited 3+ timesin past 5 years
16% 20%
64%
13% 19%
68%
17% 26%
58%
19% 24%
57%
2012 First Time vs. Repeat Visitors to North Carolina's Mountain Region
2012
2011
2010
2009
2012 North Carolina Regional Travel Summary – Mountain Region
41 | P a g e
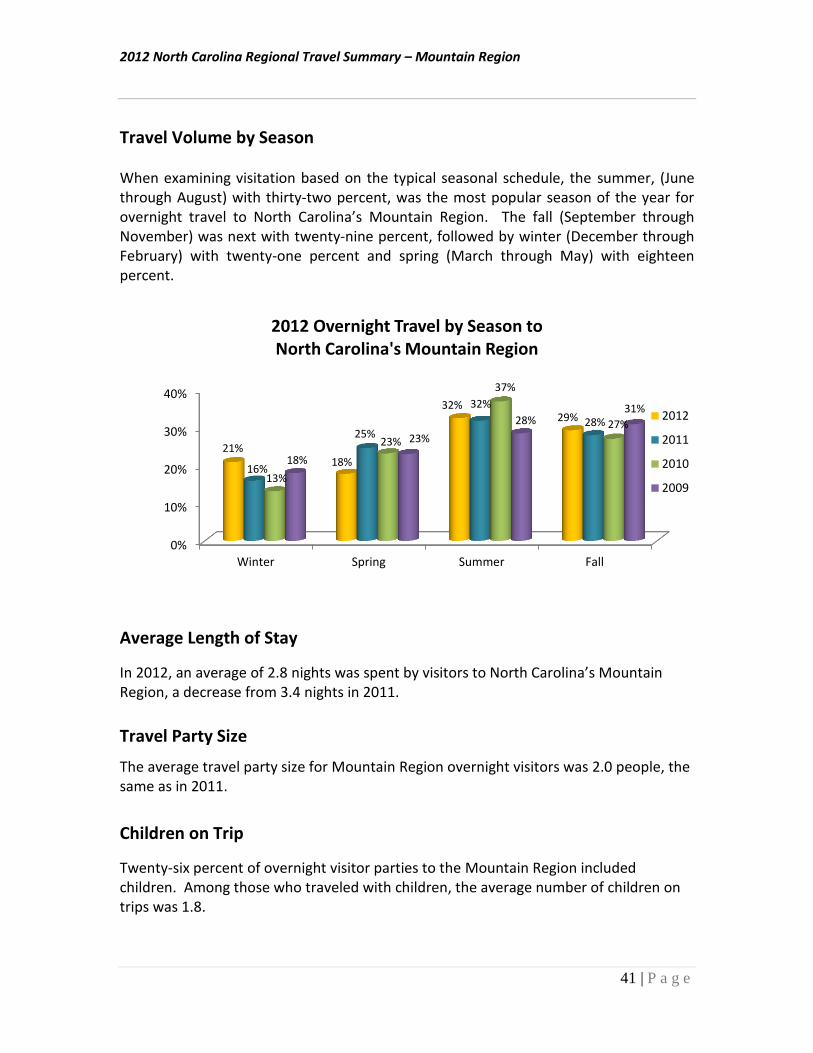
Travel Volume by Season When examining visitation based on the typical seasonal schedule, the summer, (June through August) with thirty-two percent, was the most popular season of the year for overnight travel to North Carolina’s Mountain Region. The fall (September through November) was next with twenty-nine percent, followed by winter (December through February) with twenty-one percent and spring (March through May) with eighteen percent.
Average Length of Stay
In 2012, an average of 2.8 nights was spent by visitors to North Carolina’s Mountain Region, a decrease from 3.4 nights in 2011.
Travel Party Size
The average travel party size for Mountain Region overnight visitors was 2.0 people, the same as in 2011.
Children on Trip
Twenty-six percent of overnight visitor parties to the Mountain Region included children. Among those who traveled with children, the average number of children on trips was 1.8.
0%
10%
20%
30%
40%
Winter Spring Summer Fall
21% 18%
32% 29%
16%
25%
32%
28%
13%
23%
37%
27%
18%
23%
28% 31%
2012 Overnight Travel by Season to North Carolina's Mountain Region
2012
2011
2010
2009
2012 North Carolina Regional Travel Summary – Mountain Region
42 | P a g e
Lodging Used in Mountain Region
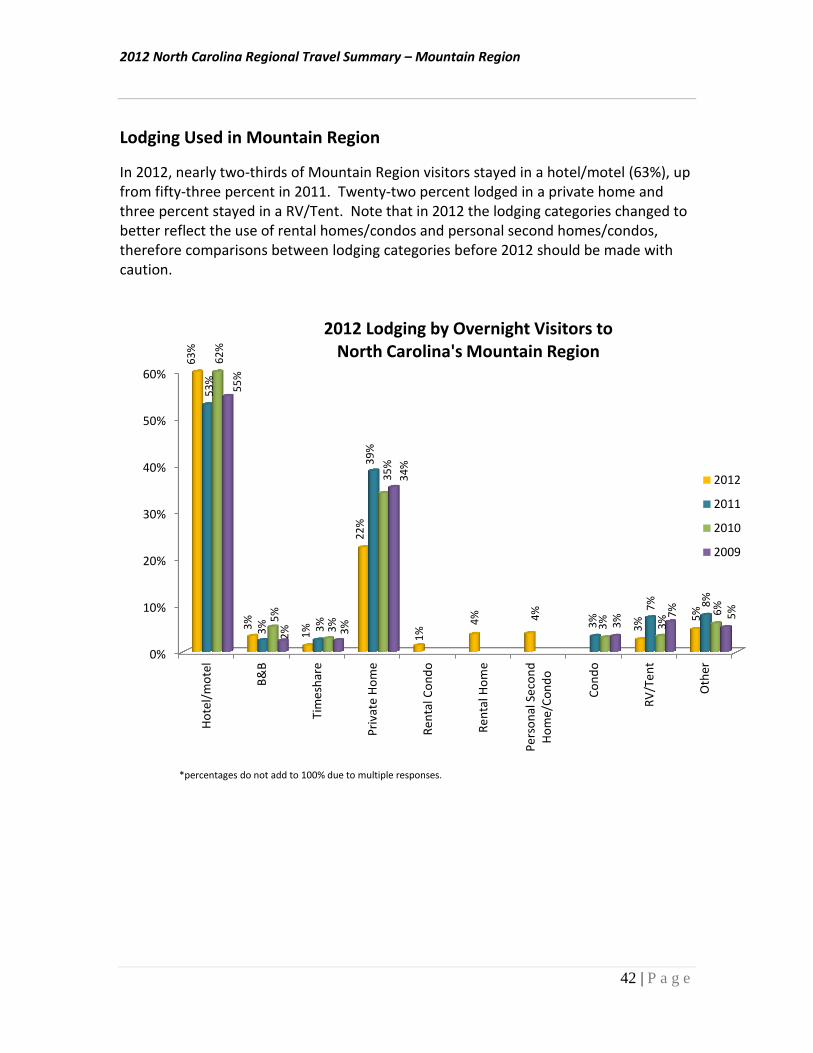
In 2012, nearly two-thirds of Mountain Region visitors stayed in a hotel/motel (63%), up from fifty-three percent in 2011. Twenty-two percent lodged in a private home and three percent stayed in a RV/Tent. Note that in 2012 the lodging categories changed to better reflect the use of rental homes/condos and personal second homes/condos, therefore comparisons between lodging categories before 2012 should be made with caution.
0%
10%
20%
30%
40%
50%
60%
Ho
tel/
mo
tel
B&
B
Tim
esh
are
Pri
vate
Ho
me
Re
nta
l Co
nd
o
Re
nta
l Ho
me
Pe
rso
nal
Se
con
dH
om
e/C
on
do
Co
nd
o
RV
/Te
nt
Oth
er
63
%
3%
1%
22
%
1%
4%
4%
3%
5%
53
%
3%
3%
39
%
3%
7%
8%
62
%
5%
3%
34
%
3%
3%
6%
55
%
2%
3%
35
%
3%
7%
5%
2012 Lodging by Overnight Visitors to North Carolina's Mountain Region
2012
2011
2010
2009
*percentages do not add to 100% due to multiple responses.
2012 North Carolina Regional Travel Summary – Mountain Region
43 | P a g e
Mode of Transportation
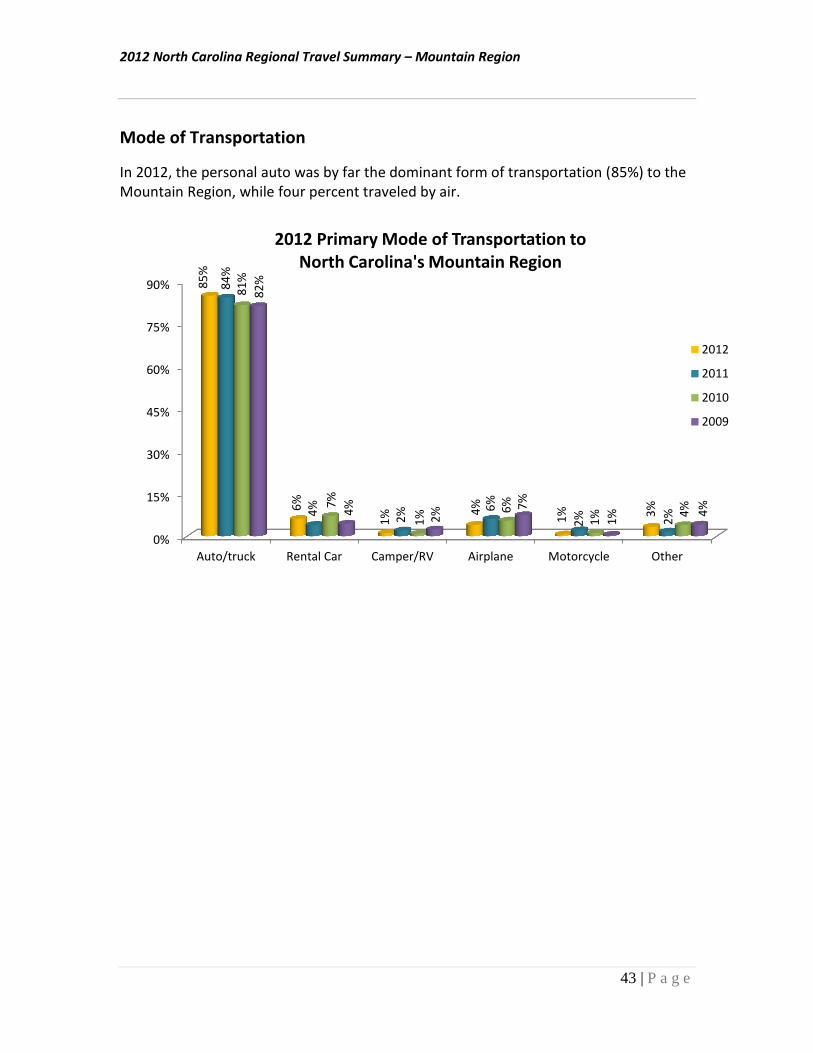
In 2012, the personal auto was by far the dominant form of transportation (85%) to the Mountain Region, while four percent traveled by air.
0%
15%
30%
45%
60%
75%
90%
Auto/truck Rental Car Camper/RV Airplane Motorcycle Other
85
%
6%
1%
4%
1%
3%
84
%
4%
2%
6%
2%
2%
82
%
7%
1%
6%
1%
4%
81
%
4%
2%
7%
1%
4%
2012 Primary Mode of Transportation to North Carolina's Mountain Region
2012
2011
2010
2009
2012 North Carolina Regional Travel Summary – Mountain Region
44 | P a g e
Amount Spent in Mountain Region
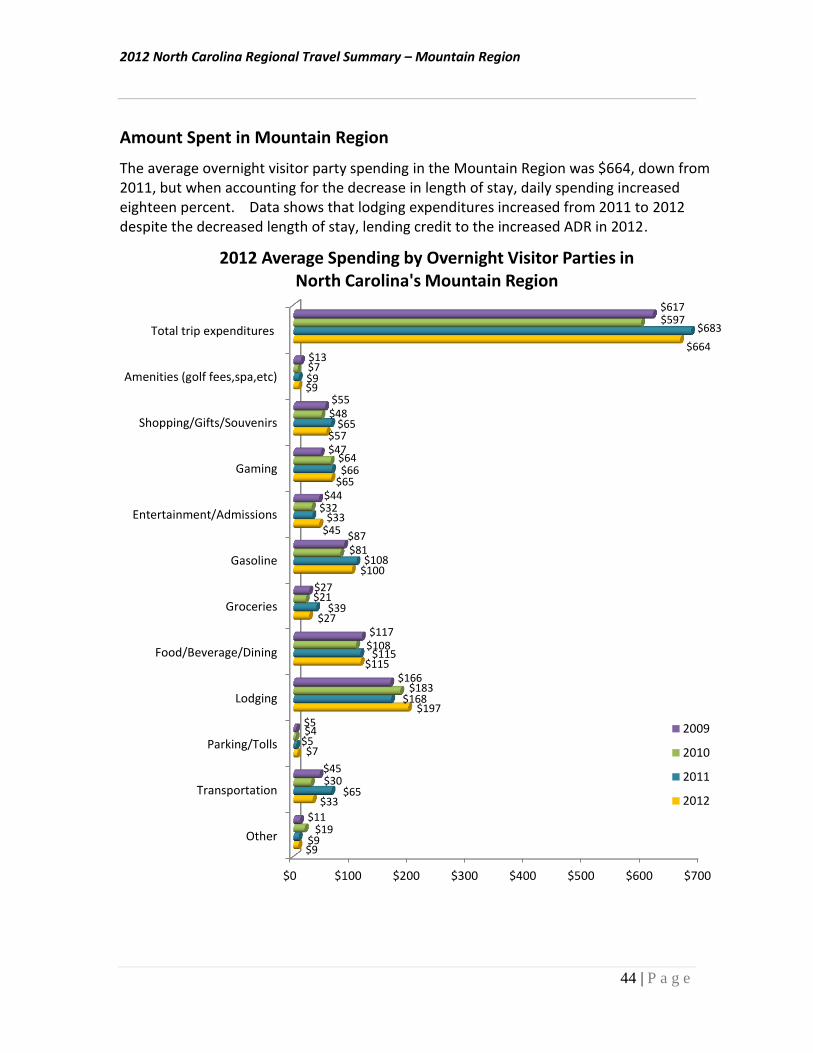
The average overnight visitor party spending in the Mountain Region was $664, down from 2011, but when accounting for the decrease in length of stay, daily spending increased eighteen percent. Data shows that lodging expenditures increased from 2011 to 2012 despite the decreased length of stay, lending credit to the increased ADR in 2012.
$0 $100 $200 $300 $400 $500 $600 $700
Other
Transportation
Parking/Tolls
Lodging
Food/Beverage/Dining
Groceries
Gasoline
Entertainment/Admissions
Gaming
Shopping/Gifts/Souvenirs
Amenities (golf fees,spa,etc)
Total trip expenditures
$9
$33
$7
$197
$115
$27
$100
$45
$65
$57
$9
$664
$9
$65
$5
$168
$115
$39
$108
$33
$66
$65
$9
$683
$19
$30
$4
$183
$108
$21
$81
$32
$64
$48
$7
$597
$11
$45
$5
$166
$117
$27
$87
$44
$47
$55
$13
$617
2012 Average Spending by Overnight Visitor Parties in North Carolina's Mountain Region
2009
2010
2011
2012
2012 North Carolina Regional Travel Summary – Mountain Region
45 | P a g e
Origin of Visitors
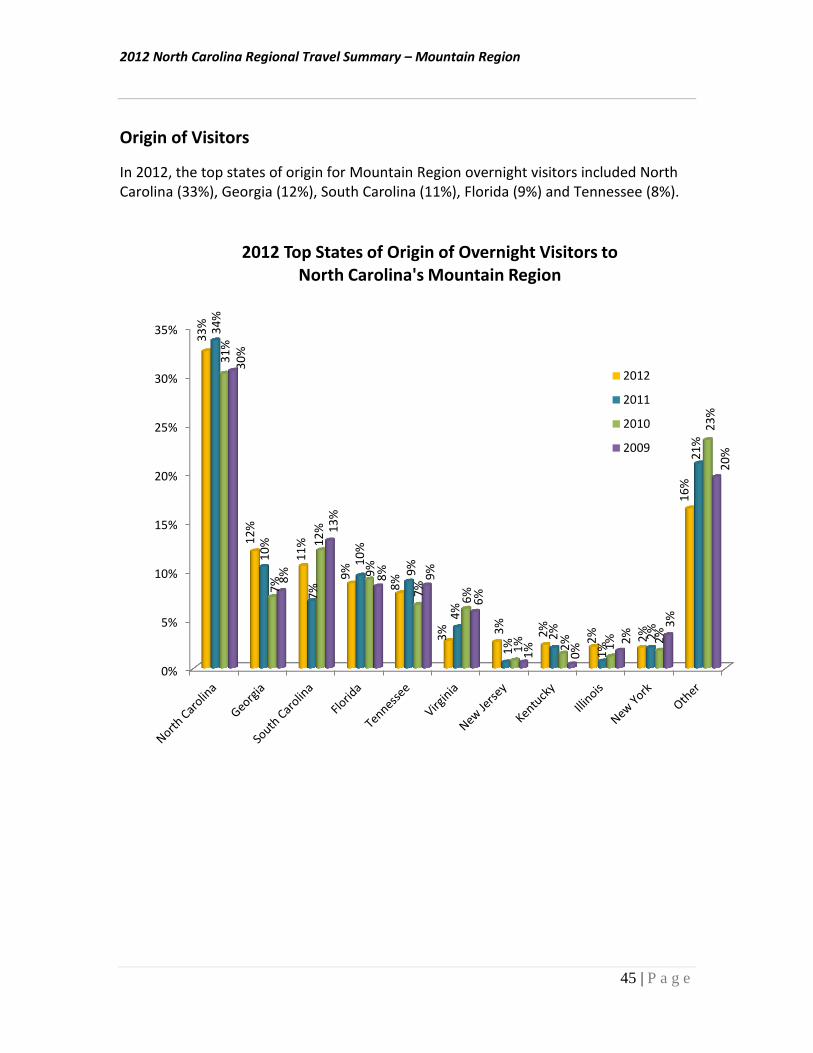
In 2012, the top states of origin for Mountain Region overnight visitors included North Carolina (33%), Georgia (12%), South Carolina (11%), Florida (9%) and Tennessee (8%).
0%
5%
10%
15%
20%
25%
30%
35%
33
%
12
%
11
%
9%
8%
3%
3%
2%
2%
2%
16
%
34
%
10
%
7%
10
%
9%
4%
1%
2%
1%
2%
21
%
30
%
7%
12
%
9%
7%
6%
1%
2%
1%
2%
23
%
31
%
8%
13
%
8%
9%
6%
1%
0%
2%
3%
20
%
2012 Top States of Origin of Overnight Visitors to North Carolina's Mountain Region
2012
2011
2010
2009
2012 North Carolina Regional Travel Summary – Mountain Region
46 | P a g e
Activities
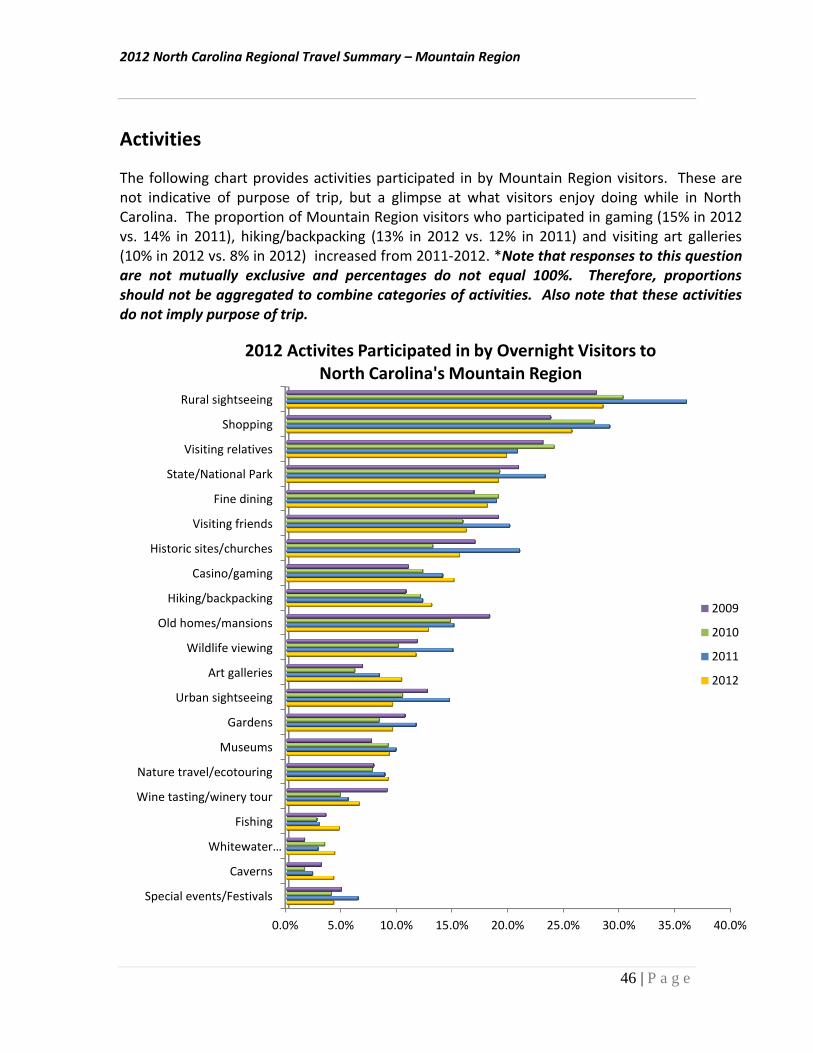
The following chart provides activities participated in by Mountain Region visitors. These are not indicative of purpose of trip, but a glimpse at what visitors enjoy doing while in North Carolina. The proportion of Mountain Region visitors who participated in gaming (15% in 2012 vs. 14% in 2011), hiking/backpacking (13% in 2012 vs. 12% in 2011) and visiting art galleries (10% in 2012 vs. 8% in 2012) increased from 2011-2012. *Note that responses to this question are not mutually exclusive and percentages do not equal 100%. Therefore, proportions should not be aggregated to combine categories of activities. Also note that these activities do not imply purpose of trip.
0.0% 5.0% 10.0% 15.0% 20.0% 25.0% 30.0% 35.0% 40.0%
Special events/Festivals
Caverns
Whitewater…
Fishing
Wine tasting/winery tour
Nature travel/ecotouring
Museums
Gardens
Urban sightseeing
Art galleries
Wildlife viewing
Old homes/mansions
Hiking/backpacking
Casino/gaming
Historic sites/churches
Visiting friends
Fine dining
State/National Park
Visiting relatives
Shopping
Rural sightseeing
2012 Activites Participated in by Overnight Visitors to North Carolina's Mountain Region
2009
2010
2011
2012
2012 North Carolina Regional Travel Summary – Mountain Region
47 | P a g e
2012 Demographic Profile of North Carolina Overnight Visitors to the Mountain Region The North Carolina Mountain Region overnight visitor gender breakdown is fifty-two percent female and forty-eight percent male. More than half (59%) of the visitors are married and just under one-fifth of the region’s visitors are divorced, widowed or separated. The largest proportion of North Carolina Mountain Region overnight visitors classify themselves as white (89.5%), and just nearly four (3.6%) percent classify themselves as black/African American. Over half (61%) of Mountain Region overnight visitor parties have a household head with a college degree or higher. The average Mountain Region visitor is 47 years old, with over half (52.4%) being 45 years old or older. Thirty-three percent of the visitor parties that traveled to North Carolina’s Mountain Region in 2011 had a household income $75,000 or over. Eleven percent had a household income of over $125,000.
2012 North Carolina Regional Travel Summary – Mountain Region
48 | P a g e
2012 Top Advertising Markets
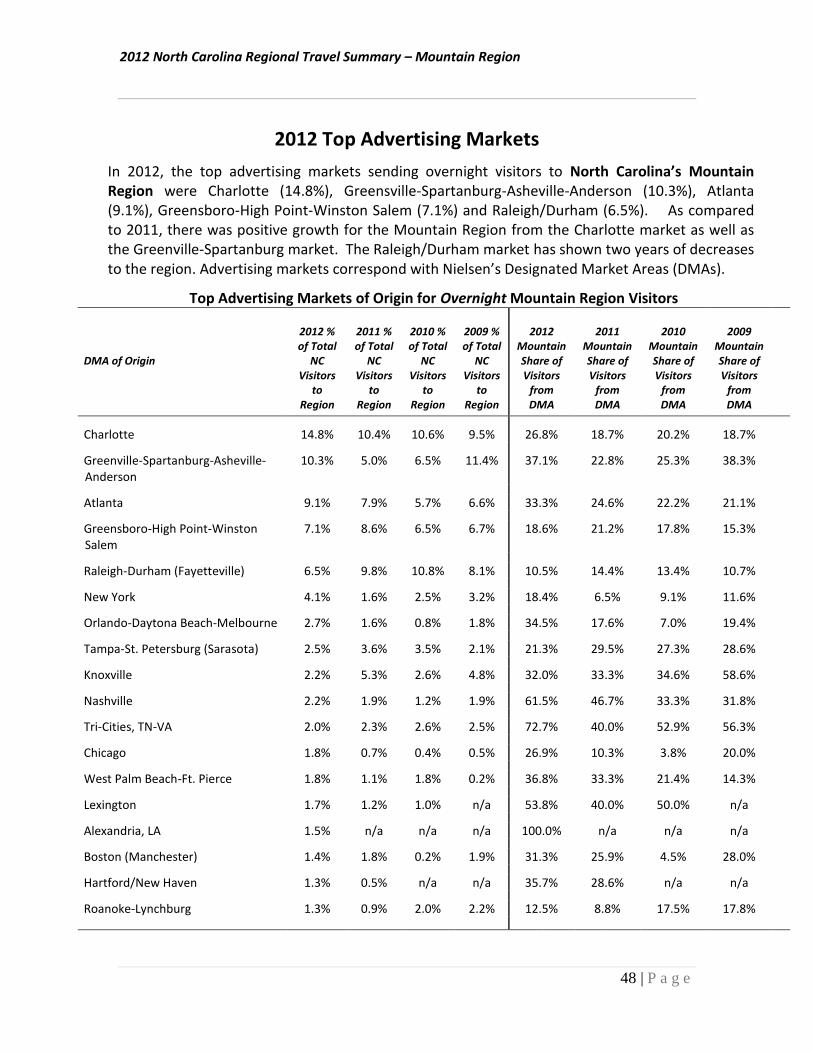
In 2012, the top advertising markets sending overnight visitors to North Carolina’s Mountain Region were Charlotte (14.8%), Greensville-Spartanburg-Asheville-Anderson (10.3%), Atlanta (9.1%), Greensboro-High Point-Winston Salem (7.1%) and Raleigh/Durham (6.5%). As compared to 2011, there was positive growth for the Mountain Region from the Charlotte market as well as the Greenville-Spartanburg market. The Raleigh/Durham market has shown two years of decreases to the region. Advertising markets correspond with Nielsen’s Designated Market Areas (DMAs).
Top Advertising Markets of Origin for Overnight Mountain Region Visitors
DMA of Origin
2012 % of Total
NC Visitors
to Region
2011 % of Total
NC Visitors
to Region
2010 % of Total
NC Visitors
to Region
2009 % of Total
NC Visitors
to Region
2012 Mountain Share of Visitors
from DMA
2011 Mountain Share of Visitors
from DMA
2010 Mountain Share of Visitors
from DMA
2009 Mountain Share of Visitors
from DMA
Charlotte 14.8% 10.4% 10.6% 9.5% 26.8% 18.7% 20.2% 18.7%
Greenville-Spartanburg-Asheville-Anderson
10.3% 5.0% 6.5% 11.4% 37.1% 22.8% 25.3% 38.3%
Atlanta 9.1% 7.9% 5.7% 6.6% 33.3% 24.6% 22.2% 21.1%
Greensboro-High Point-Winston Salem
7.1% 8.6% 6.5% 6.7% 18.6% 21.2% 17.8% 15.3%
Raleigh-Durham (Fayetteville) 6.5% 9.8% 10.8% 8.1% 10.5% 14.4% 13.4% 10.7%
New York 4.1% 1.6% 2.5% 3.2% 18.4% 6.5% 9.1% 11.6%
Orlando-Daytona Beach-Melbourne 2.7% 1.6% 0.8% 1.8% 34.5% 17.6% 7.0% 19.4%
Tampa-St. Petersburg (Sarasota) 2.5% 3.6% 3.5% 2.1% 21.3% 29.5% 27.3% 28.6%
Knoxville 2.2% 5.3% 2.6% 4.8% 32.0% 33.3% 34.6% 58.6%
Nashville 2.2% 1.9% 1.2% 1.9% 61.5% 46.7% 33.3% 31.8%
Tri-Cities, TN-VA 2.0% 2.3% 2.6% 2.5% 72.7% 40.0% 52.9% 56.3%
Chicago 1.8% 0.7% 0.4% 0.5% 26.9% 10.3% 3.8% 20.0%
West Palm Beach-Ft. Pierce 1.8% 1.1% 1.8% 0.2% 36.8% 33.3% 21.4% 14.3%
Lexington 1.7% 1.2% 1.0% n/a 53.8% 40.0% 50.0% n/a
Alexandria, LA 1.5% n/a n/a n/a 100.0% n/a n/a n/a
Boston (Manchester) 1.4% 1.8% 0.2% 1.9% 31.3% 25.9% 4.5% 28.0%
Hartford/New Haven 1.3% 0.5% n/a n/a 35.7% 28.6% n/a n/a
Roanoke-Lynchburg 1.3% 0.9% 2.0% 2.2% 12.5% 8.8% 17.5% 17.8%
2012 North Carolina Regional Travel Summary – Mountain Region vs. North Carolina
49 | P a g e
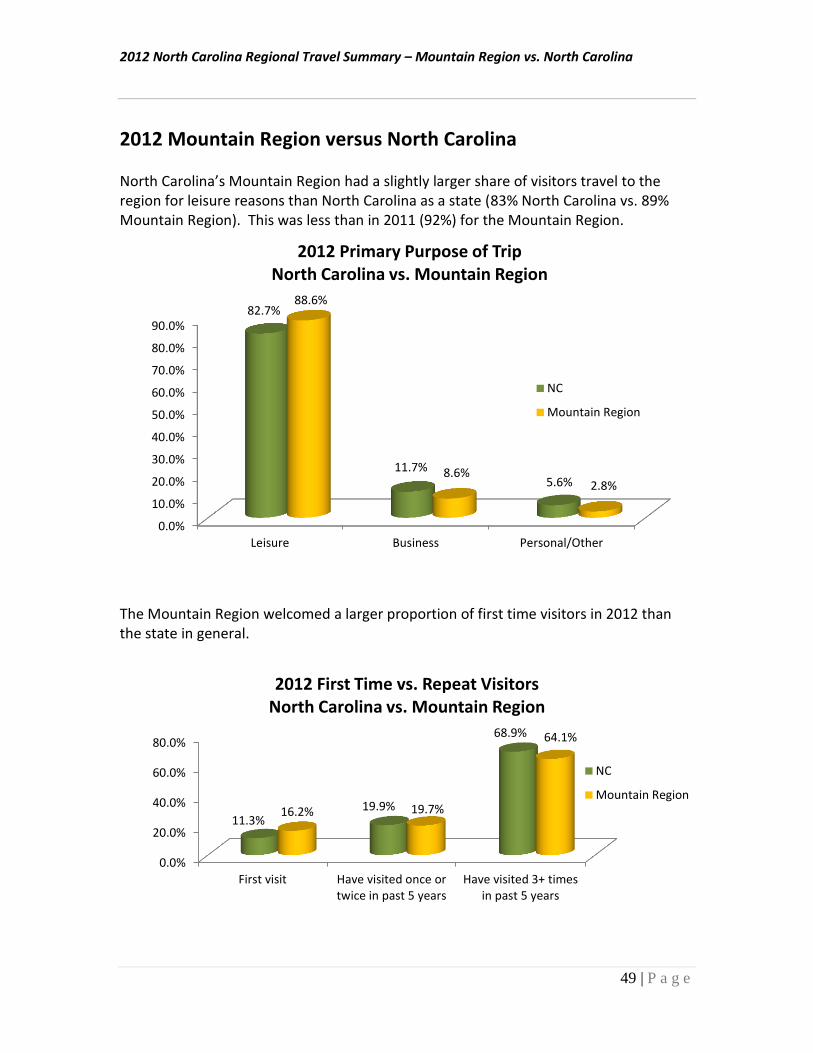
2012 Mountain Region versus North Carolina North Carolina’s Mountain Region had a slightly larger share of visitors travel to the region for leisure reasons than North Carolina as a state (83% North Carolina vs. 89% Mountain Region). This was less than in 2011 (92%) for the Mountain Region.
The Mountain Region welcomed a larger proportion of first time visitors in 2012 than the state in general.
0.0%
10.0%
20.0%
30.0%
40.0%
50.0%
60.0%
70.0%
80.0%
90.0%
Leisure Business Personal/Other
82.7%
11.7% 5.6%
88.6%
8.6% 2.8%
2012 Primary Purpose of Trip North Carolina vs. Mountain Region
NC
Mountain Region
0.0%
20.0%
40.0%
60.0%
80.0%
First visit Have visited once ortwice in past 5 years
Have visited 3+ timesin past 5 years
11.3% 19.9%
68.9%
16.2% 19.7%
64.1%
2012 First Time vs. Repeat Visitors North Carolina vs. Mountain Region
NC
Mountain Region
2012 North Carolina Regional Travel Summary – Mountain Region vs. North Carolina
50 | P a g e
Travel Volume by Season
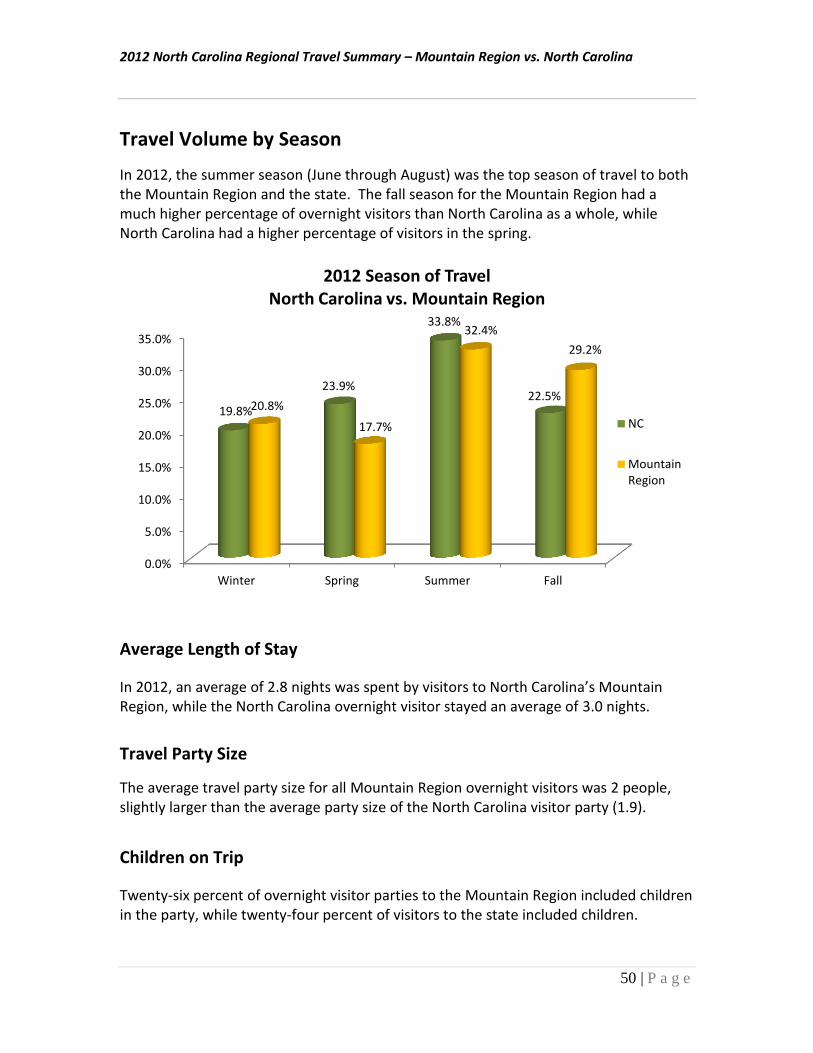
In 2012, the summer season (June through August) was the top season of travel to both the Mountain Region and the state. The fall season for the Mountain Region had a much higher percentage of overnight visitors than North Carolina as a whole, while North Carolina had a higher percentage of visitors in the spring.
Average Length of Stay
In 2012, an average of 2.8 nights was spent by visitors to North Carolina’s Mountain Region, while the North Carolina overnight visitor stayed an average of 3.0 nights.
Travel Party Size
The average travel party size for all Mountain Region overnight visitors was 2 people, slightly larger than the average party size of the North Carolina visitor party (1.9).
Children on Trip
Twenty-six percent of overnight visitor parties to the Mountain Region included children in the party, while twenty-four percent of visitors to the state included children.
0.0%
5.0%
10.0%
15.0%
20.0%
25.0%
30.0%
35.0%
Winter Spring Summer Fall
19.8%
23.9%
33.8%
22.5% 20.8%
17.7%
32.4%
29.2%
2012 Season of Travel North Carolina vs. Mountain Region
NC
MountainRegion
2012 North Carolina Regional Travel Summary – Mountain Region vs. North Carolina
51 | P a g e
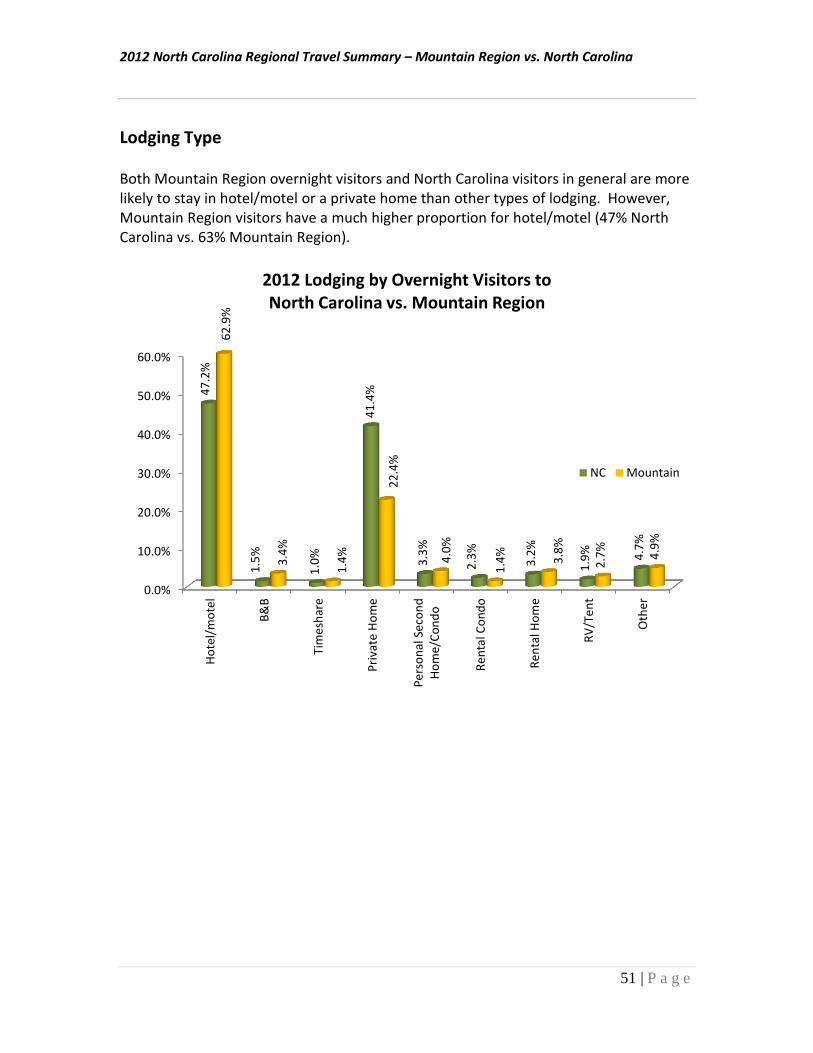
Lodging Type
Both Mountain Region overnight visitors and North Carolina visitors in general are more likely to stay in hotel/motel or a private home than other types of lodging. However, Mountain Region visitors have a much higher proportion for hotel/motel (47% North Carolina vs. 63% Mountain Region).
0.0%
10.0%
20.0%
30.0%
40.0%
50.0%
60.0%
Ho
tel/
mo
tel
B&
B
Tim
esh
are
Pri
vate
Ho
me
Pe
rso
nal
Se
con
dH
om
e/C
on
do
Re
nta
l Co
nd
o
Re
nta
l Ho
me
RV
/Te
nt
Oth
er
47
.2%
1.5
%
1.0
%
41
.4%
3.3
%
2.3
%
3.2
%
1.9
%
4.7
%
62
.9%
3.4
%
1.4
%
22
.4%
4.0
%
1.4
%
3.8
%
2.7
%
4.9
%
2012 Lodging by Overnight Visitors to North Carolina vs. Mountain Region
NC Mountain
2012 North Carolina Regional Travel Summary – Mountain Region vs. North Carolina
52 | P a g e
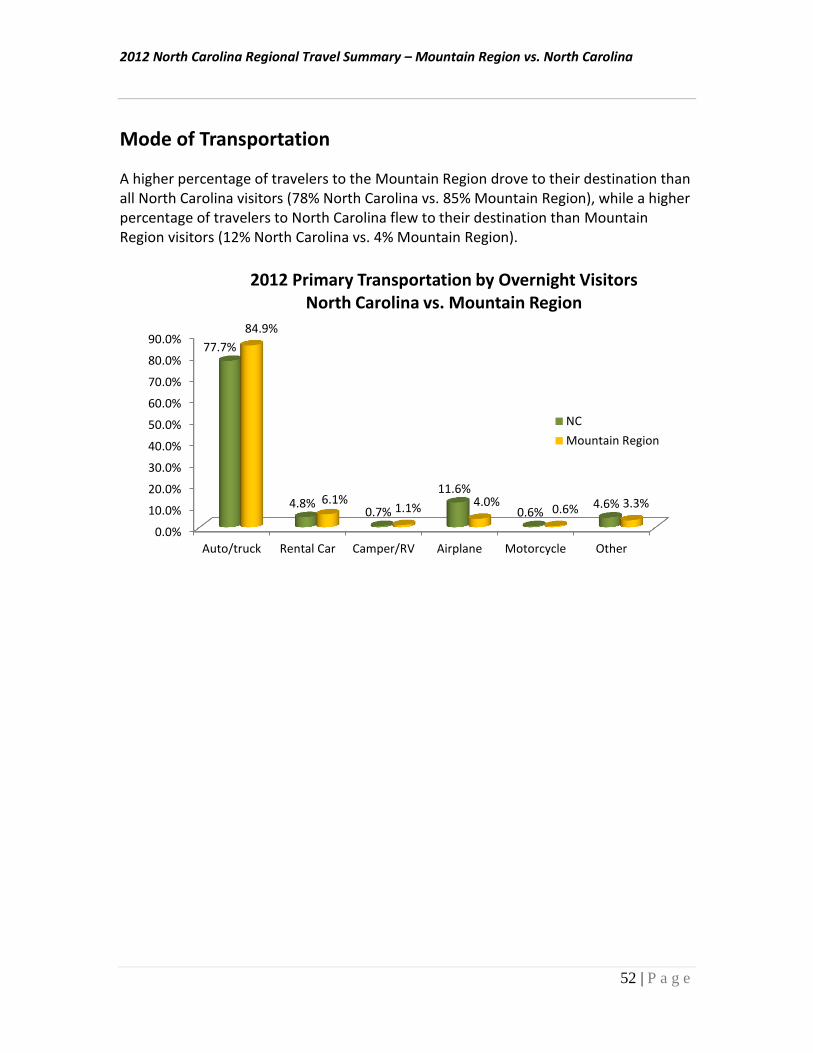
Mode of Transportation
A higher percentage of travelers to the Mountain Region drove to their destination than all North Carolina visitors (78% North Carolina vs. 85% Mountain Region), while a higher percentage of travelers to North Carolina flew to their destination than Mountain Region visitors (12% North Carolina vs. 4% Mountain Region).
0.0%
10.0%
20.0%
30.0%
40.0%
50.0%
60.0%
70.0%
80.0%
90.0%
Auto/truck Rental Car Camper/RV Airplane Motorcycle Other
77.7%
4.8% 0.7%
11.6%
0.6% 4.6%
84.9%
6.1% 1.1% 4.0%
0.6% 3.3%
2012 Primary Transportation by Overnight Visitors North Carolina vs. Mountain Region
NC
Mountain Region
2012 North Carolina Regional Travel Summary – Mountain Region vs. North Carolina
53 | P a g e
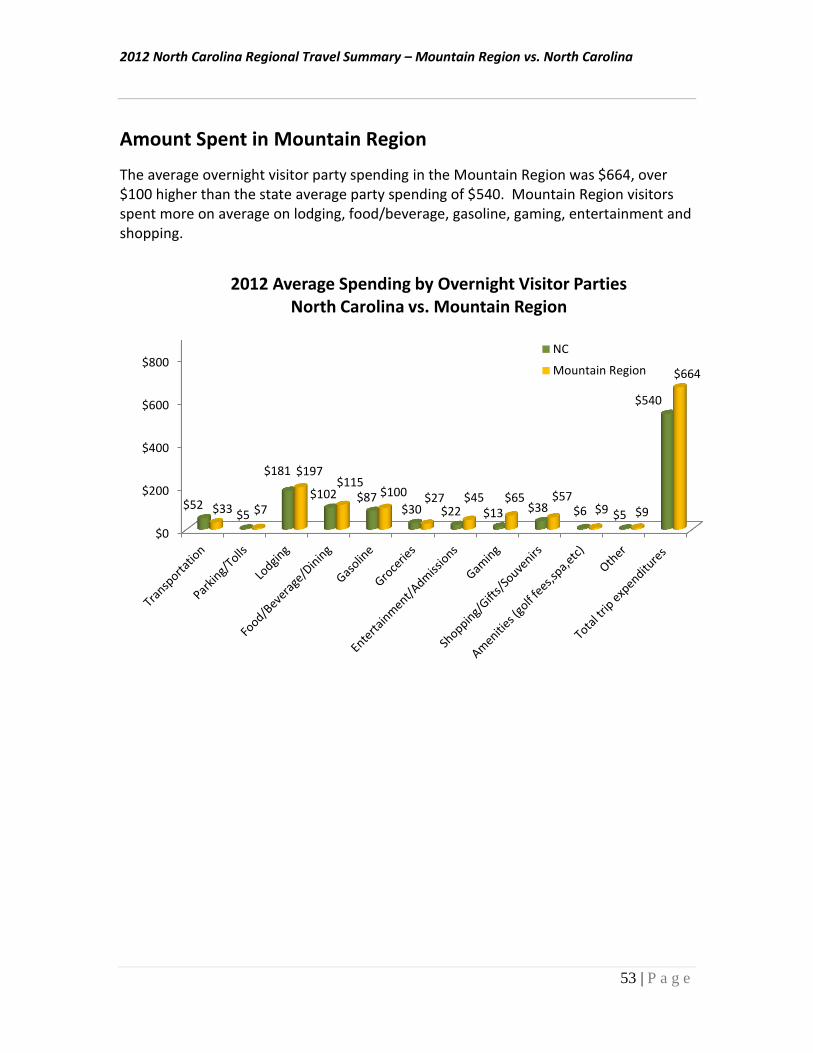
Amount Spent in Mountain Region
The average overnight visitor party spending in the Mountain Region was $664, over $100 higher than the state average party spending of $540. Mountain Region visitors spent more on average on lodging, food/beverage, gasoline, gaming, entertainment and shopping.
$0
$200
$400
$600
$800
$52 $5
$181
$102 $87 $30 $22 $13 $38 $6 $5
$540
$33 $7
$197 $115
$100 $27 $45 $65 $57 $9 $9
$664
2012 Average Spending by Overnight Visitor Parties North Carolina vs. Mountain Region
NC
Mountain Region
2012 North Carolina Regional Travel Summary – Mountain Region vs. North Carolina
54 | P a g e
Origin of Overnight Visitors
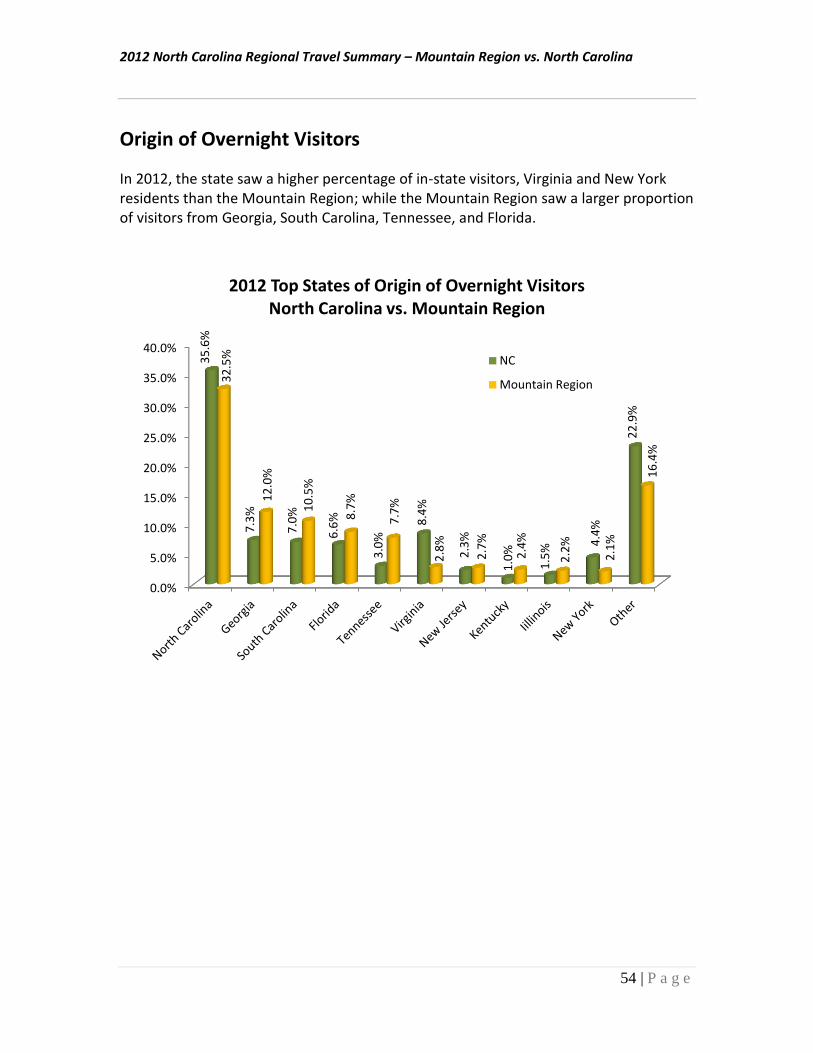
In 2012, the state saw a higher percentage of in-state visitors, Virginia and New York residents than the Mountain Region; while the Mountain Region saw a larger proportion of visitors from Georgia, South Carolina, Tennessee, and Florida.
0.0%
5.0%
10.0%
15.0%
20.0%
25.0%
30.0%
35.0%
40.0%
35
.6%
7.3
%
7.0
%
6.6
%
3.0
%
8.4
%
2.3
%
1.0
%
1.5
% 4.4
%
22
.9%
32
.5%
12
.0%
10
.5%
8.7
%
7.7
%
2.8
%
2.7
%
2.4
%
2.2
%
2.1
%
16
.4%
2012 Top States of Origin of Overnight Visitors North Carolina vs. Mountain Region
NC
Mountain Region
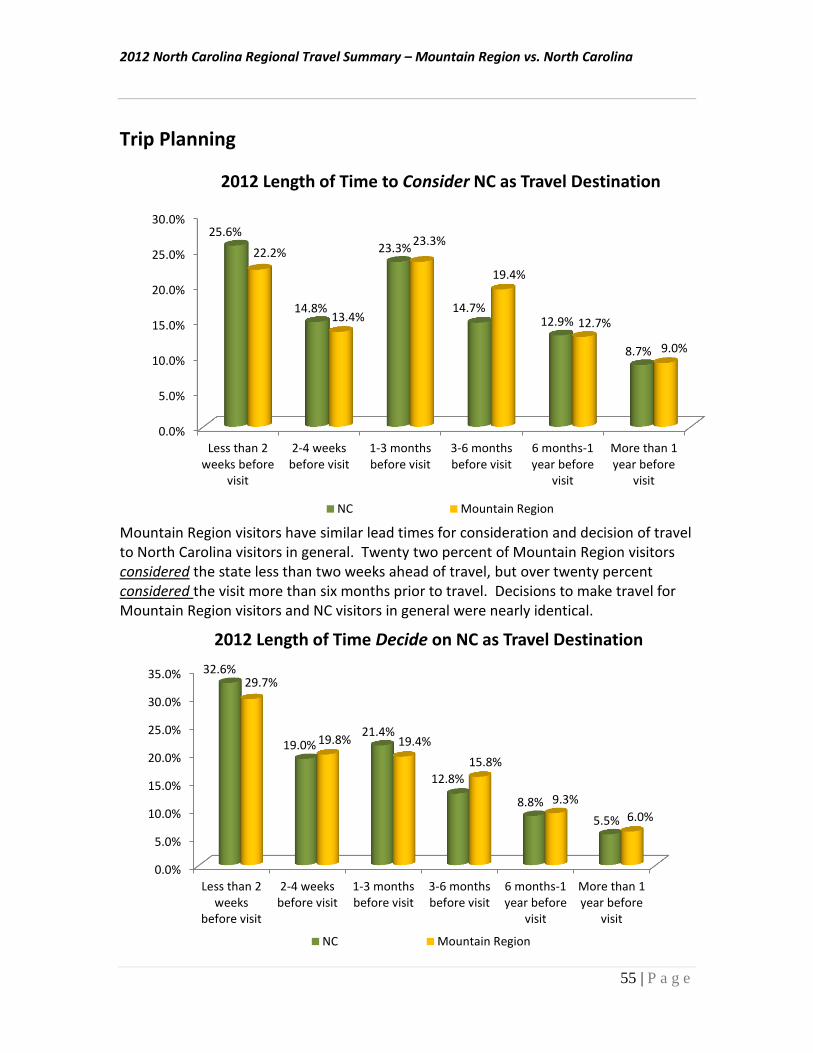
2012 North Carolina Regional Travel Summary – Mountain Region vs. North Carolina
55 | P a g e
Trip Planning
Mountain Region visitors have similar lead times for consideration and decision of travel to North Carolina visitors in general. Twenty two percent of Mountain Region visitors considered the state less than two weeks ahead of travel, but over twenty percent considered the visit more than six months prior to travel. Decisions to make travel for Mountain Region visitors and NC visitors in general were nearly identical.
0.0%
5.0%
10.0%
15.0%
20.0%
25.0%
30.0%
Less than 2weeks before
visit
2-4 weeksbefore visit
1-3 monthsbefore visit
3-6 monthsbefore visit
6 months-1year before
visit
More than 1year before
visit
25.6%
14.8%
23.3%
14.7% 12.9%
8.7%
22.2%
13.4%
23.3%
19.4%
12.7%
9.0%
2012 Length of Time to Consider NC as Travel Destination
NC Mountain Region
0.0%
5.0%
10.0%
15.0%
20.0%
25.0%
30.0%
35.0%
Less than 2weeks
before visit
2-4 weeksbefore visit
1-3 monthsbefore visit
3-6 monthsbefore visit
6 months-1year before
visit
More than 1year before
visit
32.6%
19.0% 21.4%
12.8%
8.8%
5.5%
29.7%
19.8% 19.4%
15.8%
9.3%
6.0%
2012 Length of Time Decide on NC as Travel Destination
NC Mountain Region
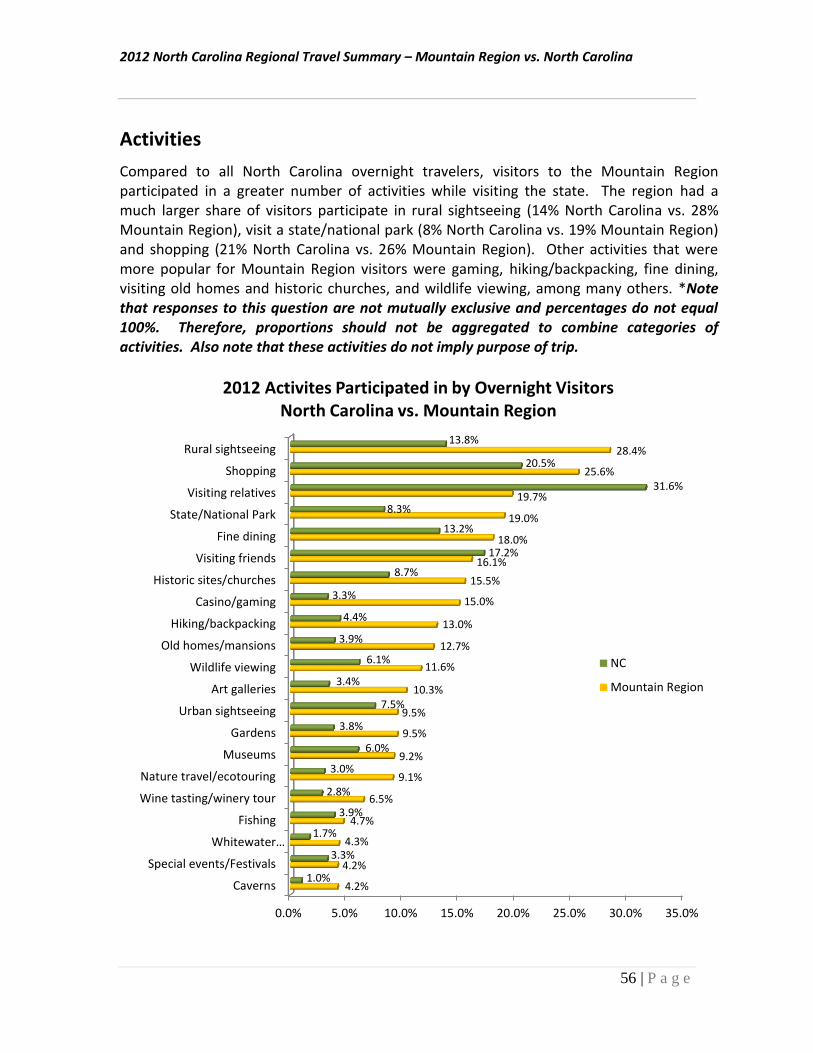
2012 North Carolina Regional Travel Summary – Mountain Region vs. North Carolina
56 | P a g e
Activities
Compared to all North Carolina overnight travelers, visitors to the Mountain Region participated in a greater number of activities while visiting the state. The region had a much larger share of visitors participate in rural sightseeing (14% North Carolina vs. 28% Mountain Region), visit a state/national park (8% North Carolina vs. 19% Mountain Region) and shopping (21% North Carolina vs. 26% Mountain Region). Other activities that were more popular for Mountain Region visitors were gaming, hiking/backpacking, fine dining, visiting old homes and historic churches, and wildlife viewing, among many others. *Note that responses to this question are not mutually exclusive and percentages do not equal 100%. Therefore, proportions should not be aggregated to combine categories of activities. Also note that these activities do not imply purpose of trip.
0.0% 5.0% 10.0% 15.0% 20.0% 25.0% 30.0% 35.0%
Caverns
Special events/Festivals
Whitewater…
Fishing
Wine tasting/winery tour
Nature travel/ecotouring
Museums
Gardens
Urban sightseeing
Art galleries
Wildlife viewing
Old homes/mansions
Hiking/backpacking
Casino/gaming
Historic sites/churches
Visiting friends
Fine dining
State/National Park
Visiting relatives
Shopping
Rural sightseeing
4.2%
4.2%
4.3%
4.7%
6.5%
9.1%
9.2%
9.5%
9.5%
10.3%
11.6%
12.7%
13.0%
15.0%
15.5%
16.1%
18.0%
19.0%
19.7%
25.6%
28.4%
1.0%
3.3%
1.7%
3.9%
2.8%
3.0%
6.0%
3.8%
7.5%
3.4%
6.1%
3.9%
4.4%
3.3%
8.7%
17.2%
13.2%
8.3%
31.6%
20.5%
13.8%
2012 Activites Participated in by Overnight Visitors North Carolina vs. Mountain Region
NC
Mountain Region
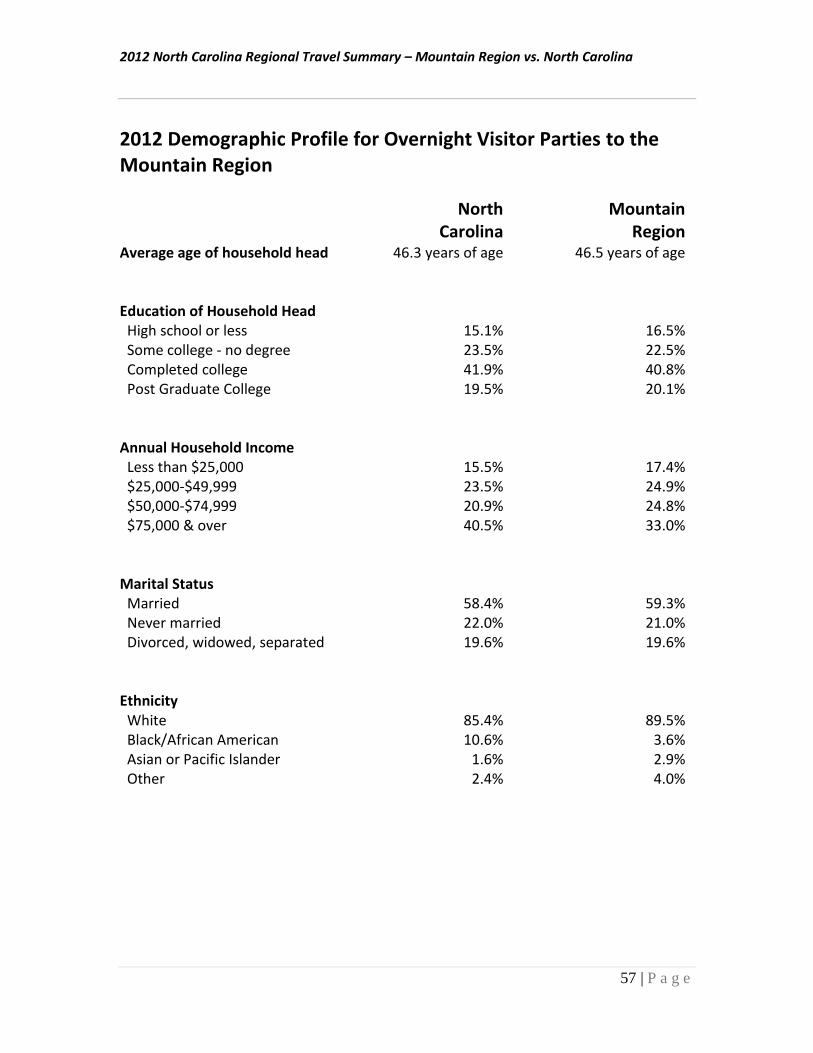
2012 North Carolina Regional Travel Summary – Mountain Region vs. North Carolina
57 | P a g e
2012 Demographic Profile for Overnight Visitor Parties to the Mountain Region
North Carolina
Mountain Region
Average age of household head 46.3 years of age 46.5 years of age
Education of Household Head High school or less 15.1% 16.5% Some college - no degree 23.5% 22.5% Completed college 41.9% 40.8% Post Graduate College 19.5% 20.1%
Annual Household Income Less than $25,000 15.5% 17.4% $25,000-$49,999 23.5% 24.9% $50,000-$74,999 20.9% 24.8% $75,000 & over 40.5% 33.0%
Marital Status Married 58.4% 59.3% Never married 22.0% 21.0% Divorced, widowed, separated 19.6% 19.6% Ethnicity White 85.4% 89.5% Black/African American 10.6% 3.6% Asian or Pacific Islander 1.6% 2.9% Other 2.4% 4.0%
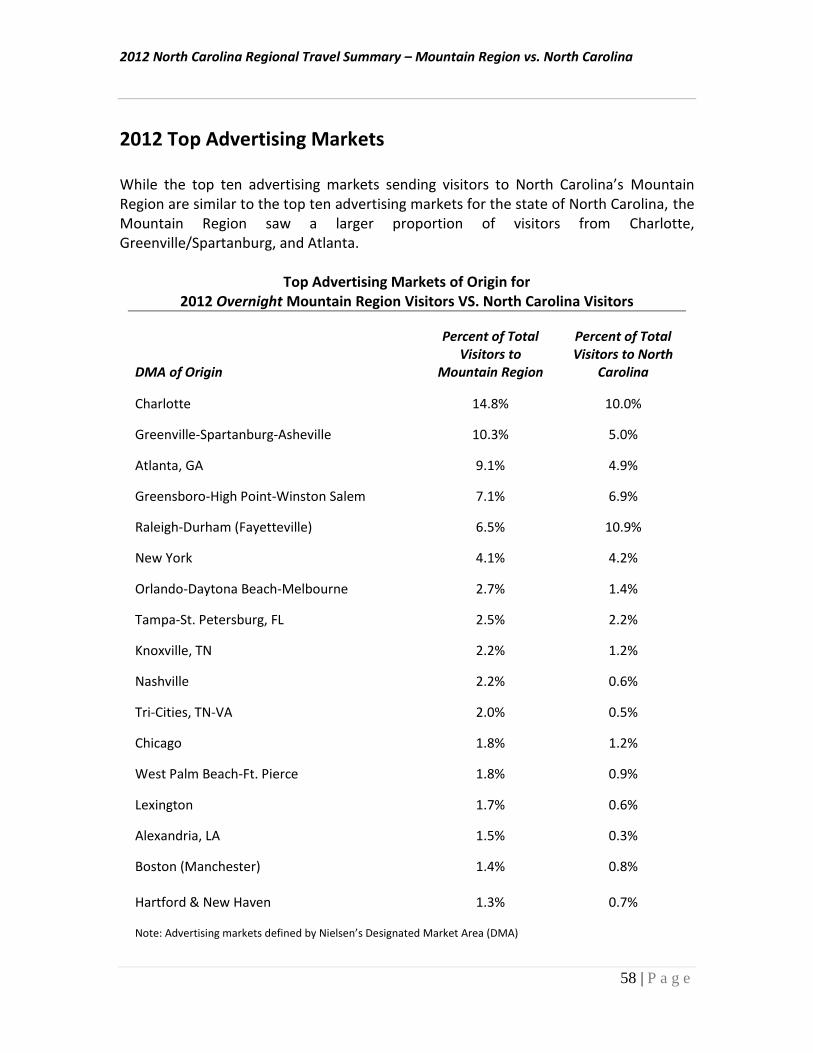
2012 North Carolina Regional Travel Summary – Mountain Region vs. North Carolina
58 | P a g e
2012 Top Advertising Markets While the top ten advertising markets sending visitors to North Carolina’s Mountain Region are similar to the top ten advertising markets for the state of North Carolina, the Mountain Region saw a larger proportion of visitors from Charlotte, Greenville/Spartanburg, and Atlanta.
Top Advertising Markets of Origin for 2012 Overnight Mountain Region Visitors VS. North Carolina Visitors
DMA of Origin
Percent of Total Visitors to
Mountain Region
Percent of Total Visitors to North
Carolina
Charlotte 14.8% 10.0%
Greenville-Spartanburg-Asheville 10.3% 5.0%
Atlanta, GA 9.1% 4.9%
Greensboro-High Point-Winston Salem 7.1% 6.9%
Raleigh-Durham (Fayetteville) 6.5% 10.9%
New York 4.1% 4.2%
Orlando-Daytona Beach-Melbourne 2.7% 1.4%
Tampa-St. Petersburg, FL 2.5% 2.2%
Knoxville, TN 2.2% 1.2%
Nashville 2.2% 0.6%
Tri-Cities, TN-VA 2.0% 0.5%
Chicago 1.8% 1.2%
West Palm Beach-Ft. Pierce 1.8% 0.9%
Lexington 1.7% 0.6%
Alexandria, LA 1.5% 0.3%
Boston (Manchester) 1.4% 0.8% Hartford & New Haven 1.3% 0.7% Note: Advertising markets defined by Nielsen’s Designated Market Area (DMA)

2012 North Carolina Regional Travel Summary –
Coastal Region vs. Piedmont Region vs. Mountain Region
59 | P a g e
2012 Regional Comparison The following section provides graphical representations of the three geographic regions together in order to offer comparisons and contrasts of the regions’ visitors. Not surprisingly, North Carolina’s Coastal and Mountain regions had larger shares of visitors travel to the regions for leisure reasons than the Piedmont Region. At the same time, the Piedmont Region’s share of business/convention travelers was larger than the proportion for the other regions.
0.0%
20.0%
40.0%
60.0%
80.0%
100.0%
NC Coastal Region Piedmont Region Mountain Region
82
.7%
91
.4%
76
.0%
88
.6%
11
.7%
4.6
% 1
7.2
%
8.6
%
5.6
%
4.0
%
6.8
%
2.8
%
2012 Primary Purpose of Trip by Region
Leisure
Business
Personal/Other
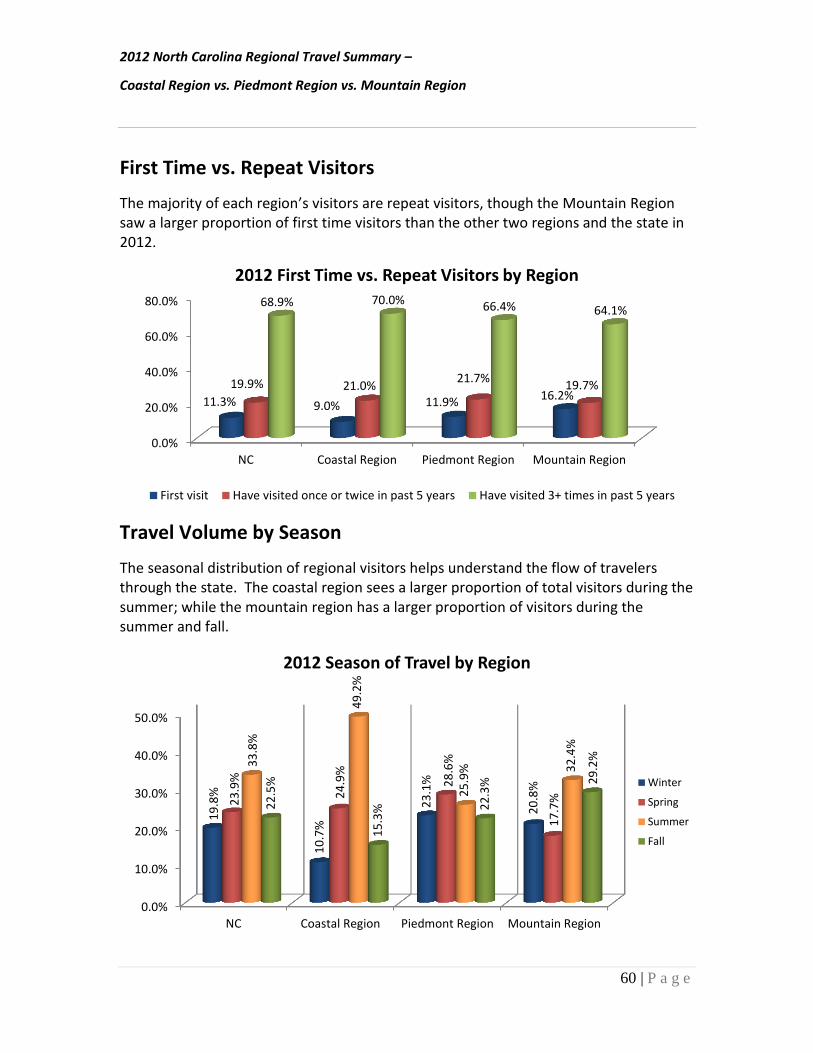
2012 North Carolina Regional Travel Summary –
Coastal Region vs. Piedmont Region vs. Mountain Region
60 | P a g e
First Time vs. Repeat Visitors
The majority of each region’s visitors are repeat visitors, though the Mountain Region saw a larger proportion of first time visitors than the other two regions and the state in 2012.
Travel Volume by Season
The seasonal distribution of regional visitors helps understand the flow of travelers through the state. The coastal region sees a larger proportion of total visitors during the summer; while the mountain region has a larger proportion of visitors during the summer and fall.
0.0%
20.0%
40.0%
60.0%
80.0%
NC Coastal Region Piedmont Region Mountain Region
11.3% 9.0% 11.9% 16.2% 19.9% 21.0%
21.7% 19.7%
68.9% 70.0% 66.4% 64.1%
2012 First Time vs. Repeat Visitors by Region
First visit Have visited once or twice in past 5 years Have visited 3+ times in past 5 years
0.0%
10.0%
20.0%
30.0%
40.0%
50.0%
NC Coastal Region Piedmont Region Mountain Region
19
.8%
10
.7%
23
.1%
20
.8%
23
.9%
24
.9%
28
.6%
17
.7%
33
.8%
49
.2%
25
.9%
32
.4%
22
.5%
15
.3%
22
.3%
29
.2%
2012 Season of Travel by Region
Winter
Spring
Summer
Fall
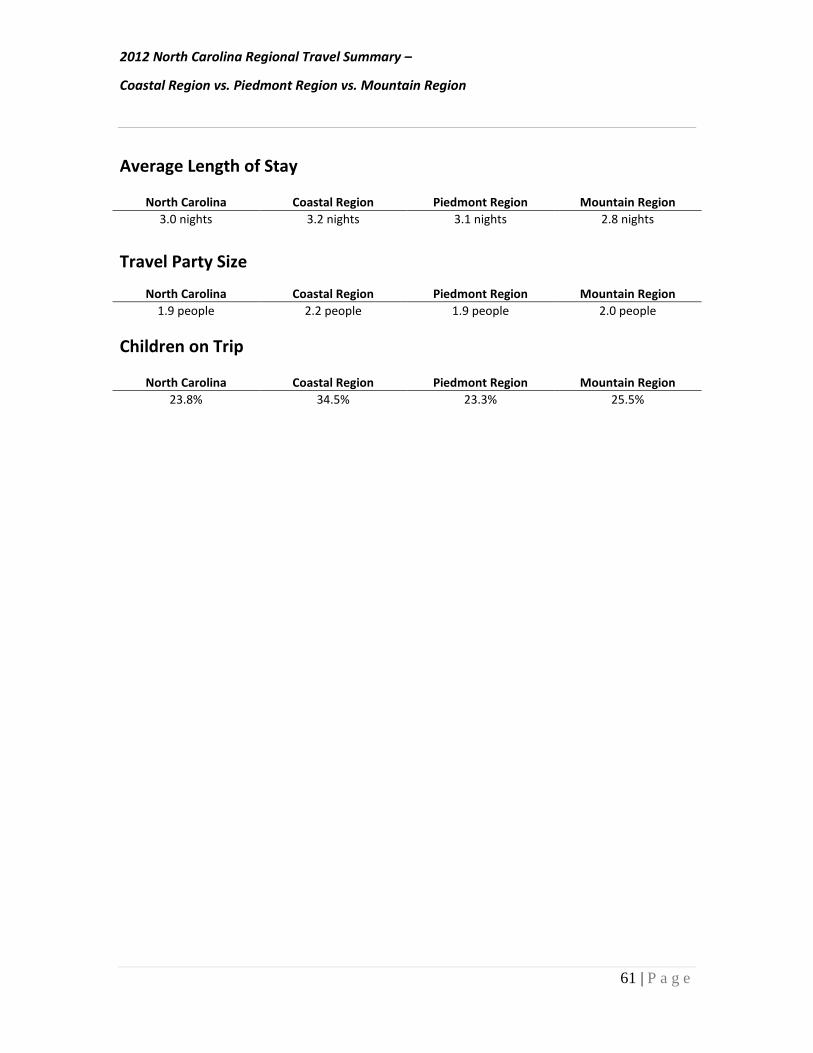
2012 North Carolina Regional Travel Summary –
Coastal Region vs. Piedmont Region vs. Mountain Region
61 | P a g e
Average Length of Stay
North Carolina Coastal Region Piedmont Region Mountain Region
3.0 nights 3.2 nights 3.1 nights 2.8 nights
Travel Party Size
North Carolina Coastal Region Piedmont Region Mountain Region
1.9 people 2.2 people 1.9 people 2.0 people
Children on Trip
North Carolina Coastal Region Piedmont Region Mountain Region
23.8% 34.5% 23.3% 25.5%
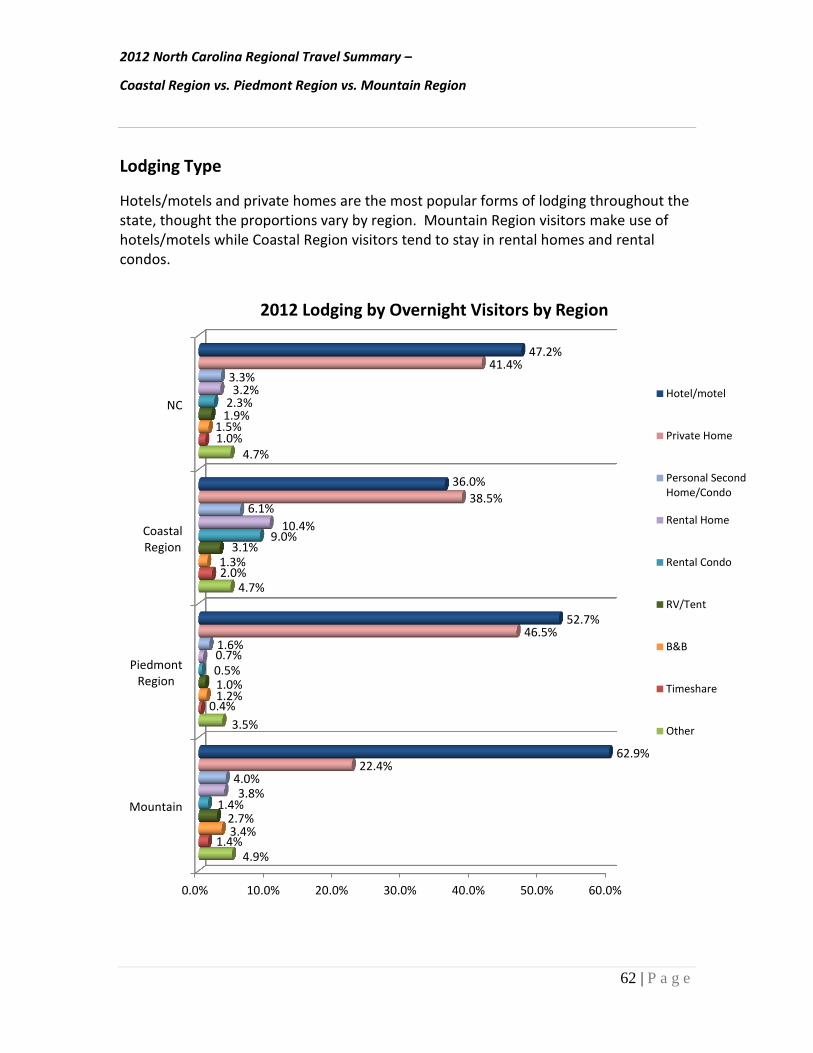
2012 North Carolina Regional Travel Summary –
Coastal Region vs. Piedmont Region vs. Mountain Region
62 | P a g e
Lodging Type
Hotels/motels and private homes are the most popular forms of lodging throughout the state, thought the proportions vary by region. Mountain Region visitors make use of hotels/motels while Coastal Region visitors tend to stay in rental homes and rental condos.
0.0% 10.0% 20.0% 30.0% 40.0% 50.0% 60.0%
Mountain
PiedmontRegion
CoastalRegion
NC
4.9%
3.5%
4.7%
4.7%
1.4%
0.4%
2.0%
1.0%
3.4%
1.2%
1.3%
1.5%
2.7%
1.0%
3.1%
1.9%
1.4%
0.5%
9.0%
2.3%
3.8%
0.7%
10.4%
3.2%
4.0%
1.6%
6.1%
3.3%
22.4%
46.5%
38.5%
41.4%
62.9%
52.7%
36.0%
47.2%
2012 Lodging by Overnight Visitors by Region
Hotel/motel
Private Home
Personal SecondHome/Condo
Rental Home
Rental Condo
RV/Tent
B&B
Timeshare
Other
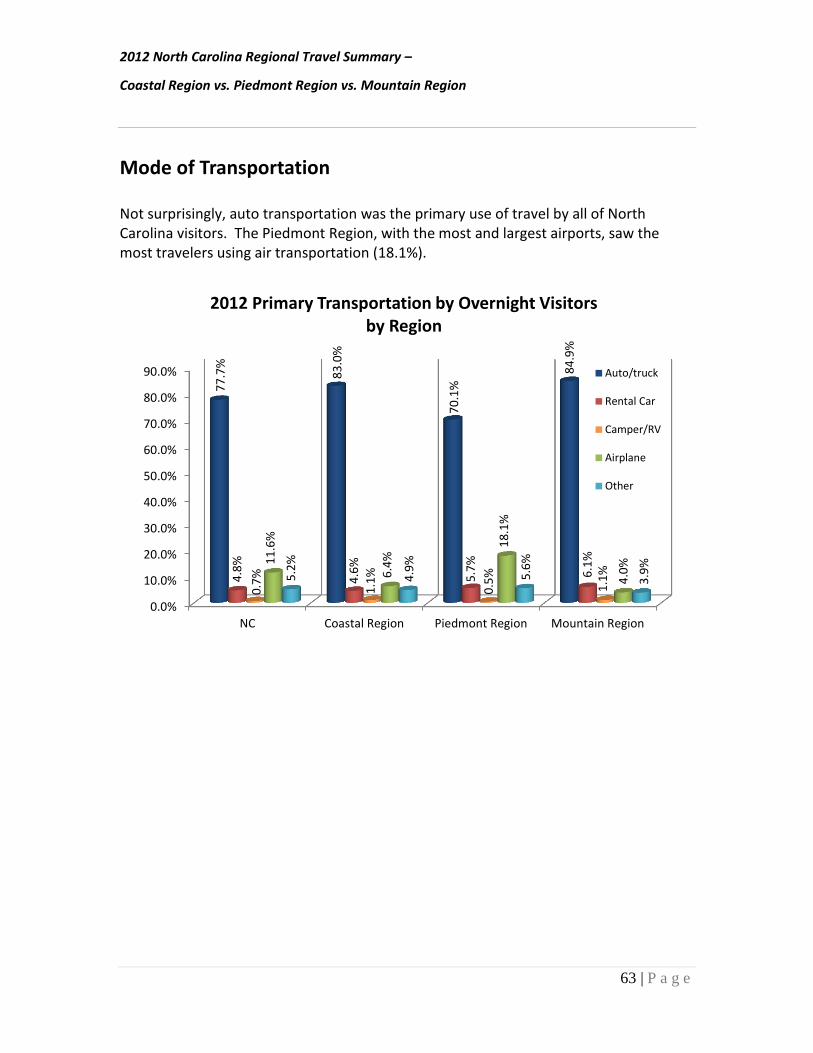
2012 North Carolina Regional Travel Summary –
Coastal Region vs. Piedmont Region vs. Mountain Region
63 | P a g e
Mode of Transportation Not surprisingly, auto transportation was the primary use of travel by all of North Carolina visitors. The Piedmont Region, with the most and largest airports, saw the most travelers using air transportation (18.1%).
0.0%
10.0%
20.0%
30.0%
40.0%
50.0%
60.0%
70.0%
80.0%
90.0%
NC Coastal Region Piedmont Region Mountain Region
77
.7%
83
.0%
70
.1%
84
.9%
4.8
%
4.6
%
5.7
%
6.1
%
0.7
%
1.1
%
0.5
%
1.1
% 1
1.6
%
6.4
% 1
8.1
%
4.0
%
5.2
%
4.9
%
5.6
%
3.9
%
2012 Primary Transportation by Overnight Visitors by Region
Auto/truck
Rental Car
Camper/RV
Airplane
Other
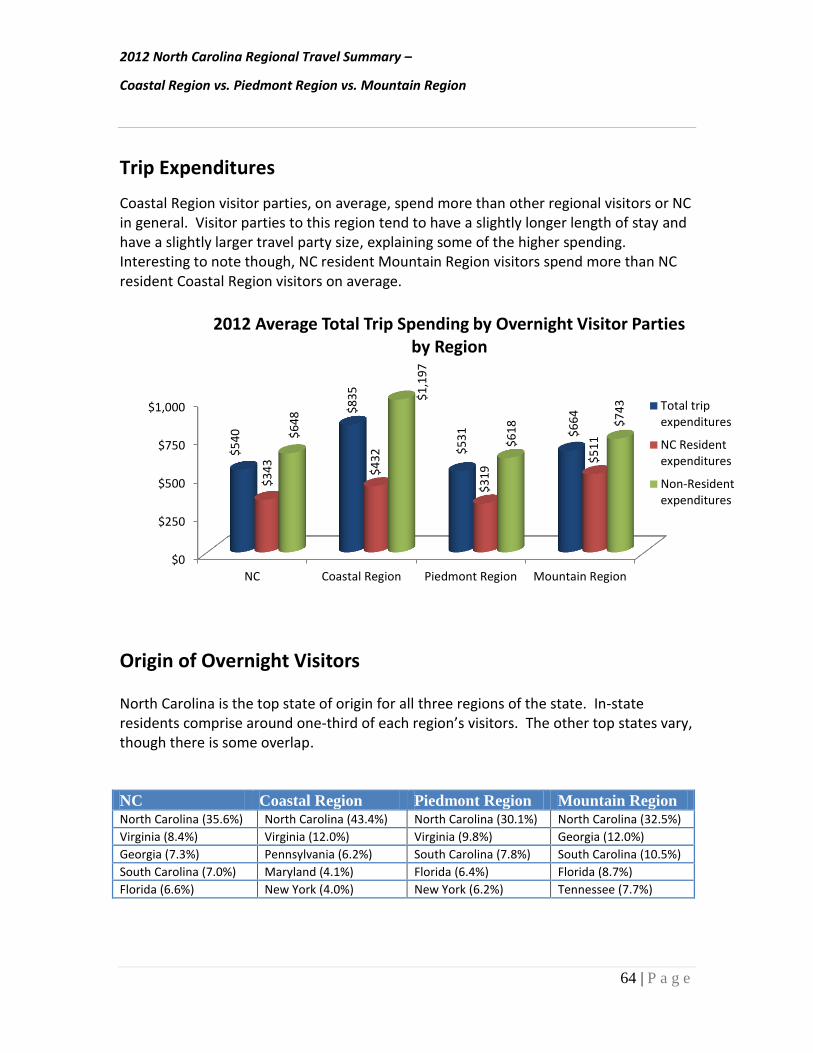
2012 North Carolina Regional Travel Summary –
Coastal Region vs. Piedmont Region vs. Mountain Region
64 | P a g e
Trip Expenditures
Coastal Region visitor parties, on average, spend more than other regional visitors or NC in general. Visitor parties to this region tend to have a slightly longer length of stay and have a slightly larger travel party size, explaining some of the higher spending. Interesting to note though, NC resident Mountain Region visitors spend more than NC resident Coastal Region visitors on average.
Origin of Overnight Visitors
North Carolina is the top state of origin for all three regions of the state. In-state residents comprise around one-third of each region’s visitors. The other top states vary, though there is some overlap.
NC Coastal Region Piedmont Region Mountain Region North Carolina (35.6%) North Carolina (43.4%) North Carolina (30.1%) North Carolina (32.5%)
Virginia (8.4%) Virginia (12.0%) Virginia (9.8%) Georgia (12.0%)
Georgia (7.3%) Pennsylvania (6.2%) South Carolina (7.8%) South Carolina (10.5%)
South Carolina (7.0%) Maryland (4.1%) Florida (6.4%) Florida (8.7%)
Florida (6.6%) New York (4.0%) New York (6.2%) Tennessee (7.7%)
$0
$250
$500
$750
$1,000
NC Coastal Region Piedmont Region Mountain Region
$5
40
$8
35
$5
31
$6
64
$3
43
$4
32
$3
19
$5
11
$6
48
$1
,19
7
$6
18
$7
43
2012 Average Total Trip Spending by Overnight Visitor Parties by Region
Total tripexpenditures
NC Residentexpenditures
Non-Residentexpenditures
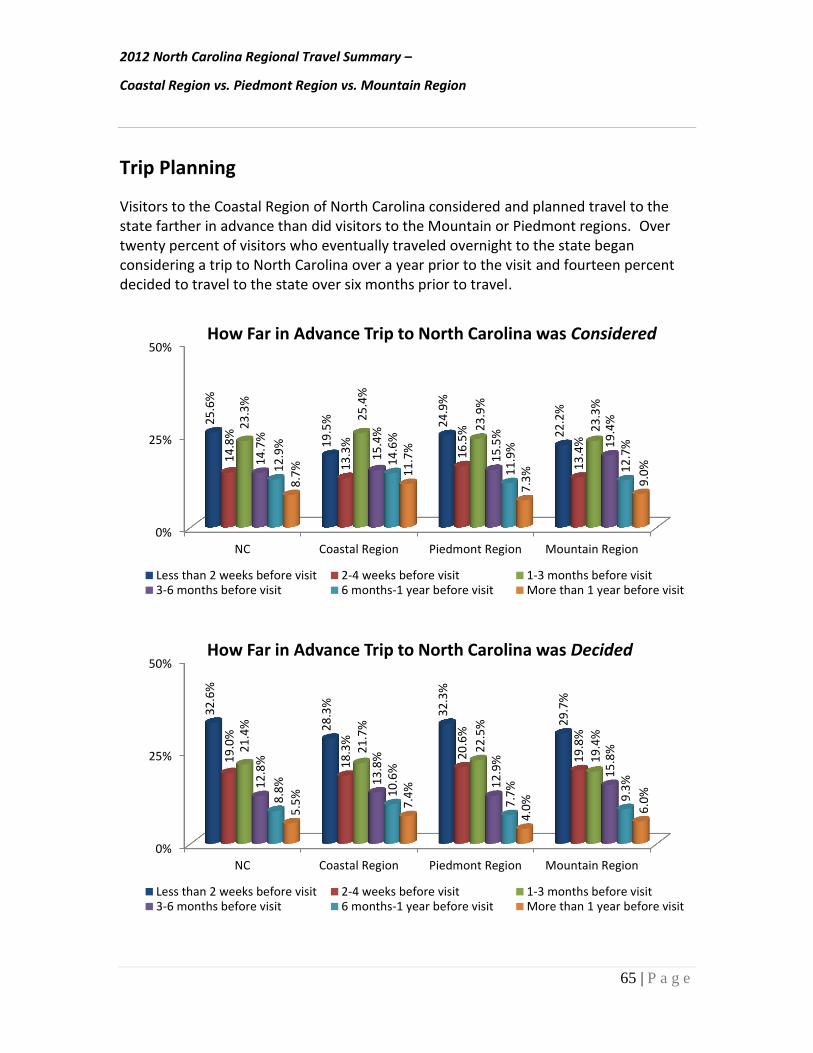
2012 North Carolina Regional Travel Summary –
Coastal Region vs. Piedmont Region vs. Mountain Region
65 | P a g e
Trip Planning
Visitors to the Coastal Region of North Carolina considered and planned travel to the state farther in advance than did visitors to the Mountain or Piedmont regions. Over twenty percent of visitors who eventually traveled overnight to the state began considering a trip to North Carolina over a year prior to the visit and fourteen percent decided to travel to the state over six months prior to travel.
0%
25%
50%
NC Coastal Region Piedmont Region Mountain Region
25
.6%
19
.5%
24
.9%
22
.2%
14
.8%
13
.3%
16
.5%
13
.4%
23
.3%
25
.4%
23
.9%
23
.3%
14
.7%
15
.4%
15
.5%
19
.4%
12
.9%
14
.6%
11
.9%
12
.7%
8.7
%
11
.7%
7.3
%
9.0
%
How Far in Advance Trip to North Carolina was Considered
Less than 2 weeks before visit 2-4 weeks before visit 1-3 months before visit3-6 months before visit 6 months-1 year before visit More than 1 year before visit
0%
25%
50%
NC Coastal Region Piedmont Region Mountain Region
32
.6%
28
.3%
32
.3%
29
.7%
19
.0%
18
.3%
20
.6%
19
.8%
21
.4%
21
.7%
22
.5%
19
.4%
12
.8%
13
.8%
12
.9%
15
.8%
8.8
%
10
.6%
7.7
%
9.3
%
5.5
%
7.4
%
4.0
%
6.0
%
How Far in Advance Trip to North Carolina was Decided
Less than 2 weeks before visit 2-4 weeks before visit 1-3 months before visit3-6 months before visit 6 months-1 year before visit More than 1 year before visit
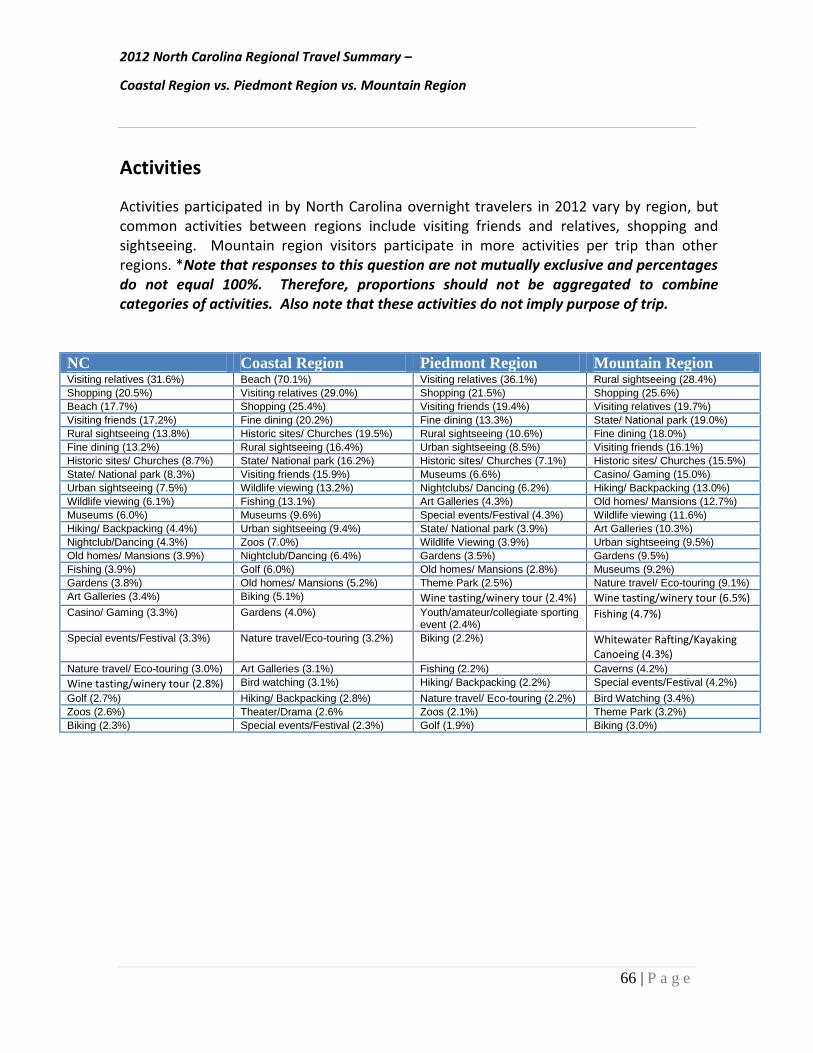
2012 North Carolina Regional Travel Summary –
Coastal Region vs. Piedmont Region vs. Mountain Region
66 | P a g e
Activities
Activities participated in by North Carolina overnight travelers in 2012 vary by region, but common activities between regions include visiting friends and relatives, shopping and sightseeing. Mountain region visitors participate in more activities per trip than other regions. *Note that responses to this question are not mutually exclusive and percentages do not equal 100%. Therefore, proportions should not be aggregated to combine categories of activities. Also note that these activities do not imply purpose of trip.
NC Coastal Region Piedmont Region Mountain Region Visiting relatives (31.6%) Beach (70.1%) Visiting relatives (36.1%) Rural sightseeing (28.4%)
Shopping (20.5%) Visiting relatives (29.0%) Shopping (21.5%) Shopping (25.6%)
Beach (17.7%) Shopping (25.4%) Visiting friends (19.4%) Visiting relatives (19.7%)
Visiting friends (17.2%) Fine dining (20.2%) Fine dining (13.3%) State/ National park (19.0%)
Rural sightseeing (13.8%) Historic sites/ Churches (19.5%) Rural sightseeing (10.6%) Fine dining (18.0%)
Fine dining (13.2%) Rural sightseeing (16.4%) Urban sightseeing (8.5%) Visiting friends (16.1%)
Historic sites/ Churches (8.7%) State/ National park (16.2%) Historic sites/ Churches (7.1%) Historic sites/ Churches (15.5%)
State/ National park (8.3%) Visiting friends (15.9%) Museums (6.6%) Casino/ Gaming (15.0%)
Urban sightseeing (7.5%) Wildlife viewing (13.2%) Nightclubs/ Dancing (6.2%) Hiking/ Backpacking (13.0%)
Wildlife viewing (6.1%) Fishing (13.1%) Art Galleries (4.3%) Old homes/ Mansions (12.7%)
Museums (6.0%) Museums (9.6%) Special events/Festival (4.3%) Wildlife viewing (11.6%)
Hiking/ Backpacking (4.4%) Urban sightseeing (9.4%) State/ National park (3.9%) Art Galleries (10.3%)
Nightclub/Dancing (4.3%) Zoos (7.0%) Wildlife Viewing (3.9%) Urban sightseeing (9.5%)
Old homes/ Mansions (3.9%) Nightclub/Dancing (6.4%) Gardens (3.5%) Gardens (9.5%)
Fishing (3.9%) Golf (6.0%) Old homes/ Mansions (2.8%) Museums (9.2%)
Gardens (3.8%) Old homes/ Mansions (5.2%) Theme Park (2.5%) Nature travel/ Eco-touring (9.1%)
Art Galleries (3.4%) Biking (5.1%) Wine tasting/winery tour (2.4%) Wine tasting/winery tour (6.5%) Casino/ Gaming (3.3%) Gardens (4.0%) Youth/amateur/collegiate sporting
event (2.4%) Fishing (4.7%)
Special events/Festival (3.3%) Nature travel/Eco-touring (3.2%) Biking (2.2%) Whitewater Rafting/Kayaking Canoeing (4.3%)
Nature travel/ Eco-touring (3.0%) Art Galleries (3.1%) Fishing (2.2%) Caverns (4.2%)
Wine tasting/winery tour (2.8%) Bird watching (3.1%) Hiking/ Backpacking (2.2%) Special events/Festival (4.2%)
Golf (2.7%) Hiking/ Backpacking (2.8%) Nature travel/ Eco-touring (2.2%) Bird Watching (3.4%)
Zoos (2.6%) Theater/Drama (2.6% Zoos (2.1%) Theme Park (3.2%)
Biking (2.3%) Special events/Festival (2.3%) Golf (1.9%) Biking (3.0%)
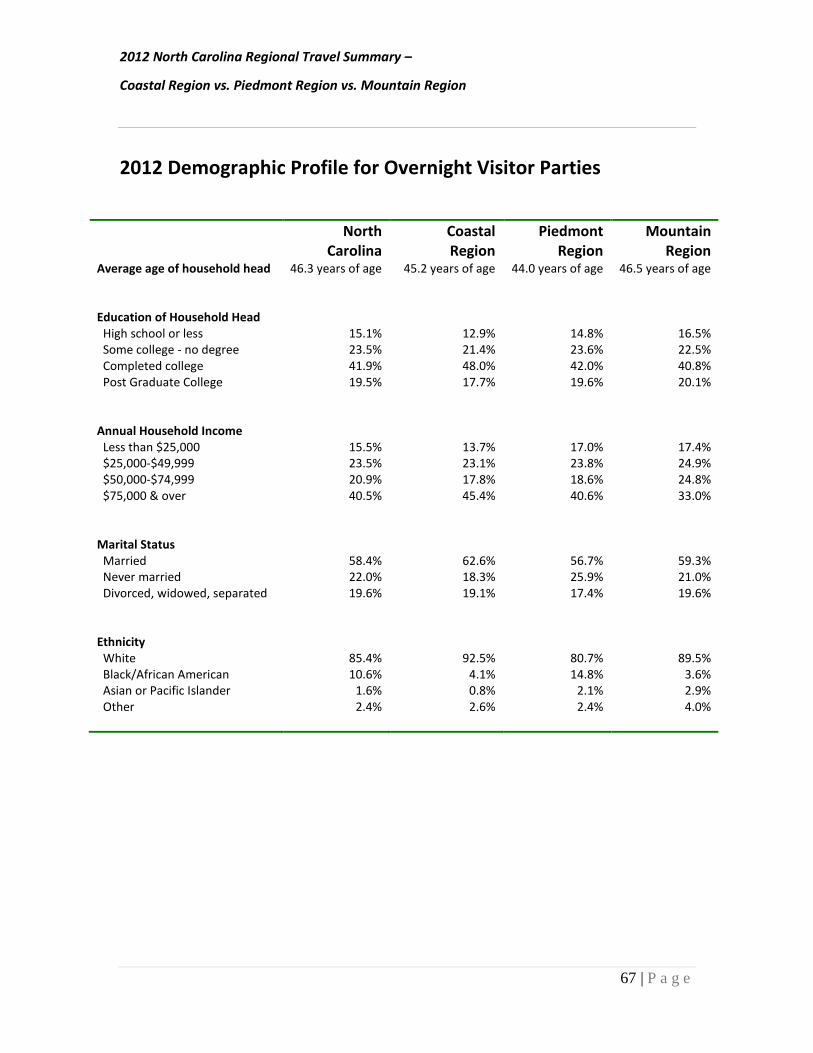
2012 North Carolina Regional Travel Summary –
Coastal Region vs. Piedmont Region vs. Mountain Region
67 | P a g e
2012 Demographic Profile for Overnight Visitor Parties
North Carolina
Coastal Region
Piedmont Region
Mountain Region
Average age of household head 46.3 years of age 45.2 years of age 44.0 years of age 46.5 years of age
Education of Household Head High school or less 15.1% 12.9% 14.8% 16.5% Some college - no degree 23.5% 21.4% 23.6% 22.5% Completed college 41.9% 48.0% 42.0% 40.8% Post Graduate College 19.5% 17.7% 19.6% 20.1%
Annual Household Income Less than $25,000 15.5% 13.7% 17.0% 17.4% $25,000-$49,999 23.5% 23.1% 23.8% 24.9% $50,000-$74,999 20.9% 17.8% 18.6% 24.8% $75,000 & over 40.5% 45.4% 40.6% 33.0%
Marital Status Married 58.4% 62.6% 56.7% 59.3% Never married 22.0% 18.3% 25.9% 21.0% Divorced, widowed, separated 19.6% 19.1% 17.4% 19.6% Ethnicity White 85.4% 92.5% 80.7% 89.5% Black/African American 10.6% 4.1% 14.8% 3.6% Asian or Pacific Islander 1.6% 0.8% 2.1% 2.9% Other 2.4% 2.6% 2.4% 4.0%
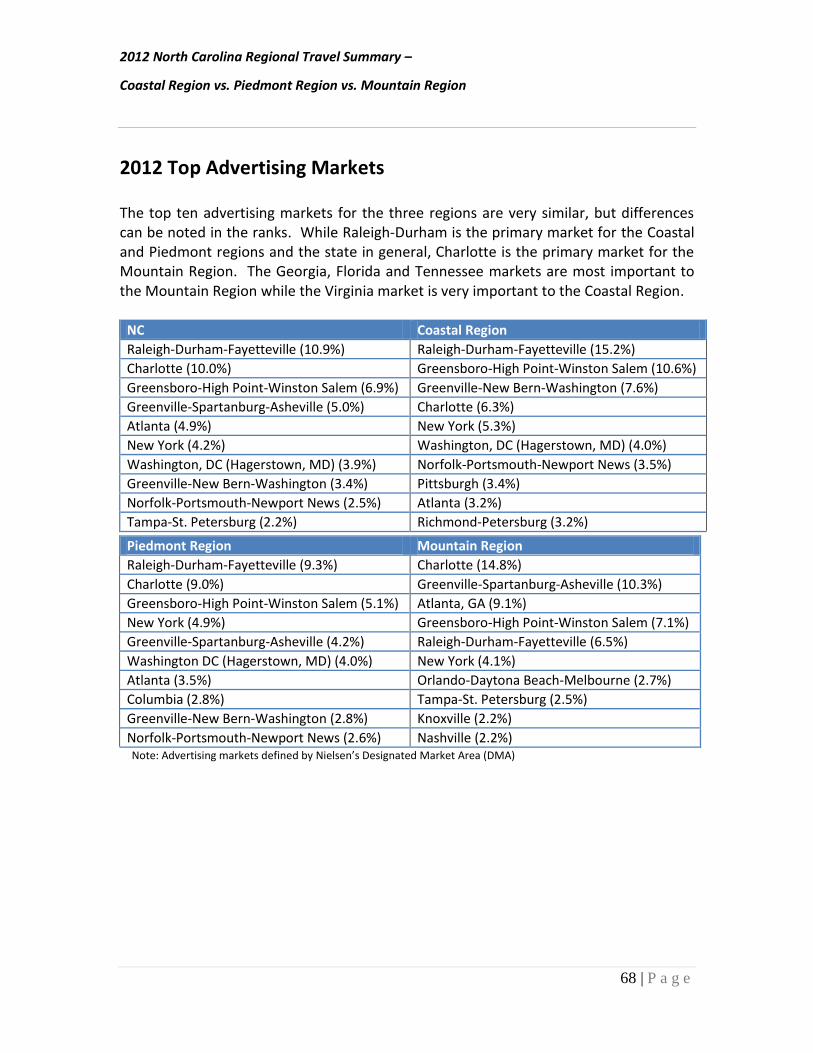
2012 North Carolina Regional Travel Summary –
Coastal Region vs. Piedmont Region vs. Mountain Region
68 | P a g e
2012 Top Advertising Markets The top ten advertising markets for the three regions are very similar, but differences can be noted in the ranks. While Raleigh-Durham is the primary market for the Coastal and Piedmont regions and the state in general, Charlotte is the primary market for the Mountain Region. The Georgia, Florida and Tennessee markets are most important to the Mountain Region while the Virginia market is very important to the Coastal Region.
NC Coastal Region
Raleigh-Durham-Fayetteville (10.9%) Raleigh-Durham-Fayetteville (15.2%)
Charlotte (10.0%) Greensboro-High Point-Winston Salem (10.6%)
Greensboro-High Point-Winston Salem (6.9%) Greenville-New Bern-Washington (7.6%)
Greenville-Spartanburg-Asheville (5.0%) Charlotte (6.3%)
Atlanta (4.9%) New York (5.3%)
New York (4.2%) Washington, DC (Hagerstown, MD) (4.0%)
Washington, DC (Hagerstown, MD) (3.9%) Norfolk-Portsmouth-Newport News (3.5%)
Greenville-New Bern-Washington (3.4%) Pittsburgh (3.4%)
Norfolk-Portsmouth-Newport News (2.5%) Atlanta (3.2%)
Tampa-St. Petersburg (2.2%) Richmond-Petersburg (3.2%)
Piedmont Region Mountain Region
Raleigh-Durham-Fayetteville (9.3%) Charlotte (14.8%)
Charlotte (9.0%) Greenville-Spartanburg-Asheville (10.3%)
Greensboro-High Point-Winston Salem (5.1%) Atlanta, GA (9.1%)
New York (4.9%) Greensboro-High Point-Winston Salem (7.1%)
Greenville-Spartanburg-Asheville (4.2%) Raleigh-Durham-Fayetteville (6.5%)
Washington DC (Hagerstown, MD) (4.0%) New York (4.1%)
Atlanta (3.5%) Orlando-Daytona Beach-Melbourne (2.7%)
Columbia (2.8%) Tampa-St. Petersburg (2.5%)
Greenville-New Bern-Washington (2.8%) Knoxville (2.2%)
Norfolk-Portsmouth-Newport News (2.6%) Nashville (2.2%) Note: Advertising markets defined by Nielsen’s Designated Market Area (DMA)
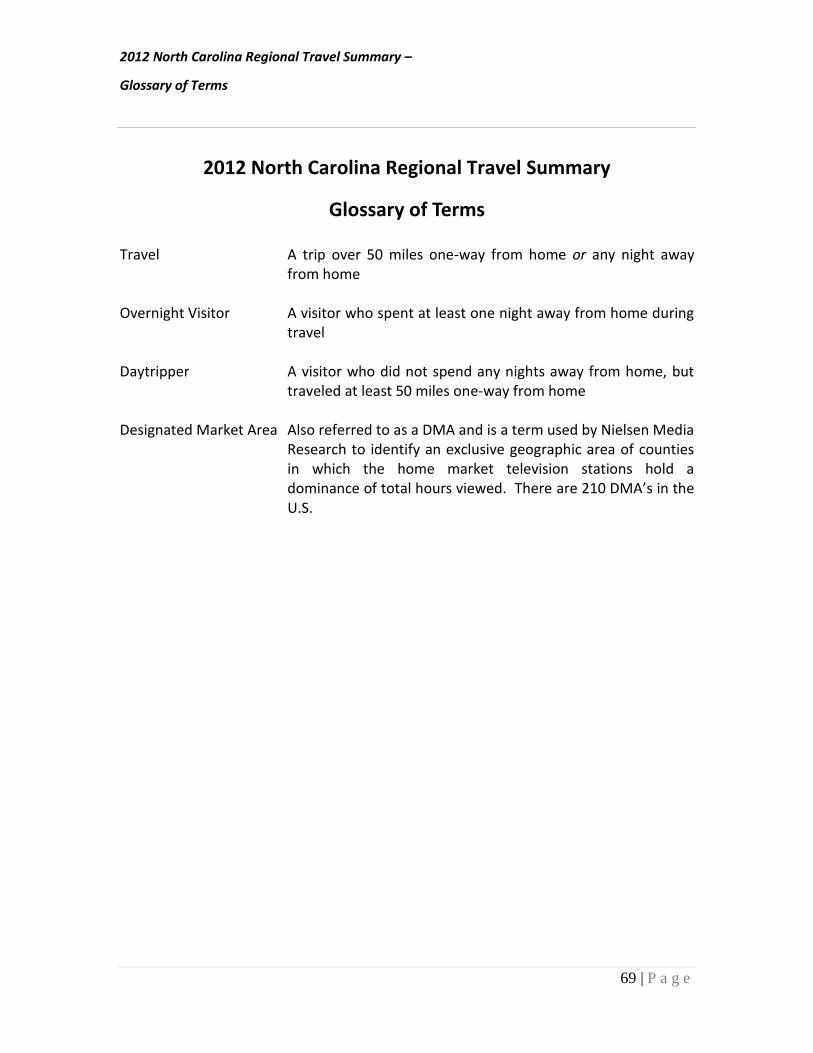
2012 North Carolina Regional Travel Summary –
Glossary of Terms
69 | P a g e
2012 North Carolina Regional Travel Summary
Glossary of Terms
Travel A trip over 50 miles one-way from home or any night away from home
Overnight Visitor A visitor who spent at least one night away from home during
travel Daytripper A visitor who did not spend any nights away from home, but
traveled at least 50 miles one-way from home Designated Market Area Also referred to as a DMA and is a term used by Nielsen Media
Research to identify an exclusive geographic area of counties in which the home market television stations hold a dominance of total hours viewed. There are 210 DMA’s in the U.S.