Embed Size (px)
DESCRIPTION
This is the Center for Houston’s Future fourth annual report in a series intended to help measure progress over time in key sustainability areas in greater Houston. The 2012 report focused on all aspects of education from early childhood thru workforce preparedness. It is conducted in collaboration with several working committees or ‘data groups’ comprised of subject matter experts from academia, business or other sectors relevant to the indicator being examined.
Citation preview
HUMAN CAPITAL DEVELOPMENT AND EDUCATION:
EARLY CHILDHOOD, K-12,WORKFORCE PREPAREDNESS
CENTER FORHOUSTON’S FUTURE 2012 INDICATORREPORT
Regional Nine Letter / page 3
Acknowledgements / page 4
Executive Summary / page 6
Transforming Education: The GI Bill / page 8
Early Childhood Education / page 11
K–12 / page 25
Workforce Preparedness / page 37
Education and Health / page 49
Scenarios 2040 / page 59
Appendices / page 60
Donors / page 68
contents
11BRAZORIA � CHAMBERS � FORT BEND � GALVESTON � HARRIS � LIBERTY � MONTGOMERY � WALLER
33BRAZORIA � CHAMBERS � FORT BEND � GALVESTON � HARRIS � LIBERTY � MONTGOMERY � WALLER2012 COMMUNITY INDICATOR REPORT CENTER FOR HOUSTON’S FUTURE The Region’s Think Tank22
INDICATORS2200112 COMMUNITY2 COMMUNITY
INDICATOR2012 COMMUNITY
REPORT
January 2012
Dear Friends:
The Center for Houston’s Future has added an important resource to ongoing efforts to advance the region’s sustainability and
competitiveness. The 2012 Community Indicator Report – Human Capital Development and Education: Early Childhood, K–12, Workforce Preparedness is a peer reviewed report card for the region that establishes metrics for public education. The publication is a tool to facilitate good public policy decisions by
making available reliable, longitudinal data.
The Center for Houston’s Future has produced this report through extensive collaboration involving more than 50 organizations.
Indicators of Early Education, K–12, and Post Secondary Success give a snapshot of where the Houston eight-county region
stands in these critical areas. Clearly, the health of the region’s schools will help to determine the vitality of our future workforce
and economy.
The 2012 Community Indicator Report is the fourth annual report in a series intended to help measure progress over time
in key areas issues. Since 2007, the Center’s benchmark studies have covered topics including air quality, billboards, green
buildings, litter and graffiti, parks and trails, tax delinquent lots, trees, water quality, water supply and resource use.
By highlighting our region’s many successes and the critical areas of needed increased effort, the Center’s Community
Indicator Report serves as the basis for ongoing collaboration to advance the Houston region as one of the top
ten global communities in which to live and work.
Sincerely,
Annise Parker Ed Emmett Robert HebertMayor of Houston Harris County Judge Fort Bend County Judge
Alan B. Sadler Jimmy Silvia Craig McNairMontgomery County Judge Chambers County Judge Liberty County Judge
E.J. King Glenn Beckendorff Mark HenryBrazoria County Judge Waller County Judge Galveston County Judge
“I am a firm believer that a bright light on the genuine truth is
a strong driver of progress…all by itself. The problem is to
get and to organize the genuinetruth, and then to put it in
a bright light.”DR. LARRY FAULKNER
President, Houston Endowment
The Region’s Think Tank

2012 COMMUNITY INDICATOR REPORT CENTER FOR HOUSTON’S FUTURE The Region’s Think Tank 55BRAZORIA � CHAMBERS � FORT BEND � GALVESTON � HARRIS � LIBERTY � MONTGOMERY � WALLER44
Authors EARLY CHILDHOOD: Carol Shattuck, President and CEO, Collaborative for Children
K-12: Bob Sanborn, Ed.D., President and CEO, Children at Risk and Caroline Holcombe, Director of Social Measurement and Evaluation, Children at Risk
WORKFORCE PREPAREDNESS: Catherine Horn, Ph.D., Associate Professor, University of Houston College of Education
HEALTH: Patricia Gail Bray, Ph.D., Executive Director, St. Luke’s Episcopal Health Charities
Early Childhood Education Data GroupKay Albrecht, Ph.D., Owner, Innovations in Early Childhood Education, Inc.
Nicole Andrews, M.Ed., Ed.D., Assistant Professor of Education Curriculum & Instruction, University of Houston
Judy Carnahan-Webb, Owner, Creative Trainers & Consultants
Mary Jane Gomez, Early Childhood Manager, Houston Independent School District
Kathryn Jenkins, M.Ed., Ed.D., Associate Professor, University of Houston-Downtown
Donna Kirkwood, Ph.D., Program Coordinator of Early Childhood Education, University of Houston-Clear Lake
Venetia Peacock, Head Start Director, HCDE-Head Start
Sul Ross, Vice President, Programs and Collaboration Development, Collaborative for Children
Bobbi Samuels, Ph.D., Retired Associate Professor Emeritus, University of Houston-Clear Lake
Sharon Spillman, Assistant V.P. of Provider Engagement, Collaborative for Children
Katherine von Haefen, Senior Program Manager, Community Impact,United Way of Greater Houston
K-12 Data GroupTerry Bruner, Executive Director, Teach for America Houston
Rhetta Detrich, Chief Program Officer, The Talent Initiative
Reagan Flowers, Founder and CEO, CSTEM.
Keith Haffey, Ed.D., Executive Director, Accountability and Research,Spring Branch ISD
Bob Houston, Ph.D., Executive Director, Institute for Urban Education Todd Litton, Executive Director, Citizen Schools of Texas
Steve Murdock, Ph.D., Professor, Department of Sociology, Rice University
Ann Stiles, Executive Director, Project Grad Houston
Carla Stevens, Assistant Superintendent Department of Research and Accountability, HISD
Ruth Turley, Ph.D., Associate Professor, Rice University
Scott Van Beck, Ph.D., Executive Director, Houston A+ Challenge
Ann Ziker, Ph.D., Managing Director, Education Pioneers Houston
Workforce Preparedness Data GroupMichael Bettersworth, Associate Vice Chancellor for Technology Advancement, The Texas State Technical College System
Rodney Bradshaw, Director of Human Services, H-GAC
Richard Carpenter, Ph.D., Chancellor, Lone Star College System
Charles Cook, Ed.D., Vice Provost for Instruction, Houston Community College
Siobhan Fleming, Ph.D., Associate Vice Chancellor of Research and Institutional Effectiveness, Lone Star College System
Annie Criner, Development Director, Houston READ Commission
Lee Holcombe, Ph.D., Director, Higher Education Policy Institute, The Texas Higher Education Coordinating Board
Linda Hubbard, Manager II, HR Business Consultant, Siemens Corporation
Acknowledgements Elizabeth Protas, P.T., Ph.D., FACSM, FAPTA, Vice President and Dean, School of Health Professions and George T. Bryan DistinguishedProfessor, UTMB Health
Lori Vetters, President and CEO, Inland Resources
Robert Wimpelberg, Ph.D., Professor of Educational Leadership, University of Houston, College of Education; Executive Director, All Kid's Alliance
Health Data GroupRogene Calvert, Public and Community Affairs Consultant, Outreach Strategists, LCC
Mustafa Tameez, Founder and Managing Director, Outreach Strategists, LCC
Joan Engebretson, Ph.D., PH, RN, AHN-BC, Judy Fred Professorship inNursing, The University of Texas School of Nursing at Houston
Harriet Arvey, Communities in Schools Houston
Editors Amelia Hewitt, Ph.D., Assistant Professor of Early Childhood Education,University of Houston-Downtown
Linda McSpadden-McNeil, Ph.D., Director for the Center of Education, Rice University
Jim Granato, Ph.D., Director, Hobby Center for Public Policy,University of Houston
Jennifer Fiechtner, The Red Pen
Moritza Day, Accounting Recruiting and Project Staffing, HR Consulting, Day West and Associates, Inc.
Robert Wimpelberg, Ph.D., Professor of Educational Leadership, University of Houston, College of Education; Executive Director, All Kid's Alliance
H. Jerome Freiberg, Ph.DRebecca and John Moores, Professor, University of Houston
The Center for Houston’s Future, The Region’s Think Tank, is proud to present the 2012 Indicator Report to the community titled Human Capital Development and Education: Early Childhood,
K-12, Workforce Preparedness.
The Center for Houston’s Future owes a debt of gratitude to the more than 50 professionals and their
organizations that collaborated with us. They generously gave their time and talent to the production
of this report, including identifying data sources, writing and editing the text and conducting peer
reviews for the accuracy and integrity of the report.
2012 Community Indicator Policy CommitteeChair: Steve Klineberg, PhD., Professor of Sociology and Co-Director of the Kinder Institute for Urban Research, Rice University
Lilibeth Andre, Associate Director, Shell Center for Sustainability, Rice University
Julie Baker, Ph.D., Chief of Major Projects, HISD
Jim Blackburn, Professor of the Practice in Environmental Law and Director of Rice University Minor in Energy and Water Sustainability
Jim Granato, Ph.D., Director of the Hobby Center for Public Policy, University of Houston
Robert Harriss, Ph.D., President, Houston Advanced Research Center
Suzanne Mayne, Director of Environment and Sustainable Development, KBR
Clara Rojas, President and CEO, Alloy Multimedia
Jeff Taebel, Director of Community and Environmental Planning, Houston-Galveston Area Council
Will Uecker, Ph.D., Professor, Jones Graduate School of Management,Rice University
Center for Houston’s Future, Community Indicator Program
Catherine Clark Mosbacher, President and CEODonna Rybiski, Director of Strategic InitiativesSandra Wegmann, Senior Manager of Strategic Initiatives
SPECIAL THANKS TOKelly Frels, Board Chair 2010–2011, and his leadership on this project.
PHOTOGRAPHY COURTESY OF HOUSTON A+ CHALLENGE AND COLLOBRATIVE FOR CHILDREN.

77BRAZORIA � CHAMBERS � FORT BEND � GALVESTON � HARRIS � LIBERTY � MONTGOMERY � WALLER2012 COMMUNITY INDICATOR REPORT CENTER FOR HOUSTON’S FUTURE The Region’s Think Tank66
Recent research shows that the biggest predictor of success for cities is the education level of the population. The Houston region currently sitsin the middle of the pack nationally with just 28.4% of the populationholding a four-year college degree. The region’s ability to be competitivein a global economy by attracting businesses and providing talent for21st Century jobs rests primarily on the success of public education.
Rice University Sociologist Dr. Stephen Klineberg, chair of the Center for Houston’s Future Community Indicator Project and Director of the 30-year running Kinder Houston Area Survey, has noted that “the goodblue-collar jobs have now largely disappeared, and they will not be comingback.” High-school dropouts today are 3 times more likely than collegegraduates to be unemployed and during the 40 years of a working life,will earn at least $1.5 million less than the average college graduate.
Economic competitiveness is only one tangible benefit of a well educatedpopulation. Metropolitan regions with higher levels of education tend tohave residents that vote more, stay out of prison, contribute to cultural andphilanthropic life, and in turn invest in the education of their children.
While the need for an educated workforce and citizenry has never beengreater, the region confronts a changing demographic tide and high levels of poverty that have put great strain on public schools. In 2010,Houston Independent School District was host to 202,773 students, ofwhom 62% were Latino and 27% were African-American. These twogroups have the highest poverty rates, reflected in the huge number of HISDstudents that qualify for reduced-price or free lunch programs: 79%.
The 2012 Community Indicator Report views the issue of human capital development as one that must be tackled holistically and withthe support of all sectors. Three chapters within the report provide a snapshot of public education along a continuum: Early Childhood,K-12, and Post-Secondary Success/Workforce Preparedness. Afourth chapter addresses the undeniable link between good healthand education. Additionally, the report is book ended with a historyof education in the region and a plausible scenario of what learningmay look like in the year 2040.
2011 proved to be an extremely challenging year for public education,given the continued growth of the student population and the reductions
Executive Summary
in funding that followed the 82nd Texas Legislative Session. Public policyconsiderations are noted in each chapter, along with examples of bestpractices. A summary of the findings of the 2012 Community IndicatorReport follows.
What is the link between Education & Health?
Is an educated population healthier? The positive link between educational attainment and health is well documented. The more youlearn, the more you earn, the more you engage in healthy behaviorand, consequently, the better your health and your children’s health. Educated people are more likely to live longer and healthier lives. Increased life expectancy and better health outcomes are evident acrosscountries and communities and within different ethnic and racial groups.A 2009 Robert Wood Johnson Study “Education Matters for Health,” reported that if all adult Americans were college graduates, with thehealth outcomes of current college graduates, improvements in healthand life expectancy would result in $1 trillion annual gains.
What is the state of Early Childhood Education?
Relative to other states, standards for Early Childhood Education (ECE)in Texas are minimal, contributing to a large gap in quality experiencesfor children 0-5 years old. Meanwhile, decades of outcomes researchshows that high quality early education can close the achievement gapbefore kindergarten. Indicators are presented to gauge the quality of theEarly Childhood System, which encompasses child care, Head Start andPre-Kindergarten (Pre-K). Teacher Education and Training andTeacher:Child Ratios were selected as indicators because of their significant impact on the early education experiences and learning inchildren ages 0-5.
The study found that 100% of Pre-K and 98% of Head Start teacher education ratings are considered excellent in the 13-county Gulf Coast region. Meanwhile, only 35% of child care centers which serve two-thirds of children in the ECE system, have achieved excellent teachereducation ratings. For the second indicator, just 12% of child care centers and 20% of Pre-K programs rated excellent in Teacher:ChildRatios in 2011. Head Start programs stand out in this area with 77%of programs reporting excellent.
A significant finding of this study is that many families served by the early education system lack access to quality programs with credentialed teachers and adequate class sizes. This lack of accessdisproportionately impacts low-income families and families whoseearnings exceed the income eligibility limit.
What is the state of K-12 Public School? Our region’s ability to educate today’s youth dictates our future competitiveness with other regions and nations. American students arelagging on a number of key indicators: American eighth graders fall significantly behind their peers in six other nations on achievement at anadvanced international benchmark in mathematics. Moreover, tenOECD nations outperform the U.S. on high school degree attainment.
In this region, low-income and minority students lag significantly behindtheir peers across educational outcomes, from third grade reading tohigh school graduation to post-secondary readiness. In the Class of2010 alone, greater Houston’s public schools failed to graduate over23,800 students on time, with each high school dropout conservatively estimated to cost the state $4,935 each yearin lost wages, sales tax revenue, and welfare payments.
Major indicators were defined as third grade reading proficiency, Algebra 1 by ninth grade and high school graduation rates among others. Key findings show that only48% of our region’s students – and only 38% of economicallydisadvantaged students – are reading at Commended levelsin third grade. Just 53% of the region’s ninth graders successfully completed Algebra I. Moreover, the Houston region graduates just 71% of its ninth grade students on time, with Texas ranking last in the U.S. in adults earninghigh school diplomas.
What is the state of Workforce Preparedness? Quality postsecondary education is critical to economic and civic viability. Such benefits remain elusive, however, to many of the region’sresidents. The fastest growing professions in the region, including education, nursing, engineering, and accounting, will face as much asa 621,000 person shortage in the next four years. The metrics presentedin this chapter suggest, however, that the gap will not be easily filled bygraduates from our community colleges and four-year institutions.
Metrics indicate that having a successful postsecondary educational experience is important – for both individual and collective economicand social well-being. Almost half of entering freshmen need one ormore developmental education classes. Just over a third of the region’sadults 25 years and older have an Associate’s or Bachelor’s degree.Meanwhile, the cost of postsecondary education has increased as statefunding has declined. Yet, between 2003 and 2010, the average priceof tuition and fees doubled.
“One of my favorite adages is: ‘If you can measure it, you can improve it.’
That’s the simple yet powerful driver behind what we’re doing for the Houston region, on all competitiveness and
sustainability issues. But, right here, right now, there is no issue more crucial to measure and improve than education.”
DAN BELLOWManaging Director, Jones Lang LaSalle
2012 Chairman, Community Indicators Policy Committee Center for Houston’s Future
The Center for Houston’s Future presents its 2012 Community Indicator Report, Human Capital Developmentand Education: Early Childhood, K-12, Workforce Preparedness. The Center for Houston’s Future beganpublishing an Indicator Report in 2007, on topics that are critical to the competitiveness and sustainabilityof the eight county region to answer the simple question, “Are things getting better or worse?”
2012 COMMUNITY INDICATOR REPORT CENTER FOR HOUSTON’S FUTURE The Region’s Think Tank 99BRAZORIA � CHAMBERS � FORT BEND � GALVESTON � HARRIS � LIBERTY � MONTGOMERY � WALLER88
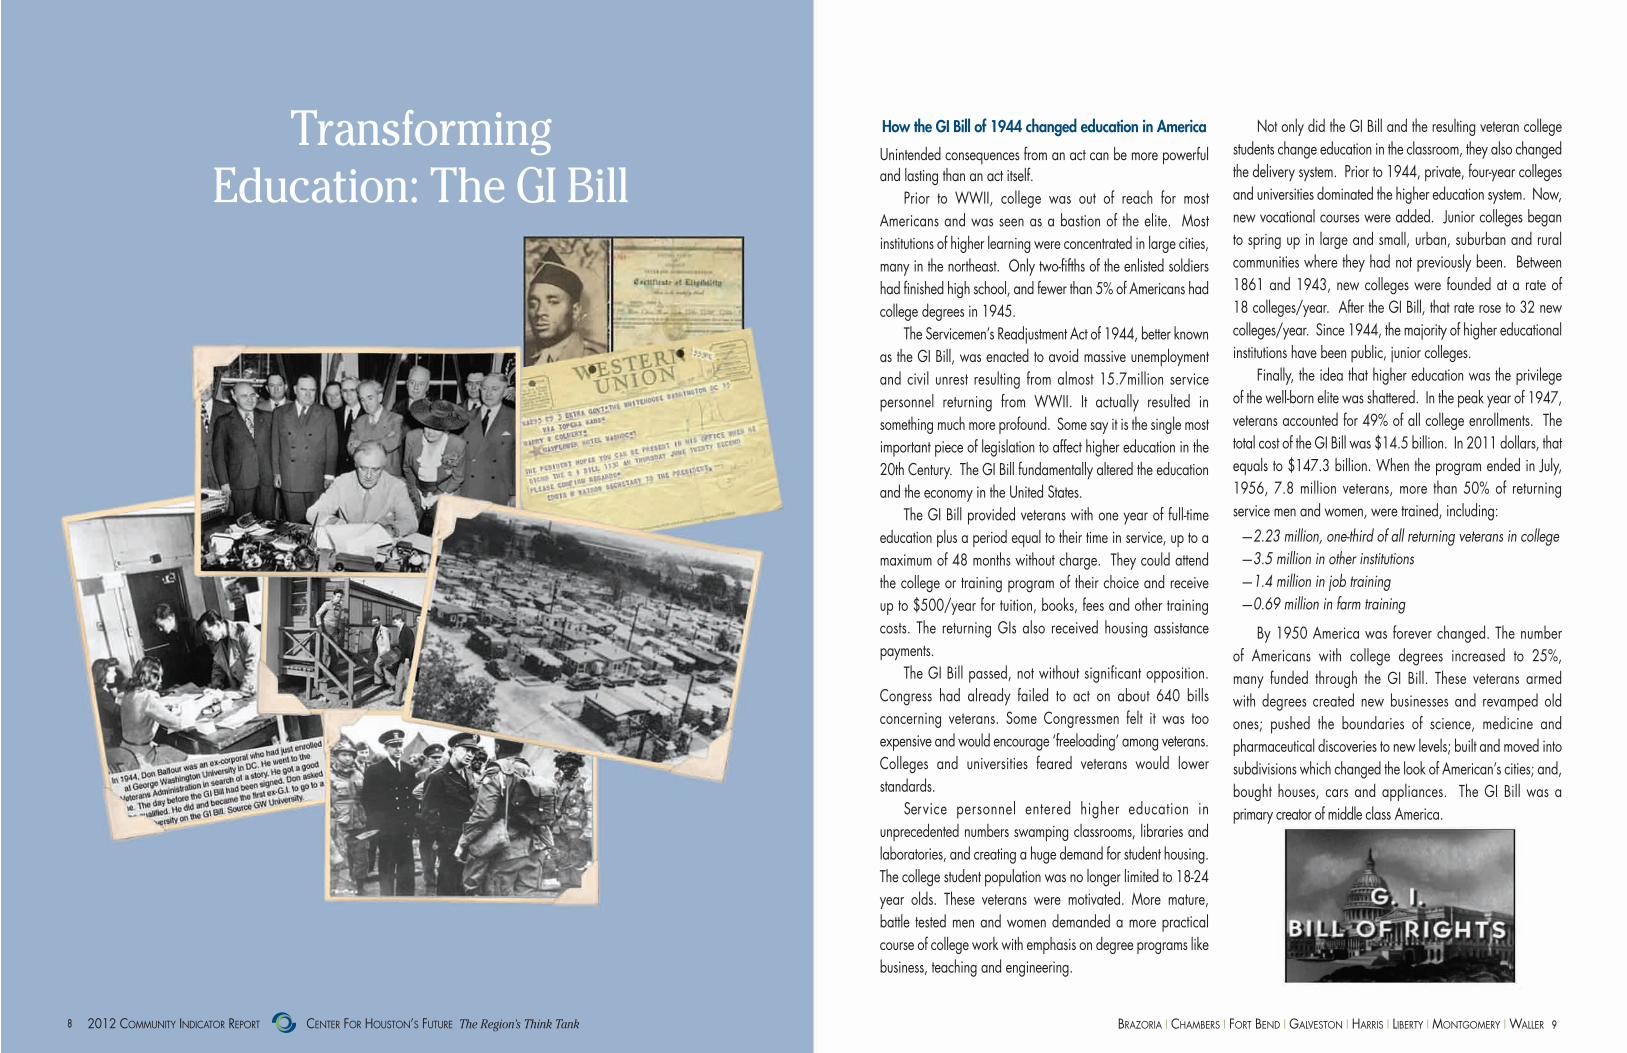
How the GI Bill of 1944 changed education in America
Unintended consequences from an act can be more powerfuland lasting than an act itself.
Prior to WWII, college was out of reach for most Americans and was seen as a bastion of the elite. Most institutions of higher learning were concentrated in large cities,many in the northeast. Only two-fifths of the enlisted soldiershad finished high school, and fewer than 5% of Americans hadcollege degrees in 1945.
The Servicemen’s Readjustment Act of 1944, better knownas the GI Bill, was enacted to avoid massive unemploymentand civil unrest resulting from almost 15.7million service personnel returning from WWII. It actually resulted in something much more profound. Some say it is the single mostimportant piece of legislation to affect higher education in the20th Century. The GI Bill fundamentally altered the educationand the economy in the United States.
The GI Bill provided veterans with one year of full-time education plus a period equal to their time in service, up to amaximum of 48 months without charge. They could attend the college or training program of their choice and receive up to $500/year for tuition, books, fees and other trainingcosts. The returning GIs also received housing assistance payments.
The GI Bill passed, not without significant opposition. Congress had already failed to act on about 640 bills concerning veterans. Some Congressmen felt it was too expensive and would encourage ‘freeloading’ among veterans.Colleges and universities feared veterans would lower standards.
Service personnel entered higher education in unprecedented numbers swamping classrooms, libraries andlaboratories, and creating a huge demand for student housing.The college student population was no longer limited to 18-24year olds. These veterans were motivated. More mature, battle tested men and women demanded a more practicalcourse of college work with emphasis on degree programs likebusiness, teaching and engineering.
Transforming Education: The GI Bill
Not only did the GI Bill and the resulting veteran collegestudents change education in the classroom, they also changedthe delivery system. Prior to 1944, private, four-year collegesand universities dominated the higher education system. Now,new vocational courses were added. Junior colleges began to spring up in large and small, urban, suburban and rural communities where they had not previously been. Between1861 and 1943, new colleges were founded at a rate of 18 colleges/year. After the GI Bill, that rate rose to 32 new colleges/year. Since 1944, the majority of higher educationalinstitutions have been public, junior colleges.
Finally, the idea that higher education was the privilege of the well-born elite was shattered. In the peak year of 1947,veterans accounted for 49% of all college enrollments. Thetotal cost of the GI Bill was $14.5 billion. In 2011 dollars, thatequals to $147.3 billion. When the program ended in July,1956, 7.8 million veterans, more than 50% of returningservice men and women, were trained, including:—2.23 million, one-third of all returning veterans in college—3.5 million in other institutions—1.4 million in job training—0.69 million in farm training
By 1950 America was forever changed. The number of Americans with college degrees increased to 25%, many funded through the GI Bill. These veterans armed with degrees created new businesses and revamped old ones; pushed the boundaries of science, medicine and pharmaceutical discoveries to new levels; built and moved intosubdivisions which changed the look of American’s cities; and,bought houses, cars and appliances. The GI Bill was a primary creator of middle class America.
2012 COMMUNITY INDICATOR REPORT CENTER FOR HOUSTON’S FUTURE The Region’s Think Tank 1111BRAZORIA � CHAMBERS � FORT BEND � GALVESTON � HARRIS � LIBERTY � MONTGOMERY � WALLER1100
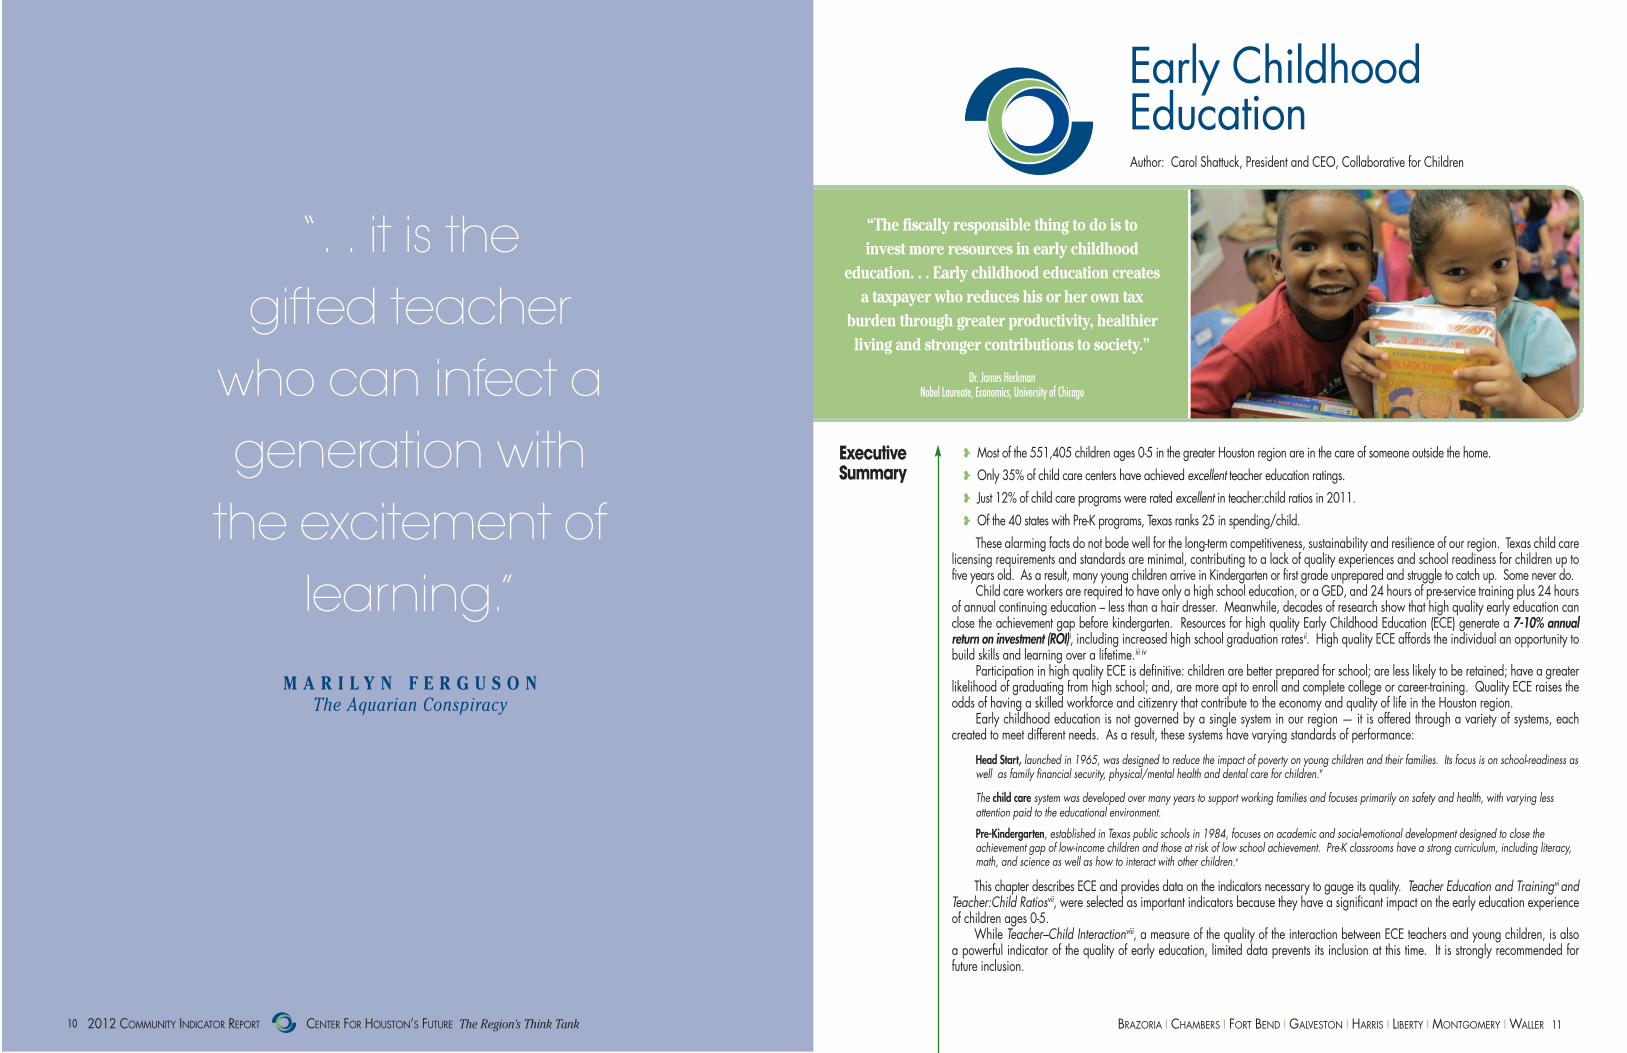
Early Childhood EducationAuthor: Carol Shattuck, President and CEO, Collaborative for Children
� Most of the 551,405 children ages 0-5 in the greater Houston region are in the care of someone outside the home.� Only 35% of child care centers have achieved excellent teacher education ratings.� Just 12% of child care programs were rated excellent in teacher:child ratios in 2011. � Of the 40 states with Pre-K programs, Texas ranks 25 in spending/child.These alarming facts do not bode well for the long-term competitiveness, sustainability and resilience of our region. Texas child care
licensing requirements and standards are minimal, contributing to a lack of quality experiences and school readiness for children up tofive years old. As a result, many young children arrive in Kindergarten or first grade unprepared and struggle to catch up. Some never do.
Child care workers are required to have only a high school education, or a GED, and 24 hours of pre-service training plus 24 hoursof annual continuing education – less than a hair dresser. Meanwhile, decades of research show that high quality early education canclose the achievement gap before kindergarten. Resources for high quality Early Childhood Education (ECE) generate a 7-10% annual return on investment (ROI)i, including increased high school graduation ratesii. High quality ECE affords the individual an opportunity tobuild skills and learning over a lifetime.iii iv
Participation in high quality ECE is definitive: children are better prepared for school; are less likely to be retained; have a greaterlikelihood of graduating from high school; and, are more apt to enroll and complete college or career-training. Quality ECE raises theodds of having a skilled workforce and citizenry that contribute to the economy and quality of life in the Houston region.
Early childhood education is not governed by a single system in our region — it is offered through a variety of systems, each created to meet different needs. As a result, these systems have varying standards of performance:
Head Start, launched in 1965, was designed to reduce the impact of poverty on young children and their families. Its focus is on school-readiness aswell as family financial security, physical/mental health and dental care for children.v
The child care system was developed over many years to support working families and focuses primarily on safety and health, with varying less attention paid to the educational environment.
Pre-Kindergarten, established in Texas public schools in 1984, focuses on academic and social-emotional development designed to close the achievement gap of low-income children and those at risk of low school achievement. Pre-K classrooms have a strong curriculum, including literacy, math, and science as well as how to interact with other children.v
This chapter describes ECE and provides data on the indicators necessary to gauge its quality. Teacher Education and Trainingvi andTeacher:Child Ratiosvii, were selected as important indicators because they have a significant impact on the early education experienceof children ages 0-5.
While Teacher–Child Interactionviii, a measure of the quality of the interaction between ECE teachers and young children, is also a powerful indicator of the quality of early education, limited data prevents its inclusion at this time. It is strongly recommended for future inclusion.
“The fiscally responsible thing to do is to invest more resources in early childhood
education. . . Early childhood education createsa taxpayer who reduces his or her own tax
burden through greater productivity, healthierliving and stronger contributions to society.”
Dr. James HeckmanNobel Laureate, Economics, University of Chicago
“. . it is the gifted teacher who can infect a generation with the excitement of
learning.”
M A R I L Y N F E R G U S O N The Aquarian Conspiracy
Executive Summary
2012 COMMUNITY INDICATOR REPORT CENTER FOR HOUSTON’S FUTURE The Region’s Think Tank1122 1133BRAZORIA � CHAMBERS � FORT BEND � GALVESTON � HARRIS � LIBERTY � MONTGOMERY � WALLER
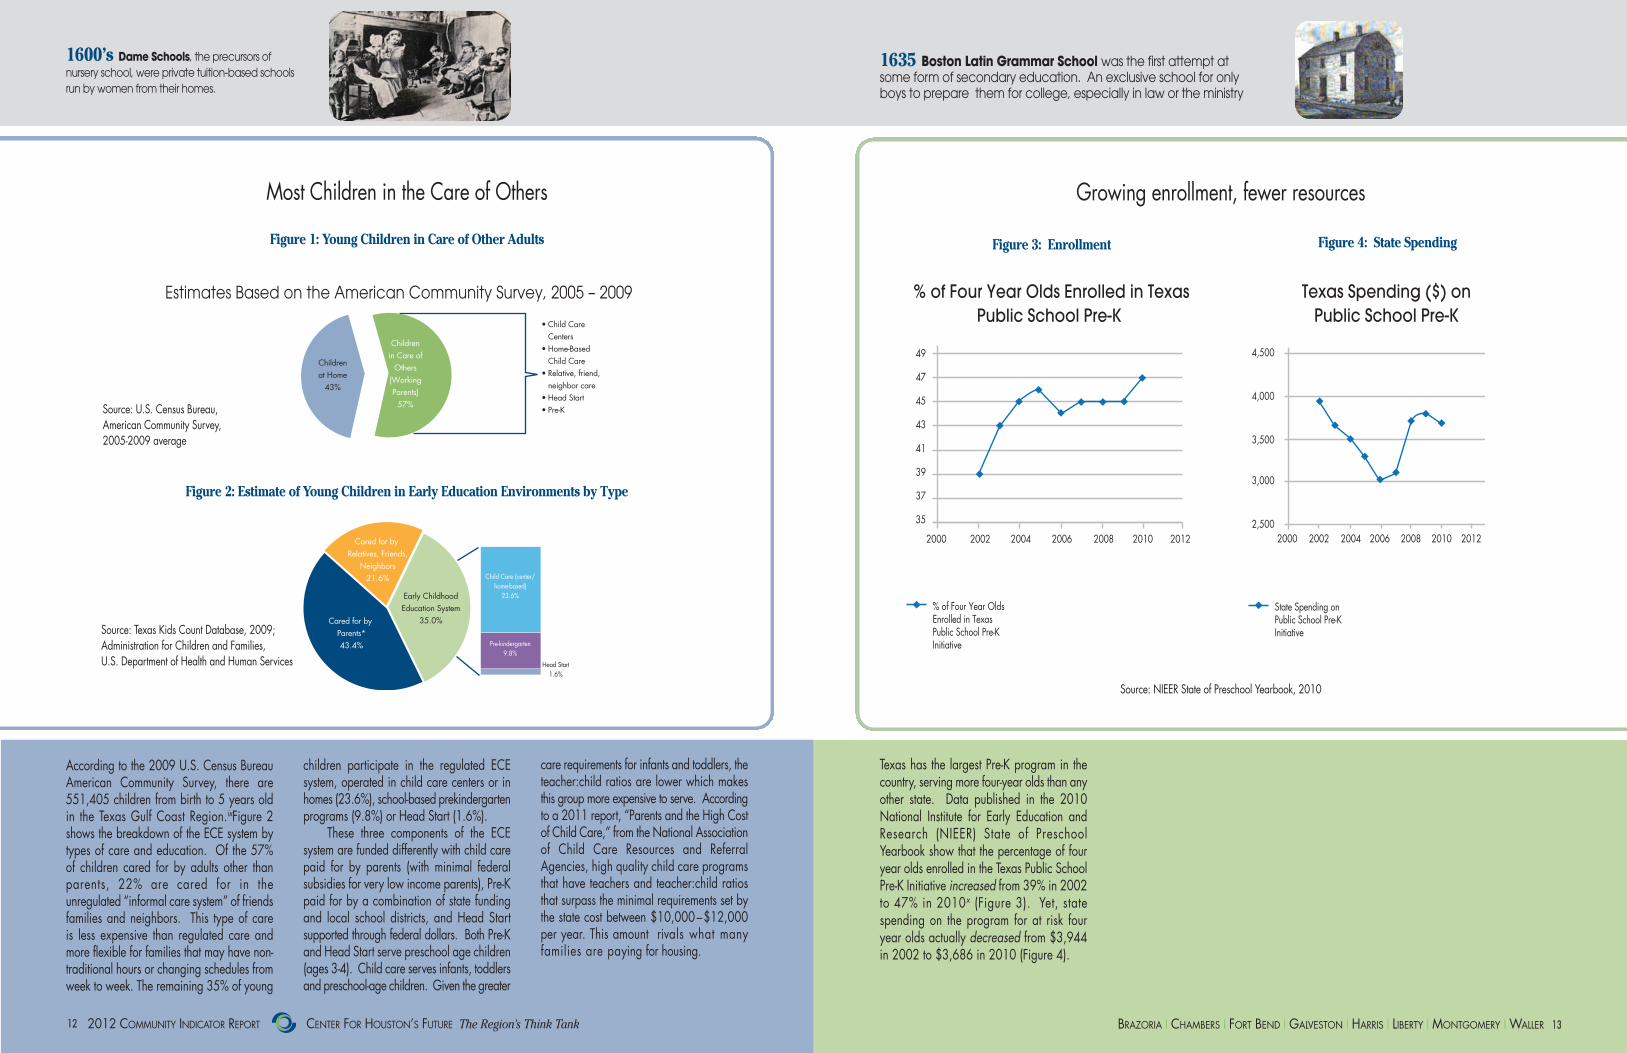
According to the 2009 U.S. Census Bureau American Community Survey, there are551,405 children from birth to 5 years oldin the Texas Gulf Coast Region.ixFigure 2shows the breakdown of the ECE system bytypes of care and education. Of the 57% of children cared for by adults other than parents, 22% are cared for in theunregulated “informal care system” of friendsfamilies and neighbors. This type of care is less expensive than regulated care andmore flexible for families that may have non-traditional hours or changing schedules fromweek to week. The remaining 35% of young
children participate in the regulated ECE system, operated in child care centers or inhomes (23.6%), school-based prekindergartenprograms (9.8%) or Head Start (1.6%).
These three components of the ECE system are funded differently with child carepaid for by parents (with minimal federal subsidies for very low income parents), Pre-Kpaid for by a combination of state fundingand local school districts, and Head Start supported through federal dollars. Both Pre-Kand Head Start serve preschool age children(ages 3-4). Child care serves infants, toddlersand preschool-age children. Given the greater
care requirements for infants and toddlers, theteacher:child ratios are lower which makesthis group more expensive to serve. Accordingto a 2011 report, “Parents and the High Costof Child Care,” from the National Associationof Child Care Resources and Referral Agencies, high quality child care programsthat have teachers and teacher:child ratiosthat surpass the minimal requirements set bythe state cost between $10,000–$12,000per year. This amount rivals what manyfamilies are paying for housing.
Most Children in the Care of Others
Source: Texas Kids Count Database, 2009; Administration for Children and Families, U.S. Departmentof Health and Human Services
Child Care (center/home-based)
23.6%
Pre-kindergarten9.8%
Head Start1.6%
Early ChildhoodEducation System
35.0%Cared for by Parents*43.4%
Cared for by Relatives, Friends,
Neighbors21.6%
Figure 2. Estimate of Young Children inEarly Education Environments by Type
Estimates Based on the American Community Survey, 2005 – 2009
• Child Care Centers• Home-Based Child Care• Relative, friend, neighbor care• Head Start• Pre-K
Source: U.S. Census Bureau, American Community Survey, 2005-2009 average
Childrenin Care of
Others(WorkingParents)
57%
Childrenat Home
43%
Figure 3: EnrollmentFigure 1: Young Children in Care of Other Adults
Figure 2: Estimate of Young Children in Early Education Environments by Type
Figure 4: State Spending
Growing enrollment, fewer resources
Texas has the largest Pre-K program in thecountry, serving more four-year olds than anyother state. Data published in the 2010 National Institute for Early Education and Research (NIEER) State of Preschool Yearbook show that the percentage of fouryear olds enrolled in the Texas Public SchoolPre-K Initiative increased from 39% in 2002to 47% in 2010x (Figure 3). Yet, statespending on the program for at risk fouryear olds actually decreased from $3,944in 2002 to $3,686 in 2010 (Figure 4).
1600’s Dame Schools, the precursors of nursery school, were private tuition-based schools run by women from their homes.
1635 Boston Latin Grammar School was the first attempt at some form of secondary education. An exclusive school for only boys to prepare them for college, especially in law or the ministry
Figure 3: Enrollment
49
47
45
43
41
39
37
35
2000 2002 2004 2006 2008 2010 2012
% of Four Year OldsEnrolled in TexasPublic School Pre-KInitiative
% of Four Year Olds Enrolled in TexasPublic School Pre-K
State Spending onPublic School Pre-KInitiative
4,500
4,000
3,500
3,000
2,5002000 2002 2004 2006 2008 2010 2012
Texas Spending ($) onPublic School Pre-K
Source: NIEER State of Preschool Yearbook, 2010
Source: U.S. Census Bureau, American Community Survey, 2005-2009 average
Source: Texas Kids Count Database, 2009; Administration for Children and Families, U.S. Department of Health and Human Services
2012 COMMUNITY INDICATOR REPORT CENTER FOR HOUSTON’S FUTURE The Region’s Think Tank1144 1155BRAZORIA � CHAMBERS � FORT BEND � GALVESTON � HARRIS � LIBERTY � MONTGOMERY � WALLER
Figure 5: Head Start State Comparisons
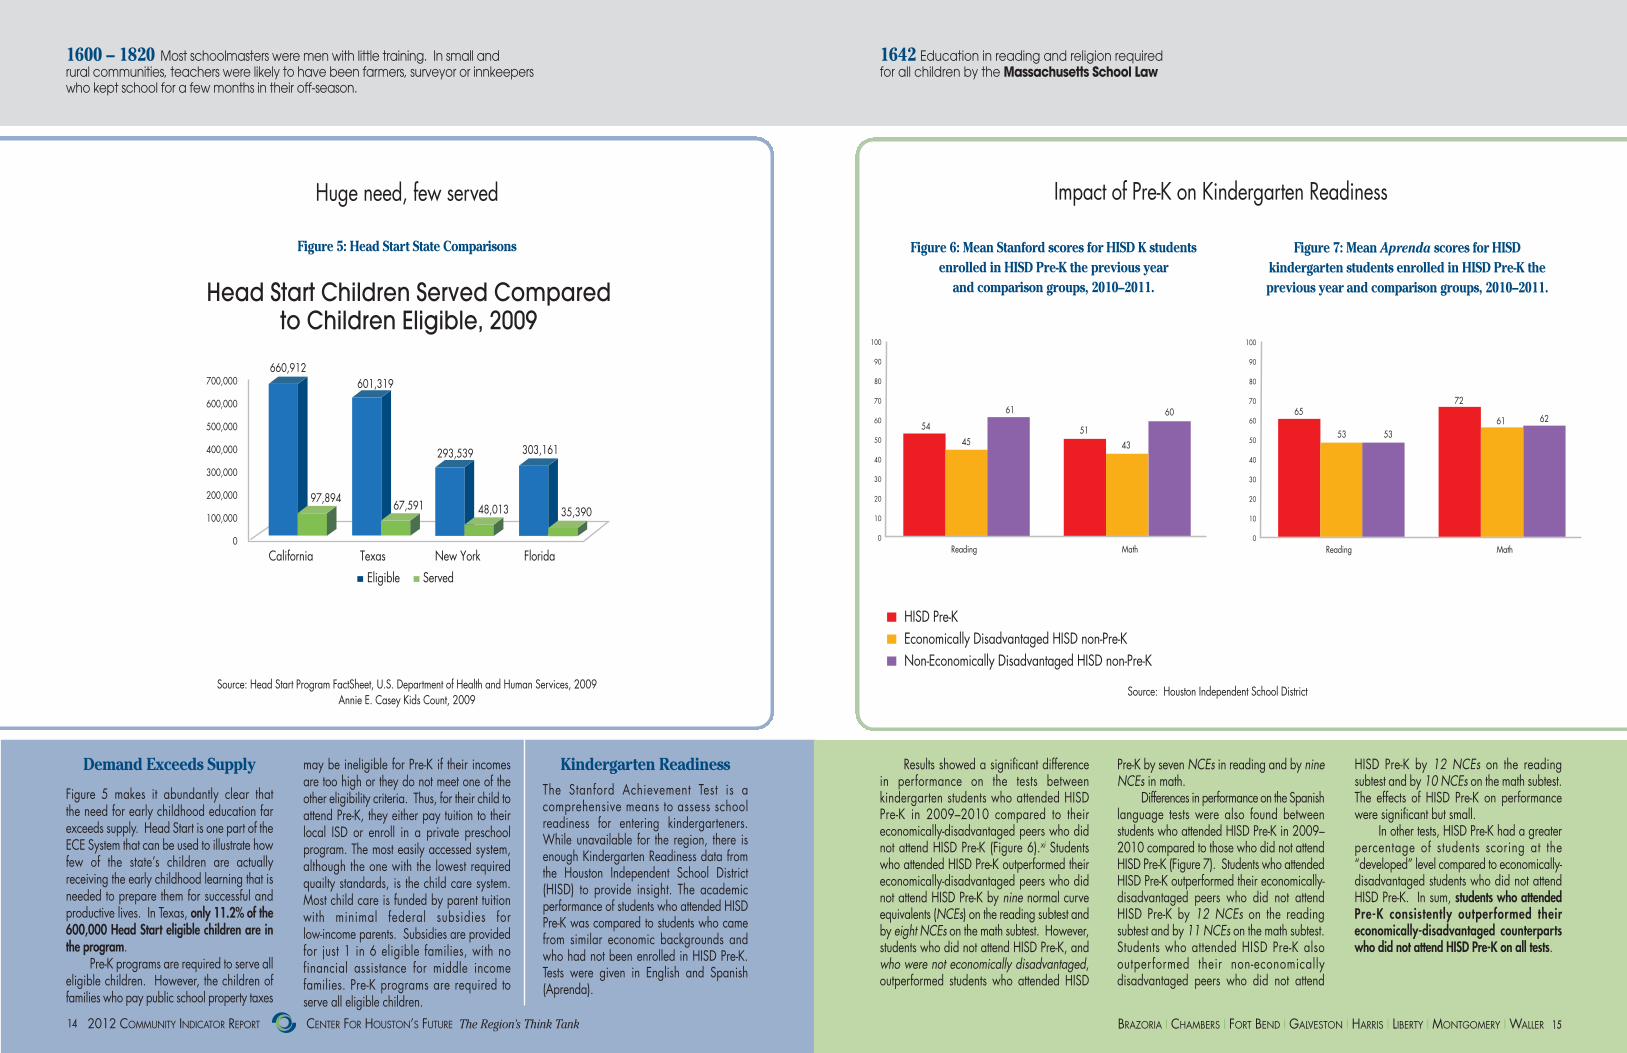
Huge need, few served
Demand Exceeds Supply
Figure 5 makes it abundantly clear that the need for early childhood education farexceeds supply. Head Start is one part of theECE System that can be used to illustrate howfew of the state’s children are actually receiving the early childhood learning that isneeded to prepare them for successful andproductive lives. In Texas, only 11.2% of the600,000 Head Start eligible children are inthe program.
Pre-K programs are required to serve alleligible children. However, the children offamilies who pay public school property taxes
may be ineligible for Pre-K if their incomesare too high or they do not meet one of theother eligibility criteria. Thus, for their child toattend Pre-K, they either pay tuition to theirlocal ISD or enroll in a private preschool program. The most easily accessed system,although the one with the lowest requiredquailty standards, is the child care system.Most child care is funded by parent tuitionwith minimal federal subsidies for low-income parents. Subsidies are providedfor just 1 in 6 eligible families, with no financial assistance for middle incomefamilies. Pre-K programs are required toserve all eligible children.
Head Start Children Served Comparedto Children Eligible, 2009
Source: Head Start Program FactSheet, U.S. Department of Health and Human Services, 2009 Data;Annie E. Casey Kids Count, 2009 Data
700,000
600,000
500,000
400,000
300,000
200,000
100,000
0California Texas New York Florida
Eligible Served
660,912601,319
293,539 303,161
97,894 67,591 48,013 35,390
Figure 5: Head Start State Comparisons
100
90
80
70
60
50
40
30
20
10
0
65
53 53
72
61 62
Reading Math
Figure 7: Mean Aprenda scores for HISDkindergarten students enrolled in HISD Pre-K
the previous year and comparison groups, 2010–2011.
Figure 6: Mean Stanford scores for HISD K studentsenrolled in HISD Pre-K the previous year
and comparison groups, 2010–2011.
100
90
80
70
60
50
40
30
20
10
0
54
45
61
5143
60
Reading Math
n HISD Pre-Kn Economically Disadvantaged HISD non-Pre-Kn Non-Economically Disadvantaged HISD non-Pre-K
Eligible
Impact of Pre-K on Kindergarten Readiness
Figure 6: Mean Stanford scores for HISD K students enrolled in HISD Pre-K the previous year
and comparison groups, 2010–2011.
Figure 7: Mean Aprenda scores for HISD kindergarten students enrolled in HISD Pre-K the previous year and comparison groups, 2010–2011.
Kindergarten ReadinessThe Stanford Achievement Test is a comprehensive means to assess school readiness for entering kindergarteners.While unavailable for the region, there isenough Kindergarten Readiness data fromthe Houston Independent School District(HISD) to provide insight. The academic performance of students who attended HISDPre-K was compared to students who camefrom similar economic backgrounds andwho had not been enrolled in HISD Pre-K.Tests were given in English and Spanish(Aprenda).
Results showed a significant differencein performance on the tests between kindergarten students who attended HISD Pre-K in 2009–2010 compared to their economically-disadvantaged peers who didnot attend HISD Pre-K (Figure 6).xi Studentswho attended HISD Pre-K outperformed theireconomically-disadvantaged peers who didnot attend HISD Pre-K by nine normal curveequivalents (NCEs) on the reading subtest andby eight NCEs on the math subtest. However,students who did not attend HISD Pre-K, andwho were not economically disadvantaged,outperformed students who attended HISD
Pre-K by seven NCEs in reading and by nineNCEs in math.
Differences in performance on the Spanishlanguage tests were also found between students who attended HISD Pre-K in 2009–2010 compared to those who did not attendHISD Pre-K (Figure 7). Students who attendedHISD Pre-K outperformed their economically-disadvantaged peers who did not attendHISD Pre-K by 12 NCEs on the reading subtest and by 11 NCEs on the math subtest.Students who attended HISD Pre-K also outperformed their non-economicallydisadvantaged peers who did not attend
HISD Pre-K by 12 NCEs on the reading subtest and by 10 NCEs on the math subtest.The effects of HISD Pre-K on performancewere significant but small.
In other tests, HISD Pre-K had a greaterpercentage of students scoring at the “developed” level compared to economically-disadvantaged students who did not attendHISD Pre-K. In sum, students who attendedPre-K consistently outperformed their economically-disadvantaged counterpartswho did not attend HISD Pre-K on all tests.
1600 – 1820 Most schoolmasters were men with little training. In small and rural communities, teachers were likely to have been farmers, surveyor or innkeepers who kept school for a few months in their off-season.
1642 Education in reading and religion required for all children by the Massachusetts School Law
Source: Houston Independent School DistrictSource: Head Start Program FactSheet, U.S. Department of Health and Human Services, 2009Annie E. Casey Kids Count, 2009

2012 COMMUNITY INDICATOR REPORT CENTER FOR HOUSTON’S FUTURE The Region’s Think Tank1166 1177BRAZORIA � CHAMBERS � FORT BEND � GALVESTON � HARRIS � LIBERTY � MONTGOMERY � WALLER
. . . as good as the teacher
1984, the teacher education standard wasetablished as a Bachelor’s degree. However,according to the National Institute for Early Education Researchxiv (NIEER), this is not truefor all public Pre-K programs. Now, 58% accept Pre-K teachers whose highest level of education is the CDA or an Associate’sdegree.xv National organizations, such asPreK Nowxvi, have strongly advocated that Pre-K teachers have a Bachelor’s degree, arguing that they are more likely to get ahigher ROI if programs are taught by highlyqualified teachers.
Figure 9: Trend Line — Teacher Education
Table 1. QualiFind Rating for Teacher Education
• Based on National Association forEducation of Young Children (NAEYC) Standards
• All lead teachers must have a CDA• OR, 25% of teachers have an AA or BA degree in early education
• OR, a child development or a teaching certificate
• All teachers have/working on AA, BA in early education or child development or a teaching certificate.
• 50% of the lead teachers musthave a CDA or higher
• OR, 12 hours of college credit in early education or child development
• OR, all lead teachers Montessori certified
• Meet Texas Department of Family and Protective Services Standards for operating a child care center
• A high school diploma or GED, 24 hours of pre-service training and 24 hours of annual training.
Excellent Good Minimal
Early childhood learning & development . . .
Teacher Education and Training
High quality teacher education and training isessential for the best child carexii, outstandingHead Start and first-rate Pre-K programs.Standards for working in a Texas child carecenter are woefully low. The state requiresminimal education and training: a high schooldiploma or a GED, plus 24 hours of pre-servicetraining and 24 hours of annual continuing education. This very low standard affects mostacutely the 23.6% (Figure 2) of pre-schoolers
Child Care Head Start PreK
100%
90%
80%
70%
60%
50%
40%
30%
20%
10%
0%
Minimal Good Excellent
Source: Collaborative for Children’s QualiFind Early childhood Education Database, 2011
All Gulf Coast Counties Early Childhood Education Programs (9/2011)
N=1,441
N= 95
N= 294
98% 100%
35%
25%
40%
1%1%
%of P
rogr
ams
Figure 8: QualiFind Ratings on Teacher Education
who receive care in child care centers, excluding Head Start or a Pre-K program.xiii
More highly trained teachers necessarilyresult in higher costs for a state, federal funder or parents. In a private child care setting, parents pay full tuition. Head Start isfree to qualified parents/children and is paidfor with federal funding. Public school Pre-K isa part of the school district budget and is provided at no cost to eligible parents.
In the 13-county region, only 35% of child care centers have excellent teacherratings (Figure 8). To achieve an excellent
rating, all teachers must have a Child Development Associate’s (CDA) credentialwhile a good teacher rating requires that halfthe lead teachers have a CDA degree. Only25% of child care centers are rated good onteacher education while 40% of child carecenters had minimal teacher education ratings.(Table 1)
Figure 8 shows the number of programsthat meet the excellent standard. Ninety eightpercent of Head Start programs and 100% ofPre-K programs are ranked excellent. Whenthe Texas Pre-K program was approved in
1751 A new type of secondary school , the “academy” was formed by Benjamin Franklin. Considered more practical than the Latin Grammar School, it focused more on subjects that could be directly related to the students' adult lives. Allowed girls to attend.
1839While Secretary of the Massachusetts Board of Education, Horace Mann, the Father of American Education, established the firstfree, non-sectarian public Normal School in the U.S. in Lexington, MA.
Source: Collaborative for Children’s QualiFind Early Childhood Education Database, 2011 Source: Collaborative for Children’s QualiFind Early Childhood Education Database, 2011
Number of Programs with Teachers Rated ExcellentAll Gulf Coast Counties Early Childhood Programs (9/2011)Figure 7: Trend Line — Teacher Education
1,000
900
800
700
600
500
400
300
200
100
0
Child Care (including Head Start) PreK
Source: Collaborative for Children’s QualiFind Early Childhood Education Database, 2011
Teachers Rated “Excellent” Slowly Growing
35% ofprograms
7/1/2
0099/1
/2009
11/1/2
0091/1
/2010
3/1/2
0105/1
/2010
7/1/2
0109/1
/2010
11/1/2
0101/1
/2011
3/1/2
0115/1
/2011
7/1/2
0119/1
/2011
%of P
rogr
ams
23%
35%

2012 COMMUNITY INDICATOR REPORT CENTER FOR HOUSTON’S FUTURE The Region’s Think Tank1188 1199BRAZORIA � CHAMBERS � FORT BEND � GALVESTON � HARRIS � LIBERTY � MONTGOMERY � WALLER
Quality education takes training, time and money Room for improvement
Child Care Head Start PreK
100%
90%
80%
70%
60%
50%
40%
30%
20%
10%
0%
All Gulf Coast Counties Early Childhood Education N=1,652
N= 105
N= 434
77%
20%12%
53%
35% 29%
4%
%of P
rogr
ams 39%
41%
QualiFind Ratings on Teacher: Child Ratios
Excellent
Good
Minimal
Teacher: Child Ratios
Results for teacher:child ratios are a cause forconcern: just 12% of all child care centers inthe region were rated excellent for teacher:child ratios in 2011.
Head Start programs stand out with77% of programs reporting excellent ratios.Even thought Head Start programs have 77% excellent ratios, 100% of Head Startprograms shouldmeet the excellent standard.Partnerships with school districts to coordinateservices and improve efficiency has meant
Figure 10: QualiFind Ratings on Teacher:Child Ratios
that Head Start has increased the number ofchildren per teacher. Pre-K teacher:child ratios were not established when the TexasPre-K program was created; thus, each schooldistrict makes its own decisions on how manyPre-K children may enroll in each class.
Only 20% of the greater Houston Pre-Kprograms ranked excellent for a teacher:child ratio of 1:10 (Figure 10). NIEER reportsthat 45 of the 52 states/territories, or 86.5%of state Pre-K programs are rated excellent.On this indicator, Texas lags far behind therest of the country.
Fifty-three percent of child care centers,29% of Head Start centers, and 39% of Pre-K programs reported teacher:child ratiosin the good category. Forty-one percent ofPre-K programs, 35% of child care centers,and 4% of Head Start centers have minimalratings.
Table 2. QualiFind Rating for Teacher:Child Ratios
NAEYC Standards• 0 – 11 months: 1:4• 12 – 17 months: 1:4• 18 – 23 months: 1:4• 2 yeas: 1:6• 3 years: 1:9• 4 years: 1:10• 5 years: 1:10
QualiFind• 0 – 11 months: 1:4• 12 – 17 months: 1:4• 18 – 23 months: 1:6• 2 years: 1:8• 3 years: 1:12• 4 years: 1:14• 5 years: 1:16
TX Dept of Family Services Std• 0 – 11 months: 1:4• 12 – 17 months: 1:5• 18 – 23 months: 1: 9• 2 years:: 1:11• 3 years: 1:15• 4 years: 1:18• 5 years: 1:20
Excellent Good Minimal
Figure 11 illustrates the limited number of ECEprograms which meets the excellent standard.The percentage of Pre-K programs rated excellent actually fell from 16% to 13% in aone-year period. At this percentage few of the region’s young children receive the individualized attention needed for social, emotional and cognitive growth and development.
Table 3 is an overview of the recommendedratios by national organizations compared to
AGE NAEYC ACADEMY HEAD START** TX CHILD TX PUBLICOF PEDIATRICS CARE STDS PRE-K0-1 YR
0 – 11 months 1:4 N/A 1: 4 N/A12 – 24 months 1:4 1:4 N/A 1:9 N/A25 36 months 1:6 1:5 N/A 1:11 N/A3 years 1:9 1:7 2:17 1:15 No Standards4 years 1:10 1:8 2:20 1:18 No Standards5 years 1:10 1:8 2:20 1:20 No Standards
* Age groups are not consistent in different systems, so comparisons are approximate ** Classrooms have two teachers to teacher/child
Figure 11: Trend Line – Teacher:Child Ratio
Table 3. National Teacher:Child Ratio Standards for ECE Systems, 0-5 years*
standards in Head Start, Texas child care andTexas Pre-K. Child care teacher:child ratiosmirror national accreditation standards for infant care; however, as children get older,Texas state licensing standards allow morechildren than are recommended by NAEYCxviiand the American Academy of Pediatrics.xviii
1857 National Education Association founded as a policy-making organization to influence the national debate about schools and schooling
1862 Port Royal Experiment , South Carolina Sea Islands, an earlyattempt to prepare newly freed slaves for full democratic participationwith the goal of literacy, economic independence and civil rights.
Source: Collaborative for Children’s QualiFind Early Childhood Education Database, 2011Source: Collaborative for Children’s QualiFind Early Childhood Education Database, 2011
Figure 9: Trend Line – Teacher–to–Child Ratio
Programs with “Excellent” Teacher:Child RatiosSlighty increasing, then worsening
500
400
300
200
100
0
Child Care (including Head Start) PreK
15% of Programs 16% of Programs13% of Programs
7/1/2
0099/1
/2009
11/1/2
0091/1
/2010
3/1/2
0105/1
/2010
7/1/2
0109/1
/2010
11/1/2
0101/1
/2011
3/1/2
0115/1
/2011
7/1/2
0119/1
/2011
Source: Collaborative for Children’s QualiFind Early Childhood Education Database, 2011
% of Programs with “Excellant”
13%15%16%
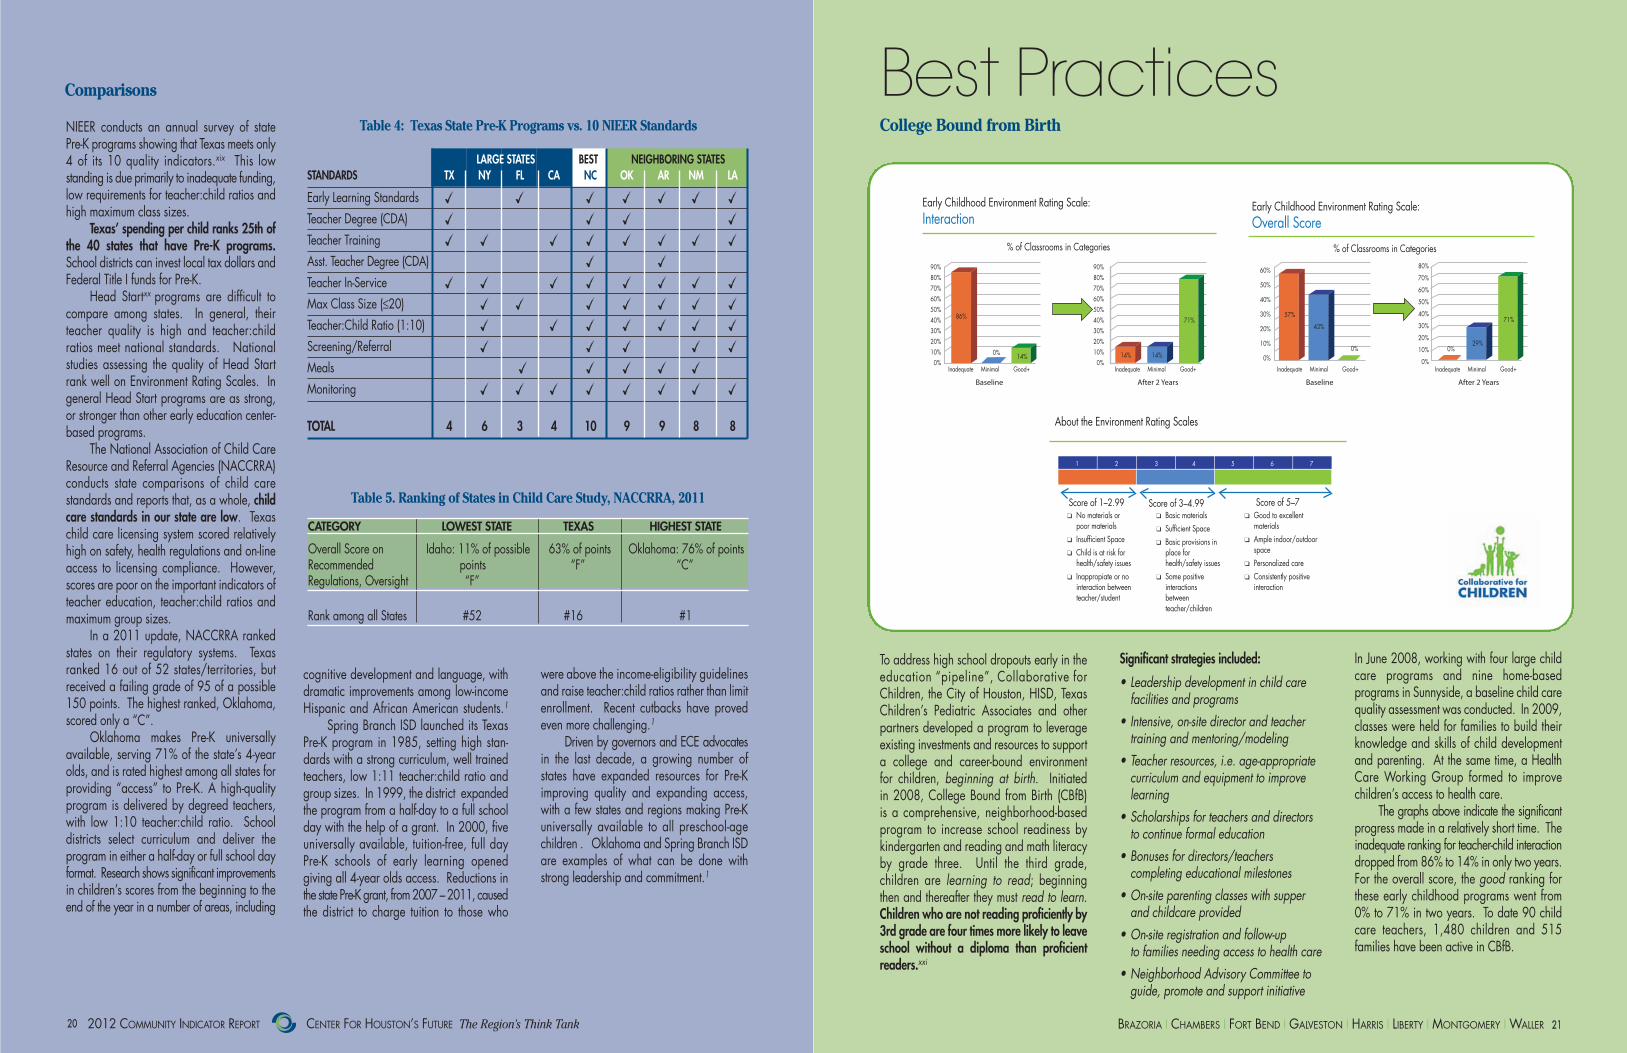
Table 4: Texas State Pre-K Programs vs. 10 NIEER StandardsNIEER conducts an annual survey of state Pre-K programs showing that Texas meets only4 of its 10 quality indicators.xix This lowstanding is due primarily to inadequate funding,low requirements for teacher:child ratios andhigh maximum class sizes.
Texas’ spending per child ranks 25th ofthe 40 states that have Pre-K programs.School districts can invest local tax dollars andFederal Title I funds for Pre-K.
Head Startxx programs are difficult tocompare among states. In general, theirteacher quality is high and teacher:child ratios meet national standards. National studies assessing the quality of Head Startrank well on Environment Rating Scales. Ingeneral Head Start programs are as strong,or stronger than other early education center-based programs.
The National Association of Child CareResource and Referral Agencies (NACCRRA)conducts state comparisons of child care standards and reports that, as a whole, childcare standards in our state are low. Texaschild care licensing system scored relativelyhigh on safety, health regulations and on-lineaccess to licensing compliance. However,scores are poor on the important indicators ofteacher education, teacher:child ratios andmaximum group sizes.
In a 2011 update, NACCRRA rankedstates on their regulatory systems. Texasranked 16 out of 52 states/territories, but received a failing grade of 95 of a possible150 points. The highest ranked, Oklahoma,scored only a “C”.
Oklahoma makes Pre-K universally available, serving 71% of the state’s 4-yearolds, and is rated highest among all states for providing “access” to Pre-K. A high-qualityprogram is delivered by degreed teachers,with low 1:10 teacher:child ratio. School districts select curriculum and deliver the program in either a half-day or full school dayformat. Research shows significant improvementsin children’s scores from the beginning to theend of the year in a number of areas, including
cognitive development and language, withdramatic improvements among low-incomeHispanic and African American students.1
Spring Branch ISD launched its TexasPre-K program in 1985, setting high stan-dards with a strong curriculum, well trainedteachers, low 1:11 teacher:child ratio andgroup sizes. In 1999, the district expandedthe program from a half-day to a full schoolday with the help of a grant. In 2000, fiveuniversally available, tuition-free, full day Pre-K schools of early learning openedgiving all 4-year olds access. Reductions inthe state Pre-K grant, from 2007 – 2011, causedthe district to charge tuition to those who
were above the income-eligibility guidelinesand raise teacher:child ratios rather than limit enrollment. Recent cutbacks have provedeven more challenging.1
Driven by governors and ECE advocatesin the last decade, a growing number ofstates have expanded resources for Pre-K improving quality and expanding access,with a few states and regions making Pre-Kuniversally available to all preschool-agechildren . Oklahoma and Spring Branch ISDare examples of what can be done withstrong leadership and commitment.1
To address high school dropouts early in theeducation “pipeline”, Collaborative for Children, the City of Houston, HISD, TexasChildren’s Pediatric Associates and otherpartners developed a program to leverageexisting investments and resources to supporta college and career-bound environment for children, beginning at birth. Initiated in 2008, College Bound from Birth (CBfB) is a comprehensive, neighborhood-based program to increase school readiness bykindergarten and reading and math literacyby grade three. Until the third grade, children are learning to read; beginningthen and thereafter they must read to learn.Children who are not reading proficiently by3rd grade are four times more likely to leaveschool without a diploma than proficientreaders.xxi
Significant strategies included:
• Leadership development in child care facilities and programs
• Intensive, on-site director and teacher training and mentoring/modeling
• Teacher resources, i.e. age-appropriate curriculum and equipment to improve learning
• Scholarships for teachers and directors to continue formal education
• Bonuses for directors/teachers completing educational milestones
• On-site parenting classes with supper and childcare provided
• On-site registration and follow-up to families needing access to health care
• Neighborhood Advisory Committee to guide, promote and support initiative
In June 2008, working with four large childcare programs and nine home-based programs in Sunnyside, a baseline child carequality assessment was conducted. In 2009,classes were held for families to build theirknowledge and skills of child developmentand parenting. At the same time, a HealthCare Working Group formed to improve children’s access to health care.
The graphs above indicate the significantprogress made in a relatively short time. Theinadequate ranking for teacher-child interactiondropped from 86% to 14% in only two years.For the overall score, the good ranking forthese early childhood programs went from0% to 71% in two years. To date 90 childcare teachers, 1,480 children and 515 families have been active in CBfB.
2012 COMMUNITY INDICATOR REPORT CENTER FOR HOUSTON’S FUTURE The Region’s Think Tank 2211BRAZORIA � CHAMBERS � FORT BEND � GALVESTON � HARRIS � LIBERTY � MONTGOMERY � WALLER2200
Comparisons
College Bound from Birth
Best Practices LARGE STATES BEST NEIGHBORING STATES
STANDARDS TX NY FL CA NC OK AR NM LA
Early Learning Standards l l l l l l l
Teacher Degree (CDA) l l l l
Teacher Training l l l l l l l l
Asst. Teacher Degree (CDA) l l
Teacher In-Service l l l l l l l l
Max Class Size (≤20) l l l l l l l
Teacher:Child Ratio (1:10) l l l l l l l
Screening/Referral l l l l l
Meals l l l l l
Monitoring l l l l l l l l
TOTAL 4 6 3 4 10 9 9 8 8
Table 5. Ranking of States in Child Care Study, NACCRRA, 2011
CATEGORY LOWEST STATE TEXAS HIGHEST STATE
Overall Score on Idaho: 11% of possible 63% of points Oklahoma: 76% of pointsRecommended points “F” “C”Regulations, Oversight “F”
Rank among all States #52 #16 #1
% of Classrooms in Categories % of Classrooms in Categories
Early Childhood Environment Rating Scale:Interaction
Early Childhood Environment Rating Scale:Overall Score
90%80%70%60%50%40%30%20%10%0%
90%80%70%60%50%40%30%20%10%0%
60%
50%
40%
30%
20%
10%
0%
80%
70%
60%
50%
40%
30%
20%
10%
0%
Baseline After 2 Years Baseline After 2 Years
Inadequate Minimal Good+ Inadequate Minimal Good+ Inadequate Minimal Good+ Inadequate Minimal Good+
0% 0% 0%
About the Environment Rating Scales
Score of 1–2.99 Score of 3–4.99 Score of 5–7q No materials or poor materialsq Insufficient Spaceq Child is at risk for health/safety issuesq Inappropiate or no interaction between teacher/student
q Basic materialsq Sufficient Spaceq Basic provisions in place for health/safety issuesq Some positive interactions between teacher/children
q Good to excellent materialsq Ample indoor/outdoor spaceq Personalized careq Consistently positive interaction
1 2 3 4 5 6 7
86% 71%57%
29%
14% 14%
71%
14%
43%
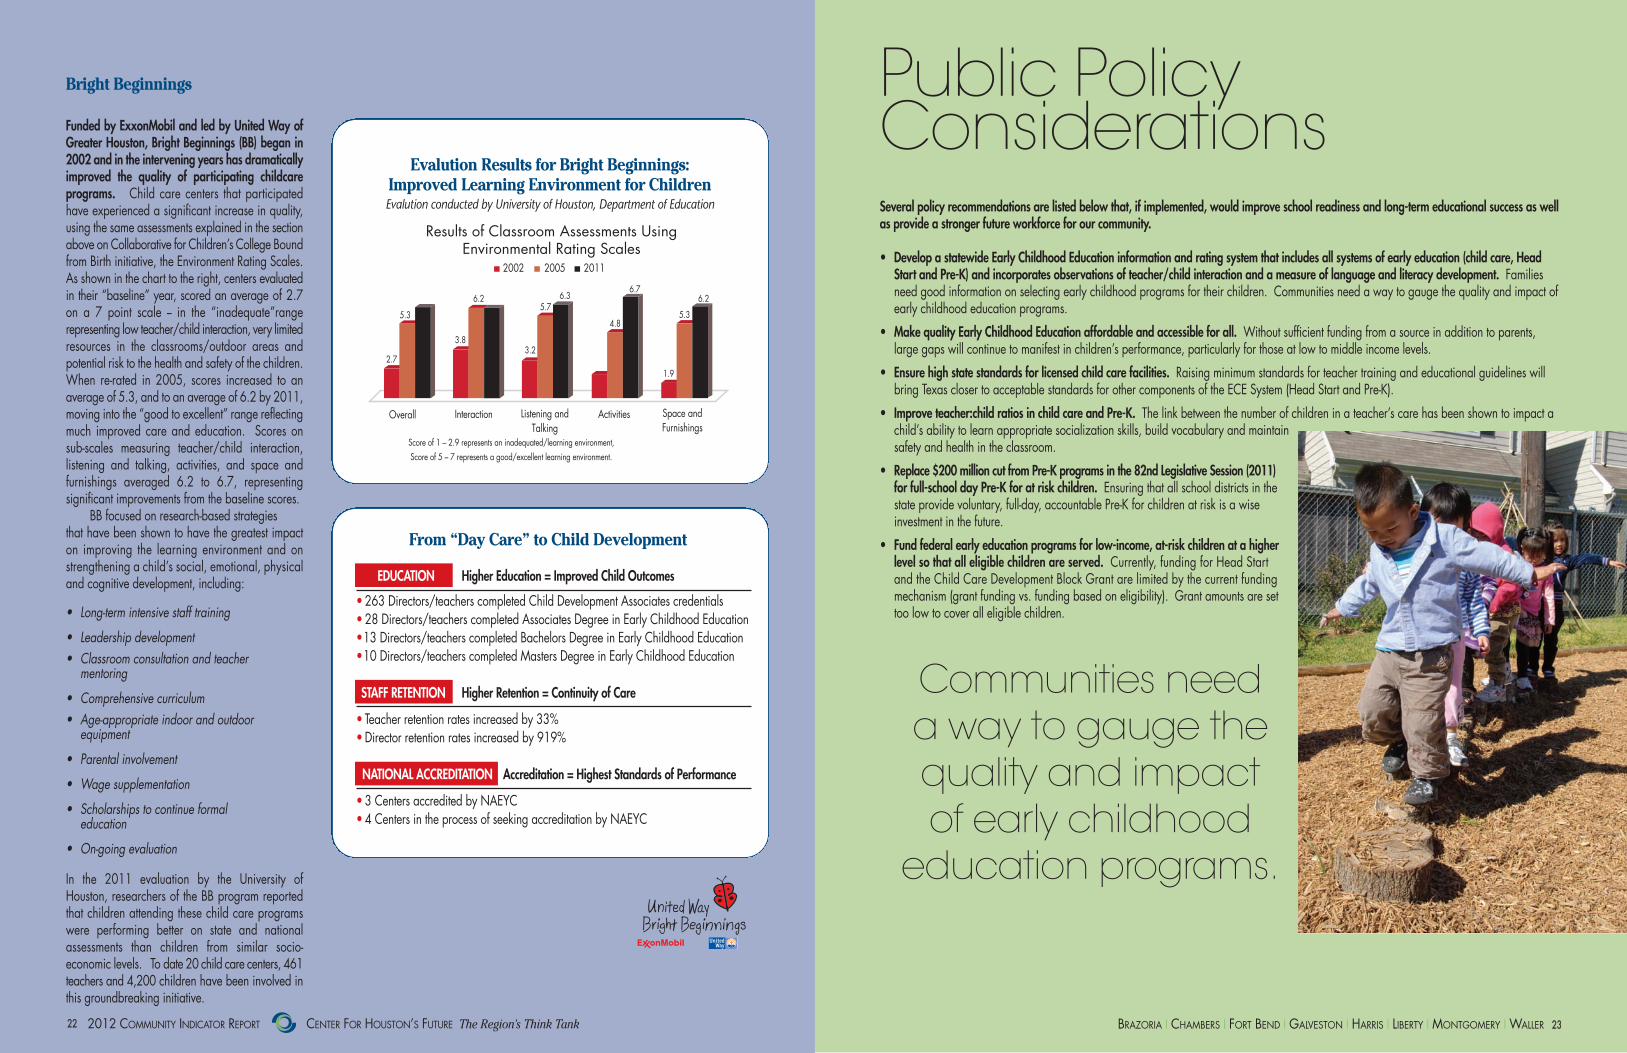
Funded by ExxonMobil and led by United Way ofGreater Houston, Bright Beginnings (BB) began in2002 and in the intervening years has dramaticallyimproved the quality of participating childcare programs. Child care centers that participated have experienced a significant increase in quality,using the same assessments explained in the sectionabove on Collaborative for Children’s College Boundfrom Birth initiative, the Environment Rating Scales.As shown in the chart to the right, centers evaluatedin their “baseline” year, scored an average of 2.7 on a 7 point scale -- in the “inadequate”range representing low teacher/child interaction, very limitedresources in the classrooms/outdoor areas and potential risk to the health and safety of the children.When re-rated in 2005, scores increased to an average of 5.3, and to an average of 6.2 by 2011,moving into the “good to excellent” range reflectingmuch improved care and education. Scores on sub-scales measuring teacher/child interaction, listening and talking, activities, and space and furnishings averaged 6.2 to 6.7, representing significant improvements from the baseline scores.
BB focused on research-based strategies that have been shown to have the greatest impacton improving the learning environment and onstrengthening a child’s social, emotional, physicaland cognitive development, including:
• Long-term intensive staff training
• Leadership development• Classroom consultation and teacher mentoring
• Comprehensive curriculum• Age-appropriate indoor and outdoor equipment
• Parental involvement
• Wage supplementation
• Scholarships to continue formal education
• On-going evaluation
In the 2011 evaluation by the University of Houston, researchers of the BB program reportedthat children attending these child care programswere performing better on state and national assessments than children from similar socio-economic levels. To date 20 child care centers, 461teachers and 4,200 children have been involved inthis groundbreaking initiative.
Results of Classroom Assessments UsingEnvironmental Rating Scales
Overall Interaction Listening andTalking
Activities Space andFurnishings
2002 2005 2011
2.7
5.3 5.3
6.2 6.2
3.83.2
5.76.3
6.7
4.8
1.9
Score of 1 – 2.9 represents an inadequated/learning environment,Score of 5 – 7 represents a good/excellent learning environment.
Several policy recommendations are listed below that, if implemented, would improve school readiness and long-term educational success as wellas provide a stronger future workforce for our community.
• Develop a statewide Early Childhood Education information and rating system that includes all systems of early education (child care, Head Start and Pre-K) and incorporates observations of teacher/child interaction and a measure of language and literacy development. Families need good information on selecting early childhood programs for their children. Communities need a way to gauge the quality and impact of early childhood education programs.
• Make quality Early Childhood Education affordable and accessible for all. Without sufficient funding from a source in addition to parents, large gaps will continue to manifest in children’s performance, particularly for those at low to middle income levels.
• Ensure high state standards for licensed child care facilities. Raising minimum standards for teacher training and educational guidelines will bring Texas closer to acceptable standards for other components of the ECE System (Head Start and Pre-K).
• Improve teacher:child ratios in child care and Pre-K. The link between the number of children in a teacher’s care has been shown to impact a child’s ability to learn appropriate socialization skills, build vocabulary and maintain safety and health in the classroom.
• Replace $200 million cut from Pre-K programs in the 82nd Legislative Session (2011)for full-school day Pre-K for at risk children. Ensuring that all school districts in the state provide voluntary, full-day, accountable Pre-K for children at risk is a wise investment in the future.
• Fund federal early education programs for low-income, at-risk children at a higher level so that all eligible children are served. Currently, funding for Head Start and the Child Care Development Block Grant are limited by the current funding mechanism (grant funding vs. funding based on eligibility). Grant amounts are set too low to cover all eligible children.
2012 COMMUNITY INDICATOR REPORT CENTER FOR HOUSTON’S FUTURE The Region’s Think Tank 2233BRAZORIA � CHAMBERS � FORT BEND � GALVESTON � HARRIS � LIBERTY � MONTGOMERY � WALLER2222
Bright Beginnings Public Policy Considerations
Communities need a way to gauge thequality and impactof early childhood
education programs.
Evalution Results for Bright Beginnings: Improved Learning Environment for ChildrenEvalution conducted by University of Houston, Department of Education
From “Day Care” to Child Development
EDUCATION Higher Education = Improved Child Outcomes
• 263 Directors/teachers completed Child Development Associates credentials• 28 Directors/teachers completed Associates Degree in Early Childhood Education•13 Directors/teachers completed Bachelors Degree in Early Childhood Education•10 Directors/teachers completed Masters Degree in Early Childhood Education
STAFF RETENTION Higher Retention = Continuity of Care
• Teacher retention rates increased by 33%•Director retention rates increased by 919%
NATIONAL ACCREDITATION Accreditation = Highest Standards of Performance
• 3 Centers accredited by NAEYC•4 Centers in the process of seeking accreditation by NAEYC
2012 COMMUNITY INDICATOR REPORT CENTER FOR HOUSTON’S FUTURE The Region’s Think Tank 2255BRAZORIA � CHAMBERS � FORT BEND � GALVESTON � HARRIS � LIBERTY � MONTGOMERY � WALLER2244
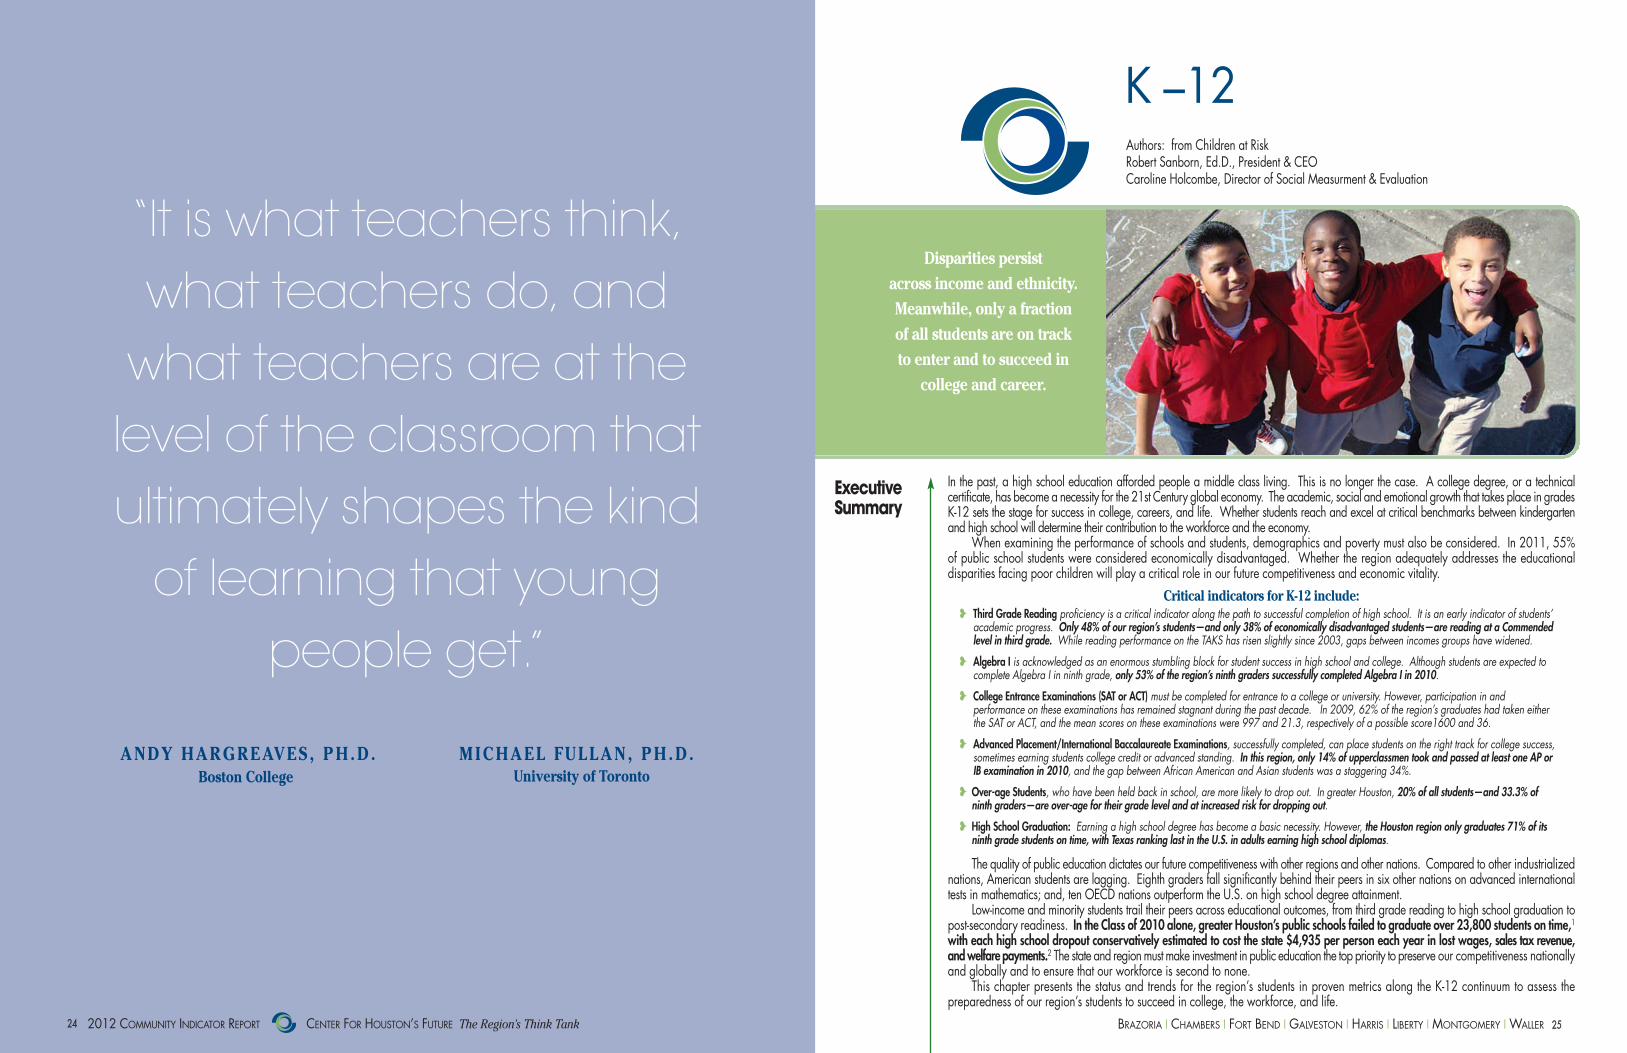
K –12Authors: from Children at Risk Robert Sanborn, Ed.D., President & CEOCaroline Holcombe, Director of Social Measurment & Evaluation
In the past, a high school education afforded people a middle class living. This is no longer the case. A college degree, or a technical certificate, has become a necessity for the 21st Century global economy. The academic, social and emotional growth that takes place in gradesK-12 sets the stage for success in college, careers, and life. Whether students reach and excel at critical benchmarks between kindergartenand high school will determine their contribution to the workforce and the economy.
When examining the performance of schools and students, demographics and poverty must also be considered. In 2011, 55%of public school students were considered economically disadvantaged. Whether the region adequately addresses the educational disparities facing poor children will play a critical role in our future competitiveness and economic vitality.
Critical indicators for K-12 include:� Third Grade Reading proficiency is a critical indicator along the path to successful completion of high school. It is an early indicator of students’ academic progress. Only 48% of our region’s students—and only 38% of economically disadvantaged students—are reading at a Commended level in third grade. While reading performance on the TAKS has risen slightly since 2003, gaps between incomes groups have widened.
� Algebra I is acknowledged as an enormous stumbling block for student success in high school and college. Although students are expected to complete Algebra I in ninth grade, only 53% of the region’s ninth graders successfully completed Algebra I in 2010.
� College Entrance Examinations (SAT or ACT) must be completed for entrance to a college or university. However, participation in and performance on these examinations has remained stagnant during the past decade. In 2009, 62% of the region’s graduates had taken either the SAT or ACT, and the mean scores on these examinations were 997 and 21.3, respectively of a possible score1600 and 36.
� Advanced Placement/International Baccalaureate Examinations, successfully completed, can place students on the right track for college success, sometimes earning students college credit or advanced standing. In this region, only 14% of upperclassmen took and passed at least one AP or IB examination in 2010, and the gap between African American and Asian students was a staggering 34%.
� Over-age Students, who have been held back in school, are more likely to drop out. In greater Houston, 20% of all students—and 33.3% of ninth graders—are over-age for their grade level and at increased risk for dropping out.
� High School Graduation: Earning a high school degree has become a basic necessity. However, the Houston region only graduates 71% of its ninth grade students on time, with Texas ranking last in the U.S. in adults earning high school diplomas.
The quality of public education dictates our future competitiveness with other regions and other nations. Compared to other industrializednations, American students are lagging. Eighth graders fall significantly behind their peers in six other nations on advanced internationaltests in mathematics; and, ten OECD nations outperform the U.S. on high school degree attainment.
Low-income and minority students trail their peers across educational outcomes, from third grade reading to high school graduation topost-secondary readiness. In the Class of 2010 alone, greater Houston’s public schools failed to graduate over 23,800 students on time,1with each high school dropout conservatively estimated to cost the state $4,935 per person each year in lost wages, sales tax revenue,and welfare payments.2 The state and region must make investment in public education the top priority to preserve our competitiveness nationallyand globally and to ensure that our workforce is second to none.
This chapter presents the status and trends for the region’s students in proven metrics along the K-12 continuum to assess the preparedness of our region’s students to succeed in college, the workforce, and life.
Disparities persist across income and ethnicity.Meanwhile, only a fraction of all students are on track to enter and to succeed in
college and career.
“It is what teachers think, what teachers do, and what teachers are at the level of the classroom that ultimately shapes the kind of learning that young
people get.”
ANDY HARGREAVES , PH .D . M ICHAEL FULLAN , PH .D .Boston College University of Toronto
Executive Summary

2012 COMMUNITY INDICATOR REPORT CENTER FOR HOUSTON’S FUTURE The Region’s Think Tank2266 2277BRAZORIA � CHAMBERS � FORT BEND � GALVESTON � HARRIS � LIBERTY � MONTGOMERY � WALLER
Figure 3: Percentage of 3rd graders reading at Commended Level on TAKS by Economic Disadvantage Status, 2003–2010
Figure 4: Percentage of 4th graders reaching national benchmark levels on NAEP Reading (2009)
There is a demographic revolution in thiscountry as the U.S. population becomes increasingly diverse. It is especially important to consider this trend and the impact it will have on educational and socialsystems in the fast-growing and highly diversestate of Texas. Demographers project thatLatino children will account for nearly two in threechildren by 2040.3 These demographicchanges are magnified in this region.
In 2011, nearly 1.2 million studentswere enrolled in greater Houston’s publicschools. They have predominately minoritybackgrounds: 46% Latino, 27% White, 19%
2003 2004 2005 2006 2007 2008 2009 2010
100%
90%
80%
70%
60%
50%
40%
30%
20%
10%
0%
All Students
EconomicallyDisadvantage
Not EconomicallyDisadvantage
120
100
80
60
40
20
0Nation Texas Houston ISD
Advanced
Proficient
Basic
Below Basic
2003 2004 2005 2006 2007 2008 2009 2010
100%
90%
80%
70%
60%
50%
40%
30%
20%
10%
0%
All Students
EconomicallyDisadvantage
Not EconomicallyDisadvantage
120
100
80
60
40
20
0Nation Texas Houston ISD
Advanced
Proficient
Basic
Below Basic
Figure 1: Percentage of economically disadvantaged Figure 2: Percentage of student population by race/ethnicity
The challenges and facts of demographics and poverty Early sign of educational success – third grade reading
African American, 6% Asian, and 2% Multiracial. The majority come from low-income families, with 55% of studentsqualifying for free or reduced-price meals or other public assistance. Further, one in five students has limited proficiency in theEnglish language, with native languagesranging from Spanish to Mandarin to Urdu.4Understanding the changing demographiccomposition of this region and its schools isessential to understanding the condition of education and to addressing current educational inequalities and their impact onthe future workforce.
Third Grade ReadingLearning to read is the most fundamental skillto master to be successful in college, work,and life. Whether students are proficient inthird grade reading is an early indicator oftheir being on the “path for success” throughhigh school completion.5 Third grade marksthe turning point from learning how to read –a skill that is the basis for all other learning –to reading to learn.
Children make the greatest gains inreading in early years; consequently, studentswho fall behind in early grades can have amuch harder time catching up.6 Students who
are not reading proficiently in third grade areon a path to struggle throughout their schooling,adversely impacting their ability to learn othersubjects including literature, history, science,and mathematics. Researchers have foundthat students reading on grade level in thirdgrade are more likely to graduate high schooland enroll in college.7 A recent longitudinalstudy found that students who were not readingproficiently in third grade were four timesmore likely to exit school before earning adiploma than proficient readers.8
In this region, 92% of third graders arereading at the most basic level which is
*Note to graphs: Other economically disadvantagedincludes students from a family with an annual income at or below the official poverty line, students eligible for Temporary Assistance toNeedy Families (TANF) or other public assistance,students that received a Pell Grant or comparablestate program of need-based financial assistance,students eligible for programs assisted under Title II of the Job Training Partnership Act (JTPA),and students eligible for benefits under the Food Stamp Act of 1977.
Source: Texas Education Agency, PEIMS Standard Reports (2011) Source: Texas Education Agency, PEIMS Standard Reports (2011)
determined by achieving a passing score on the TAKS examination. Only 48% areachieving at the Commended level that is more closely aligned to college-ready standards up from 25% in 2003.Statewide, the passing rate is 91% and theCommended rate is 45%. Statistics from theEnglish and Spanish language test are combined.
Third grade reading ability, as measured on the TAKS test, varies greatlyby race and by economic disadvantage,with a Commended gap of 24% between economically disadvantaged and not economically disadvantaged students.
1862 Land Grant Act gave states land fromthe federal government for colleges
1867 The Office of Education, a small unit in the Federal Government, was created on March 2, 1867. Henry Barnard of Connecticut was appointed as the first Commissioner.
� Texas A&M when it was made a land grant institution.
Source: Texas Education Agency, CHILDREN AT RISK Analysis
Source: National Center for Education Statistics, Institute of Education Sciences. The Nation's Report Card: Reading 2009.
Childrenin Care of
Others(WorkingParents)
57%44.8% 43.4%
5.4% 6.4%
Economic Disadvantage of Greater HoustonStudents, 2010-11
Race/Ethnicity of Greater HoustonStudents, 2010-11
5.7%1.5% 0.6%
Eligible For Free Meals
Eligible For Reduced-Price Meals
Other EconomicallyDisadvantaged
Not EconomicallyDisadvantage
Hispanic
White
Black or AfricanAmerican
Asian
Two or More Races
Other
18.7%
27.4%
46.1%
2012 COMMUNITY INDICATOR REPORT CENTER FOR HOUSTON’S FUTURE The Region’s Think Tank2288 2299BRAZORIA � CHAMBERS � FORT BEND � GALVESTON � HARRIS � LIBERTY � MONTGOMERY � WALLER
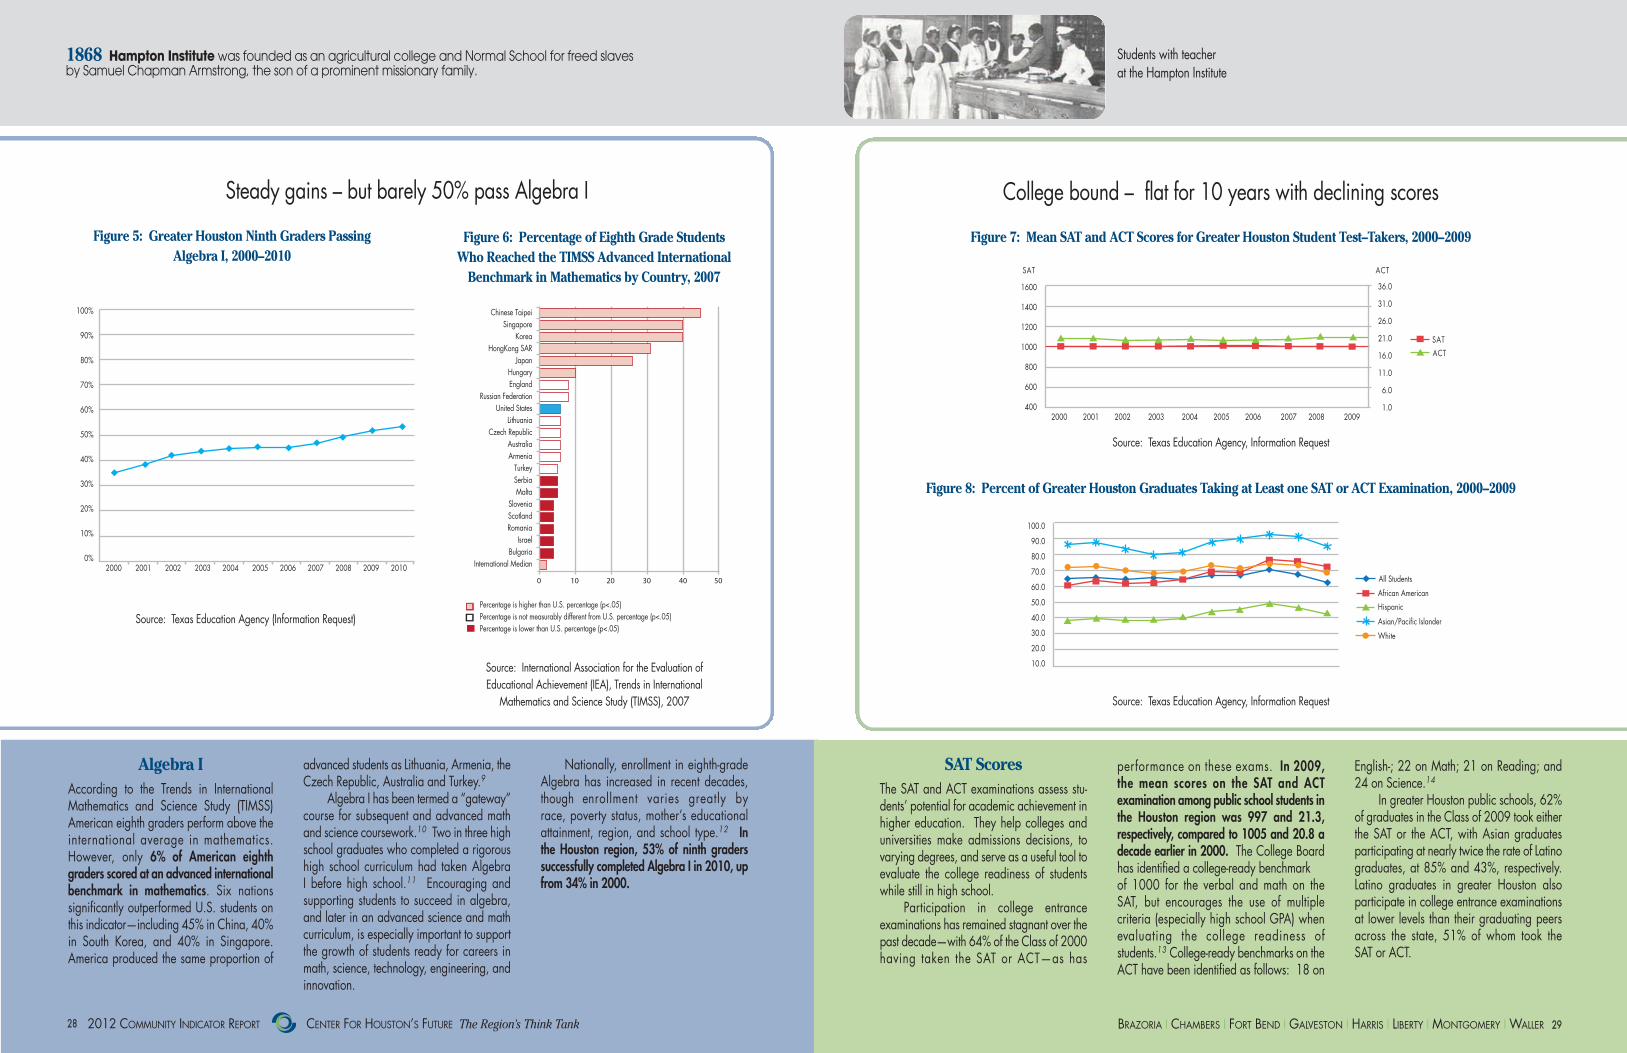
Steady gains – but barely 50% pass Algebra I College bound – flat for 10 years with declining scores
Algebra IAccording to the Trends in InternationalMathematics and Science Study (TIMSS)American eighth graders perform above theinternational average in mathematics. However, only 6% of American eighthgraders scored at an advanced internationalbenchmark in mathematics. Six nationssignificantly outperformed U.S. students onthis indicator—including 45% in China, 40%in South Korea, and 40% in Singapore.America produced the same proportion of
SAT ScoresThe SAT and ACT examinations assess stu-dents’ potential for academic achievement inhigher education. They help colleges anduniversities make admissions decisions, tovarying degrees, and serve as a useful tool toevaluate the college readiness of studentswhile still in high school.
Participation in college entrance examinations has remained stagnant over thepast decade—with 64% of the Class of 2000having taken the SAT or ACT—as has
performance on these exams. In 2009, the mean scores on the SAT and ACT examination among public school students inthe Houston region was 997 and 21.3, respectively, compared to 1005 and 20.8 adecade earlier in 2000. The College Boardhas identified a college-ready benchmark of 1000 for the verbal and math on the SAT, but encourages the use of multiple criteria (especially high school GPA) whenevaluating the college readiness of students.13 College-ready benchmarks on theACT have been identified as follows: 18 on
English-; 22 on Math; 21 on Reading; and24 on Science.14
In greater Houston public schools, 62%of graduates in the Class of 2009 took eitherthe SAT or the ACT, with Asian graduates participating at nearly twice the rate of Latinograduates, at 85% and 43%, respectively.Latino graduates in greater Houston also participate in college entrance examinationsat lower levels than their graduating peersacross the state, 51% of whom took the SAT or ACT.
Figure 5: Greater Houston Ninth Graders PassingAlgebra I, 2000–2010
Figure 6: Percentage of Eighth Grade Students Who Reached the TIMSS Advanced International
Benchmark in Mathematics by Country, 2007
Figure 7: Mean SAT and ACT Scores for Greater Houston Student Test–Takers, 2000–2009
Figure 8: Percent of Greater Houston Graduates Taking at Least one SAT or ACT Examination, 2000–2009
1600
1400
1200
1000
800
600
400
100.0
90.0
80.0
70.0
60.0
50.0
40.0
30.0
20.0
10.0
36.0
31.0
26.0
21.0
16.0
11.0
6.0
1.0
SAT ACT
ACTSAT
2000 2001 2002 2003 2004 2005 2006 2007 2008 2009
All Students
African AmericanHispanic
Asian/Pacific Islander
White
1600
1400
1200
1000
800
600
400
100.0
90.0
80.0
70.0
60.0
50.0
40.0
30.0
20.0
10.0
36.0
31.0
26.0
21.0
16.0
11.0
6.0
1.0
SAT ACT
ACTSAT
2000 2001 2002 2003 2004 2005 2006 2007 2008 2009
All Students
African AmericanHispanic
Asian/Pacific Islander
White
Source: Texas Education Agency, Information Request
Source: Texas Education Agency, Information Request
advanced students as Lithuania, Armenia, theCzech Republic, Australia and Turkey.9
Algebra I has been termed a “gateway”course for subsequent and advanced mathand science coursework.10 Two in three highschool graduates who completed a rigoroushigh school curriculum had taken Algebra I before high school.11 Encouraging and supporting students to succeed in algebra,and later in an advanced science and mathcurriculum, is especially important to supportthe growth of students ready for careers inmath, science, technology, engineering, andinnovation.
Nationally, enrollment in eighth-gradeAlgebra has increased in recent decades,though enrollment varies greatly byrace, poverty status, mother’s educational attainment, region, and school type.12 In the Houston region, 53% of ninth graders successfully completed Algebra I in 2010, upfrom 34% in 2000.
1868 Hampton Institutewas founded as an agricultural college and Normal School for freed slavesby Samuel Chapman Armstrong, the son of a prominent missionary family.
100%
90%
80%
70%
60%
50%
40%
30%
20%
10%
0%2000 2001 2002 2003 2004 2005 2006 2007 2008 2009 2010
0 10 20 30 5040
Chinese TaipeiSingapore
KoreaHongKong SAR
JapanHungaryEngland
Russian FederationUnited States
LithuaniaCzech Republic
AustraliaArmenia
TurkeySerbiaMalta
SloveniaScotlandRomania
IsraelBulgaria
International Median
Percentage is higher than U.S. percentage (p<.05)Percentage is not measurably different from U.S. percentage (p<.05)Percentage is lower than U.S. percentage (p<.05)
Source: Texas Education Agency (Information Request)
Source: International Association for the Evaluation of Educational Achievement (IEA), Trends in International Mathematics and Science Study (TIMSS), 2007
Students with teacherat the Hampton Institute

2012 COMMUNITY INDICATOR REPORT CENTER FOR HOUSTON’S FUTURE The Region’s Think Tank3300 3311BRAZORIA � CHAMBERS � FORT BEND � GALVESTON � HARRIS � LIBERTY � MONTGOMERY � WALLER
AP/IB: Few score high enough to qualify and succeed – disparities persist Students in danger of dropping out
AP/IB ExamsEarning a three or higher on an AdvancedPlacement (AP) exam or a four or higher onan International Baccalaureate (IB) examhelps place students on the right track uponentering college, and can earn students advanced standing or college credit.
Completing a challenging and rigoroushigh school curriculum and earning advanced standing or college credit while still
Drop OutsIdentifying students who are over-age fortheir grade level is important because theseare the students likely to drop out of school.Students are identified as “over-age” whenthey are a year older than the standard agefor their grade during the 2010-11 schoolyear, as captured on September 1, 2010.Standard ages are six for first grade, sevenfor second grade, and so on.
35%
30%
25%
20%
15%
10%
5%
0%
Percent 1+ Yr Over -age
Percent 2+ Yr Over -age
First
Second Third
Fourth
Fiveth Sixth
Sevent
h
Eight
Nineth
Tenth
Eleven
thTw
elveth
School districts might flag over-age students as part of an early warning systemfor dropping out, or examine trends in over-age students to monitor successful transitions, such as from middle to highschool.16 Students who have been held backin school are substantially more likely thantheir peers to drop out, and students who areover-age for their grade have been found tobecome disengaged in school as a precursor
Figure 9: Percent of 11th and 12 Grade Students Meeting the Criterion Scoreon One or More AP or IB Exams, Greater Houston, 2000–2010
Figure 10: Greater Houston Students Over–age for their Grade, as an Indicator of Dropout Risk, by Grade and Years, 2009–2010
40%
35%
30%
25%
20%
15%
10%
5%
0%2000 2001 2002 2003 2004 2005 2006 2007 2008 2009 2010
All Students
African AmericanHispanic
Asian/Pacific Islander
White
in high school can help place students ontrack for postsecondary success. In 2010,nearly one in four eleventh and twelfthgraders in the region took at least one AP or IB exam, with 14% of examinees earninga score that could qualify them for advancedstanding or course credit in college. (Figure 9)
The largest achievement gap on this in-dicator exists between African American and
Asian students: only 4% of African Americanstudents took and passed at least one AP orIB exam, compared to 38% of Asian students.In a study of Texas high school graduates produced for the College Board, researchersfound that students who had taken AP coursework and exams in high school outperformed their peers while in college interms of GPA, accrual of course hours, andfour-year graduation rates.15
to dropping out.17 In greater Houston, onein five students is over-age for their gradelevel. Figure 10 points out that thepercentage of students who are over-agepeeks at the transitional freshman year, andthen declines as these at-risk students drop outof high school.
1877 Houston's first free public schools established. 1895 Plessy v. Ferguson, Supreme Court ruling establishing the ‘separate but equal’ principleThe state of Louisiana enacted a law that required separate railway cars for blacks and whites. In 1892, Homer Adolph Plessy--who was seven-eighths Caucasian--took a seat in a "whites only" car of a Louisiana train. He refused to move to the car reserved for blacks and was arrested.
Source: Texas Education Agency, Information Request Source: Texas Education Agency, Information Request, Information Request (CHILDREN AT RISK Analysis}

2012 COMMUNITY INDICATOR REPORT CENTER FOR HOUSTON’S FUTURE The Region’s Think Tank3322 3333BRAZORIA � CHAMBERS � FORT BEND � GALVESTON � HARRIS � LIBERTY � MONTGOMERY � WALLER
High school graduation rates improving at a crawl Texas’ drop outs = $9.6 billion loss/year
Graduation RatesEighty-eight percent of American youngadults, ages 25-34, have earned at least ahigh school diploma or equivalent. TenOECD nations outperform the United Stateson this measure. At the upper end, 98% ofSouth Korea’s young adults are attaining atleast an upper secondary education. Ingreater Houston, only 71% of new ninthgraders entering high school in 2006-07completed high school within four years. Thisgraduation rate does not account for thosestudents who may have left public schools to
Figure 11: High school graduation rates Figure: 12: Percentage of US adults aged 25-24 with high school degrees
go out of the state, to be home schooled or toattend private school.
Failure to finish high school is related toa number of negative outcomes for students,the workforce, and economy. Dropouts areless likely to be employed and generally earnlower wages when they are employed. Only39% of high school dropouts were employedin 2010, compared to 55% of high schoolgraduates and 73% of college graduates.18
The median income for Harris County’shigh school dropouts aged 25 and older was$19,99319 compared to $27,318 amonghigh school graduates and GED recipients in
2008.20 Further, close to half of Texas’ prisoninmates are high school dropouts.21
*Methodology: Children at Risk graduation rateutilizes the first-time freshmen cohorts used by the TEA Division of Accountability Research. Graduation rates are calculated by: 1) subtractingstudents who passed away before graduating fromhigh school from their first-time freshmen cohort to create an adjusted first-time freshmen cohort;and 2) dividing the number of graduates from aschool’s adjusted first-time freshmen cohort(whether they graduated from the same school orany other public school in the state) by that school’stotal adjusted first-time freshmen cohort
Expenditures and Economic Impact
Texas ranks 43rd in the nation in per pupilexpenditure on public education, with onlyArizona, Idaho, Mississippi, Nevada, NorthCarolina, Oklahoma, Tennessee, and Utahspending less per pupil than Texas.2 2According to the US Census Bureau and the TEA, in 2009 Texas spent $8,540 perpupil compared to the national average of $10,499. The state of New York spent$18,126 per pupil in the same year.
At the same time, a drop out is estimatedto cost Texas $4,935 per student each year interms of lost wages, sales tax revenue, andwelfare payments. High school dropouts costthe state in numerous ways–through higherrates of crime and incarceration, increaseduse of welfare and social services, greater dependence on public health care systems,and the loss of earnings and economic activity. In total, this amounts to a single classof dropouts costing Texas up to $9.6 billion.23
Figure 13: What if …half of Texas’s 135,100 dropouts from the Class of 2010 had stayed in school and earned a high school diploma?
The results would be . . .
Source: 2011 Alliance for Excellence in Education
1897 Chicago Teachers Federation, the first of many teacher organizations,formed for women elementary school teachers to improve their salaries and pensions.
1906 Carnegie Foundation for the Advancement of Teaching was chartered by an Act of Congress as an independent policy and research center.
Source: Information Request, Texas Education Agency, 2011.CHILDREN AT RISK Analysis Source: OECD. Education at a Glance 2010
100%
90%
80%
70%
60%
50%
40%
30%
20%
10%
0%2000 2001 2002 2003 2004 2005 2006 2007 2008 2009 2010
All Students
Not EconomicallyDisadvantaged
EconomicallyDisadvantaged
Korea
Denmark
Czech Republic
Slovak Republic
Poland
CanadaSweden
Finland
Switzerland
Austria
United States
Germany
Hungary
Chile
Ireland
75 80 85 90 95 100
Percent of Greater Houston First-Time Freshman Graduating from any Texas Public HighSchool within Four Years, Class of 2000-2010
Percent of Adults Aged 25-34 with at Least Upper Secondary Education, by County (2008)
ANDREW CARNEGIE
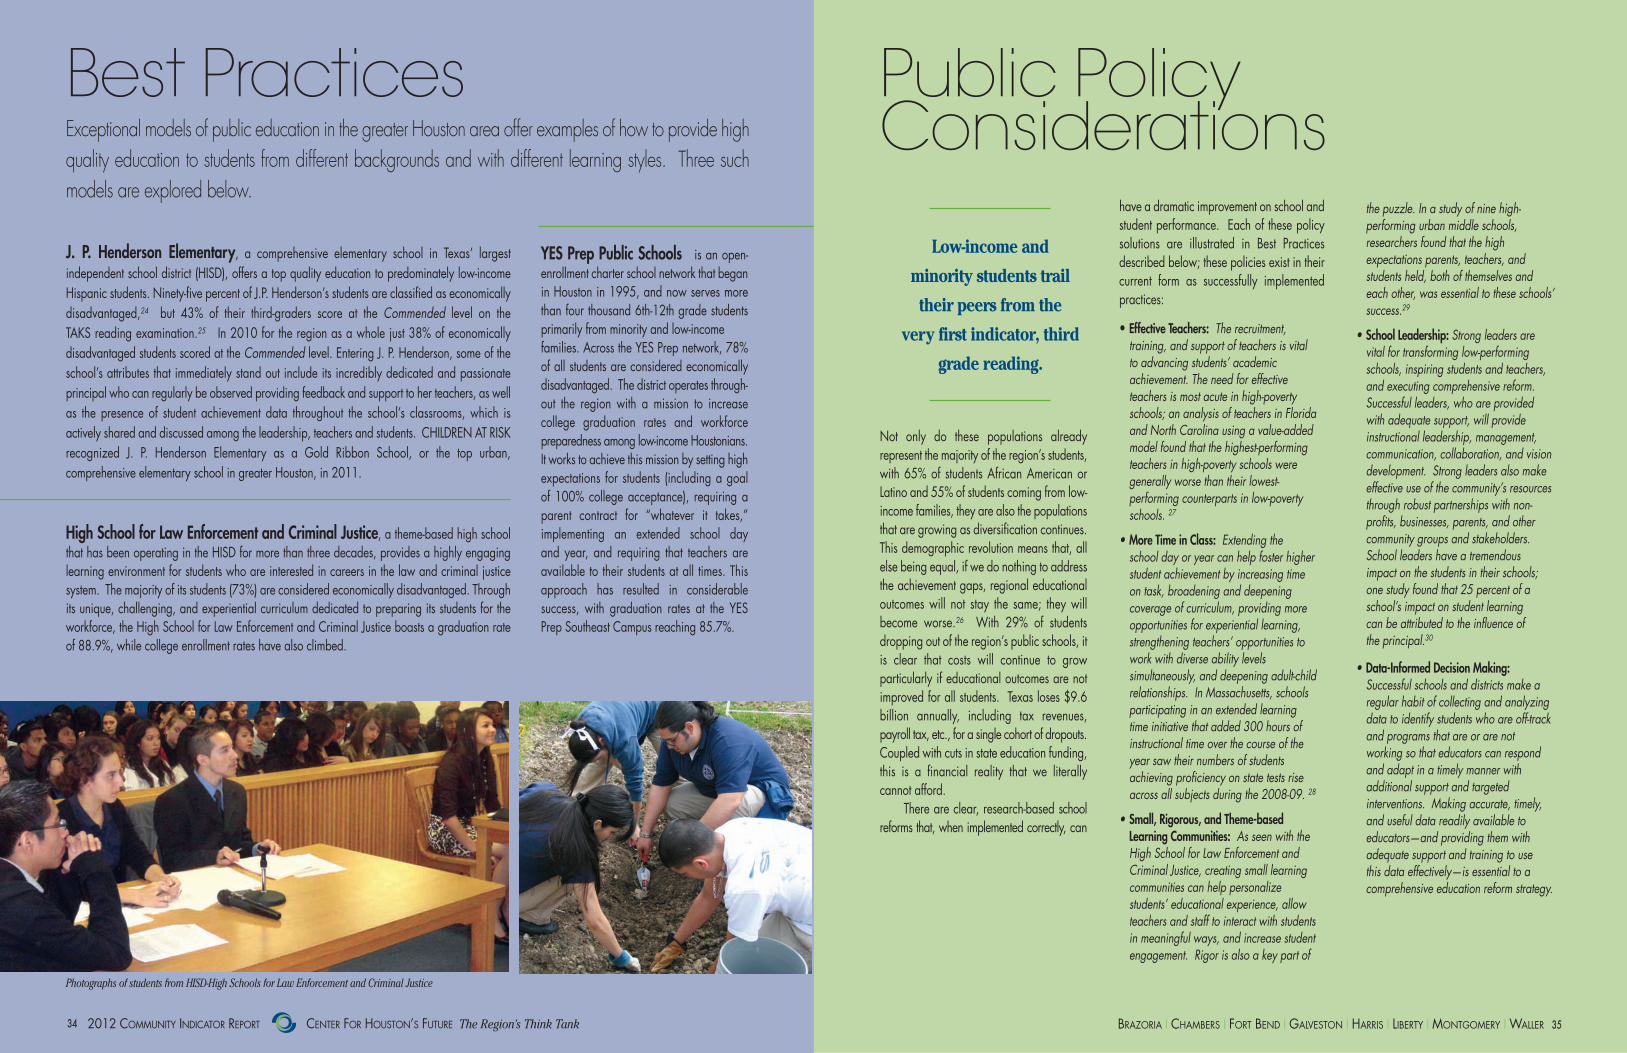
Not only do these populations already represent the majority of the region’s students,with 65% of students African American orLatino and 55% of students coming from low-income families, they are also the populationsthat are growing as diversification continues.This demographic revolution means that, allelse being equal, if we do nothing to addressthe achievement gaps, regional educationaloutcomes will not stay the same; they will become worse.26 With 29% of students dropping out of the region’s public schools, itis clear that costs will continue to grow particularly if educational outcomes are notimproved for all students. Texas loses $9.6billion annually, including tax revenues, payroll tax, etc., for a single cohort of dropouts.Coupled with cuts in state education funding,this is a financial reality that we literally cannot afford.
There are clear, research-based schoolreforms that, when implemented correctly, can
have a dramatic improvement on school andstudent performance. Each of these policysolutions are illustrated in Best Practices described below; these policies exist in theircurrent form as successfully implementedpractices:
• Effective Teachers: The recruitment, training, and support of teachers is vital to advancing students’ academic achievement. The need for effective teachers is most acute in high-poverty schools; an analysis of teachers in Florida and North Carolina using a value-added model found that the highest-performing teachers in high-poverty schools were generally worse than their lowest-performing counterparts in low-poverty schools. 27
• More Time in Class: Extending the school day or year can help foster higher student achievement by increasing time on task, broadening and deepening coverage of curriculum, providing more opportunities for experiential learning, strengthening teachers’ opportunities to work with diverse ability levels simultaneously, and deepening adult-child relationships. In Massachusetts, schools participating in an extended learning time initiative that added 300 hours of instructional time over the course of the year saw their numbers of students achieving proficiency on state tests rise across all subjects during the 2008-09. 28
• Small, Rigorous, and Theme-based Learning Communities: As seen with the High School for Law Enforcement and Criminal Justice, creating small learning communities can help personalize students’ educational experience, allow teachers and staff to interact with students in meaningful ways, and increase student engagement. Rigor is also a key part of
the puzzle. In a study of nine high-performing urban middle schools, researchers found that the high expectations parents, teachers, and students held, both of themselves and each other, was essential to these schools’ success.29
• School Leadership: Strong leaders are vital for transforming low-performing schools, inspiring students and teachers, and executing comprehensive reform. Successful leaders, who are provided with adequate support, will provide instructional leadership, management, communication, collaboration, and vision development. Strong leaders also make effective use of the community’s resources through robust partnerships with non-profits, businesses, parents, and other community groups and stakeholders. School leaders have a tremendous impact on the students in their schools; one study found that 25 percent of a school’s impact on student learning can be attributed to the influence of the principal.30
• Data-Informed Decision Making: Successful schools and districts make a regular habit of collecting and analyzing data to identify students who are off-track and programs that are or are not working so that educators can respond and adapt in a timely manner with additional support and targeted interventions. Making accurate, timely, and useful data readily available to educators—and providing them with adequate support and training to usethis data effectively—is essential to a comprehensive education reform strategy.
Low-income and
minority students trail
their peers from the
very first indicator, third
grade reading.
Public Policy Considerations
Best Practices Exceptional models of public education in the greater Houston area offer examples of how to provide highquality education to students from different backgrounds and with different learning styles. Three such models are explored below.
J. P. Henderson Elementary, a comprehensive elementary school in Texas’ largest independent school district (HISD), offers a top quality education to predominately low-income Hispanic students. Ninety-five percent of J.P. Henderson’s students are classified as economicallydisadvantaged,24 but 43% of their third-graders score at the Commended level on the TAKS reading examination.25 In 2010 for the region as a whole just 38% of economically disadvantaged students scored at the Commended level. Entering J. P. Henderson, some of theschool’s attributes that immediately stand out include its incredibly dedicated and passionate principal who can regularly be observed providing feedback and support to her teachers, as wellas the presence of student achievement data throughout the school’s classrooms, which is actively shared and discussed among the leadership, teachers and students. CHILDREN AT RISKrecognized J. P. Henderson Elementary as a Gold Ribbon School, or the top urban, comprehensive elementary school in greater Houston, in 2011.
High School for Law Enforcement and Criminal Justice, a theme-based high schoolthat has been operating in the HISD for more than three decades, provides a highly engaginglearning environment for students who are interested in careers in the law and criminal justice system. The majority of its students (73%) are considered economically disadvantaged. Throughits unique, challenging, and experiential curriculum dedicated to preparing its students for theworkforce, the High School for Law Enforcement and Criminal Justice boasts a graduation rateof 88.9%, while college enrollment rates have also climbed.
YES Prep Public Schools is an open-enrollment charter school network that beganin Houston in 1995, and now serves morethan four thousand 6th-12th grade studentsprimarily from minority and low-income families. Across the YES Prep network, 78%of all students are considered economicallydisadvantaged. The district operates through-out the region with a mission to increase college graduation rates and workforce preparedness among low-income Houstonians.It works to achieve this mission by setting highexpectations for students (including a goal of 100% college acceptance), requiring aparent contract for “whatever it takes,” implementing an extended school day and year, and requiring that teachers areavailable to their students at all times. This approach has resulted in considerable success, with graduation rates at the YESPrep Southeast Campus reaching 85.7%.
3355BRAZORIA � CHAMBERS � FORT BEND � GALVESTON � HARRIS � LIBERTY � MONTGOMERY � WALLER2012 COMMUNITY INDICATOR REPORT CENTER FOR HOUSTON’S FUTURE The Region’s Think Tank3344
Photographs of students from HISD-High Schools for Law Enforcement and Criminal Justice
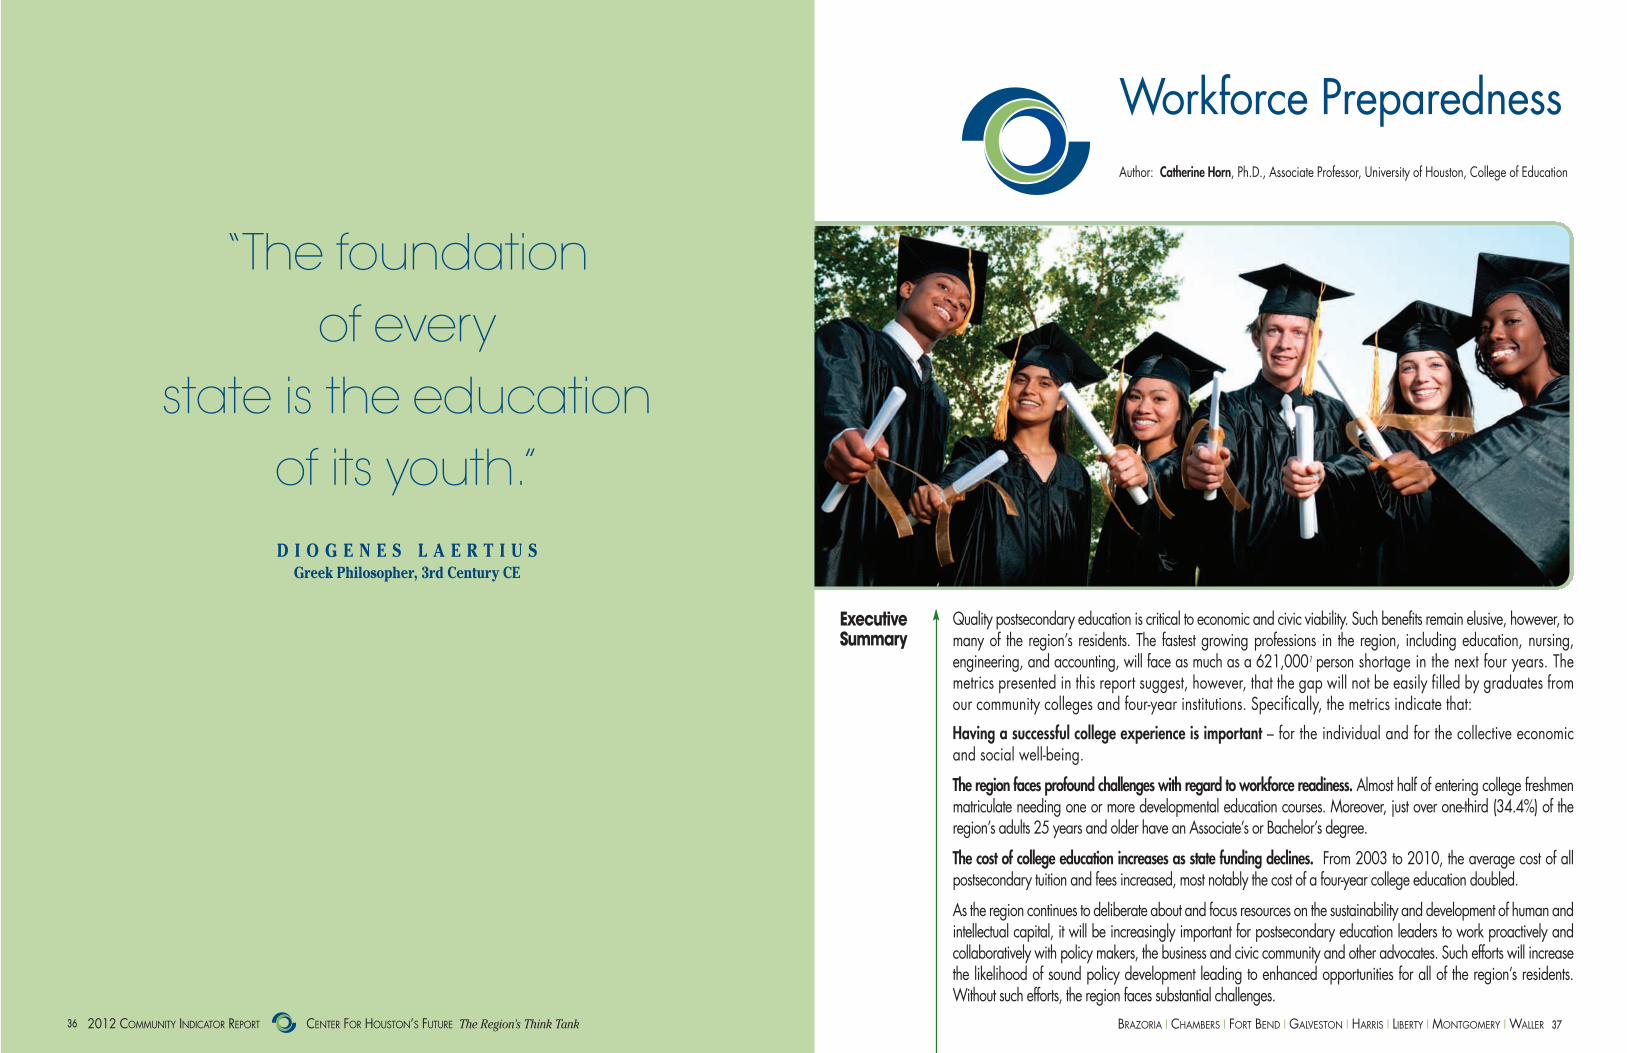
3377BRAZORIA � CHAMBERS � FORT BEND � GALVESTON � HARRIS � LIBERTY � MONTGOMERY � WALLER2012 COMMUNITY INDICATOR REPORT CENTER FOR HOUSTON’S FUTURE The Region’s Think Tank3366
Workforce Preparedness
Quality postsecondary education is critical to economic and civic viability. Such benefits remain elusive, however, tomany of the region’s residents. The fastest growing professions in the region, including education, nursing, engineering, and accounting, will face as much as a 621,0001 person shortage in the next four years. The metrics presented in this report suggest, however, that the gap will not be easily filled by graduates fromour community colleges and four-year institutions. Specifically, the metrics indicate that:
Having a successful college experience is important – for the individual and for the collective economicand social well-being.
The region faces profound challenges with regard to workforce readiness. Almost half of entering college freshmenmatriculate needing one or more developmental education courses. Moreover, just over one-third (34.4%) of the region’s adults 25 years and older have an Associate’s or Bachelor’s degree.
The cost of college education increases as state funding declines. From 2003 to 2010, the average cost of all postsecondary tuition and fees increased, most notably the cost of a four-year college education doubled.
As the region continues to deliberate about and focus resources on the sustainability and development of human andintellectual capital, it will be increasingly important for postsecondary education leaders to work proactively and collaboratively with policy makers, the business and civic community and other advocates. Such efforts will increasethe likelihood of sound policy development leading to enhanced opportunities for all of the region’s residents. Without such efforts, the region faces substantial challenges.
Author: Catherine Horn, Ph.D., Associate Professor, University of Houston, College of Education
“The foundation of every
state is the education of its youth.”D I O G E N E S L A E R T I U S
Greek Philosopher, 3rd Century CE
Executive Summary
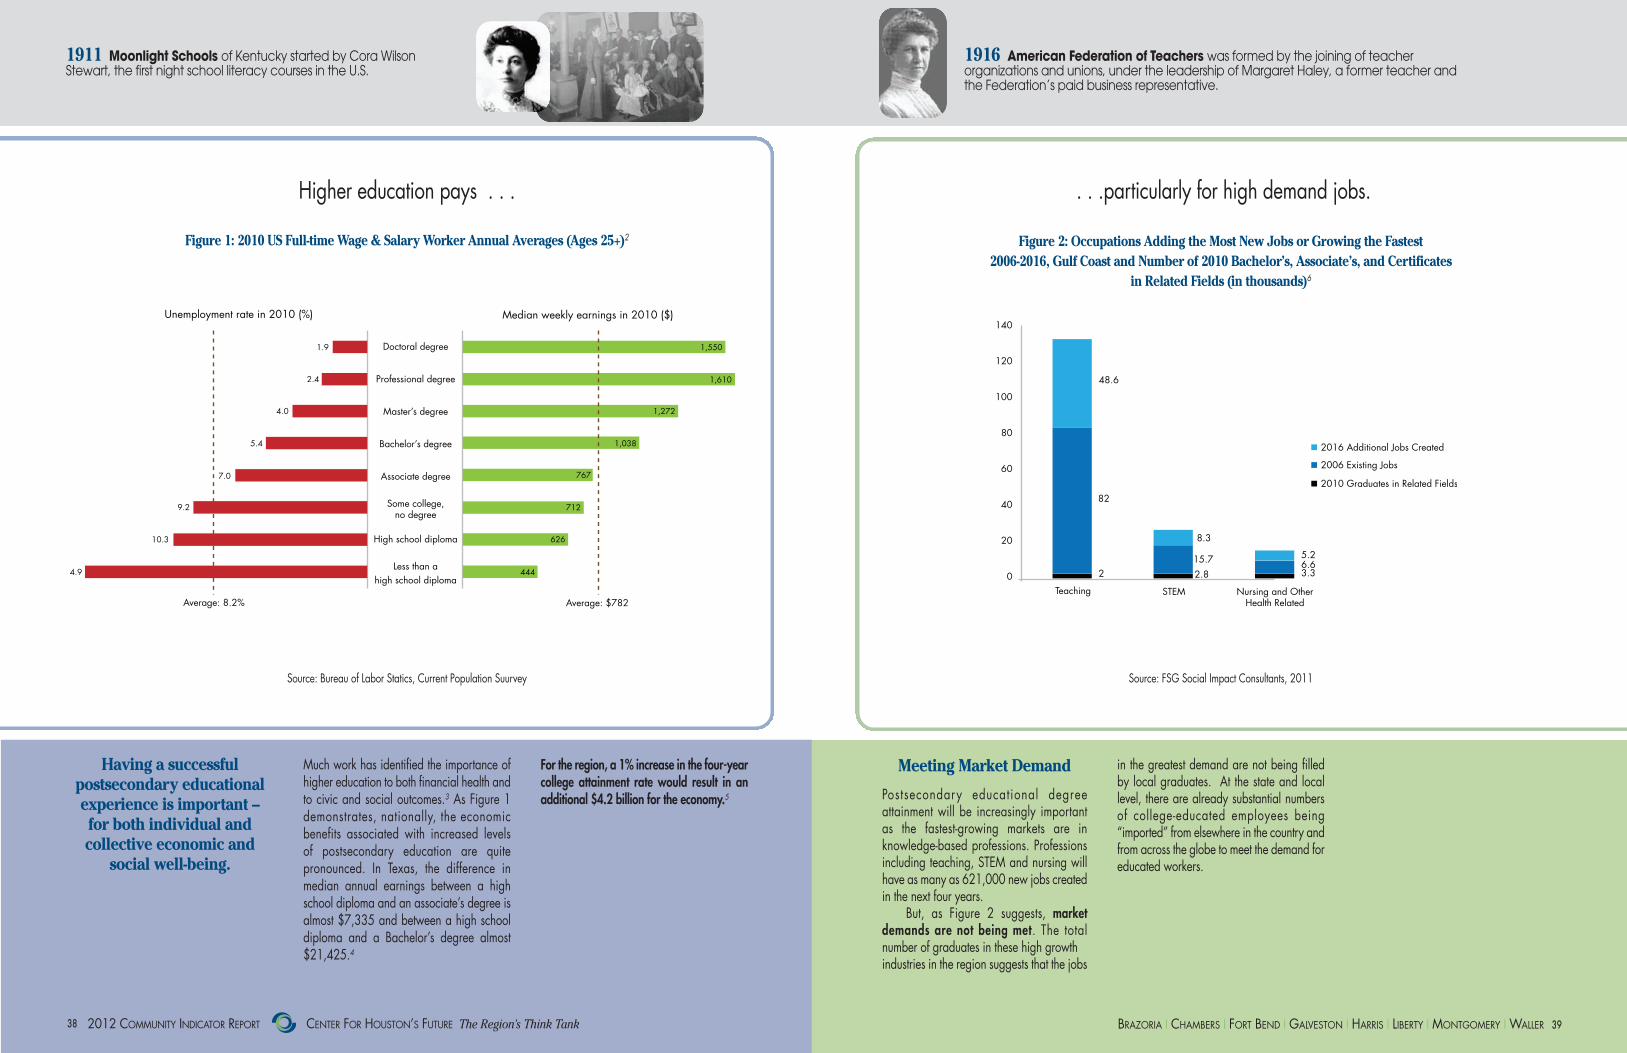
2012 COMMUNITY INDICATOR REPORT CENTER FOR HOUSTON’S FUTURE The Region’s Think Tank3388 3399BRAZORIA � CHAMBERS � FORT BEND � GALVESTON � HARRIS � LIBERTY � MONTGOMERY � WALLER
Figure 2: Occupations Adding the Most New Jobs or Growing the Fastest2006-2016, Gulf Coast and Number of 2010 Bachelor’s, Associate’s, and Certificates
in Related Fields (in thousands)6
Having a successful postsecondary educationalexperience is important – for both individual and collective economic and
social well-being.
1.9 1,550
1,6102.4
4.0 1,272
5.4 1,038
7.0 767
712
626
444
9.2
10.3
4.9
Average: 8.2% Average: $782
Doctoral degree
Professional degree
Master’s degree
Bachelor’s degree
Associate degree
Some college,no degree
High school diploma
Less than ahigh school diploma
Unemployment rate in 2010 (%) Median weekly earnings in 2010 ($)
Figure 1: 2010 US Full-time Wage & Salary Worker Annual Averages (Ages 25+)2
Higher education pays . . . . . .particularly for high demand jobs.
Much work has identified the importance ofhigher education to both financial health andto civic and social outcomes.3 As Figure 1demonstrates, nationally, the economic benefits associated with increased levels of postsecondary education are quite pronounced. In Texas, the difference in median annual earnings between a highschool diploma and an associate’s degree isalmost $7,335 and between a high schooldiploma and a Bachelor’s degree almost$21,425.4
Meeting Market Demand
Postsecondary educational degreeattainment will be increasingly important as the fastest-growing markets are in knowledge-based professions. Professionsincluding teaching, STEM and nursing willhave as many as 621,000 new jobs createdin the next four years.
But, as Figure 2 suggests, market demands are not being met. The total number of graduates in these high growth industries in the region suggests that the jobs
in the greatest demand are not being filledby local graduates. At the state and locallevel, there are already substantial numbersof college-educated employees being “imported” from elsewhere in the country andfrom across the globe to meet the demand foreducated workers.
For the region, a 1% increase in the four-yearcollege attainment rate would result in an additional $4.2 billion for the economy.5
2016 Additional Jobs Created
2010 Graduates in Related Fields
2006 Existing Jobs
140
120
100
80
60
40
20
0
82
2
8.3
15.72.8
5.26.63.3
Teaching STEM Nursing and OtherHealth Related
48.6
1911 Moonlight Schools of Kentucky started by Cora Wilson Stewart, the first night school literacy courses in the U.S.
1916 American Federation of Teachers was formed by the joining of teacherorganizations and unions, under the leadership of Margaret Haley, a former teacher andthe Federation’s paid business representative.
Source: Bureau of Labor Statics, Current Population Suurvey Source: FSG Social Impact Consultants, 2011

2012 COMMUNITY INDICATOR REPORT CENTER FOR HOUSTON’S FUTURE The Region’s Think Tank4400 4411BRAZORIA � CHAMBERS � FORT BEND � GALVESTON � HARRIS � LIBERTY � MONTGOMERY � WALLER
Higher education . . . a benefit to the the entire community Profound challenges with regard to workforce readiness
Benefits of HigherEducation
Beyond the financial impact, an Associate’sor a Bachelor’s degree is also related to increased social well being. Increased education attainment is also associated withincreased volunteerism (Figure 3) and voterparticipation (Figure 4).
Another area where education benefits
Only 28.4% of the region’sresidents have a four yearcollege degree. Source: 2010 American Community Survey
Workforce Readiness
According to the 2010 American CommunitySurvey, 28.4% of the region has a four-yearcollege degree, slightly above the nationalpercentage of 28.1%. However, many competitor regions are faring much better.Only 6% of the population holds an Associate’sDegree. At 34rd among the 50 largest Metropolitan Statistical Areas, our regionranks far behind the top five metropolitan regions in terms of percentage of college degree earners, including Washington D.C.,San Jose, San Francisco, Boston and Raleigh
in descending order. For these cities, college attainment ranges from 46.8% to41%. Chicago, an area of comparablesize to Houston ranks14th, Dallas ranks 23rdand Philadelphia ranks 16th.
Moreover, Houston ranks 60th out of the75 least literate cities in the United States (75being the least literate).10
As the region moves solidly into the 21stCentury knowledge-based economy, moreand more employers will require highly skilledand educated workers. Thus, it is incumbentthat a much higher percentage of the popu-lation has a two- or four-year college degree.
According to a 2011 report from TheBrookings Institute, what employers wanttoday and what local students are trained todo today simply do not match. The Baytown-Houston-Sugarland MSA ranks 94th amongthe largest 100 MSAs in matching jobsneeded to degrees granted.
Civic, education, community, and business leaders recognize the critical needto close the gaps between the economic demands and a labor force ready tomeet them.11
Figure 3: National Volunteering Rates among Individuals Ages 25+, by Education Level, 20097
Figure 4: National Voting Rate among US Citizens, by Age & Education Level, 20088
Figure 5: Percent of People Age 25+ With College Degree9
9%19%
30%
Not a HSGraduate
HSGraduate
SomeCollege orAssociates
Degree
Bachelor’sDegree or
Higher
100
90
80
70
60
50
40
30
20
10
0
43%
100
90
80
70
60
50
40
30
20
10
0
18 to 24 25 to 44 45 to 64 65 to 74 75 andover
■ Not a HS Graduate ■ Some College or Associate Degree■ HS Graduate ■ Bachelor’s Degree or Higher
■ Volunteering Rates
1926 Standard Achievement Test 1944 G.I. Bill of Rights , officially the Servicemen’s Readjustment Act, signed into law college tuition, living expenses, books, supplies and equipment to all who served, transforming higher education in America.
Carl Brigham, the Princeton academic who invented the SAT.
the individual and society is the cost of incarceration. Lower education attainment increases the likelihood that individuals, particularly males, will be arrested and incarcerated. In a 2004 report by the Alliance of Excellent Education, economistsLance Lochner of the University of WesternOntario and Enrico Moretti of the Universityof California, Berkeley, conservatively estimated that if the male graduation rate
were increased by just 5%, annual crime related savings to the nation would be approximately $5 billion. Beyond this savings, almost $2.8 billion would be generated in additional annual earnings tothe economy.
Source: Houston–Galveston Area CounselSource: The College Board, 2010 Source: The College Board, 2010

2012 COMMUNITY INDICATOR REPORT CENTER FOR HOUSTON’S FUTURE The Region’s Think Tank4422 4433BRAZORIA � CHAMBERS � FORT BEND � GALVESTON � HARRIS � LIBERTY � MONTGOMERY � WALLER
Regional standing and capacity VS. growing demand Community College enrollment skyrockets; 4-year colleges relatively stagnant
Population Growth vs. Capacity
While the region has one of the youngest,fastest growing and most diverse populationsin the country13, it also faces profound challenges. To meet its education and workforce needs, the region is supported bya number of public and private universities as well as two of the country’s 10 largestcommunity college systems14 (Figure 6).
MSA Population Colleges, Universities (MM) Professional Schools
New York City 18.9 273Los Angeles 12.8 224Chicago 9.5 160Houston 5.9 38Philadelphia 5.9 93
Source: US Census Bureau 2009
How does the greater Houston region compare?
Table 2: Regional Community College Enrollment, 2005-201016
YEAR ENROLLMENT2005 129,6132006 132,6992007 134,9152008 140,6782009 156,3462010 175,854
Enrollment: Community Colleges
Postsecondary enrollment growth in the regionhas been most pronounced at the communitycolleges while enrollment at the region’s fouryear colleges has remained relatively stagnant.
Community college enrollment has skyrocketed and, for the region, represents thepostsecondary setting most students are attending.In Texas, more than 700,000 students attendedcommunity colleges in 2010, a 30% increasefrom 2005. The region, which accounts forabout one-quarter of the state’s enrollment, sawa 36% increase from 2005 to 2010 (Table 2).
30,000
25,000
20,000
15,000
10,000
5,000
0
Applicants Acceptances
Enrollees
28,125
23,24621,339
16,628
14,409
6,9878,306
2000
2001
2002
2003
2004
2005
2006
2007
2008
2009
2010
Enrollment: Four-Year Institutions
Among public four year institutions in the region, applications and admissions of first timein college freshmen have also steadily risenover the last decade. Almost 12,000 more students applied and 7,000 more were admitted to attend four-year institutions in2010 than in 2000. However, enrollmentsto the region’s public four year collegeshave remained relatively stagnant withfewer than 2,000 additional students enrolling in 2010 than in 2000 (Figure 7).
Figure 6: Gulf Coast Region, Higher Education Campuses12 Figure 7: First-Time College Applications, Acceptances, and Enrollments for Regional Four-Year Universities, 2000-201015
1954 Brown v. Board of Education of Topeka, KS: The Supreme Court ruled that segregated schools were inherently unequal.
1955 The Supreme Court announced that schools must desegregate.
Table 1: Education among Top US Cities
Source: Texas Higher Education Coordinating Board, 2011Source: Texas Comptroller of Public Accounts
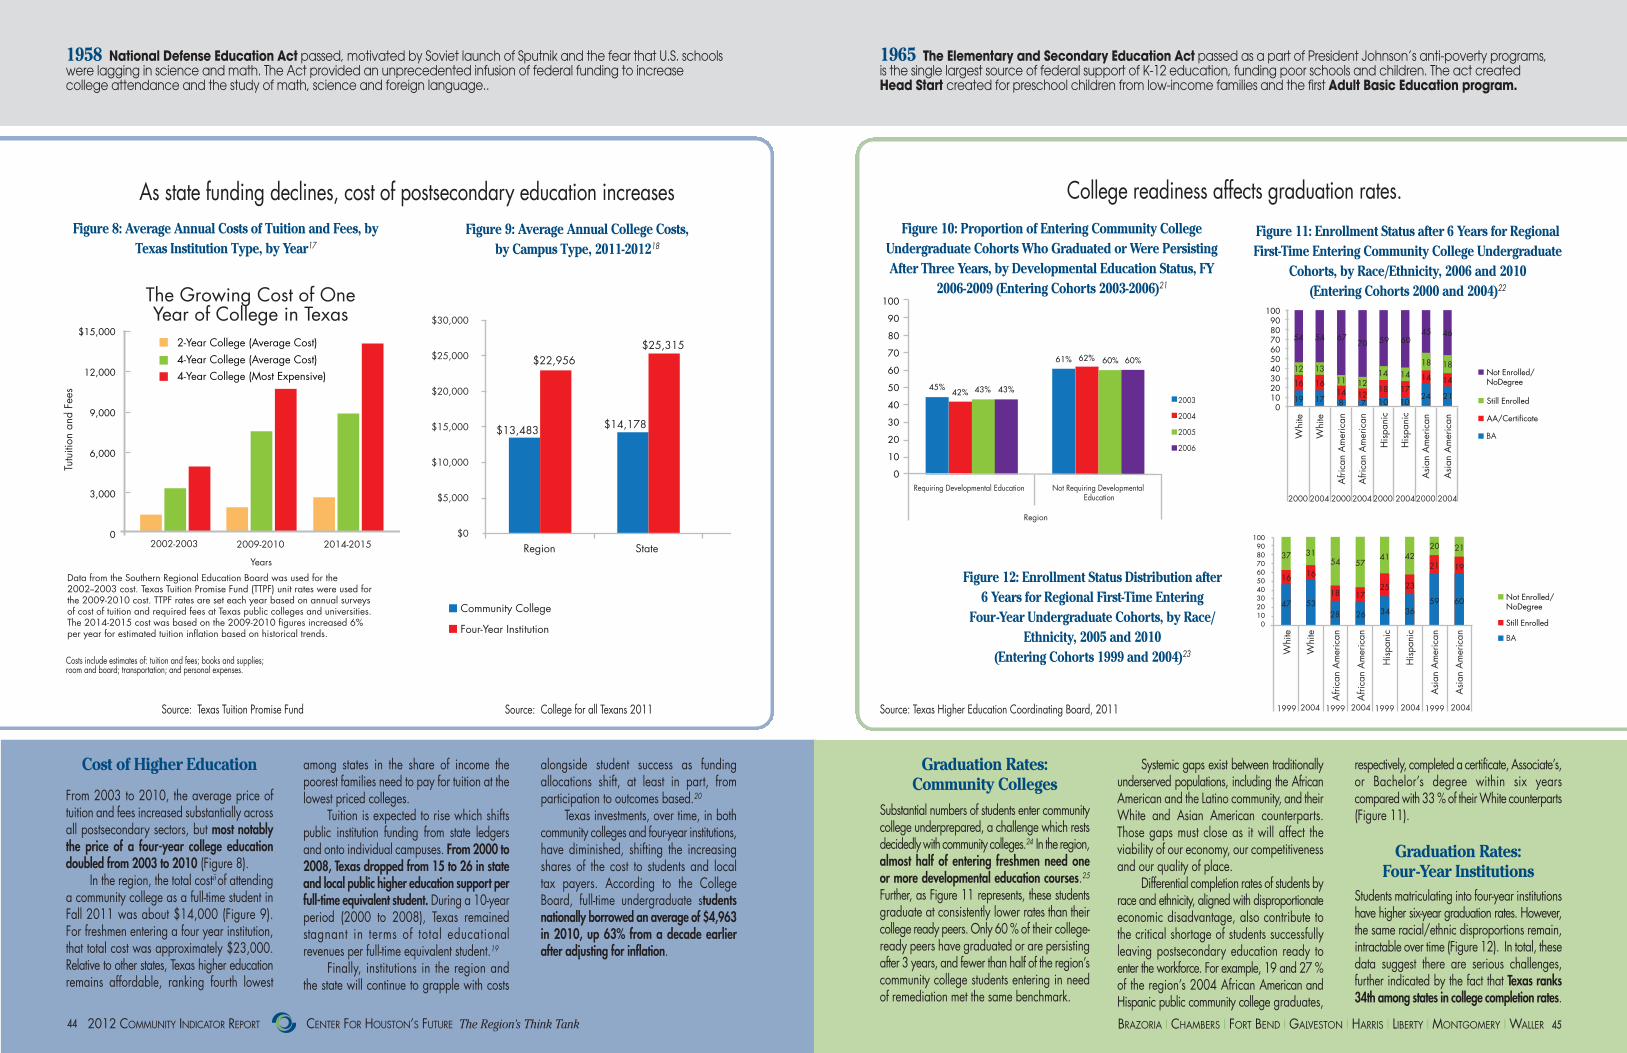
2012 COMMUNITY INDICATOR REPORT CENTER FOR HOUSTON’S FUTURE The Region’s Think Tank4444 4455BRAZORIA � CHAMBERS � FORT BEND � GALVESTON � HARRIS � LIBERTY � MONTGOMERY � WALLER
As state funding declines, cost of postsecondary education increases College readiness affects graduation rates.
Cost of Higher Education
From 2003 to 2010, the average price of tuition and fees increased substantially acrossall postsecondary sectors, but most notablythe price of a four-year college educationdoubled from 2003 to 2010 (Figure 8).
In the region, the total costii of attendinga community college as a full-time student inFall 2011 was about $14,000 (Figure 9).For freshmen entering a four year institution,that total cost was approximately $23,000.Relative to other states, Texas higher educationremains affordable, ranking fourth lowest
$15,000
12,000
9,000
6,000
3,000
0
2-Year College (Average Cost)4-Year College (Average Cost)4-Year College (Most Expensive)
2002-2003 2009-2010 2014-2015
Years
Tutu
ition
and
Fee
s
The Growing Cost of OneYear of College in Texas
Data from the Southern Regional Education Board was used for the2002--2003 cost. Texas Tuition Promise Fund (TTPF) unit rates were used forthe 2009-2010 cost. TTPF rates are set each year based on annual surveysof cost of tuition and required fees at Texas public colleges and universities.The 2014-2015 cost was based on the 2009-2010 figures increased 6%per year for estimated tuition inflation based on historical trends.
$30,000
$25,000
$20,000
$15,000
$10,000
$5,000
$0
Region State
$13,483 $14,178
$25,315$22,956
Community College
Four-Year Institution
$15,000
12,000
9,000
6,000
3,000
0
2-Year College (Average Cost)4-Year College (Average Cost)4-Year College (Most Expensive)
2002-2003 2009-2010 2014-2015
Years
Tutu
ition
and
Fee
s
The Growing Cost of OneYear of College in Texas
Data from the Southern Regional Education Board was used for the2002--2003 cost. Texas Tuition Promise Fund (TTPF) unit rates were used forthe 2009-2010 cost. TTPF rates are set each year based on annual surveysof cost of tuition and required fees at Texas public colleges and universities.The 2014-2015 cost was based on the 2009-2010 figures increased 6%per year for estimated tuition inflation based on historical trends.
$30,000
$25,000
$20,000
$15,000
$10,000
$5,000
$0
Region State
$13,483 $14,178
$25,315$22,956
Community College
Four-Year Institution
Figure 8: Average Annual Costs of Tuition and Fees, byTexas Institution Type, by Year17
Figure 9: Average Annual College Costs, by Campus Type, 2011-201218
Figure 10: Proportion of Entering Community College Undergraduate Cohorts Who Graduated or Were PersistingAfter Three Years, by Developmental Education Status, FY
2006-2009 (Entering Cohorts 2003-2006)21
Figure 11: Enrollment Status after 6 Years for RegionalFirst-Time Entering Community College Undergraduate
Cohorts, by Race/Ethnicity, 2006 and 2010 (Entering Cohorts 2000 and 2004)22
Figure 12: Enrollment Status Distribution after 6 Years for Regional First-Time Entering
Four-Year Undergraduate Cohorts, by Race/Ethnicity, 2005 and 2010
(Entering Cohorts 1999 and 2004)23
among states in the share of income thepoorest families need to pay for tuition at thelowest priced colleges.
Tuition is expected to rise which shiftspublic institution funding from state ledgersand onto individual campuses. From 2000 to2008, Texas dropped from 15 to 26 in stateand local public higher education support perfull-time equivalent student. During a 10-yearperiod (2000 to 2008), Texas remainedstagnant in terms of total educational revenues per full-time equivalent student.19
Finally, institutions in the region andthe state will continue to grapple with costs
alongside student success as funding allocations shift, at least in part, from participation to outcomes based.20
Texas investments, over time, in bothcommunity colleges and four-year institutions,have diminished, shifting the increasingshares of the cost to students and local tax payers. According to the CollegeBoard, full-time undergraduate students nationally borrowed an average of $4,963in 2010, up 63% from a decade earlierafter adjusting for inflation.
Graduation Rates: Community Colleges
Substantial numbers of students enter communitycollege underprepared, a challenge which restsdecidedly with community colleges.24 In the region,almost half of entering freshmen need one or more developmental education courses.25Further, as Figure 11 represents, these studentsgraduate at consistently lower rates than theircollege ready peers. Only 60 % of their college-ready peers have graduated or are persistingafter 3 years, and fewer than half of the region’scommunity college students entering in needof remediation met the same benchmark.
Systemic gaps exist between traditionallyunderserved populations, including the AfricanAmerican and the Latino community, and theirWhite and Asian American counterparts.Those gaps must close as it will affect the viability of our economy, our competitivenessand our quality of place.
Differential completion rates of students byrace and ethnicity, aligned with disproportionateeconomic disadvantage, also contribute tothe critical shortage of students successfullyleaving postsecondary education ready toenter the workforce. For example, 19 and 27 %of the region’s 2004 African American andHispanic public community college graduates,
respectively, completed a certificate, Associate’s,or Bachelor’s degree within six years compared with 33 % of their White counterparts(Figure 11).
Graduation Rates: Four-Year Institutions
Students matriculating into four-year institutionshave higher six-year graduation rates. However,the same racial/ethnic disproportions remain,intractable over time (Figure 12). In total, thesedata suggest there are serious challenges, further indicated by the fact that Texas ranks34th among states in college completion rates.
Costs include estimates of: tuition and fees; books and supplies; room and board; transportation; and personal expenses.
1958 National Defense Education Act passed, motivated by Soviet launch of Sputnik and the fear that U.S. schools were lagging in science and math. The Act provided an unprecedented infusion of federal funding to increase college attendance and the study of math, science and foreign language..
1965 The Elementary and Secondary Education Act passed as a part of President Johnson’s anti-poverty programs, is the single largest source of federal support of K-12 education, funding poor schools and children. The act created Head Start created for preschool children from low-income families and the first Adult Basic Education program.
1009080706050403020100
2000 20002004 20042000 20042000 2004
Whi
te
Afri
can
Am
eric
an
Afri
can
Am
eric
an
His
pani
c
His
pani
c
Asi
an A
mer
ican
Asi
an A
mer
ican
Whi
te
19 17
16 16
12 1311 12
14
18
10 1024 21
17
14
12148 7
54 6770 59 60
45 4654
14
18 18
14
Not Enrolled/NoDegree
Still Enrolled
BA
1999 1999 199919992004 2004 20042004
Whi
te
Afri
can
Am
eric
an
Afri
can
Am
eric
an
His
pani
c
His
pani
c
Asi
an A
mer
ican
Asi
an A
mer
ican
Whi
te
100908070605040302010
0
37 3154 57
41 4220 21
16 16
534718 17
25 23
21 19
28 26 34 3659 60
100
90
80
70
60
50
40
30
20
10
0
45%42% 43% 43%
61% 62% 60% 60%
Region
Requiring Developmental Education Not Requiring Developmental Education
2003
2004
2005
2006
Not Enrolled/NoDegree
Still Enrolled
AA/Certificate
BA
100908070605040302010
0
2000 20002004 20042000 20042000 2004
Whi
te
Afri
can
Am
eric
an
Afri
can
Am
eric
an
His
pani
c
His
pani
c
Asi
an A
mer
ican
Asi
an A
mer
ican
Whi
te
19 17
16 16
12 1311 12
14
18
10 1024 21
17
14
12148 7
54 6770 59 60
45 4654
14
18 18
14
Not Enrolled/NoDegree
Still Enrolled
BA
1999 1999 199919992004 2004 20042004
Whi
te
Afri
can
Am
eric
an
Afri
can
Am
eric
an
His
pani
c
His
pani
c
Asi
an A
mer
ican
Asi
an A
mer
ican
Whi
te
100908070605040302010
0
37 3154 57
41 4220 21
16 16
534718 17
25 23
21 19
28 26 34 3659 60
100
90
80
70
60
50
40
30
20
10
0
45%42% 43% 43%
61% 62% 60% 60%
Region
Requiring Developmental Education Not Requiring Developmental Education
2003
2004
2005
2006
Not Enrolled/NoDegree
Still Enrolled
AA/Certificate
BA
Source: Texas Tuition Promise Fund Source: College for all Texans 2011 Source: Texas Higher Education Coordinating Board, 2011

Although there are many challenges in workforce development, educators and businesses are implementing a number ofprograms geared toward increasing students’access to and success in postsecondary education.
Achieving the Dream
Campuses throughoutthe eight counties havebeen multi-year partnersin national and regionalinitiatives such as Achieving the Dream (AtD).College of the Mainland’s participation inAtD professional development activitiesaimed at increasing the effectiveness offaculty and staff in serving and connectingwith students resulted in a 7 percentage pointincrease in fall to spring student retention,from 65% in the baseline years to 72% by2010.26 Additionally, cross-communityefforts represented by P-16 alliances havebeen formed to “gather and analyze dataacross the pipeline to bring greater alignmentof education systems in support of student success.”27 Such efforts are critical to the continued pursuit of increased access toand successful completion of postsecondary educational experiences toward workforcereadiness.
Production Technician Internship Program
In June, 2011 Bayer Material Science (BMS)launched an innovative Production TechnicianInternship Program (PTIP) designed to flexibly
and efficiently staff its largest US chemicalmanufacturing site with future operators. Located in the heart of the Houston Ship Channel, the Bayer facility was faced with thedaunting challenge of finding technical talentto replace its aging, retiring workforce. In acompetitive labor market characterized by high demand, limited supply, and an educational system not yet producing sufficient numbers of students with the neededmath and science fundamentals, the company needed a solution. Workingclosely with industry through East HarrisCounty Manufacturers Association and localcommunity college partners, Lee and San Jacinto Colleges, BMS and its partners designed and implemented a technician internship program that has already generated 24 interns in only 6 months.
The PTIP program has several key objectives:
1 – To recruit the top talent of students enrolled in the Process Technology certification programs from local community colleges to fill vacant positions.
2 – To stimulate a robust pipeline of future production technicians by motivating and recruiting talented high school seniors to enroll in the Process Technology certification program.
3 – To provide students hands on experience as potential production technicians to complement their theory based technical education and to experience chemical manufacturing work and careers first hand.
4 – To complete a comprehensive, first hand assessment of skills, competencies, and work ethic of Bayer applicants prior to making a fulltime employment offer.
5 – To support the community through training, education, and the positive economic impact of safe, secure high paying jobs.
Students enrolled in or recently graduatedfrom an accredited Process Technology certificate or degree program are eligible to test and interview for intern positions. Selected candidates:1 – Complete 8-10 weeks of site observation
and job shadowing of experienced technicians and trainers.
2 – Work and experience the challenges and adjustments of a rotating shift schedule.
3 – Train and work with:a – Operating Proceduresb – Operating Checklistsc – Process Flow Diagramsd – Piping and Instrumentation Diagramse – Training manualsf – Material Safety Data Sheetsg – Safety Procedures.
4 – Give a final presentation and a formal evaluation process for future hire consideration.
5 – Achieve school course credit for successful completion of internship.
Bayer will measure the long term return on investment of the PTIP program based on expected reductions in recruiting time, lengthof training, cost, and involuntary turnover.This sourcing model has already achieved a30% reduction in labor/training costs fornewly hired production technicians. The fastest growing professions
in the region, including
education, nursing, engineering,
and accounting, will face as much
as a 621,000 person shortage in
the next four years.
4477BRAZORIA � CHAMBERS � FORT BEND � GALVESTON � HARRIS � LIBERTY � MONTGOMERY � WALLER2012 COMMUNITY INDICATOR REPORT CENTER FOR HOUSTON’S FUTURE The Region’s Think Tank4466
Best Practices
The data in this report identify several considerations for policy makers that, incombination, challenge them and advocatesof quality education to consider the economic, social and educational return of apostsecondary education to the student, thecity and the state. As the indicators clearlyidentify, each of these considerations high-lights the interrelated nature of the Pre-K-12and postsecondary sectors as well as thedeep need to actively incorporate the culturalassets of the region into the solutions.
Support for Programs Proven Effective
Increasingly, K-16 partnerships are servingimportant roles in facilitating the developmentof a well-prepared workforce. Policymakersin the region must consider carefully local and state exemplars in order to identify bestpractices and benchmark efforts moving forward. The El Paso Texas Collaborativefor Excellence, for example, has seenmarked increases in student achievement aswell as a pronounced narrowing of the gapamong groups of students through theirK–16 collaborative. Enhanced support of such programs may help move forward the efforts toclose gaps in postsecondary participation
Public Policy Considerations
and completion. In 2011, the state formed aCouncil for Continuous Improvement and Innovation in Texas Higher Education. It is apermanent council whose charge is to increase efficiency and productivity. Thechallenges identified in these metrics mark animportant place for the Houston area branchof this council to begin work.
Funding Structure
The Texas funding structure of higher educationcreates challenges and opportunities for bothcommunity colleges and four-year institutions.Careful and rigorous analysis of issues suchas taxing, district boundaries, outcomes-based funding and state-available financialaid such as the TEXAS Grant need to be included in the policy dialogue. Specifically,additional research is needed to inform understanding of how shifts in these criticalscaled contributions to college financing willaffect the likelihood of students – particularlythose most economically disadvantaged —enrolling and ultimately graduating, ready tosuccessfully enter the workforce.
Economically Disadvantaged Populations anda Cultural Asset Framework
As identified clearly in the state’s Closing theGap initiative, the postsecondary educationpolicies of the region need to attend carefullyto the disproportionate disadvantages ofLatino and African American students andthose in poverty face in the pursuit of a college education. Texas and the region holdthe distinct advantage of being one of the most diverse states in the nation. Suchcultural assets must be nurtured rather thansquandered.
Support for Continued Research on Long-Term Outcomes
Finally, among the most important recommendations is the continued thoughtful consideration of access, success, and affordability metrics themselves. Ongoingand expanded collection of relevant state andregional data on postsecondary educationalexperiences and long-term post-graduate outcomes is warranted in order to have an increasingly robust understanding of the contributions of college to individual andcommunity well-being.

Gen
eral
Socio
–economic, Cultural and Environmental Conditions
Socia
l and Community Networks
Indi
vidual Lifestyle Factors
Age, Sex andConstitutional
Factors
Living and WorkingConditions
mqwertyuiop[]\asdfghjkl;'zxcvbnm,./
mmWork
Environment
Education
Agricultureand FoodProduction
Unemployment
Water andSanitation
HealthCare
Services
Housing
The Link between
Education and Health
The more you learn, the more you earn, the more you engage in healthy behaviors.1
Is an educated population healthier? Absolutely; the positive link between educational attainment and healthis well documented in the scientific literature. People with more education are more likely to live longer and healthier lives. Increased life expectancy and better health outcomes are evident across countries, communities and different ethnic and racial groups. These bold claims are backed by extensive data. Forexample, the 2007 National Vital Statistics Report, states that the mortality rate for American males with lessthan a high school education, between 25 and 64 years of age, was more than double the rate for males withsome college or higher education3. The differences are not reflected just in reduced life expectancy: the sametrend is true in acute and chronic disease.
How do we define and measure what affects health? According to the World Health Organization, certain factors are fixed, such as the individual’s age, gender and genetics. Other factors can be modified,such as lifestyle behaviors, social and community networks, living and working conditions, and general socioeconomic, cultural and environmental conditions. In Figure 1, these factors, or determinants, providean illustration for understanding health, which is not merely an absence of disease, but rather “the conditionsin which people are born, grow, live, work and age”4. Education plays a role in all of these conditions.
Authors from St. Luke’s Episcopal Health Charities: Patricia Gail Bray, PhD, Executive Director; Jeanne Hanks, Dr.PH & MSW, Community Liaison; Linda Highfield, PhD, Director of Quantitative Research; Philomene Balihe, MPH, Biostatistician; and Jenita Parekh, MPH, Senior Research Associate
Figure 1. Determinants of Health.
Source: Dahlgren and Whitehead, 20062
4499BRAZORIA � CHAMBERS � FORT BEND � GALVESTON � HARRIS � LIBERTY � MONTGOMERY � WALLER2012 COMMUNITY INDICATOR REPORT CENTER FOR HOUSTON’S FUTURE The Region’s Think Tank4488
“All human beings areborn with unique gifts. The healthy functioning
of community depends onrealizing the capacity todevelop each gift.”
P E T E R S E N G E , P H . D .Massachusetts Institute of Technology
Executive Summary
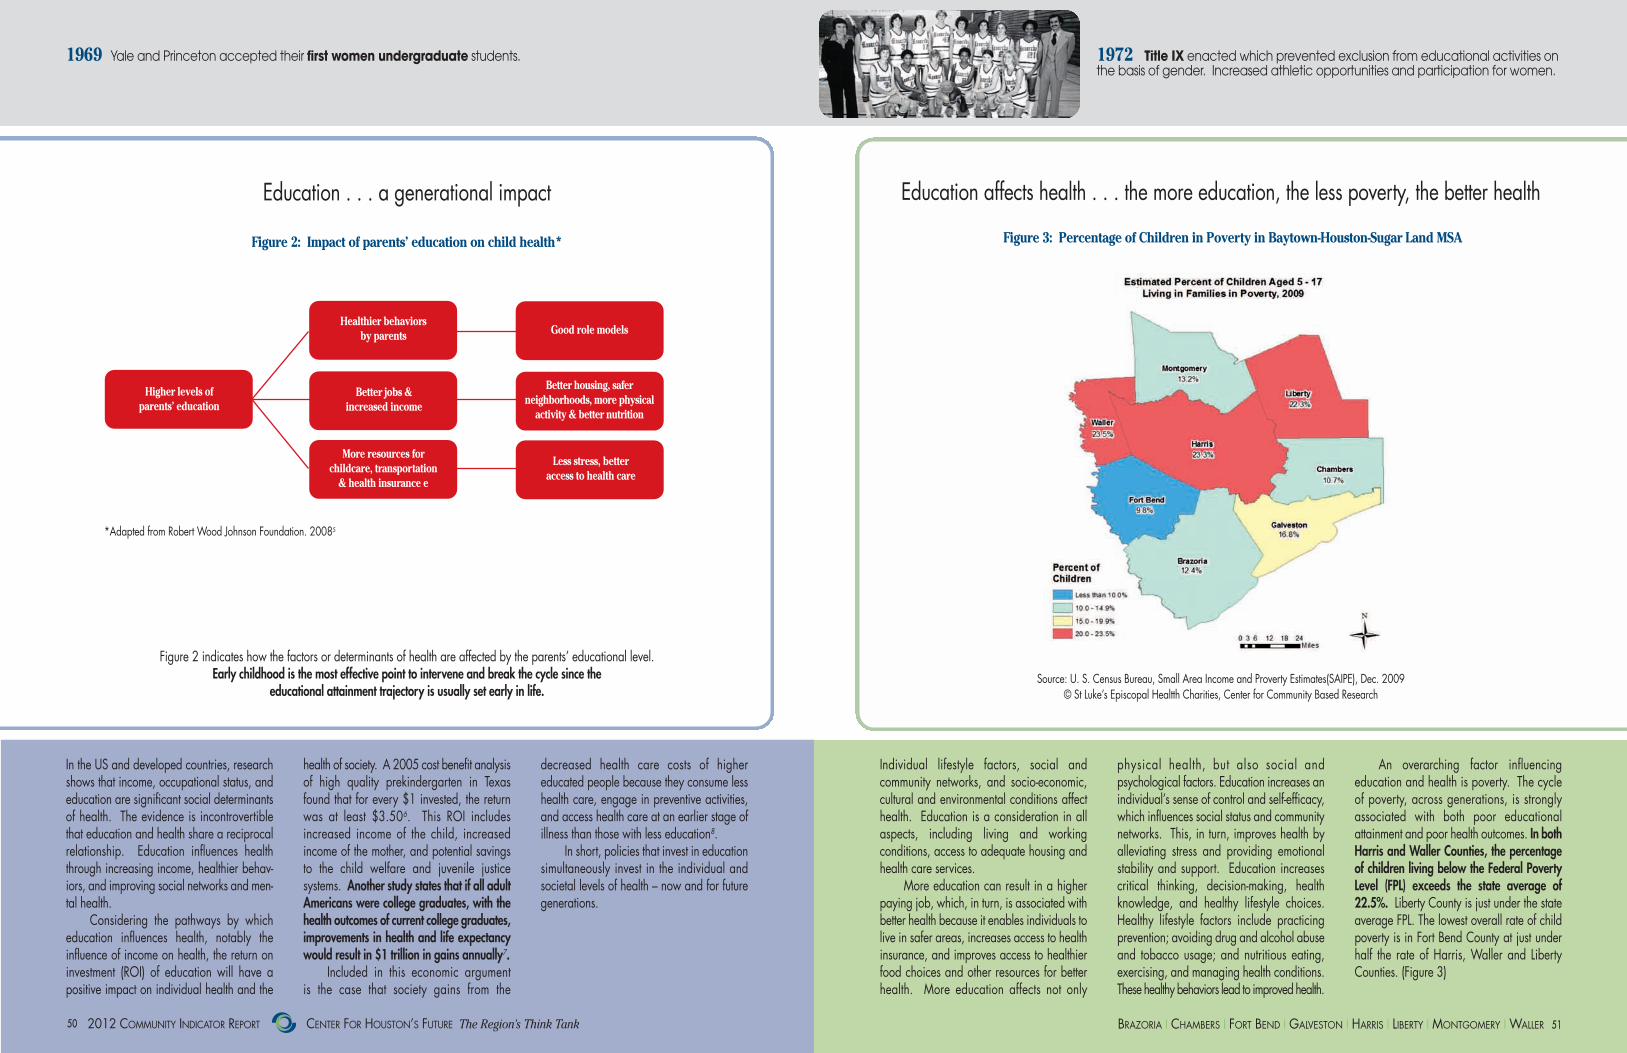
2012 COMMUNITY INDICATOR REPORT CENTER FOR HOUSTON’S FUTURE The Region’s Think Tank5500 5511BRAZORIA � CHAMBERS � FORT BEND � GALVESTON � HARRIS � LIBERTY � MONTGOMERY � WALLER
decreased health care costs of higher educated people because they consume lesshealth care, engage in preventive activities,and access health care at an earlier stage ofillness than those with less education8.
In short, policies that invest in educationsimultaneously invest in the individual and societal levels of health – now and for futuregenerations.
In the US and developed countries, researchshows that income, occupational status, andeducation are significant social determinantsof health. The evidence is incontrovertiblethat education and health share a reciprocalrelationship. Education influences healththrough increasing income, healthier behav-iors, and improving social networks and men-tal health.
Considering the pathways by which education influences health, notably the influence of income on health, the return oninvestment (ROI) of education will have a positive impact on individual health and the
health of society. A 2005 cost benefit analysisof high quality prekindergarten in Texasfound that for every $1 invested, the returnwas at least $3.506. This ROI includes increased income of the child, increasedincome of the mother, and potential savingsto the child welfare and juvenile justicesystems. Another study states that if all adultAmericans were college graduates, with thehealth outcomes of current college graduates,improvements in health and life expectancywould result in $1 trillion in gains annually7.
Included in this economic argument is the case that society gains from the
Education affects health . . . the more education, the less poverty, the better healthEducation . . . a generational impact
Figure 2 indicates how the factors or determinants of health are affected by the parents’ educational level. Early childhood is the most effective point to intervene and break the cycle since the
educational attainment trajectory is usually set early in life.
Individual lifestyle factors, social andcommunity networks, and socio-economic,cultural and environmental conditions affecthealth. Education is a consideration in all aspects, including living and working conditions, access to adequate housing andhealth care services.
More education can result in a higherpaying job, which, in turn, is associated withbetter health because it enables individuals tolive in safer areas, increases access to healthinsurance, and improves access to healthierfood choices and other resources for betterhealth. More education affects not only
physical health, but also social andpsychological factors. Education increases anindividual’s sense of control and self-efficacy,which influences social status and communitynetworks. This, in turn, improves health byalleviating stress and providing emotional stability and support. Education increasescritical thinking, decision-making, healthknowledge, and healthy lifestyle choices.Healthy lifestyle factors include practicing prevention; avoiding drug and alcohol abuseand tobacco usage; and nutritious eating, exercising, and managing health conditions.These healthy behaviors lead to improved health.
An overarching factor influencing education and health is poverty. The cycleof poverty, across generations, is strongly associated with both poor educational attainment and poor health outcomes. In bothHarris and Waller Counties, the percentageof children living below the Federal PovertyLevel (FPL) exceeds the state average of22.5%. Liberty County is just under the stateaverage FPL. The lowest overall rate of childpoverty is in Fort Bend County at just underhalf the rate of Harris, Waller and LibertyCounties. (Figure 3)
Figure 2: Impact of parents’ education on child health* Figure 3: Percentage of Children in Poverty in Baytown-Houston-Sugar Land MSA
*Adapted from Robert Wood Johnson Foundation. 20085
Source: U. S. Census Bureau, Small Area Income and Proverty Estimates(SAIPE), Dec. 2009© St Luke’s Episcopal Healtth Charities, Center for Community Based Research
Good role models
Better housing, saferneighborhoods, more physical
activity & better nutrition
Less stress, better access to health care
Higher levels of parents’ education
Healthier behaviors by parents
Better jobs &increased income
More resources for childcare, transportation
& health insurance e
1969 Yale and Princeton accepted their first women undergraduate students. 1972 Title IX enacted which prevented exclusion from educational activities onthe basis of gender. Increased athletic opportunities and participation for women.
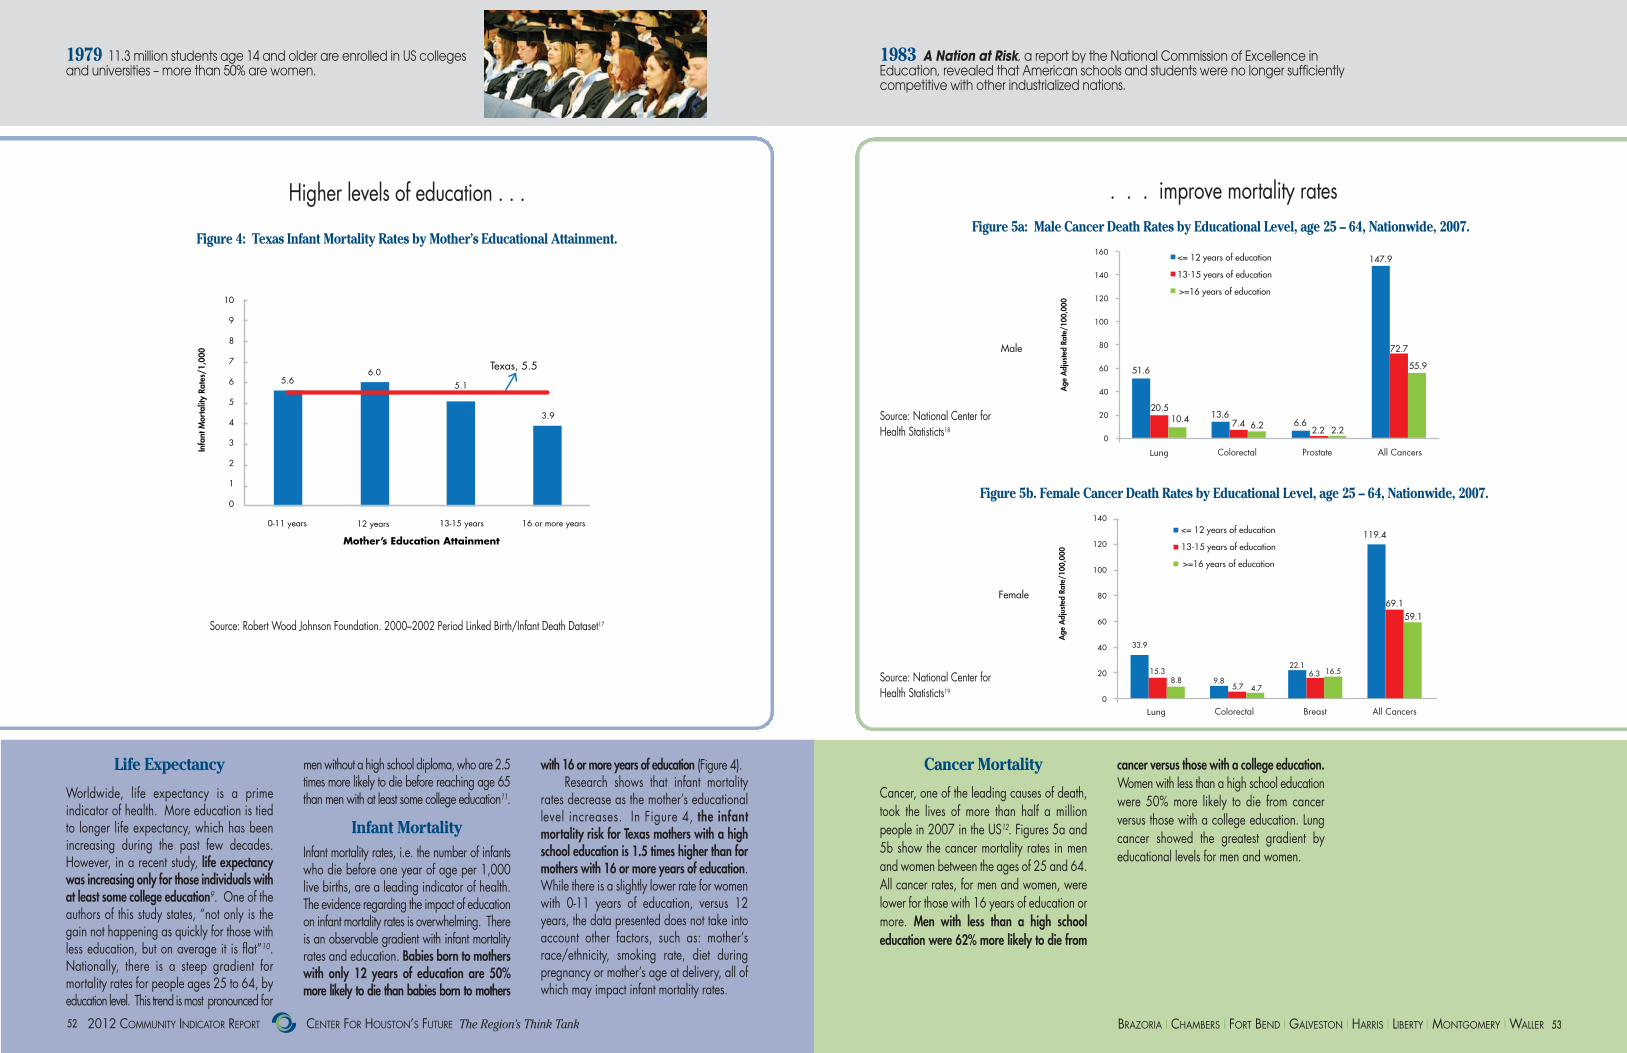
2012 COMMUNITY INDICATOR REPORT CENTER FOR HOUSTON’S FUTURE The Region’s Think Tank5522 5533BRAZORIA � CHAMBERS � FORT BEND � GALVESTON � HARRIS � LIBERTY � MONTGOMERY � WALLER
Life Expectancy
Worldwide, life expectancy is a prime indicator of health. More education is tiedto longer life expectancy, which has been increasing during the past few decades.However, in a recent study, life expectancywas increasing only for those individuals withat least some college education9. One of theauthors of this study states, “not only is thegain not happening as quickly for those withless education, but on average it is flat”10.Nationally, there is a steep gradient for mortality rates for people ages 25 to 64, byeducation level. This trend is most pronounced for
men without a high school diploma, who are 2.5times more likely to die before reaching age 65than men with at least some college education11.
Infant MortalityInfant mortality rates, i.e. the number of infantswho die before one year of age per 1,000live births, are a leading indicator of health.The evidence regarding the impact of educationon infant mortality rates is overwhelming. Thereis an observable gradient with infant mortalityrates and education. Babies born to motherswith only 12 years of education are 50%more likely to die than babies born to mothers
with 16 or more years of education (Figure 4).Research shows that infant mortality
rates decrease as the mother’s educationallevel increases. In Figure 4, the infant mortality risk for Texas mothers with a highschool education is 1.5 times higher than formothers with 16 or more years of education.While there is a slightly lower rate for womenwith 0-11 years of education, versus 12years, the data presented does not take intoaccount other factors, such as: mother’srace/ethnicity, smoking rate, diet duringpregnancy or mother’s age at delivery, all ofwhich may impact infant mortality rates.
10
9
8
7
6
5
4
3
2
1
0
0-11 years 12 years 13-15 years 16 or more years
Texas, 5.55.6
6.05.1
3.9
Mother’s Education Attainment
Infa
nt M
orta
lity
Rate
s/1,
000
Higher levels of education . . . . . . improve mortality rates
Figure 4: Texas Infant Mortality Rates by Mother’s Educational Attainment.Figure 5a: Male Cancer Death Rates by Educational Level, age 25 – 64, Nationwide, 2007.
Figure 5b. Female Cancer Death Rates by Educational Level, age 25 – 64, Nationwide, 2007.
Cancer Mortality
Cancer, one of the leading causes of death,took the lives of more than half a million people in 2007 in the US12. Figures 5a and5b show the cancer mortality rates in menand women between the ages of 25 and 64.All cancer rates, for men and women, werelower for those with 16 years of education ormore. Men with less than a high school education were 62% more likely to die from
cancer versus those with a college education.Women with less than a high school educationwere 50% more likely to die from cancer versus those with a college education. Lungcancer showed the greatest gradient by educational levels for men and women.
Source: Robert Wood Johnson Foundation. 2000–2002 Period Linked Birth/Infant Death Dataset17
Source: National Center forHealth Statisticts18
Source: National Center forHealth Statisticts19
1979 11.3 million students age 14 and older are enrolled in US collegesand universities – more than 50% are women.
1983 A Nation at Risk, a report by the National Commission of Excellence inEducation, revealed that American schools and students were no longer sufficientlycompetitive with other industrialized nations.
160
140
120
100
80
60
40
20
0
Lung Colorectal
Male
Prostate All Cancers
<= 12 years of education
13-15 years of education
>=16 years of education
51.6
20.513.6
7.4 6.210.4 6.6
2.2 2.2
147.9
140
120
100
80
60
40
20
0
Lung Colorectal
Female
Breast All Cancers
<= 12 years of education
13-15 years of education
>=16 years of education
33.9
15.39.8
5.7 4.78.8
22.16.3 16.5
119.4
Age
Adj
uste
d Ra
te/1
00,0
00A
ge A
djus
ted
Rate
/100
,000
72.7
55.9
69.159.1
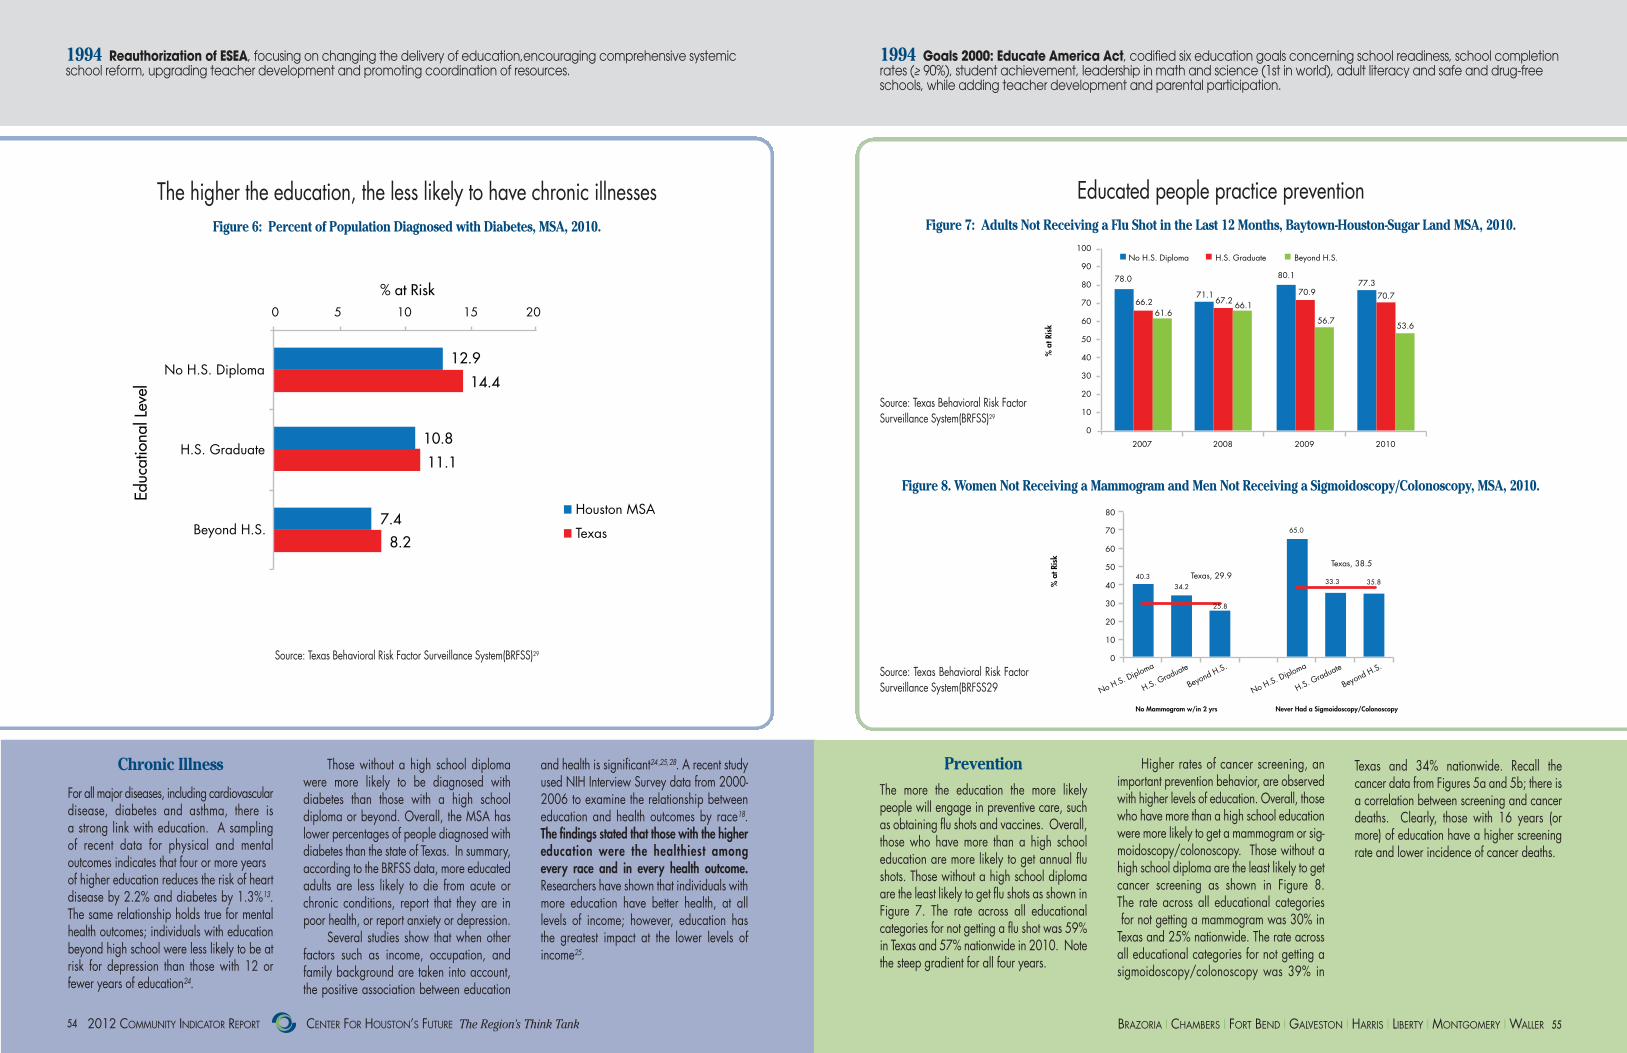
2012 COMMUNITY INDICATOR REPORT CENTER FOR HOUSTON’S FUTURE The Region’s Think Tank5544 5555BRAZORIA � CHAMBERS � FORT BEND � GALVESTON � HARRIS � LIBERTY � MONTGOMERY � WALLER
Educated people practice prevention
0 5 10 15 20
No H.S. Diploma
H.S. Graduate
Beyond H.S.Houston MSA
Texas
% at Risk
Educ
atio
nal L
evel
12.9
14.4
10.8
11.1
7.48.2
The higher the education, the less likely to have chronic illnessesFigure 6: Percent of Population Diagnosed with Diabetes, MSA, 2010.
Chronic Illness
For all major diseases, including cardiovasculardisease, diabetes and asthma, there is a strong link with education. A sampling of recent data for physical and mental outcomes indicates that four or more years of higher education reduces the risk of heartdisease by 2.2% and diabetes by 1.3%13.The same relationship holds true for mentalhealth outcomes; individuals with educationbeyond high school were less likely to be atrisk for depression than those with 12 orfewer years of education24.
Those without a high school diplomawere more likely to be diagnosed with diabetes than those with a high schooldiploma or beyond. Overall, the MSA haslower percentages of people diagnosed withdiabetes than the state of Texas. In summary,according to the BRFSS data, more educatedadults are less likely to die from acute orchronic conditions, report that they are inpoor health, or report anxiety or depression.
Several studies show that when otherfactors such as income, occupation, and family background are taken into account,the positive association between education
and health is significant24 ,25, 28. A recent studyused NIH Interview Survey data from 2000-2006 to examine the relationship betweeneducation and health outcomes by race18.The findings stated that those with the highereducation were the healthiest among every race and in every health outcome. Researchers have shown that individuals withmore education have better health, at all levels of income; however, education has the greatest impact at the lower levels of income25.
Figure 7: Adults Not Receiving a Flu Shot in the Last 12 Months, Baytown-Houston-Sugar Land MSA, 2010.
Figure 8. Women Not Receiving a Mammogram and Men Not Receiving a Sigmoidoscopy/Colonoscopy, MSA, 2010.
PreventionThe more the education the more likely people will engage in preventive care, suchas obtaining flu shots and vaccines. Overall,those who have more than a high school education are more likely to get annual flushots. Those without a high school diplomaare the least likely to get flu shots as shown inFigure 7. The rate across all educational categories for not getting a flu shot was 59%in Texas and 57% nationwide in 2010. Notethe steep gradient for all four years.
Higher rates of cancer screening, an important prevention behavior, are observedwith higher levels of education. Overall, thosewho have more than a high school educationwere more likely to get a mammogram or sig-moidoscopy/colonoscopy. Those without ahigh school diploma are the least likely to getcancer screening as shown in Figure 8. The rate across all educational categoriesfor not getting a mammogram was 30% inTexas and 25% nationwide. The rate acrossall educational categories for not getting asigmoidoscopy/colonoscopy was 39% in
Texas and 34% nationwide. Recall the cancer data from Figures 5a and 5b; there isa correlation between screening and cancerdeaths. Clearly, those with 16 years (ormore) of education have a higher screeningrate and lower incidence of cancer deaths.
1994 Goals 2000: Educate America Act, codified six education goals concerning school readiness, school completionrates (≥ 90%), student achievement, leadership in math and science (1st in world), adult literacy and safe and drug-freeschools, while adding teacher development and parental participation.
1994 Reauthorization of ESEA, focusing on changing the delivery of education,encouraging comprehensive systemic school reform, upgrading teacher development and promoting coordination of resources.
Source: Texas Behavioral Risk Factor Surveillance System(BRFSS)29
Source: Texas Behavioral Risk FactorSurveillance System(BRFSS)29
Source: Texas Behavioral Risk FactorSurveillance System(BRFSS29
100
90
80
70
60
50
40
30
20
10
0
No H.S. Diploma H.S. Graduate Beyond H.S.
2007 2008 2009 2010
78.0
66.261.6
71.167.2 66.1
80.177.3
80
70
60
50
40
30
20
10
0
40.334.2
Texas, 29.9Texas, 38.5
65.0
33.3 35.8
No H.S. Diploma
H.S. Graduate
Beyond H.S.
No H.S. Diploma
H.S. Graduate
Beyond H.S.
No Mammogram w/in 2 yrs Never Had a Sigmoidoscopy/Colonoscopy
25.8
% a
t Ris
k %
at R
isk
70.9
56.7
70.7
53.6

2012 COMMUNITY INDICATOR REPORT CENTER FOR HOUSTON’S FUTURE The Region’s Think Tank5566 5577BRAZORIA � CHAMBERS � FORT BEND � GALVESTON � HARRIS � LIBERTY � MONTGOMERY � WALLER
Figure 9: Overweight and Obese, MSA, 2010.
Figure 10. Smoking Behavior, MSA, 2010.
ObesityInactivity and poor diet are leading contributorsto being overweight and/or obese. Like manybehaviors, poorer nutrition and inactivity aremore prevalent among lower educated people20, 21. According to the data, more educated people are more likely to have leisuretime and to exercise regularly. Overall, thosewho have more than a high school educationare less likely to be obese, but are more likelyto be overweight. High school graduates arethe most likely to be overweight or obese asshown in Figure 9. The rate across all
educational categories for being obese oroverweight was 29% and 38%, respectivelyin Texas and 31% and 34% nationwide.
Within Texas and the MSA, lower levelsof leisure time and lower levels of physical activity are reported by those with less education. Those without a high schooldiploma are twice as likely to report noleisure time and less physical activity as thosewith education beyond High School (41%,20% respectively). The greater Houston areareports lower levels of physical activity thanthe State of Texas.
SmokingSmoking leads to poorer health outcomes, including higher incidence of cancer and cardiovascular disease. People who haveeducation beyond high school have lowerrates of smoking. The life expectancy of smokersis about six years less than nonsmokers6. Figure 10 shows smoking rates for the MSA.The lowest level of smoking is seen in peoplewith an education beyond high school in theMSA. The highest rates for both current smokers and former smokers are seen in highschool graduates.
Maternal and Early Child Health
A mother's education is strongly associatedwith her behaviors in pregnancy, whichinfluence her child’s birth outcomes andhealth. The figures above indicate late or noprenatal care by mother’s education23. In allcases, mothers with no, or only a high schooldiploma entered care later, or not at all, athigher rates than mothers who have somecollege or a college degree.
Babies born to mothers who enter prenatalcare after the first trimester, or who have no care,have a mortality rate of 8.35 per 1,000 births,
which is 37% higher than babies whose mothersenter care in the first trimester of pregnancy39.
Figure 11 illustrates that the rate for noprenatal care for mothers without a high schooldiploma was highest in Harris County (8.2),which exceeded the Texas rate (7.9). For motherswithout a high school diploma, the highestrate for third trimester entry to care was inLiberty County; the lowest was in ChambersCounty. Across all counties, the rate of lateentry into prenatal care was highest for thosewith less than a high school diploma (Figure 12).
Mothers with lower educational attainmentare more likely to have low birth weight babies40. A recent study estimated that an
additional year of education reduces the incidence of low birth weight by 10%41.
Higher education is associated withmore stimulation and interaction with infants,which is directly related to brain developmentin early childhood42. Brain development isstrongly linked to reduction in cardiovasculardiseases, diabetes, stroke, drug use, and depression in the child's adult life41.
Children in households without a highschool graduate are more than four timesmore likely to be in poor health than childrenliving with a college graduate44. In addition,children of less educated parents are lesslikely to succeed in school43.
Mother’s education, a huge plus for childrenEducated people likely to avoid chronic diseaseFigure 11: No Prenatal Care, Selected Texas Counties, 2008.
Figure 12. Prenatal Care Began Third Trimester, Selected Texas Counties, 2008.
2000 The first OECD Program for International Student Assessmentwas conducted in reading, mathematics and science. The alarm was sounded when US fifteen year-old students scored average and below when compared to other developed nations.
2008 For the first time, women earned more doctoral degrees than men (50.4%). In 2000, the percentage of women earning doctoral degrees was 44%. For master’s degrees, approximately 60.4% of women earn the degrees.
Source: Texas Behavioral Risk Factor Surveillance System(BRFSS)30
Source: Texas Behavioral Risk Factor Surveillance System(BRFSS)29
Source: 2008 Births to Texas Residents, Texas Department of State Health Seveices37
Source: 2008 Births to Texas Residents, Texas Department of State Health Seveices38
100
90
80
70
60
50
40
30
20
10
0No H.S. Diploma H.S. Graduate Beyond H.S.
No H.S. Diploma H.S. Graduate Beyond H.S.
% a
t Ris
k
% a
t Ris
k
Educational Level
31
Overweight
Obesity
40.3 40.7 25.3
31.7
37.3
60
50
40
30
20
10
0
Current
Ever Smoked
15.5
31
48.3
25.2
32.33
12.4
Education
100
90
80
70
60
50
40
30
20
10
0No H.S. Diploma H.S. Graduate Beyond H.S.
No H.S. Diploma H.S. Graduate Beyond H.S.
% a
t Ris
k
% a
t Ris
k
Educational Level
31
Overweight
Obesity
40.3 40.7 25.3
31.7
37.3
60
50
40
30
20
10
0
Current
Ever Smoked
15.5
31
48.3
25.2
32.33
12.4
Education
40
35
30
25
20
15
10
5
0
Beyond H.S. H.S. Graduate No H.S. Diploma
Brazo
ria
Chambe
rs
Fort B
end
Galvest
onHarr
is
Libert
y
Montgo
mery
Wall
erTex
as
5.5
6.4 8.9
5.45.0
8.9
12.4
5.6
3.3
13.1
10.0
13.3
7.5
13.8
3.9
10.5
10.9
12.8
5.6
8.3
13.4
6.45.7
9.5
13.1
9.7
11.5
% o
f Ris
k
20
18
16
14
12
10
8
6
4
2
0
Beyond H.S. H.S. Graduate No H.S. Diploma
Brazo
ria
Chambe
rs
Fort B
end
Galvest
onHarr
is
Libert
y
Montgo
mery
Wall
erTex
as
2.5
1.9
1.9
2.8
2.8
5.2
7.9
2.5
3.8
3.9
4.5
6.4
3.3
5.61.9
3.2
6.0
4.1
1.8
3.6
4.7
4.2
2.7
5.7
8.2
5.0
4.5
% o
f Ris
k
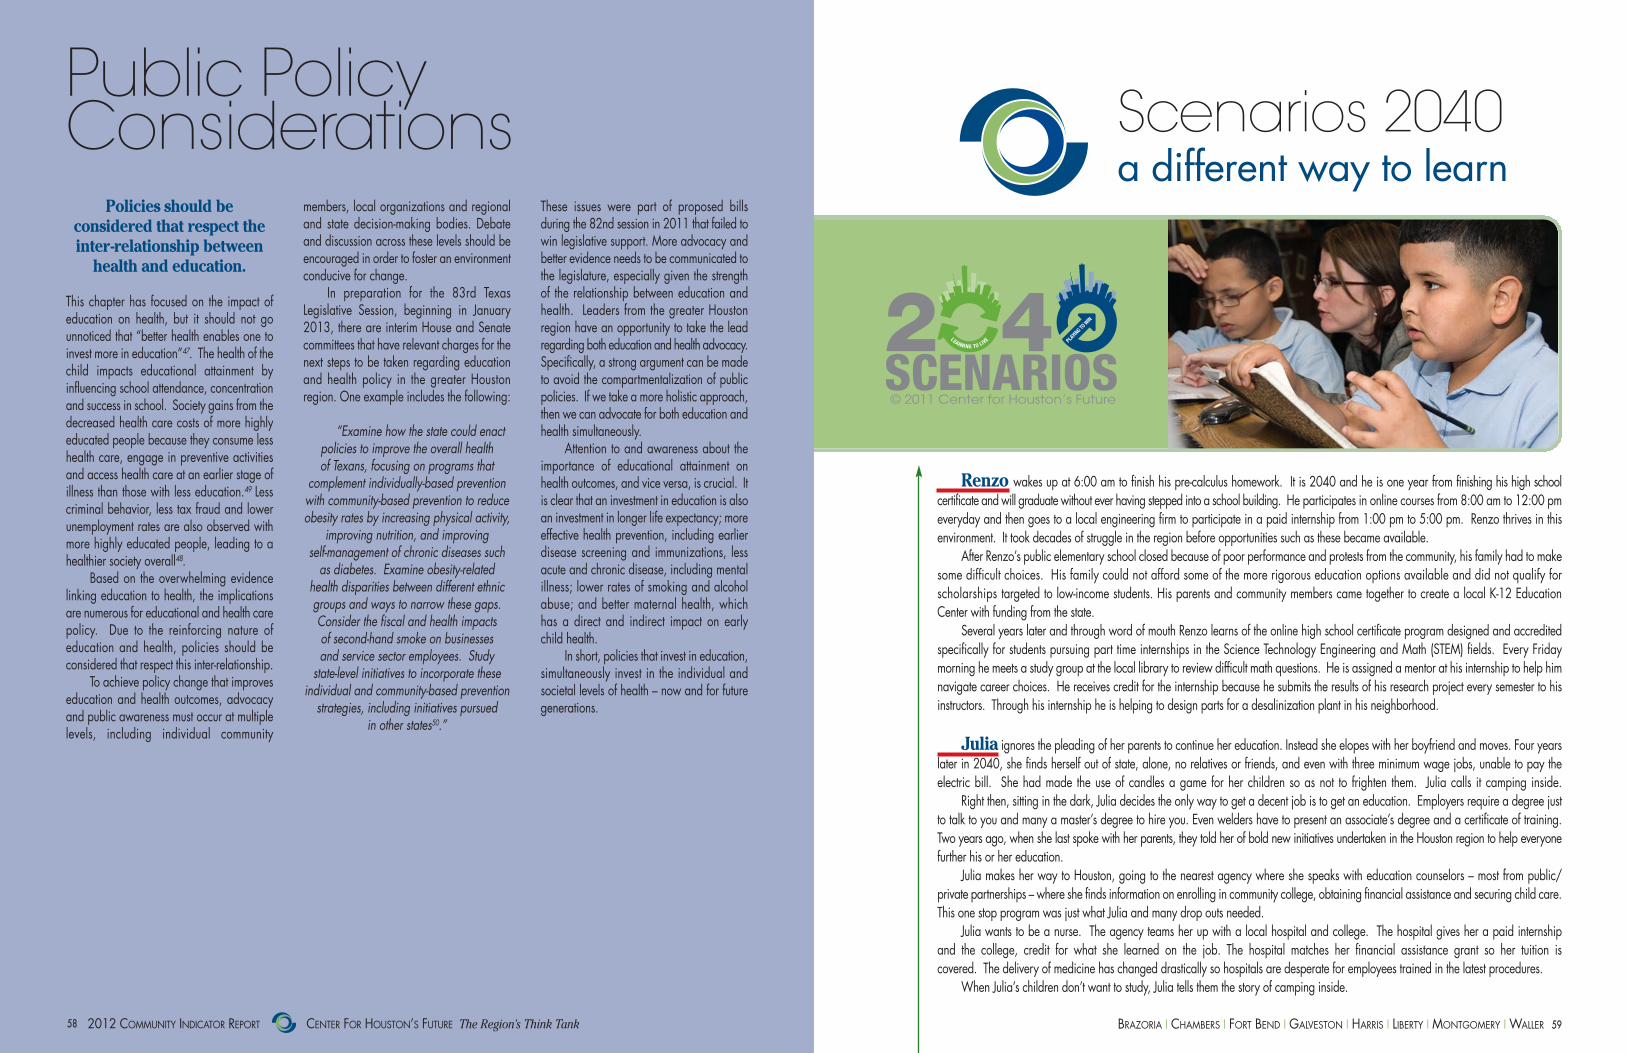
Policies should be considered that respect theinter-relationship between
health and education.
This chapter has focused on the impact of education on health, but it should not go unnoticed that “better health enables one toinvest more in education”47. The health of thechild impacts educational attainment by influencing school attendance, concentrationand success in school. Society gains from thedecreased health care costs of more highlyeducated people because they consume lesshealth care, engage in preventive activitiesand access health care at an earlier stage ofillness than those with less education.49 Lesscriminal behavior, less tax fraud and lowerunemployment rates are also observed withmore highly educated people, leading to ahealthier society overall48.
Based on the overwhelming evidencelinking education to health, the implicationsare numerous for educational and health carepolicy. Due to the reinforcing nature of education and health, policies should be considered that respect this inter-relationship.
To achieve policy change that improveseducation and health outcomes, advocacyand public awareness must occur at multiplelevels, including individual community
members, local organizations and regionaland state decision-making bodies. Debateand discussion across these levels should beencouraged in order to foster an environmentconducive for change.
In preparation for the 83rd Texas Legislative Session, beginning in January2013, there are interim House and Senatecommittees that have relevant charges for thenext steps to be taken regarding educationand health policy in the greater Houston region. One example includes the following:
“Examine how the state could enactpolicies to improve the overall health of Texans, focusing on programs that
complement individually-based preventionwith community-based prevention to reduceobesity rates by increasing physical activity,
improving nutrition, and improving self-management of chronic diseases suchas diabetes. Examine obesity-related
health disparities between different ethnicgroups and ways to narrow these gaps.Consider the fiscal and health impacts of second-hand smoke on businesses and service sector employees. Study state-level initiatives to incorporate these individual and community-based preventionstrategies, including initiatives pursued
in other states50.”
These issues were part of proposed bills during the 82nd session in 2011 that failed towin legislative support. More advocacy andbetter evidence needs to be communicated tothe legislature, especially given the strengthof the relationship between education andhealth. Leaders from the greater Houston region have an opportunity to take the leadregarding both education and health advocacy.Specifically, a strong argument can be madeto avoid the compartmentalization of publicpolicies. If we take a more holistic approach,then we can advocate for both education andhealth simultaneously.
Attention to and awareness about theimportance of educational attainment onhealth outcomes, and vice versa, is crucial. Itis clear that an investment in education is alsoan investment in longer life expectancy; moreeffective health prevention, including earlierdisease screening and immunizations, lessacute and chronic disease, including mentalillness; lower rates of smoking and alcoholabuse; and better maternal health, which has a direct and indirect impact on earlychild health.
In short, policies that invest in education,simultaneously invest in the individual and societal levels of health – now and for futuregenerations.
5599BRAZORIA � CHAMBERS � FORT BEND � GALVESTON � HARRIS � LIBERTY � MONTGOMERY � WALLER2012 COMMUNITY INDICATOR REPORT CENTER FOR HOUSTON’S FUTURE The Region’s Think Tank5588
Renzo wakes up at 6:00 am to finish his pre-calculus homework. It is 2040 and he is one year from finishing his high school certificate and will graduate without ever having stepped into a school building. He participates in online courses from 8:00 am to 12:00 pmeveryday and then goes to a local engineering firm to participate in a paid internship from 1:00 pm to 5:00 pm. Renzo thrives in this environment. It took decades of struggle in the region before opportunities such as these became available.
After Renzo’s public elementary school closed because of poor performance and protests from the community, his family had to makesome difficult choices. His family could not afford some of the more rigorous education options available and did not qualify forscholarships targeted to low-income students. His parents and community members came together to create a local K-12 Education Center with funding from the state.
Several years later and through word of mouth Renzo learns of the online high school certificate program designed and accreditedspecifically for students pursuing part time internships in the Science Technology Engineering and Math (STEM) fields. Every Friday morning he meets a study group at the local library to review difficult math questions. He is assigned a mentor at his internship to help himnavigate career choices. He receives credit for the internship because he submits the results of his research project every semester to hisinstructors. Through his internship he is helping to design parts for a desalinization plant in his neighborhood.
Julia ignores the pleading of her parents to continue her education. Instead she elopes with her boyfriend and moves. Four yearslater in 2040, she finds herself out of state, alone, no relatives or friends, and even with three minimum wage jobs, unable to pay the electric bill. She had made the use of candles a game for her children so as not to frighten them. Julia calls it camping inside.
Right then, sitting in the dark, Julia decides the only way to get a decent job is to get an education. Employers require a degree justto talk to you and many a master’s degree to hire you. Even welders have to present an associate’s degree and a certificate of training. Two years ago, when she last spoke with her parents, they told her of bold new initiatives undertaken in the Houston region to help everyonefurther his or her education.
Julia makes her way to Houston, going to the nearest agency where she speaks with education counselors – most from public/private partnerships – where she finds information on enrolling in community college, obtaining financial assistance and securing child care.This one stop program was just what Julia and many drop outs needed.
Julia wants to be a nurse. The agency teams her up with a local hospital and college. The hospital gives her a paid internship and the college, credit for what she learned on the job. The hospital matches her financial assistance grant so her tuition is covered. The delivery of medicine has changed drastically so hospitals are desperate for employees trained in the latest procedures.
When Julia’s children don’t want to study, Julia tells them the story of camping inside.
a different way to learn
LEARNING TO
LIVE PLAYIN
G TOWIN
© 2011 Center for Houston’s Future
Scenarios 2040Public Policy Considerations
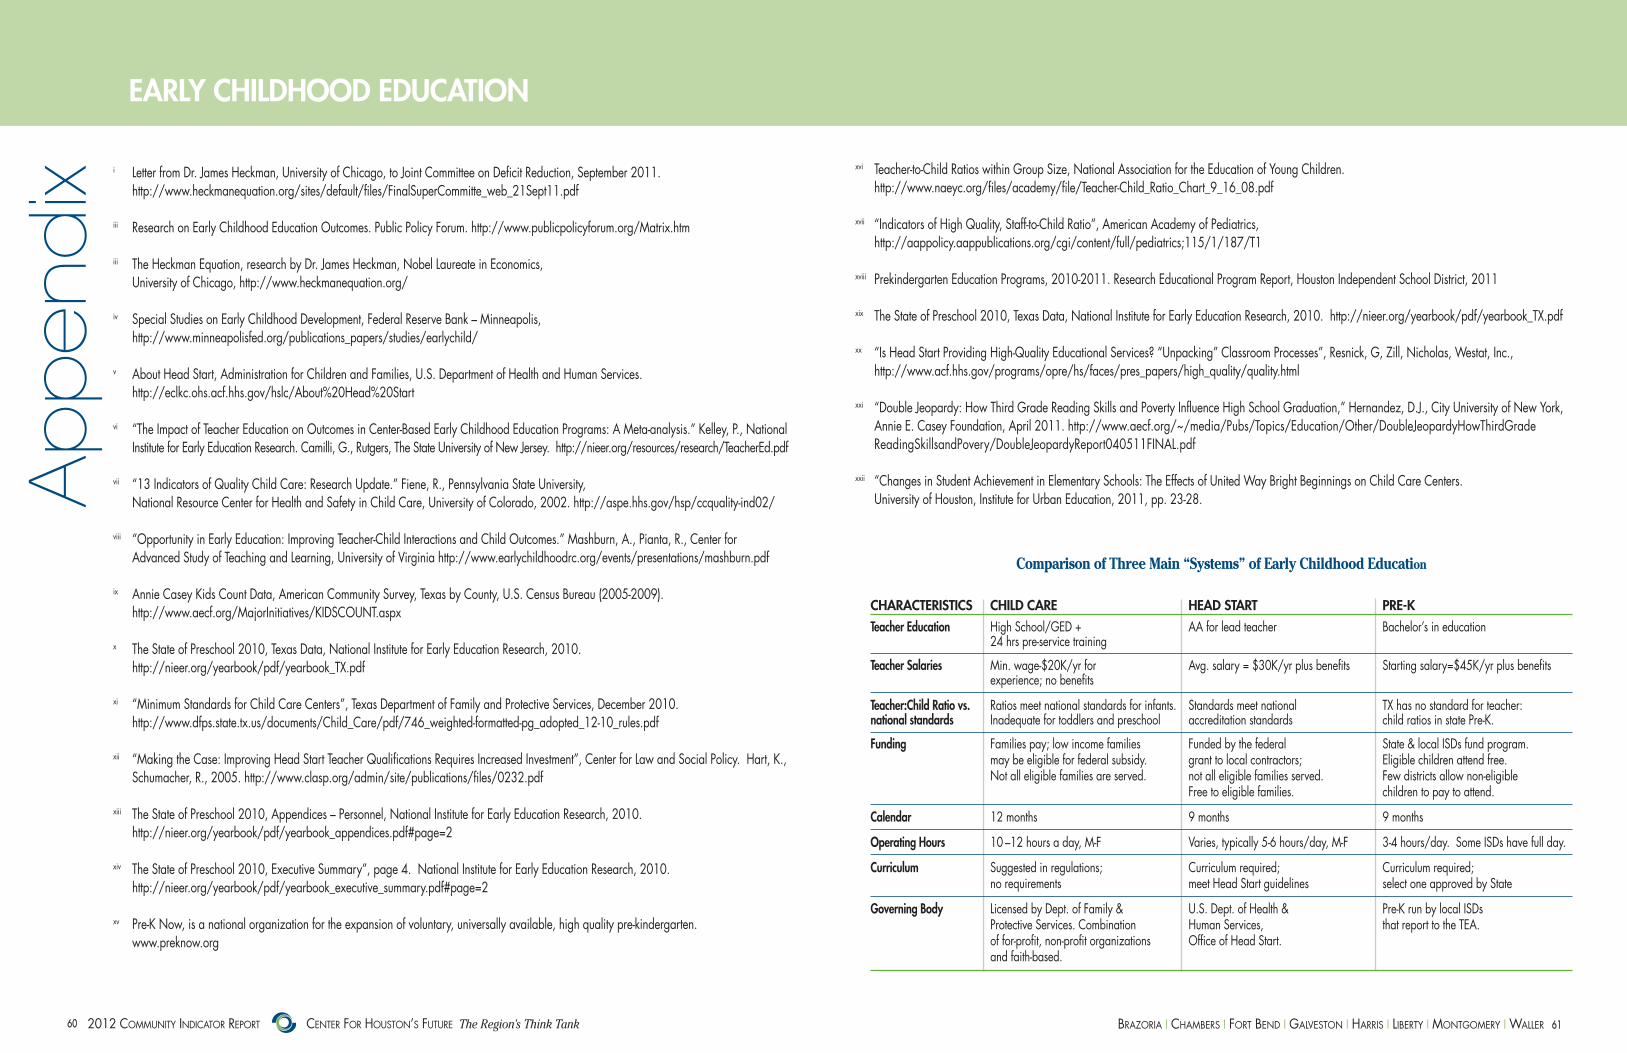
6611BRAZORIA � CHAMBERS � FORT BEND � GALVESTON � HARRIS � LIBERTY � MONTGOMERY � WALLER2012 COMMUNITY INDICATOR REPORT CENTER FOR HOUSTON’S FUTURE The Region’s Think Tank6600
EARLY CHILDHOOD EDUCATION
i Letter from Dr. James Heckman, University of Chicago, to Joint Committee on Deficit Reduction, September 2011. http://www.heckmanequation.org/sites/default/files/FinalSuperCommitte_web_21Sept11.pdf
iii Research on Early Childhood Education Outcomes. Public Policy Forum. http://www.publicpolicyforum.org/Matrix.htm
iii The Heckman Equation, research by Dr. James Heckman, Nobel Laureate in Economics, University of Chicago, http://www.heckmanequation.org/
iv Special Studies on Early Childhood Development, Federal Reserve Bank – Minneapolis, http://www.minneapolisfed.org/publications_papers/studies/earlychild/
v About Head Start, Administration for Children and Families, U.S. Department of Health and Human Services. http://eclkc.ohs.acf.hhs.gov/hslc/About%20Head%20Start
vi “The Impact of Teacher Education on Outcomes in Center-Based Early Childhood Education Programs: A Meta-analysis.” Kelley, P., National Institute for Early Education Research. Camilli, G., Rutgers, The State University of New Jersey. http://nieer.org/resources/research/TeacherEd.pdf
vii “13 Indicators of Quality Child Care: Research Update.” Fiene, R., Pennsylvania State University, National Resource Center for Health and Safety in Child Care, University of Colorado, 2002. http://aspe.hhs.gov/hsp/ccquality-ind02/
viii “Opportunity in Early Education: Improving Teacher-Child Interactions and Child Outcomes.” Mashburn, A., Pianta, R., Center for Advanced Study of Teaching and Learning, University of Virginia http://www.earlychildhoodrc.org/events/presentations/mashburn.pdf
ix Annie Casey Kids Count Data, American Community Survey, Texas by County, U.S. Census Bureau (2005-2009). http://www.aecf.org/MajorInitiatives/KIDSCOUNT.aspx
x The State of Preschool 2010, Texas Data, National Institute for Early Education Research, 2010. http://nieer.org/yearbook/pdf/yearbook_TX.pdf
xi “Minimum Standards for Child Care Centers”, Texas Department of Family and Protective Services, December 2010. http://www.dfps.state.tx.us/documents/Child_Care/pdf/746_weighted-formatted-pg_adopted_12-10_rules.pdf
xii “Making the Case: Improving Head Start Teacher Qualifications Requires Increased Investment”, Center for Law and Social Policy. Hart, K., Schumacher, R., 2005. http://www.clasp.org/admin/site/publications/files/0232.pdf
xiii The State of Preschool 2010, Appendices – Personnel, National Institute for Early Education Research, 2010. http://nieer.org/yearbook/pdf/yearbook_appendices.pdf#page=2
xiv The State of Preschool 2010, Executive Summary”, page 4. National Institute for Early Education Research, 2010. http://nieer.org/yearbook/pdf/yearbook_executive_summary.pdf#page=2
xv Pre-K Now, is a national organization for the expansion of voluntary, universally available, high quality pre-kindergarten. www.preknow.org
xvi Teacher-to-Child Ratios within Group Size, National Association for the Education of Young Children. http://www.naeyc.org/files/academy/file/Teacher-Child_Ratio_Chart_9_16_08.pdf
xvii “Indicators of High Quality, Staff-to-Child Ratio”, American Academy of Pediatrics, http://aappolicy.aappublications.org/cgi/content/full/pediatrics;115/1/187/T1
xviii Prekindergarten Education Programs, 2010-2011. Research Educational Program Report, Houston Independent School District, 2011
xix The State of Preschool 2010, Texas Data, National Institute for Early Education Research, 2010. http://nieer.org/yearbook/pdf/yearbook_TX.pdf
xx “Is Head Start Providing High-Quality Educational Services? “Unpacking” Classroom Processes”, Resnick, G, Zill, Nicholas, Westat, Inc., http://www.acf.hhs.gov/programs/opre/hs/faces/pres_papers/high_quality/quality.html
xxi “Double Jeopardy: How Third Grade Reading Skills and Poverty Influence High School Graduation,” Hernandez, D.J., City University of New York, Annie E. Casey Foundation, April 2011. http://www.aecf.org/~/media/Pubs/Topics/Education/Other/DoubleJeopardyHowThirdGradeReadingSkillsandPovery/DoubleJeopardyReport040511FINAL.pdf
xxii “Changes in Student Achievement in Elementary Schools: The Effects of United Way Bright Beginnings on Child Care Centers. University of Houston, Institute for Urban Education, 2011, pp. 23-28.A
ppendix
Comparison of Three Main “Systems” of Early Childhood Education
CHARACTERISTICS CHILD CARE HEAD START PRE-K
Teacher Education High School/GED + AA for lead teacher Bachelor’s in education24 hrs pre-service training
Teacher Salaries Min. wage-$20K/yr for Avg. salary = $30K/yr plus benefits Starting salary=$45K/yr plus benefitsexperience; no benefits
Teacher:Child Ratio vs. Ratios meet national standards for infants. Standards meet national TX has no standard for teacher:national standards Inadequate for toddlers and preschool accreditation standards child ratios in state Pre-K.
Funding Families pay; low income families Funded by the federal State & local ISDs fund program.may be eligible for federal subsidy. grant to local contractors; Eligible children attend free.Not all eligible families are served. not all eligible families served. Few districts allow non-eligible
Free to eligible families. children to pay to attend.
Calendar 12 months 9 months 9 months
Operating Hours 10 –12 hours a day, M-F Varies, typically 5-6 hours/day, M-F 3-4 hours/day. Some ISDs have full day.
Curriculum Suggested in regulations; Curriculum required; Curriculum required; no requirements meet Head Start guidelines select one approved by State
Governing Body Licensed by Dept. of Family & U.S. Dept. of Health & Pre-K run by local ISDsProtective Services. Combination Human Services, that report to the TEA. of for-profit, non-profit organizations Office of Head Start.and faith-based.

6633BRAZORIA � CHAMBERS � FORT BEND � GALVESTON � HARRIS � LIBERTY � MONTGOMERY � WALLER2012 COMMUNITY INDICATOR REPORT CENTER FOR HOUSTON’S FUTURE The Region’s Think Tank6622
1 Information Request, Texas Education Agency. CHILDREN AT RISK analysis.2 Taylor, Lori et al. (2009). The ABCDs of Texas Education: Assessing the Benefits and Costs of Reducing the Dropout Rate.
The Bush School of Government and Public Service. Available at http://bush.tamu.edu/research/capstones/mpsa/projects/2009/TheABCDs.pdf. Accessed August 26, 2010.
3 Murdock, Steve; Zey, Mary; Cline, Michael E.; and Klineberg, Stephen. (2010). “Poverty, Educational Attainment and Health Among America’s Children: Current and Future Effects of Population Diversification and Associated Socioeconomic Change,” Journal of Applied Research on Children: Vol. 1: Iss. 1, Article 2. Available at: http://digitalcommons.library.tmc.edu/childrenatrisk/vol1/iss1/2.
4 Texas Education Agency. (2011). PEIMS Standard Reports. Available at http://ritter.tea.state.tx.us/adhocrpt/Standard_Reports.html. Accessed June 17, 2011.
5 Foley, Ellen; Mishook, Jacob; Thompson, Joanne; Kubiak, Michael; Supovitz, Jonathan; and Rhude-Faust, Mary Kaye. (2010). “Beyond Test Scores: Leading Indicators for Education. Providence, RI: Annenberg Institute for School Reform at Brown University. Available at: http://www.annenberginstitute.org/products/LeadingIndicators.php. Accessed March 2, 2011.
6 Musen, Lindsey. (2010). Early Reading Proficiency. Providence, RI: Annenberg Institute for School Reform at Brown University. http://www.annenberginstitute.org/products/LeadingIndicators.php. Accessed March 2, 2011.
7 Lesnick, Joy; Goerge, Robert; Smithgall, Cherly; and Gwynne, Julia. (2010). Reading on Grade Level in Third Grade: How is It Related to High School Performance and College Enrollment? Chicago: Chapin Hall at the University of Chicago.
8 Hernandez, Donald. (2011). Double Jeopardy: How Third-Grade Reading Skills and Poverty Influence High School Graduation.The Annie E. Casey Foundation. Available at: http://www.aecf.org/KnowledgeCenter/Publications.aspx?pubguid={D4DBAD77-DE2E-4FAE-B443-A9AEEBBC6E35}. Accessed April 29, 2011.
9 Note: The term significant here is used to mean statistically significant (p<.05), while the comparison countries performing ‘at the same level’ demonstrated no statistically significant difference on this indicator. International Association for the Evaluation of Educational Achievement (IEA), Trends in International Mathematics and Science Study (TIMSS), 2007.
10 Walston, Jull and McCarroll, Jill Carlivati. (2010). Eighth-Grade Algebra: Findings from the Eighth-Grade Round of the Early Childhood Longitudinal Study, Kindergarten Class of 1998-99 (ECLS-K).Washington, D.C.: National Center for Education Statistics, Institute of Education Sciences, U.S. Department of Education.
11 America’s High School Graduates 2009.12 Walston, Jull and McCarroll, Jill Carlivati. (2010). Eighth-Grade Algebra: Findings from the Eighth-Grade Round of the Early Childhood
Longitudinal Study, Kindergarten Class of 1998-99 (ECLS-K).Washington, D.C.: National Center for Education Statistics, Institute of Education Sciences, U.S. Department of Education.
13 Wiley, Andrew; Wyatt, Jeffrey; and Camara, Wayne J. (2010). The Development of a Multidimensional College Readiness Index. College Board.14 Gullikson, Glen. (2011). The Forgotten Middle: Ensuring that All Students are on Target for College and Career Readiness before
High School. ACT Southwest Region. PowerPoint Presentation.15 Hargrove, Linda; Godin, Donn; and Dodd, Barbara. (2008). College Outcomes Comparisons by AP® and Non-AP High School Experiences.
New York, New York: The College Board.16 Foley, Ellen; Mishook, Jacob; Thompson, Joanne; Kubiak, Michael; Supovitz, Jonathan; and Rhude-Faust, Mary Kaye. (2010). Beyond Test
Scores: Leading Indicators for Education. Providence, RI: Annenberg Institute for School Reform at Brown University. Available at: http://www.annenberginstitute.org/products/LeadingIndicators.php. Accessed March 2, 2011.
17 Roderick, Melissa. (1994). “Grade Retention and School Dropout: Investigating the Association.” American Educational Research Journal.31(4):729-759.
18 Bureau of Labor Statistics, United States Department of Labor. Employment status of the civilian noninstitutional population 25 years and over by educational attainment, sex, race, and Hispanic or Latino ethnicity. Available at http://www.bls.gov/cps/cpsaat7.pdf. Accessed July 15, 2011.
19 U.S. Census Bureau, “2006-2008 American Community Survey 3-Year Estimates: Harris County, Texas,” Educational Attainment, 2008. <http://factfinder.census.gov/servlet/STTable?_bm=y&-geo_id=05000US48201&-qr_name=ACS_2008_3YR_G00_S1501&-ds_name= ACS_2008_3YR_G00_&-_lang=en&-redoLog=false> (Accessed June 2010).
20 Ibid.
DISTRICT NAME COUNTY PERCENT PERCENT OF PERCENT OF TOTALOF THIRD GRADERS GRADUATES OPERATING
ECONOMICALLY READING AT TAKING THE EXPENDITURE-DISADVANTAGED COMMENDED LEVEL SAT/ACT PER PUPIL
(2010) (2010) (2009) (2009)Aldine Isd Harris 85 41 52 8658Alief Isd Harris 79 38 59 8437Alvin Isd Brazoria 52 47 41 8151Anahuac Isd Chambers 50 45 73 9915Angleton Isd Brazoria 56 48 46 7824Barbers Hill Isd Chambers 22 61 54 12506Brazosport Isd Brazoria 57 50 47 7663Channelview Isd Harris 77 40 53 8102Clear Creek Isd Galveston 23 57 69 8186Cleveland Isd Liberty 73 25 61 8227Columbia-Brazoria Isd Brazoria 50 43 42 7622Conroe Isd Montgomery 36 55 67 7273Crosby Isd Harris 47 34 57 7129Cypress-Fairbanks Isd Harris 43 52 63 7058Damon Isd Brazoria 73 44 . 9729Danbury Isd Brazoria 30 51 43 8831Dayton Isd Liberty 57 37 40 7771Deer Park Isd Harris 42 50 40 15640Devers Isd Liberty 51 64 . 17848Dickinson Isd Galveston 60 39 44 7883East Chambers Isd Chambers 53 44 59 8748Fort Bend Isd Fort Bend 35 54 82 7863Friendswood Isd Galveston 6 66 79 7031Galena Park Isd Harris 77 42 41 8763Galveston Isd Galveston 69 38 54 13464Goose Creek Cisd Harris 63 42 33 8986Hardin Isd Liberty 57 24 51 8888Hempstead Isd Waller 73 37 59 9928High Island Isd Galveston 72 14 83 22221Hitchcock Isd Galveston 78 23 54 13314Houston Isd Harris 80 44 67 9231Huffman Isd Harris 34 42 50 7218Hull-Daisetta Isd Liberty 73 39 39 15267Humble Isd Harris 33 48 69 7490Katy Isd Harris 29 64 75 7740Kendleton Isd Fort Bend 95 14 . 15985Klein Isd Harris 36 52 68 7655La Marque Isd Galveston 74 38 57 9593La Porte Isd Harris 45 50 . 9403Lamar Cisd Fort Bend 48 55 60 8109Liberty Isd Liberty 63 38 49 9853Magnolia Isd Montgomery 40 48 56 7788Montgomery Isd Montgomery 26 65 68 8271Needville Isd Fort Bend 34 47 63 7632New Caney Isd Montgomery 61 42 48 7847North Forest Isd Harris 100 32 75 8872Pasadena Isd Harris 79 41 40 8458Pearland Isd Brazoria 25 62 61 7373Royal Isd Waller 81 36 53 9121Santa Fe Isd Galveston 33 58 42 7994Sheldon Isd Harris 78 31 46 9279Splendora Isd Montgomery 62 41 33 7817Spring Branch Isd Harris 57 45 84 8978Spring Isd Harris 68 39 56 8304Stafford Msd Fort Bend 59 41 72 7930Sweeny Isd Brazoria 47 57 44 9043Tarkington Isd Liberty 44 31 48 7432Texas City Isd Galveston 62 39 38 8921Tomball Isd Harris 24 55 61 7838Waller Isd Waller 60 45 65 8326Willis Isd Montgomery 58 48 52 7708
*Includes Non-Charter School Districts In The Eight-County Houston Region. Source: Texas Education Agency
Table: School District* Data for Select K-12 Indicators
K–12
21 Texas Department of Criminal Justice. (2011). Statistical Report Fiscal Year 2010. Available at http://www.tdcj.state.tx.us/publications/publications-home.htm. Accessed July 15, 2011.
22 Note: states are ranked from 1 to 51 (including the Washington, D.C.), with 1 spending the most per pupil. Children’s Defense Fund. (2011). The State of America’s Children 2011. Available at http://www.childrensdefense.org/child-research-data-publications/data/state-of-americas-children-2011-report.html. Accessed July 18, 2011.
23 Note: This figure excludes debt service and capital outlay. Texas Education Agency. (2011). Academic Excellence Indicator System 2009-10.
24 Taylor, Lori et al. (2009). The ABCDs of Texas Education: Assessing the Benefits and Costs of Reducing the Dropout Rate.The Bush School of Government and Public Service. Available at http://bush.tamu.edu/research/capstones/mpsa/projects/2009/TheABCDs.pdf. Accessed August 26, 2010.
25 Texas Education Agency. Academic Excellence Indicator System 2010-11.
26 This statistic is reported for the English examination only.Texas Education Agency. Student Assessment: TAKS Region, District, and Campus Level Data Files (2011). CHILDREN AT RISK Analysis.
27 Murdock et al. (2010).28 Sass, Tim R., Jane Hannaway, Zeyu Xu, David N. Figlio, and
Li Feng (2010), Value-Added of Teachers in High-Poverty Schools and Lower-Poverty Schools. Washington, D.C.: The National Center for the Analysis of Longitudinal Data in Education Research, The Urban Institute.
29 Massachusetts Expanded Learning Time Initiative (2010), More Time for Learning: Promising Practices and Lessons Learned.Boston: Massachusetts 2020.
30 Hope for Urban Education: A Study of Nine High-Performing, High-Poverty, Urban Elementary Schools (1999). Austin: Charles A. Dana Center, University of Texas, U.S. Department of Education.
Appendix

6655BRAZORIA � CHAMBERS � FORT BEND � GALVESTON � HARRIS � LIBERTY � MONTGOMERY � WALLER2012 COMMUNITY INDICATOR REPORT CENTER FOR HOUSTON’S FUTURE The Region’s Think Tank6644
REFERENCES
Achieving the Dream. (2011). Promising practices: 2011 leader colleges. Retrieved October 17, 2011, from http://www.achievingthedream.org/Portal/Modules/f22fb33e-8ac2-4e4c-82d9-b0976a9e7d26.asset
All Kids Alliance. (2010). All kids alliance 2010 report. Retrieved July 1, 2011, from http://www.allkidsalliance.com/reports.htm
Bailey, T. (2008). Challenge and opportunity: Rethinking the role and function of developmental education in community college.CCRC Working Paper No.14. NY: Community College Research Center, Columbia University.
Baum, S., Ma, J., & Payea, K. (2010). Education pays 2010. VA: College Board.
Bowen, W., & Bok, D. (1998). The shape of the river: Long-term consequences of considering race in college and university admissions.NJ: Princeton University Press.
Carnevale, A., Smith, N., & Strohl, J. (2010). Help wanted: Projections of jobs and education requirements through 2018.VA: Center on Education and the Workforce, Georgetown University.
College for All Texans. (2011). College costs-2011-2012-All institutions. Retrieved July 1, 2011, http://www.collegeforalltexans.com/apps/collegecosts.cfm
Dana Center. (2007). The cost of developmental education in Texas. TX: University of Texas at Austin. Retrieved July 1, 2011, from http://www.lbb.state.tx.us/Higher_Education/Cost_Developmental_Ed_TX_0407.pdf
Federal Reserve Bank of St. Louis. (2010). Many moving parts: A look inside the U.S. labor market. Retrieved July 1, 2011, from http://www.stlouisfed.org/publications/ar/2010/pages/ar10_2c.cfm
FSG Social Impact Consultants. (2011). Gulf coast regional overview. Boston: Author.
Goldsmith, B. (2011, May 10). Houston competes for $1M ‘talent dividend.’ Houston Business Journal. Retrieved October 16, 2011, from http://www.bizjournals.com/houston/news/2011/05/10/houston-competes-for-1m-talent.html
Greater Houston Partnership. (2009). Economic development. Retrieved July 1, 2011, from http://www.houston.org/economic-development/facts-figures/index.aspx
Miller, J. (2010). America’s most literate cities. CT: Central Connecticut State University. Retrieved July 1, 2011, from http://www.ccsu.edu/page.cfm?p=8227
National Center for Higher Education Management Systems. (2009). Turning data into information. Retrieved July 1, 2011, from http://www.higheredinfo.org/
Texas Comptroller of Public Accounts. (n.d.). Texas in focus: Gulf coast region. Retrieved July 1, 2011, from http://www.window.state.tx.us/specialrpt/tif/gulf/education.php
Texas Workforce Investment Council. (2010). Texas index 2010. Retrieved July 1, 2011, from http://governor.state.tx.us/files/twic/2010_Texas_Index.pdf
Texas Higher Education Coordinating Board (n.d.). Gulf coast region enrollment-community and technical colleges. Retrieved July 1, 2011, from www.thecb.state.tx.us/download.cfm?downloadfile=AF473E68-05D4-B72A-17A8035FF2FBE326&typename=dmF...
Texas Higher Education Coordinating Board. (n.d.a.) Higher education accountability system. Retrieved September 2, 2011, from http://www.txhighereddata.org/Interactive/Accountability/default.cfm?CFID=3053016&CFTOKEN=7b03cc870d487f8d-2AC1AE2C-A0D6-5BEC-4D51C8DDC4DAB667
Texas Higher Education Coordinating Board. (2000). Closing the gaps: The Texas higher education plan. Retrieved July 1, 2011, fromhttp://www.thecb.state.tx.us/reports/PDF/0379.PDF?CFID=18046495&CFTOKEN=80012026
Texas Higher Education Coordinating Board. (2009). Funding Texas higher education: Presentation for the house appropriations subcommittee on education.TX: Author. Retrieved September 2, 2011, from http://www.thecb.state.tx.us/reports/PDF/1744.PDF?CFID=18046495&CFTOKEN=80012026
Texas Higher Education Coordinating Board. (2010). Fall 2010 headcount. TX: author. Retrieved September 2, 2011, from http://www.tacc.org/documents/EnrollFa10_CB.pdf
Texas Higher Education Coordinating Board. (2010a). Formula funding recommendations, 2012-2013 biennium. TX: author. Retrieved July 1,2011, from http://www.thecb.state.tx.us/reports/PDF/2020.PDF?CFID=18046495&CFTOKEN=80012026
1 FSG Social Impact Consultants (2011).2 United States Department of Labor, Bureau of Labor Statistics, Current Population Survey (2010). 3 Bowen and Bok (1998); Carnevale, Smith, and Strohl (2010); Texas Higher Education Coordinating Board (2000).4 National Center for Higher Education Management Systems (2009).5 Goldsmith (2011, May 10). 6 FSG Social Impact Consultants (2011).7 Baum, Ma, and Payea (2010).8 Baum, Ma, and Payea (2010).9 Houston-Galveston Area Council10 Miller (2010).11 For example, All Kids Alliance (2010); Texas Higher Education Coordinating Board (2000).12 Texas Comptroller of Public Accounts (n.d.).13 Greater Houston Partnership (2009).14 U. S. Department of Education Institute of Education Sciences (n.d.).15 Texas Higher Education Coordinating Board (n.d.); Texas Higher Education Coordinating Board (2010). Author’s calculations.16 Texas Higher Education Coordinating Board (2011c). Author’s calculations.17 Texas Tuition Promise Fund (n.d.).18 College for All Texans (2011). 19 National Center for Higher Education Management Systems (2009).20 National Center for Higher Education Management Systems (2009).21 Texas Higher Education Coordinating Board (2010).22 Texas Higher Education Coordinating Board (2009).23 Texas Higher Education Coordinating Board (2011a). Author’s calculations.24 Texas Higher Education Coordinating Board (2011b).
Note: Inclusion conditional on enrolling 12 or more semester credit hours in first semester. 25 Texas Higher Education Coordinating Board (2011b). Author’s calculations.
Note: Inclusion conditional on enrolling 12 or more semester credit hours in first semester. 26 Achieving the Dream (2011).27 Greater Texas Foundation (2011, p. 19).
Texas Higher Education Coordinating Board. (2011*). Annual data profile. Austin, TX: author.
Texas Higher Education Coordinating Board. (2011). Automated student and adult learner follow-up system (academic years 2005-2006 through2008-2009). Retrieved July 1, 2011, from http://www.txhighereddata.org/reports/performance/ctcasalf/
Texas Higher Education Coordinating Board. (2011a). Developmental education accountability measures. Retrieved July 1, 2011, from http://www.txhighereddata.org/reports/performance/deved/
Texas Higher Education Coordinating Board. (2011b). Baccalaureate/Associate’s graduation rates. Retrieved July 1, 2011, from http://www.txhigh-ereddata.org/Interactive/GradRates.cfm#BTWO
Texas Higher Education Coordinating Board. (2011c). First-time undergraduate applicant, acceptance, and enrollment information.Retrieved July 1, 2011, from http://www.txhighereddata.org/Interactive/AppAccEnr.cfm
Texas P-16 Public Education Information Resource. (2011). High school graduates enrolled in higher education – by education service center region.Retrieved July 1, 2011, from http://www.texaseducationinfo.org/tea.tpeir.web/Picklist.aspx?Page=Region&ReportName=tpeir_cra_grad_enroll_region&PickList=School+Year&Title=High+School+Graduates+Enrolled+in+Higher+Education+-+by+Education+Service+Center+Region&Graph=N
Texas Tuition Promise Fund. (n.d.). Cost of college. TX: Texas Comptroller of Public Accounts. Retrieved October 16, 2011, from https://www.texastuitionpromisefund.com/OFI529/PN/generated/en_us/PrimaryNavigation_07-09-08-173626.xml
U. S. Department of Education. (2010). Official cohort default rate search for postsecondary schools fiscal years 2008, 2007, and 2006.Retrieved July 1, 2011, from http://www.nslds.ed.gov/nslds_SA/defaultmanagement/search_cohort.cfm
U. S. Department of Education Institute for Education Sciences. (n.d.). Integrated postsecondary education data system. Retrieved July 1, 2011, from http://nces.ed.gov/ipeds/datacenter/
U. S. Department of Labor. (2010). Employment projections. Retrieved August 23, 2011, from http://www.bls.gov/emp/ep_chart_001.htm
WORKFORCE PREPAREDNESSAppendix

6677BRAZORIA � CHAMBERS � FORT BEND � GALVESTON � HARRIS � LIBERTY � MONTGOMERY � WALLER2012 COMMUNITY INDICATOR REPORT CENTER FOR HOUSTON’S FUTURE The Region’s Think Tank6666
REFERENCES
1 Federal Reserve Bank of St. Louis. 2011. Which Came First—Better Education or Better Health? The RegionalEconomist. http://www.stlouisfed.org/publications/re/articles/?id=2092. Retrieved September 6, 2011.
2 National Vital Statistics Report. 2007. The mortality rate for American males with less than a high school education, between 25 and 64 years was 665.2 per 100,000 deaths versus 238.9 for males with some college or higher. Reported in the Federal Reserve Bank of St. Louis (2011) report.
3 World Health Organization. http://www.who.int/social_determinants/en/. Retrieved July 13th, 2011.4 Dahlgren G, Whitehead M. (2006). Levelling up (part 2): A discussion paper on European strategies for tackling social inequities in health.
Copenhagen: WHO Regional Office for Europe. http://www.euro.who.int/document/e89384.pdf. Retrieved September 15, 2011.5 Groot, Wim and Maassen van den Brink, Henriette. 2006. What does education do to our health? Measuring the Effects
of Education on Health and Civic Engagement: Proceedings of the Copenhagen Symposium, OECD. p. 358.6 Groot and Maassen van den Brink. 2006., p. 359.7 Groot and Maassen van den Brink. 2006., p. 362.8 Bush School of Government and Public Service. 2005. A Cost Benefit Analysis of Universally Accessible Prekindergarten
Education in Texas. College Station, TX: Texas A&M University9 Egerter S., Braveman P., Sadegh-Nobari T., et al. 2009. Education Matters For Health. Washington, DC: Robert Wood
Johnson Foundation to Build a Healthier America10 Groot and Maassen van den Brink, 2006. p. 36111 The 2011 HHS Poverty Guidelines. 2011 http://aspe.hhs.gov/poverty/11poverty.shtml Federal Poverty Level for a family
of 4 is annual income $22,350 or less. Retrieved September 15, 2011.12 Meara, E.R., Richards, S., and Cutler, D. 2008. The Gap Gets Bigger: Changes in Mortality and Life Expectancy, By Education, 1981 – 2000.
Health Affairs. 27 (2): 350-360. http://content.healthaffairs.org/content/27/2/350.abstract. Retrieved September 12, 2011.13 Meara, Richards and Cutler. 2008.14 National Vital Statistics Report. 2007. The mortality rate for American males with less than a high school education, between 25 and 64 years was
665.2 per 100,000 deaths versus 238.9 for males with some college or higher. Reported in the Federal Reserve Bank of St. Louis (2011) report.15 Robert Wood Johnson Foundation. 2010. Commission to Build a Healthier America. Education and Health Calculator.
http://www.commissiononhealth.org/Calculator.aspx. Retrieved July 13th, 201116 Robert Wood Johnson Foundation. 2008. Commission to Build a Healthier America. 2000-2002 Period Linked Birth/Infant Death Data Set.
Prepared for the RWJF Commission to Build a Healthier America by the Center on Social Disparities in Health at the University of California, San Francisco. http://www.commissiononhealth.org/PDF/tab6_78.pdf. Retrieved September 15, 2011
17 American Cancer Society. Cancer Facts & Figures 2011.http://www.cancer.org/acs/groups/content/@epidemiologysurveilance/documents/document/acspc-029771.pdf. Retrieved September 15, 2011.
18 American Cancer Society. Cancer Facts & Figures 2011. http://www.cancer.org/acs/groups/content/@epidemiologysurveilance/documents/document/acspc-029771.pdf. Retrieved September 15, 2011.
19 Centers for Disease Control and Prevention. 2009. Leading Causes of Death. http://www.cdc.gov/nchs/fastats/lcod.htm.Retrieved September 15, 2011.
20 Texas Department of State Health Services, Behavioral Risk Factor Surveillance (BRFSS): Data Table Lookup.http://www.dshs.state.tx.us/chs/brfss/, Retrieved September 8, 2011
21 Code Red: The Critical Condition of Health in Texas, 2008 www.coderedtexas.org. Retrieved September 15, 2011. p.13622 Cutler D.M. and Lleras-Muney A. 2006. Education and health: evaluating theories and evidence. NBER working paper
No. W12352. Cambridge, MA: National Bureau of Economic Research.23 Mezuk B, Eaton WW, Golden SH, Ding Y. 2008. “The influence of educational attainment on depression and risk of type
2 diabetes.” Am J Public Health. 98(8):1480-5.24 Mezuk, Eaton, Golden and Ding. 2008
25 Schnittker J. 2004. “Education and the Changing Shape of the Income Gradient in Health.” Journal of Health and Socical Behavior. Vol 45: 286-305.26 Winkleby MA, Jatulis DE, Frank E, and Fortmann SP. 1992. “Socioeconomic status and health: how education, income,
and occupation contribute to risk factors for cardiovascular disease.” Am J Public Health. 82 (6): 816-820.27 Kimbro R., Bzostek S., Goldman N., and Rodriguez G. 2008. Race, Ethnicity, and the Education Gradient in Health. Health Affairs. 27(2): 361-372.28 Schnittker J. 2004. Education and the Changing Shape of the Income Gradient in Health. Journal of Health and Social Behavior. Vol 45: 286-305.29 Texas Department of State Health Services, Behavioral Risk Factor Surveillance (BRFSS): Data Table Lookup.
http://www.dshs.state.tx.us/chs/brfss/, Retrieved September 8, 201130 Texas Department of State Health Services, Behavioral Risk Factor Surveillance (BRFSS): Data Table Lookup.
http://www.dshs.state.tx.us/chs/brfss/, Retrieved September 8, 201131 Drewnowski, A. (2009), Obesity, diets, and social inequalities. Nutrition Reviews, 67: S36–S39.32 Texas Department of State Health Services, Behavioral Risk Factor Surveillance (BRFSS): Data Table Lookup.
http://www.dshs.state.tx.us/chs/brfss/, Retrieved September 8, 201133 Texas Department of State Health Services, Behavioral Risk Factor Surveillance (BRFSS): Data Table Lookup.
http://www.dshs.state.tx.us/chs/brfss/, Retrieved September 8, 201134 Groot and Maassen van den Brink. 2006., p. 360.35 Texas Department of State Health Services, Behavioral Risk Factor Surveillance (BRFSS): Data Table Lookup.
http://www.dshs.state.tx.us/chs/brfss/, Retrieved September 8, 201136 Texas Department of State Health Services. 2008. Texas Health Data, Birth to Texas Residents.37 Texas Department of State Health Services, Birth Data: Data Table Lookup. http://soupfin.tdh.state.tx.us/birth05.htm. September 6, 201138 Texas Department of State Health Services, Birth Data: Data Table Lookup. http://soupfin.tdh.state.tx.us/birth05.htm. September 6, 201139 Centers for Disease Control and Prevention. 2007. National Vital Statistics Report.
http://www.cdc.gov/nchs/data/nvsr/nvsr55/nvsr55_14.pdf. Retrieved August 11, 2011.40 Currie J. and Moretti E. 2003. “Mother's Education and the Intergenerational Transmission of Human Capital: Evidence
from College Openings.” Quarterly Journal of Economics. VCXVII 4, 1495-1532.41 Currie and Moretti. 2003.42 Robert Wood Johnson Foundation. 2008. Commission to Build a Healthier America. Issue Brief 1: Early Childhood
Experiences and Health. http://www.rwjf.org/files/research/commissionearlychildhood062008.pdf. Retrieved September 16, 2011.43 Robert Wood Johnson Foundation. 2008. Issue Brief 144 Robert Wood Johnson Foundation. 2008. New State-by-State Report Finds Shortfalls in Children’s Health Tied to
Parents’ Income and Education. Washington, DC.45 Robert Wood Johnson Foundation. 2008. Issue Brief 146 Robert Wood Johnson Foundation. 2008. Commission to Build a Better America. America’s Health Starts with Healthy
Children: How do States Compare? October 2008.http://www.commissiononhealth.org/Documents/ChildrensHealth_Chartbook.pdf. Retrieved September 16, 2011
47 Groot and Maassen van den Brink. 2006. p. 355.48 Groot and Maassen ven den Brink. 2006. p. 36149 Groot and Maassen ven den Brink. 2006. p. 362.50 The Institute for Health Policy. 2011. The University of Texas School of Public Health. Personal communication with
the Interim Director, Dr. Stephen H. Linder, September 15, 2011.
EDUCATION AND HEALTHAppendix
Stanford and Joan Alexander FoundationAllegiance Bank Texas/The Stewart Organization
Allen Boone Humphries Robinson LLPAmegy Bank of Texas
Anadarko Petroleum CorporationAndrews Kurth, LLP
Asia Chemical CorporationAT&T
Bank of AmericaDan Bellow
Bracewell & Giuliani, LLPBrown Foundation
Philip and Alice BurguieresCamden Property Trust
CenterPoint EnergyChevron
Citizens for Affordable EnergyComerica Charitable FoundationCommunity Health Choice, Inc.
ConocoPhillips CompanyPhil and Suzie Conway
Rufus and Yvonne CormierDannenbaum Engineering Corporation
William DeLaneyCharles Duncan, Jr. El Paso Corporation
Jenny and Jim Elkins Family FundEnergy XXI
Everett Family FundExxon Mobil Corporation
Larry and Mary Ann FaulknerFederal Reserve Bank of Dallas - Houston
Fondren FoundationDoug and Sarah FosheeKelly and Carmela Frels
Frost National BankFulbright & Jaworski L.L.P.
Harry Gee, Jr. & Associates/MaloneBailey, LLPGeneration Park/McCord Development Corporation, Inc.
GenslerGreenberg Traurig, LLP
Grijalva & Allen, P.C.Joseph and Merrill HafnerJunior and Pauline HigginsHouston Endowment, Inc.
Huffington FoundationJones Lang LaSalle
JPMorgan Chase FoundationKayser Foundation
KBR
Kempner Capital Management, Inc.Kinder FoundationKing & Spalding LLPKresge FoundationStephen LasherLocke Lord, LLPLone Star College SystemM.D. Anderson FoundationMarathon Oil CorporationMarek Brothers Systems, IncGeorge and Kathryn MartinezMD Anderson Cancer CenterMemorial Hermann Hospital SystemSteven and Sheila Miller Foundation Mitsubishi International CorporationNeighborhood Centers Inc.Cathy NunnallyRobert R. and Kay M. Onstead FoundationPalmetto Partners, LTD.Pannell Kerr Forster of Texas, PCReliant Energy The Romans GroupLeslie Elkins and Shannon SasserSteven SchweitzerScurlock FoundationShadywood FoundationTerry ShaikhShell Silver Eagle Distributors, LPSmith Seckman Reid, Inc.Smith, Graham & Co. Investment Advisors, LPSociété GénéraleSpectra EnergyStatesman Business AdvisorsSysco CorporationTejas Office Products, Inc.Tellepsen Family FundTexas Children's HospitalTudor, Pickering, Holt & Co.UHY AdvisorsUniversity of HoustonUniversity of Texas Health Science Center at HoustonEugene H. and Susan VaughanVerizon WirelessVinson & Elkins, LLPW.S. Bellows Construction CorporationWells FargoThe Woodlands TownshipJohn L. Wortham & Son, L.P.
THANK YOU TO OUR
Donors
2012 COMMUNITY INDICATOR REPORT CENTER FOR HOUSTON’S FUTURE The Region’s Think Tank6688


![Outline Human capital theory by C. Echevarriahomepage.usask.ca/~ece220/econ221/4-HC [Compatibility Mode].pdf · Human capital theory by C. Echevarria ... Human capital Human capital](https://img.dokumen.tips/doc/110x75/5ae0d5467f8b9a6e5c8df29c/outline-human-capital-theory-by-c-ece220econ2214-hc-compatibility-modepdfhuman.jpg)