Embed Size (px)
Citation preview

2012 IECEE CTL PTP Workshop
Ingrid Flemming
IFM Quality Services Pty Ltd

Today
• QM discussion– Re-cap on corrective actions (group exercise)
– Record keeping
• Creepage and Clearance discussion and exercises
• Determination of Earth Resistance discussion and exercises

Back in 2011…….
• Cause analyses were discussed at length
• Many participants did not seem to perform adequate analyses of causes.
• Without thorough cause investigations, the corrective actions put into place may also not be successful

Root Cause Analysis?
• What is that?

Root Cause Analysis?
• What does it mean?
• Looking deeply and looking EVERYWHERE for causative factors, not just in the immediate places

Looking deeply
Looking everywhere

Improvements?
• IFM has spent considerable time following up participants to ensure adequate cause analysis is performed and corrective actions are reported in line with ISO/IEC 17025: 4.11
• Most responses received seem adequate – at least better
• More can be done

• Please stand to introduce yourself to your neighbours.
• Then remain standing.
• There are important questions to ask each other

Question
• Should an outlier in a PTP program be considered to be a non-conformance?– If yes, there is an implication that the laboratory
SHOULD register PTP outliers in their quality system and carry out the required actions as per their QM system.
Question
• What records should laboratories keep of their test results?

ISO/IEC17025, clause 4.13.2.1
• The laboratory shall retain records of original observations, derived data and sufficient information to establish an audit trail, calibration records, staff records and a copy of each test report or calibration certificate issued, for a defined period. The records for each test or calibration shall contain sufficient information to facilitate, if possible, identification of factors affecting the uncertainty and to enable the test or calibration to be repeated under conditions as close as possible to the original. The records shall include the identity of personnel responsible for the sampling, performance of each test and/or calibration and checking of results.

Group exercise
• Review some responses given for recent PTPs
• For each case, discuss the response with your team and decide:1. Does the analysis of cause seem adequate?
2. Does the determined root cause seem plausible?
3. Are corrective actions (or proposed corrective actions) sufficient?
4. Can you offer the laboratory any advice?

• For information:• 11e41 questions 9 and 10 required the determination of
creepage path of sample B at pollution degree 2 and 3 respectively.
• 11e41 Question 11 required determination of clearance for sample B
• 11e41 questions 6 and 7 required the determination of creepage paths for sample A at pollution degree 2 and 3 respectively
• 11e41 Question 13 was to determine the diameter of a hole on sample A
• 11e41 Question 17 was to determine the width of the plastic edge inside the hole on sample B

Case 1
• After reviewing the 11e41 Interim Report recently provided, we understand the pathway we took was not the shortest path.
• As a corrective action, we will pursue additional creepage and clearance measurement training to be able to properly evaluate these more complex measurements.
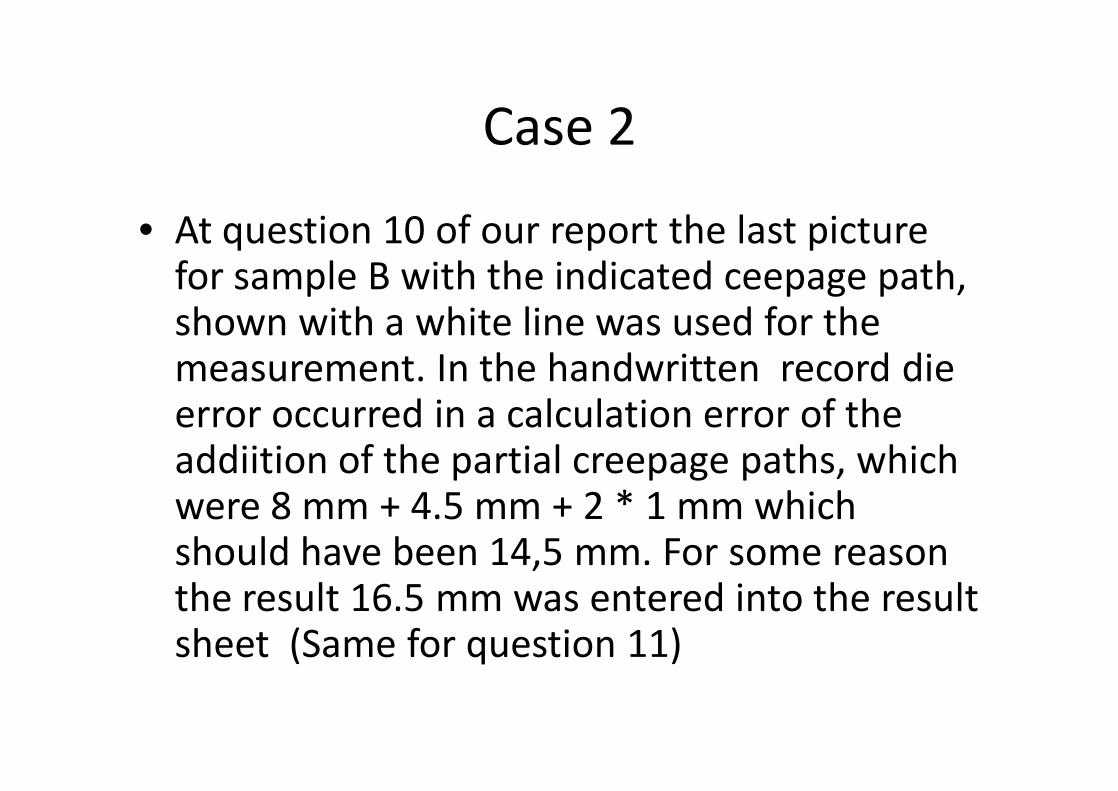
Case 2
• At question 10 of our report the last picture for sample B with the indicated ceepage path, shown with a white line was used for the measurement. In the handwritten record die error occurred in a calculation error of the addiition of the partial creepage paths, which were 8 mm + 4.5 mm + 2 * 1 mm which should have been 14,5 mm. For some reason the result 16.5 mm was entered into the result sheet (Same for question 11)

Case 2 continued
• The error occured due to wrong result transfer from the hand written record into the result sheet. The error was not detected as no second review of the result had been performed and as the complete calculation with the result was not written on the record.. The consequence will be an improved documentation of the tests even if the tests are specific and not common, where also the intermediate results and the complete calculation are filed for review and traceability

Case 3
• Initial clearance measurements seemed to indicate the shortest pathway, when in actuality there was a shorter clearance pathway. A series of repeated measurements of the pathways (verifying the measurement results) would have revealed the proper pathway.
• Action: Clearance and Creepage distance measurements will be repeated three times and the results compared.
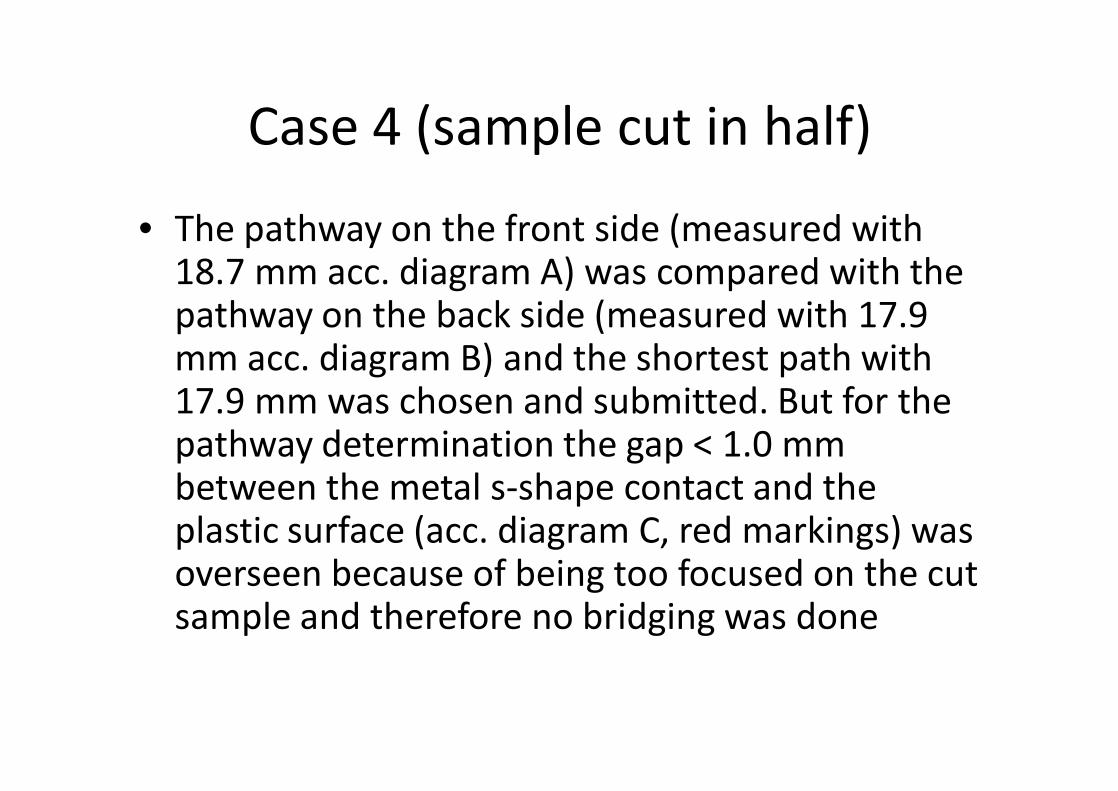
Case 4 (sample cut in half)
• The pathway on the front side (measured with 18.7 mm acc. diagram A) was compared with the pathway on the back side (measured with 17.9 mm acc. diagram B) and the shortest path with 17.9 mm was chosen and submitted. But for the pathway determination the gap < 1.0 mm between the metal s-shape contact and the plastic surface (acc. diagram C, red markings) was overseen because of being too focused on the cut sample and therefore no bridging was done
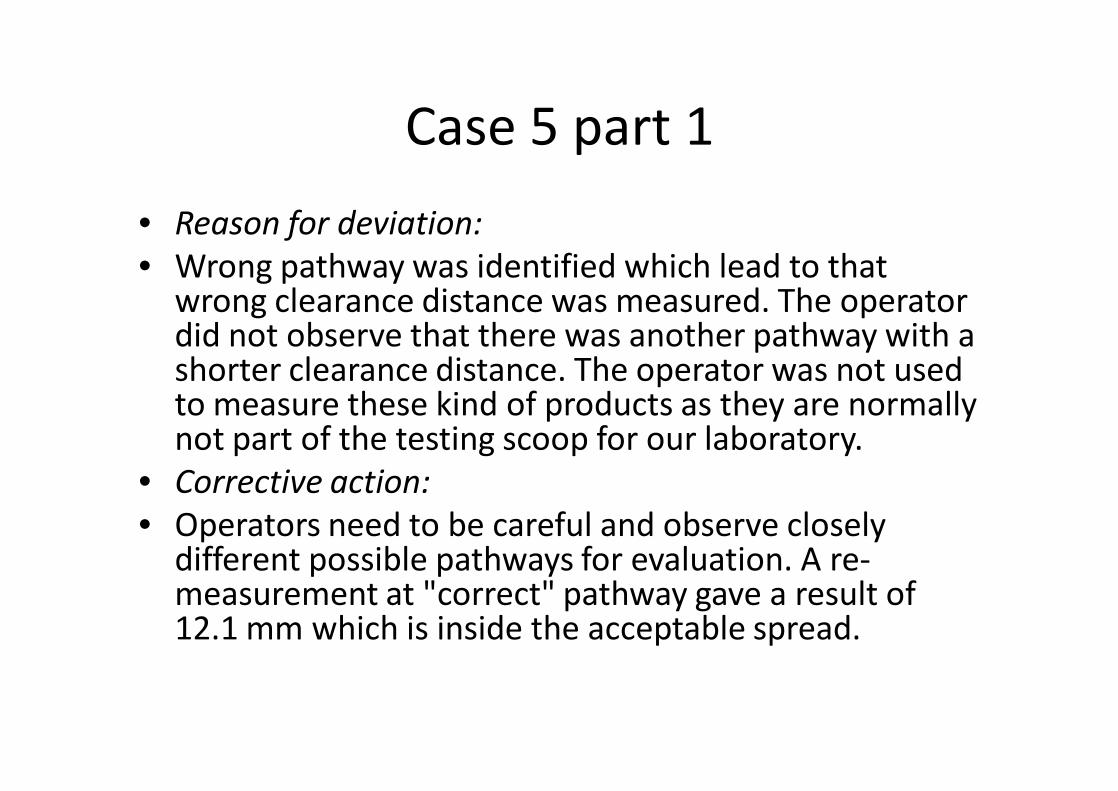
Case 5 part 1
• Reason for deviation:• Wrong pathway was identified which lead to that
wrong clearance distance was measured. The operator did not observe that there was another pathway with a shorter clearance distance. The operator was not used to measure these kind of products as they are normally not part of the testing scoop for our laboratory.
• Corrective action:• Operators need to be careful and observe closely
different possible pathways for evaluation. A re-measurement at "correct" pathway gave a result of 12.1 mm which is inside the acceptable spread.

Case 5 part 2• Reason for deviation:• Probably the calliper was not absolutely perpendicular to the surface of
the test object. A small angel of the calliper gives easily deviations of 0.1 mm. The calliper used for the measurement was a type with mechanical reading (not electronic) which easily can lead to small errors in the reading of the result. As the measured distance exceeded the acceptable by 0.0517mm, this could be explained by possible angle of the calliper or not enough accuracy of the reading at a mechanical calliper.
• Corrective action• Operators needs to be more careful when handling the calliper. When
small distances should be measured and when limits are defined in a standard, an electronic calliper should always be used.
• When re-measuring this distance with the electronic calliper a result of 6.69mm is measured, which is inside the acceptable spread.

Case 6
• Root Cause Investigation:• 1. Pathway of questions 9 and 10, correct pathways were
selected in both of the result sheets submitted, but not presented clearly in the result sheets.
• 2. Question 11, correct pathway was selected, the tips of calliper used to measure the clearance were not perpendicular to the measured surface, so that shorter clearance resulted than that measured on correct pathway
• 3. Question 13, the tips of calliper used to measure the hole diameter were not perpendicular to the surface and shorter diameter resulted.
• (Corrective actions appear to be teaching staff to test these particular samples, rather than all samples.)
Discussion
• Considering all 6 responses as a group - What is the general impression of the relative strengths and weaknesses of the responses presented?
Discussion
• How similar/different (in format and presentation) were the 6 responses considered?
• What should constitute the minimum information presented to allow an external monitor (IFM) to clear follow up activities?
• In what format would this best be presented?• Own documentation, checklist or “official form”
11e41: Creepage and Clearance

CBTL68%
MTL26%
"private"6%
11e41 Participant Types
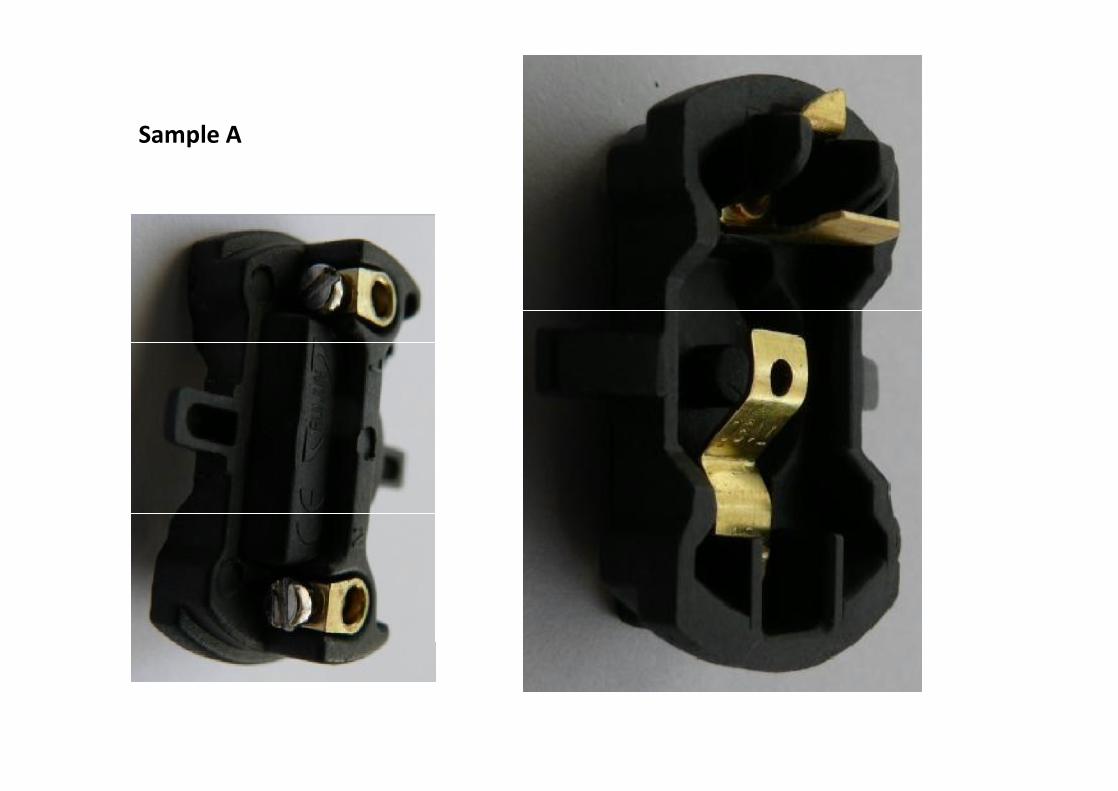
Sample A

Sample B

0%
10%
20%
30%
40%
50%
60%
70%
80%
90%
100%
CBTL MTL
Follow-up status (as at 16 April 2012)
closed action action unfinalised no action

18%
31%
46%
5%
11e41: Nature of outliers
incorrect measurement
both incorrect measurement and incorrect pathways
incorrect pathways
pathways not provided
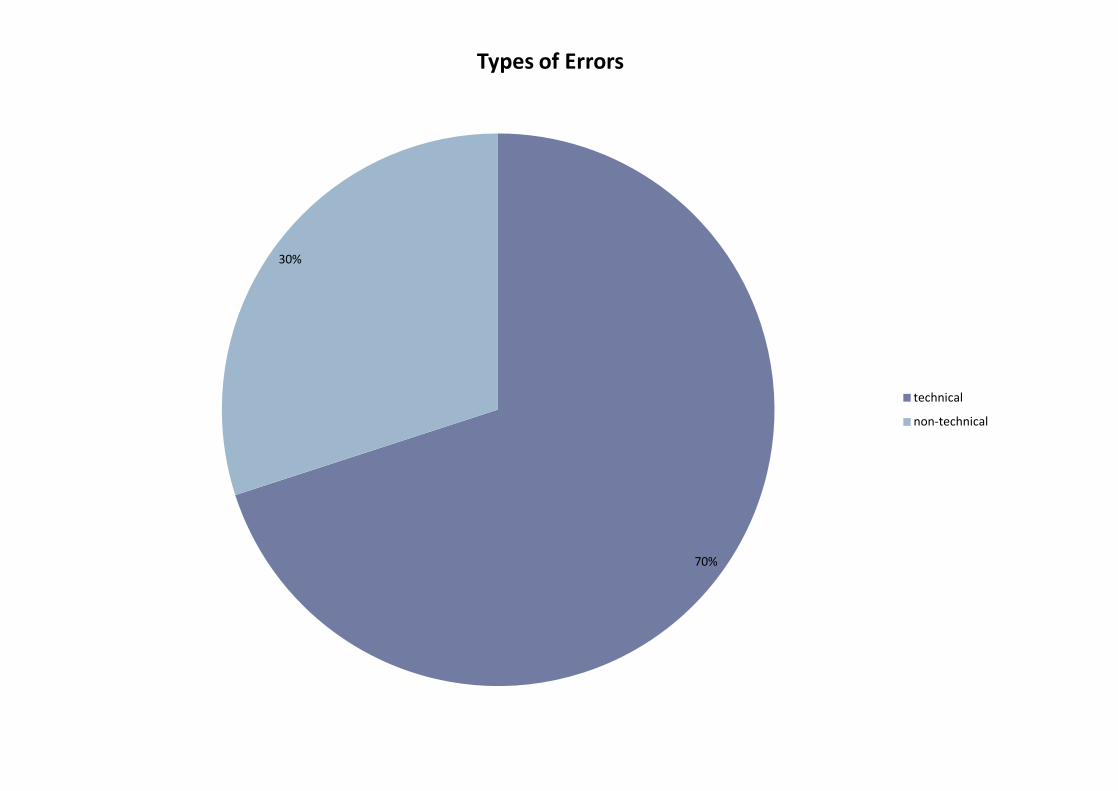
70%
30%
Types of Errors
technical
non-technical

17%
13%
70%
Cause of non-technical errors
failure to read/interpret instructions
transcription error
quality of records
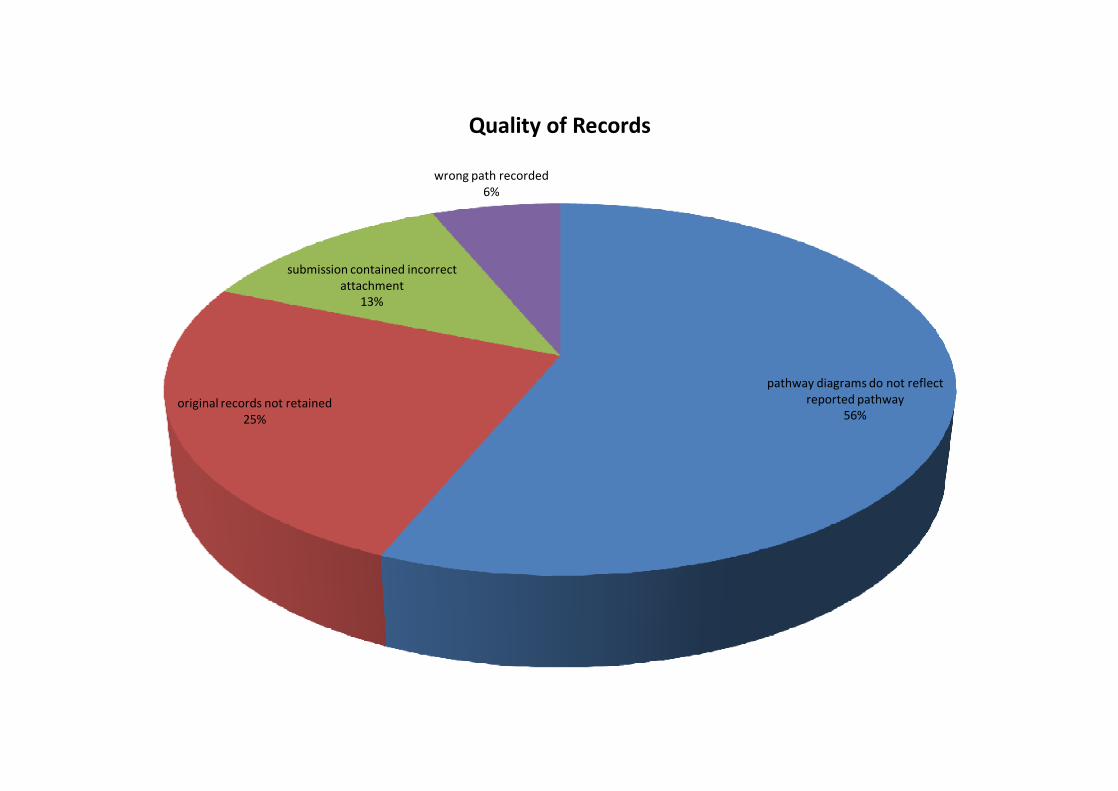
pathway diagrams do not reflect reported pathway
56%original records not retained
25%
submission contained incorrect attachment
13%
wrong path recorded6%
Quality of Records
• As a result of follow-up activities, several laboratories found that the details they had reported originally contained errors when compared with their original data, including providing the wrong photo or diagram of the pathway measured.
• Comment:– In order to minimise such errors, laboratory
procedures normally require that test results and reports are independently reviewed for content and accuracy before they are issued.
• Cases occurred where a laboratory claimed to have chosen and measured the correct path although their original diagrams were not adequate to show this.
• Comment:– These claims were accepted provided evidence could
be provided from original laboratory notes and the measured results were consistent with the claim.
– Laboratories are required to retain records of original observations, derived data and sufficient information to establish an audit trail (Reference: ISO/IEC17025, clause 4.13.2.1).
• A laboratory measured Sample A with what was clearly a distorted contact, checked the second sample and found it to be like the diagram in the Instructions, and claimed the damage to the sample occurred in the shipment.
• Comment:– The correct configuration of the sample was clearly
indicated in the Instructions.– Checks affecting the quality of tests should be made
on purchased supplies before they are used (Reference: ISO/IEC17025, clause 4.6.2)

31%
10%
14%2%
43%
Cause of technical errors
poor understanding of C&C rules
sample handling
failure to consider all possible paths
handling numbers
poor measurement technique

• A laboratory made useful observations on the effect that lighting had on the accuracy of their measurements.
• Comment:– This is relevant to many different measurement
situations.

• Several laboratories found on follow-up that outlier measurements were the result of poor technique in the use of vernier callipers.
• Comment:– Training was required in the correct techniques to
be employed.

interpretation of DSHs20%
incorrect determination of end points13%
general60%
"too complex"7%
Poor understanding of C&C rules

C&C Rules Revision: creepageThe angles forming the corners of the groove are greater than 80’
Gap/Groove =X or >X Gap/Groove <X
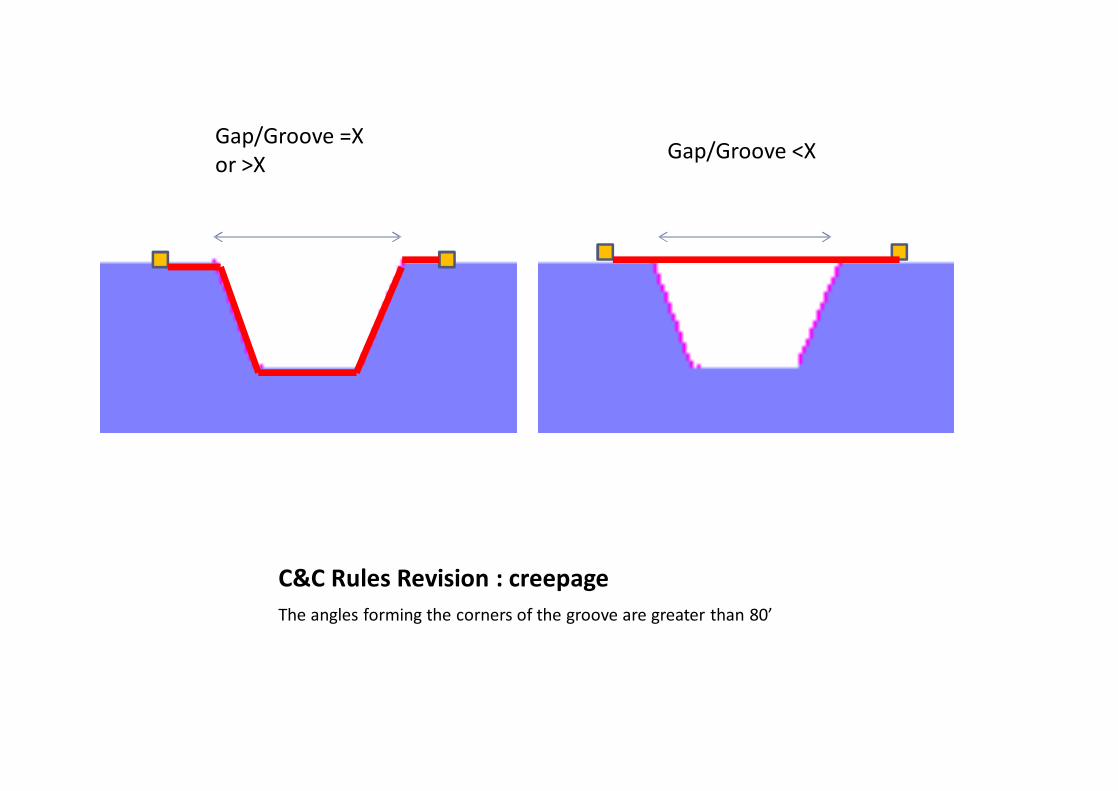
C&C Rules Revision : creepageThe angles forming the corners of the groove are greater than 80’
Gap/Groove =X or >X
Gap/Groove <X

C&C Rules Revision : creepageThe angles forming the corners of the groove are greater than 80’
Gap/Groove =X or >X Gap/Groove <X

C&C Rules Revision : creepageThe angles forming the corners of the groove are less than 80’
Gap/Groove =X or >X Gap/Groove <X
Bridges at distance = X

C&C Rules Revision : creepageThere are no faces forming a groove, therefore the contour is exactly followed

Group Exercise: C&C RulesImagine a continuous moulding greater than 30 units long. The middle of the moulding is fitted with components including live parts. Determine the creepage and clearance distances between points A and B, and points A and C. Assume jumping distance X is one grid unit on the handout.

Creepage path A-B
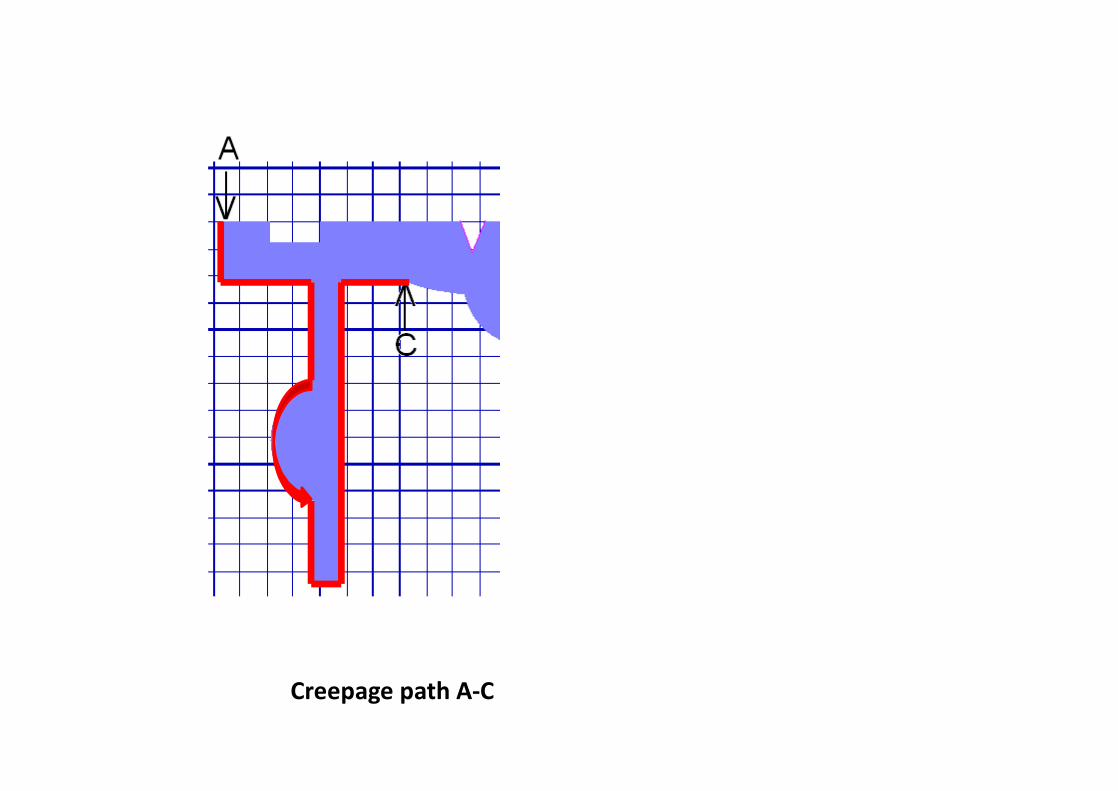
Creepage path A-C

Clearance paths A-B and A-CThere is another possible A-C clearance path – what is it?
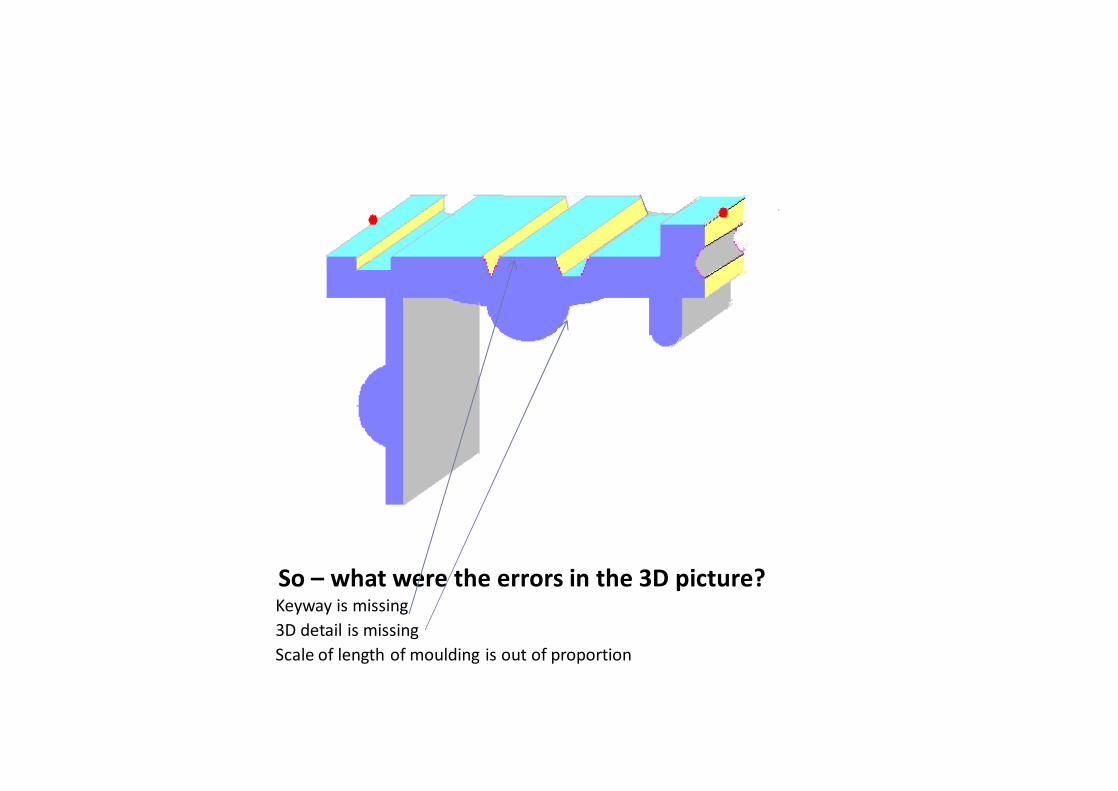
So – what were the errors in the 3D picture?Keyway is missing3D detail is missingScale of length of moulding is out of proportion
distortion or breakage of sample before test completed
40%
sectioning of sample, thus destroying path
60%
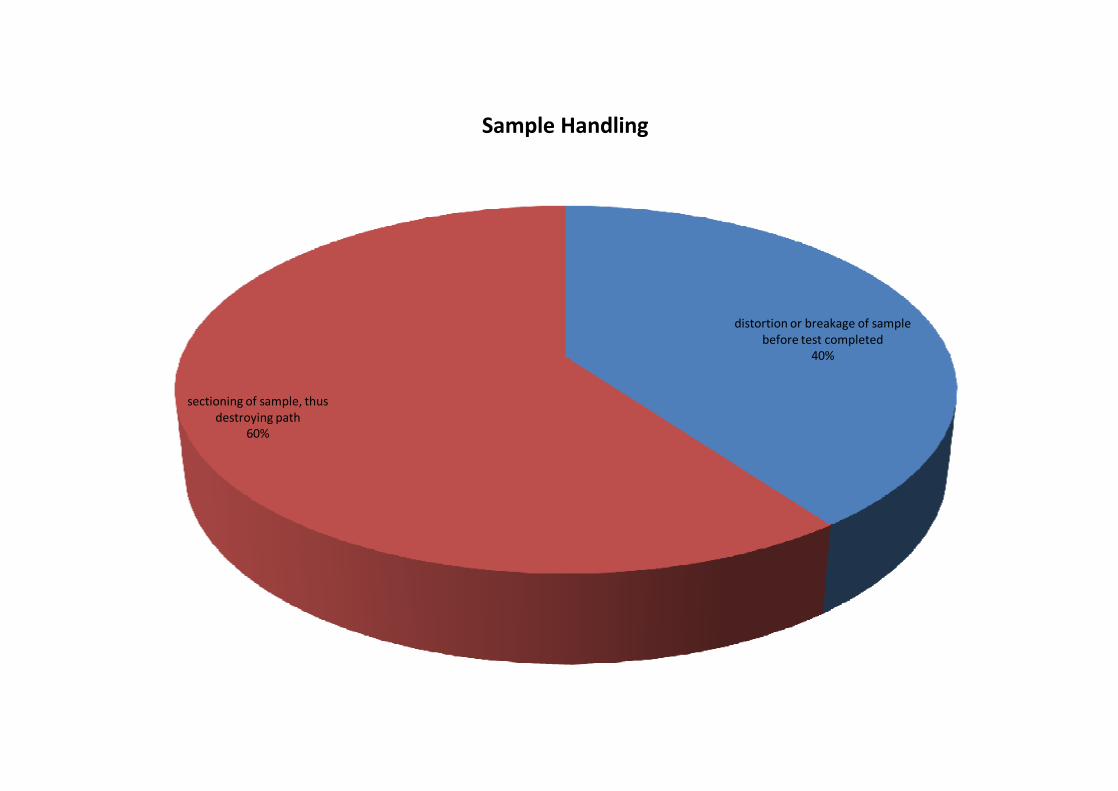
Sample Handling

• Many laboratories sectioned Sample A in order to determine and measure creepagepaths. Some overlooked the fact that in doing so they had removed a possible creepage path from the sample.
• Comment:– Laboratories needed to be aware of a possible loss
of original information if a sample was sectioned.
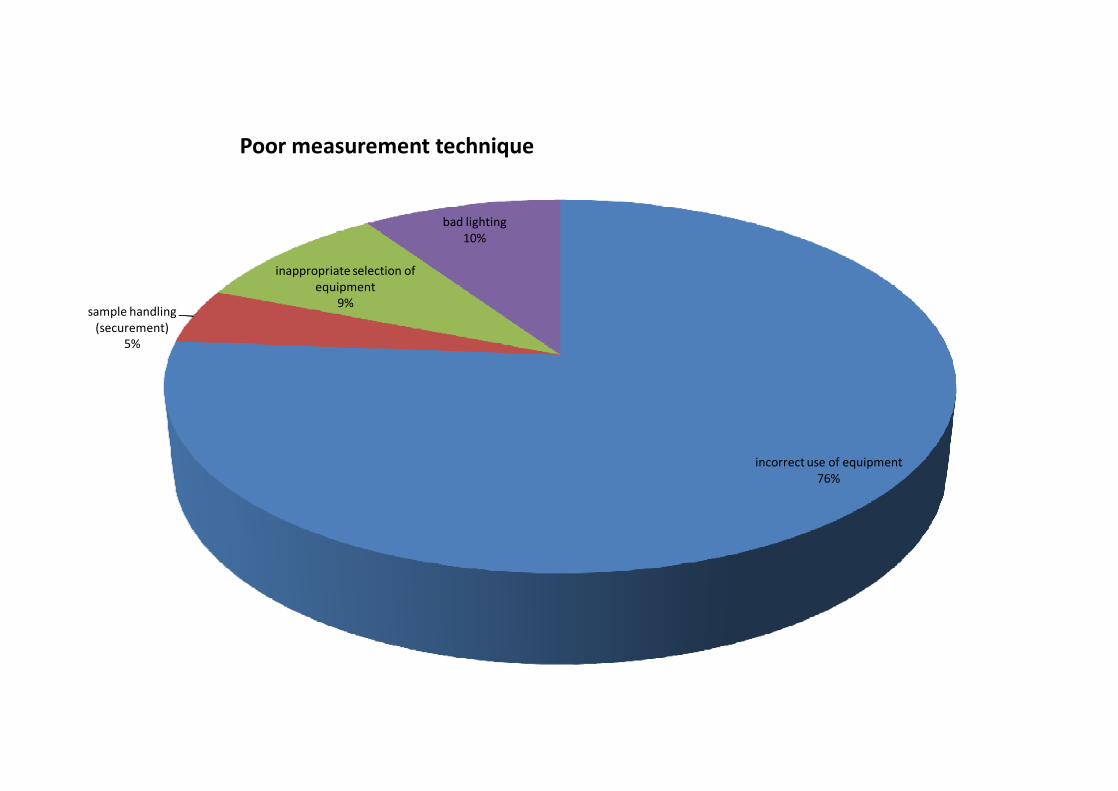
incorrect use of equipment76%
sample handling (securement)
5%
inappropriate selection of equipment
9%
bad lighting10%
Poor measurement technique
• A laboratory made useful observations on the effect that lighting had on the accuracy of their measurements.
• Comment:– This is relevant to many different measurement
situations.
• Several laboratories found on follow-up that outlier measurements were the result of poor technique in the use of vernier callipers.
• Comment:– Training was required in the correct techniques to
be employed.
0
10
20
30
40
50
60
70
80
6.5
6.6
6.7
6.8
6.9
Mor
e
Title
Title
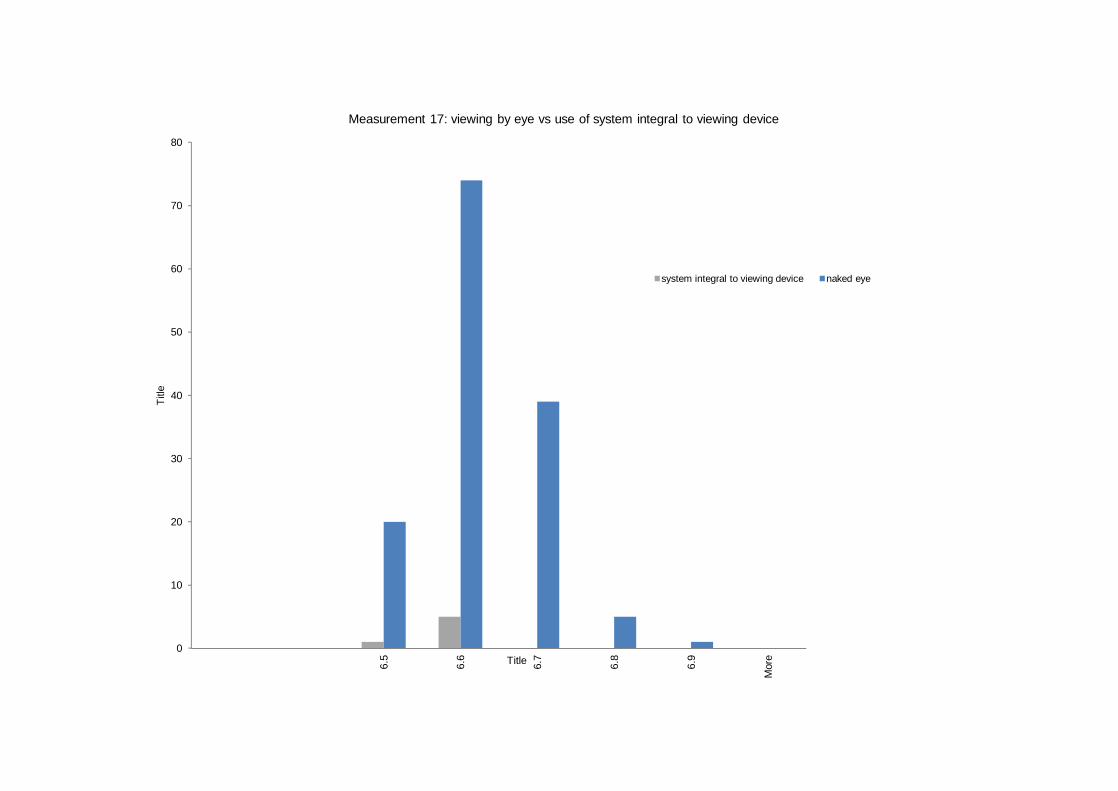
Measurement 17: viewing by eye vs use of system integral to viewing device
system integral to viewing device naked eye
• Some laboratories found that for some distances which were difficult to measure directly it was easier to measure indirectly and use Pythagoras Theorem to calculate the distance required.
• Comment:– This approach can be useful in certain situations,
either as the primary means of obtaining a measurement or as a check on the direct measurement.

Question 17“Distance 6” The measurement is approximately 6.5mm.Majority of participants used CALLIPERS to perform the measurement.

Exercise: relating to Question 17
• Consider and list the sources of measurement uncertainty for the captioned measurement
• What would be the most appropriate instrument and measurement technique to perform this measurement adequately?
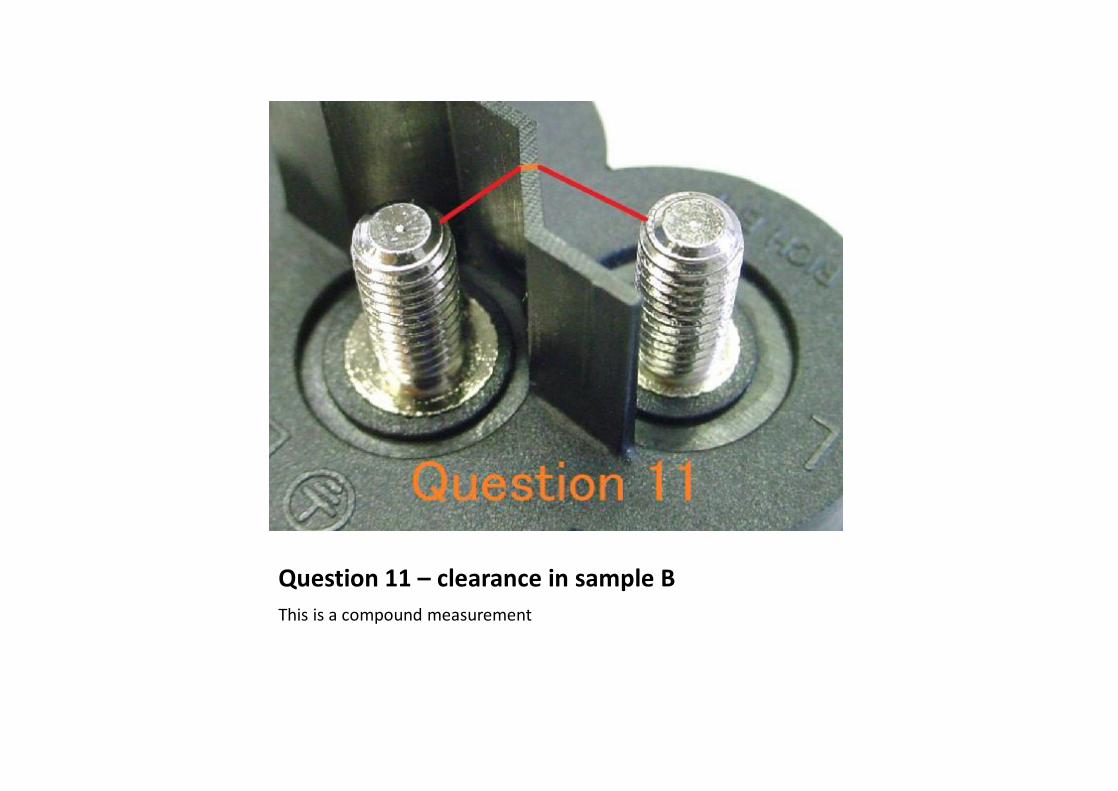
Question 11 – clearance in sample BThis is a compound measurement
0
10
20
30
40
50
6011
.1
11.3
11.5
11.7
11.9
12.1
12.3
12.5
12.7
Mor
e
Freq
uenc
y
Result
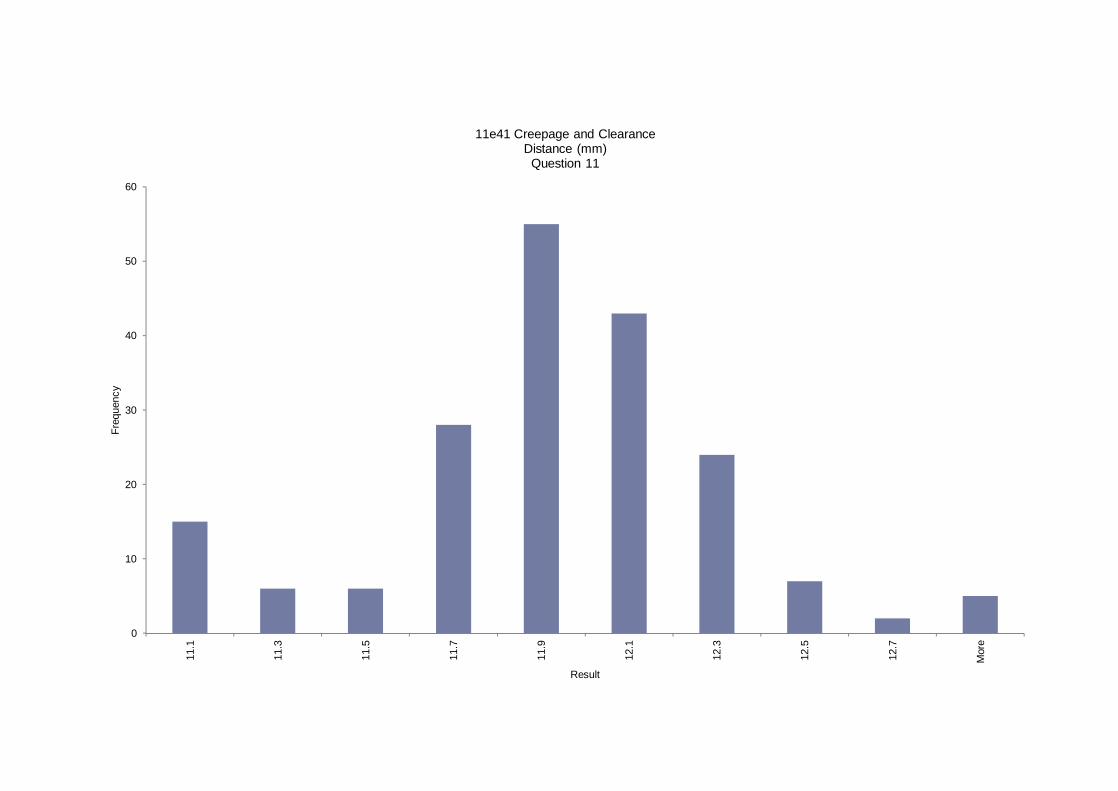
11e41 Creepage and ClearanceDistance (mm)
Question 11

0
2
4
6
8
10
12
14
16
18
20
11.3
11.4
11.5
11.6
11.7
11.8
11.9 12
12.1
12.2
12.3
Mor
e
num
ber
of p
artic
ipan
ts r
epor
ting
the
resu
lt
reported result (mm)
Measurement 11
naked eye + ruler
miscrscope with integral device
naked eye/callipers
hand lens/callipers
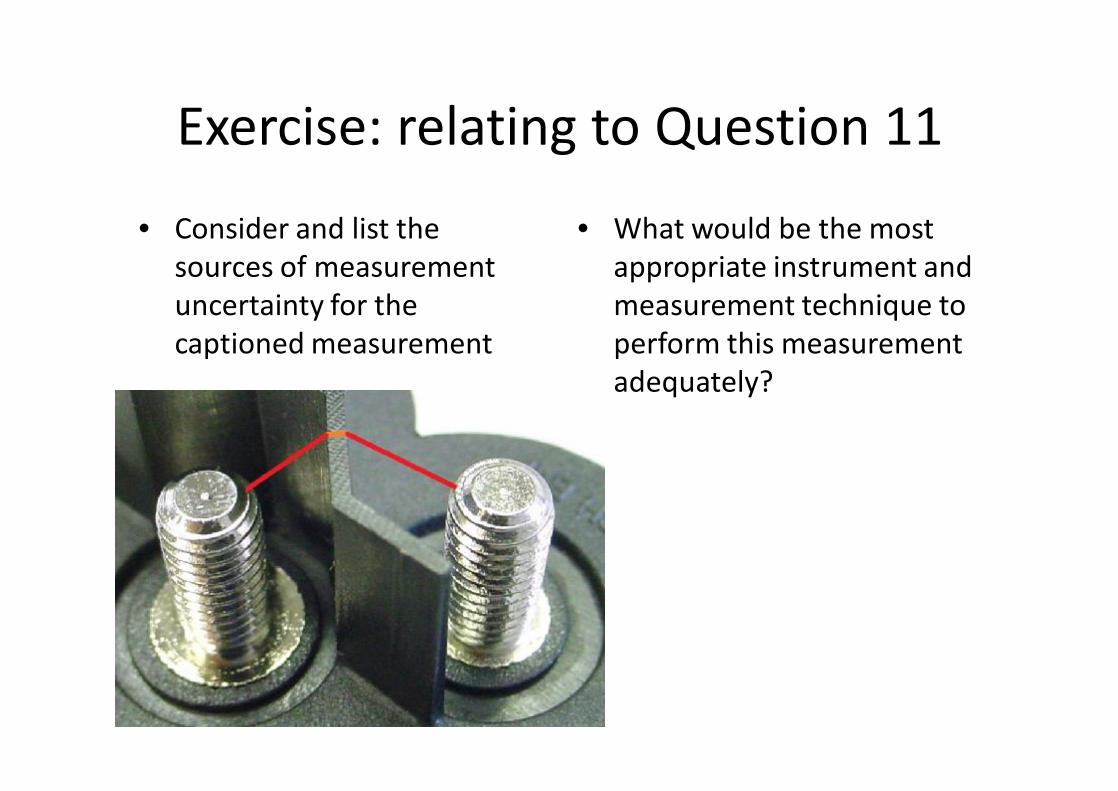
Exercise: relating to Question 11
• Consider and list the sources of measurement uncertainty for the captioned measurement
• What would be the most appropriate instrument and measurement technique to perform this measurement adequately?

Determination of Earth Resistance


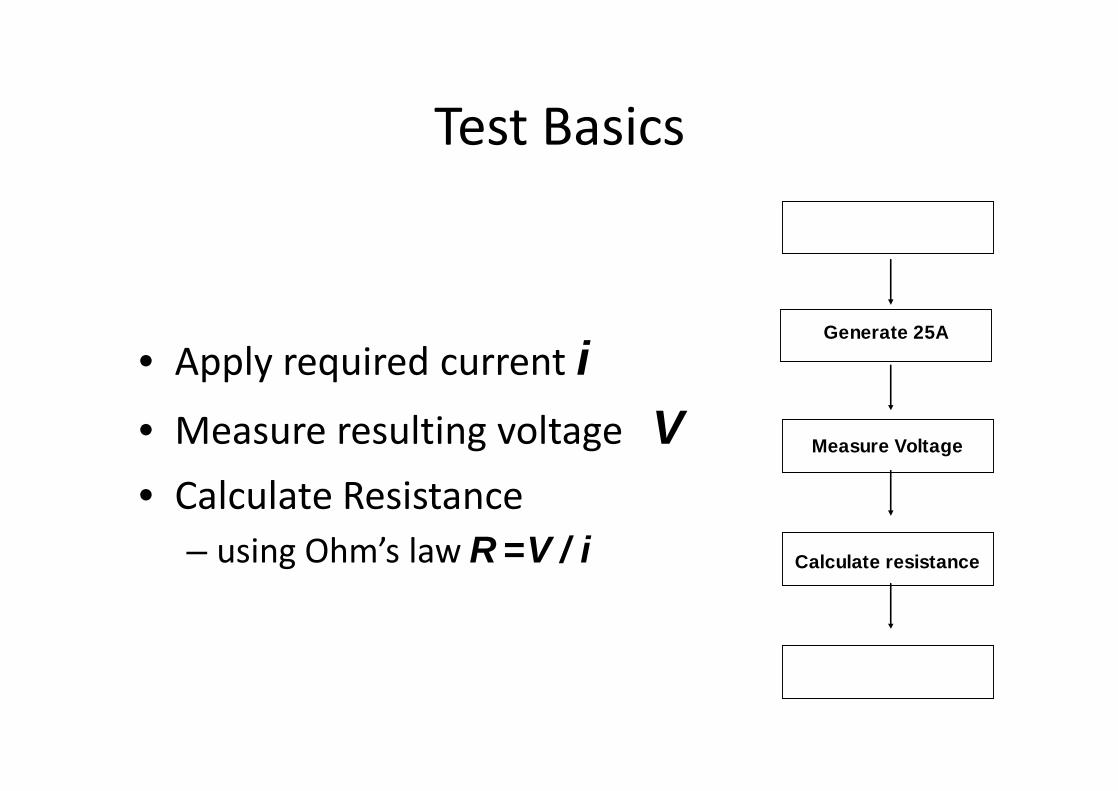
Test Basics
• Apply required current i• Measure resulting voltage V• Calculate Resistance
– using Ohm’s law R=V/i
Generate 25A
Measure Voltage
Calculate resistance
Why do it this way?
• R=V/I
• Which is the most critical measurement for optimal accuracy?
• Applying 25A,
• Measure volts,
• calculate milli ohms??

Results summary
• Results are “reasonable”
• Definite trends
• There are factors that could be controlled that would result in more consistent test results

Group exercise
Equipment
Variation in results

Summary

What pattern can we observe?
0
10
20
30
40
50
60
70
80
36.8
9
38.3
4
39.7
9
41.2
4
42.6
9
44.1
4
45.5
9
47.0
4
48.4
9
Mor
e
Freq
uenc
y
Result
11e42 Earthing ResistanceNominal 1
32A ac Calculated Resistance (mOhm)
0102030405060708090
10032
.
33.5 35.
36.5 38.
39.5 41.
42.5 44.
Mor
e
Freq
uenc
y
Result
11e42 Earthing ResistanceNominal 1
25A ac Calculated Resistance (mOhm)
0
20
40
60
80
100
120
61.6
8
63.7
6
65.8
4
67.9
2
70.
72.0
8
74.1
6
76.2
4
78.3
2
Mor
e
Freq
uenc
y
Result
11e42 Earthing ResistanceNominal 2
10A ac Calculated Resistance (mOhm)
0
10
20
30
40
50
60
70
80
90
65.8
5
68.1
70.3
4
72.5
9
74.8
3
77.0
8
79.3
2
81.5
7
83.8
1
Mor
e
Freq
uenc
y
Result
11e42 Earthing ResistanceNominal 2
25A ac Calculated Resistance (mOhm)
The laws of nature


Similarly
• There are many CONSTANTS in nature – things that happen, no matter what is going on elsewhere.
• Similarly, the LAWS OF PHYSICS are full of constants – things that occur, whether we are conducting a regular (generic) test for resistance or a test for earth resistance
Key questions asked for Earth Resistance PTP
• Sample Temperature rise
• Is current adjusted during the test?
• How long does it take to obtain required current?
• Does timing of the test start immediately, or only after the required current has been obtained?
• What is the impedance of the voltmeter?

What was the temperature rise of the sample during testing?
71
72
73
74
75
76
77
78
79
80
2K or less >2 - 5K >5-8K >8-11K >11-15K >15K
med
ian
resi
stan
ce r
epor
ted
by g
roup
(m
Ohm
)
temperature rise of sample during test interval (K)
25A ac, nominal 2, effects of sample temperature rise during test
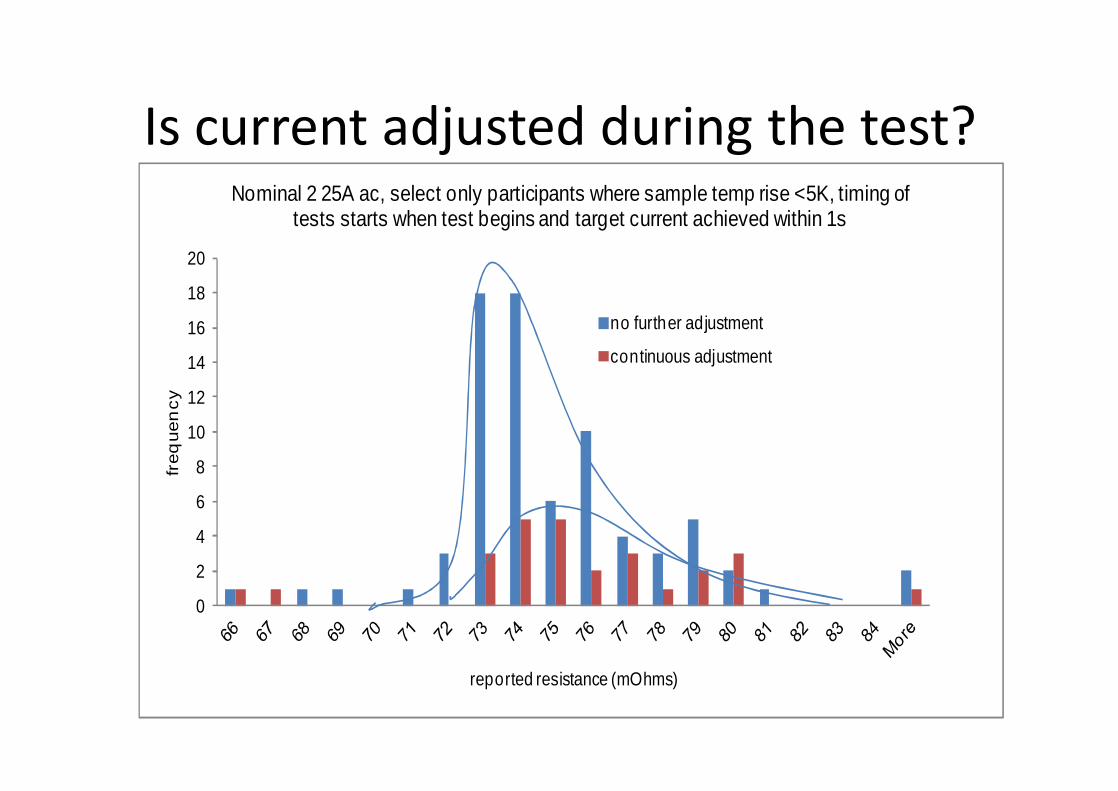
Is current adjusted during the test?
0
2
4
6
8
10
12
14
16
18
20
freq
uen
cy
reported resistance (mOhms)
Nominal 2 25A ac, select only participants where sample temp rise <5K, timing of tests starts when test begins and target current achieved within 1s
no further adjustment
continuous adjustment
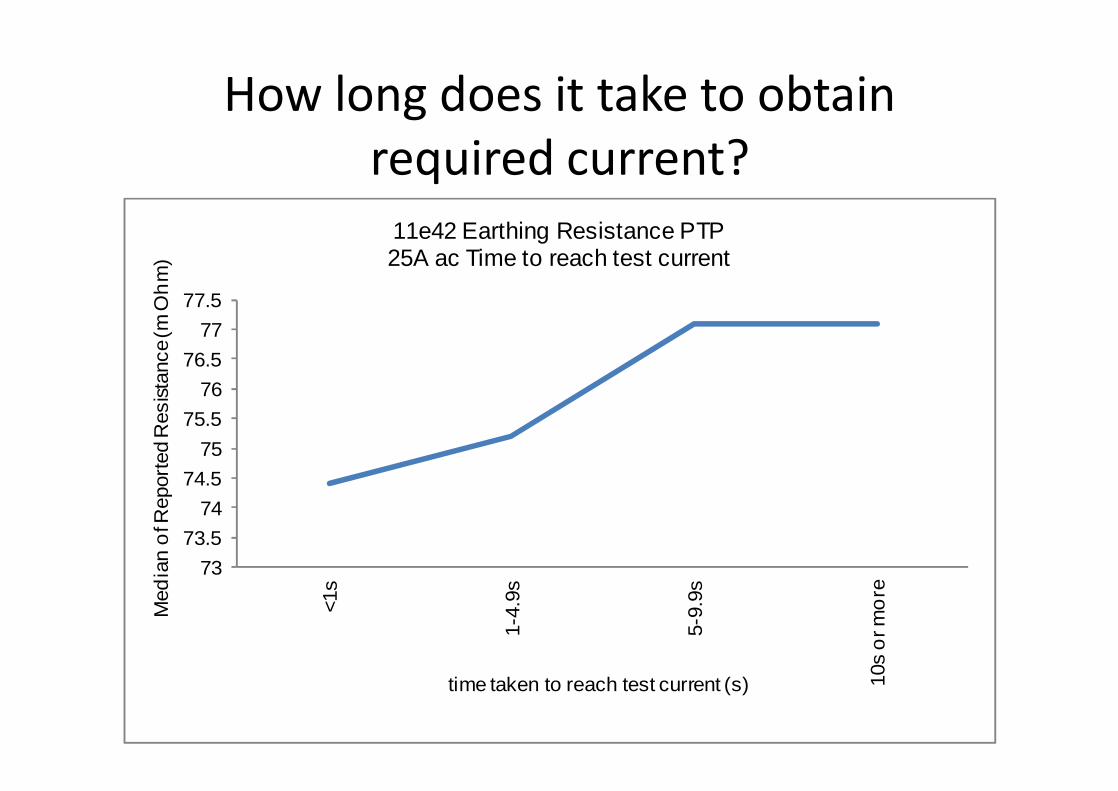
How long does it take to obtain required current?
7373.5
7474.5
7575.5
7676.5
7777.5<1
s
1-4.
9s
5-9.
9s
10s
or m
ore
Med
ian
of R
epor
ted
Res
istan
ce (m
Ohm
)
time taken to reach test current (s)
11e42 Earthing Resistance PTP25A ac Time to reach test current

Does timing of the test start immediately, or after the required current has been reached?
73.00
73.50
74.00
74.50
75.00
75.50
76.00
timing includes current adjustment time starts when current achieved
med
ia re
sist
ance
repo
rted
(mO
hms)
25A ac, nominal 2, participants achieve required current af ter 1s to 4.9s
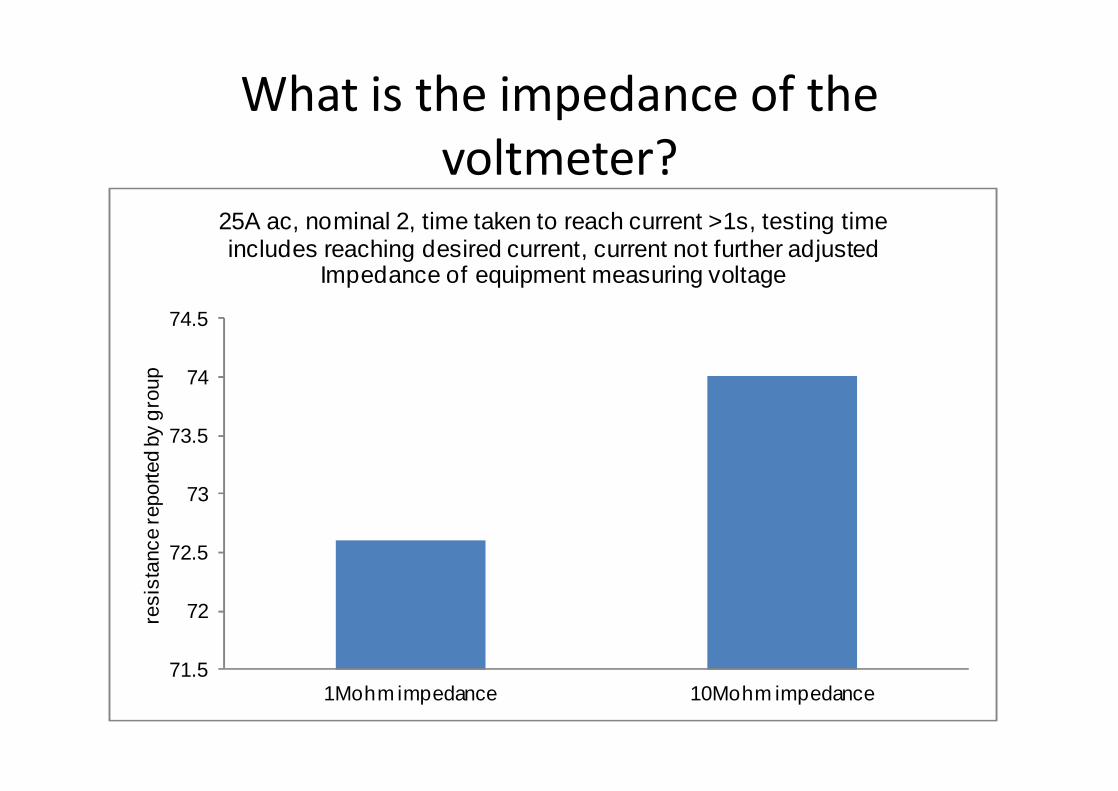
What is the impedance of the voltmeter?
71.5
72
72.5
73
73.5
74
74.5
1Mohm impedance 10Mohm impedance
resi
stan
ce re
porte
d by
gro
up
25A ac, nominal 2, time taken to reach current >1s, testing time includes reaching desired current, current not further adjusted
Impedance of equipment measuring voltage
Last exercises for the day
• Summarise the previous earth resistance exercise outcomes, supplement with the PTP outcomes and devise a checklist that will assist a new staff engineer to successfully set up an earth resistance test