Embed Size (px)
Citation preview

2012
HOTELS IN INDIATRENDS & OPPORTUNITIES
Kaushik VardharajanManaging Director - HVS Hospitality Services
Yashaas RajanConsulting & Valuation Analyst
www.hvs.com HVS Hospitality Services th 6 Floor, Building 8-C, DLF Cyber City, Phase - II, Gurgaon 122 002, INDIA
2012 HOTELS IN INDIA TRENDS & OPPORTUNITIES | PAGE 1 1 Country Report: India (July 2012). Economist Intelligence Unit
Exhibit 1: Survey Participation (1995/96 2011/12)–
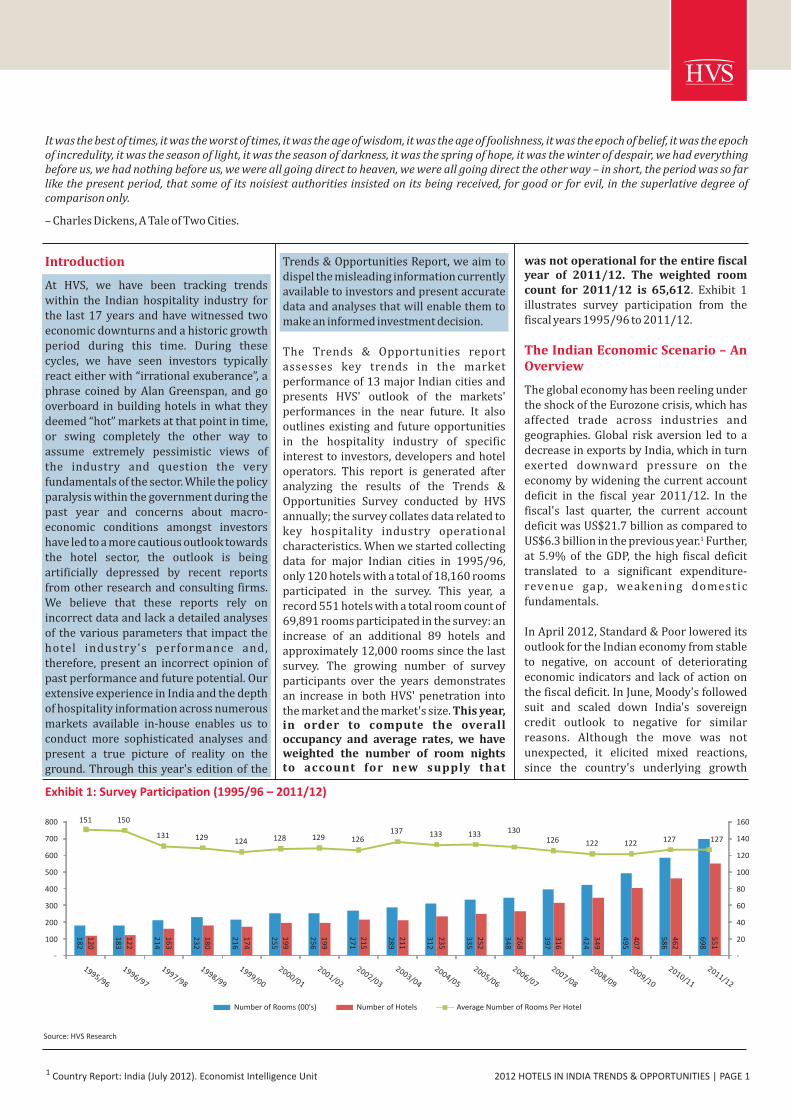
was not operational for the entire fiscal year of 2011/12. The weighted room count for 2011/12 is 65,612. Exhibit 1 illustrates survey participation from the fiscal years 1995/96 to 2011/12.
The global economy has been reeling under the shock of the Eurozone crisis, which has affected trade across industries and geographies. Global risk aversion led to a decrease in exports by India, which in turn exerted downward pressure on the economy by widening the current account deficit in the fiscal year 2011/12. In the fiscal's last quarter, the current account deficit was US$21.7 billion as compared to
1US$6.3 billion in the previous year. Further, at 5.9% of the GDP, the high fiscal deficit translated to a significant expenditure-revenue gap, weakening domestic fundamentals.
In April 2012, Standard & Poor lowered its outlook for the Indian economy from stable to negative, on account of deteriorating economic indicators and lack of action on the fiscal deficit. In June, Moody's followed suit and scaled down India's sovereign credit outlook to negative for similar reasons. Although the move was not unexpected, it elicited mixed reactions,since the country's underlying growth
The Indian Economic Scenario – An Overview
Trends & Opportunities Report, we aim to dispel the misleading information currently available to investors and present accurate data and analyses that will enable them to make an informed investment decision.
The Trends & Opportunities report assesses key trends in the market performance of 13 major Indian cities and presents HVS' outlook of the markets' performances in the near future. It also outlines existing and future opportunities in the hospitality industry of specific interest to investors, developers and hotel operators. This report is generated after analyzing the results of the Trends & Opportunities Survey conducted by HVS annually; the survey collates data related to key hospitality industry operational characteristics. When we started collecting data for major Indian cities in 1995/96, only 120 hotels with a total of 18,160 rooms participated in the survey. This year, a record 551 hotels with a total room count of 69,891 rooms participated in the survey: an increase of an additional 89 hotels and approximately 12,000 rooms since the last survey. The growing number of survey participants over the years demonstrates an increase in both HVS' penetration into the market and the market's size. This year, in order to compute the overall occupancy and average rates, we have weighted the number of room nightsto account for new supply that
Source: HVS Research
It was the best of times, it was the worst of times, it was the age of wisdom, it was the age of foolishness, it was the epoch of belief, it was the epoch of incredulity, it was the season of light, it was the season of darkness, it was the spring of hope, it was the winter of despair, we had everything before us, we had nothing before us, we were all going direct to heaven, we were all going direct the other way – in short, the period was so far like the present period, that some of its noisiest authorities insisted on its being received, for good or for evil, in the superlative degree of comparison only.
– Charles Dickens, A Tale of Two Cities.
Introduction
At HVS, we have been tracking trends within the Indian hospitality industry for the last 17 years and have witnessed two economic downturns and a historic growth period during this time. During these cycles, we have seen investors typically react either with “irrational exuberance”, a phrase coined by Alan Greenspan, and go overboard in building hotels in what they deemed “hot” markets at that point in time, or swing completely the other way to assume extremely pessimistic views ofthe industry and question the very fundamentals of the sector. While the policy paralysis within the government during the past year and concerns about macro-economic conditions amongst investors have led to a more cautious outlook towards the hotel sector, the outlook is being artificially depressed by recent reports from other research and consulting firms. We believe that these reports rely on incorrect data and lack a detailed analyses of the various parameters that impact the hotel industry's performance and, therefore, present an incorrect opinion of past performance and future potential. Our extensive experience in India and the depth of hospitality information across numerous markets available in-house enables us to conduct more sophisticated analyses and present a true picture of reality on the ground. Through this year's edition of the
18
2
18
3
21
4
23
2
21
6
25
5
25
6
27
1
28
9
31
2
33
5
34
8
39
7
42
4
49
5
58
6
69
8
12
0
12
2
16
3
18
0
17
4
19
9
19
9
21
5
21
1
23
5
25
2
26
8
31
6
34
9
40
7
46
2
55
1
151 150
131 129 124 128 129 126137 133 133 130
126 122 122 127 127
-
20
40
60
80
100
120
140
160
-
100
200
300
400
500
600
700
800
Number of Rooms (00's) Number of Hotels Average Number of Rooms Per Hotel
2012 HOTELS IN INDIA TRENDS & OPPORTUNITIES | PAGE 2
parameters are still believed to be strong.
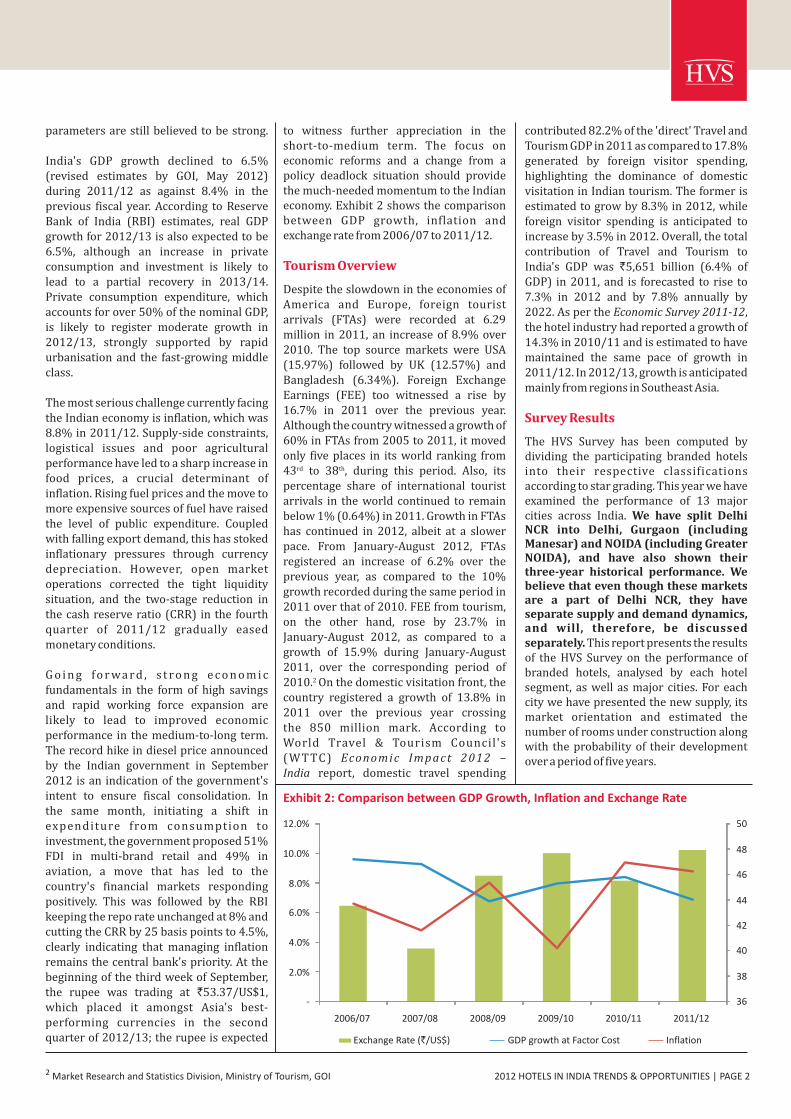
India's GDP growth declined to 6.5% (revised estimates by GOI, May 2012) during 2011/12 as against 8.4% in the previous fiscal year. According to Reserve Bank of India (RBI) estimates, real GDP growth for 2012/13 is also expected to be 6.5%, although an increase in private consumption and investment is likely to lead to a partial recovery in 2013/14. Private consumption expenditure, which accounts for over 50% of the nominal GDP, is likely to register moderate growth in 2012/13, strongly supported by rapid urbanisation and the fast-growing middle class.
The most serious challenge currently facing the Indian economy is inflation, which was 8.8% in 2011/12. Supply-side constraints, logistical issues and poor agricultural performance have led to a sharp increase in food prices, a crucial determinant of inflation. Rising fuel prices and the move to more expensive sources of fuel have raised the level of public expenditure. Coupled with falling export demand, this has stoked inflationary pressures through currency depreciation. However, open market operations corrected the tight liquidity situation, and the two-stage reduction in the cash reserve ratio (CRR) in the fourth quarter of 2011/12 gradually eased monetary conditions.
G o i n g f o r wa r d , s t r o n g e c o n o m i c fundamentals in the form of high savings and rapid working force expansion are likely to lead to improved economic performance in the medium-to-long term. The record hike in diesel price announced by the Indian government in September 2012 is an indication of the government's intent to ensure fiscal consolidation. Inthe same month, initiating a shift in expenditure from consumption to investment, the government proposed 51% FDI in multi-brand retail and 49% in aviation, a move that has led to the country's financial markets responding positively. This was followed by the RBI keeping the repo rate unchanged at 8% and cutting the CRR by 25 basis points to 4.5%, clearly indicating that managing inflation remains the central bank's priority. At the beginning of the third week of September, the rupee was trading at `53.37/US$1,which placed it amongst Asia's best-performing currencies in the second quarter of 2012/13; the rupee is expected
contributed 82.2% of the 'direct' Travel and Tourism GDP in 2011 as compared to 17.8% generated by foreign visitor spending, highlighting the dominance of domestic visitation in Indian tourism. The former is estimated to grow by 8.3% in 2012, while foreign visitor spending is anticipated to increase by 3.5% in 2012. Overall, the total contribution of Travel and Tourism to India's GDP was `5,651 billion (6.4% of GDP) in 2011, and is forecasted to rise to 7.3% in 2012 and by 7.8% annually by 2022. As per the Economic Survey 2011-12, the hotel industry had reported a growth of 14.3% in 2010/11 and is estimated to have maintained the same pace of growth in 2011/12. In 2012/13, growth is anticipated mainly from regions in Southeast Asia.
The HVS Survey has been computed by dividing the participating branded hotels into their respective classifications according to star grading. This year we have examined the performance of 13 major cities across India. We have split Delhi NCR into Delhi, Gurgaon (including Manesar) and NOIDA (including Greater NOIDA), and have also shown their three-year historical performance. We believe that even though these markets are a part of Delhi NCR, they have separate supply and demand dynamics, and will, therefore, be discussed separately. This report presents the results of the HVS Survey on the performance of branded hotels, analysed by each hotel segment, as well as major cities. For each city we have presented the new supply, its market orientation and estimated the number of rooms under construction along with the probability of their development over a period of five years.
Survey Results
to witness further appreciation in the short-to-medium term. The focus on economic reforms and a change from a policy deadlock situation should provide the much-needed momentum to the Indian economy. Exhibit 2 shows the comparison between GDP growth, inflation and exchange rate from 2006/07 to 2011/12.
Despite the slowdown in the economies of America and Europe, foreign tourist arrivals (FTAs) were recorded at 6.29 million in 2011, an increase of 8.9% over 2010. The top source markets were USA (15.97%) followed by UK (12.57%) and Bangladesh (6.34%). Foreign Exchange Earnings (FEE) too witnessed a rise by 16.7% in 2011 over the previous year. Although the country witnessed a growth of 60% in FTAs from 2005 to 2011, it moved only five places in its world ranking from
rd th43 to 38 , during this period. Also, its percentage share of international tourist arrivals in the world continued to remain below 1% (0.64%) in 2011. Growth in FTAs has continued in 2012, albeit at a slower pace. From January-August 2012, FTAs registered an increase of 6.2% over the previous year, as compared to the 10% growth recorded during the same period in 2011 over that of 2010. FEE from tourism, on the other hand, rose by 23.7% in January-August 2012, as compared to a growth of 15.9% during January-August 2011, over the corresponding period of
2 2010. On the domestic visitation front, the country registered a growth of 13.8% in 2011 over the previous year crossingthe 850 million mark. According toWorld Travel & Tourism Council's(WTTC) Economic Impact 2012 –India report, domestic travel spending
Tourism Overview
2 Market Research and Statistics Division, Ministry of Tourism, GOI
36
38
40
42
44
46
48
50
-
2.0%
4.0%
6.0%
8.0%
10.0%
12.0%
2006/07 2007/08 2008/09 2009/10 2010/11 2011/12
Exchange Rate (`/US$) GDP growth at Factor Cost Inflation
Exhibit 2: Comparison between GDP Growth, Inflation and Exchange Rate
2012 HOTELS IN INDIA TRENDS & OPPORTUNITIES | PAGE 3
In Defense of Hospitality
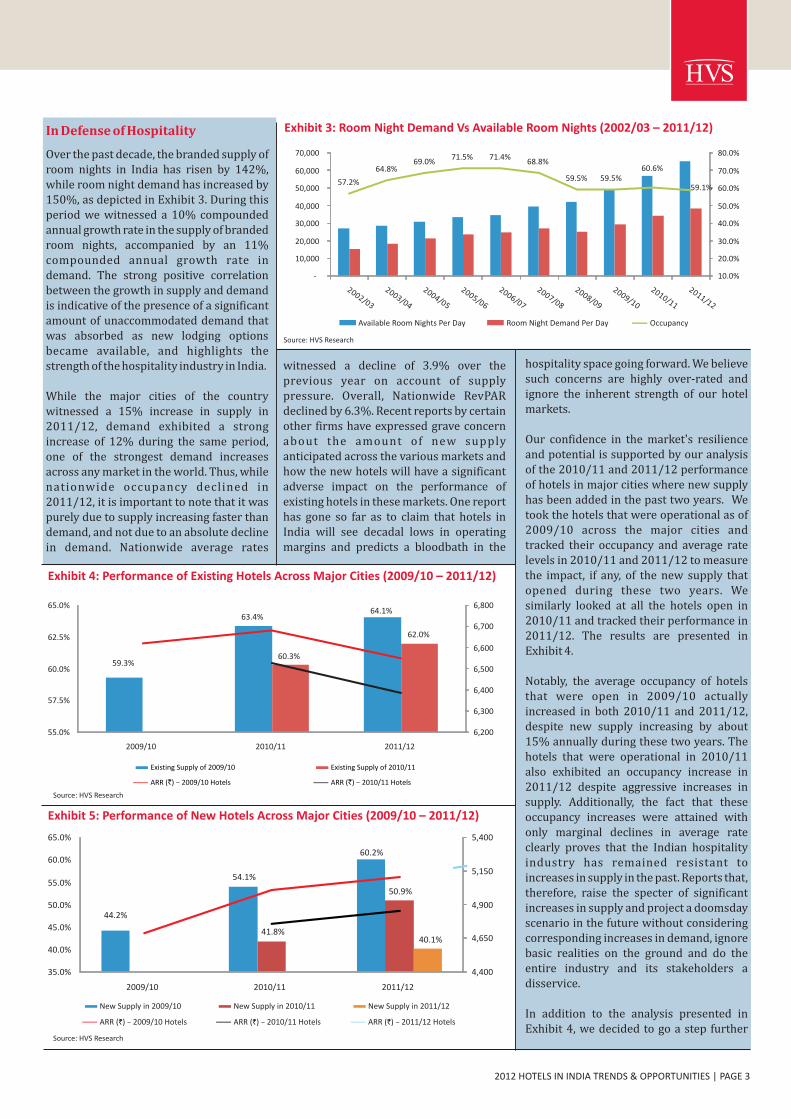
Over the past decade, the branded supply of room nights in India has risen by 142%, while room night demand has increased by 150%, as depicted in Exhibit 3. During this period we witnessed a 10% compounded annual growth rate in the supply of branded room nights, accompanied by an 11% compounded annual growth rate in demand. The strong positive correlation between the growth in supply and demand is indicative of the presence of a significant amount of unaccommodated demand that was absorbed as new lodging options became available, and highlights the strength of the hospitality industry in India.
While the major cities of the country witnessed a 15% increase in supply in 2011/12, demand exhibited a strong increase of 12% during the same period, one of the strongest demand increases across any market in the world. Thus, while nationwide occupancy declined in 2011/12, it is important to note that it was purely due to supply increasing faster than demand, and not due to an absolute decline in demand. Nationwide average rates
hospitality space going forward. We believe such concerns are highly over-rated and ignore the inherent strength of our hotel markets.
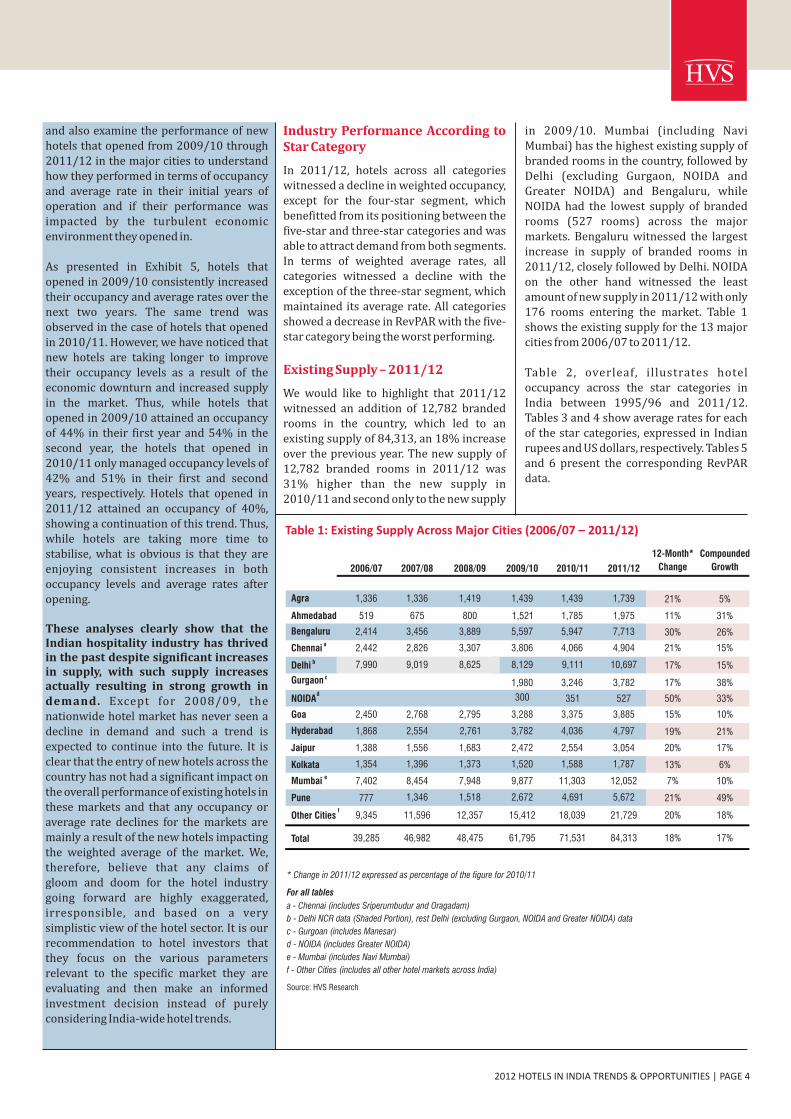
Our confidence in the market's resilience and potential is supported by our analysis of the 2010/11 and 2011/12 performance of hotels in major cities where new supply has been added in the past two years. We took the hotels that were operational as of 2009/10 across the major cities and tracked their occupancy and average rate levels in 2010/11 and 2011/12 to measure the impact, if any, of the new supply that opened during these two years. We similarly looked at all the hotels open in 2010/11 and tracked their performance in 2011/12. The results are presented in Exhibit 4.
Notably, the average occupancy of hotels that were open in 2009/10 actually increased in both 2010/11 and 2011/12, despite new supply increasing by about 15% annually during these two years. The hotels that were operational in 2010/11 also exhibited an occupancy increase in 2011/12 despite aggressive increases in supply. Additionally, the fact that these occupancy increases were attained with only marginal declines in average rate clearly proves that the Indian hospitality industry has remained resistant to increases in supply in the past. Reports that, therefore, raise the specter of significant increases in supply and project a doomsday scenario in the future without considering corresponding increases in demand, ignore basic realities on the ground and do the entire industry and its stakeholders a disservice.
In addition to the analysis presented in Exhibit 4, we decided to go a step further
Exhibit 3: Room Night Demand Vs Available Room Nights 2002/03 2011/12)( –
57.2%
64.8%69.0%
71.5% 71.4%68.8%
59.5% 59.5%60.6%
59.1%
10.0%
20.0%
30.0%
40.0%
50.0%
60.0%
70.0%
80.0%
-
10,000
20,000
30,000
40,000
50,000
60,000
70,000
Available Room Nights Per Day Room Night Demand Per Day Occupancy
Source: HVS Research
Source: HVS Research
Exhibit 5: Performance of New Hotels 2009/10 2011/12)Across Major Cities ( –
Source: HVS Research
59.3%
63.4%64.1%
60.3%
62.0%
6,200
6,300
6,400
6,500
6,600
6,700
6,800
55.0%
57.5%
60.0%
62.5%
65.0%
2009/10 2010/11 2011/12
Existing Supply of 2009/10 Existing Supply of 2010/11
ARR (`) – 2009/10 Hotels ARR ( ) ` 2010/11 Hotels–
44.2%
54.1%
60.2%
41.8%
50.9%
40.1%
4,400
4,650
4,900
5,150
5,400
35.0%
40.0%
45.0%
50.0%
55.0%
60.0%
65.0%
2009/10 2010/11 2011/12
New Supply in 2009/10 New Supply in 2010/11 New Supply in 2011/12
ARR ( ) ` – 2009/10 Hotels ARR ( ) ` – 2010/11 Hotels ARR ( ) ` – 2011/12 Hotels
witnessed a decline of 3.9% over the previous year on account of supply pressure. Overall, Nationwide RevPAR declined by 6.3%. Recent reports by certain other firms have expressed grave concern about the amount of new supply anticipated across the various markets and how the new hotels will have a significant adverse impact on the performance of existing hotels in these markets. One report has gone so far as to claim that hotels in India will see decadal lows in operating margins and predicts a bloodbath in the
Exhibit 4: Performance of Existing Hotels Across Major Cities (2009/10 2011/12)–
2012 HOTELS IN INDIA TRENDS & OPPORTUNITIES | PAGE 4
and also examine the performance of new hotels that opened from 2009/10 through 2011/12 in the major cities to understand how they performed in terms of occupancy and average rate in their initial years of operation and if their performance was impacted by the turbulent economic environment they opened in.
As presented in Exhibit 5, hotels that opened in 2009/10 consistently increased their occupancy and average rates over the next two years. The same trend was observed in the case of hotels that opened in 2010/11. However, we have noticed that new hotels are taking longer to improve their occupancy levels as a result of the economic downturn and increased supply in the market. Thus, while hotels that opened in 2009/10 attained an occupancy of 44% in their first year and 54% in the second year, the hotels that opened in 2010/11 only managed occupancy levels of 42% and 51% in their first and second years, respectively. Hotels that opened in 2011/12 attained an occupancy of 40%, showing a continuation of this trend. Thus, while hotels are taking more time to stabilise, what is obvious is that they are enjoying consistent increases in both occupancy levels and average rates after opening.
These analyses clearly show that the Indian hospitality industry has thrived in the past despite significant increases in supply, with such supply increases actually resulting in strong growth in demand. Except for 2008/09, the nationwide hotel market has never seen a decline in demand and such a trend is expected to continue into the future. It is clear that the entry of new hotels across the country has not had a significant impact on the overall performance of existing hotels in these markets and that any occupancy or average rate declines for the markets are mainly a result of the new hotels impacting the weighted average of the market. We, therefore, believe that any claims ofgloom and doom for the hotel industry going forward are highly exaggerated, irresponsible, and based on a very simplistic view of the hotel sector. It is our recommendation to hotel investors that they focus on the various parameters relevant to the specific market they are evaluating and then make an informed investment decision instead of purely considering India-wide hotel trends.
in 2009/10. Mumbai (including Navi Mumbai) has the highest existing supply of branded rooms in the country, followed by Delhi (excluding Gurgaon, NOIDA and Greater NOIDA) and Bengaluru, while NOIDA had the lowest supply of branded rooms (527 rooms) across the major markets. Bengaluru witnessed the largest increase in supply of branded rooms in 2011/12, closely followed by Delhi. NOIDA on the other hand witnessed the least amount of new supply in 2011/12 with only 176 rooms entering the market. Table 1 shows the existing supply for the 13 major cities from 2006/07 to 2011/12.
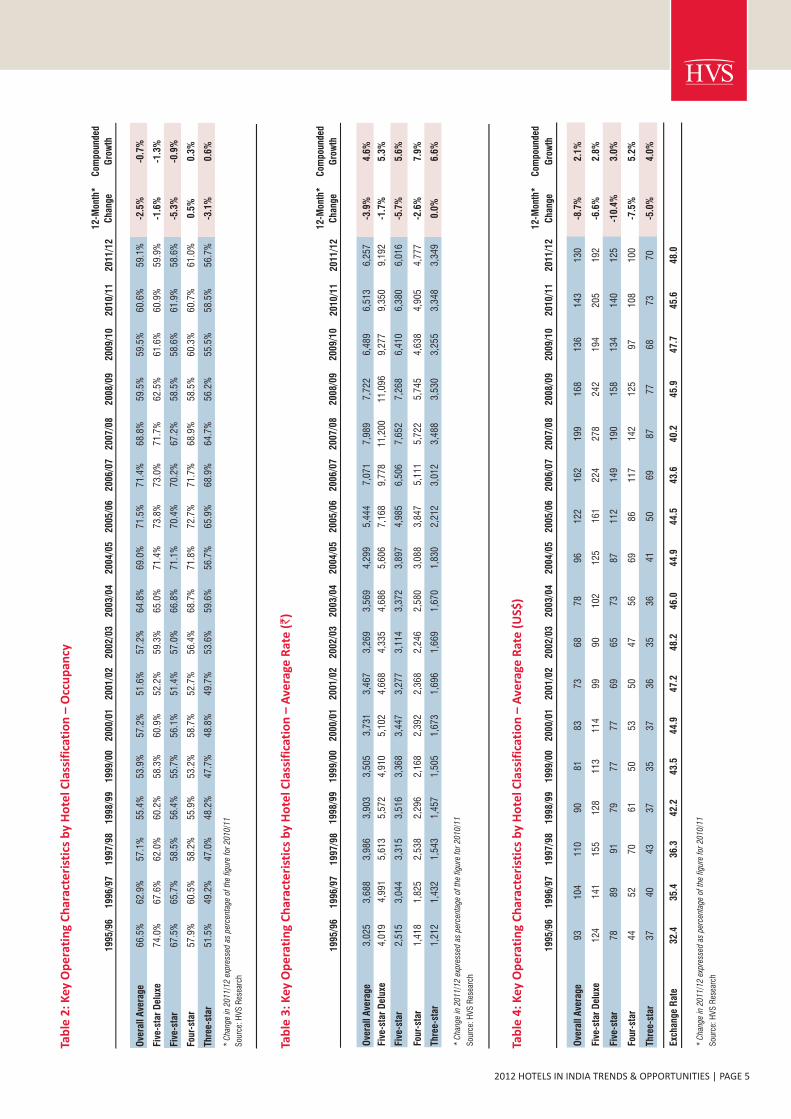
Table 2, overleaf, illustrates hotel occupancy across the star categories in India between 1995/96 and 2011/12. Tables 3 and 4 show average rates for each of the star categories, expressed in Indian rupees and US dollars, respectively. Tables 5 and 6 present the corresponding RevPAR data.
Industry Performance According to Star Category
Existing Supply 2011/12
In 2011/12, hotels across all categories witnessed a decline in weighted occupancy, except for the four-star segment, which benefitted from its positioning between the five-star and three-star categories and was able to attract demand from both segments. In terms of weighted average rates, all categories witnessed a decline with the exception of the three-star segment, which maintained its average rate. All categories showed a decrease in RevPAR with the five-star category being the worst performing.
We would like to highlight that 2011/12 witnessed an addition of 12,782 branded rooms in the country, which led to an existing supply of 84,313, an 18% increase over the previous year. The new supply of 12,782 branded rooms in 2011/12 was 31% higher than the new supply in2010/11 and second only to the new supply
–
Table 1: Existing Supply Across Major Cities (2006/07 – 2011/12)
* Change in 2011/12 expressed as percentage of the figure for 2010/11
For all tables
a - Chennai (includes Sriperumbudur and Oragadam)
b - Delhi NCR data (Shaded Portion), rest Delhi (excluding Gurgaon, NOIDA and Greater NOIDA) data
c - Gurgoan (includes Manesar)
d - NOIDA (includes Greater NOIDA)
e - Mumbai (includes Navi Mumbai)
f - Other Cities (includes all other hotel markets across India)
Source: HVS Research
12-Month* Compounded
2006/07 2007/08 2008/09 2009/10 2010/11 2011/12 Change Growth
Agra
Ahmedabad
Bengaluru
Chennai
Delhi
Gurgaon
NOIDA
Goa
Hyderabad
Jaipur
Kolkata
Mumbai
Pune
Other Cities
1,336
519
2,414
2,442
7,990
2,450
1,868
1,388
1,354
7,402
777
9,345
39,285Total
1,336
675
3,456
2,826
9,019
2,768
2,554
1,556
1,396
8,454
1,346
11,596
46,982
1,419
800
3,889
3,307
8,625
2,795
2,761
1,683
1,373
7,948
1,518
12,357
48,475
1,439
1,521
5,597
3,806
8,129
1,980
300
3,288
3,782
2,472
1,520
9,877
2,672
15,412
61,795
1,439
1,785
5,947
4,066
9,111
3,246
351
3,375
4,036
2,554
1,588
11,303
4,691
18,039
71,531
1,739
1,975
7,713
4,904
10,697
3,782
527
3,885
4,797
3,054
1,787
12,052
5,672
21,729
84,313
21%
11%
30%
21%
17%
17%
50%
15%
19%
20%
13%
7%
21%
20%
18%
5%
31%
26%
15%
15%
38%
33%
10%
21%
17%
6%
10%
49%
18%
17%
a
b
c
d
e
f
Tab
le 4
: K
ey O
pe
rati
ng
Ch
arac
teri
stic
s b
y H
ote
l Cla
ssif
icat
ion
– A
vera
ge R
ate
(U
S$)
1995
/96
1996
/97
1997
/98
1998
/99
1999
/00
2000
/01
2001
/02
2002
/03
2003
/04
2004
/05
2005
/06
20
06
/07
20
07/0
82
00
8/0
92
00
9/1
02
01
0/1
12
01
1/1
2
12
-Mon
th*
Cha
nge
Com
poun
ded
Gro
wth
Ove
rall
Ave
rage
9310
411
090
8183
7368
7896
122
162
199
168
136
143
130
-8.7
%2
.1%
Five
-sta
r D
elux
e12
414
115
512
811
311
499
9010
212
516
122
427
824
219
420
519
2-6
.6%
2.8
%
Five
-sta
r 78
8991
7977
7769
6573
8711
214
919
015
813
414
012
5-1
0.4
%3
.0%
Four
-sta
r44
5270
6150
5350
4756
6986
117
142
125
9710
810
0-7
.5%
5.2
%
Thre
e-st
ar37
4043
3735
3736
3536
4150
6987
7768
7370
-5.0
%4
.0%
Exch
ange
Rat
e32
.435
.436
.342
.243
.544
.947
.248
.246
.044
.944
.54
3.6
40.
24
5.9
47
.74
5.6
48
.0
* C
hang
e in
201
1/12
exp
ress
ed a
s pe
rcen
tage
of
the
figur
e fo
r 20
10/1
1
Sou
rce:
HV
S R
esea
rch
Tab
le 2
: K
ey O
pe
rati
ng
Ch
arac
teri
stic
s b
y H
ote
l Cla
ssif
icat
ion
– O
ccu
pan
cy
Ove
rall
Ave
rage
66.5
%62
.9%
57.1
%55
.4%
53.9
%57
.2%
51.6
%57
.2%
64.8
%69
.0%
71.5
%71
.4%
68.8
%59
.5%
59.5
%60
.6%
59.1
%-2
.5%
-0.7
%
Five
-sta
r D
elux
e74
.0%
67.6
%62
.0%
60.2
%58
.3%
60.9
%52
.2%
59.3
%65
.0%
71.4
%73
.8%
73.0
%71
.7%
62.5
%61
.6%
60.9
%59
.9%
-1.6
%-1
.3%
Five
-sta
r 67
.5%
65.7
%58
.5%
56.4
%55
.7%
56.1
%51
.4%
57.0
%66
.8%
71.1
%70
.4%
70.2
%67
.2%
58.5
%58
.6%
61.9
%58
.6%
-5.3
%-0
.9%
Four
-sta
r57
.9%
60.5
%58
.2%
55.9
%53
.2%
58.7
%52
.7%
56.4
%68
.7%
71.8
%72
.7%
71.7
%68
.9%
58.5
%60
.3%
60.7
%61
.0%
0.5%
0.3
%
Thre
e-st
ar51
.5%
49.2
%47
.0%
48.2
%47
.7%
48.8
%49
.7%
53.6
%59
.6%
56.7
%65
.9%
68.9
%64
.7%
56.2
%55
.5%
58.5
%56
.7%
-3.1
%0.6
%
* C
hang
e in
201
1/12
exp
ress
ed a
s pe
rcen
tage
of
the
figur
e fo
r 20
10/1
1
Sou
rce:
HV
S R
esea
rch
1995
/96
1996
/97
1997
/98
1998
/99
199
9/00
2000
/01
2001
/02
2002
/03
2003
/04
2004
/05
2005
/06
2006
/07
2007
/08
2008
/09
2009
/10
2010
/11
2011
/12
12-M
onth
*
Cha
nge
Com
poun
ded
Gro
wth
Tab
le 3
: K
ey O
pe
rati
ng
Ch
arac
teri
stic
s b
y H
ote
l Cla
ssif
icat
ion
– A
vera
ge R
ate
(`)
1995
/96
1996
/97
19
97/9
819
98/9
919
99/0
020
00/0
120
01/0
220
02/0
320
03/0
420
04/0
520
05/0
62
00
6/0
72
007
/08
20
08
/09
20
09
/10
20
10
/11
20
11
/12
12
-Mon
th*
Cha
nge
Com
poun
ded
Gro
wth
Ove
rall
Ave
rage
3,02
53,
688
3,98
63,
903
3,50
53,
731
3,46
73,
269
3,56
94,
299
5,44
47,
071
7,98
97,
722
6,48
96,
513
6,25
7-3
.9%
4.6
%
Five
-sta
r D
elux
e4,
019
4,99
15,
613
5,57
24,
910
5,10
24,
668
4,33
54,
686
5,60
67,
168
9,77
811
,200
11,0
969,
277
9,35
09,
192
-1.7
%5
.3%
Five
-sta
r 2,
515
3,04
43,
315
3,51
63,
368
3,44
73,
277
3,11
43,
372
3,89
74,
985
6,50
67,
652
7,26
86,
410
6,38
06,
016
-5.7
%5
.6%
Four
-sta
r1,
418
1,82
52,
538
2,29
62,
168
2,39
22,
368
2,24
62,
580
3,08
83,
847
5,11
15,
722
5,74
54,
638
4,90
54,
777
-2.6
%7
.9%
Thre
e-st
ar1,
212
1,43
21,
543
1,45
71,
505
1,67
31,
696
1,66
91,
670
1,83
02,
212
3,01
23,
488
3,53
03,
255
3,34
83,
349
0.0
%6
.6%
* C
hang
e in
201
1/12
exp
ress
ed a
s pe
rcen
tage
of
the
figur
e fo
r 20
10/1
1
Sou
rce:
HV
S R
esea
rch
2012 HOTELS IN INDIA TRENDS & OPPORTUNITIES | PAGE 5

Tab
le 6
: K
ey O
pe
rati
ng
Ch
arac
teri
stic
s b
y H
ote
l Cla
ssif
icat
ion
– R
evPA
R (
US$
)
1995
/96
1996
/97
1997
/98
1998
/99
1999
/00
2000
/01
2001
/02
2002
/03
2003
/04
2004
/05
2005
/06
20
06
/07
20
07/0
82
00
8/0
92
00
9/1
02
01
0/1
12
01
1/1
2
12
-Mon
th*
Cha
nge
Com
poun
ded
Gro
wth
Ove
rall
Ave
rage
6266
6350
4348
3839
5066
8711
613
710
081
8777
-11
.0%
1.4
%
Five
-sta
r D
elux
e92
9596
7766
6952
5366
8911
916
420
015
112
012
511
5-8
.1%
1.4
%
Five
-sta
r53
5853
4443
4336
3749
6279
105
128
9379
8774
-15
.2%
2.1
%
Four
-sta
r25
3141
3427
3126
2639
4963
8498
7359
6561
-7.0
%5
.6%
Thre
e-st
ar19
2020
1816
1818
1922
2333
4856
4338
4340
-7.9
%4
.7%
Exch
ange
Rat
e32
.435
.436
.342
.243
.544
.947
.248
.246
.044
.944
.54
3.6
40.
24
5.9
47
.74
5.6
48
.0
* C
hang
e in
201
1/12
exp
ress
ed a
s pe
rcen
tage
of
the
figur
e fo
r 20
10/1
1
Sou
rce:
HV
S R
esea
rch
Tab
le 5
: K
ey O
pe
rati
ng
Ch
arac
teri
stic
s b
y H
ote
l Cla
ssif
icat
ion
– R
evPA
R (
`)
1
995/
9619
96/9
719
97/9
819
98/9
919
99/0
020
00/0
120
01/0
220
02/0
320
03/0
420
04/0
520
05/0
62
00
6/0
72
007
/08
20
08
/09
20
09
/10
20
10
/11
20
11
/12
12
-Mon
th*
Cha
nge
Com
poun
ded
Gro
wth
Ove
rall
Ave
rage
2,01
22,
320
2,27
62,
162
1,88
92,
134
1,78
91,
870
2,31
32,
966
3,89
25,
049
5,49
64,
598
3,86
13,
947
3,69
8-6
.3%
3.9
%
Five
-sta
r D
elux
e2,
974
3,37
43,
480
3,35
42,
863
3,10
72,
437
2,57
13,
046
4,00
35,
290
7,13
88,
030
6,93
35,
715
5,69
45,
506
-3.3
%3
.9%
Five
-sta
r 1,
698
2,00
01,
939
1,98
31,
876
1,93
41,
684
1,77
52,
252
2,77
13,
509
4,56
75,
142
4,25
03,
756
3,94
93,
525
-10
.7%
4.7
%
Four
-sta
r82
11,
104
1,47
71,
283
1,15
31,
404
1,24
81,
267
1,77
22,
217
2,79
73,
665
3,94
23,
362
2,79
72,
977
2,91
4-2
.1%
8.2
%
Thre
e-st
ar62
470
572
570
271
881
684
389
599
51,
038
1,45
82,
075
2,25
71,
985
1,80
61,
959
1,89
9-3
.0%
7.2
%
* C
hang
e in
201
1/12
exp
ress
ed a
s pe
rcen
tage
of
the
figur
e fo
r 20
10/1
1
Sou
rce:
HV
S R
esea
rch
2012 HOTELS IN INDIA TRENDS & OPPORTUNITIES | PAGE 6
Future Supply
Over the years, HVS has followed a comprehensive approach for tracking new hotel development. We would like to state that a lot of effort goes into collating this data and then verifying many of these projects across various cities in terms of their development stage. Our tracking omits any flippant statements made to the media or announcements made by real estate developers to promote their brand and, therefore, get greater visibility. Thus, as we do each year, we have put together a list of developments under construction or those announced in each market that have a confirmed tie-up with an operator. Such developments have been analysed rationally, through the prism of an unbiased third party, for the probability factor of their development within the next five years.
The proposed supply of branded hotels in 2007/08 was 114,466 rooms, which declined to 94,115 rooms in 2008/09 due to the economic downturn. The decline continued through 2009/10 with the total proposed supply amounting to only 89,499 rooms. As the economy strengthened the proposed supply grew to 102,438 in 2010/11.
In the year 2011/12, we witnessed an 8.8% decline in proposed supply over the previous year to 93,355 rooms. The decline can partially be attributed to a substantial number of rooms in last year's proposed supply having become operational this year; these rooms are now included in this year's existing supply. Additionally, several projects that had their plans for development formalised and were in the supply pipeline till last year, have now been delayed or called-off on account of high borrowing costs, tight liquidity and perhaps a lowered confidence in the Indian economy and political leadership.
Numerous international hotel brands have entered the Indian hospitality market in the past decade and are now aggressively focusing on their expansion strategies. In Exhibit 6, we present the total operating inventory for the 20 largest hotel brands in the country as of September 2012.
In Table 7, we present the existing and proposed supply in each of the 13 major markets and 'other cities' covered in this report. Table 7 reflects the anticipated

2012 HOTELS IN INDIA TRENDS & OPPORTUNITIES | PAGE 7
Exhibit 6: Top 20 Hotel Brands by Existing Inventory – September 2012
-
2,000
4,000
6,000
8,000
10,000
12,000
Number of Rooms
Source: HVS Research
Table 8: Distribution of Existing and Proposed Branded Hotel Rooms 2006/07 2011/12)Across Major Cities ( –
2006/07 2007/08 2008/09 2009/10 2010/11 2011/12 2006/07 2007/08 2008/09 2009/10 2010/11 2011/12 2006/07 2007/08 2008/09 2009/10 2010/11 2011/12
Agra 1,336 1,336 1,419 1,439 1,439 1,739 764 670 400 510 667 650 32% 55% 75% 41% 22% 80%
Ahmedabad 519 675 800 1,521 1,785 1,975 2,230 3,664 3,058 2,339 2,319 2,550 60% 47% 71% 69% 73% 69%
Bengaluru 2,414 3,456 3,889 5,597 5,947 7,713 12,882 15,542 10,784 9,819 12,509 9,716 61% 60% 58% 65% 67% 71%
Chennai 2,442 2,826 3,307 3,806 4,066 4,904 6,213 7,147 4,945 5,995 7,819 7,547 68% 71% 67% 72% 57% 58%
Delhi 7,990 9,019 8,625 8,129
1,980
300
9,111 10,697 19,423 22,360 16,560 20,021 18,608 5,626 56% 51% 53% 75% 75% 87%
Gurgaon 3,246 3,782
5,818 55%
NOIDA 351 527
5,522 37%
Goa 2,450 2,768 2,795 3,288 3,375 3,885
3,058 3,353 2,178 1,736 2,154 2,422 58% 42% 31% 41% 53% 53%
Hyderabad 1,868 2,554 2,761 3,782 4,036 4,797
10,619 8,250 5,884 5,302 5,713 5,265 47% 64% 73% 63% 77% 74%
Jaipur 1,388 1,556 1,683 2,472 2,554 3,054
4,012 2,937 3,357 2,664 4,867 3,356 56% 53% 53% 77% 45% 52%
Kolkata 1,354 1,396 1,373 1,520 1,588 1,787
3,644 5,965 4,025 3,481 3,612 3,118 67% 49% 62% 51% 58% 74%
Mumbai 7,402 8,454 7,948 9,877 11,303 12,052
11,578 10,613 13,386 7,477 12,121 10,896 49% 62% 73% 60% 35% 47%
Pune 777 1,346 1,518 2,672 4,691 5,672
8,072 8,243 8,054 5,196 5,545 4,645 77% 66% 52% 67% 56% 69%
Other Cities 9,345 11,596 12,357 15,412 18,039 21,729
19,476 25,722 21,484 24,909 26,504 26,224 58% 60% 60% 65% 56% 48%
Total 39,285 46,982 48,475 61,795 71,531 84,313 101,971 114,466 94,115 89,449 102,438 93,355 58% 58% 60% 67% 60% 58%
Source: HVS Research
Existing Supply Proposed Supply Active Development of Supply
Table 7: Proposed Branded Hotel Rooms 2012/13 2016/17)Across Major Cities ( –
Existing Supply
2011/12
Proposed
Supply
Increase in Future
Supply
Active Development
of Supply Luxury Upscale Mid Market Budget Extended Stay
Agra 1,739 650 37% 80% 20.0% 0.0% 80.0% 0.0% 0.0%
Ahmedabad 1,975 2,550 129% 69% 9.8% 39.4% 26.9% 23.8% 0.0%
Bengaluru 7,713 9,716 126% 71% 20.0% 31.2% 23.4% 17.0% 8.4%
Chennai 4,904 7,547 154% 58% 19.9% 19.3% 32.9% 22.6% 5.3%
Delhi 10,697 5,626 53% 87% 18.4% 31.8% 33.8% 16.0% 0.0%
Gurgaon 3,782 5,818 154% 55% 23.2% 38.3% 20.7% 15.6% 2.1%
NOIDA 527 5,522 1048% 37% 32.5% 39.8% 10.6% 11.9% 5.3%
Goa 3,885 2,422 62% 53% 4.3% 4.5% 40.5% 45.5% 5.2%
Hyderabad 4,797 5,265 110% 74% 12.4% 28.5% 35.0% 17.3% 6.8%
Jaipur 3,054 3,356 110% 52% 3.3% 51.1% 26.3% 19.3% 0.0%
Kolkata 1,787 3,118 174% 74% 21.6% 30.4% 47.9% 0.0% 0.0%
Mumbai 12,052 10,896 90% 47% 30.0% 22.3% 32.4% 9.8% 5.5%
Pune 5,672 4,645 82% 69% 12.2% 24.3% 36.4% 25.5% 1.6%
Other Cities 21,729 26,224 121% 48% 0.7% 29.3% 49.0% 21.0% 0.0%
Total 84,313 93,355 111% 58% 14.5% 29.2% 35.3% 18.0% 3.0%
Source: HVS Research
2012 HOTELS IN INDIA TRENDS & OPPORTUNITIES | PAGE 8
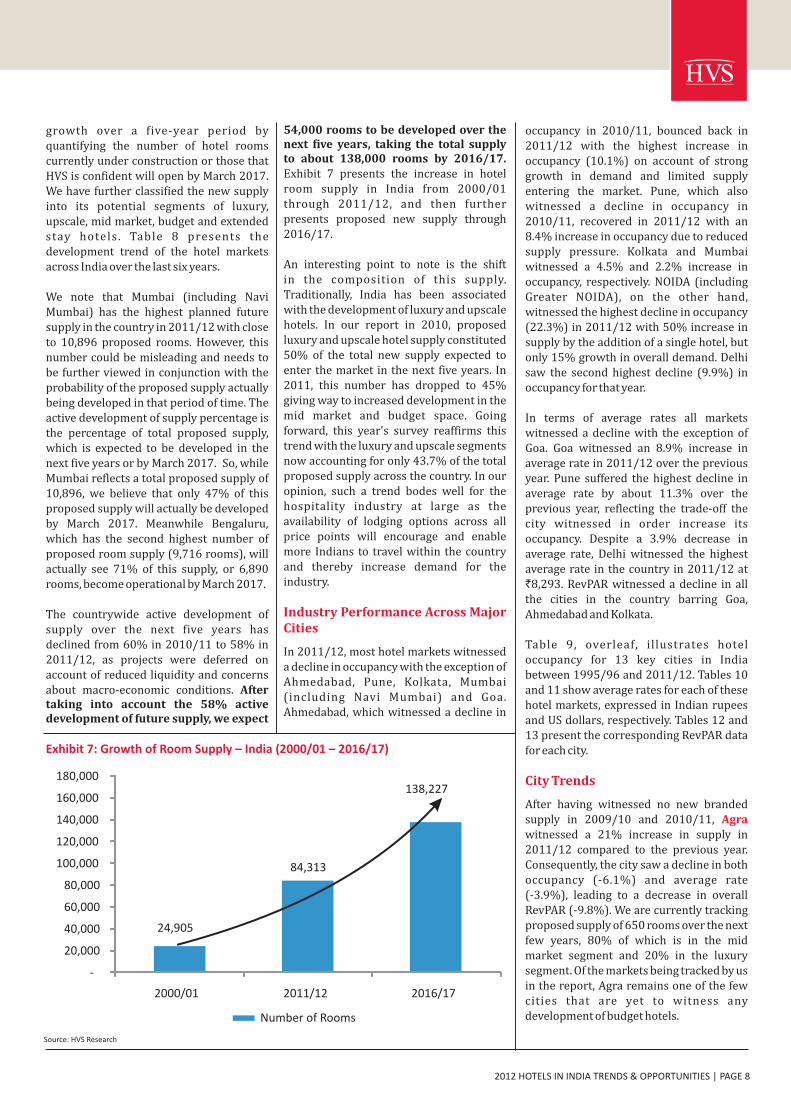
54,000 rooms to be developed over the next five years, taking the total supplyto about 138,000 rooms by 2016/17. Exhibit 7 presents the increase in hotel room supply in India from 2000/01 through 2011/12, and then further presents proposed new supply through 2016/17.
An interesting point to note is the shiftin the composition of this supply. Traditionally, India has been associated with the development of luxury and upscale hotels. In our report in 2010, proposedluxury and upscale hotel supply constituted 50% of the total new supply expected to enter the market in the next five years. In 2011, this number has dropped to 45% giving way to increased development in the mid market and budget space. Going forward, this year's survey reaffirms this trend with the luxury and upscale segments now accounting for only 43.7% of the total proposed supply across the country. In ouropinion, such a trend bodes well for the hospitality industry at large as the availability of lodging options across all price points will encourage and enable more Indians to travel within the country and thereby increase demand for the industry.
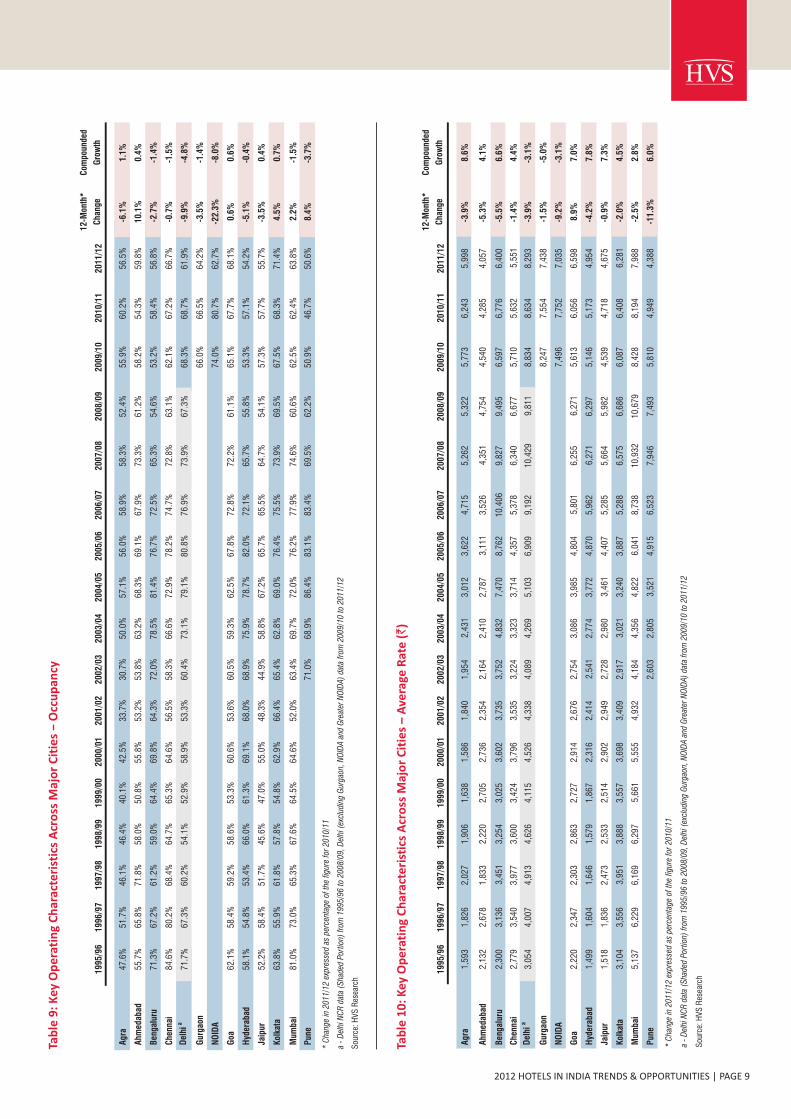
In 2011/12, most hotel markets witnessed a decline in occupancy with the exception of Ahmedabad, Pune, Kolkata, Mumbai (including Navi Mumbai) and Goa. Ahmedabad, which witnessed a decline in
Industry Performance Across Major Cities
occupancy in 2010/11, bounced back in 2011/12 with the highest increase in occupancy (10.1%) on account of strong growth in demand and limited supply entering the market. Pune, which also witnessed a decline in occupancy in 2010/11, recovered in 2011/12 with an 8.4% increase in occupancy due to reduced supply pressure. Kolkata and Mumbai witnessed a 4.5% and 2.2% increase in occupancy, respectively. NOIDA (including Greater NOIDA), on the other hand, witnessed the highest decline in occupancy(22.3%) in 2011/12 with 50% increase insupply by the addition of a single hotel, but only 15% growth in overall demand. Delhi saw the second highest decline (9.9%) in occupancy for that year.
In terms of average rates all markets witnessed a decline with the exception of Goa. Goa witnessed an 8.9% increase in average rate in 2011/12 over the previous year. Pune suffered the highest decline in average rate by about 11.3% over the previous year, reflecting the trade-off the city witnessed in order increase its occupancy. Despite a 3.9% decrease in average rate, Delhi witnessed the highest average rate in the country in 2011/12 at `8,293. RevPAR witnessed a decline in all the cities in the country barring Goa, Ahmedabad and Kolkata.
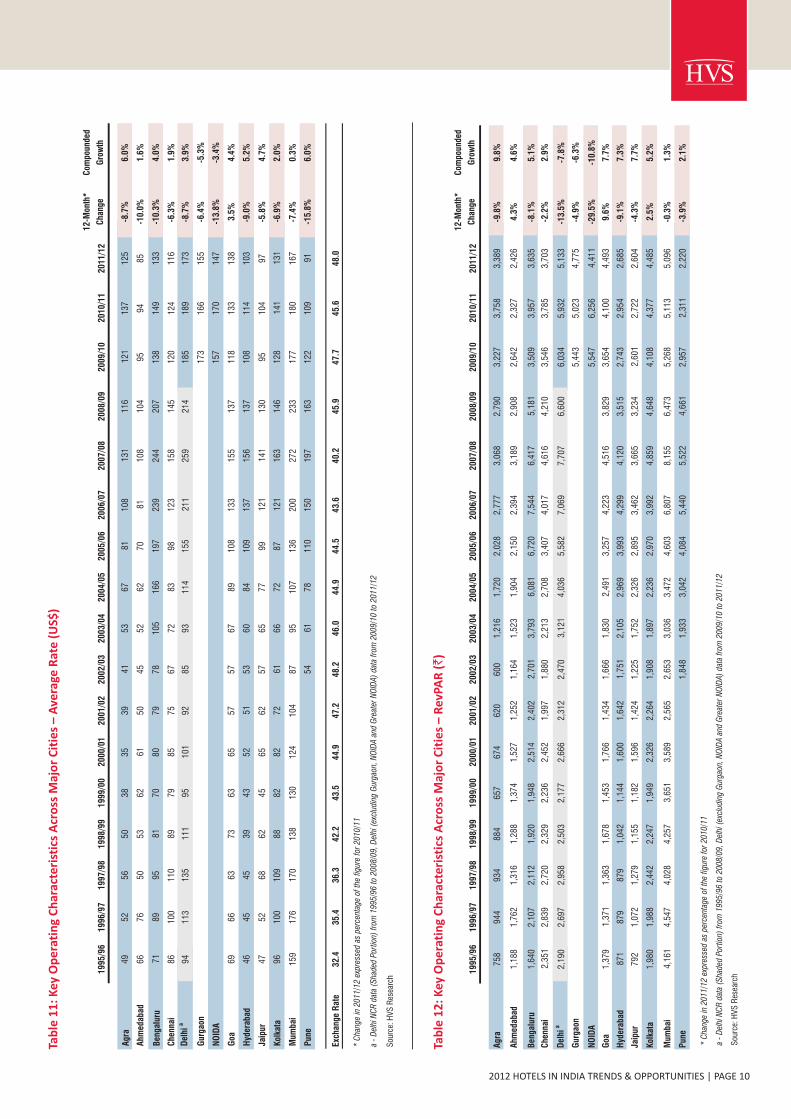
Table 9, overleaf, illustrates hotel occupancy for 13 key cities in India between 1995/96 and 2011/12. Tables 10 and 11 show average rates for each of these hotel markets, expressed in Indian rupees and US dollars, respectively. Tables 12 and 13 present the corresponding RevPAR data for each city.
After having witnessed no new branded supply in 2009/10 and 2010/11, witnessed a 21% increase in supply in 2011/12 compared to the previous year. Consequently, the city saw a decline in both occupancy (-6.1%) and average rate(-3.9%), leading to a decrease in overall RevPAR (-9.8%). We are currently tracking proposed supply of 650 rooms over the next few years, 80% of which is in the mid market segment and 20% in the luxury segment. Of the markets being tracked by us in the report, Agra remains one of the few cities that are yet to witness any development of budget hotels.
City Trends
Agra
Exhibit 7: Growth of Room Supply – India (2000/01 2016/17)–
Source: HVS Research
24,905
84,313
138,227
-
20,000
40,000
60,000
80,000
100,000
120,000
140,000
160,000
180,000
2000/01 2011/12 2016/17
Number of Rooms
growth over a five-year period by quantifying the number of hotel rooms currently under construction or those that HVS is confident will open by March 2017. We have further classified the new supply into its potential segments of luxury, upscale, mid market, budget and extended stay hotels. Table 8 presents the development trend of the hotel markets across India over the last six years.
We note that Mumbai (including Navi Mumbai) has the highest planned future supply in the country in 2011/12 with closeto 10,896 proposed rooms. However, thisnumber could be misleading and needs to be further viewed in conjunction with the probability of the proposed supply actually being developed in that period of time. The active development of supply percentage is the percentage of total proposed supply, which is expected to be developed in the next five years or by March 2017. So, while Mumbai reflects a total proposed supply of 10,896, we believe that only 47% of this proposed supply will actually be developedby March 2017. Meanwhile Bengaluru, which has the second highest number of proposed room supply (9,716 rooms), will actually see 71% of this supply, or 6,890 rooms, become operational by March 2017.
The countrywide active development of supply over the next five years hasdeclined from 60% in 2010/11 to 58% in 2011/12, as projects were deferred on account of reduced liquidity and concerns about macro-economic conditions. After taking into account the 58% active development of future supply, we expect
2012 HOTELS IN INDIA TRENDS & OPPORTUNITIES | PAGE 9
Tab
le 1
0:
Key
Op
era
tin
g C
har
acte
rist
ics
– A
vera
ge R
ate
A
cro
ss M
ajo
r C
itie
s(`
)
12-M
onth
*C
ompo
unde
d
199
5/9
619
96/
971
997
/98
199
8/9
919
99
/00
200
0/01
200
1/02
200
2/03
2003
/04
2004
/05
2005
/06
2006
/07
2007
/08
2008
/09
2009
/10
2010
/11
2011
/12
Cha
nge
Gro
wth
Agr
a47
.6%
51.7
%46
.1%
46.4
%40
.1%
42.5
%33
.7%
30.7
%50
.0%
57.1
%56
.0%
58.9
%58
.3%
52.4
%55
.9%
60.2
%56
.5%
-6.1
%1.
1%
Ahm
edab
ad55
.7%
65.8
%71
.8%
58.0
%50
.8%
55.8
%53
.2%
53.8
%63
.2%
68.3
%69
.1%
67.9
%73
.3%
61.2
%58
.2%
54.3
%59
.8%
10.1
%0.
4%
Ben
galu
ru71
.3%
67.2
%61
.2%
59.0
%64
.4%
69.8
%64
.3%
72.0
%78
.5%
81.4
%76
.7%
72.5
%65
.3%
54.6
%53
.2%
58.4
%56
.8%
-2.7
%-1
.4%
Che
nnai
84.6
%80
.2%
68.4
%64
.7%
65.3
%64
.6%
56.5
%58
.3%
66.6
%72
.9%
78.2
%74
.7%
72.8
%63
.1%
62.1
%67
.2%
66.7
%-0
.7%
-1.5
%
Del
hia
71.7
%67
.3%
60.2
%54
.1%
52.9
%58
.9%
53.3
%60
.4%
73.1
%79
.1%
80.8
%76
.9%
73.9
%67
.3%
68.3
%68
.7%
61.9
%-9
.9%
-4.8
%
Gur
gaon
66.0
%66
.5%
64.2
%-3
.5%
-1.4
%
NO
IDA
74.0
%80
.7%
62.7
%-2
2.3%
-8.0
%
Goa
62.1
%58
.4%
59.2
%58
.6%
53.3
%60
.6%
53.6
%60
.5%
59.3
%62
.5%
67.8
%72
.8%
72.2
%61
.1%
65.1
%67
.7%
68.1
%0.
6%0.
6%
Hyd
erab
ad58
.1%
54.8
%53
.4%
66.0
%61
.3%
69.1
%68
.0%
68.9
%75
.9%
78.7
%82
.0%
72.1
%65
.7%
55.8
%53
.3%
57.1
%54
.2%
-5.1
%-0
.4%
Jaip
ur52
.2%
58.4
%51
.7%
45.6
%47
.0%
55.0
%48
.3%
44.9
%58
.8%
67.2
%65
.7%
65.5
%64
.7%
54.1
%57
.3%
57.7
%55
.7%
-3.5
%0.
4%
Kol
kata
63.8
%55
.9%
61.8
%57
.8%
54.8
%62
.9%
66.4
%65
.4%
62.8
%69
.0%
76.4
%75
.5%
73.9
%69
.5%
67.5
%68
.3%
71.4
%4.
5%0.
7%
Mum
bai
81.0
%73
.0%
65.3
%67
.6%
64.5
%64
.6%
52.0
%63
.4%
69.7
%72
.0%
76.2
%77
.9%
74.6
%60
.6%
62.5
%62
.4%
63.8
%2.
2%-1
.5%
Pun
e71
.0%
68.9
%86
.4%
83.1
%83
.4%
69.5
%62
.2%
50.9
%46
.7%
50.6
%8.
4%-3
.7%
* C
hang
e in
201
1/12
exp
ress
ed a
s pe
rcen
tage
of
the
figur
e fo
r 20
10/1
1
a -
Del
hi N
CR
dat
a (S
hade
d Po
rtio
n) f
rom
199
5/96
to
2008
/09,
Del
hi (
excl
udin
g G
urga
on, N
OID
A a
nd G
reat
er N
OID
A)
data
fro
m 2
009/
10 t
o 20
11/1
2
Sou
rce:
HV
S R
esea
rch
12-M
onth
*C
ompo
unde
d
1995
/96
199
6/9
71
997
/98
1998
/99
1999
/00
2000
/01
2001
/02
2002
/03
2003
/04
2004
/05
2005
/06
2006
/07
2007
/08
2008
/09
2009
/10
2010
/11
2011
/12
Cha
nge
Gro
wth
Agr
a1,
593
1,82
62,
027
1,90
61,
638
1,58
61,
840
1,95
42,
431
3,01
23,
622
4,71
55,
262
5,32
25,
773
6,24
35,
998
-3.9
%8.
6%
Ahm
edab
ad2,
132
2,67
81,
833
2,22
02,
705
2,73
62,
354
2,16
42,
410
2,78
73,
111
3,52
64,
351
4,75
44,
540
4,28
54,
057
-5.3
%4.
1%
Ben
galu
ru2,
300
3,13
63,
451
3,25
43,
025
3,60
23,
735
3,75
24,
832
7,47
08,
762
10,4
069,
827
9,49
56,
597
6,77
66,
400
-5.5
%6.
6%
Che
nnai
2,77
93,
540
3,97
73,
600
3,42
43,
796
3,53
53,
224
3,32
33,
714
4,35
75,
378
6,34
06,
677
5,71
05,
632
5,55
1-1
.4%
4.4%
Del
hia
3,05
44,
007
4,91
34,
626
4,11
54,
526
4,33
84,
089
4,26
95,
103
6,90
99,
192
10,4
299,
811
8,83
48,
634
8,29
3-3
.9%
-3.1
%
Gur
gaon
8,24
77,
554
7,43
8-1
.5%
-5.0
%
NO
IDA
7,49
67,
752
7,03
5-9
.2%
-3.1
%
Goa
2,22
02,
347
2,30
32,
863
2,72
72,
914
2,67
62,
754
3,08
63,
985
4,80
45,
801
6,25
56,
271
5,61
36,
056
6,59
88.
9%7.
0%
Hyd
erab
ad1,
499
1,60
41,
646
1,57
91,
867
2,31
62,
414
2,54
12,
774
3,77
24,
870
5,96
26,
271
6,29
75,
146
5,17
34,
954
-4.2
%7.
8%
Jaip
ur1,
518
1,83
62,
473
2,53
32,
514
2,90
22,
949
2,72
82,
980
3,46
14,
407
5,28
55,
664
5,98
24,
539
4,71
84,
675
-0.9
%7.
3%
Kol
kata
3,10
43,
556
3,95
13,
888
3,55
73,
698
3,40
92,
917
3,02
13,
240
3,88
75,
288
6,57
56,
686
6,08
76,
408
6,28
1-2
.0%
4.5%
Mum
bai
5,13
76,
229
6,16
96,
297
5,66
15,
555
4,93
24,
184
4,35
64,
822
6,04
18,
738
10,9
3210
,679
8,42
88,
194
7,98
8-2
.5%
2.8%
Pun
e2,
603
2,80
53,
521
4,91
56,
523
7,94
67,
493
5,81
04,
949
4,38
8-1
1.3%
6.0%
* C
hang
e in
201
1/12
exp
ress
ed a
s pe
rcen
tage
of
the
figur
e fo
r 20
10/1
1
a -
Del
hi N
CR
dat
a (S
hade
d Po
rtio
n) f
rom
199
5/96
to
2008
/09,
Del
hi (
Gur
gaon
, NO
IDA
and
Gre
ater
NO
IDA
) da
ta f
rom
200
9/10
to
2011
/12
excl
udin
g
Sou
rce:
HV
S R
esea
rch
2012 HOTELS IN INDIA TRENDS & OPPORTUNITIES | PAGE 10
Tab
le 1
2:
Key
Op
era
tin
g C
har
acte
rist
ics
– R
evPA
R
A
cro
ss M
ajo
r C
itie
s(`
)
Tab
le 1
1:
Key
Op
era
tin
g C
har
acte
rist
ics
– A
vera
ge R
ate
(U
S$)
Acr
oss
Maj
or
Cit
ies
* C
hang
e in
201
1/12
exp
ress
ed a
s pe
rcen
tage
of
the
figur
e fo
r 20
10/1
1
a -
Del
hi N
CR
dat
a (S
hade
d Po
rtio
n) f
rom
199
5/96
to
2008
/09,
Del
hi (
Gur
gaon
, NO
IDA
and
Gre
ater
NO
IDA
) da
ta f
rom
200
9/10
to
2011
/12
excl
udin
g
Sou
rce:
HV
S R
esea
rch
Agr
a75
894
493
488
465
767
462
060
01,
216
1,72
02,
028
2,77
73,
068
2,79
03,
227
3,75
83,
389
Ahm
edab
ad1,
188
1,76
21,
316
1,28
81,
374
1,52
71,
252
1,16
41,
523
1,90
42,
150
2,39
43,
189
2,90
82,
642
2,32
72,
426
Ben
galu
ru1,
640
2,10
72,
112
1,92
01,
948
2,51
42,
402
2,70
13,
793
6,08
16,
720
7,54
46,
417
5,18
13,
509
3,95
73,
635
Che
nnai
2,35
12,
839
2,72
02,
329
2,23
62,
452
1,99
71,
880
2,21
32,
708
3,40
74,
017
4,61
64,
210
3,54
63,
785
3,70
3
Gur
gaon
5,44
35,
023
4,77
5
NO
IDA
5,54
76,
256
4,41
1
Goa
1,37
91,
371
1,36
31,
678
1,45
31,
766
1,43
41,
666
1,83
02,
491
3,25
74,
223
4,51
63,
829
3,65
44,
100
4,49
3
Hyd
erab
ad87
187
987
91,
042
1,14
41,
600
1,64
21,
751
2,10
52,
969
3,99
34,
299
4,12
03,
515
2,74
32,
954
2,68
5
Jaip
ur79
21,
072
1,27
91,
155
1,18
21,
596
1,42
41,
225
1,75
22,
326
2,89
53,
462
3,66
53,
234
2,60
12,
722
2,60
4
Kol
kata
1,98
01,
988
2,44
22,
247
1,94
92,
326
2,26
41,
908
1,89
72,
236
2,97
03,
992
4,85
94,
648
4,10
84,
377
4,48
5
Mum
bai
4,16
14,
547
4,02
84,
257
3,65
13,
589
2,56
52,
653
3,03
63,
472
4,60
36,
807
8,15
56,
473
5,26
85,
113
5,09
6
Pun
e1,
848
1,93
33,
042
4,08
45,
440
5,52
24,
661
2,95
72,
311
2,22
0
12-M
onth
* C
ompo
unde
d
19
95/9
619
96/9
719
97/
98
199
8/9
919
99/
00
200
0/0
12
001
/02
200
2/03
2003
/04
2004
/05
2005
/06
2006
/07
2007
/08
2008
/09
2009
/10
2010
/11
2011
/12
Cha
nge
Gro
wth
2,19
02,
697
2,95
82,
503
2,17
72,
666
2,31
22,
470
3,12
14,
036
5,58
27,
069
7,70
76,
600
6,03
45,
932
5,13
3D
elhi
a
12-M
onth
*C
ompo
unde
d
1995
/96
199
6/9
71
997
/98
1998
/99
1999
/00
2000
/01
2001
/02
2002
/03
2003
/04
2004
/05
2005
/06
2006
/07
2007
/08
2008
/09
2009
/10
2010
/11
2011
/12
Cha
nge
Gro
wth
Agr
a
Ahm
edab
ad
Ben
galu
ru
Che
nnai
Del
hia
Gur
gaon
NO
IDA
Goa
Hyd
erab
ad
Jaip
ur
Kol
kata
Mum
bai
Pun
e
4952
5650
3835
3941
5367
8110
813
111
612
113
712
5-8
.7%
6.0%
6676
5053
6261
5045
5262
7081
108
104
9594
85-1
0.0%
1.6%
7189
9581
7080
7978
105
166
197
239
244
207
138
149
133
-10.
3%4.
0%
8610
011
089
7985
7567
7283
9812
315
814
512
012
411
6-6
.3%
1.9%
9411
313
511
195
101
9285
9311
415
521
125
921
418
518
917
3-8
.7%
3.9%
173
166
155
-6.4
%-5
.3%
157
170
147
-13.
8%-3
.4%
6966
6373
6365
5757
6789
108
133
155
137
118
133
138
3.5%
4.4%
4645
4539
4352
5153
6084
109
137
156
137
108
114
103
-9.0
%5.
2%
4752
6862
4565
6257
6577
9912
114
113
095
104
97-5
.8%
4.7%
9610
010
988
8282
7261
6672
8712
116
314
612
814
113
1-6
.9%
2.0%
159
176
170
138
130
124
104
8795
107
136
200
272
233
177
180
167
-7.4
%0.
3%
5461
7811
015
019
716
312
210
991
-15.
8%6.
0%
Exch
ange
Rat
e32
.435
.436
.342
.243
.544
.947
.248
.246
.044
.944
.543
.640
.245
.947
.745
.648
.0
* C
hang
e in
201
1/12
exp
ress
ed a
s pe
rcen
tage
of
the
figur
e fo
r 20
10/1
1
a -
Del
hi N
CR
dat
a (S
hade
d Po
rtio
n) f
rom
199
5/96
to
2008
/09,
Del
hi (
Gur
gaon
, NO
IDA
and
Gre
ater
NO
IDA
) da
ta f
rom
200
9/10
to
2011
/12
excl
udin
g
Sou
rce:
HV
S R
esea
rch
-9.8
%9.
8%
4.3%
4.6%
-8.1
%5.
1%
-2.2
%2.
9%
-4.9
%-6
.3%
-29.
5%-1
0.8%
9.6%
7.7%
-9.1
%7.
3%
-4.3
%7.
7%
2.5%
5.2%
-0.3
%1.
3%
-3.9
%2.
1%
-13.
5%-7
.8%

2012 HOTELS IN INDIA TRENDS & OPPORTUNITIES | PAGE 11
Unlike Jaipur, its sister-city in the Golden Triangle itinerary, Agra has been unable to establish itself as a MICE destination and obtains demand primarily from the Group Leisure and Individual Leisure (Foreign and Domestic) segments. Growth in the MICE segment has been minimal mainly due to the lack of infrastructure developmentand limited connectivity to Delhi NCR. However, the recent opening of the six-lane, 165-kilometre long Yamuna Expressway that connects Greater NOIDA to Agra hashalved travel time from four hours to approximately two hours. Thus, we anticipate Agra to witness significantgrowth in demand especially in the MICE and Individual Leisure (Domestic) segments. HVS believes that although demand will continue to grow, the impending supply pressures are likely to keep average rates fairly muted in the next few years.
witnessed the highest increase in occupancy (10.1%) amongst the cities tracked in the survey despite an 11% increase in supply, which is indicative of the strong increase in demand. Marketwide average rate, however, declined by 5.3%, resulting in RevPAR growth of 4.3%. Demand in Ahmedabad is driven primarily by the commercial segment and largely depends on the project-related business emanating from industrial clusters located along the periphery of the city in Naroda, Vatwa, Changodar, Odhav, Aslali and Sanand, in addition to demand generated from the traditional CBD areas of Ashram Road and CG Road. In the past few years, owing to hectic development in the commercial sector, Sarkhej Gandhinagar Highway is slowly developing into an alternate CBD. Despite several delays, construction is also underway at Gujarat International Finance Tec-city (GIFT). Additionally, the much talked about Sabarmati Riverfront project was completed earlier this year and is expected to add a leisure element to an otherwise business oriented city. We are currently tracking a proposed supply of 2,550 rooms with only 69% of this supply expected to come online in the next five years. Nearly 50% of the 2,550 rooms is expected in the luxury and upscale space, which in our opinion will help in uplifting the image of the city, as currently Ahmedabad supports only one upscale hotel. Also, the meeting spaces planned within these hotels will help attract MICE
Ahmedabad
Tab
le 1
3:
Key
Op
era
tin
g C
har
acte
rist
ics
– R
evPA
R (
US$
)A
cro
ss M
ajo
r C
itie
s
12-M
onth
*C
ompo
unde
d
199
5/9
619
96/9
71
997
/98
199
8/9
91
999
/00
200
0/0
120
01/
02
2002
/03
2003
/04
2004
/05
2005
/06
2006
/07
2007
/08
2008
/09
2009
/10
2010
/11
2011
/12
Cha
nge
Gro
wth
Agr
a23
2726
2315
1513
1327
3845
6476
6168
8271
-14.
3%7.
2%
Ahm
edab
ad37
5036
3131
3427
2433
4248
5579
6455
5151
-0.9
%2.
0%
Ben
galu
ru51
6058
4845
5651
5682
135
151
173
160
113
7487
76-1
2.7%
2.6%
Che
nnai
7380
7558
5255
4239
4861
7792
115
9174
8377
-7.0
%0.
4%
Del
hia
6776
8160
5059
4951
6890
125
162
192
144
126
130
107
-17.
8%2.
9%
Gur
gaon
114
110
100
-9.7
%-6
.6%
NO
IDA
116
137
92-3
3.0%
-11.
1%
Goa
4339
3743
3439
3134
4056
7397
112
8477
9094
4.1%
5.0%
Hyd
erab
ad27
2524
2626
3635
3746
6689
9910
276
5865
56-1
3.6%
4.7%
Jaip
ur25
3035
2821
3630
2638
5265
7991
7055
6054
-9.1
%5.
1%
Kol
kata
6156
6751
4552
4840
4150
6691
121
101
8696
94-2
.6%
2.7%
Mum
bai
129
128
111
9384
8054
5566
7710
415
620
314
111
011
210
6-5
.3%
-1.2
%
Pun
e38
4267
9112
513
710
162
5146
-8.7
%2.
1%
Exch
ange
Rat
e3
2.4
35.4
36.3
42.2
43.5
44.
947
.248
.246
.044
.944
.543
.640
.245
.947
.745
.648
.0
* C
hang
e in
201
1/12
exp
ress
ed a
s pe
rcen
tage
of
the
figur
e fo
r 20
10/1
1
a -
Del
hi N
CR
dat
a (S
hade
d Po
rtio
n) f
rom
199
5/96
to
2008
/09,
Del
hi (
Gur
gaon
, NO
IDA
and
Gre
ater
NO
IDA
) da
ta f
rom
200
9/10
to
2011
/12
excl
udin
g
Sou
rce:
HV
S R
esea
rch
2012 HOTELS IN INDIA TRENDS & OPPORTUNITIES | PAGE 12
demand as the city has huge potential for the same given the large presence of the pharmaceutical sector in Ahmedabad. With the base inventory expected to more than double in the next few years, we believe hotels in the city will see occupancy pressures. Moreover, we project average rates for the overall Ahmedabad market to decline in the short term as hotels will focus on occupancy levels in a more competitive marketplace.
hotel market relies heavily on the IT and ITeS sector with a high foreign to domestic guest ratio, making it more vulnerable to global economic changes than most other cities in the country. This exposure to the international markets was one of the primary reasons why the city's hotels witnessed an overall drop of 8.1% in RevPAR in 2011/12. Additionally, a 30% increase in the number of hotel rooms in a single year augmented the pressure on average rates, resulting in most hotels adopting a volume-driven strategy. The distinct micromarkets of the city behaved differently, with the CBD that has the highest concentration of luxury and upscale hotels witnessing the maximum drop in average rates while still maintaining stable occupancies as compared to the previous year. Whitefield and Electronic City, on the other hand, recorded marginal increases in average rates owing to limited new supply entering these markets. 2011/12 also saw two new micromarkets being formed in Bengaluru – the ORR-Sarjapur stretch to the southeast and Yeshwantpur to the northwest of the city centre – increasing pressures on the average rate across the city with the commercial business traveller having more accommodation options to choose from.
Contrary to the common phenomenon of budget and mid market hotels recording higher occupancies than hotels with a higher positioning, Bengaluru continues to witness luxury and upscale hotels performing better on this parameter than the rest of the market owing to the latter facing stiff competition from the parallel unbranded hotel market in the city.
Ranking third in terms of existing supply, Bengaluru is anticipated to witness the highest number of new rooms entering the market over the short-to-medium term (9,716 of which 71% is under active development), a reflection of the continued investor confidence in the city. Bengaluru's
Bengaluru's
hotel market is expected to become more competitive with around 2,400 new rooms entering the market over the next couple of years, and we expect hotels to focus more on occupancy than average rates across all micromarkets of the city in the short-to-medium term. However, with nearly half of the new supply having an upscale/luxury positioning, we anticipate the marketwide average rates to witness an increase in the long term. There is an increased focus on the MICE segment with it contributing over 20% of the rooms business for most of the newer hotels that opened in the last one year. However, the city still lacks a world-class convention centre, restricting its ability to tap into this lucrative segment.
In 2011/12, witnessed marginal declines in both occupancy and average rates over the previous year, primarily due to the entrance of new supply in the market. In 2012/13, we expect further pressure on occupancy and rates as more than 1,000 new rooms get added to the market, including luxury properties such as the ITC Grand Chola, The Leela Palace and the Park Hyatt.
The micromarket of Old Mahabalipuram Road (OMR) is also expected to experience a drop in occupancy as city hotels and the new properties opening in Guindy actively compete for demand from this area. OMR is expected to witness a large influx of new supply in the next five years; approximately 2,000 rooms have been announced, and 5 0 % o f t h e m a re a c t ive ly u n d e r development. The micromarkets of Sriperumbudur and Oragadam, where several automobile and manufacturing units are located, continue to present opportunities for hotel development, especially in the budget and mid market segments.
Chennai is expected to witness continued growth in demand from the IT/ITeS, Automobile, and Manufacturing sectors, and the more traditional finance and government sectors. We expect the new iconic properties with large meeting spaces to attract large conferences and events into the city and help in marketing Chennai as a MICE destination. The new international and domestic airport terminals in Chennai are also expected to become operational this year, with the combined capacity of the two terminals increasing to 23 mppa from 12 mppa. We therefore also expect growth in the Airline segment in the city.
Chennai
Delhi (excluding Gurgaon, NOIDA andGreater NOIDA),
Gurgaon,
the second largest hotel
market in India after Mumbai, saw a compounded increase in supply of 15% over the past three years. In the same period, supply pressure and the overall state of the economy caused RevPar to decline by a compounded rate of roundly 8%. HVS is currently tracking 5,626 proposed rooms which is an increase of 53% in supply. However, we expect only 87% (4,901 rooms) of them to be developed over the next five years. A majority of this supply is in the Upscale and Mid-Market segment and is concentrated around the DIAL Aero city area which consists of 15 hotels that are either under construction or in advance planning stages. In the short term, Delhi continues to be a strong market and the phased introduction of the DIAL hotels from late 2012 to 2016 is likely to further induce demand for the city. Despite moderate supply pressures in the next few years, Delhi remains a strong market for hotels. Furthermore, the high costs and scarcity of land bodes well for Delhi as it continues to position the city as a high barrier to entry market.
which forms an integral part of the NCR, is amongst the top performing hotel markets in the country with an existing supply of approximately 3,800 hotel rooms as of 2011/12. The area has seen the addition of approximately 40
2million ft of office space between 2002/03 and 2011/12 and is expected to see a further addition of a near similar quantum over the next 10 years. The city saw the addition of approximately 1,100 rooms in 2010/11 and a further 550 rooms in 2011/12. In spite of these large changes in supply, marketwide occupancy grew byhalf a percentage point in 2010/11 f o l l o w e d b y a m a r g i n a l d i p o f approximately two percentage points in 2011/12. Average rates, however, saw some correction during these periods primarily on account of a large portion of the new supply being in the mid market and budget segments of hotels, which negatively impacted marketwide average rates. These drops in occupancy and rate however should not be looked at negatively, but instead as a step towards stabilised growth. Almost 60% of the existing supply in the market belongs to the mid market and budget category of hotels which is bound to bring the overall average rates of the city down.

Going forward, a supply pipeline of approximately 5,800 rooms is planned for development in Gurgaon with only 55%of these under active development. These increases in supply is expected to result in declines in both occupancy and average rates. However, in the medium-to-longterm with the continuous large-scale commercial development in the city, hotel performances are expected to be fairly stable.
recorded the sharpest decline in RevPAR(-29.5%) in 2011/12 primarily due to a significant increase in supply (50%) over that in 2010/11. NOIDA has traditionally supported a very small branded hotel base with the average inventory size rangingfrom 50-100 rooms. In the case of Greater NOIDA, branded hospitality development is a relatively recent phenomenon as the city only witnessed the entry of branded hotels for the inaugural Formula 1 motor race held at the Buddh International Circuit last year.
NOIDA and Greater NOIDA have steadily grown over the past decade to become hubs of industrial activity. Improvements in infrastructure such as the expansion of roads, development of the six-lane expressway connecting NOIDA with Greater NOIDA, the addition of a power sub-station near the NOIDA Special Economic Zone (NSEZ) and construction of several new housing projects has made the area attractive for investment. Additionally, the recently opened Yamuna Expressway project that connects Greater NOIDA to Agra is expected to boost vehicular movement from Delhi NCR to Greater NOIDA and onward to Agra. Going forth, HVS is tracking a staggering growth of 1,048% in supply with an addition of 5,522 new rooms. However, we expect only 37% (2,053 rooms) of these projects to be built over the next five years. HVS is of the opinion that as new hotels enter the market, NOIDA and Greater NOIDA will evolve into individual micromarkets.
In NOIDA, we anticipate the hotel market to face average rate pressure from new hotels expected to open in the East Delhi and Ghaziabad areas. Hotels in Greater NOIDA are anticipated to focus on shoring up occupancy in the short-to-medium term.
is the only major hotel market in the country that witnessed a year-on-year growth in both average rate and occupancy
NOIDA (including Greater NOIDA)
Goa
2012 HOTELS IN INDIA TRENDS & OPPORTUNITIES | PAGE 13
in 2011/12. The marginal growth in marketwide occupancy in spite of the recent opening of the Grand Hyatt is indicative of the market's ability to absorb quality branded hotels with relative ease. A near 9% growth in marketwide average rate is a result of a steady growth in room night demand. However, future growth will be influenced by improvements in transportation links, with Goa still awaitingclarity on the upgradation of the Dabolim Airport as well as the development of the proposed Mopa Airport in the Pernem district.
Additionally, the state continues to have high barriers to entry and seeking the relevant approvals and permissions to construct a hotel coupled with the CRZ regulations (some of which are likely to see improvements in the near future) make it difficult for developers to open properties across the shores of Goa.
As stated in previous HVS publications,Goa's lack of clarity regarding land-use norms continues to limit the proposed supply entering the state. Of the 2,422 rooms that are proposed to enter the market, only about 53% are under active development. Almost all of the proposed supply will be centred around the Candolim-Vagator belt of North Goa. Overall, our future outlook for Goa continues to remain positive. We expect the hotel market to successfully absorb the proposed supply and continue to sustain marketwide occupancies in the late 60s to early 70s in the short-to-medium term. Average rates are expected to continue witnessing a steady and sustainable increase in the short-to-medium term as well.
has witnessed a sharp decline in RevPAR over the past five years with a compounded decrease of 10.2%. Supply pressure has kept occupancies and average rates suppressed and the ongoing political disorder clubbed with a slowing global and national economy has further impacted the performance of hotels in the city. Although existing companies have resumed business with a moderate pickup in demand of 3%, new companies and investments are reluctant to consider Hyderabad given the current political uncertainty associated with the city. Though the immediate outlook for Hyderabad may seem bleak with supply
Hyderabad
outpacing demand, the city has proved to be fairly resilient by absorbing a 17% compounded increase in supply over the past five years resulting in a 10.2% compounded drop in RevPAR for the same period.
Hyderabad is scheduled to host one of the biggest international events to be held in India; the International Bio-Diversity Conference in October 2012. The conference is likely to attract 8,000 international delegates, which is a first for the city. The establishing of India's first conventions bureau last year, the Hyderabad Convention Visitors Bureau, is further expected to enhance meeting and conferencing demand for the city in the long-run.
We are currently tracking proposed supply of 5,265 rooms over the next five years withabout 74% under active development.A majority of the proposed supply (63.5%) is expected in the upscale and mid market segments. HVS believes that although demand will continue to grow, the impending supply pressures are likely to keep the occupancy and average rates fairly muted in the short-run.
continues to be one of the premier leisure destinations in the country given its rich historic flavour, vibrant culture and the marketing efforts of local and international travel trade companies as one of the three key destinations on the famous Golden Triangle itinerary together with Delhi and Agra. In recent times, the city has also become a key MICE destination catering to large incentive tours, corporate residential meetings and weddings. The competitive rates the Jaipur hotel market is able to offer, coupled with the fact that the city also offers an opportunity to use an extra day for leisure activities for corporate groups, serves as an important selling tool. Additionally, the wedding market in the city, which has always been a large contributor to hotel revenues, is also expected to see growth with the concept of destination weddings gaining immense popularity. Jaipur as a city is able to offer the historic splendour and setting making it ideal for grand Indian weddings. The city witnessed a 3.5% drop in occupancy in 2011/12 over that of the previous year as well as a marginal decline in marketwide average rates. 2011/12 also witnessed the introduction of
Jaipur
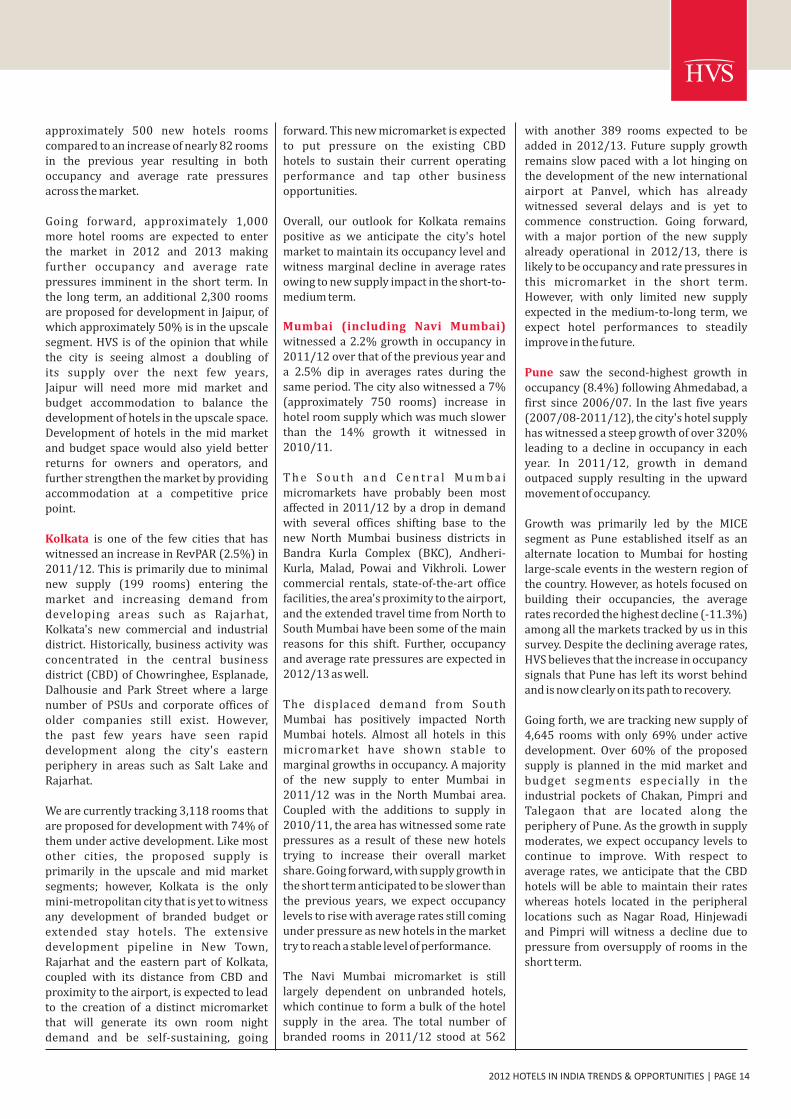
approximately 500 new hotels rooms compared to an increase of nearly 82 rooms in the previous year resulting in both occupancy and average rate pressures across the market.
Going forward, approximately 1,000more hotel rooms are expected to enterthe market in 2012 and 2013 making further occupancy and average rate pressures imminent in the short term. In the long term, an additional 2,300 rooms are proposed for development in Jaipur, of which approximately 50% is in the upscale segment. HVS is of the opinion that while the city is seeing almost a doubling ofits supply over the next few years,Jaipur will need more mid market and budget accommodation to balance the development of hotels in the upscale space. Development of hotels in the mid market and budget space would also yield better returns for owners and operators, and further strengthen the market by providing accommodation at a competitive price point.
is one of the few cities that has witnessed an increase in RevPAR (2.5%) in 2011/12. This is primarily due to minimal new supply (199 rooms) entering the market and increasing demand from developing areas such as Rajarhat, Kolkata's new commercial and industrial district. Historically, business activity was concentrated in the central business district (CBD) of Chowringhee, Esplanade, Dalhousie and Park Street where a large number of PSUs and corporate offices of older companies still exist. However,the past few years have seen rapid development along the city's eastern periphery in areas such as Salt Lake and Rajarhat.
We are currently tracking 3,118 rooms that are proposed for development with 74% of them under active development. Like most other cities, the proposed supply is primarily in the upscale and mid market segments; however, Kolkata is the only mini-metropolitan city that is yet to witness any development of branded budget or extended stay hotels. The extensive development pipeline in New Town, Rajarhat and the eastern part of Kolkata, coupled with its distance from CBD and proximity to the airport, is expected to lead to the creation of a distinct micromarket that will generate its own room night demand and be self-sustaining, going
Kolkata
forward. This new micromarket is expected to put pressure on the existing CBDhotels to sustain their current operating performance and tap other business opportunities.
Overall, our outlook for Kolkata remains positive as we anticipate the city's hotel market to maintain its occupancy level and witness marginal decline in average rates owing to new supply impact in the short-to-medium term.
witnessed a 2.2% growth in occupancy in 2011/12 over that of the previous year and a 2.5% dip in averages rates during the same period. The city also witnessed a 7% (approximately 750 rooms) increase in hotel room supply which was much slower than the 14% growth it witnessed in 2010/11.
T h e S o u t h a n d C e n t r a l M u m b a i micromarkets have probably been most affected in 2011/12 by a drop in demand with several offices shifting base to thenew North Mumbai business districts in Bandra Kurla Complex (BKC), Andheri-Kurla, Malad, Powai and Vikhroli. Lower commercial rentals, state-of-the-art office facilities, the area's proximity to the airport, and the extended travel time from North to South Mumbai have been some of the main reasons for this shift. Further, occupancy and average rate pressures are expected in 2012/13 as well.
The displaced demand from SouthMumbai has positively impacted North Mumbai hotels. Almost all hotels in this micromarket have shown stable to marginal growths in occupancy. A majority of the new supply to enter Mumbai in 2011/12 was in the North Mumbai area. Coupled with the additions to supply in 2010/11, the area has witnessed some rate pressures as a result of these new hotels trying to increase their overall market share. Going forward, with supply growth in the short term anticipated to be slower than the previous years, we expect occupancy levels to rise with average rates still coming under pressure as new hotels in the market try to reach a stable level of performance.
The Navi Mumbai micromarket is still largely dependent on unbranded hotels, which continue to form a bulk of the hotel supply in the area. The total number of branded rooms in 2011/12 stood at 562
Mumbai (including Navi Mumbai)
with another 389 rooms expected to be added in 2012/13. Future supply growth remains slow paced with a lot hinging on the development of the new international airport at Panvel, which has already witnessed several delays and is yet to commence construction. Going forward, with a major portion of the new supply already operational in 2012/13, there is likely to be occupancy and rate pressures in this micromarket in the short term.However, with only limited new supply expected in the medium-to-long term, we expect hotel performances to steadily improve in the future.
saw the second-highest growth in occupancy (8.4%) following Ahmedabad, a first since 2006/07. In the last five years (2007/08-2011/12), the city's hotel supply has witnessed a steep growth of over 320% leading to a decline in occupancy in each year. In 2011/12, growth in demand outpaced supply resulting in the upward movement of occupancy.
Growth was primarily led by the MICE segment as Pune established itself as an alternate location to Mumbai for hosting large-scale events in the western region of the country. However, as hotels focused on building their occupancies, the average rates recorded the highest decline (-11.3%) among all the markets tracked by us in this survey. Despite the declining average rates, HVS believes that the increase in occupancy signals that Pune has left its worst behind and is now clearly on its path to recovery.
Going forth, we are tracking new supply of 4,645 rooms with only 69% under active development. Over 60% of the proposed supply is planned in the mid market and budget segments especially in the industrial pockets of Chakan, Pimpri and Talegaon that are located along the periphery of Pune. As the growth in supply moderates, we expect occupancy levels to continue to improve. With respect to average rates, we anticipate that the CBD hotels will be able to maintain their rates whereas hotels located in the peripheral locations such as Nagar Road, Hinjewadi and Pimpri will witness a decline due to pressure from oversupply of rooms in the short term.
Pune
2012 HOTELS IN INDIA TRENDS & OPPORTUNITIES | PAGE 14
2012 HOTELS IN INDIA TRENDS & OPPORTUNITIES | PAGE 15
requirements of guests and not be based solely on a brand's wish list.
For the past couple of years, we have been highlighting the changing nature of ownership in the hospitality industry and predicting a new phase where more hotels are bought and sold in the marketplace. Since our last Trends & Opportunities report, we have seen several transactionsin our sector and we expect to see moreof them in the future. It is our opinion that the industry is heading into a consolidation phase that will play itself out over the next 12-24 months. Investments made by institutional parties in 2006-2008 in hotel companies are also approaching the end of their investment horizon and will lead to some transaction activity over the next 12 months.
We continue to believe that there are significant opportunities across hotel positionings in the MICE segment. While they wait for the development of full-fledged convention centres across various cities, hotel developers are increasingly taking matters into their own hands and building hotels with extensive meeting and conference facilities. The ITC Grand Chola in Chennai and the Sheraton and Vivanta by Taj in Bengaluru are some examples of this phenomenon. We believe that there is need for meeting and conferencing facilities across Tier 1 and Tier 2 cities and investors should look into the potential of this segment in their respective markets and capitalise on the opportunity.
Environmental sustainability in hotels has quickly transformed from an optional philanthropic activity to one that bears close scrutiny in order to control spiraling operational costs. Where utility costs stand at 7-9% of a hotel's operational expenses, this number is getting bigger giventhe increasing demand of electricity from power plants and rapidly decliningwater availability, especially in India. An investment in environmental sustainability is returned several times over in termsof instantaneously reduced operational costs, stable utility rates, and guaranteed availability of resources in the upcoming years. A 10-20% reduction in energy consumption can be readily achieved through no-cost and low-cost measures, and can amount to a hefty 2-4% of the hotel's GOP margin.
Opportunities
An interesting development is currently unfolding for Indian tourist destinations. According to our research and discussion with some of the larger tour operators, HVS is aware that there is a buyer-pressure for India, which is building. With the recent troubles in the Middle East, countries like Egypt, Syria, Lebanon and Jordan that used to attract a fair number of western tourists and also Russians tour groups, are no longer seen as safe destinations for tourism. Thus, these large tour operators are looking for alternate destinations and India possibly could be a beneficiary but for its lack of adequate tourism infrastructure. The basic problem is that hot spots like Goa simply do not have enough capacity to absorb these tourists, as we are talking about a few million tourists that needto be accommodated in a single season.While this may be a temporary phase there is an opportunity to convert this demand into a stable source of business for hotels and make it a long term trend.
Unfortunately, another factor that goes against India is the high cost of air travel within the country on account of very high fuel costs which today account for 50% or more of the operating cost of airlines. In fact if there was one single factor that webelieve can continue to adversely impact hotel occupancies in India it would be the high cost of air travel, which is forcing Indians to stop traveling within India and explore cheaper options outside of the country. Even business travel within India is down as airfares have gone up by nearly 100% in the past 12 months.
Traditionally, Goa has been the favourite hot spot for leisure tourism in India. However, a heartening development has been the emergence of Kashmir as a destination for local tourists. Two hotel chains – Vivanta by Taj and LaLiT have opened hotels here and they are both exceeding market expectations. We hope that in times to come, more people will consider developing hotel products in Kashmir as it has tremendous potential and will also help bring normalcy back to the region. In the south in Kerala, Bekal is becoming a new hot destination. Two new hotels, again Vivanta by Taj and the LaLiT, are providing a unique new holiday experience to guest travellers. We believe that developing good upscale hotels in new leisure locations is a growing trend and will help to expand tourism into India.
Future Trends
Our analysis of hotel performance data for the past 17 years reveals that except for 2008/09, we have not seen room night demand decline in the country, and any declines in occupancy levels have been a result of supply increasing faster than demand. It is therefore very important to track future supply when projecting future performance for any market. Our current analysis reveals that unlike previous cycles where significant number of hotel rooms entered the markets in very short periods of time, future supply is now more evenly spread out and should have a less detrimental impact on marketwide occupancy levels.
Another trend that we have observed and that will become more relevant in the future is the nature of capital that is now flowing into the Indian hospitality industry. Historically, while a majority of hotel development was funded either by high net-worth individuals or real estatefirms, we are now increasingly seeing institutional players invest in the hospitality space, especially in the budget and mid market space. Investment by such players brings with it a disciplined approach to the process, with any investment based on thorough market research and due diligence, generally ensuring that unfeasible projects are not developed on a whim and that new supply is not added to markets indiscriminately. Such an approach will ensure that any development is purely based on Return On Investment (ROI) instead of Return On Ego (ROE) and also inspire confidence amongst lenders and other stakeholders.
While institutional investors are very focused on maximising operational margins, they are just as committed to development costs of the hotels they build. As part of their drive to reduce input costs, investors are questioning the brand standards dictated by hotel companies and the relevance or requirements for some of them. As the industry matures and hotel investors continue to become more knowledgeable and savvy, it is our opinion that hotel brands can no longer simply mandate such requirements, unless they can prove to owners that the additional costs incurred will lead to greater returns. As our industry heads towards critical mass, we believe that hotels will now have to be designed to meet the actual

For participation:Please write to [email protected] OR log on to www.hicsaconference.com
thHVS, 6 Floor, Tower - C, Building No. 8, DLF Cyber City Phase II, Gurgaon 122 002, INDIA , Tel: +91 124 4616 000, Fax: +91 124 4616 001
Block Your
DatesPATRONS
PLATINUM PARTNERS
GOLD PARTNERS
SUPPORTED BY
Hosted by
DEBT
LICENSING HR
DELAYS
OUTLOOK
TH9 HOTEL INVESTMENT CONFERENCE - SOUTH ASIA (HICSA) 2013: APRIL 3-4, GRAND HYATT MUMBAI
2013
Highlights:4 Do the deals!4 Meet the most influential decision makers4 Spectacular networking opportunities4 Global CEO outlook
Notable Speakers
Arne M SorensonPresident & CEO
Marriott International
Christopher J NassettaPresident & CEO
Hilton Worldwide
Frits van PaasschenPresident & CEO
Starwood Hotels & Resorts
Mark S HoplamazianPresident & CEO
Hyatt Hotels Corporation
Meinhard HuckPresident
Swissôtel Hotels & Resorts
Steve Rushmore Chairman & Founder
HVS Hospitality Services
Shriji Arvind Singh MewarChairman & MD
HRH Group of Hotels
Raymond BicksonManaging Director & CEO
Taj Hotels Resorts & Palaces
About HVSHVS
www.hvs.com
is the world's leading consulting and services organization focused on the hotel,
restaurant, shared ownership, gaming, and leisure industries. Established in 1980,
the company performs more than 2,500 assignments per year for virtually every
major industry participant. HVS principals are regarded as the leading professionals
in their respective regions of the globe. Through a worldwide network of 34 offices
staffed by 450 seasoned industry professionals, HVS provides an unparalleled range
of complementary services for the hospitality industry. For further information
regarding our expertise and specifics about our services, please visit .
For further information please contact [email protected] or [email protected]
About Consulting and Valuation Over the last decade, we have established ourselves as market leaders and the scope
of our professional services has expanded to include a wide range of consulting
activities, all geared to enhance economic returns and asset value for our clients.
The Consulting and Valuation team comprises of highly experienced industry
professionals offering the utmost level of expertise and credibility. Our consultants
understand the hotel business and have received qualifications from leading
hospitality schools across the world, while also possessing actual hotel operating
experience.
OUR SERVICES
As part of our Consulting and Valuation services, we offer the following:
?Market Studies?Feasibility Studies and Return-on-investment Analyses?Development Strategy Recommendations?Valuations (Single Asset and Portfolio)?Market Entry Strategy Studies?Land Bid Evaluations and Residual Land Valuations?Investment and Transaction Advisory Services (Buy and Sell Side)?Operator Search and Management Contract Negotiations?Operational Audit & Advisory Services
Kaushik Vardharajan is Managing Director HVS Hospitality Services - India. He joined HVS' New York office in 2001 and moved to the New Delhi office in 2008
and soon became a partner at the Indian operations of HVS. Kaushik has worked on over 1,500 market studies, feasibility analyses, and valuations in North America and India, with a special focus on large mixed-use projects and portfolio valuations. Kaushik is also a Member ofthe Royal Institute of Chartered Surveyors (RICS) and is part of the Valuation Working Committee of RICS, which is responsible for establishing professional standards for property valuations in India. He has also taught courses and spoken at New York University, Johnson & Wales University, and the Indian School of Business.
About the Authors
Y a s h a a s R a j a n i s a Consulting & Valuation Analyst with HVS' New Delhi office, since 2011. He holds a Bachelor in Business Studies from Shaheed Sukhdev
College of Business Studies, University of Delhi and is currently pursuing a CFA charter. Since joining HVS, Yashaas has worked on several feasibility studies and valuations in India and Bangladesh.
www.hvs.com HVS Hospitality Services th 6 Floor, Building 8-C, DLF Cyber City, Phase - II, Gurgaon 122 002, INDIA