Embed Size (px)
Citation preview

2012 Election Analysis
Post-Campaign

President Obama dominated the electoral college 332-206 Won every Battleground State except for NC
2008 Election Results 2012 Election Results
Obama – 365 McCain – 173 Obama – 332 Romney – 206
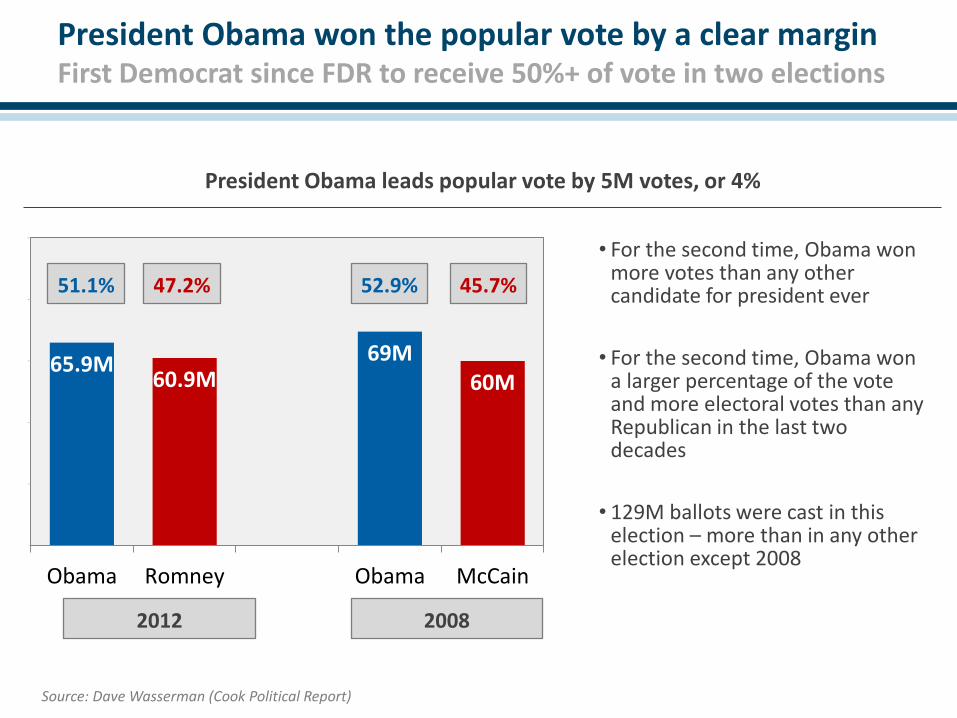
65.9M 60.9M
69M 60M
0
20
40
60
80
100
Obama Romney Obama McCain
President Obama won the popular vote by a clear margin First Democrat since FDR to receive 50%+ of vote in two elections
2012 2008
President Obama leads popular vote by 5M votes, or 4%
45.7% 52.9% 47.2% 51.1%
• For the second time, Obama won more votes than any other candidate for president ever
• For the second time, Obama won a larger percentage of the vote and more electoral votes than any Republican in the last two decades
• 129M ballots were cast in this election – more than in any other election except 2008
Source: Dave Wasserman (Cook Political Report)

The race was relatively stable over time DNC produced 2-point bump, 1st Debate produced 2-point drop
OFA Internal Polling 2-Way Support in Battleground States over Time
Source: OFA Analytics Polling and Modeling

Campaign executed on five key priorities
Build relationships with key constituencies
• Won decisive margins among Moderates, Women, Latinos, and AAPI, and Youth. Turnout matched record 2008 levels among African Americans, Latinos, and Youth
Grow and maintain
grassroots organization
• Built the most impactful grassroots organization in history of American politics, with 10K teams + 2.2M volunteers
Build cutting-edge
technology infrastructure
• Created the most innovative digital and technology program in politics, and ran a sophisticated data-driven campaign
Hold GOP accountable • Successfully defined Romney early in the race through our
communications, paid media, digital, and research efforts
Build financial foundation
• Fought back against Republican outside spending - raising $1B with the support of 4.5M donors + 15M contributions
1
2
3
4
5
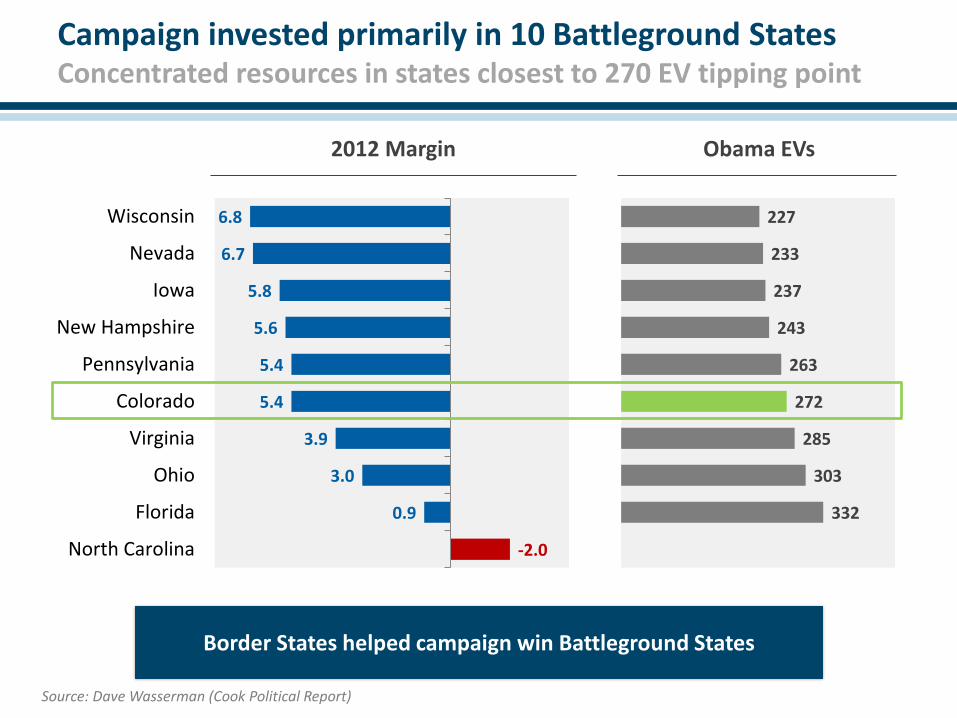
Campaign invested primarily in 10 Battleground States Concentrated resources in states closest to 270 EV tipping point
332
303
285
272
263
243
237
233
227
-2.0
0.9
3.0
3.9
5.4
5.4
5.6
5.8
6.7
6.8
North Carolina
Florida
Ohio
Virginia
Colorado
Pennsylvania
New Hampshire
Iowa
Nevada
Wisconsin
Obama EVs 2012 Margin
Source: Dave Wasserman (Cook Political Report)
Border States helped campaign win Battleground States
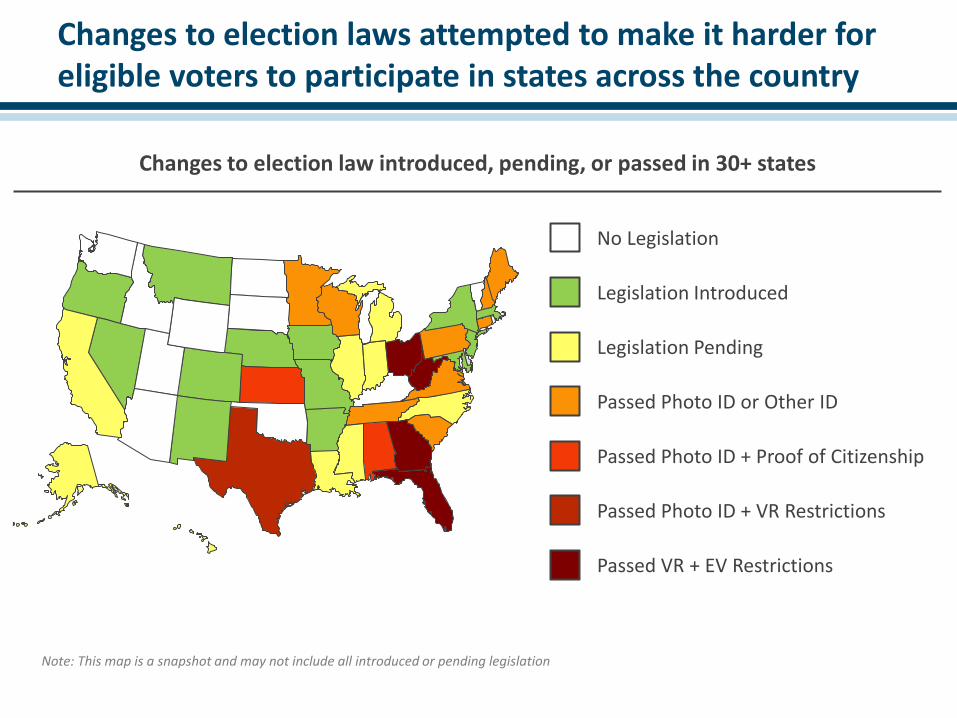
Changes to election laws attempted to make it harder for eligible voters to participate in states across the country
No Legislation
Legislation Introduced
Legislation Pending
Passed Photo ID or Other ID
Passed Photo ID + Proof of Citizenship
Passed Photo ID + VR Restrictions
Passed VR + EV Restrictions
Changes to election law introduced, pending, or passed in 30+ states
Note: This map is a snapshot and may not include all introduced or pending legislation

Democrats were outspent by Republicans in the 2012 presidential race because of GOP outside groups
OFA: $716M Romney:
$446M
DNC: $315M
RNC: $400M
Allies: $134M Allies: $412M
Democrats Republicans
Total Presidential Campaign Fundraising
Total: $1.16B Total: $1.26B
Source: OpenSecrets.org

h
Registration
Register and re-register unregistered supporters
Persuasion
Persuade likely voters open to campaign message
Turnout
Educate and motivate sporadic voting supporters
Organization Building
Creates foundation to execute the 3 core programs
1 2 3
• Collected 1.8M+ voter reg. forms since launch, with 1.7M+ in 2012 alone
• Forms collected exceeded margin of victory in 5 states
• Made 150M+ phone calls + door knocks, with a high % focused on persuasion
• Data and analysis ensured we talked to the right voters
• Won early vote, turning out more Dems + non-midterm voters than GOP
• Opened 5,177 hyper-local GOTV staging locations
OFA built an unprecedented grassroots organization that generated votes via registration, persuasion, and turnout
• Invested in 800+ offices and 2,700+ field organizers
• Tested and trained 10K NTLs and 30K CTMs, scheduled 2.2M unique volunteers
• Created most sophisticated training program in political history

By starting early, OFA built the strongest grassroots organization in the history of American politics
2,700 Field Organizers
10,000 Team Leaders
30,000 Core Team Members
2.2M Volunteers Scheduled
Neighborhood Teams
OFA 2012 recruited 80% more volunteers than OFA 2008
75% of State Staff were FOs
3 Team Leaders per FO
4 Team Members per NTL
66 Volunteers per CTM
Campaign started in April 2011, but grassroots organization building started in 2007 and never stopped
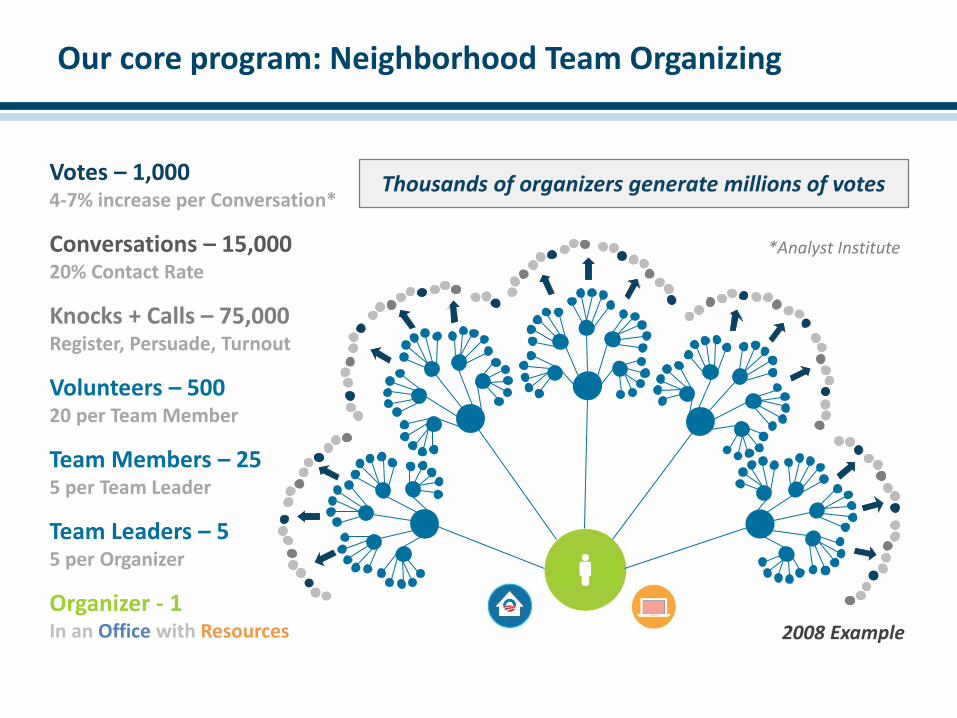
Our core program: Neighborhood Team Organizing
Organizer - 1 In an Office with Resources
Team Members – 25 5 per Team Leader
Volunteers – 500 20 per Team Member
Team Leaders – 5 5 per Organizer
Knocks + Calls – 75,000 Register, Persuade, Turnout
Votes – 1,000 4-7% increase per Conversation*
2008 Example
Conversations – 15,000 20% Contact Rate
*Analyst Institute
Thousands of organizers generate millions of votes
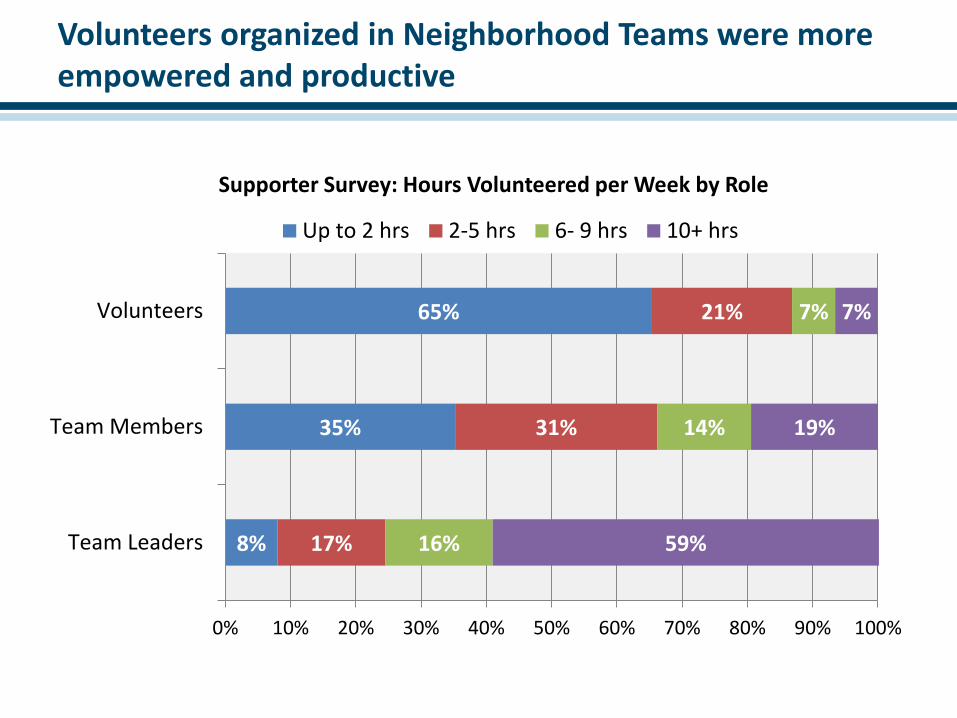
Volunteers organized in Neighborhood Teams were more empowered and productive
8%
35%
65%
17%
31%
21%
16%
14%
7%
59%
19%
7%
0% 10% 20% 30% 40% 50% 60% 70% 80% 90% 100%
Team Leaders
Team Members
Volunteers
Supporter Survey: Hours Volunteered per Week by Role
Up to 2 hrs 2-5 hrs 6- 9 hrs 10+ hrs

OFA had more local offices than the Romney campaign
631
282
Obama Romney
Offices in Targeted States •OFA had 813 offices nationwide, including 631 in targeted states • Local offices create a presence in the
community for volunteer organization •OFA transitioned to 5K+ hyper-local
staging locations for GOTV • 80% of volunteers lived within 10 miles
of a local campaign office
OFA 2012 had more than 2x as many local offices as Romney in Targeted States
Volunteers listed a local office as the most important resource for organizing in their local community, along with guidance from their organizer
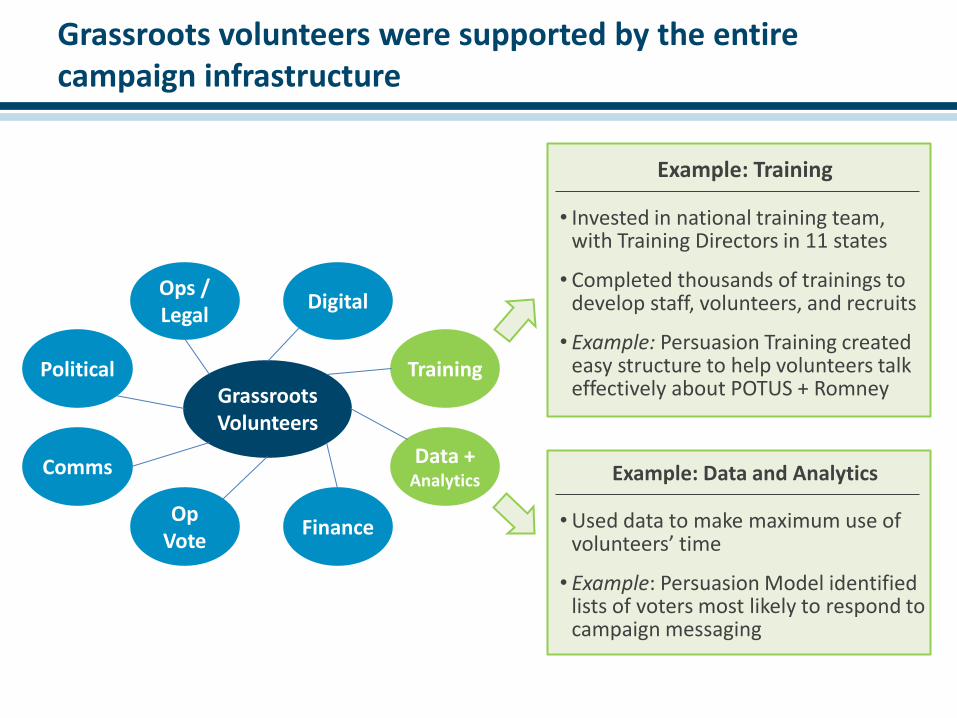
Grassroots volunteers were supported by the entire campaign infrastructure
Digital
Training
Data + Analytics
Finance
Ops / Legal
Political
Comms
Op Vote
Grassroots Volunteers
Example: Training
• Invested in national training team, with Training Directors in 11 states
• Completed thousands of trainings to develop staff, volunteers, and recruits
• Example: Persuasion Training created easy structure to help volunteers talk effectively about POTUS + Romney
Example: Data and Analytics
•Used data to make maximum use of volunteers’ time
• Example: Persuasion Model identified lists of voters most likely to respond to campaign messaging

OFA voter registrations exceed the Obama margin of victory in 3 Battleground States
State Registration Forms Collected by OFA
Obama Margin of Victory
Florida 361,176 74,309
Colorado 156,860 137,948
Nevada 95,973 67,806
OFA collected 1.8M voter registrations forms nationally, and exceeded the margin of victory in 3 Battleground States
• NC collected 341K forms, keeping the state in play the entire campaign
• Including online reg., we exceeded the margin of victory in OH and VA
Source: Dave Wasserman (Cook Political Report)

OFA voter registration program changed the electorate Strong numbers among Youth, Latinos, and African Americans
7%
2%
1%
12%
9%
13%
10%
20%
0%
VA
PA
OH
NV
NC
IA
FL
CO
19%
6%
2%
20%
55%
15%
22%
20%
0%
VA
PA
OH
NV
NC
IA
FL
CO
3%
-4%
-4%
0%
2%
-1%
2%
10%
-30% 0% 30%
VA
PA
OH
NV
NC
IA
FL
CO
White Latino AfAm
Voter Registration up among Latinos and African Americans since 2008
Growth in Registered Voters since 2008
Most new registrants were youth, women, African Americans, or Latinos
State Youth
(Under 35)
Women, Youth,
AfAm, + Latino
CO 62% 85%
FL 53% 86%
IA 65% 85%
MI 63% 86%
NC 60% 88%
NV 48% 81%
OH 59% 86%
PA 73% 91%
VA 65% 87%
WI NA 87%
% of New Registrants (Aug 1 to Nov) who are Youth, Women, AfAm, or Latino
Source: DNC Voter File

OFA volunteers made 150M door knocks and phone calls Millions of conversations for persuasion, turnout, + recruitment
Part of an all-of-the-above organizing program that included targeted phone calls, door knocks, direct mail, digital ads, targeted TV, and digital follow up
0
20
40
60
80
100
120
140
Mill
ion
en
2012 Door Knocks and Phone Calls by Day (Cumulative)

Our contacts were more effective
29,7% 26,4%
0%
5%
10%
15%
20%
25%
30%
35%
Obama Campaign Contacts Romney Campaign Contacts
Post-Election Survey: “The campaign contact was important in helping me make up my mind”
Source: OFA Post-Election Voter Survey

Obama won by decisive margins with key groups
Group Obama Romney Margin
Moderates 56 41 +15
Women 55 44 +11
Latinos 71 27 +44
Youth 60 37 +23
Asian Americans 73 26 +47
2012 Exit Poll Results
Maintained double digit lead with women and expanded 2008 margin by 8 points with Latinos
Source: National Exit Poll
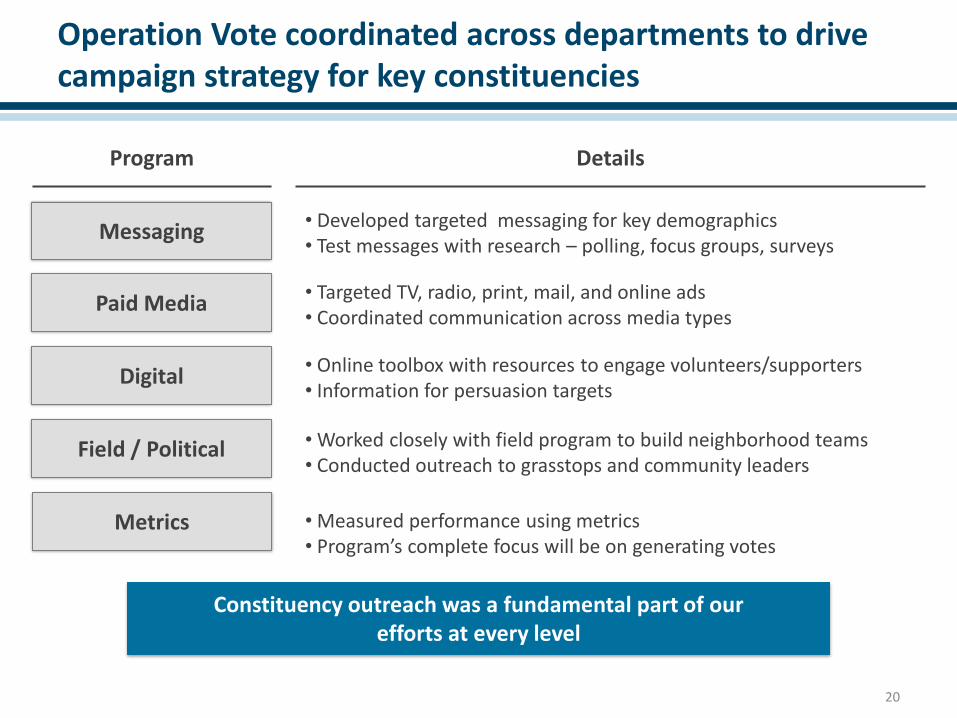
Operation Vote coordinated across departments to drive campaign strategy for key constituencies
20
Messaging • Developed targeted messaging for key demographics • Test messages with research – polling, focus groups, surveys
Program
Paid Media • Targeted TV, radio, print, mail, and online ads • Coordinated communication across media types
• Worked closely with field program to build neighborhood teams • Conducted outreach to grasstops and community leaders
Constituency outreach was a fundamental part of our efforts at every level
• Measured performance using metrics • Program’s complete focus will be on generating votes
Digital • Online toolbox with resources to engage volunteers/supporters • Information for persuasion targets
Field / Political
Metrics
Details
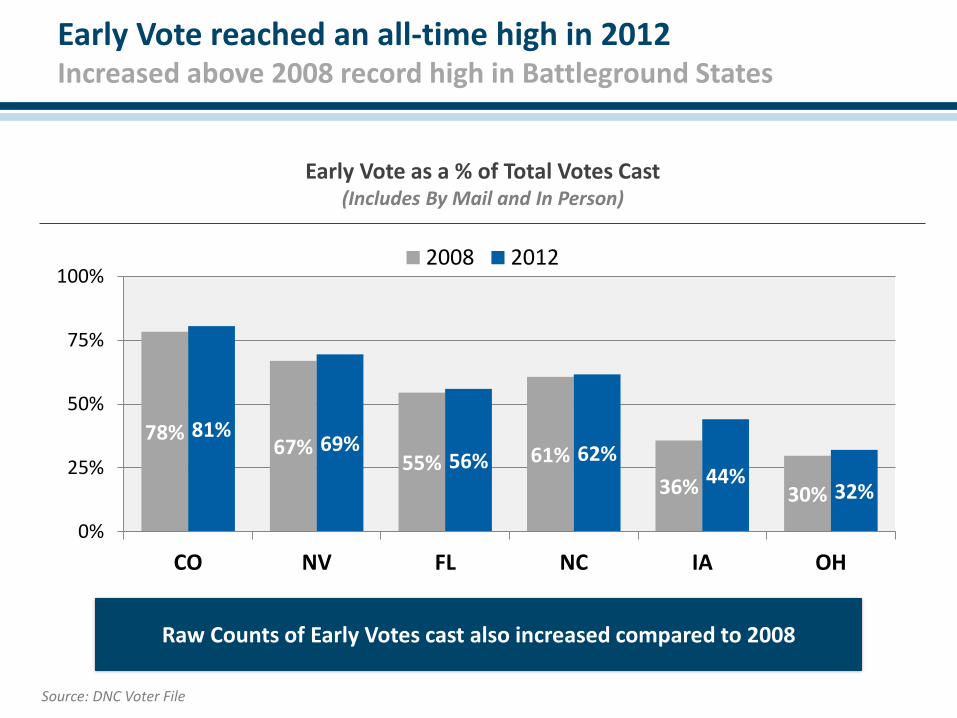
Early Vote reached an all-time high in 2012 Increased above 2008 record high in Battleground States
78% 67%
55% 61%
36% 30%
81% 69%
56% 62% 44%
32%
0%
25%
50%
75%
100%
CO NV FL NC IA OH
2008 2012
Early Vote as a % of Total Votes Cast (Includes By Mail and In Person)
Raw Counts of Early Votes cast also increased compared to 2008
Source: DNC Voter File
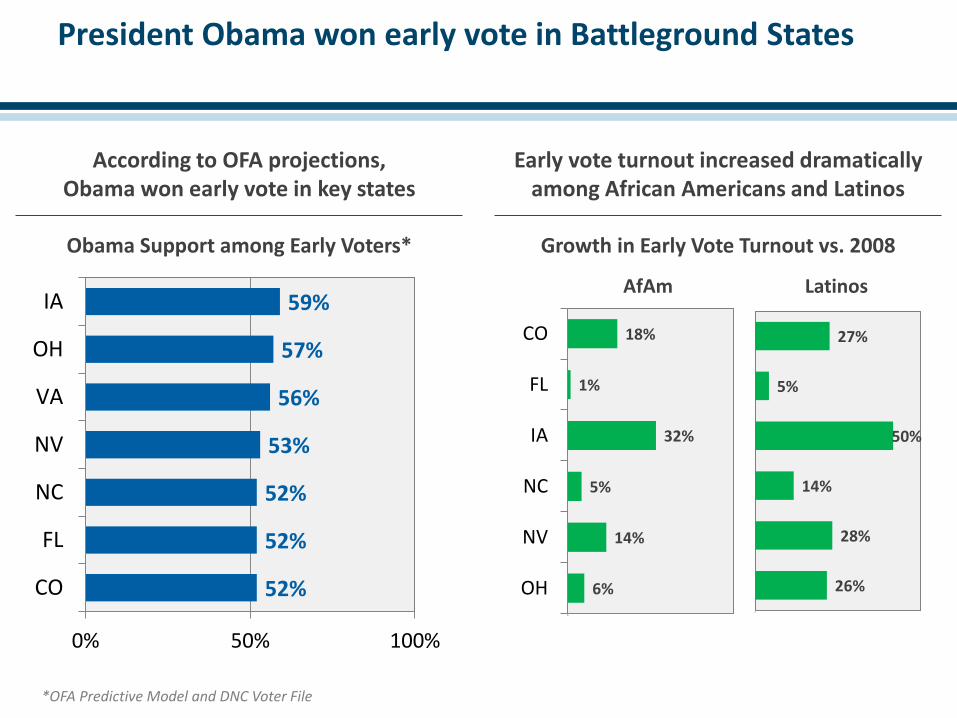
President Obama won early vote in Battleground States
52%
52%
52%
53%
56%
57%
59%
0% 50% 100%
CO
FL
NC
NV
VA
OH
IA
According to OFA projections, Obama won early vote in key states
Obama Support among Early Voters*
*OFA Predictive Model and DNC Voter File
Early vote turnout increased dramatically among African Americans and Latinos
6%
14%
5%
32%
1%
18%
0%
OH
NV
NC
IA
FL
CO
AfAm
Growth in Early Vote Turnout vs. 2008
26%
28%
14%
50%
5%
27%
0%
Latinos

Obama coalition turned out to vote again in 2012
State Latino Youth AfAm Women White
CO 1 6 -1 1 -3
FL 3 1 0 2 -4
IA -1 -2 -1 1 2
NC 1 -2 0 2 -2
NH 1 1 1 0 -1
NV 4 1 -1 1 -5
OH -1 0 4 0 -4
PA 2 1 0 -2 -3
VA 0 -2 0 0 0
WI 1 -1 2 0 -3
1% 1%
0% 0%
-2%
Latinos and Youth comprised a larger share of votes cast in 2012, and African Americans maintained record share of the electorate from 2008
National Change in Share of Electorate, 2008 to 2012
Battleground State Change in Share of Electorate, 2008 to 2012
Source: National Exit Poll

Turnout: raw turnout increased 1.0% in battleground states and decreased 2.8% in non-battleground states
36.7M
94.6M
37.1M
91.9M
0
20
40
60
80
100
120
Battleground States Non-Battleground States
2008 2012
+385K votes = +1.0% -2.6M votes = -2.8%
Mill
ion
s
Total Turnout by Battleground vs. Non-Battleground States
Source: Dave Wasserman (Cook Political Report)


![[PPT]Obama Ephemeraopenlib.org/home/krichel/courses/lis654n12s/plan/oakwood... · Web viewBy Wendy Ball – Attipoe LIS 654, February 5, 2012 OBAMA 2008 ELECTION EPHEMERA Project](https://img.dokumen.tips/doc/110x75/5b2179eb7f8b9a08698b456b/pptobama-web-viewby-wendy-ball-attipoe-lis-654-february-5-2012-obama.jpg)