Embed Size (px)
Citation preview
2012 Corn Hybrid Performance& Technology Update
Agronomy In-service January 4, 2013
Peter Thomison, Allen Geyer
and Rich Minyo
Horticulture and Crop Science
Ohio State University

Ohio Corn Production Historical Yield Data, 1930-2012
y = 1.5401x - 2946.5
R2 = 0.8987
020406080
100120140160180
1930 1940 1950 1960 1970 1980 1990 2000 2010 2020
Year
Yie
ld (
Bu
/A)
Yield increase about 1.5 bu/A/yr

Iowa Corn Production Historical Yield Data, 1930-2012
y = 1.7465x - 3347.3
R2 = 0.9009
0
40
80
120
160
200
1930 1940 1950 1960 1970 1980 1990 2000 2010 2020
Year
Yie
ld (
Bu
/A)
Yield increase about 1.7 bu/A/yr

Factors Contributing to Higher Corn Yields
• Improved hybrid genetics–Better adapted/stress resistant– Improved pest resistance– Improved stalk quality
• Improved cultural practices– Earlier planting dates– Higher plant density– More effective fertility practices– Improved machinery– Better pest management

Selecting Hybrids for Performance & Profits
Key factors to consider:
•Maturity
•Yield potential & stability
•Stalk quality & standability
•Drydown
•Pest and herbicide resistance
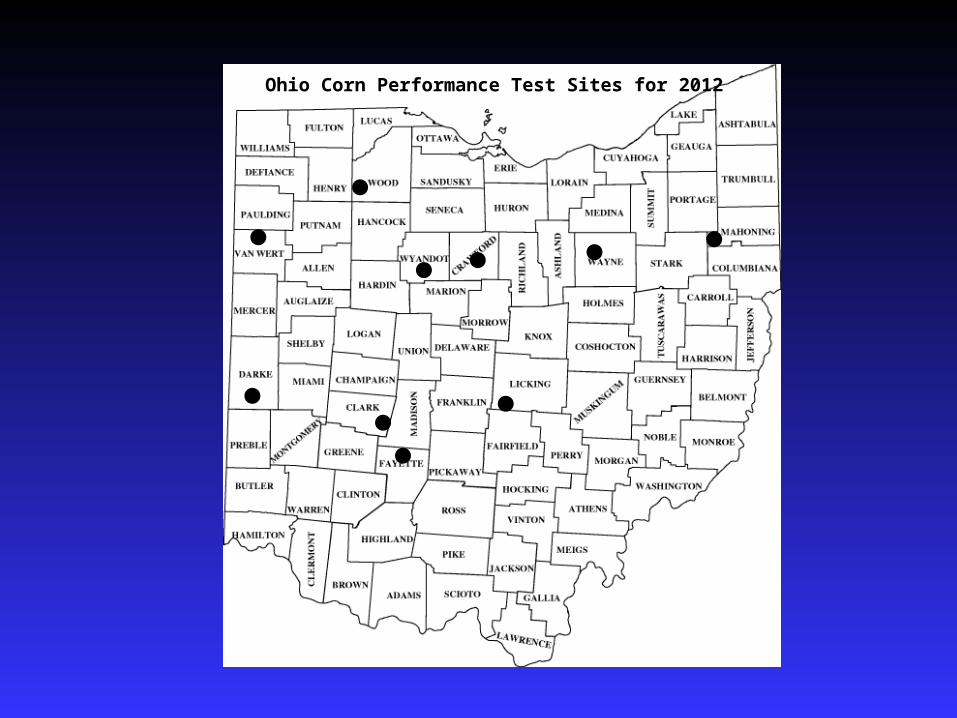
Ohio Corn Performance Test Sites for 2012

Difference Between Highest and Lowest Yielding Hybrids in Bu/A.
2012 OSU Early Maturity Corn Trials
5154
78
55 57 60 61
85
55
73
0
10
20
30
40
50
60
70
80
90
Bu
shel
s/A
cre
HE WCH SC GV VW HV US BE BU WO
SC/WC/C NW NC/NE
224
226
227
148 16
4
146
200
209 19
0
193

Difference Between Highest and Lowest Yielding Hybrids in $/A
2012 OSU Early Maturity Corn Trials
$341
$545
379 $386 $409 $424$385
$585
$370
$489
$0
$100
$200
$300
$400
$500
$600
$/A
*
HE SC WCH GV HV US VW BE BU WO
* Calculated using corn price of $7.00/bu & drying charge of $0.03 for each percentage point above 15.5
SC/WC/C NW NC/NE

Difference Between Highest and Lowest Yielding Hybrids in Bu/A. 2012 OSU Full Season Corn Trials
55
67
80
60
83
5058
52
6368
01020304050607080
90100
Bu
shel
s/A
cre
HE SC WCH GV VW HV US BE BU WO
SC/WC/C NW NC/NE
230 24
0
161
178 20
7
151
210
236
195
218
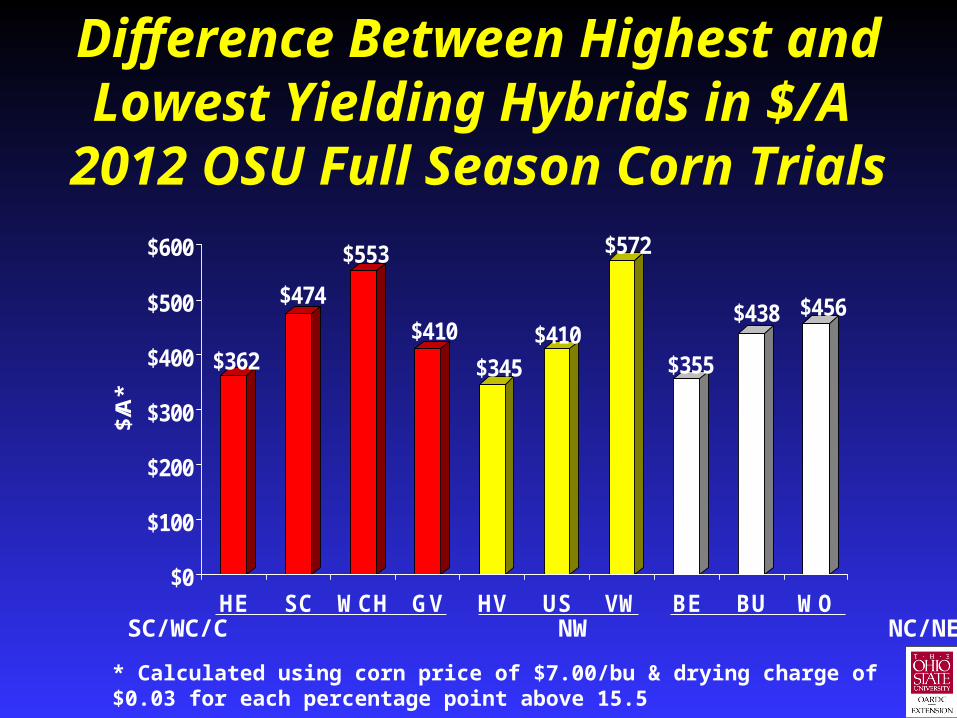
Difference Between Highest and Lowest Yielding Hybrids in $/A
2012 OSU Full Season Corn Trials
$362
$474
$553
$410
$345$410
$572
$355
$438 $456
$0
$100
$200
$300
$400
$500
$600
$/A
*
HE SC WCH GV HV US VW BE BU WO
* Calculated using corn price of $7.00/bu & drying charge of $0.03 for each percentage point above 15.5
SC/WC/C NW NC/NE

Major Changes During the Past 15 Years Have Affected Hybrid Selection
• Fewer companies and higher seed costs
• Explosion of new seed technologies especially transgenic traits (GMO corn)
• Seed has become a major part of pest management systems - replacing pesticide inputs and simplifying herbicide management

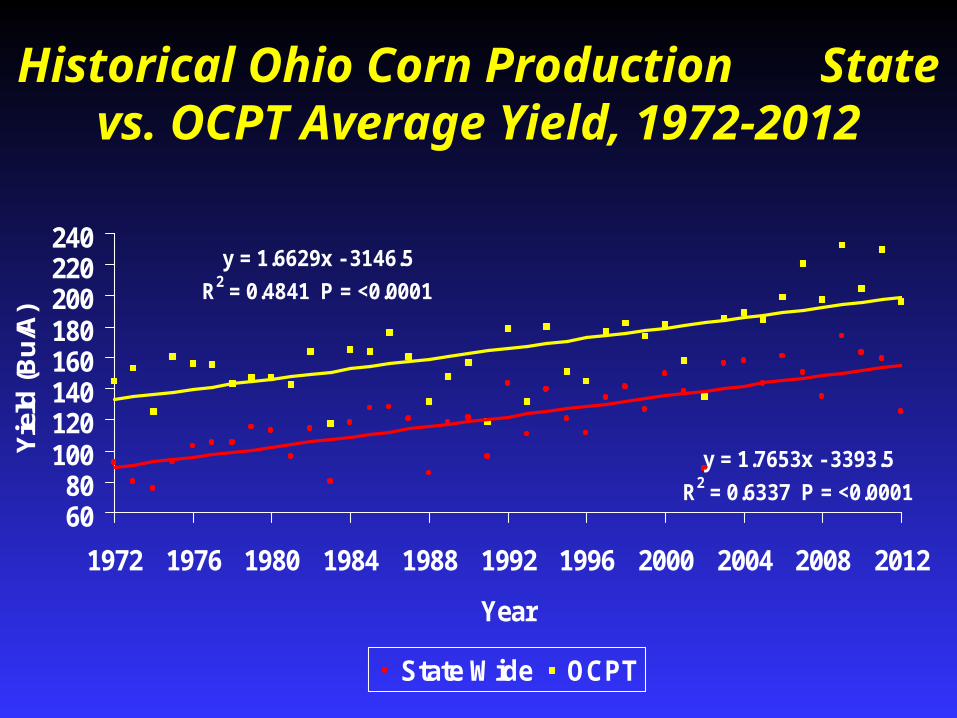
Historical Ohio Corn Production State vs. OCPT Average Yield, 1972-2012
y = 1.7653x - 3393.5
R2 = 0.6337 P = <0.0001
y = 1.6629x - 3146.5
R2 = 0.4841 P = <0.0001
6080
100120140160180200220240
1972 1976 1980 1984 1988 1992 1996 2000 2004 2008 2012
Year
Yie
ld (
Bu
/A)
State Wide OCPT

Average U.S. corn yields and kinds of corn, Civil War to 2004. "b" values (regressions - bu/ac) indicate production
gain per unit area per year (USDA-NASS, 2005)
Source: Troyer, 2006. Crop Sci. 46:528-543

Historical Ohio Corn Production State vs. OCPT Average Yield, 1972-2012
y = 0.3626x - 568.48
R2 = 0.0222
6080
100120140160180200220240
1972 1976 1980 1984 1988 1992 1996 2000 2004 2008 2012
Year
Yie
ld (
Bu
/A)
y = 3.8505x - 7528.9
R2 = 0.5428
6080
100120140160180200220240
1972 1976 1980 1984 1988 1992 1996 2000 2004 2008 2012
Year
Yie
ld (
Bu
/A)
OCPT State
y = 1.5913x - 3048.2
R2 = 0.37746080
100120140160180200220240
1972 1976 1980 1984 1988 1992 1996 2000 2004 2008 2012
Year
Yie
ld (
Bu
/A)
y = 1.8922x - 3650.1
R2 = 0.202
6080
100120140160180200220240
1972 1976 1980 1984 1988 1992 1996 2000 2004 2008 2012
Year
Yie
ld (
Bu
/A)

Percent of Hybrids in OCPT for Multiple Years, 2001-2012
0
10
20
30
40
50
% o
f H
ybri
ds
in T
est
2001 2002 2003 2004 2005 2006 2007 2008 2009 2010 2011 2012
2 Years 3 Years
27% for 2 years10% for 3 years

Adoption of Transgenic Corn, U.S. vs. Ohio, 2000-2012
25
9
26
11
34
9
40
9
47
13
52
18
61
26
73
41
80
66
85
67
86
71
86
74
88
76
0
20
40
60
80
100
% o
f A
cres
2000 2001 2002 2003 2004 2005 2006 2007 2008 2009 2010 2011 2012
U.S. Ohio

Biotech Share of Ohio Corn Acres Planted
Stacked Traits43%
Non-GMO24%
Herbicide Tolerant
20%
Bt13%
Based on 2012 crop year3,620,000 Total Corn Acres

Transgenic and Non-Transgenic Entries in OCPT 1996-2012
2
280
3
257
4
229
15
194
10
179
10
219
10
225
30
202
84
120
81
126135
90
193
44
222
20
242
26
229
20
230
20
210
26
0
50
100
150
200
250
300
No
. o
f E
ntr
ies
1996 2000 2004 2008 2012
Transgenic Non-Transgenic

Hybrid Traits Tested in 2012 OCPT
42%
40%
11%
5%
2%
No Traits
1 Trait
2 Traits
3 Traits
4 Traits
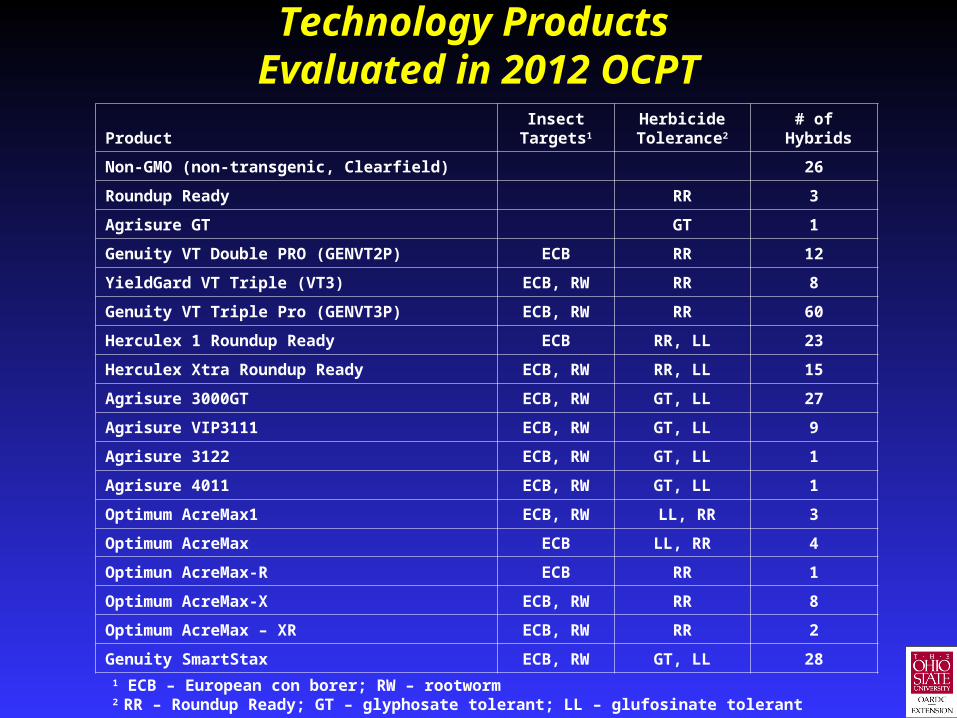
Technology Products Evaluated in 2012 OCPT
ProductInsect
Targets1
Herbicide Tolerance2
# of Hybrids
Non-GMO (non-transgenic, Clearfield) 26
Roundup Ready RR 3
Agrisure GT GT 1
Genuity VT Double PRO (GENVT2P) ECB RR 12
YieldGard VT Triple (VT3) ECB, RW RR 8
Genuity VT Triple Pro (GENVT3P) ECB, RW RR 60
Herculex 1 Roundup Ready ECB RR, LL 23
Herculex Xtra Roundup Ready ECB, RW RR, LL 15
Agrisure 3000GT ECB, RW GT, LL 27
Agrisure VIP3111 ECB, RW GT, LL 9
Agrisure 3122 ECB, RW GT, LL 1
Agrisure 4011 ECB, RW GT, LL 1
Optimum AcreMax1 ECB, RW LL, RR 3
Optimum AcreMax ECB LL, RR 4
Optimun AcreMax-R ECB RR 1
Optimum AcreMax-X ECB, RW RR 8
Optimum AcreMax – XR ECB, RW RR 2
Genuity SmartStax ECB, RW GT, LL 281 ECB – European con borer; RW – rootworm2 RR – Roundup Ready; GT – glyphosate tolerant; LL – glufosinate tolerant

How much does it cost for corn seed technologies?
Where is the breakeven point?
YieldIncrease(bu/A)
$20 Bag difference $40 Bag difference $60 Bag difference
Corn Price Corn Price Corn Price
$5.00 $6.00 $7.00 $5.00 $6.00 $7.00 $5.00 $6.00 $7.00
0 $-8 $-8 $-8 $-17 $-17 $-17 $-25 $-25 $-25
2 $2 $4 $6 $-7 $5 $-3 $-17 $-13 $-11
4 $12 $16 $20 $3 $17 $11 $-9 $-1 $3
6 $22 $28 $34 $13 $29 $25 $-1 $11 $17
8 $32 $40 $48 $23 $41 $39 $7 $23 $31
10 $42 $52 $62 $33 $53 $53 $15 $35 $45
12 $52 $64 $76 $43 $65 $67 $23 $47 $59Assume: 80,000 seeds/bag planted at 33,000 seeds/A for final population of 30,000 plants/A
Source: J. Lauer, Univ. of Wisconsin (Update by P. Thomison, 2012)
Cost ($/A) matrix of corn seed sold at a premium (i.e. technology fee)

Non-GMO Hybrids Entered in State Corn Performance Tests, 2012
State
OH IN MI PA KY IL
Total Number
of Hybrids
236 210 288 100 179 185
Number of Non-GMO Hybrids
26 30 24 5 7 19
Source: 2012 State Performance Trials

Yields of Transgenic vs. Non-Transgenic Corns
OCPT Early Maturity Test 2012224 227 228225 228227
146142
210202
166150
189190200200
193 187
145150
0
50
100
150
200
250
Yie
ld (
Bu
/A)
HE WCH SC GV VW HV US BU WO BE
Transgenic Non-Transgenic
SC/WC NW NC/NE
200-251(57)
207-238(8)
194-248(57)
203-248(8)
182-560(57)
208-246(8)
118-172(57)
122-167(8)
148-183(67)
124-162(10)
158-209(10)
152-213(67)
156-230(57)
185-210(9)
91-174(57)
132-158(9)
178-235(67)
180-213(10)
172-226(57)
161-220(9)

Yields of Transgenic vs. Non-Transgenic Corns
OCPT Full Season Test 2012229 231 235239 241
231
162154
218214
180164
207205 210209196190
151160
0
50
100
150
200
250
Yie
ld (
Bu
/A)
HE WCH WB GV VW HV US BU WO BE
Transgenic Non-Transgenic
SC/WC NW NC/NE
202-256(58)
209-257(7)
188-268(58)
217-264(7)
218-240(7)
209-276(58) 190-
231(9)
152-192(68)
175-234(68)
148-180(9)
189-231(39)
183-231(9)
149-177(4)
124-176(39)
124-183(58)
142-177(7)
165-230(39)
163-217(4)
177-260(68)
167-229(4)
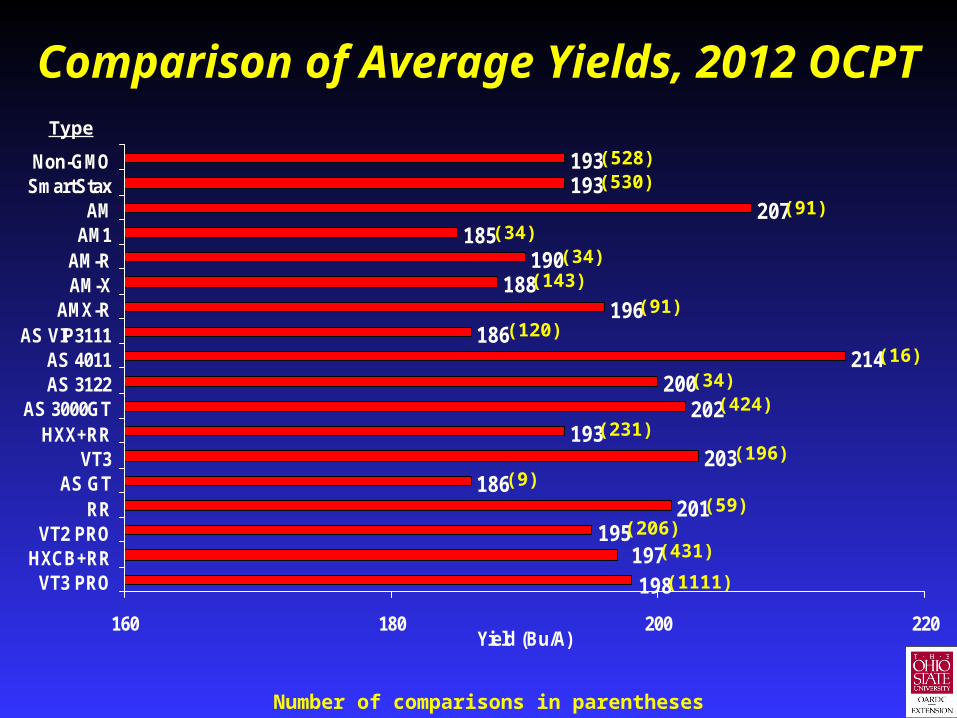
Comparison of Average Yields, 2012 OCPT
201186
203193
202200
214186
196188
190185
207193193
195197198
160 180 200 220
VT3 PROHXCB+RR
VT2 PRORR
AS GTVT3
HXX+RRAS 3000GT
AS 3122AS 4011
AS VIP3111AMX-R
AM-XAM-RAM1AM
SmartStaxNon-GMO
Yield (Bu/A)
Type
(528)
Number of comparisons in parentheses
(530)
(34)(16)
(231)
(431)
(91)
(196)
(59)
(1111)
(424)
(34)
(120)
(34)
(91)(143)
(9)
(206)

Grain Yield of Hybrids Grouped by Insect Resistance and Herbicide Tolerance Traits, 2012 OCPT
Region
SW/SC/C NW NE/NC
Trait Set† No. Yield No. Yield No. Yield
None 15 210 19 188 13 183
GT1 2 210 2 191 0
CB2+GT1 6 209 10 192 8 180
CB1+GT1+LL1 14 214 15 197 8 180
CB1+RW1+GT1 8 223 6 204 6 184
CB1+RW2+GT1+LL1 9 208 10 189 7 175
CB1+RW1+GT1+LL1 10 214 19 200 12 189
LEP1+CB1+RW1+GT1+LL1 3 213 2 185 4 169
CB3+RW3+GT1+LL1 14 206 19 192 15 181
CB2+RW1+GT1 34 214 42 197 31 185
CB2+RW3+GT1 1 210 1 198 1 191
CB2+GT1+LL1 4 215 2 204 1 200
CB2+RW2+GT1+LL1 5 214 4 187 3 173
CB2+RW2+GT1 4 208 2 191 1 182
† number after trait indicates the number of different events of that type

Recent Developments
• Drought tolerance technology
–Pioneer AquaMax
–Syngenta Artesian
–Monsanto DroughtGard (transgenic)
• New herbicide tolerance technology
–2,4-D resistant transgenic corn
• More RIB stacked traits
Historical Ohio Corn Production State vs. OCPT Average Yield, 1972-2012
y = 1.7653x - 3393.5
R2 = 0.6337 P = <0.0001
y = 1.6629x - 3146.5
R2 = 0.4841 P = <0.0001
6080
100120140160180200220240
1972 1976 1980 1984 1988 1992 1996 2000 2004 2008 2012
Year
Yie
ld (
Bu
/A)
State Wide OCPT

Final Stands, OCPT vs. State 1972-2012
y = 279.92x - 530622
R2 = 0.9087
y = 254.15x - 483031
R2 = 0.9418
15000
18000
21000
24000
27000
30000
33000
36000
1971 1976 1981 1986 1991 1996 2001 2006 2011 2016
Pla
nts
/Acr
e
OCPT Statewide

Average Lodging, Ohio Corn Performance Test, 1972-2011
y = -0.108x+222
R2 = 0.043 P = 0.205
0
5
10
15
20
25
30
1971 1976 1981 1986 1991 1996 2001 2006 2011
% L
od
gin
g

2008 Stalk Lodging

Corn for Grain: Plant Population per Acre, 2012
State Plant Population
IL 29,750
IN 29,200
IA 30,100
MN 30,000
NE 26,150
OH 29,100
WI 28,600Source: NASS ( 2012)

Distribution of Ohio Corn Populations, 2006
>30,00014%
25,001 - 27,50027%
27,501 - 30,00025%
<20,0009%
22,501 - 25,00019%
20,000 - 22,5006%
Source: NASS ( 2006)

Distribution of Ohio Corn Populations 2012
>30,00045%
25,001 - 27,50021%
27,501 - 30,00022%
<20,0003% 22,501 - 25,000
6%
20,000 - 22,5003%
Source: NASS ( 2011)

Corn Plant Population Trends
• Populations have increased 14% in past 10 yrs (54% since the early 1970’s)
• Newer hybrids are more stable under stress
• Superiority of modern hybrids is fully expressed only at high plant densities

Agronomic Performance of Corn at Varying Seeding Rates
• Are current seeding rate guidelines for corn appropriate?
• How much variation in yield response to population exists across environments?
• How will higher seeding rates impact stalk lodging and harvestability.

Grain Yield Response to Plant Population for Corn Hybrids by Location Yield Level
18 24 30 36 42
90
110
130
150
170
190
210
>180 bu /acre( n=14,879)
150-180 bu /acre(n=9,420)
120-150 bu /acre(n=3,294)
<120 bu /acre(n=988)
Plants/acre (x1000) at Harvest
Gra
in Y
ield
(B
u/a
cre)
Source: Seed Company 2009
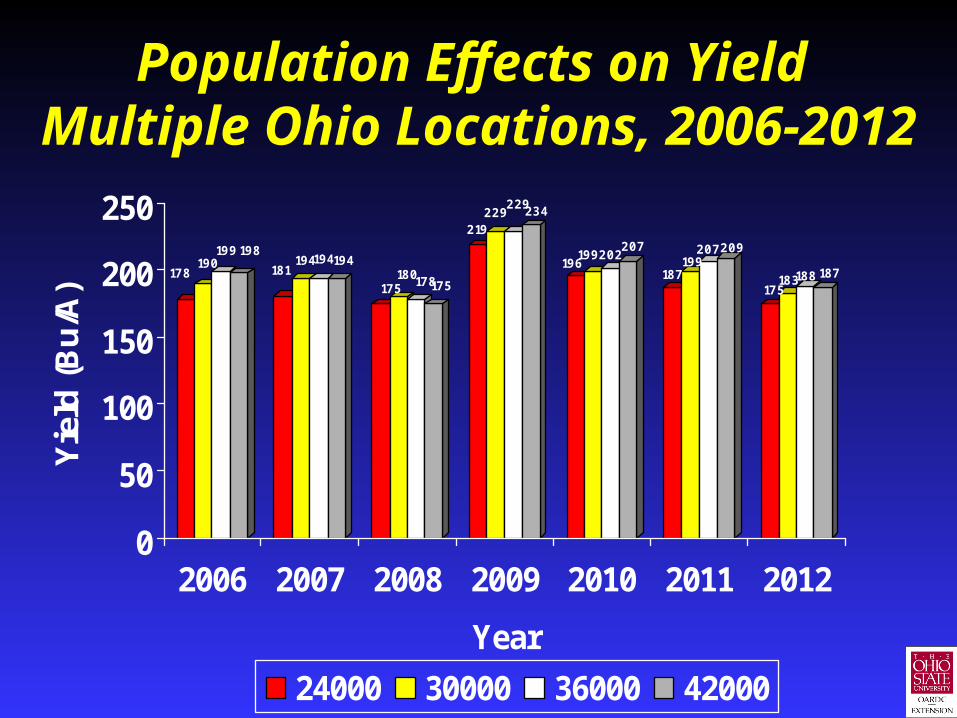
Population Effects on Yield Multiple Ohio Locations, 2006-2012
178190
199198
181194194194
175180178175
219229
229234
196199202
207
187199
207209
175183188187
0
50
100
150
200
250
Yie
ld (
Bu
/A)
2006 2007 2008 2009 2010 2011 2012
Year
24000 30000 36000 42000

Population Effects on Lodging Multiple Ohio Locations, 2006-2012
3
1014
19
0 0 0 0
10
16
33
52
0 15
14
1 24
14
0 012
0 0 000
10
20
30
40
50
60
% L
odgi
ng
2006 2007 2008 2009 2010 2011 2012
Year
24000 30000 36000 42000
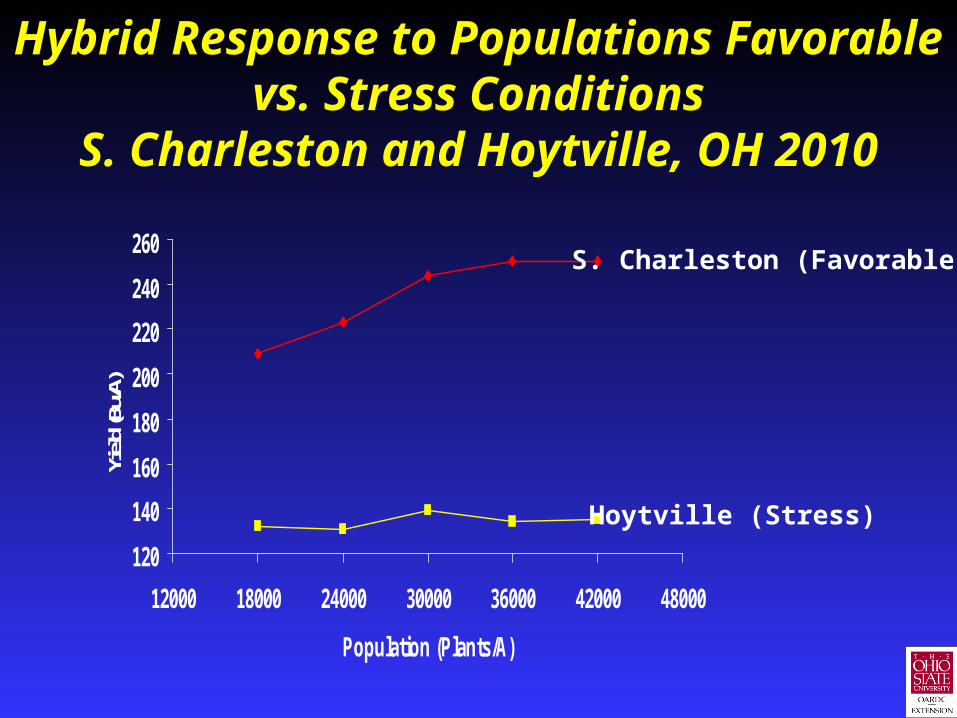
Hybrid Response to Populations Favorable vs. Stress Conditions
S. Charleston and Hoytville, OH 2010
120
140
160
180
200
220
240
260
12000 18000 24000 30000 36000 42000 48000
Population (Plants/A)
Yield
(Bu/
A)
S. Charleston (Favorable)
Hoytville (Stress)
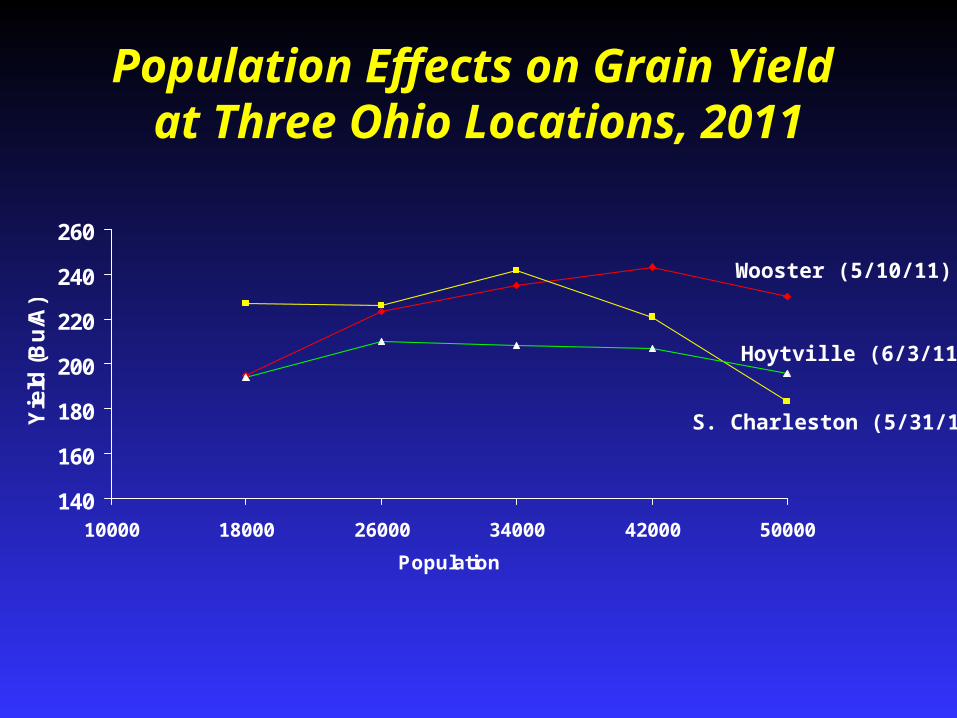
Population Effects on Grain Yield at Three Ohio Locations, 2011
140
160
180
200
220
240
260
10000 18000 26000 34000 42000 50000
Population
Yie
ld (
Bu
/A)
Wooster (5/10/11)
Hoytville (6/3/11)
S. Charleston (5/31/11)

Population Effects on Grain Yield at Two Ohio Locations, 2012
140
160
180
200
220
240
260
10000 18000 26000 34000 42000 50000
Population
Yie
ld (
Bu
/A)
Hoytville (5/3/12)
S. Charleston (5/14/12)

Yields at Different Populations and Yield Levels, OSU Population Studies,
2006-2012
80
100120
140
160
180200
220
240
24000 30000 36000 42000
Final Stand
Yiel
d (B
u/A
)
<140 Bu/A
140-189 Bu/A
>190 Bu/A(68 comparisons)
(47 comparisons)
(11 comparisons)
~33000
~31000
~24000

Seeding Rate ConsiderationsAdjust seeding rates for site yield leveland planting dates.
• 23-24,000 seeds/A - adequate for low yield droughty soils
• 31-33,000 seeds/A - adequate for most environments
• 36-37,000 seeds/A - necessary for very productive soils with exceptional yield levels

Optimizing Corn Plant Populations
• Current seeding rates too low in many production environments
• Planting a hybrid at suboptimal seeding rates is usually more likely to cause yield losses than planting above recommended rates
• High populations generally do not result in major yield losses even under stress

THANK YOU Any questions or
comments?


